Embed Size (px)
Citation preview
Research Article
Evaluation of Auditory Counts for EstimatingBreeding Populations of White-Winged Doves
MARIO SEPULVEDA, Caesar Kleberg Wildlife Research Institute, Texas A&M University-Kingsville, Kingsville, TX 78363, USA
FIDEL HERNANDEZ,1 Caesar Kleberg Wildlife Research Institute, Texas A&M University-Kingsville, Kingsville, TX 78363, USA
DAVID G. HEWITT, Caesar Kleberg Wildlife Research Institute, Texas A&M University-Kingsville, Kingsville, TX 78363, USA
WILLIAM P. KUVLESKY, Caesar Kleberg Wildlife Research Institute, Texas A&M University-Kingsville, Kingsville, TX 78363, USA
GARY WAGGERMAN, Texas Parks and Wildlife Department, San Marcos, TX 78666, USA
RALPH L. BINGHAM, Caesar Kleberg Wildlife Research Institute, Texas A&M University-Kingsville, Kingsville, TX 78363, USA
Abstract
We evaluated an unverified index (auditory counts) used to estimate breeding populations of white-winged doves (Zenaida asiatica)
in Texas, USA. Our objectives were to determine optimal survey time of day, year, and count duration, determine if a relationship
existed between number of calling doves and population size (nest and dove density), and evaluate an electronic counter to
estimate breeding density. We collected data on 15 sites in the Lower Rio Grande Valley of Texas during May–August of 2002–
2003. Peak calling occurred between mid-May and late June during 0600–0800 hours. We detected about 60% of calling doves
during 2-minute auditory counts. Estimates of breeding doves (pairs ha�1) as determined by auditory counts were positively
correlated with both population density (r . 0.90, P , 0.01) and nest density (r . 0.94, P , 0.01). The electronic coo-counter tally
also exhibited a positive relationship with population density (r . 0.77, P , 0.01) and nest density (r . 0.92, P , 0.04). However, the
high correlations observed for auditory counts and electronic counter were influenced by 2 high dove-density sites. Our data did
not provide convincing support for the premise underlying auditory counts of white-winged doves (i.e., number of doves calling
reflects dove abundance). The electronic coo counter was limited in application because it tabulated dove calls based solely on
acoustic frequency and therefore could not discriminate against other avian calls with acoustic frequencies similar to those of
white-winged doves. Auditory counts may be appropriate as coarse-resolution reconnaissance surveys to locate new white-
winged dove areas in need of monitoring but not to obtain reliable abundance estimates. The use of an electronic counter to
estimate breeding populations of white-winged doves holds promise, given technical modifications, and warrants further research.
Given the current limitations of both auditory counts and electronic counters, alternative survey methods that incorporate detection
probabilities (e.g., distance sampling) need to be evaluated for white-winged doves. (JOURNAL OF WILDLIFE MANAGEMENT
70(5):1393–1402; 2006)
Key wordsauditory counts, coo counts, Lower Rio Grande Valley, surveys, Texas, white-winged dove, Zenaida asiatica.
Auditory counts are a common technique used to assessavian populations during the breeding season (McClure1939, Duke 1966, Scott and Boeker 1972, Dolton 1993).Although auditory techniques vary methodologically, mostare based on a common procedure where the number ofindividuals heard calling along prescribed routes is recorded(Wakeley et al. 1990). An important assumption of indicesis that number of birds heard calling provides an accurateindex to abundance (Sisson 1968, Keppie et al. 1970).However, because factors such as observer variability andweather can affect detectability of calling birds (LaPerriereand Haugen 1972, Shields 1977, Baskett et al. 1978), thisassumption may be violated, thereby invalidating indices(Anderson 2001, Thompson 2002).
An auditory-count index has been used by Texas Parksand Wildlife Department to monitor white-winged dovepopulations in the Lower Rio Grande Valley of Texas,USA, since 1949 (Uzzell 1949, Cottam and Trefethen1968). The procedure involves counting the number ofcalling white-winged doves during 2 minutes at predeter-mined stops and converting that number to an estimatedbreeding-pair density using a conversion table (Appendix 1;
Uzzell and Kiel 1950). There are 2 primary concerns
regarding the validity of this index. First, the methodology
is based on the premise that number of calling doves is
related to population density, a relationship that has been
both questioned (Olson et al. 1983, Armbruster and Basket
1985, Rappole and Waggerman 1986) and supported for
doves (Sisson 1968, Keppie et al. 1970). A second and more
critical issue is the unknown origin and development of the
Uzzell and Kiel (1950) conversion table. An account of the
methodology or data used to develop the table does not
exist. In fact, according to the only living coauthor, the
conversion table was not developed by Uzzell and Kiel
(1950) but was already in existence at the time of his hire in
1949 (W. H. Kiel, retired wildlife biologist, personal
communication).
Despite the historic and widespread use of an unverified
index to monitor white-winged doves in Texas, the validity
of the auditory-count index is largely untested (Rappole and
Waggerman 1986). In addition, basic survey protocol
remains unsubstantiated. For example, timing of surveys is
based on subjective estimates of peak diurnal and seasonal
calling. The 2-minute duration of auditory counts also
represents an arbitrary time period. Our objectives were to1 E-mail: [email protected]
Sepulveda et al. � Evaluation of Auditory Counts for White-Winged Dove 1393
1) quantify peaks in diurnal and seasonal calling, 2)determine percentage of calling doves detected during a 2-minute period, 3) determine if number of calling doves is acorrelate of population abundance (nest and dove density),and 4) evaluate the feasibility and practicality of anelectronic counter to estimate white-winged dove breedingabundance.
Study Area
We conducted our study in Cameron and Hidalgo counties,Texas, during May–August of 2002 and 2003. Thesecounties lay within a region referred to as the Lower RioGrande Valley. The Lower Rio Grande Valley was part ofthe Pleistocene–Recent delta of the Rio Grande andcorresponded closely with the Matamoran district of theTamaulipan Biotic Province (Blair 1950, Jahrsdoerfer andLeslie 1988). The dominant tree species in the Tamaulipanthorn scrub was honey mesquite (Prosopis glandulosa; Lonardand Judd 2002). Other common vegetative associationspreferred by white-winged doves were dominated by sugarhackberry (Celtis laevigata), cedar elm (Ulmus crassifolia),anacua (Ehretia anacua), Texas ebony (Pithecellobium ebano),granjeno (Celtis pallida), and brasil (Condalia hookeri).
Inland from the Gulf of Mexico, elevation rises about 0.95m/km and soils gradually changed from silty loams and claysto caliche and gravels (Parvin 1988). The climate in theLower Rio Grande Valley was semiarid and subtropical withannual rainfall of 38–76 cm. Temperatures averaged about108C in January to 368C in August ( Jahrsdoerfer and Leslie1988).
Methods
Experimental DesignOur sample population included all auditory survey points inTexas Parks and Wildlife Department’s 2001 standardoperational survey (n ¼ 384 points) in the Lower RioGrande Valley, which were established systematically alongroutes to encompass white-winged dove distribution. Weused stratified random sampling to select sites for our study.We categorized survey points into 3 strata based onbreeding-pair density estimates obtained during 2001surveys. We defined breeding-pair density strata as low(0–24 breeding pairs ha�1), medium (25–49 breeding pairsha�1), and high (.50 breeding pairs ha�1). We thenrandomly selected 5 survey points from each density strata,resulting in 15 total survey points.
We divided the field season into 3 periods based uponhistoric nesting chronology from Texas Parks and WildlifeDepartment’s nesting transect data: prepeak (1 May–9 Jun),peak (10 Jun–19 Jul), and postpeak (20 Jul–28 Aug).Estimated peak calling of white-winged doves (late May–early Jun) occurred prior to peak nesting. We used the termsprepeak, peak, and postpeak in reference to nestingchronology and not calling chronology.
We conducted 3 types of coo counts using the 15 surveypoints described above: 2 minutes, 10 minutes, and all
morning. We conducted different types of coo counts toaddress our different objectives.
Assessment of Dove Calling as a Correlateof Population AbundanceWe conducted 2-minute auditory counts at each surveypoint following Texas Parks and Wildlife Departmentprotocol (Waggerman 1999) once per period during 2002.To increase sampling effort within a period, we conductedauditory counts at each survey point 7–10 times per periodin 2003. We denoted the number of white-winged dovescalling during auditory counts at each survey point and thenconverted them to breeding-pair density (pairs ha�1) usingthe conversion table of Uzzell and Kiel (1950; Appendix 1).Because our intent was to relate dove calling to white-winged dove population abundance, it was essential thatestimates of both variables were obtained from a commonarea. Thus, we created a 400-m-radius buffer around eachsurvey point using ArcGIS 8.1 (Environmental SystemsResearch Institute, Redlands, California) to delineate thearea from which dove and nest density estimates wereobtained. We chose a distance of 400 m because, on average,an observer is able to hear a white-winged dove callingwithin this range (G. Waggerman, Texas Parks and WildlifeDepartment, unpublished data) and this radius had beenused in other dove research relating dove calling to nestdensity (Armbruster et al. 1978, Armbruster and Basket1985).
To estimate nest density, we delineated brush areas (i.e.,potential nesting habitat) and non-brush areas within eachbuffered survey point and randomly established 3 10 3 100-m transects (0.1 ha) within potential nesting habitat(Rappole and Waggerman 1986). We monitored transectsevery 4 days throughout each field season (May–Aug, 2002and 2003). We used a telescopic pole with a 10-cm mirror atthe tip to examine each nest found and determine stage ofnesting cycle. We numbered each active nest that we foundand tagged it for identification with a red tag, which weplaced at eye level below each nest.
We also estimated dove density (doves ha�1) within eachbuffered survey point using fixed-radius point counts (Huttoet al. 1986). These fixed-radius points were located at thebeginning and end of each nest transect, resulting in 6 fixed-radius points per survey point (3 transects 3 2 fixed-radiuspoints/transect). We conducted point counts instantane-ously at a 20-m radius to minimize dove movement into andout of the area of the fixed-radius point. We selected a 20-mradius because this was the approximate distance beyondwhich vegetation completely obstructed visibility. Wesurveyed fixed-radius points every 4 days to coincide withnest transect surveys.
Evaluation of Coo-Count SurveySeasonal peak.—We collected the data from 2-minute
auditory counts (see above) throughout the white-wingeddove nesting season (May–Aug); thus, we used this data todetermine the seasonal peak in calling within a year. Weconducted 2 additional types of auditory counts at survey
1394 The Journal of Wildlife Management � 70(5)
points, all-morning counts and 10-minute counts, todetermine peak calling within a day and optimal countduration, respectively.
Diurnal peak.—All-morning counts consisted of 2-minute auditory counts conducted at 20-minute intervalsduring 0600�1100 hours. We focused counts during themorning period and not throughout the day becauseprevious research had already documented that white-winged doves called more frequently during the morningperiod (Duvall and Robbins 1952, Peters 1952, Cohen et al.1960). We conducted all-morning counts once per period atlow-density survey points in 2002 and at both low- andmedium-density survey points in 2003. We used only low-density survey points initially because we believed that anobserver could distinguish individual doves only at low-density survey points. However, during 2002 we discoveredthat individual doves also could be distinguished atmedium-density survey points.
Count duration.—We conducted 10-minute counts 4–8times per period at low-density survey points in 2002 and atboth low- and medium-density survey points in 2003. Thesecounts consisted of 5 consecutive counts of 2 minutes’duration. For each successive time interval (0–2 min, .2–4min, etc.), we determined only the number of newindividuals calling and accumulative total doves calling.We calculated a mean percentage of doves heard for eachinterval for each site.
Evaluation of Electronic CounterPersonnel in the College of Engineering at Texas A&MUniversity-Kingsville developed an electronic counter to surveycalling white-winged dove. The electronic counter was aMATLAB 5.1 (Mathworks, Natick, Massachusetts) computerprogram that tallied white-winged dove calls based on acousticfrequency corresponding to a white-winged dove call (Irani2002, Preetham 2002). The electronic counter tallied only totalwhite-winged dove calls and not individual doves.
In 2002 and 2003, we obtained 2-minute recordings duringeach 2-minute auditory count using a MKH-416 microphone(Sennheiser Electronic Corporation, Old Lyme, Connecti-cut) and a portable Sony TCD-D100 Portable Digital AudioTape Walkman Field Recorder (Sony, New York City, NewYork). Each recording was subsequently processed by theelectronic counter to determine total number of calls heard.This procedure involved partitioning each recording into 200segments and further partitioning each segment into 25-millisecond subsegments (Irani 2002, Preetham 2002). Theacoustic frequency of each segment piece was determined, andwe then put this information into a matrix to determine if theparticular segment occurred within target range for white-winged dove acoustic frequency. Although the mean acousticfrequency of white-winged dove was estimated to be 625 Hz(Waechtler 1977), we set the range from 100 to 1,000 Hzbecause it was found that white-winged dove acousticfrequencies ranged as low as 100 Hz in high-density situationsand as high as 1,000 Hz for individual doves (Irani 2002,Preetham 2002). When a segment met the target acousticfrequency, we tabulated a one in the matrix, and if not, we
noted a zero. We totaled the occurrence of ones to estimatethe total number of calls detected. We did not attempt torelate range, distribution, and mean calling rate amongindividuals with different temporal, spatial, and intrinsiccharacteristics (e.g., age, gender, breeding status, etc.).
Statistical AnalysesEvaluation of coo-count survey.—We estimated peak
time of year for dove calling by fitting a linear spline modelwith unknown knot to weekly averages of 2-minuteauditory-count data using PROC NLIN (SAS Institute2001). The peak time was determined to be the abscissa ofthe knot. We defined the range of dates for peak calling tobe the 95% confidence interval (CI) for the knot. We alsoused this same approach to determine the diurnal peak indove calling. To evaluate duration of auditory counts, wecalculated the mean percentage of doves heard calling ateach interval out of the total number of doves detectedduring 10-minute counts.
Assessment of dove calling as a correlate ofpopulation abundance.—We calculated Pearson’s prod-uct–moment correlation coefficients between dove calling(i.e., auditory estimate and electronic tally) and populationabundance (i.e., dove density and nest density) using 2different approaches: 1) dove calling to nest-densityestimates corresponding to the peak time period asidentified by linear spline models, and 2) dove calling tonest-density estimates corresponding to the prepeak andpeak period, respectively, following Texas Parks and Wild-life Department protocol. The latter correlation involved atemporal offset because Texas Parks and Wildlife Depart-ment protocol associated peak calling, which was believed tooccur in May, to peak nesting, which occurred in June.
Evaluation of electronic counter.—We used Pearson’sproduct–moment correlation coefficients to relate elec-tronic-counter tally with population and nest densityfollowing the same 2 approaches described above.
Results
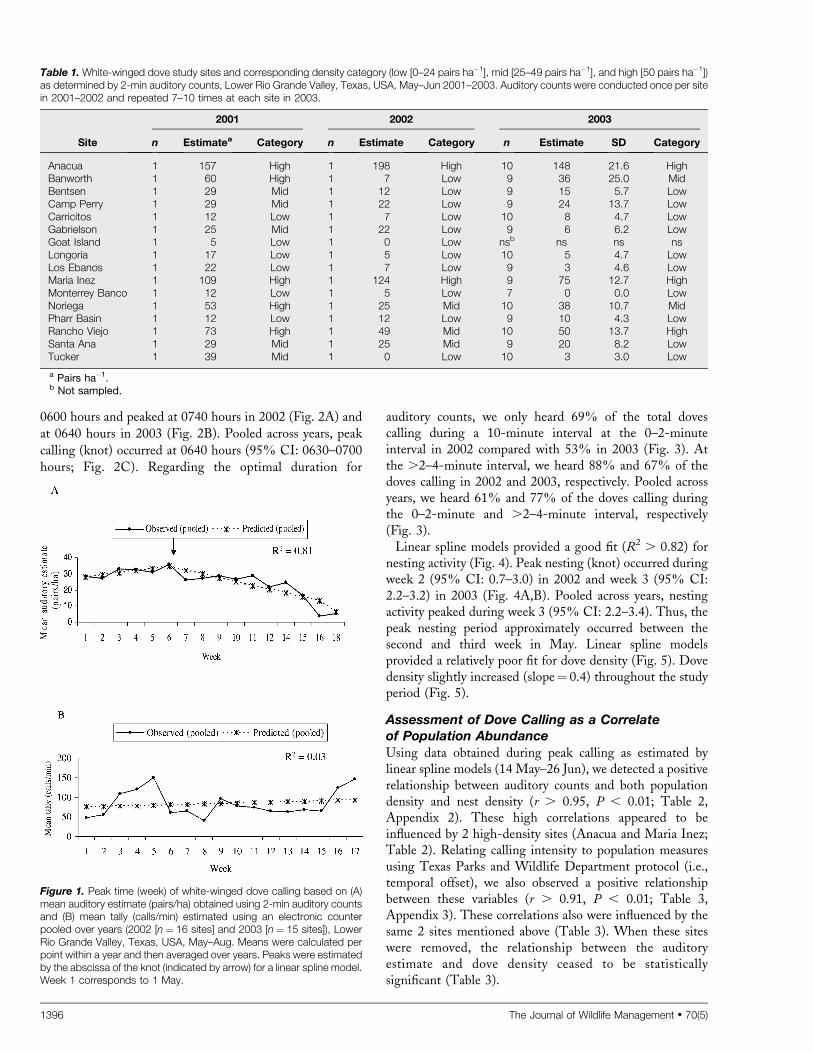
Evaluation of Coo-Count SurveyWhite-winged dove abundance as estimated by auditorycounts varied across years. These fluctuations resulted inseveral sites that did not maintain their original densitydesignation (Table 1). Although our study began with equalallocation of sites by density category in 2001, our study sitesconsisted of 11 low-, 3 medium-, and 2 high-densitycategories in 2002 and 10, 2, and 3, respectively, in 2003(Table 1).
Linear spline models provided a good fit (R2 ¼ 0.81) forcalling intensity as estimated by auditory counts (Fig. 1A).We documented that peak calling (knot) occurred duringweek 5 (95% CI: 1.9–8.1). Thus, the peak calling periodapproximately occurred between the second week in Mayand the third week in June. Linear spline models were notgood predictors of calling intensity (R2¼ 0.03) as estimatedby the electronic counter, and a peak (knot) could not beidentified (Fig. 1B).
Calling intensity within a diurnal period increased from
Sepulveda et al. � Evaluation of Auditory Counts for White-Winged Dove 1395
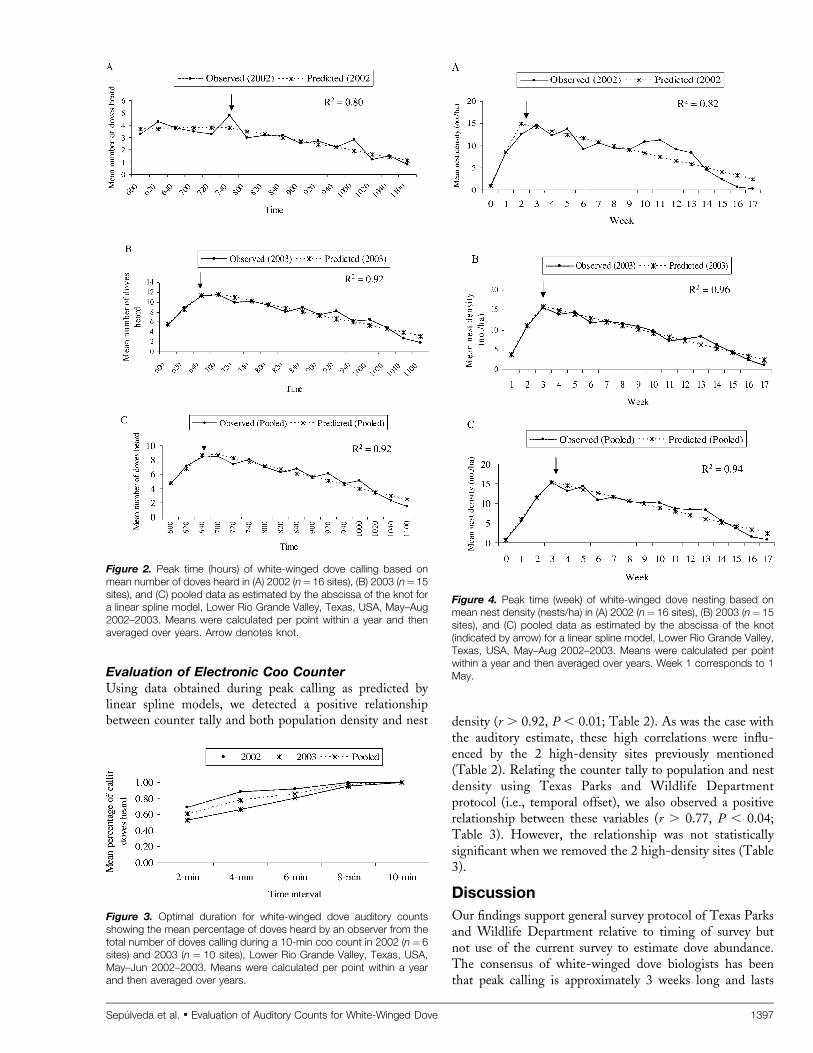
0600 hours and peaked at 0740 hours in 2002 (Fig. 2A) and
at 0640 hours in 2003 (Fig. 2B). Pooled across years, peak
calling (knot) occurred at 0640 hours (95% CI: 0630–0700
hours; Fig. 2C). Regarding the optimal duration for
auditory counts, we only heard 69% of the total dovescalling during a 10-minute interval at the 0–2-minuteinterval in 2002 compared with 53% in 2003 (Fig. 3). Atthe .2–4-minute interval, we heard 88% and 67% of thedoves calling in 2002 and 2003, respectively. Pooled acrossyears, we heard 61% and 77% of the doves calling duringthe 0–2-minute and .2–4-minute interval, respectively(Fig. 3).
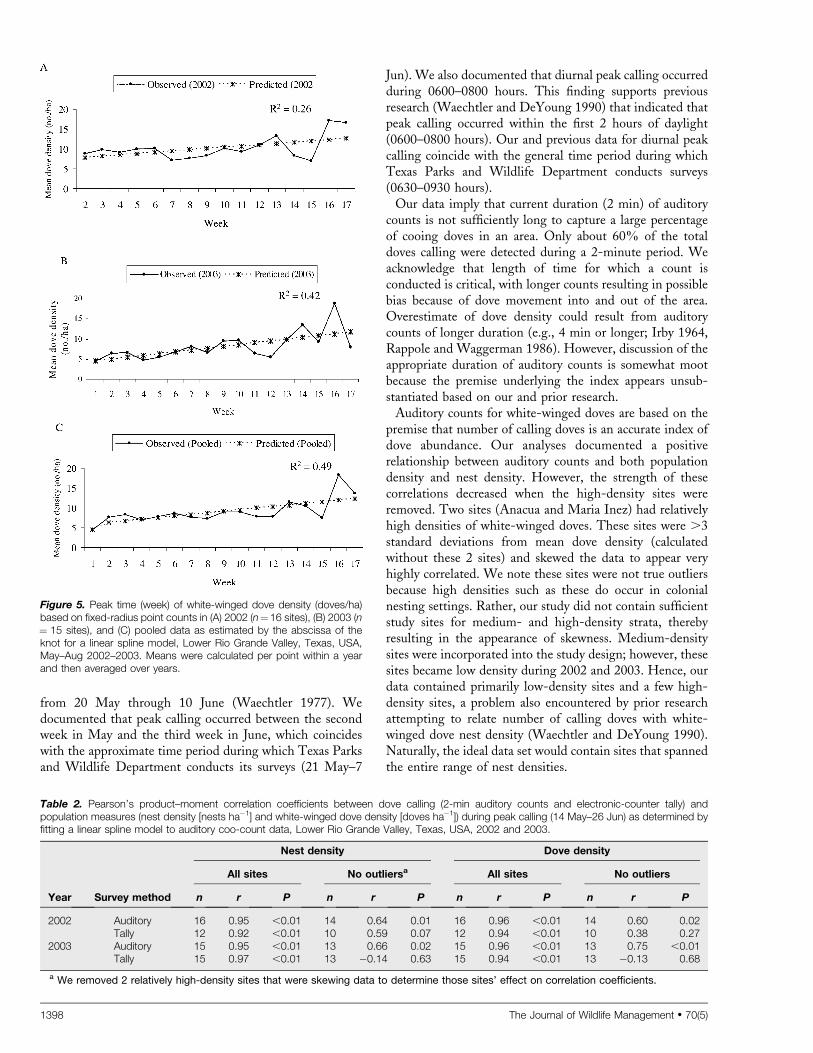
Linear spline models provided a good fit (R2 . 0.82) fornesting activity (Fig. 4). Peak nesting (knot) occurred duringweek 2 (95% CI: 0.7–3.0) in 2002 and week 3 (95% CI:2.2–3.2) in 2003 (Fig. 4A,B). Pooled across years, nestingactivity peaked during week 3 (95% CI: 2.2–3.4). Thus, thepeak nesting period approximately occurred between thesecond and third week in May. Linear spline modelsprovided a relatively poor fit for dove density (Fig. 5). Dovedensity slightly increased (slope¼ 0.4) throughout the studyperiod (Fig. 5).
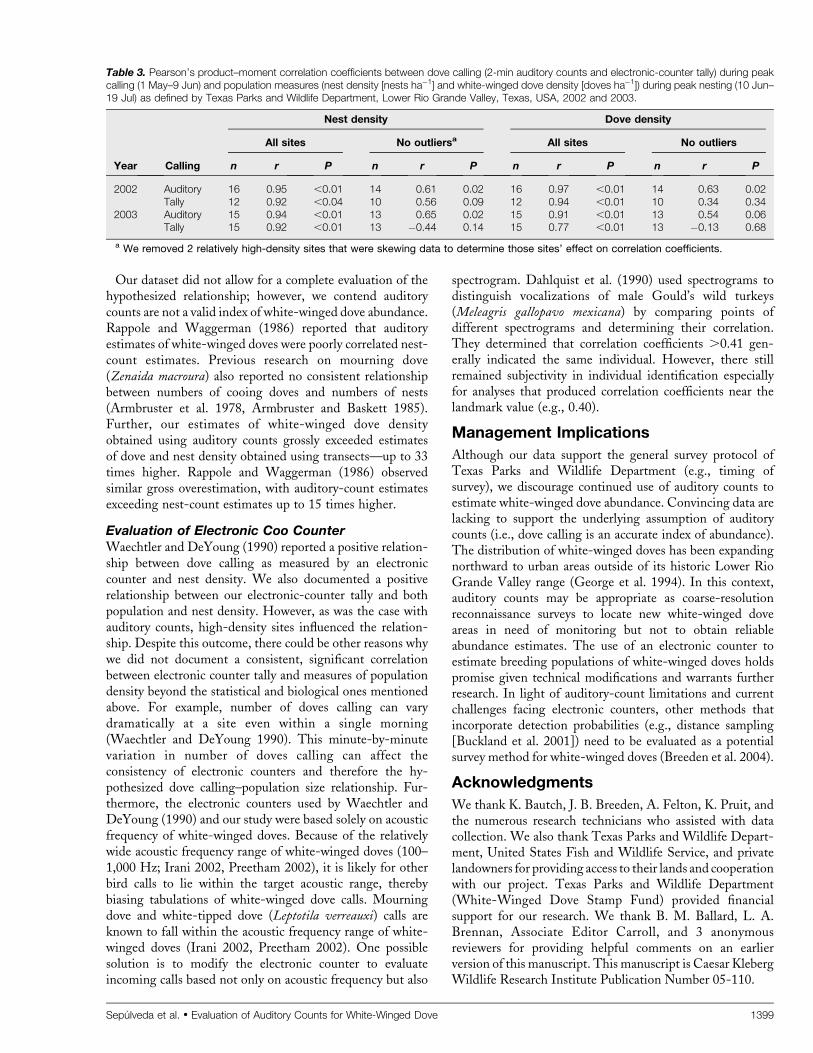
Assessment of Dove Calling as a Correlateof Population AbundanceUsing data obtained during peak calling as estimated bylinear spline models (14 May–26 Jun), we detected a positiverelationship between auditory counts and both populationdensity and nest density (r . 0.95, P , 0.01; Table 2,Appendix 2). These high correlations appeared to beinfluenced by 2 high-density sites (Anacua and Maria Inez;Table 2). Relating calling intensity to population measuresusing Texas Parks and Wildlife Department protocol (i.e.,temporal offset), we also observed a positive relationshipbetween these variables (r . 0.91, P , 0.01; Table 3,Appendix 3). These correlations also were influenced by thesame 2 sites mentioned above (Table 3). When these siteswere removed, the relationship between the auditoryestimate and dove density ceased to be statisticallysignificant (Table 3).
Table 1. White-winged dove study sites and corresponding density category (low [0–24 pairs ha�1], mid [25–49 pairs ha�1], and high [50 pairs ha�1])as determined by 2-min auditory counts, Lower Rio Grande Valley, Texas, USA, May–Jun 2001–2003. Auditory counts were conducted once per sitein 2001–2002 and repeated 7–10 times at each site in 2003.
2001 2002 2003
Site n Estimatea Category n Estimate Category n Estimate SD Category
Anacua 1 157 High 1 198 High 10 148 21.6 HighBanworth 1 60 High 1 7 Low 9 36 25.0 MidBentsen 1 29 Mid 1 12 Low 9 15 5.7 LowCamp Perry 1 29 Mid 1 22 Low 9 24 13.7 LowCarricitos 1 12 Low 1 7 Low 10 8 4.7 LowGabrielson 1 25 Mid 1 22 Low 9 6 6.2 LowGoat Island 1 5 Low 1 0 Low nsb ns ns nsLongoria 1 17 Low 1 5 Low 10 5 4.7 LowLos Ebanos 1 22 Low 1 7 Low 9 3 4.6 LowMaria Inez 1 109 High 1 124 High 9 75 12.7 HighMonterrey Banco 1 12 Low 1 5 Low 7 0 0.0 LowNoriega 1 53 High 1 25 Mid 10 38 10.7 MidPharr Basin 1 12 Low 1 12 Low 9 10 4.3 LowRancho Viejo 1 73 High 1 49 Mid 10 50 13.7 HighSanta Ana 1 29 Mid 1 25 Mid 9 20 8.2 LowTucker 1 39 Mid 1 0 Low 10 3 3.0 Low
a Pairs ha�1.b Not sampled.
Figure 1. Peak time (week) of white-winged dove calling based on (A)mean auditory estimate (pairs/ha) obtained using 2-min auditory countsand (B) mean tally (calls/min) estimated using an electronic counterpooled over years (2002 [n¼ 16 sites] and 2003 [n¼ 15 sites]), LowerRio Grande Valley, Texas, USA, May–Aug. Means were calculated perpoint within a year and then averaged over years. Peaks were estimatedby the abscissa of the knot (indicated by arrow) for a linear spline model.Week 1 corresponds to 1 May.
1396 The Journal of Wildlife Management � 70(5)
Evaluation of Electronic Coo CounterUsing data obtained during peak calling as predicted bylinear spline models, we detected a positive relationshipbetween counter tally and both population density and nest density (r . 0.92, P , 0.01; Table 2). As was the case with
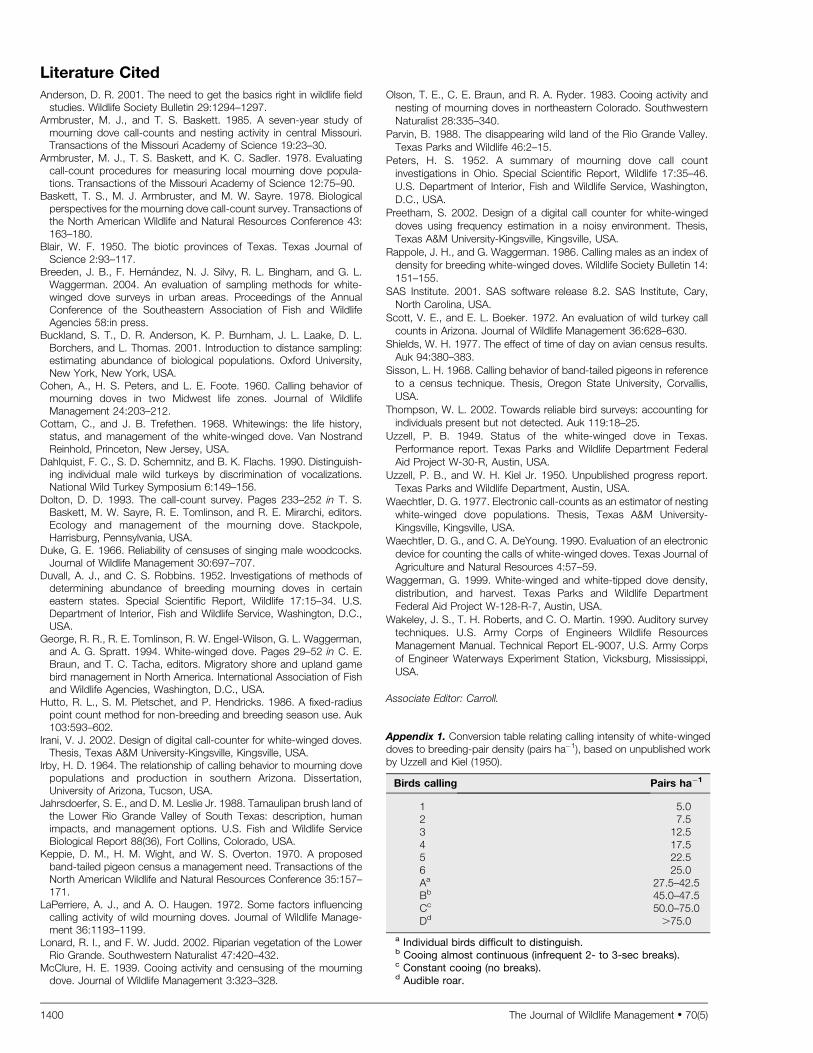
the auditory estimate, these high correlations were influ-enced by the 2 high-density sites previously mentioned(Table 2). Relating the counter tally to population and nestdensity using Texas Parks and Wildlife Departmentprotocol (i.e., temporal offset), we also observed a positiverelationship between these variables (r . 0.77, P , 0.04;Table 3). However, the relationship was not statisticallysignificant when we removed the 2 high-density sites (Table3).
Discussion
Our findings support general survey protocol of Texas Parksand Wildlife Department relative to timing of survey butnot use of the current survey to estimate dove abundance.The consensus of white-winged dove biologists has beenthat peak calling is approximately 3 weeks long and lasts
Figure 2. Peak time (hours) of white-winged dove calling based onmean number of doves heard in (A) 2002 (n¼16 sites), (B) 2003 (n¼15sites), and (C) pooled data as estimated by the abscissa of the knot fora linear spline model, Lower Rio Grande Valley, Texas, USA, May–Aug2002–2003. Means were calculated per point within a year and thenaveraged over years. Arrow denotes knot.
Figure 3. Optimal duration for white-winged dove auditory countsshowing the mean percentage of doves heard by an observer from thetotal number of doves calling during a 10-min coo count in 2002 (n¼ 6sites) and 2003 (n ¼ 10 sites), Lower Rio Grande Valley, Texas, USA,May–Jun 2002–2003. Means were calculated per point within a yearand then averaged over years.
Figure 4. Peak time (week) of white-winged dove nesting based onmean nest density (nests/ha) in (A) 2002 (n¼ 16 sites), (B) 2003 (n¼ 15sites), and (C) pooled data as estimated by the abscissa of the knot(indicated by arrow) for a linear spline model, Lower Rio Grande Valley,Texas, USA, May–Aug 2002–2003. Means were calculated per pointwithin a year and then averaged over years. Week 1 corresponds to 1May.
Sepulveda et al. � Evaluation of Auditory Counts for White-Winged Dove 1397
from 20 May through 10 June (Waechtler 1977). Wedocumented that peak calling occurred between the secondweek in May and the third week in June, which coincideswith the approximate time period during which Texas Parksand Wildlife Department conducts its surveys (21 May–7
Jun). We also documented that diurnal peak calling occurredduring 0600–0800 hours. This finding supports previousresearch (Waechtler and DeYoung 1990) that indicated thatpeak calling occurred within the first 2 hours of daylight(0600–0800 hours). Our and previous data for diurnal peakcalling coincide with the general time period during whichTexas Parks and Wildlife Department conducts surveys(0630–0930 hours).
Our data imply that current duration (2 min) of auditorycounts is not sufficiently long to capture a large percentageof cooing doves in an area. Only about 60% of the totaldoves calling were detected during a 2-minute period. Weacknowledge that length of time for which a count isconducted is critical, with longer counts resulting in possiblebias because of dove movement into and out of the area.Overestimate of dove density could result from auditorycounts of longer duration (e.g., 4 min or longer; Irby 1964,Rappole and Waggerman 1986). However, discussion of theappropriate duration of auditory counts is somewhat mootbecause the premise underlying the index appears unsub-stantiated based on our and prior research.
Auditory counts for white-winged doves are based on thepremise that number of calling doves is an accurate index ofdove abundance. Our analyses documented a positiverelationship between auditory counts and both populationdensity and nest density. However, the strength of thesecorrelations decreased when the high-density sites wereremoved. Two sites (Anacua and Maria Inez) had relativelyhigh densities of white-winged doves. These sites were .3standard deviations from mean dove density (calculatedwithout these 2 sites) and skewed the data to appear veryhighly correlated. We note these sites were not true outliersbecause high densities such as these do occur in colonialnesting settings. Rather, our study did not contain sufficientstudy sites for medium- and high-density strata, therebyresulting in the appearance of skewness. Medium-densitysites were incorporated into the study design; however, thesesites became low density during 2002 and 2003. Hence, ourdata contained primarily low-density sites and a few high-density sites, a problem also encountered by prior researchattempting to relate number of calling doves with white-winged dove nest density (Waechtler and DeYoung 1990).Naturally, the ideal data set would contain sites that spannedthe entire range of nest densities.
Figure 5. Peak time (week) of white-winged dove density (doves/ha)based on fixed-radius point counts in (A) 2002 (n¼16 sites), (B) 2003 (n¼ 15 sites), and (C) pooled data as estimated by the abscissa of theknot for a linear spline model, Lower Rio Grande Valley, Texas, USA,May–Aug 2002–2003. Means were calculated per point within a yearand then averaged over years.
Table 2. Pearson’s product–moment correlation coefficients between dove calling (2-min auditory counts and electronic-counter tally) andpopulation measures (nest density [nests ha�1] and white-winged dove density [doves ha�1]) during peak calling (14 May–26 Jun) as determined byfitting a linear spline model to auditory coo-count data, Lower Rio Grande Valley, Texas, USA, 2002 and 2003.
Nest density Dove density
All sites No outliersa All sites No outliers
Year Survey method n r P n r P n r P n r P
2002 Auditory 16 0.95 ,0.01 14 0.64 0.01 16 0.96 ,0.01 14 0.60 0.02Tally 12 0.92 ,0.01 10 0.59 0.07 12 0.94 ,0.01 10 0.38 0.27
2003 Auditory 15 0.95 ,0.01 13 0.66 0.02 15 0.96 ,0.01 13 0.75 ,0.01Tally 15 0.97 ,0.01 13 �0.14 0.63 15 0.94 ,0.01 13 �0.13 0.68
a We removed 2 relatively high-density sites that were skewing data to determine those sites’ effect on correlation coefficients.
1398 The Journal of Wildlife Management � 70(5)
Our dataset did not allow for a complete evaluation of thehypothesized relationship; however, we contend auditorycounts are not a valid index of white-winged dove abundance.Rappole and Waggerman (1986) reported that auditoryestimates of white-winged doves were poorly correlated nest-count estimates. Previous research on mourning dove(Zenaida macroura) also reported no consistent relationshipbetween numbers of cooing doves and numbers of nests(Armbruster et al. 1978, Armbruster and Baskett 1985).Further, our estimates of white-winged dove densityobtained using auditory counts grossly exceeded estimatesof dove and nest density obtained using transects—up to 33times higher. Rappole and Waggerman (1986) observedsimilar gross overestimation, with auditory-count estimatesexceeding nest-count estimates up to 15 times higher.
Evaluation of Electronic Coo CounterWaechtler and DeYoung (1990) reported a positive relation-ship between dove calling as measured by an electroniccounter and nest density. We also documented a positiverelationship between our electronic-counter tally and bothpopulation and nest density. However, as was the case withauditory counts, high-density sites influenced the relation-ship. Despite this outcome, there could be other reasons whywe did not document a consistent, significant correlationbetween electronic counter tally and measures of populationdensity beyond the statistical and biological ones mentionedabove. For example, number of doves calling can varydramatically at a site even within a single morning(Waechtler and DeYoung 1990). This minute-by-minutevariation in number of doves calling can affect theconsistency of electronic counters and therefore the hy-pothesized dove calling–population size relationship. Fur-thermore, the electronic counters used by Waechtler andDeYoung (1990) and our study were based solely on acousticfrequency of white-winged doves. Because of the relativelywide acoustic frequency range of white-winged doves (100–1,000 Hz; Irani 2002, Preetham 2002), it is likely for otherbird calls to lie within the target acoustic range, therebybiasing tabulations of white-winged dove calls. Mourningdove and white-tipped dove (Leptotila verreauxi) calls areknown to fall within the acoustic frequency range of white-winged doves (Irani 2002, Preetham 2002). One possiblesolution is to modify the electronic counter to evaluateincoming calls based not only on acoustic frequency but also
spectrogram. Dahlquist et al. (1990) used spectrograms todistinguish vocalizations of male Gould’s wild turkeys(Meleagris gallopavo mexicana) by comparing points ofdifferent spectrograms and determining their correlation.They determined that correlation coefficients .0.41 gen-erally indicated the same individual. However, there stillremained subjectivity in individual identification especiallyfor analyses that produced correlation coefficients near thelandmark value (e.g., 0.40).
Management Implications
Although our data support the general survey protocol ofTexas Parks and Wildlife Department (e.g., timing ofsurvey), we discourage continued use of auditory counts toestimate white-winged dove abundance. Convincing data arelacking to support the underlying assumption of auditorycounts (i.e., dove calling is an accurate index of abundance).The distribution of white-winged doves has been expandingnorthward to urban areas outside of its historic Lower RioGrande Valley range (George et al. 1994). In this context,auditory counts may be appropriate as coarse-resolutionreconnaissance surveys to locate new white-winged doveareas in need of monitoring but not to obtain reliableabundance estimates. The use of an electronic counter toestimate breeding populations of white-winged doves holdspromise given technical modifications and warrants furtherresearch. In light of auditory-count limitations and currentchallenges facing electronic counters, other methods thatincorporate detection probabilities (e.g., distance sampling[Buckland et al. 2001]) need to be evaluated as a potentialsurvey method for white-winged doves (Breeden et al. 2004).
Acknowledgments
We thank K. Bautch, J. B. Breeden, A. Felton, K. Pruit, andthe numerous research technicians who assisted with datacollection. We also thank Texas Parks and Wildlife Depart-ment, United States Fish and Wildlife Service, and privatelandowners for providing access to their lands and cooperationwith our project. Texas Parks and Wildlife Department(White-Winged Dove Stamp Fund) provided financialsupport for our research. We thank B. M. Ballard, L. A.Brennan, Associate Editor Carroll, and 3 anonymousreviewers for providing helpful comments on an earlierversion of this manuscript. This manuscript is Caesar KlebergWildlife Research Institute Publication Number 05-110.
Table 3. Pearson’s product–moment correlation coefficients between dove calling (2-min auditory counts and electronic-counter tally) during peakcalling (1 May–9 Jun) and population measures (nest density [nests ha�1] and white-winged dove density [doves ha�1]) during peak nesting (10 Jun–19 Jul) as defined by Texas Parks and Wildlife Department, Lower Rio Grande Valley, Texas, USA, 2002 and 2003.
Nest density Dove density
All sites No outliersa All sites No outliers
Year Calling n r P n r P n r P n r P
2002 Auditory 16 0.95 ,0.01 14 0.61 0.02 16 0.97 ,0.01 14 0.63 0.02Tally 12 0.92 ,0.04 10 0.56 0.09 12 0.94 ,0.01 10 0.34 0.34
2003 Auditory 15 0.94 ,0.01 13 0.65 0.02 15 0.91 ,0.01 13 0.54 0.06Tally 15 0.92 ,0.01 13 �0.44 0.14 15 0.77 ,0.01 13 �0.13 0.68
a We removed 2 relatively high-density sites that were skewing data to determine those sites’ effect on correlation coefficients.
Sepulveda et al. � Evaluation of Auditory Counts for White-Winged Dove 1399
Literature Cited
Anderson, D. R. 2001. The need to get the basics right in wildlife fieldstudies. Wildlife Society Bulletin 29:1294–1297.
Armbruster, M. J., and T. S. Baskett. 1985. A seven-year study ofmourning dove call-counts and nesting activity in central Missouri.Transactions of the Missouri Academy of Science 19:23–30.
Armbruster, M. J., T. S. Baskett, and K. C. Sadler. 1978. Evaluatingcall-count procedures for measuring local mourning dove popula-tions. Transactions of the Missouri Academy of Science 12:75–90.
Baskett, T. S., M. J. Armbruster, and M. W. Sayre. 1978. Biologicalperspectives for the mourning dove call-count survey. Transactions ofthe North American Wildlife and Natural Resources Conference 43:163–180.
Blair, W. F. 1950. The biotic provinces of Texas. Texas Journal ofScience 2:93–117.
Breeden, J. B., F. Hernandez, N. J. Silvy, R. L. Bingham, and G. L.Waggerman. 2004. An evaluation of sampling methods for white-winged dove surveys in urban areas. Proceedings of the AnnualConference of the Southeastern Association of Fish and WildlifeAgencies 58:in press.
Buckland, S. T., D. R. Anderson, K. P. Burnham, J. L. Laake, D. L.Borchers, and L. Thomas. 2001. Introduction to distance sampling:estimating abundance of biological populations. Oxford University,New York, New York, USA.
Cohen, A., H. S. Peters, and L. E. Foote. 1960. Calling behavior ofmourning doves in two Midwest life zones. Journal of WildlifeManagement 24:203–212.
Cottam, C., and J. B. Trefethen. 1968. Whitewings: the life history,status, and management of the white-winged dove. Van NostrandReinhold, Princeton, New Jersey, USA.
Dahlquist, F. C., S. D. Schemnitz, and B. K. Flachs. 1990. Distinguish-ing individual male wild turkeys by discrimination of vocalizations.National Wild Turkey Symposium 6:149–156.
Dolton, D. D. 1993. The call-count survey. Pages 233–252 in T. S.Baskett, M. W. Sayre, R. E. Tomlinson, and R. E. Mirarchi, editors.Ecology and management of the mourning dove. Stackpole,Harrisburg, Pennsylvania, USA.
Duke, G. E. 1966. Reliability of censuses of singing male woodcocks.Journal of Wildlife Management 30:697–707.
Duvall, A. J., and C. S. Robbins. 1952. Investigations of methods ofdetermining abundance of breeding mourning doves in certaineastern states. Special Scientific Report, Wildlife 17:15–34. U.S.Department of Interior, Fish and Wildlife Service, Washington, D.C.,USA.
George, R. R., R. E. Tomlinson, R. W. Engel-Wilson, G. L. Waggerman,and A. G. Spratt. 1994. White-winged dove. Pages 29–52 in C. E.Braun, and T. C. Tacha, editors. Migratory shore and upland gamebird management in North America. International Association of Fishand Wildlife Agencies, Washington, D.C., USA.
Hutto, R. L., S. M. Pletschet, and P. Hendricks. 1986. A fixed-radiuspoint count method for non-breeding and breeding season use. Auk103:593–602.
Irani, V. J. 2002. Design of digital call-counter for white-winged doves.Thesis, Texas A&M University-Kingsville, Kingsville, USA.
Irby, H. D. 1964. The relationship of calling behavior to mourning dovepopulations and production in southern Arizona. Dissertation,University of Arizona, Tucson, USA.
Jahrsdoerfer, S. E., and D. M. Leslie Jr. 1988. Tamaulipan brush land ofthe Lower Rio Grande Valley of South Texas: description, humanimpacts, and management options. U.S. Fish and Wildlife ServiceBiological Report 88(36), Fort Collins, Colorado, USA.
Keppie, D. M., H. M. Wight, and W. S. Overton. 1970. A proposedband-tailed pigeon census a management need. Transactions of theNorth American Wildlife and Natural Resources Conference 35:157–171.
LaPerriere, A. J., and A. O. Haugen. 1972. Some factors influencingcalling activity of wild mourning doves. Journal of Wildlife Manage-ment 36:1193–1199.
Lonard, R. I., and F. W. Judd. 2002. Riparian vegetation of the LowerRio Grande. Southwestern Naturalist 47:420–432.
McClure, H. E. 1939. Cooing activity and censusing of the mourningdove. Journal of Wildlife Management 3:323–328.
Olson, T. E., C. E. Braun, and R. A. Ryder. 1983. Cooing activity andnesting of mourning doves in northeastern Colorado. SouthwesternNaturalist 28:335–340.
Parvin, B. 1988. The disappearing wild land of the Rio Grande Valley.Texas Parks and Wildlife 46:2–15.
Peters, H. S. 1952. A summary of mourning dove call countinvestigations in Ohio. Special Scientific Report, Wildlife 17:35–46.U.S. Department of Interior, Fish and Wildlife Service, Washington,D.C., USA.
Preetham, S. 2002. Design of a digital call counter for white-wingeddoves using frequency estimation in a noisy environment. Thesis,Texas A&M University-Kingsville, Kingsville, USA.
Rappole, J. H., and G. Waggerman. 1986. Calling males as an index ofdensity for breeding white-winged doves. Wildlife Society Bulletin 14:151–155.
SAS Institute. 2001. SAS software release 8.2. SAS Institute, Cary,North Carolina, USA.
Scott, V. E., and E. L. Boeker. 1972. An evaluation of wild turkey callcounts in Arizona. Journal of Wildlife Management 36:628–630.
Shields, W. H. 1977. The effect of time of day on avian census results.Auk 94:380–383.
Sisson, L. H. 1968. Calling behavior of band-tailed pigeons in referenceto a census technique. Thesis, Oregon State University, Corvallis,USA.
Thompson, W. L. 2002. Towards reliable bird surveys: accounting forindividuals present but not detected. Auk 119:18–25.
Uzzell, P. B. 1949. Status of the white-winged dove in Texas.Performance report. Texas Parks and Wildlife Department FederalAid Project W-30-R, Austin, USA.
Uzzell, P. B., and W. H. Kiel Jr. 1950. Unpublished progress report.Texas Parks and Wildlife Department, Austin, USA.
Waechtler, D. G. 1977. Electronic call-counts as an estimator of nestingwhite-winged dove populations. Thesis, Texas A&M University-Kingsville, Kingsville, USA.
Waechtler, D. G., and C. A. DeYoung. 1990. Evaluation of an electronicdevice for counting the calls of white-winged doves. Texas Journal ofAgriculture and Natural Resources 4:57–59.
Waggerman, G. 1999. White-winged and white-tipped dove density,distribution, and harvest. Texas Parks and Wildlife DepartmentFederal Aid Project W-128-R-7, Austin, USA.
Wakeley, J. S., T. H. Roberts, and C. O. Martin. 1990. Auditory surveytechniques. U.S. Army Corps of Engineers Wildlife ResourcesManagement Manual. Technical Report EL-9007, U.S. Army Corpsof Engineer Waterways Experiment Station, Vicksburg, Mississippi,USA.
Associate Editor: Carroll.
Appendix 1. Conversion table relating calling intensity of white-wingeddoves to breeding-pair density (pairs ha�1), based on unpublished workby Uzzell and Kiel (1950).
Birds calling Pairs ha�1
1 5.02 7.53 12.54 17.55 22.56 25.0Aa 27.5–42.5Bb 45.0–47.5Cc 50.0–75.0Dd .75.0
a Individual birds difficult to distinguish.b Cooing almost continuous (infrequent 2- to 3-sec breaks).c Constant cooing (no breaks).d Audible roar.
1400 The Journal of Wildlife Management � 70(5)
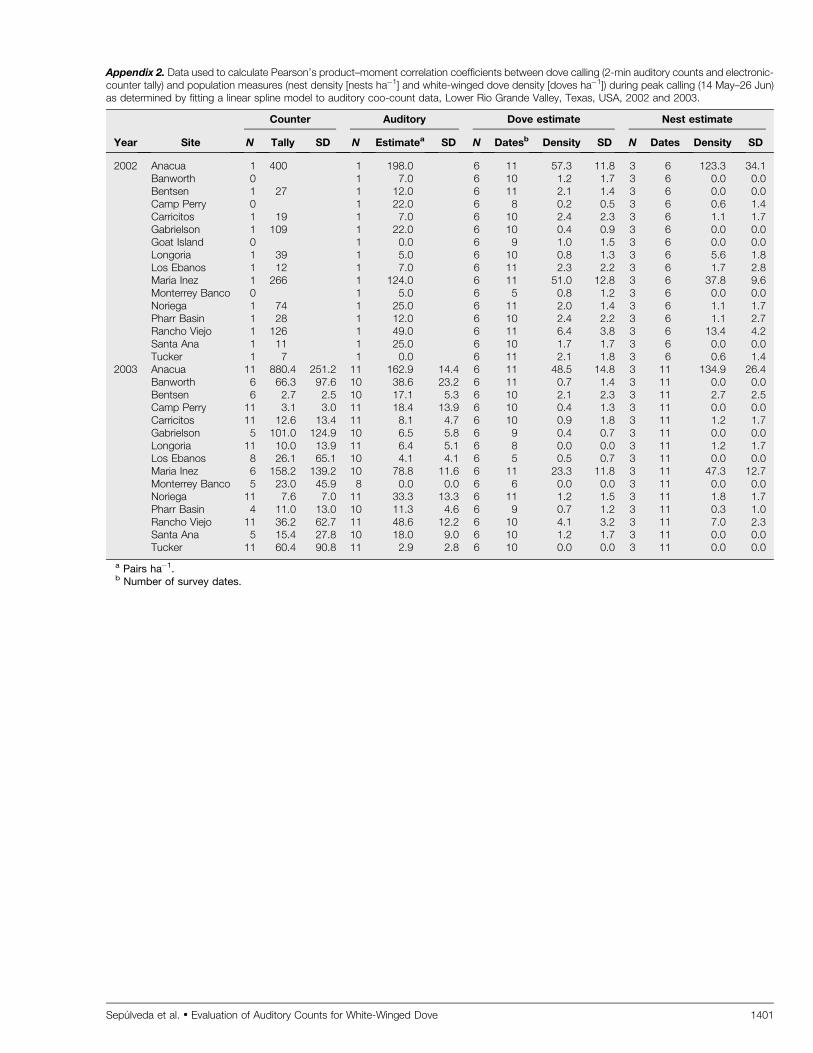
Appendix 2. Data used to calculate Pearson’s product–moment correlation coefficients between dove calling (2-min auditory counts and electronic-counter tally) and population measures (nest density [nests ha�1] and white-winged dove density [doves ha�1]) during peak calling (14 May–26 Jun)as determined by fitting a linear spline model to auditory coo-count data, Lower Rio Grande Valley, Texas, USA, 2002 and 2003.
Counter Auditory Dove estimate Nest estimate
Year Site N Tally SD N Estimatea SD N Datesb Density SD N Dates Density SD
2002 Anacua 1 400 1 198.0 6 11 57.3 11.8 3 6 123.3 34.1Banworth 0 1 7.0 6 10 1.2 1.7 3 6 0.0 0.0Bentsen 1 27 1 12.0 6 11 2.1 1.4 3 6 0.0 0.0Camp Perry 0 1 22.0 6 8 0.2 0.5 3 6 0.6 1.4Carricitos 1 19 1 7.0 6 10 2.4 2.3 3 6 1.1 1.7Gabrielson 1 109 1 22.0 6 10 0.4 0.9 3 6 0.0 0.0Goat Island 0 1 0.0 6 9 1.0 1.5 3 6 0.0 0.0Longoria 1 39 1 5.0 6 10 0.8 1.3 3 6 5.6 1.8Los Ebanos 1 12 1 7.0 6 11 2.3 2.2 3 6 1.7 2.8Maria Inez 1 266 1 124.0 6 11 51.0 12.8 3 6 37.8 9.6Monterrey Banco 0 1 5.0 6 5 0.8 1.2 3 6 0.0 0.0Noriega 1 74 1 25.0 6 11 2.0 1.4 3 6 1.1 1.7Pharr Basin 1 28 1 12.0 6 10 2.4 2.2 3 6 1.1 2.7Rancho Viejo 1 126 1 49.0 6 11 6.4 3.8 3 6 13.4 4.2Santa Ana 1 11 1 25.0 6 10 1.7 1.7 3 6 0.0 0.0Tucker 1 7 1 0.0 6 11 2.1 1.8 3 6 0.6 1.4
2003 Anacua 11 880.4 251.2 11 162.9 14.4 6 11 48.5 14.8 3 11 134.9 26.4Banworth 6 66.3 97.6 10 38.6 23.2 6 11 0.7 1.4 3 11 0.0 0.0Bentsen 6 2.7 2.5 10 17.1 5.3 6 10 2.1 2.3 3 11 2.7 2.5Camp Perry 11 3.1 3.0 11 18.4 13.9 6 10 0.4 1.3 3 11 0.0 0.0Carricitos 11 12.6 13.4 11 8.1 4.7 6 10 0.9 1.8 3 11 1.2 1.7Gabrielson 5 101.0 124.9 10 6.5 5.8 6 9 0.4 0.7 3 11 0.0 0.0Longoria 11 10.0 13.9 11 6.4 5.1 6 8 0.0 0.0 3 11 1.2 1.7Los Ebanos 8 26.1 65.1 10 4.1 4.1 6 5 0.5 0.7 3 11 0.0 0.0Maria Inez 6 158.2 139.2 10 78.8 11.6 6 11 23.3 11.8 3 11 47.3 12.7Monterrey Banco 5 23.0 45.9 8 0.0 0.0 6 6 0.0 0.0 3 11 0.0 0.0Noriega 11 7.6 7.0 11 33.3 13.3 6 11 1.2 1.5 3 11 1.8 1.7Pharr Basin 4 11.0 13.0 10 11.3 4.6 6 9 0.7 1.2 3 11 0.3 1.0Rancho Viejo 11 36.2 62.7 11 48.6 12.2 6 10 4.1 3.2 3 11 7.0 2.3Santa Ana 5 15.4 27.8 10 18.0 9.0 6 10 1.2 1.7 3 11 0.0 0.0Tucker 11 60.4 90.8 11 2.9 2.8 6 10 0.0 0.0 3 11 0.0 0.0
a Pairs ha�1.b Number of survey dates.
Sepulveda et al. � Evaluation of Auditory Counts for White-Winged Dove 1401
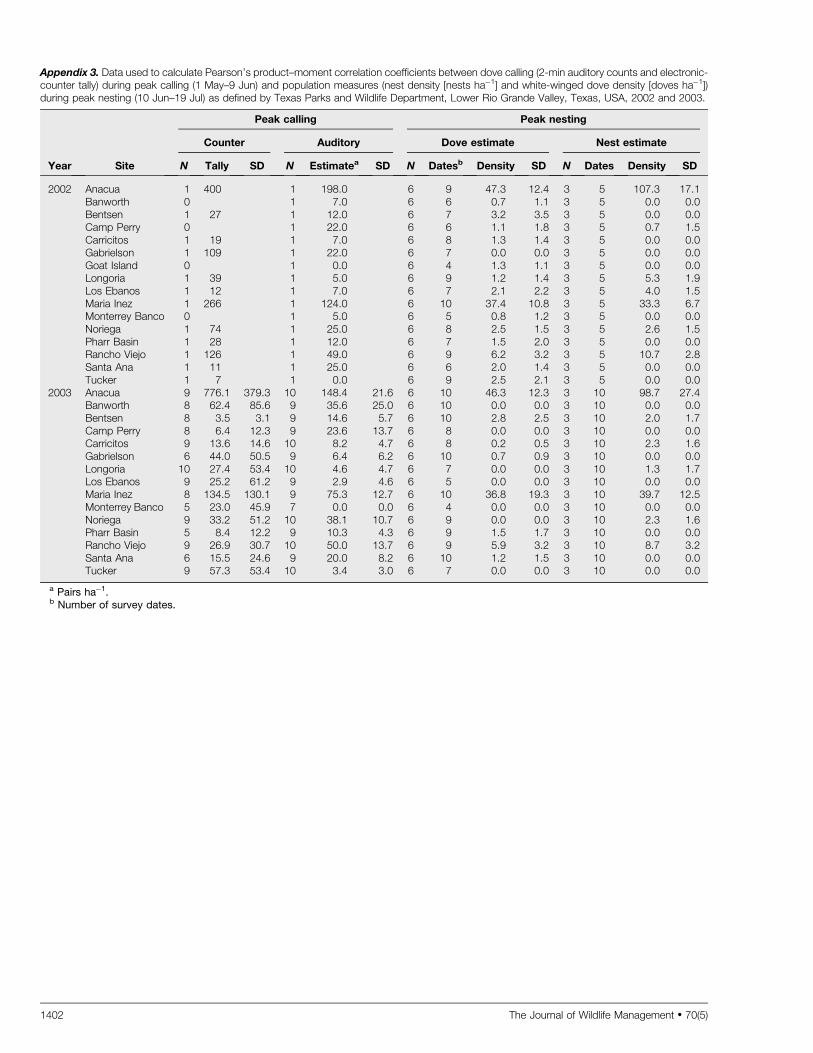
Appendix 3. Data used to calculate Pearson’s product–moment correlation coefficients between dove calling (2-min auditory counts and electronic-counter tally) during peak calling (1 May–9 Jun) and population measures (nest density [nests ha�1] and white-winged dove density [doves ha�1])during peak nesting (10 Jun–19 Jul) as defined by Texas Parks and Wildlife Department, Lower Rio Grande Valley, Texas, USA, 2002 and 2003.
Peak calling Peak nesting
Counter Auditory Dove estimate Nest estimate
Year Site N Tally SD N Estimatea SD N Datesb Density SD N Dates Density SD
2002 Anacua 1 400 1 198.0 6 9 47.3 12.4 3 5 107.3 17.1Banworth 0 1 7.0 6 6 0.7 1.1 3 5 0.0 0.0Bentsen 1 27 1 12.0 6 7 3.2 3.5 3 5 0.0 0.0Camp Perry 0 1 22.0 6 6 1.1 1.8 3 5 0.7 1.5Carricitos 1 19 1 7.0 6 8 1.3 1.4 3 5 0.0 0.0Gabrielson 1 109 1 22.0 6 7 0.0 0.0 3 5 0.0 0.0Goat Island 0 1 0.0 6 4 1.3 1.1 3 5 0.0 0.0Longoria 1 39 1 5.0 6 9 1.2 1.4 3 5 5.3 1.9Los Ebanos 1 12 1 7.0 6 7 2.1 2.2 3 5 4.0 1.5Maria Inez 1 266 1 124.0 6 10 37.4 10.8 3 5 33.3 6.7Monterrey Banco 0 1 5.0 6 5 0.8 1.2 3 5 0.0 0.0Noriega 1 74 1 25.0 6 8 2.5 1.5 3 5 2.6 1.5Pharr Basin 1 28 1 12.0 6 7 1.5 2.0 3 5 0.0 0.0Rancho Viejo 1 126 1 49.0 6 9 6.2 3.2 3 5 10.7 2.8Santa Ana 1 11 1 25.0 6 6 2.0 1.4 3 5 0.0 0.0Tucker 1 7 1 0.0 6 9 2.5 2.1 3 5 0.0 0.0
2003 Anacua 9 776.1 379.3 10 148.4 21.6 6 10 46.3 12.3 3 10 98.7 27.4Banworth 8 62.4 85.6 9 35.6 25.0 6 10 0.0 0.0 3 10 0.0 0.0Bentsen 8 3.5 3.1 9 14.6 5.7 6 10 2.8 2.5 3 10 2.0 1.7Camp Perry 8 6.4 12.3 9 23.6 13.7 6 8 0.0 0.0 3 10 0.0 0.0Carricitos 9 13.6 14.6 10 8.2 4.7 6 8 0.2 0.5 3 10 2.3 1.6Gabrielson 6 44.0 50.5 9 6.4 6.2 6 10 0.7 0.9 3 10 0.0 0.0Longoria 10 27.4 53.4 10 4.6 4.7 6 7 0.0 0.0 3 10 1.3 1.7Los Ebanos 9 25.2 61.2 9 2.9 4.6 6 5 0.0 0.0 3 10 0.0 0.0Maria Inez 8 134.5 130.1 9 75.3 12.7 6 10 36.8 19.3 3 10 39.7 12.5Monterrey Banco 5 23.0 45.9 7 0.0 0.0 6 4 0.0 0.0 3 10 0.0 0.0Noriega 9 33.2 51.2 10 38.1 10.7 6 9 0.0 0.0 3 10 2.3 1.6Pharr Basin 5 8.4 12.2 9 10.3 4.3 6 9 1.5 1.7 3 10 0.0 0.0Rancho Viejo 9 26.9 30.7 10 50.0 13.7 6 9 5.9 3.2 3 10 8.7 3.2Santa Ana 6 15.5 24.6 9 20.0 8.2 6 10 1.2 1.5 3 10 0.0 0.0Tucker 9 57.3 53.4 10 3.4 3.0 6 7 0.0 0.0 3 10 0.0 0.0
a Pairs ha�1.b Number of survey dates.
1402 The Journal of Wildlife Management � 70(5)