Embed Size (px)
Citation preview

Evaluation of CO2 capture with
high performance hollow fi bre membranes from fl ue gas
Final Report
ANLEC Project 3-1110-0087
Dr Hongyu Li, Professor Vicki Chen, Jingwei Hou and Dr
Guangxi Dong
February 2015 | CO2CRC Report No: RPT14-5254
REPORT

CO2CRC PARTICIPANTS
CSIRO
Curtin University
Geoscience Australia
GNS Science
Monash University
Simon Fraser University
University of Adelaide
University of Melbourne
University of New South Wales
University of Western Australia
Core ResearchParticipants
SupportingParticipants
Industry & GovernmentParticipants
CanSyd Australia
Charles Darwin University
Government of South Australia
Lawrence Berkeley National Laboratory
Process Group
The Global CCS Institute
University of Queensland
ANLEC R&D
BG Group
BHP Billiton
BP Developments Australia
Brown Coal Innovation Australia
Chevron
State Government Victoria–Dept. of State
Development Business & Innovation
INPEX
KIGAM
NSW Government Dept. Trade & Investment
Rio Tinto
SASOL
Shell
Total
Western Australia Dept. of Mines and Petroleum
Glencore

Evaluation of CO2 capture with high performance hollow fibre membranes from
flue gas
Final Report
ANLEC Project 3-1110-0087
Dr Hongyu Li, Professor Vicki Chen, Jingwei Hou
and Dr Guangxi Dong
February 2015
CO2CRC Report No: RPT14-5254
Acknowledgements
The authors wish to acknowledge financial assistance provided to the CO2CRC by the Australian
Government through its CRC program and through Australian National Low Emissions Coal Research
and Development (ANLEC R&D). ANLEC R&D is supported by Australian Coal Association Low
Emissions Technology Limited and the Australian Government through the Clean Energy Initiative.
CO2CRC Limited
School of Earth Sciences, University of Melbourne Level 3, 253-283 Elgin Street, VIC 3010 PO Box 1182, Carlton VIC 3053 p: +61 3 9035 9729 www.co2crc.com.au
Reference: Li, H, Chen, V, Dong, G and Hou, J, 2015. Evaluation of CO2 Capture with High
Performance Hollow Fibre Membranes from Flue Gas: Final Report. ANLEC report. Cooperative
Research Centre for Greenhouse Gas Technologies, Canberra, Australia, CO2CRC Publication
Number: RPT14-5254, pp 109.
© CO2CRC 2015
Unless otherwise specified, the Cooperative Research Centre for Greenhouse Gas Technologies (CO2CRC) retains copyright over this publication through its incorporated entity, CO2CRC Ltd. You must not reproduce, distribute, publish, copy, transfer or commercially exploit any information contained in this publication that would be an infringement of any copyright, patent, trademark, design or other intellectual property right.
Requests and inquiries concerning copyright should be addressed to the Commercial Manager, CO2CRC, PO Box 1130, Bentley, WA 6102 AUSTRALIA. Telephone: +61 8 6436 865

i
Executive Summary
This final technical report is prepared for ANLEC R&D Project: 3-1110-0087. This project
aimed to fabricate high performance hollow fibre membranes for CO2 capture from flue gases
and to assess their performance with both a laboratory synthesised gas mixture and real flue
gases from a power plant. In concluding this project, we were expected to:
(1) Select one or two polymers and additives (commercial polymers) as materials for
production of hollow fibre membranes with potential for superior performance based on
the CO2 permeability and CO2/N2 selectivity.
(2) Develop 2 hollow fibre membranes with improved CO2 permeability of at least 50%
higher and comparable CO2/N2 selectivity compared to benchmark hollow fibre
membrane.
(3) Evaluate the tolerance of the hollow fibre membranes to impurities in flue gas with the
objective of achieving stabilised selectivity and permeance over one month operation.
(4) Test the performance of membranes developed in this project with real flue gas on-site
a power plant.
The project started with an extensive State-of-the-Art assessment of material selection and
baseline performance criteria that considered the major techno-economic issues for large-
scale deployment. Fundamental technology background for membrane gas separation and
its application in CO2 capture, particularly in post-combustion flue gas CO2 capture were
reviewed. This was followed by identification of benchmark membrane performances based
on materials that are currently being synthesised and fabricated at scale in hollow fibre
configurations. Those materials were poly(p-phenylene oxide), polyimide (Matrimid®), and
polyethersulfone (PES). They exhibit a permeance in the range of 50 GPU and CO2/N2
selectivity of 25. In conjunction with the good mechanical properties and manufacturing
maturity of these materials and in line with the use of MEA as the solvent benchmark for CO2
capture, these polymers were considered to be the benchmark materials in this study. As
such the CO2/N2 separation target for this project was set as the CO2 permeance surpassing
50 GPU and CO2/N2 selectivity over 25.
Based on the extensive review, screening and selecting benchmark polymer materials, we
selected two materials for hollow fiber membrane development for laboratory and on-site
tests with flue gas.

ii
(1) the 1st generation membrane: hollow fiber membranes fabricated using Matrimid
blended with selected PEO and PEO-PDMS copolymer additives with improved
separation performance and long term performance sustainability;
(2) the 2nd generation membrane: composite hollow fibre membranes developed in this
study with multi-layer coating using selected CO2-philic PEO-PA block copolymers
(PEBAX) as selective layer.
Membranes of both generations were fabricated in house with their separation performance
tested with “clean” CO2 and N2 pure gases (no impurities) and CO2/N2 gas mixture in the
laboratory. For the 1st generation membranes, improved CO2 permeance (between 24-34
GPU) and CO2/N2 selectivity (between 30-40) than commercially available products were
achieved.
For the 2nd generation membranes, a new protocol for dissolving Pebax®1074 grade polymer
using simple and environmentally friendly mixed solvent solution was developed followed by
systematic studies on the phase structure of Pebax® dense membranes (including blended
membranes) and their related gas separation performances. Based on this fundamental
knowledge, composite hollow fiber membrane development was conducted through selection
of suitable microporous substrates, selection of materials for protective gutter layer, and
design and construction of a unique dip-coating facility (funded by CO2CRC) suitable for
hollow fiber composite membranes. At the best combination of the conditions screened in
this study, CO2 permeance up to 560 GPU and CO2/N2 selectivity above 46 was achieved at
room temperature, whereas 950 GPU and CO2/N2 selectivity of 30 was achieved at the
commonly reported temperature of 35ºC. This performance was better than the best
reported results for composite hollow fibers for CO2 capture.
In the Phase 2 membrane development, the separation performance of the candidate
Matrimid hollow fibre membrane was evaluated in the laboratory for tolerance to NO
impurity (the primary impurity present in the flue gas after the pre-treatment column) and
water by testing with a synthesised CO2/N2/NO gas mixture with addition of water vapour.
The test results indicated that the trace amounts of NO only had minor impact on the CO2/N2
separation performance for the Matrimid hollow fibre membrane with 4 % Silwet® L-7607.
Both CO2 permeance and CO2/N2 selectivity dropped less than 10 % compared with the
mixed-gas permeation results without NO. However, the performance tested with humidified
gas (gas feed passing through a water humidifier to add water vapour to the feed to the

iii
membrane), indicated severe reduction in CO2/N2 selectivity (70%) and limited CO2
permeance (up to 16% at water vapour activity between 0.6 and 0.86), stressing the
importance of water removal pre-treatment process in membrane applications for flue gas
treatment.
In evaluation of the composite hollow fiber membranes, we observed that, similar to that of
Matrimid® based hollow fiber membranes, the presence of NO did not affect the membrane
separation performance significantly. The presence of a small amount of water at low activity
of 0.08 and 0.16, had an insignificant influence on the separation performance, while the
evaluation at higher water activity level was not conducted due to the restricted resource in
the lab environment.
With the purpose designed and constructed mobile membrane test unit, the on-site test with
the 1st generation Matrimid hollow fibre membrane was conducted at Delta Electricity at
Vales Point with untreated flue gas as the expected pre-treatment facility linked to the other
capture plant on the same site was unavailable. Seven membrane modules were prepared
with 5 modules tested on-site. A decrease in both CO2 permeance (15 GPU at the highest)
and CO2/N2 selectivity (up to 15) in comparison with the results obtained with pure gases in
the laboratory was observed. However, 2 of them (both with 4 % Silwet® additive, fabricated
with 15 cm air gap) exhibited minimal loss of separation performance after 3 days operation
with untreated real flue gas, indicating good integrity against real industrial conditions.
Despite the good chemical and mechanical stability of the 1st generation membrane,
prolonged tests with flue gas on-site was discontinued due to the interrupted supply of flue
gas caused by power plant maintenance.
When the flue gas supply was resumed, the subsequent on-site tests were conducted with
the 2nd generation composite hollow fiber membranes because much better performance had
been observed for the second generation membranes in lab tests. The on-site test of the 2nd
generation membrane composite hollow fiber membranes made with polyvinylidene fluoride
(PVDF) microporous fiber as substrate, coated with multiple (Polymer poly[1-(trimethylsilyl)-
1-propyne]) (PTMSP) as gutter layer and PEBAX as selective layer were conducted with
three membrane modules that had been evaluated in lab tests. In the first 14 days of tests,
minimal pre-treatment of the flue gas feed was facilitated through regular change of the
desiccant column and draining of the water trap bottle (used for collection of condensed
water in the piping line). Relatively stable permeance and selectivity were observed with all
three modules with CO2 permeance of 90-120 GPU and CO2/N2 selectivity of 3.5. While the

iv
CO2 permeance and the CO2/N2 selectivity was lower than what was achieved in the lab with
synthetic gas mixture, the mechanical integrity of the membrane was maintained through the
flue gas exposure, in that, when the membrane module was brought back to the UNSW and
dried followed by testing with pure gas, only 12% reduction of CO2 permeance (from 500 to
441 GPU) and 5% reduction in CO2/N2 selectivity (31.2 to 29.6) was experienced.
When the membrane was subjected to the flue gas without pre-treatment, severe loss of
permeance and selectivity of all three modules were observed, and permanent damage to
the membrane mechanical integrity was suspected as evidenced by the irreversible reduction
of membrane selectivity after drying tested in the lab. The damage to the membrane was
most likely due to flooding of the membrane module by condensed water in the feed line.
In conclusion, 2 generations of membrane were developed and tested with both lab and on-
site conditions. Improved CO2 separation performance was achieved with the first generation
membrane compared with existing membranes, while the 2nd generation composite
membrane achieved excellent separation performance with potential to make a membrane
process competitive for CO2 capture. On-site test results for both generation membranes
demonstrated that the stable membrane separation performance could be achieved but
performance was severely impacted when subjected to flue gas without pre-treatment.
Flooding of the membrane module by condensed water in the pipeline could cause
irreversible damage to the membrane fibers.
These observations suggest that pre-treatment of flue gas, particularly removal of water is
essential prior to feeding to the membrane system. Systematic evaluation of the influence of
membrane performance by water vapour should be conducted through well-controlled
experiments. In addition, the stable performance of the hollow fibre membranes in the field
indicate that further development of membranes with improved characteristics is highly likely
to lead to a membrane process with suitable separation performance for flue gas treatment.
i
Contents
Executive Summary ...................................................................................................................... i
List of Tables ............................................................................................................................... iii
List of Figures .............................................................................................................................. iv
1. Introduction ............................................................................................................................ 1
1.1. Description of the project ................................................................................................ 1
1.2. Milestones and deliverables ........................................................................................... 3
1.3. Layout of this report........................................................................................................ 4
2. Membrane Gas Separation for CO2 Capture (A state of the art review) ........................... 6
2.1. Membrane separation mechanisms ............................................................................... 8
2.2. Membrane structures ..................................................................................................... 9
2.3. Selection of membrane materials ................................................................................. 10
2.4. Membrane fabrication process ..................................................................................... 16
2.4.1. Phase-inversion ....................................................................................................... 17
2.5. Hollow fiber membrane fabrication ............................................................................... 18
2.6. Fabrication of composite membranes .......................................................................... 19
2.6.1. Fabrication of thin film composite (TFC) membrane .......................................... 19
2.7. Evaluation of membrane performance ......................................................................... 21
2.8. Constraints of large-scale implementation ................................................................... 22
2.8.1. Physical ageing ........................................................................................................ 22
2.8.2. Membrane plasticization .......................................................................................... 24
2.9. Effect of minor components .......................................................................................... 25
SOX ........................................................................................................................................ 25
NOX ........................................................................................................................................ 25
Water vapor ........................................................................................................................... 25
2.10. Economic considerations ......................................................................................... 26
2.11. Membrane process design ....................................................................................... 27
2.12. Research benchmarks ............................................................................................. 30
3. Development Hollow fiber membranes using Matrid® blended with selected additives (1st generation membrane) ......................................................................................................... 32
3.1. Hollow fiber membrane fabrication ............................................................................... 32
3.2. Gas permeation tests ................................................................................................... 35
3.2.1. Evaluation of PEG additive on gas separation performance .................................... 35
3.2.2. Evaluation of PEG-PDMS additive on gas separation performance ......................... 37
3.3. Effect of additive on membrane CO2 plasticization ...................................................... 38
4. Development of composite membrane for CO2 capture from flue gas (2nd generation membrane) .................................................................................................................................. 41

ii
4.1. Fabrication and evaluation of PEBAX dense film ......................................................... 41
4.2. The effect of blending on PEBAX dense membrane structure and separation performance ........................................................................................................................... 45
4.2.1. The effect of pressure and the performance with mixed gas .................................... 51
4.3. Development of thin-film composite (TFC) membranes ............................................... 53
4.3.1. Flat sheet TFC membrane ....................................................................................... 53
4.3.2. Composite hollow fiber membranes ......................................................................... 54
4.3.3. Screening the substrate ........................................................................................... 55
4.3.4. Stability of PTMSP gutter layer ............................................................................. 60
4.3.5. Comparison with TFC membranes in literature ........................................................ 61
5. Membrane performance in the presence of NO and water vapour .................................. 63
5.1. Matrimid blended hollow fiber membranes ................................................................... 63
5.1.1. Effect of NO in the feed mixture ............................................................................... 63
5.1.2. The effect of water vapour and temperature ............................................................ 67
5.2. Pebax composite hollow fiber membranes ................................................................... 70
6. Pilot Plant Design ................................................................................................................ 74
6.1. Feed composition property ........................................................................................... 74
6.2. Selection of equipment ................................................................................................. 75
6.3. Nomenclature ............................................................................................................... 83
7. On-site tests in Vales Point Power Plant (Milestone 4) .................................................... 84
7.1. On-site installation ........................................................................................................ 84
7.2. Floor Plan for the CO2CRC Membrane CO2 Capture Facility ...................................... 86
7.3. On-Site Test of the 1st Generation Membrane (Milestone 5) ........................................ 87
7.3.1. Raw Flue Gas Composition ...................................................................................... 87
7.3.2. On-Site Tests of blended Matrimid hollow fiber membranes .................................... 89
7.3.3. Results from On-site Test (1st generation membrane) ............................................. 90
7.3.4. Modifications on the Flue Gas Feed Inlet Connection .............................................. 93
7.4. On-Site Test of the composite hollow fiber Membranes (Milestone 6) ......................... 94
7.4.1. Modifications on the membrane unit for the 2nd generation membrane test ............. 94
7.4.2. Results from on-site test (2nd generation membrane) ............................................... 95
8. Conclusions and recommendations ................................................................................ 101
8.1. Conclusions ................................................................................................................ 101
8.2. Recommendations ..................................................................................................... 104
9. References ......................................................................................................................... 105
iii
List of Tables
Table 1. 1: Key milestones and specific tasks......................................................................................... 3 Table 2. 1: Membrane materials used in industrial-scale gas separation applications ........................... 6 Table 2. 2: CO2/N2 gas separation properties for variety of membrane materials ................................ 13 Table 2. 3: Maturity of membrane development in gas-separation applications ................................... 15 Table 2. 4: Packing density of typical membrane module configuration ............................................... 17 Table 2. 5: Summary of the polymeric membrane materials for CO2 capture from flue gas ................. 31 Table 3. 1: Gas permeation test results for Matrimid® hollow fibers with 0, 4, 8 and 12 wt% PEO-PDMS Copolymer conducted using pure gases. .............................................................................................. 37 Table 4-1: CO2 permeability and CO2/N2 selectivity of Pebax®1657 and 1074 membranes cast with different polymer concentration solutions (Gas permeation tests conducted at 200 psi and 35ºC) ..... 43 Table 4-2: CO2 permeability and CO2/N2 selectivity of Pebax®1657 and 1074 dense membranes cast with different solvent evaporation rate (200 psi and 35ºC) ................................................................... 44
Table 4-3: Thermal properties of Pebax1657 blend membranes with IM22 and Silwet. .................... 49
Table 4-4: Thermal properties of Pebax1074 blend membranes with IM22 and Silwet ...................... 50 Table 4-5: CO2 separation performance of PES-PEBAX® composite membrane ................................ 54 Table 4-6: Water flux of hollow fibre substrate (pump rate=20mL/min) ................................................ 55 Table 4-7: CO2 permeability and CO2/N2 selectivity of PES and PVDF substrates coated with gutter layers only (tested at room temperature) .............................................................................................. 56 Table 4-8: Gas permeation test results of composite hollow fibers with PES and PVDF substrates ... 57 Table 4-9: CO2 permeability and CO2/N2 selectivity of composite hollow fiber membranes using PTMSP as gutter layer. ......................................................................................................................... 60 Table 5-1: Percentage change in CO2 and CO2/N2 selectivity for humidified pure gas ........................ 69 Table 6-1. Flue gas composition at the Vales Point Power Station ...................................................... 74 Table 6-2: Specifications of the major equipment ................................................................................ 76 Table 6-3: Potential hazards, causes, consequences and controls ..................................................... 77 Table 6-4: Operating conditions of the membrane capture pilot plant ................................................. 78 Table 6-5: Process conditions and gas composition for each line ....................................................... 79 Table 7-1: Flue gas composition at Vales Point Power Station ............................................................ 88 Table 7-2: CO2/N2 separation performance of the selected membrane modules ................................. 90 Table 7-3: Composite hollow fiber membranes developed in this study. Selected modules for tests on site with flue gas were highlighted. .......................................................................................... 96 Table 7-4: Comparison of the membrane pure gas test results in lab before and after the on-site test 99

iv
List of Figures
Figure 2. 1: Mass transport mechanisms in pressure driven membrane systems. ................................. 8 Figure 2. 2: Physical structure and morphologies of common membranes .......................................... 10 Figure 2. 3: Robeson upper bound correlation for CO2/N2 [8] ............................................................... 12 Figure 2. 4: Methods of membrane fabrication process. ....................................................................... 16 Figure 2. 5: SEM image of in-house fabricated Matrimid® asymmetric hollow fibre membrane. .......... 17 Figure 2. 6: Schematic of a typical hollow fiber spinning process ......................................................... 18 Figure 2. 7: Structure of multilayer TFC membrane and scheme of dip-coating facility for hollow fibre production developed during this project. .............................................................................................. 20 Figure 2. 8: SEM image of a hollow fibre membrane with a coated dense layer (formed using a dip coating technique). ................................................................................................................................ 21 Figure 2. 9: O2 flux profile of PES hollow fibre membrane as a function of time [57] ........................... 23 Figure 2. 10: CO2 permeation isotherm as a function of feed pressure (pure CO2 feed stream) [66] .. 24 Figure 2. 11: Effect of Membrane selectivity on capture cost of CO2 [4] ............................................... 27 Figure 2. 12: Effect of CO2 permeability on the cost of CO2 capture for different vacuum membrane
systems: single stage membrane system (◇), two-stage cascade membrane system () and two-
stage cascade membrane system-RR () [86] ..................................................................................... 28 Figure 2. 13: Stage gates to large-scale implementation ...................................................................... 29
Figure 3. 1: Chemical structures of Matrimid®, Silwet L-7607 and PEG 400 ...................................... 33 Figure 3. 2: Laboratory scale hollow fibre spinning equipment located at UNSW. ............................... 34 Figure 3. 3: In-house fabricated Matrimid® hollow fibre membrane and membrane module with 4 to 5 strains of fibers potted inside the stainless steel tube. .......................................................................... 34 Figure 3. 4: Schematic representation of gas permeation test rig......................................................... 35 Figure 3. 5: Gas separation performance for Matrimid® hollow fibers with 0, 4, 8 and 12 wt% PEG. The gas permeation tests for CO2 and N2 were conducted at 6 bars at room temperature. ........................ 36 Figure 3. 6: CO2/N2 mixed-gas (22/78 vol. %) separation performance, closed symbols are pure gas results and open symbols indicate the mixed-gas results. .................................................................... 36 Figure 3. 7: CO2/N2 mixed-gas (22/78 vol. %) separation performance, closed symbols are pure gas results and open symbols indicate the mixed-gas results. .................................................................... 38 Figure 3. 8: CO2 permeance as a function of feed pressure for Matrimid® hollow fibers with different PEG contents. The arrows indicate the estimated plasticization pressure. .......................................... 39 Figure 3. 9: CO2 permeance as a function of feed pressure for Matrimid® hollow fibers with different PEO-PDMS copolymer contents, the arrows indicate the estimated plasticization pressure ............... 39 Figure 3. 10: CO2 permeance over time under a constant pressure (20 bar) for pure Matrimid®, Matrimid® with 8 wt% PEG and Matrimid® with 8 wt% PEO-PDMS copolymer membranes ................ 40 Figure 4. 1: Chemical structure of general PEBAX®, PA and PE changes with the grades of particular products. ................................................................................................................................................ 41 Figure 4. 2: Phase images of Pebax®1657(a) and 1074(b) dense membranes obtained from SPM scanning ................................................................................................................................................ 43 Figure 4. 3: CO2 and N2 permeability of Pebax® 1074 membrane in gas mixture (solid line) compared with pure gas (dash line) (■the initial value; ▲the value at 24hours). .................................................. 44 Figure 4. 4: CO2/N2 selectivity of Pebax®1657 and 1074 membrane in gas mixture (♦ Pebax®1657; ■Pebax®1074). ..................................................................................................................................... 45
Figure 4. 5: Chemical structure of PEO-PDMS additives (a) IM22 (m=n=15) (b) Silwet. ..................... 46
Figure 4. 6: Phase images of Pebax1657 blend membranes obtained from SPM. ............................ 48
Figure 4. 7: SPM phase images of Pebax1074 blend membranes ..................................................... 48

v
Figure 4. 8: CO2 permeability (a) and selectivity (b) of Pebax1657 blend membranes with 10~50 wt%
IM22 and Silwet conducted 35C and 4 bars. The dash line indicated the theoretical prediction of CO2 permeability contributed by the miscible PEO in IM22 and Silwet co-polymer. .................................... 51
Figure 4. 9: CO2 (solid line) and N2 (dash line) permeability of Pebax1074 blend membranes with
10~40wt% IM22 and Silwet (35C and 200psi). .................................................................................... 51
Figure 4. 10: CO2 permeability (a) and CO2/N2 selectivity (b) of Pebax1657 blend membranes with
20% IM22, 30% and 50% Silwet at different measurement pressure operated at 35C. ..................... 52
Figure 4. 11: CO2 permeability (a) and CO2/N2 selectivity (b) of Pebax1657 blend membranes with 20% IM22 and 30% Silwet in pure gas (dash line) and CO2/N2 mixture (solid line) as a function of pressure
tested at 35C. ....................................................................................................................................... 53 Figure 4. 12: SEM image of the PES composite membrane with PEBAX® as the coating layer. ........ 54 Figure 4. 13: Schematic representation of the dip coating facility and the sandwich-like coating layer structure of a composite membrane ...................................................................................................... 55 Figure 4. 14: Relative silicon concentration profile within 10 µm depth obtained from EDX analysis for TFC membranes coated with two gutter layers. .................................................................................... 57 Figure 4. 15: Chemical structure /formular of PTMSP ([123]). .............................................................. 58 Figure 4. 16: SEM outer cross-section images of TFC membranes with PVDF substrate. .................. 59 Figure 4. 17: SEM images of out surface of PVDF hollow fiber substrates coated with PDMS and PTMSP with 2 and 4 layers of coating. ................................................................................................. 59 Figure 4. 18: CO2 permeance and CO2/N2 permselectivity of TFC membrane measured during the extensive period (room temperature). ................................................................................................... 61 Figure 4. 19: High performance TFC membranes reported in literatures. ▲ hollow fibre [31, 52, 125, 126]; □ flat sheet [4, 34, 48-50, 108, 127]; ♦ this study (at room temperature) the grey frame indicates the target region defined by MTR for high performance TFC membrane. ............................................ 62 Figure 5. 1: Schematic representation of the membrane permeation set-up for the pure and mixed-gas as well as for water vapour tests. .......................................................................................................... 63 Figure 5. 2: Comparison of the CO2/N2 gas separation performance with/without NO from Matrimid®
hollow fibre membranes with 4 % Silwet L-7607 (The numbers show on the top of each column are the actual permeance and selectivity with/without NO): (A) CO2 permeance, and (B) CO2/N2 selectivity ............................................................................................................................................................... 65 Figure 5. 3: Simulation results of the CO2 concentration in permeate as function of CO2/N2 selectivity (CO2 permeance is assumed at 20 GPU). ............................................................................................ 67 Figure 5. 4: Schematic representation of competitive sorption caused by water vapour. ..................... 68 Figure 5. 5: The effect of temperature and water vapour activity on separation of humidified CO2 .... 69 Figure 5. 6: The effect of water vapour in the feed evaluated with gas mixture. The legends in both figures are the same. ............................................................................................................................. 70 Figure 5. 7: Comparison of the CO2/N2 gas separation performance with pure gas and mixed gas (CO2/N2 20/80 vol %) under 35 °C (dash line: pure gas, solid line: mixed gas). ................................... 71 Figure 5. 8: Comparison of the CO2/N2 gas separation performance with NO and water under 35 °C (dotted line: without NO; solid line: with NO, dashed line, with water vapour (water activity between 0.1 to 0.17). .................................................................................................................................................. 73 Figure 6. 1: Legend for the P&ID and PFD. .......................................................................................... 80 Figure 6. 2: P&ID of the membrane capture pilot plant at he Vales Point Power Station .................... 81 Figure 6. 3: PFD and stream tables for the membrane capture pilot plant at the Vales Point Power Station .................................................................................................................................................... 82 Figure 7. 1: Overall dimensions of the mobile membrane unit .............................................................. 84 Figure 7. 2: Sampling side of the mobile membrane unit ...................................................................... 85 Figure 7. 3: The system control side of the mobile membrane unit ...................................................... 85 Figure 7. 4: Floor plan for the CO2CRC mobile membrane unit at Vales Point .................................... 87

vi
Figure 7. 5: CO2 permeance profiles over 3 days on-site operation ..................................................... 91 Figure 7. 6: CO2/N2 selectivity profiles over 3 days on-site operation ................................................... 91 Figure 7. 7: Permeation flux profile of Module 2 over 3 days operation ................................................ 93 Figure 7. 8: Modification of flue gas in-let pipe connection. .................................................................. 94 Figure 7. 9: Modifications of the on-site membrane unit for the 2nd generation membrane testing (upper: gas flow rate monitor, and lower: 2 L water trap) ...................................................................... 95 Figure 7. 10: The membrane performance profiles for the composite hollow fiber (or 2nd generation) membrane over 17 days on-site operation (module 1)(upper: permeance and permeation flux, lower: CO2/N2 selectivity) ................................................................................................................................. 97 Figure 7. 11: The 2nd generation membrane performance profiles over 17 days on-site operation (module 1-3) (upper: CO2 permeance, lower: CO2/N2 selectivity) ......................................................... 98 Figure 7. 12: Corrosion of the copper membrane module fitting after membrane flooding. ............... 100

1
1. Introduction
Description of the project
This research aimed to fabricate high performance hollow fiber membranes for CO2 capture
from flue gas and to compare their laboratory performance using synthesised gas mixtures
with real flue gas streams in power plants and to demonstrate the feasibility of membrane
application for CO2 capture in black coal fired post combustion flue gas. Through this study,
issues related to translating lab performance to industrial applications such as the influence
of pre-treatment processes, the minor components in the flue, and effects of long term
exposure are highlighted. The outcomes of this project contribute to advancing technology
development for successful demonstration of low emission coal technology in Australia by
identifying and developing appropriate membrane materials and optimising future process
configurations.
The challenges for post-combustion capture include maintaining acceptable CO2/N2
separation while achieving ultra-high permeabilities for low feed pressures and relatively low
CO2 concentration in the feed. Recent research and development around the world have
reported the potential of new polymeric materials and modules in gas-separation membrane
systems to achieve significantly higher CO2 permeance by two to three orders of magnitude
compared to conventional gas-separation membranes. In conjunction with smart design of
multi-cascade systems, it is anticipated that the costs of CO2 capture from flue gas using
membranes could be significantly reduced to provide a significant cost advantage with much
fewer environmental issues compared to MEA solvent adsorption processes.
This research study utilised our capacity in fabricating polymeric hollow fibres membranes
with high selectivity and our extensive experience in evaluation and understanding the
performance of membrane systems in gas separation applications. We have also embarked
on development of new generation composite hollow fiber membranes with high permeation
rate to handle post-combustion flue gas CO2 capture in this project. Hollow fibres provide
high surface area and flexible module configurations adaptable to a number of flue gas
separation processes and rapid scale-up.
The project was defined into three phases,

2
• Phase 1: evaluation of CO2 permeation rate and CO2/N2 selectivity with CO2 and N2
mixed gas and the influence of operational conditions on the membrane
performance.
• Phase 2: evaluation of the influence of components such as water vapour and SOx
and NOx on the membrane performance in the lab environment.
• Phase 3: on site test of the membrane unit at Delta Electricity’s CSIRO managed pilot
plant site at Vales Point. Feed gas streams from the pilot plant were used as feed to
evaluate the membrane performance, tolerances to minor components, and
comparison with the lab test results.
The expected outcomes of this project were defined as:
(1) To select one or two polymers and additives (from cost effective materials such as
PPO, PES and Matrimid for base polymer, PEBAX and similar rubbery copolymers,
PEG/PPO/Siloxane additives) as materials for production of hollow fibre membranes
with potential for superior performance. These materials were selected based on the
CO2 permeability and CO2/N2 selectivity.
(2) To develop 2 hollow fibre membranes with improved CO2 permeability of at least 50%
and comparable CO2/N2 selectivity compared to benchmark hollow fibre membrane
material.
(3) To evaluate the tolerance of the hollow fibre membranes to impurities in flue gas with
the objective of achieving stabilised selectivity and permeance over one month
operation.
(4) Based on an economic assessment identify the membrane that achieves at least 20%
reduction in costs compared to benchmark membrane material on a sustained
productivity basis.

3
Milestones and deliverables
The key milestone and specific tasks specified in the project proposal are provided in Table
1.1 and the delivery of the milestones is explained in the following sections.
Table 1. 1: Key milestones and specific tasks
Key Milestones Tasks
1. Signing of Contracts
2. Human Resources Employed, preliminary material selection and SOTA report.
a. Advertisement and recruitment. b. Prepare state of art report on performance of membrane materials. c. Select benchmark commercial membrane hollow fibre material based on state of the art report for comparison with new membrane(s). d. Screen and select polymer materials for membrane development based on combination of glassy and rubbery polymers based on anticipated CO2 permeability and CO2/N2 selectivity.
3. Design of on-site test facility, phase 1 membrane screening (Stage Gate 1)
e. Agree design specifications with Delta and CSIRO for on-site membrane unit at Vales Point including final selection of location for connection to flue gas. f. Manufacture hollow fibre membranes from materials selected in (d) g. Screen membranes at laboratory scale based on CO2/N2 mixtures to achieve a similar selectivity and at least 50 % improvement in permeance over benchmark membrane. h. Report on phase 1 screening of membranes.
4. Phase 2 membrane screening, production of 1st generation membrane (Stage Gate 2)
i. Screen best membranes from (g) at laboratory scale based on CO2/N2 mixtures with SOx/NOx impurities to achieve a similar selectivity and at least 50 % improvement in permeance over benchmark membrane. j. Report on phase 2 screening of membranes. k. Select 1st generation membrane for use in on-site membrane unit. l. Finalise plan for on-site tests with Delta and CSIRO.
5. On-site Phase 3 testing, selection of 2nd generation membrane (Stage Gate 3)
m. Construct on-site membrane unit at UNSW. n. Commission on-site membrane unit at Delta. o. Collect and analyse data from on-site tests. p. Report on on-site tests for 1st generation membrane. q. Develop 2nd generation membrane to achieve improved flux and higher selectivity
6. Further on-site Phase 3 testing
r. On-site test of 2nd generation membrane to assess improved performance and assess stability.
7. Final Report s. Prepare and submit Final Report incorporating all results and analysis.
The signing of the agreement and the recruitment of the post-doctoral researchers was
completed in July 2011 in the Milestone 1.

4
For Milestone 2 of this project, a State-of-the-Art report (CO2CRC Report No: RPT11-3363
December 2011) was prepared with for selection of materials and baseline performance
criteria that took into consideration the major techno-economic issues for large-scale
deployment as well as identified benchmark hollow fibre performance based on materials
that are currently being synthesised and fabricated at scale in hollow fibre configurations.
Screening and selecting benchmark polymer materials for the Phase 1 membrane
development identified two candidate polymer materials for the laboratory and on-site tests.
The selected materials were: (1) the 1st generation membrane: Matrimid® hollow fibre with
Silwet® L-7607 additive; and (2) the 2nd generation membrane: composite hollow fibre
membrane coated with PEBAX®. Membranes of both generations were fabricated in house
with their separation performance tested with “clean” CO2 and N2 pure gases (no impurities) in
the laboratory.
In Milestone 4 of this project, the separation performance of the candidate Matrimid® hollow
fibre membrane was evaluated in the laboratory for tolerance to NO impurity (the primary
impurity present in the flue gas after pretreatment with an alkaline wash) and water by testing
with a synthesised CO2/N2/NO gas mixture.
The on-site test with the 1st generation Matrimid® hollow fibre membrane was conducted
with a purpose built mobile membrane test unit at Delta Electricity in Vales Point with
untreated flue gas. Seven membrane modules were prepared with 5 modules tested on-site.
The 2nd generation membrane tested on-site was the (composite polyvinylidene fluoride
(PVDF) hollow fibre membrane coated with PEBAX® and suitable material (Polymer poly[1-
(trimethylsilyl)-1-propyne]) (PTMSP) for gutter layer coating. Three membrane modules were
tested on-site.
Layout of this report
This report is comprised of 8 chapters; this chapter provides the description of the project,
different phases of the project and specific milestones and tasks. The layout of this report is
also provided.
Chapter 2 provides the state of art review of membrane applications for CO2 capture which
includes the fundamentals of membrane technology and membrane process in gas
separation applications. Fabrication processes of asymmetric hollow fiber membranes and

5
thin film composite membranes and the factors that affect the membrane separation
performance are also discussed. Selection criteria for membranes materials for potential
large scale application and issues related to it are also identified. Finally economic
considerations that affect material selection and the stage gates for large scale
implementation are discussed in this chapter.
Chapters 3 and 4 provide details on membrane development for flue gas CO2 capture in this
study. This includes fabrication of integral skinned hollow fiber membranes using Matrimid®
and application of a blending strategy for enhancing the membrane permeance while
maintaining the CO2/N2 selectivity (Chapter 3). The detailed study of phase structure and
related thermal properties of selected PEO containing block copolymers (different grades of
Pebax®, and their blends and their relationship with gas separation properties was
investigated with the aid of dense membranes followed by application of those materials as
selective material thin film composite membranes in both the flat sheet and hollow fiber
configuration. The protocols of composite membrane fabrication developed in this study are
also presented followed by evaluation and selection of membranes for subsequent
performance tests using pure gases and gas mixture. Membrane performance including the
effect of operating pressure, plasticization and aging are evaluated.
Chapter 5 presents the lab test results of the selected membranes in conditions relevant to
flue gas conditions, including performance with a CO2/N2 gas mixture and the gas mixture
containing minor components (NO in this study) and water vapour.
Chapter 6 presents details about the design and construction of the mobile membrane unit
for on-site tests using flue gas as feed. Details about the selection and specification of major
equipment, potential hazards, causes and controls as well operating conditions are provided.
The feed composition used for design of the membrane unit is also presented.
Chapter 7 presents the on-site tests results for two separation campaigns using integrally
skinned PEO and PEO-PDMS blended Matrimid® hollow fiber membranes and composite
hollow fiber membranes respectively. The details of the on-site test conditions and results
obtained using membranes developed in this study are presented.
Chapter 8 presents the discussion of the on-site test experiences and identifies issues that
affected the membrane performance with untreated flue gas and recommendations for future
work.

6
2. Membrane Gas Separation for CO2 Capture (A state of the art review)
Gas separation membrane technology emerged as a commercial process on the industrial
scale in the 1980s [1]. The selection of the membrane materials is a key factor that
determines the separation performance (selectivity, permeability, energy usage etc.) of this
technology [2]. During the past 30 years, more than 1000 novel polymer materials have been
synthesised with promising physio-chemical and mechanical properties. Yet, only 8 or 9 of
these materials have been used for fabricating commercial gas separation membranes [3].
This is partly due to the complexity involved in scaling-up new material manufacturing as
well as membrane fabrication and module fabrication processes. Due to their low cost and
flexibility in fabrication process, the majority of the membranes used in industrial applications
are polymeric. The areas where gas separation membranes have already been successfully
applied at the industrial-scale and the common polymer materials used are compiled in
Table 1. 1.
Table 2. 1: Membrane materials used in industrial-scale gas separation applications
Main applications Polymer materials Membrane module type
Manufacturers
Nitrogen/air separation in
large gas companies
Hydrogen separation
Polysulfone
Polyimides/
Polyamides
Polycarbonate
Hollow fibre
PRISM (Air products)
Medal (Air Liquide)
IMS (Praxair)
Generon (MG)
Mostly natural gas
separation,
Hydrogen separation
Acid gas removal
Cellulose Acetate Spiral wound
Hollow fibre
GMS (Kvaerner)
Separex (UOP)
Cynara (Natro)
Vapor /gas separation
Air dehydration
Polyphenylene oxide
Polyimide Hollow fibre
Parker
Ube
GKSS
MTR
Recovery of VOC Poly(dimethyl siloxane)
(silicone rubber)
Plate and frame
Spiral wound MTR
In terms of CO2 capture from flue gas, the main challenges are the low pressure of the flue
gas, the low CO2 concentration, and the high volumes of flue gas that need to be processed.
To be suitable for CO2 capture from flue gases, a membrane material should possess the
following properties:

7
High CO2 permeability
High CO2/N2 selectivity
Thermal and chemical stability
Plasticisation resistance
Ageing resistance
Easy and cheap to manufacture and assemble
Research and development of membranes for CO2 capture has been very active over the
last 10 years, and a number of new polymeric membrane materials have been developed
that have achieved a significantly higher CO2 permeation rate with similar or improved
selectivity [26, 30]. Other international research projects most relevant to this study on the
application of membrane technology to flue gas CO2 separation are being undertaken by
Membrane Research Technology (MTR) in the USA [4] and the European Commission
funded project NanoGLOWA [5]. Both projects have developed their own membranes and
modules and are conducting tests on the membrane performance with real flue gas in the
last couple of years. The membrane developed by MTR is a multi-layer composite flat sheet
membrane housed in spiral wound modules. The details of the membrane materials are
undisclosed. In the NanoGLOWA project, the tests with a commercial PPO membrane
module in a power plant achieved a CO2 permeance of 0.04 m3/m2h bar (14.8 GPU) and a
selectivity between 25~70 depending on the temperature. Another lead candidate, the
Diffusion Transport Membrane (DTM), which is a composite hollow fibre (most likely PES
micro-porous support with a SPEEK coating), is currently undergoing tests with artificial flue
gas before being trialled with real flue gas in a power plant. No permeation results have
been reported so far for this hollow fibre. Previous research on a SPEEK dense film reported
CO2 permeability around 20 barrer and CO2/N2 selectivity of 30 [6]. The eventual target for
the NanoGLOWA project is to achieve CO2 permeance of 1 m3/m2hbar (370 GPU) and
CO2/N2 selectivity up to 320.
Apart from these two studies, most of the current research has only focused on the
separation performance of thin, dense polymer films using mixed gases in the laboratory
rather than actual self-supported membrane modules with real flue gas. This lack of
research leads to a poor understanding of membrane performance under real industrial
conditions and certainly requires more attention prior to the large-scale implementation of
membrane technology for post-combustion capture.

8
Membrane separation mechanisms
A membrane is a thin barrier that allows selective passage of different species. Membranes
used in industrial application are normally synthetic. The major membrane separation
processes are microfiltration, ultrafiltration, nanofiltration, reverse osmosis and gas
separation.
Membrane separation mechanisms are very much dependent on membrane morphology or
microscopic structure. Membranes used in microfiltration and ultrafiltration processes are
porous whereas membranes used in reverse osmosis and gas separation are non-porous.
Porous membranes contain fixed pores, in the range of 0.1 to 10 micrometer (m) for
microfiltration and 2 to 100 nanometer (nm) for ultrafiltration.
The mechanism of gas separation by nonporous membranes is different to that of porous
membranes, in which gas molecules are separated by differences in their size and/or by
transport through membrane pores by Knudsen diffusion. In non-porous membranes, the
gas molecules dissolve into and diffuse through the dense membrane matrix (Figure 2. 1)
Figure 2. 1: Mass transport mechanisms in pressure driven membrane systems.
The gas transport through the non-porous membrane consists of three steps:
Absorption or adsorption at the upstream boundary,
Activated diffusion through the membrane,
Dissolution or evaporation from the downstream boundary.

9
The solution diffusion mechanism is driven by a difference in thermodynamic potential
existing at the upstream and downstream faces of a membrane. Membrane permeability (P)
is the combination of the diffusivity (D) of the target gas through the membrane and the
solubility (S) of target gas in the membrane material.
Membrane structures
Membrane structure can be either symmetric or asymmetric. The thickness of symmetric
membranes ranges between 10 to 200 m and the resistance to mass transfer is determined
by the total membrane thickness. A decrease in membrane thickness results in increased
permeability. However, a very thin film (0.1 to 1 m) is very difficult to fabricate and support
is required for such thin films.
Wide-spread industrial application of membranes was made possible with the development
of the phase inversion technique by Loeb and Sourirajan in 1962 [7]. This technique enables
the preparation of integrally skinned asymmetric membranes that possess high permeability
and selectivity [7]. The ultra-thin selective skin layer of these membranes maximizes the
permeability and the micro-porous sub-structure provides mechanical strength while
minimizing the resistance to the permeation. The skin and support layer of the integrally
skinned membranes are prepared at the same time with the same material.
Another breakthrough in membrane manufacture came with the development of composite
membranes that possess an asymmetric structure, where a thin dense top-layer is supported
by a porous sub-layer or substrate. In this case, the two or more layers originate from
different (polymeric) materials can be prepared via separate steps. The advantage of
composite membranes is that each layer can be optimized independently to obtain optimal
membrane performance with respect to selectivity, permeability and chemical and thermal
stability. Furthermore, the top-layer of such composite membranes can be made from a
material that is difficult to use in the phase inversion technique. Figure 2. 2 illustrates four of
the common physical and morphological structures of membranes.

10
Figure 2. 2: Physical structure and morphologies of common membranes
Selection of membrane materials
Given the dominant place of polymeric membranes in current industrial applications, their
relative cost and the large volume of flue gas to be treated, the consensus is that the
membranes for post-combustion capture of flue gas are likely to be polymeric. While other
types of membranes (such as carbon micro-sieves and ceramic membranes) may have
development potential for pre-combustion capture, this review focused mainly in the area of
polymeric materials and membranes.
A polymeric material can be classified as glassy or rubbery at room temperature. The
polymer material can change from rubbery to glassy when the temperature drops below the
glass transition temperature, the temperature at which amorphous polymers undergo a
transition from a rubbery, viscous amorphous liquid, to a brittle, glassy amorphous solid.
Above the glass transition temperature, the polymer is in a rubbery state in which the
polymer chain segments can rotate along the main chain bonds without much restriction,
and the mobility of the polymer chains is very high. Below the glassy transition temperature,
along with the decrease of the temperature, the motion of the polymer chains becomes
restricted, the segments of the polymer chain are not able to rotate freely, and the polymer is
in the glassy state. Commonly used polymer materials for membrane listed in Table 2. 2 such
as Polysulfone, Cellulose acetate, Aromatic polyimides, Aromatic polyamides, Aromatic
polycarbonates and poly(2,6-dimethyl phenylene oxide) or PPO are all rigid glassy materials,
whereas Poly(dimethyl siloxane) (PDMS) is a rubbery material.
Nonporous membrane Porous membrane
Asymmetric membrane Thin film composite
Isotropic membrane
Anisotropic membrane

11
One of the most crucial criteria for the selection of the membrane materials is the gas
separation performance. Development of membrane material for CO2 capture has been a
very active research field over the last 10 years. Those developments have focused on
aiming for better permeability and selectivity in combination in gas-separation tests.
However, almost all materials fall under an artificial “Robeson upper bound” as shown in
Figure 2. 3: Robeson upper bound correlation for CO2/N2 [8]
[8]. This plot is based on a measured or assumed dense film thickness as the majority of
laboratory synthesized materials shown in this diagram were evaluated as dense films.

12
Figure 2. 3: Robeson upper bound correlation for CO2/N2 [8]
Gas separation performances of typical membranes made from commodity polymers and for
laboratory synthesized polymers in the form of dense films or hollow fibres are given in Table
2. 2. As the information was compiled from literature data, we should note that the
permeation data compiled here were obtained under different operation conditions (e.g.
pressure, temperature, feed compositions etc.), and the membranes tested were in different
configurations (dense film or asymmetric hollow fibre membranes) so that the data are not
strictly comparable.
It should also be noted that the membrane separation properties given in Table 2. 2 were all
obtained from tests with pure gases. This is a normal research practice and commonly used
to estimate selectivity in the literature. In most cases, the estimated selectivity values will
differ from those measured in mixed gas experiments. Usually both the permeability and
selectivity obtained with mixed-gas permeation experiments will be lower than for pure
gases. With real flue gas, other issues such as water condensation, ash, and other minor
components will also influence the separation performance of the membranes.

13
Table 2. 2: CO2/N2 gas separation properties for variety of membrane materials
Materials
CO2 permeability/
Permeance CO2/N2
selectivity Material maturity Ref.
Den
se fi
lm
PI: Matrimid 6 ~ 10 Barrer 25 ~ 30 Commodity polymer [9-12]
Polycarbonates 6 ~ 7 Barrer 19 ~21 Commodity polymer [13, 14]
Polyethersulfone 3.4 Barrer 26 Commodity polymer [15]
Polysulfone 4 ~ 6 Barrer 22 ~ 25 Commodity polymer [14, 16]
Poly(ethylene oxide) 8 ~ 50 Barrer 40 ~ 140 Commodity polymer [17]
Polyarylates 5 ~ 40 barrer 18 ~ 25 Lab scale synthesis [18-22]
PIM >2000 Barrer >90 Lab scale synthesis [23]
PI: 6FDA-durene >400 Barrer 10 ~ 15 Lab scale synthesis [24, 25]
Polyactive® >100 Barrer 20 ~ 50 Commodity polymer1 [26]
Hol
low
fibr
e
Polyethersulfone 30 ~ 80 GPU 15 ~ 25 Commodity polymer [27, 28]
PI: Matrimid 10 ~ 12 GPU 6 ~ 10 Commodity polymer [29]
Poly(p-phenylene oxide) 4 GPU 20 Commodity polymer [30]
PEBAX® (composite membrane)2
17 ~ 40 GPU 17 ~ 30 Commodity polymer [31]
PI: 6FDA-durene >900 GPU 2 ~ 7 Lab scale synthesis [32]
Notes: 1 Small-scale commercial production 2 Lab-scale fabrication
The best CO2 separation performances given in Table 2. 2 were all obtained with lab scale
synthesized materials. For example, the best permeance was for 6FDA-durene hollow fibre
membranes using lab scale synthesized material [32], while the highest CO2/N2 selectivity
was achieved with PIM in the form of a dense film that to date has only been synthesized at
lab scale.
Polyimides (PI) such as Matrimid® are good candidates for large scale CO2 capture because
they exhibit good selectivity and excellent thermal and chemical resistance even though the
permeability was not as impressive as other polymer materials. However with certain
modifications (e.g. the addition of additives), the permeation behaviour can be significantly
improved, and this has already been confirmed from our own lab work.
Copolymers offer the potential to fine tune permeabilities and reduce the costs of polymer
synthesis. These polymers usually possess a “hard” block and a “soft” block. When a
polymeric membrane is formed using these copolymers, the glassy (“hard”) polymer
segments will form a structural frame and provide mechanical support. If the “hard” block

14
consists of high temperature polymers such as polyimides, it can also provide better thermal
resistance. On the other hand, the rubbery (“soft”) segments usually form continuous micro-
domains and the nature of the flexible chain structure allows easy transportation of gases;
hence providing good permeability. The right ratio of “hard” and “soft” blocks provides good
separation without loss of permeability.
Copolymers with PEO segments (e.g. PEBAX®) generally have both high selectivity and high
CO2 permeability because the PEO chain has a strong affinity towards CO2 molecules [33].
To date, PEBAX® is the most extensively investigated block copolymer for carbon capture
[34-38]. A dense film based on this material has been prepared by Kim et al., and very high
CO2 permeability (more than 100 barrer) was reported [39]. Additives with appropriate CO2–
philic blocks may also provide further opportunities to modify the base polymer performance.
One issue we realised in screening of the membrane materials found in the open literature
for CO2 separation was that the majority of the studies have focused on the separation
performance of the membrane materials without consideration of the stage of maturity of the
synthesis technique or the ability to scale-up the fabrication techniques to produce the large
membrane areas required for post-combustion capture.
In this study, we considered it important to compare the polymer materials not only based on
their performance but also their maturity and manufacturing readiness. In this report, several
membrane materials have been evaluated in terms of the performance, maturity of the
materials, potential for scale-up as well as membrane module production. The comparison
results are compiled in Table 2. 3 Apart from the polymeric materials, a few other types of
membranes have also received considerable attention for CO2 capture due to their good
separation properties. These include carbon molecular sieve membranes, ceramic
membranes, mixed-matrix membranes, and polymer inclusion membranes. The separation
performance of some of these membranes is also listed in Table 2. 3. However all of those
types of membrane currently have significant drawbacks mainly related to the high cost
and/or complexity of fabrication, which are substantial barriers to the large-scale commercial
deployment required for CO2 capture. Taking these factors in to account, such membranes
will not be considered for testing or used as benchmarks in this project.

15
Table 2. 3: Maturity of membrane development in gas-separation applications
Selectivity PermeabilitySynthesis at
Scale/Cost Fabrication at Scale
Modules at
Scale/Footprint
Tested in the
Field/Pilot
Rubbery Polymers Modest High Tons/
Low cost
Thin film composite for
flat sheet Yes, spiral wound
Yes, 1 ton/day flue
gas
Mixed Matrix (including
MOF’s)
Some
increase
Some
increase
Grams/kg/
Potentially high cost
Not very thin film. Hollow
fibre and flat sheet No No
Commercial Glassy
Polymer (i.e. Matrimid,
PPO)
Good Modest to
Good
Tons/
Medium cost
Integrally skinned hollow
fibre, mainly Yes, hollow fibre Yes
Adv. Polyimides (6FDA-
Durene, etc) High Good
Grams/
High cost Dense film, primarily No No
Ceramics/Zeolites High Very High Flat sheet, tubular/
Very high cost Inorganic supports
Tubular, Monoliths/
Very high footprint
Very small sample
Post-Combustion
PIMs, TR Membrane High High Grams/
High cost Dense film, mainly No No
Carbon Membranes Good Good Very high cost Tubular, Hollow fibre No No

16
Membrane fabrication process
Membranes can be fabricated into flat sheet or hollow fiber configuration and into different
microscopic structures using different fabrication techniques as illustrated in Figure 2. 4.
Figure 2. 4: Methods of membrane fabrication process.
Asymmetric hollow fibre modules are one of the dominant configurations in the industrial gas
separation membrane market (~ 70% membrane area) [40] due to their high membrane area
to module volume ratio (>1000m2/m3) compared to the flat sheet (for spiral wound membrane
module) and tubular configurations as shown in Table 2. 4.
Typical asymmetric hollow fibre membranes consist of a very thin (0.1~0.5 µm), non-porous
selective skin layer, combined with a much thicker micro-porous (100~200 µm) layer to
provide mechanical support for skin, with one example given in Figure 2. 5. The defect-free
skin layer ensures the efficient separation of different gas species; meanwhile its ultra-thin
skin and porous support layer guarantees that the resistance to gas transport is minimized,
thus the permeability will not be compromised.

17
Table 2. 4: Packing density of typical membrane module configuration
Module type Packing density
(Membrane surface/module volume)
Plat and frame 100-400 m2/m3
Spiral wound 300-1,000 m2/m3
Hollow fibre 1,000-30,000 m2/m3
Figure 2. 5: SEM image of in-house fabricated Matrimid® asymmetric hollow fibre membrane.
2.4.1. Phase-inversion
Asymmetric polymer membranes including hollow fibre and flat sheet (used for spiral wound
modules) are fabricated with phase inversion process, where a casting solution of a polymer
in a solvent is immersed in a non-solvent coagulation bath, where the solvent in the polymer
solution diffuses into the non-solvent bath and the non-solvent diffuses into the polymer
solution.
The structure of the membrane fabricated by phase-inversion technique is determined by the
equilibrium thermodynamic properties of the membrane system, and the kinetic properties,
including the magnitude of the overall material transfer and the rate of phase separation [41].

18
Hollow fiber membrane fabrication
Dry-jet, wet spinning is the most common technique used to prepare asymmetric hollow fibre
membranes. The fabrication process involves the co-extrusion of the dope (the membrane
forming mixture consisting of the polymer, solvent and other additives) and the bore fluid (for
the formation of the bore within the hollow fibre) from a spinneret into an air gap either under
ambient conditions or under forced convective evaporation. Once past the air gap (known as
the dry phase), the nascent fibres are immersed into a coagulation bath filled with a
coagulation (non-solvent) medium at room temperature or elevated temperature (known as
the wet phase). Following the coagulation process, the fibres are collected and may often be
subjected to post-treatment. A diagram of typical hollow fiber membrane spinning facility is
shown in Figure 2. 6.
Figure 2. 6: Schematic of a typical hollow fiber spinning process
While an integrally skinned asymmetric membrane can offer high permeability and selectivity
under short fabrication times, the fabrication conditions can be difficult to optimize for both
the skin layer and porous substrate simultaneously. The development of new membrane
materials normally encounters the Robeson’s upper bound with the trade-off between
permeability and permselectivity [42, 43]. There are also limited polymers that can be phase-
inversed to the anisotropic architecture, particularly spinning of hollow fibres require certain
mechanical strength of the nascent fiber [44].
Furthermore, gas permeance of membrane is inversely proportional to the membrane
thickness, and the thickness of the selective layer of an integrally skinned asymmetric
membrane can be difficult to control in the complex phase inversion process. The cost of the
selected material that possesses good selective properties can be high.

19
Fabrication of composite membranes
Development of composite membranes is one of the economic ways to achieve high
separation performance while reducing transport resistance as well as reducing the material
cost. A composite membrane is more flexible in material selection, in that a thin dense film is
coated on a (relatively thick) porous support, which was made in a separate step and
normally from low cost conventional glassy polymers to serve as the robust mechanical
support. The formation of a thin top layer requires a sub-micron thickness of selective
material that can use expensive materials to improve the economic viability of membrane
applications [45].
2.6.1. Fabrication of thin film composite (TFC) membrane
TFC membranes can be fabricated through dip-coating, spin-coating, laminating, interfacial
polymerization, plasma treatment, electromagnetic irradiation or chemical reaction methods
[46, 47], in which the dip-coating is the simplest and most straightforward approach that also
is suited for making TFC in a hollow fibre configuration.
TFC membrane has a multiple-layer structure in order to optimize the separation
performance, that normally includes a
o Substrate (to provide mechanical support for the selective layer with minimum
resistance to transport)
o Gutter layer (to seal substrate pores on the surface in order to avoid extrusion
of selective layer into the substrate pores).
o Selective layer (to form a thin dense selective layer on the substrate for high
selectivity and permeability).
o Protective layer (to protect the selective layer from chemical and mechanical
damage during fabrication and processing while contributing minimum
additional resistance to transport).
Properties of the substrate such as pore size and pore size distribution as well as fiber
diameter, properties of the gutter layer and selective layer coating solution such as
concentration and viscosity as well surface tension could all contribute to the property of the
selective layer (thickness, smoothness of the film and avoidance of defects).

20
Porous support
Selective layer <1µm
Protection layer ~1µm
Gutter layer 1~2µm
Stepper motor drive
Clips to hold fibres
Hollow fibre
Polymer solution
Dip coating conditions, such as the residence time of the substrate in the coating solutions,
insertion and the draw speed of the substrate to and from the coating solution also affect the
properties of the selective layer which in turn affect the separation properties of the resultant
composite membranes and need to be evaluated for optimum conditions.
The multi-layer structure (substrate/gutter/selective/protective) and the dip coating facility for
hollow fiber substrate developed at UNSW during this project is given in Figure 2. 7
The majority of the reported TFC membranes with reported outstanding performance were
fabricated on flat porous substrates (FS), for instance, PolarisTM membrane made by
Membrane and Technology Research Inc. (MTR), USA, polyactive TFC membrane on flat
PAN substrate by GKSS Research Centre Geesthacht GmbH, Germany, and interfacially
polymerized PA TFC membrane on flat PSf support [4, 48-50]. Reports of TFC membranes
using HF substrates are much fewer, and the performance was normally inferior to the FS
configuration [31, 51-53].
However, hollow fiber TFC membrane can be more desirable due to the advantages of
higher surface volume ratio of membrane modules. In addition, the self-supporting nature of
hollow fibres also minimizes the cost of fabricating devices for their containment [54]. Figure
2. 8 presents an SEM image of a cross-section of a composite hollow fiber membrane
fabricated using dip coating technique developed at UNSW.
Figure 2. 7: Structure of multilayer TFC membrane and scheme of dip-coating facility for hollowfibre production developed during this project.

21
Figure 2. 8: SEM image of a hollow fibre membrane with a coated dense layer (formed using a dip coating technique).
Evaluation of membrane performance
In the laboratory, the common approaches for characterization of asymmetric hollow fibre
membranes can be classified into two main categories: evaluation of the macroscopic and
microscopic properties (or separation performance). Scanning electron microscopy (SEM) is
often used to observe the macroscopic properties of the hollow fibres (e.g. macrovoids,
porous structure of the support layer, bore concentricity, ovality etc.). The information from
SEM images can be used to briefly evaluate the mechanical strength and indicative integrity
of separation performance. Microscopic properties (i.e. the gas separation performance in
terms of permeability and selectivity) are a direct measure of the quality of the membrane,
with pure and mixed gas permeation tests being used to determine these properties.
Gas separation performance is evaluated by the permeability of the target gas (CO2 in flue
gas and natural gas applications) and the selectivity of the target gas over other gases (such
as N2 in flue gas or CH4 in natural gas).
For symmetric membranes, the permeability is calculated by the following equation,
∙
∆ Equation (2-1)
where P is the permeability of target gas, l is the thickness of the symmetric membrane, N is
the permeate flux (permeate flow rate per unit membrane area), and P is the pressure
difference. The common units for permeability are Barrers, defined as:
1 10∙
∙

22
For asymmetric membrane, the thickness of the effective skin layer is difficult to measure,
therefore the concept of “permeance” is introduced to avoid the measurement of the skin
layer thickness and calculated based on the following equation,
∆ Equation (2-2)
The common units for permeance are GPU (gas permeation units), defined as:
10 ∙∙ ∙
The ideal selectivity of a membrane can be simply calculated by the ratio of the permeability
of gas A and B as shown in the following equation,
/ Equation (2-3)
For the mixed-gas environment, the selectivity of a membrane is the ratio of the composition
of the permeate to the feed, which is measured by gas chromatography.
Constraints of large-scale implementation
The selection of membrane materials with good separation properties does not guarantee
successful large-scale implementation in industry. For membrane technology to become
commercially viable for CO2 capture, membranes should possess sustainable performance
over long-term operation. In this regard, the stability of membrane materials should also be
considered as a benchmark for the selection of the materials. To date, most of the
investigations of long-term performance of membranes are limited to several commodity
polymers (e.g. polyimides, polyethersulfone, polysulfone, cellulose acetate). For new
polymers, research in this field remains scarce even though such information will be crucial
to determine the fate of these polymer materials for large-scale implementation.
2.8.1. Physical ageing
Since glassy polymers are not in thermodynamic equilibrium at temperatures below their
glass transition, they exhibit a slow and gradual approach towards equilibrium which is called
physical ageing [55]. Membranes fabricated from glassy polymers, therefore, will also
experience such behaviour. As a consequence, the free volume in the membrane structure
which provides the passage for gas molecules will reduce, thus significantly reducing the

23
permeability of the membrane over time. Such behaviour has been well documented by
various researchers for different types of polymer materials (e.g. polysulfone,
polyethersulfone, polyimides) [56-60]. For instance, cellulose acetate (CA) was one of the
earliest materials used to produce membranes for CO2 capture. However the CO2 flux of CA
based membranes declined substantially over time [61]. Therefore this material has no
longer been considered as a suitable material for CO2 capture from flue gas.
Figure 2. 9: O2 flux profile of PES hollow fibre membrane as a function of time [57]
As seen in Figure 2. 9, the PES hollow fibre membrane experienced significant loss in O2
permeance over the first 60 days after fabrication and then stabilized. Thus, it is necessary to
measure membrane separation properties over a sufficient period of time until the
performance stabilizes.
As most of the membrane separation performances reported in the literature were based on
the performance of the as-fabricated membranes that may not represent the long-term
performance of the membranes. In addition, the physical ageing phenomenon was observed
as thickness dependent, therefore asymmetric hollow fibres with an ultra-thin skin layer may
experience more severe ageing effect than dense films [62-64]. This could also apply to the
composite hollow fiber membrane
Since the behaviour of physical ageing is largely dependent on the polymer structure, the
selection of the polymer materials for membrane fabrication becomes crucial. Glassy
polymers, in general, exhibit strong physical ageing while rubbery polymers show much less
impact of ageing due to the flexibility of their polymer chains. The aging performance of
composite hollow fiber membranes using block co-polymers as selective layer should be
evaluated for their aging performance for industrial application.

24
2.8.2. Membrane plasticization
For membranes made from glassy polymers (Matrimid® for example), when the feed stream
contains a plasticizer, such as CO2, the membrane materials swell due to sorption of CO2 by
the polymer and interaction between the CO2 and the polymer material. As a result, the
permeation of the other gas species accelerates leading to a reduction in selectivity [65].
However membrane plasticization can only be induced when the partial pressure of CO2
reaches a certain value (known as the “plasticization pressure” as shown in Figure 2. 10 [66].
Figure 2. 10: CO2 permeation isotherm as a function of feed pressure (pure CO2 feed stream) [66]
Since the total pressure of the flue gas is usually low (just above atmospheric) and the
composition of CO2 is usually lower than 20%, the partial pressure of CO2 might not be
sufficient to cause plasticization. However, understanding of the plasticization mechanism
still remains poor and the majority of investigations have only been carried out over short
time frames [66-72]. Whether real industrial conditions will lead to plasticization at a much
lower CO2 partial pressure over long-term operation still remains unknown.
In addition, similar to physical ageing, the plasticization phenomenon is also thickness
dependent [60, 64, 71, 73, 74] with plasticization becoming more pronounced as the
thickness of the membrane decreases. Therefore asymmetric hollow fibres with a thin skin
layer may suffer more from plasticization than their dense film counterparts.
Furthermore, to date most of the plasticization investigations were only carried out with pure
gas, rather than mixed gases, which neglects the effect of competitive sorption [75-77]. The

25
effect of competitive sorption caused by gas mixtures might alter the membrane performance
and mask the plasticization effect [78].
Effect of minor components
The presence of minor components in the raw flue gas stream during the membrane gas
separation process may compete with CO2 for separation and therefore decrease
permeability, and alter separation performance. Some of these minor components could also
enhance plasticization and physical ageing of the membrane.
SOX
Combustion of sulfur containing fuels results in the production of SO2 and SO3 in trace
amounts. The permeation of SO2 in polymeric membrane is generally faster than CO2 due to
the higher critical temperature of SO2 which leads to a higher affinity. As a consequence,
most of the polymeric membranes display a SO2/CO2 selectivity in the range of 5 ~ 25 [79]. In
addition to competing with CO2 for permeation, the presence of SO2 can also lead to
plasticization. Furthermore a relatively high level of water vapor is present in an untreated
industrial flue gas stream. The mixture of SO2 and water could lead to generation of sulfuric
acid, especially within the free volume of polymeric membranes, causing damage to the
membrane structure and increasing the fractional free volume and permeability.
NOX
Nitric oxides (NOX) are also a product of the combustion process. In the presence of water,
NOX forms nitric acid that may degrade polymeric membranes. To the best of our knowledge,
there is no report on the permeation behavior of NOX against CO2 in polymeric membranes.
Water vapor
An untreated post-combustion flue gas stream is saturated with water vapor. Competitive
water sorption, as well as plasticization and ageing due to water, are known to have a much
stronger influence on membrane permeability and performance than that of the minor
components mentioned above [80]. Water-induced plasticization has been reported to
permanently alter the membrane structure, such that the initial performance cannot be

26
recovered even after drying the membrane [81]. Water permeability can also often be
substantially higher than CO2. Under these conditions, the permeate stream will have a
higher percentage of water than the feed, and, if the permeate temperature is below the dew
point, there is a possibility of condensation. The condensate will create an additional transfer
layer for the gases, thus reducing the permeability.
The minor components found in the flue gas provided by Delta Electricity are SOx, NOx,
water vapour and fly ash. While SOx and NOx alone should not have a detrimental impact
on the membrane integrity and separation performance, the presence of those components
in the feed could lead to a slightly improved difference in CO2 partial pressure across the
membrane caused by their relatively higher concentration in the permeate compared to CO2,
resulting from their higher permeability than CO2 [79]. However, when combined with water,
these compounds can form acids which could potentially degrade the polymeric membrane
and the membrane housing material.
Those issues were taken in to consideration in the planning stage of this project. To avoid
damage to the post-combustion capture (PCC) blower due to the high temperature, a heat
exchanger was planned to be installed by Delta Electricity before the blower to lower the
temperature of the gas stream. To lower the level of SOX, a flue gas pre-treatment (FPT)
column containing sodium hydroxide was also planned to be installed by Delta Electricity to
desulfurize the flue gas.
Economic considerations
There have been various suggestions about the required performance in order for membrane
gas separation to overtake other technologies for CO2 capture. For example, one study
suggested that a CO2/N2 selectivity > 70 and a minimum CO2 permeability of 100 Barrers for
a membrane thickness of 0.1 μm are required for an economic operation [82]. According to
Husain et al, in terms of energy requirements, membrane systems should match the energy
required by amine absorption (4 ~ 6 kJ/kg CO2) to be feasible [83]. The cost of the
membrane is also crucial. Merkel et al. [4] proposed that if the membrane cost can be
brought down to $5/m2 at an installation price of $50/m2, then membrane technology will
become competitive. There was also a suggestion that membranes can compete with
absorption if the flue gas contains 20 % or more CO2 [82, 84].
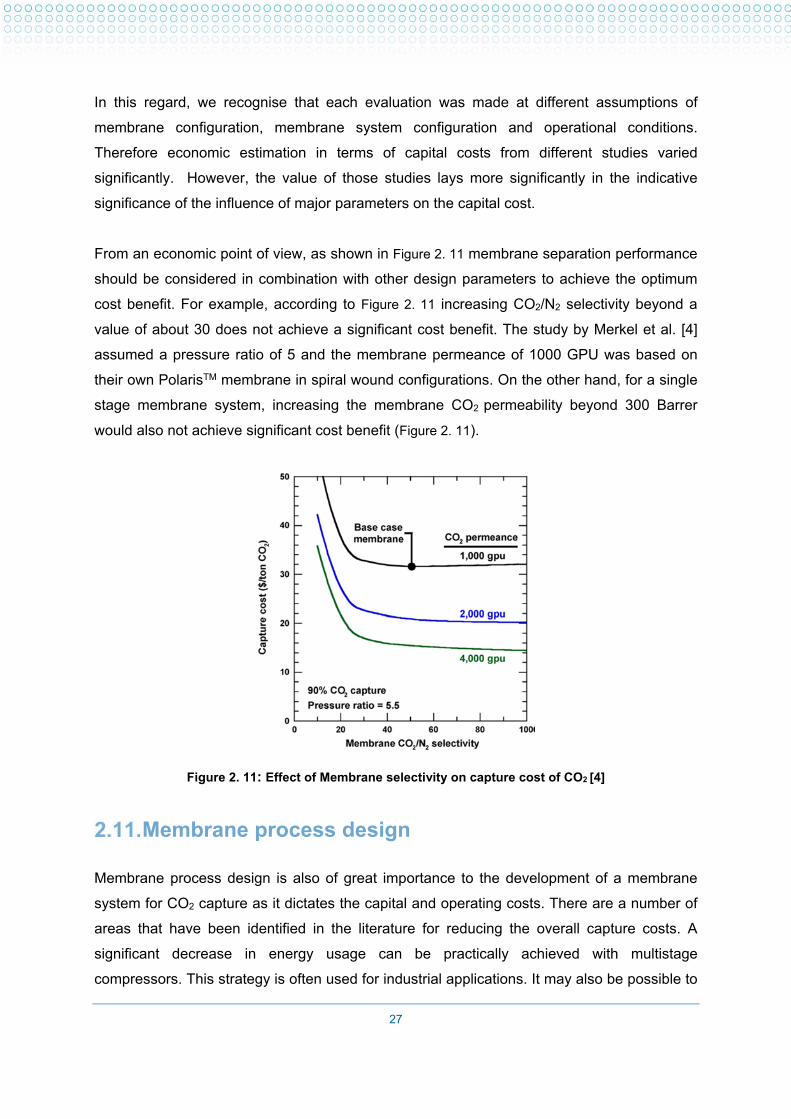
27
In this regard, we recognise that each evaluation was made at different assumptions of
membrane configuration, membrane system configuration and operational conditions.
Therefore economic estimation in terms of capital costs from different studies varied
significantly. However, the value of those studies lays more significantly in the indicative
significance of the influence of major parameters on the capital cost.
From an economic point of view, as shown in Figure 2. 11 membrane separation performance
should be considered in combination with other design parameters to achieve the optimum
cost benefit. For example, according to Figure 2. 11 increasing CO2/N2 selectivity beyond a
value of about 30 does not achieve a significant cost benefit. The study by Merkel et al. [4]
assumed a pressure ratio of 5 and the membrane permeance of 1000 GPU was based on
their own PolarisTM membrane in spiral wound configurations. On the other hand, for a single
stage membrane system, increasing the membrane CO2 permeability beyond 300 Barrer
would also not achieve significant cost benefit (Figure 2. 11).
Figure 2. 11: Effect of Membrane selectivity on capture cost of CO2 [4]
Membrane process design
Membrane process design is also of great importance to the development of a membrane
system for CO2 capture as it dictates the capital and operating costs. There are a number of
areas that have been identified in the literature for reducing the overall capture costs. A
significant decrease in energy usage can be practically achieved with multistage
compressors. This strategy is often used for industrial applications. It may also be possible to
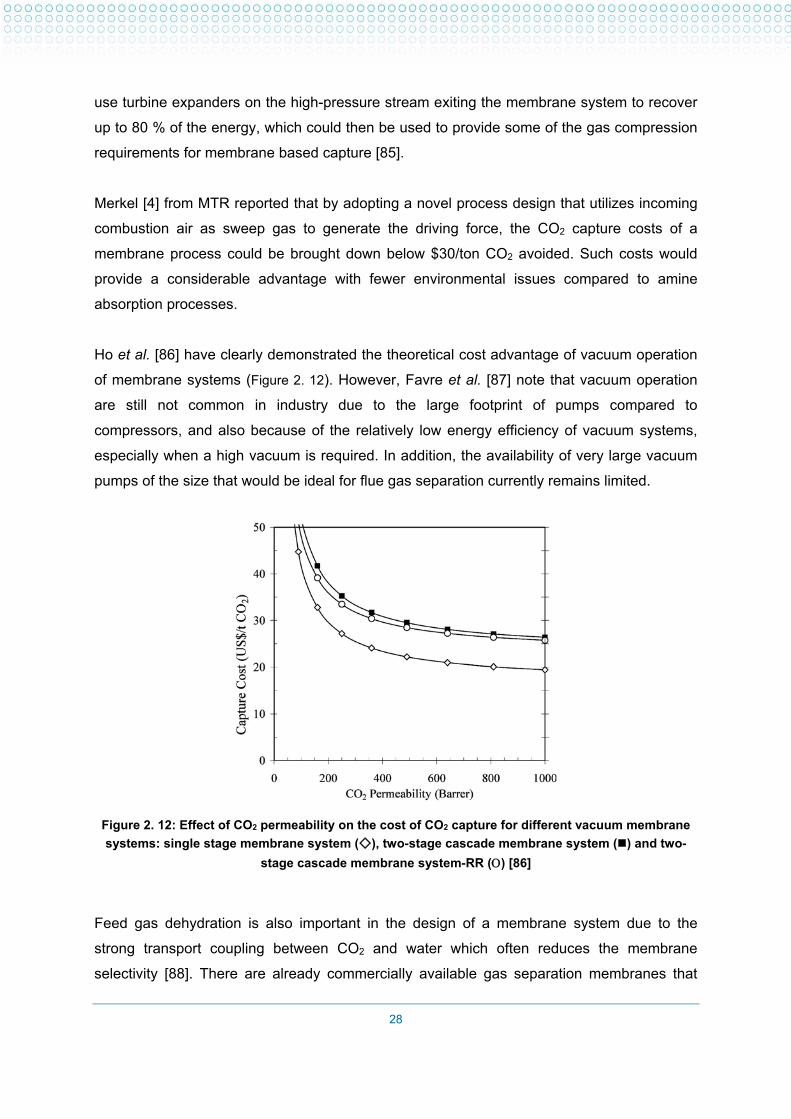
28
use turbine expanders on the high-pressure stream exiting the membrane system to recover
up to 80 % of the energy, which could then be used to provide some of the gas compression
requirements for membrane based capture [85].
Merkel [4] from MTR reported that by adopting a novel process design that utilizes incoming
combustion air as sweep gas to generate the driving force, the CO2 capture costs of a
membrane process could be brought down below $30/ton CO2 avoided. Such costs would
provide a considerable advantage with fewer environmental issues compared to amine
absorption processes.
Ho et al. [86] have clearly demonstrated the theoretical cost advantage of vacuum operation
of membrane systems (Figure 2. 12). However, Favre et al. [87] note that vacuum operation
are still not common in industry due to the large footprint of pumps compared to
compressors, and also because of the relatively low energy efficiency of vacuum systems,
especially when a high vacuum is required. In addition, the availability of very large vacuum
pumps of the size that would be ideal for flue gas separation currently remains limited.
Figure 2. 12: Effect of CO2 permeability on the cost of CO2 capture for different vacuum membrane
systems: single stage membrane system (◇), two-stage cascade membrane system () and two-
stage cascade membrane system-RR () [86]
Feed gas dehydration is also important in the design of a membrane system due to the
strong transport coupling between CO2 and water which often reduces the membrane
selectivity [88]. There are already commercially available gas separation membranes that

29
can be used for water recovery and the possibility of simultaneous removal of water and
other contaminants using gas separation membranes is attractive. Researchers in the
Netherlands have demonstrated that some block copolymer materials exhibit good
performance for flue gas dehydration [35, 89].
Hybrid processes including a membrane system have not received much attention to date for
flue gas separation. But a membrane system combined with amine absorption is used in the
natural gas industry and may also be of future relevance for post-combustion capture.
In terms of the large-scale implementation, as shown in Figure 2. 13 there are other issues that should also be taken into consideration before industrial-scale implementation including:
Minimization of the footprint through careful design of the module assembly to ensure
maximum membrane area to volume ratio,
Process integration to reduce capital and operating costs for the entire process,
Scale-up of results from the short-term lab-scale experiments to the long-term
exposure under industrial-scale conditions.
Figure 2. 13: Stage gates to large-scale implementation

30
Research benchmarks
As the ultimate objective of this study is to provide: (a) An environmentally friendly CO2
capture technology at large scale with reduced energy requirements and reduced emission
to atmosphere, and (b) Significant performance enhancement and cost reduction for the
capture technology, the criteria that have been chosen in this study for polymer material
selection are:
Polymer separation performance: Most of the polymer materials listed in Table 2. 5
exhibit modest to high separation properties, which is sufficient for CO2 capture from
flue gas. For polyethersulfone and polysulfone, the performance can be improved by
the addition of other materials.
Polymer synthesis (or availability) at scale: Some of the materials listed in Table
2. 5 can only be synthesized at the lab scale (e.g. PIM, 6FDA-durene etc.). It is
difficult to prepare membranes from these materials for medium to large-scale
implementation. Choosing commodity polymers will most likely provide a quicker
route for large-scale implementation.
Membrane and module fabrication at scale: Hollow fibre modules are favoured for
industrial scale gas separation due to the high packing density. Polymer materials
which can be used for this configuration are desirable (e.g. Matrimid, polycarbonates,
polyethersulfone, polysulfone etc.). Rubbery or block co-polymers (e.g. PEO and
PEBAX), might not be the ideal candidates for spinning hollow fibres, however, they
can be used either as additives to improve the performance of hollow fibres prepared
from commodity polymers or as the coating layer material to prepare a composite
hollow fibre membrane.
Sustainable performance in the field: To ensure large-scale implementation,
membrane materials should be able to maintain initial performance over long-term
operation under industrial conditions. To date, most of the materials listed in Table 2.
5 have not been tested in the field; therefore their long-term performance, physical
ageing and plasticization in the laboratory and in the presence of contaminants
remains largely unknown and requires thorough investigation.

31
Table 2. 5: Summary of the polymeric membrane materials for CO2 capture from flue gas
Materials CO2
permeability CO2/N2
selectivity Synthesis at scale
Fabrication
at scale
Sustainable
performance in
the field
Comments
Polyethersulfone Low High Commodity polymer Both HF & DF Yes Modest separation performance, ready for large-scale
implementation, permeability needs to be improved
Polysulfone Low High Commodity polymer Both HF & DF Yes Modest separation performance, ready for large-scale
implementation, permeability needs to be improved
PI: Matrimid Modest High Commodity polymer Both HF & DF Yes Good separation performance, ready for large-scale
implementation, permeability can be improved by modification
Polycarbonates Modest High Commodity polymer Both HF & DF Yes Good separation performance, ready for large-scale
implementation, permeability can be improved by modification
Poly(p-phenylene oxide) Modest High Commodity polymer Both HF & DF No Good separation performance, ready for large-scale
implementation, field tests required
Poly(ethylene oxide) Modest - high High Commodity polymer Rubbery,
blending No
Good separation performance, rubbery polymer, can be
blended in other polymer materials to improve their
performance
PEBAX High High Commodity polymer CM & DF No
Good separation performance, block co-polymer, can be used
to prepare composite membrane as top layer material, field
tests required
Polyarylates Modest - high High Lab scale synthesis DF No Good separation performance, lab-scale synthesis, not ready
for large-scale implementation
PI: 6FDA-durene High Modest Lab scale synthesis DF No Good separation performance, lab-scale synthesis, not ready
for large-scale implementation
PIM High High Lab scale synthesis DF No Good separation performance, lab-scale synthesis, not ready
for large-scale implementation
Notes: HF: Hollow Fibre, DF: Dense Film, CM: Composite Membrane

32
3. Development Hollow fiber membranes using Matrid® blended with selected additives (1st generation membrane)
To be economically competitive, polymeric membranes used for CO2 capture need to
possess significantly higher CO2 permeation rate and good CO2/N2 selectivity than most
commercially available gas separation membranes could offer. One of the most promising
strategies to improve membrane gas separation performance by using commercially
available material is through blending targeted additives into base polymer material in order
to utilize the beneficial properties of both components [49, 90-93].
Hollow fiber membrane fabrication
Additives such as low molecular weight poly (ethylene oxide) (PEO) or poly (ethylene glycol)
(PEG) and block copolymers containing PEO segments have shown promising effect for
improving separation performance for CO2 removal from light gases due to the strong affinity
of the ethylene oxide (EO) units in these materials to CO2 through dipole-quadrupole
interaction, making membrane more permeable to CO2 than to light gases (e.g. N2), thus
higher CO2 permeability and CO2/light gas selectivity [94]. Block copolymers containing PEO
segments such as polyethylene oxide-polydimethylsiloxane (PEO-PDMS) copolymer have
also been identified as potential materials to improve CO2 permeability through combined
high permeability of PDMS [95] with the high selectivity of PEO, as well as eliminating
crystallization of the PEO segments.
Our previous study using commercially available PEG and a linear PEO-PDMS block
copolymer as additives to poly(2,6-dimethyl-1,4-phenylene oxide) in fabricating flat sheet
membranes with phase inversion process have observed significant improvement of gas
separation and strong indication of changes of membrane structure (increase in membrane
porosity and reduced skin layer thickness) [96].
Subsequently, we demonstrated the suitability of blending a small molecular weight PEG
(400 Da) with Matrimid® solution and conducted screening of various commercially available
PEG-PDMS copolymers based on their miscibility with Matrimid® 5218 polymer solution (N-
Methyl-2-pyrrolidone, NMP as solvent). A PEO-PDMS copolymer (under the trademark of
Silwet L-7607, viscosity of 50 cSt and a molecular weight of 1000 Da, Momentive) that
consisted of 80 wt% PEO and 20 wt% PDMS were proven as suitable additives to Matrimid®
solution.
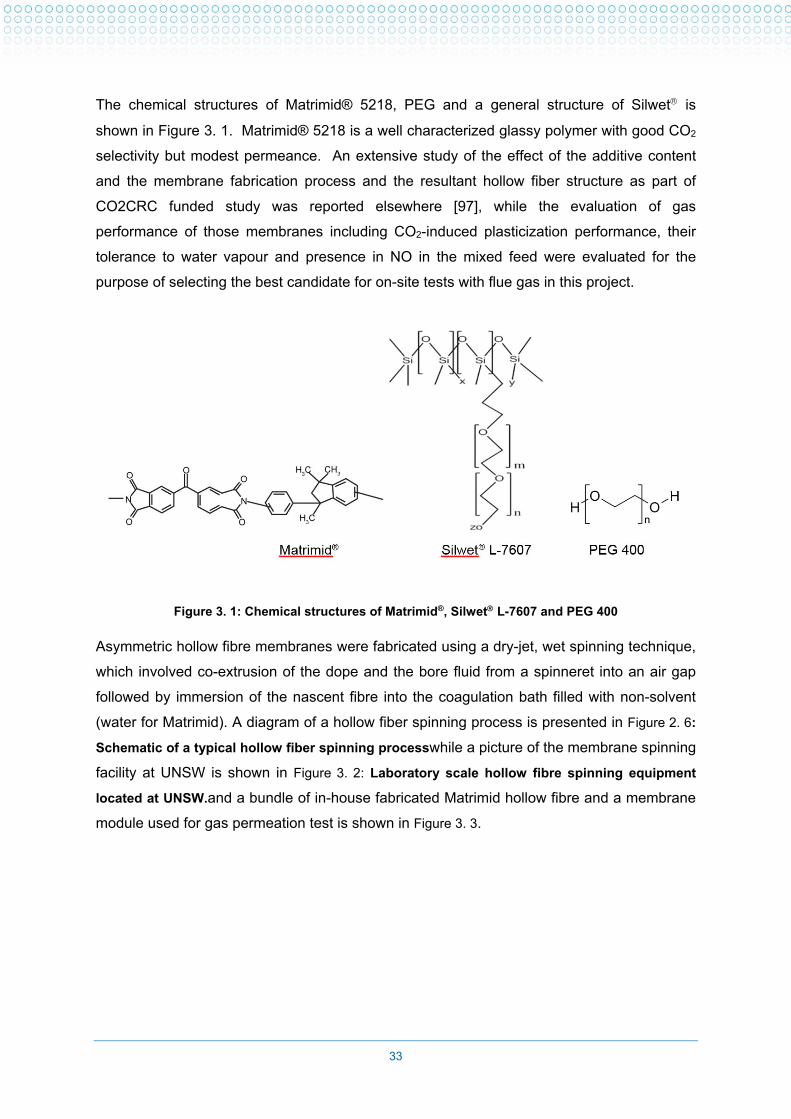
33
The chemical structures of Matrimid® 5218, PEG and a general structure of Silwet is
shown in Figure 3. 1. Matrimid® 5218 is a well characterized glassy polymer with good CO2
selectivity but modest permeance. An extensive study of the effect of the additive content
and the membrane fabrication process and the resultant hollow fiber structure as part of
CO2CRC funded study was reported elsewhere [97], while the evaluation of gas
performance of those membranes including CO2-induced plasticization performance, their
tolerance to water vapour and presence in NO in the mixed feed were evaluated for the
purpose of selecting the best candidate for on-site tests with flue gas in this project.
Figure 3. 1: Chemical structures of Matrimid®, Silwet L-7607 and PEG 400
Asymmetric hollow fibre membranes were fabricated using a dry-jet, wet spinning technique,
which involved co-extrusion of the dope and the bore fluid from a spinneret into an air gap
followed by immersion of the nascent fibre into the coagulation bath filled with non-solvent
(water for Matrimid). A diagram of a hollow fiber spinning process is presented in Figure 2. 6:
Schematic of a typical hollow fiber spinning processwhile a picture of the membrane spinning
facility at UNSW is shown in Figure 3. 2: Laboratory scale hollow fibre spinning equipment
located at UNSW.and a bundle of in-house fabricated Matrimid hollow fibre and a membrane
module used for gas permeation test is shown in Figure 3. 3.

34
Figure 3. 2: Laboratory scale hollow fibre spinning equipment located at UNSW.
(a)
(b)
Figure 3. 3: In-house fabricated Matrimid® hollow fibre membrane and membrane module with 4 to 5
strains of fibers potted inside the stainless steel tube.

35
Gas permeation tests
Pure gas permeation tests (N2, O2 and CO2) were carried out at room temperature (20 to
23°C) with the feed pressure at approximately 6 bar, while the mixed-gas permeation tests
(22/78 vol% CO2/N2) were conducted at the pressure of 9 bar, intended to keep the CO2
partial pressure closer to that of pure gas tests.
Four to five dried hollow fibers were potted in a double-ended stainless steel module and
tested in a shell-fed configuration. The volumetric flow rate of the permeate was measured
using an Agilent Technologies Optiflow 570 digital bubble flow rate meter. The hollow fiber
permeation test process is schematically represented in Figure 3. 4.
Figure 3. 4: Schematic representation of gas permeation test rig.
3.2.1. Evaluation of PEG additive on gas separation performance
The gas separation performance of Matrimid® hollow fiber membranes with different
amounts of PEG and two air gap lengths evaluated with both pure and mixed-gas
permeation tests are presented in Figure 3. 5 and Figure 3. 6 respectively. The pure gas
permeation results shown in Figure 3. 5 were obtained with at least 3 batches of membranes
fabricated under the same conditions with the average results and the standard deviations
reported.

36
Figure 3. 5: Gas separation performance for Matrimid® hollow fibers with 0, 4, 8 and 12 wt% PEG. The gas permeation tests for CO2 and N2 were conducted at 6 bars at room temperature.
Figure 3. 6: CO2/N2 mixed-gas (22/78 vol. %) separation performance, closed symbols are pure gas
results and open symbols indicate the mixed-gas results.
The addition of 4 wt% PEG resulted in a doubling CO2/N2 selectivity while the CO2
permeance was similar with that of the pure Matrimid® hollow fiber. Further increase in
PEG concentration to 8 and 12 wt% resulted in the increased CO2 permeances, while the
increase in selectivity (47% and 18% respectively) was smaller than the membranes with
4 wt% PEG (100% increase in selectivity). A longer air gap length also resulted in lower CO2
permeance and higher CO2/N2 selectivity.
0
5
10
15
20
25
30
35
40
45
0 4% 8% 12%
CO
2perm
ean
ce (GPU)
PEG content (wt/wt)
15cm air gap 30cm air gap
0
10
20
30
40
50
60
70
0 4% 8% 12%
CO
2/N
2 selectivity
PEG content (wt/wt)
15cm air gap 30cm air gap

37
The mixed-gas separation performances shown in Figure 3. 6 displayed similar trends to that
of the pure gas tests, i.e., significant improvement in the CO2/N2 selectivity in fibers with
4 wt% PEG additive, and appreciable improvement in the CO2 permeance and selectivity in
fibers with 8 wt% PEG additive. The lower gas permeances of both CO2 and N2 than pure
gas results were most likely caused by the membrane compression (mixed-gas permeation
tests conducted at higher feed pressure of 9 bar as opposed to 6 bars with pure gas, in order
to increase CO2 partial pressure) and competitive sorption between CO2 and N2. This trend
was in agreement with many previous observations in CO2 related mixed gas separation
[98].
3.2.2. Evaluation of PEG-PDMS additive on gas separation performance
The CO2/N2 pure gas permeation results from the hollow fibers with PEG-PDMS are
presented in Table 3.1. The CO2/N2 selectivity increased with the increase of additive
content, while an optimum additive concentration was observed at 4 wt%, with the highest
CO2 permeance (31.7 ± 4.3 GPU). The CO2/N2 mixed-gas (22/78 vol. %) separation
performance for Matrimid® hollow fiber with 0, 4 and 8 wt% PEG-PDMS copolymer is shown
in Figure 3. 7. The improvement of CO2/N2 selectivity with the increase in copolymer content
are also observed with the mixed-gas while the optimum CO2 permeance is observed with
the membrane made with 4 wt% copolymer. Similar to the membranes with PEG additive,
mixed-gas permeances for both CO2 and N2 are lower than that in the pure gas test, and the
selectivities in the mixed-gas test are also lower than that observed in the pure gas test.
Table 3. 1: Gas permeation test results for Matrimid® hollow fibers with 0, 4, 8 and 12 wt% PEO-PDMS Copolymer conducted using pure gases.
Hollow fibers Pure gas permeance (GPU) Selectivity
N2 CO2 CO2/N2
Pure Matrimid® 0.9±0.3 20.9±0.6 24.5±5.8
PEO-PDMS wt% of Matrimid®
4 wt% 0.9±0.4 31.7±4.3 39.0±6.1
8 wt% 0.4±0.1 22.3±2.3 52.6±5.5
12 wt% 0.3±0.1 16.1±0.3 51.4±0.3

38
Figure 3. 7: CO2/N2 mixed-gas (22/78 vol. %) separation performance, closed symbols are pure gas results and open symbols indicate the mixed-gas results.
Effect of additive on membrane CO2 plasticization
The membrane resistance to plasticization commonly evaluated with CO2 permeance of the
membrane as a function of feed pressure were evaluated for the Matrimid hollow fibers with
and without additive and shown in Figure 3. 8 and Figure 3. 9. The plasticization pressure,
the pressure beyond which the CO2 permeance begin to increase, shifted to a lower value
with increasing PEG content as shown in Figure 3. 8, indicating an onset of low plasticisation
pressure with PEG blended membranes.
On the other hand, addition of 8% and 12% PEG-PDMS copolymer caused an increase in
plasticization pressure as shown Figure 3. 9. Comparison of CO2 permeance of hollow
fibers made of pure Matrimid®, Matrimid® with 8 wt% PEG, and Matrimid® with 8 wt% PEO-
PDMS at 20 bars (above the estimated plasticization pressure) over 3 hours demonstrated
much lower degree of plasticization of the blended hollow fibres compared to the fibres
made with pure Matrimid®. The increase in the CO2 permeance of the membrane with
8 wt% PEO-PDMS copolymer was less than 5% over 3 hours (Figure 3. 10), suggesting that
addition of PEO-PDMS copolymer could suppress the CO2-induced plasticization to a large
degree.

39
Figure 3. 8: CO2 permeance as a function of feed pressure for Matrimid® hollow fibers with different PEG contents. The arrows indicate the estimated plasticization pressure.
Figure 3. 9: CO2 permeance as a function of feed pressure for Matrimid® hollow fibers with different PEO-PDMS copolymer contents, the arrows indicate the estimated plasticization pressure
0
5
10
15
20
25
30
35
40
45
50
0 2 4 6 8 10 12 14 16
CO
2 P
erm
ean
ce
Feed pressure (bar)
Pure Matrimid4 wt% PEG8 wt% PEG12 wt% PEG
0
5
10
15
20
25
30
35
40
45
50
0 2 4 6 8 10 12 14 16
CO
2 P
erm
ean
ce (
GP
U)
Feed pressure (bar)
Pure Matrimid4 wt% PEO‐PDMS8 wt% PEO‐PDMS12 wt% PEO‐PDMS

40
Figure 3. 10: CO2 permeance over time under a constant pressure (20 bar) for pure Matrimid®, Matrimid®
with 8 wt% PEG and Matrimid® with 8 wt% PEO-PDMS copolymer membranes
0.9
1
1.1
1.2
1.3
0 50 100 150 200
Pt/P0
Time/ min

41
4. Development of composite membrane for CO2 capture from flue gas (2nd generation membrane)
Apart from physical blending of PEO and PEO-containing copolymers with commercial
polymers, other approaches for introducing PEO segments into the polymer and structure of
gas separation membranes include crosslinking [33, 99-103] and synthesis of PEO-based
block copolymers such as PEO-PI (polyimide), PEO-PA (polyamide), PEO-PBT(polybutylene
terephthalate), PEO-PU(polyurethane), PEO-PUU(polyurethane urea) and PEO-PE
(polyester) [104-112]. A specific aspect of the PEO-based block copolymer is the complexity
of micro-phases that could exist in the polymeric matrix, which include two crystalline and
two amorphous phases formed by rigid (hard) and flexible (soft) segments respectively, as
well as the blended composition around the interface of both amorphous phases. The
advantages of PEO-based block copolymers include more robust mechanical strength as
well as chemical and thermal resistance attributed by the semicrystalline hard phase of the
copolymer. The suppression of PEO crystallization in the soft phase due to the presence of
alternative block structure also contributes to better separation performance.
Fabrication and evaluation of PEBAX dense film
We started the membrane development using PEO-containing block copolymer in this
project by fabrication and examination of dense film using different grades of Pebax® (the
trade name of the Atofina company for polyether (PE)-block- polyamide (PA) copolymer
(PEBA)), with chemical structure shown in Figure 4. 1 and to evaluate and understand the
influence of membrane phase structure on gas separation properties.
Figure 4. 1: Chemical structure of general PEBAX®, PA and PE changes with the grades of
particular products.
Pebax dense membranes were fabricated by using a solvent casting method with steps
involving polymer solution preparation, solution casting and solvent evaporation. Different polymer concentrations, amount of casting solution, and solvent evaporation protocols were tested in this study.

42
Pebax1657 (with PA6) solution was made by dissolving polymer pellets in the ethanol/water
mixture (weight ratio = 2:1) under heating at 65°C for 2 hours, Pebax1074 (with PA12)
solution were prepared using a protocol developed in this study which is relatively simple
and more environmentally friendly, in that the Pebax1074 pellets were dissolved in a
solvent made of 1-propanol and water mixture (weight ratio = 2:1) under heating at 90ºC for
24 hours. A mixture of 1% polymer remained in solution at room temperature without
gelation, while higher concentrations of Pebax1074 solutions could form gels at room
temperature. The presence of a micro-phase separated nanostructure in the dense
membrane was demonstrated by the phase images obtained with SPM scanning for
Pebax®1657 and 1074 membranes shown in Figure 4. 2.
The scanning probe microscope (SPM) (Bruker Dimension Icon SPM) utilises silicon nitride
probes to raster scan the free membrane surface in the PeakForce tapping mode and
ScanAsyst automatic controlling system. The phase image at 1 µm2 size was obtained at the
scan rate 0.977Hz. The surface roughness of membrane can be estimated with SPM
scanning measurements.
The fibril segments (in dark colour) corresponded to the crystalline hard domains, while the
remaining parts (in light colour) were mainly the amorphous soft phase filling between the
hard domains. The length of hard domains in the membrane of Pebax®1657 appeared
longer and the micro-structure more orderly than the membrane of Pebax®1074 possible
due to the formation of extensive crystalline domains related to the regular PA6 chains as
opposed to the smaller crystalline domains of relatively longer P12 chains.

43
(a) (b)
Figure 4. 2: Phase images of Pebax®1657(a) and 1074(b) dense membranes obtained from SPM scanning
As expected, membrane thickness (varied by changing the volume of cast solution) did not
have a significant effect on CO2 permeability and CO2/N2 selectivity (results not shown). The
membranes with irregular micro-phase separated structure were related to higher CO2
permeability. For example, Pebax® 1074 membrane with shorter crystalline domains has
higher CO2 permeability than Pebax® 1657 that contained longer hard domains. Membranes
fabricated under faster sol-to-gel transition at high polymer concentration (Table 4-1) or high
evaporation rate (at 35ºC as opposed to room temperature) (Table 4-2) all resulted in higher
CO2 permeability.
Table 4-1: CO2 permeability and CO2/N2 selectivity of Pebax®1657 and 1074 membranes cast with different polymer concentration solutions (Gas permeation tests conducted at 200 psi and 35ºC)
Membrane Polymer concentration
Permeability (Barrer) Permselectivity N2 CO2 CO2/N2
Pebax®1657 (dry at room temperature)
1% 0.60 55 92
3% 0.82 75 91
5% 1.30 118 91
6% 1.60 125 78 Pebax®1074 (dry at 35C)
1% 3.07 168 55 3% 2.76 169 61 5% 4.00 263 66
Hard domain

44
Table 4-2: CO2 permeability and CO2/N2 selectivity of Pebax®1657 and 1074 dense membranes cast with different solvent evaporation rate (200 psi and 35ºC)
Membrane Solvent evaporation
condition
Permeability (Barrer) Permselectivity
N2 CO2 CO2/N2
Pebax1657 (1%) Room temperature 0.60 55 92
35C 0.98 84 85
Pebax1657 (3%) Room temperature 0.82 75 91
35C 1.12 94 84
Pebax1657 (6%) Room temperature 1.60 125 78
35C 1.66 147 89
Pebax1074 (1%) Room temperature 2.39 128 53
35C 3.07 168 55
CO2 permeation tested with 20/80 vol% CO2/N2 gas mixture has shown that the membrane
separation performance did not differ significantly from that measured with pure gas as
shown in Figure 4. 3 and Figure 4. 4 Pebax®1657 and 1074 dense membranes fabricated in
this study maintained stable performance over 24-hour operation at a wide range of
pressures.
Figure 4. 3: CO2 and N2 permeability of Pebax® 1074 membrane in gas mixture (solid line) compared
with pure gas (dash line) (■the initial value; ▲the value at 24hours).
0 20 40 60 80 100
1
10
100
50 150 250 350 450
CO2 partial pressure (psi)
Per
mea
bili
ty (
Bar
rer)
N2 partial pressure (psi)
pure CO2
CO2 in mixed gas
N2 in mixed gaspure N2

45
Figure 4. 4: CO2/N2 selectivity of Pebax®1657 and 1074 membrane in gas mixture (♦ Pebax®1657; ■
Pebax®1074).
The effect of blending on PEBAX dense membrane structure and separation performance
Significant enhancement in CO2 permeability was recently reported in the literature for
membranes made of blended low MW PEO or PEO containing copolymers with PEO-based
block copolymers [49, 91, 113-118]. In addition to the increased PEO content, the
performance improvement was also related to the modified membrane morphology through:
(1) Low MW PEO serves as the plasticizer in the membrane matrix to increase the inter-
chain space and promote the segmental motions, with examples include PEO oligomers
blended with Pebax®1657, polyactive® and PEO-silica hybrid membrane [26, 113, 115, 117].
(2) When PEO oligomers containing non-polar end group such as PEG-DME (dimethyl
ether) and PEG-DBE (dibuthyl ether) were involved, the additive molecules acted as a
hindrance to weaken the inter-segmental interactions. For example, hydrogen bonding
between the ether/carbonyl oxygen and hydroxyl end group (existed in PEO-PA and PEO-
polyester block copolymers) was weakened by the additive domains in between the soft and
hard segments, and caused substantial reduction in chain packing and increase in chain
mobility [49, 114, 116, 119].
3) The incorporation of highly permeable PDMS segments into the membrane matrix that
would benefit gas transport [91, 118].
0
10
20
30
40
50
60
0 20 40 60 80 100
CO
2\N
2le
ctiv
ity
CO2 partial pressure (psi)
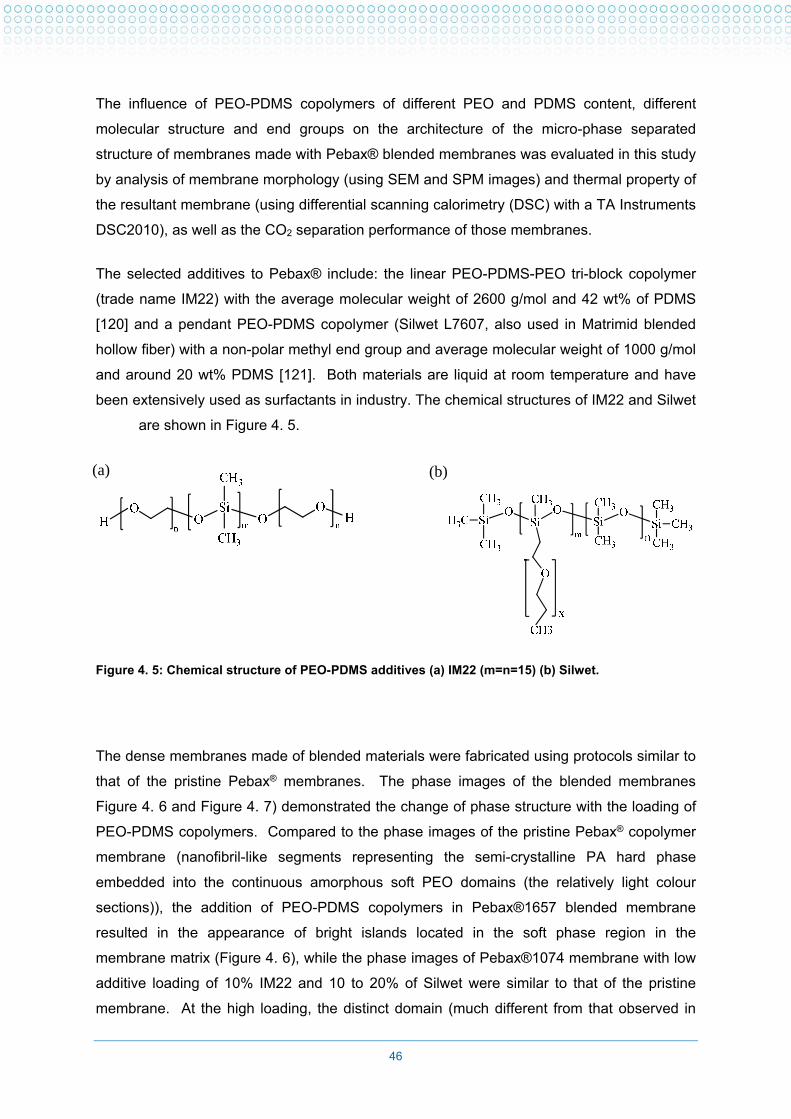
46
The influence of PEO-PDMS copolymers of different PEO and PDMS content, different
molecular structure and end groups on the architecture of the micro-phase separated
structure of membranes made with Pebax® blended membranes was evaluated in this study
by analysis of membrane morphology (using SEM and SPM images) and thermal property of
the resultant membrane (using differential scanning calorimetry (DSC) with a TA Instruments
DSC2010), as well as the CO2 separation performance of those membranes.
The selected additives to Pebax® include: the linear PEO-PDMS-PEO tri-block copolymer
(trade name IM22) with the average molecular weight of 2600 g/mol and 42 wt% of PDMS
[120] and a pendant PEO-PDMS copolymer (Silwet L7607, also used in Matrimid blended
hollow fiber) with a non-polar methyl end group and average molecular weight of 1000 g/mol
and around 20 wt% PDMS [121]. Both materials are liquid at room temperature and have
been extensively used as surfactants in industry. The chemical structures of IM22 and Silwet
are shown in Figure 4. 5.
The dense membranes made of blended materials were fabricated using protocols similar to
that of the pristine Pebax® membranes. The phase images of the blended membranes
Figure 4. 6 and Figure 4. 7) demonstrated the change of phase structure with the loading of
PEO-PDMS copolymers. Compared to the phase images of the pristine Pebax® copolymer
membrane (nanofibril-like segments representing the semi-crystalline PA hard phase
embedded into the continuous amorphous soft PEO domains (the relatively light colour
sections)), the addition of PEO-PDMS copolymers in Pebax®1657 blended membrane
resulted in the appearance of bright islands located in the soft phase region in the
membrane matrix (Figure 4. 6), while the phase images of Pebax®1074 membrane with low
additive loading of 10% IM22 and 10 to 20% of Silwet were similar to that of the pristine
membrane. At the high loading, the distinct domain (much different from that observed in
(a) (b)
Figure 4. 5: Chemical structure of PEO-PDMS additives (a) IM22 (m=n=15) (b) Silwet.

47
PEO-PA6 blended membrane) could be seen as shown in Figure 4. 7. The joint net like
pattern was possibly the manifestation of PDMS aggregates within the PEO soft phase,
resulted from extra PDMS from additive exceeding the miscibility limit in PEO.
As the dimethylsilicone chains were highly flexible and have a tendency to fold into
aggregates [120], the third phase shown in Figure 4. 6 inside the soft domain should be the
folded PDMS aggregates. The increased size of this phase was related to the increase in
the additive loading, i.e. the PDMS content. As the nanofibril hard phase appeared to be
more distinctive and clearer in the blend membranes, the presence of new domains could
improve the hard phase separation from the soft phase, as suggested in previous work in
which a PDMS soft phase was incorporated into polyether - polyurethane urea (PE-PUU)
copolymer membranes [105].
(a) Pure (b) 10% IM22
(c) 20% IM22 (d) 30% IM22
(e) 10% Silwet (f) 20% Silwet

48
Figure 4. 6: Phase images of Pebax1657 blend membranes obtained from
SPM.
Figure 4. 7: SPM phase images of Pebax1074 blend membranes
For the same weight percentage of IM22 and Silwet in Pebax blended membranes, the
smaller PDMS domain in the Silwet blended membrane was attributed to the smaller PDMS content in Silwet than in IM22 molecules. With a lower molecular weight and smaller PDMS content, Silwet had better dispersion within the soft phase than IM22.
The thermal properties of Pebax1657 and Pebax1074 blend membranes obtained from
DSC scanning (TA Instruments DSC2010) (Table 4-3 and Table 4-4), indicating the constant
hard phase PA melting temperature, and the changing thermal properties (reduced melting
temperature Tm and glass transition temperature Tg towards the values of the additive with
(g) 30% Silwet (f) 40% Silwet
(a) Pure (b) 20% Silwet
(c) 20% IM22 (d) 30% Silwet
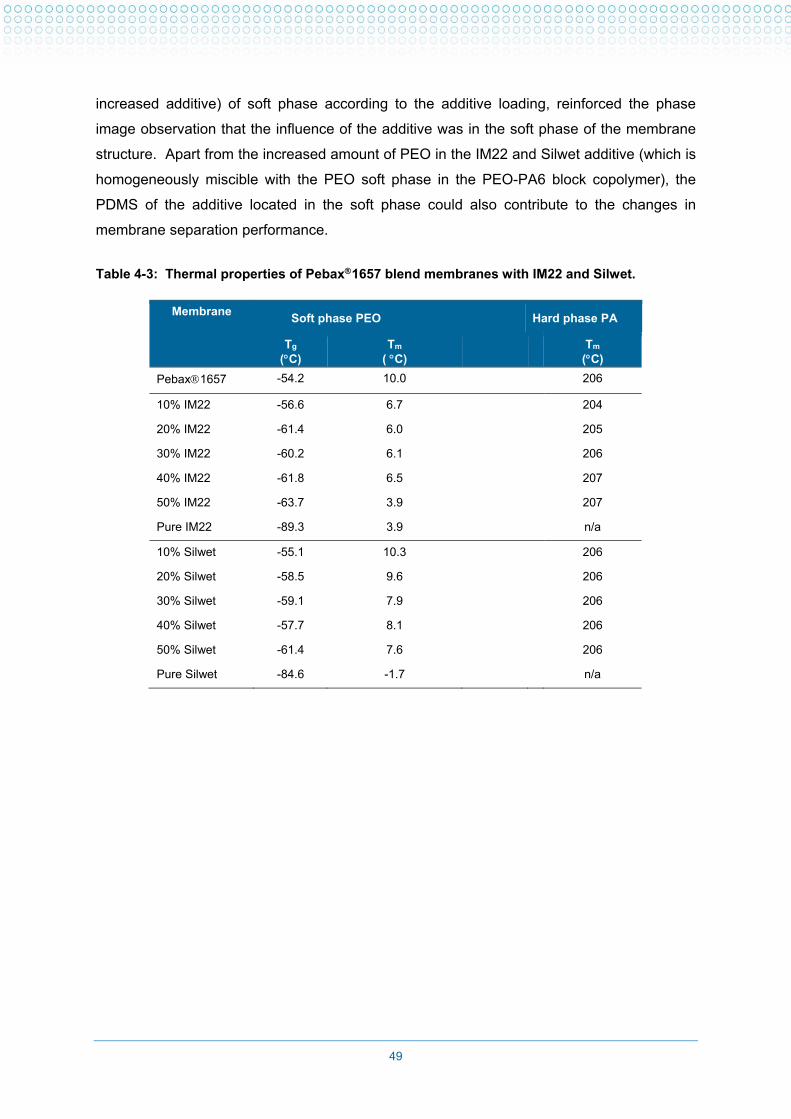
49
increased additive) of soft phase according to the additive loading, reinforced the phase
image observation that the influence of the additive was in the soft phase of the membrane
structure. Apart from the increased amount of PEO in the IM22 and Silwet additive (which is
homogeneously miscible with the PEO soft phase in the PEO-PA6 block copolymer), the
PDMS of the additive located in the soft phase could also contribute to the changes in
membrane separation performance.
Table 4-3: Thermal properties of Pebax1657 blend membranes with IM22 and Silwet.
Membrane Soft phase PEO Hard phase PA
Tg
(C) Tm
( C)
Tm (C)
Pebax1657 -54.2 10.0 206
10% IM22 -56.6 6.7 204
20% IM22 -61.4 6.0 205
30% IM22 -60.2 6.1 206
40% IM22 -61.8 6.5 207
50% IM22 -63.7 3.9 207
Pure IM22 -89.3 3.9 n/a
10% Silwet -55.1 10.3 206
20% Silwet -58.5 9.6 206
30% Silwet -59.1 7.9 206
40% Silwet -57.7 8.1 206
50% Silwet -61.4 7.6 206
Pure Silwet -84.6 -1.7 n/a

50
Table 4-4: Thermal properties of Pebax1074 blend membranes with IM22 and Silwet
Membrane
PEO Soft phase Hard phase PA
Tg
(C) Tm
( C)
Tm (C)
Pebax1074 -57.8 7.9 164
20%IM22 -59.6 7.1 164
40%IM22 -58.9 7.7 166
IM22 -89.3 3.9 n/a
20% silwet -56.8 5.6 166
40% silwet -61.9 7.0 166
Silwet -84.6 -1.7 n/a
Gas permeation tests demonstrated that CO2 permeability of Pebax1657 blended
membranes were significantly enhanced with blending of the additives while CO2/N2
selectivity was decreased slightly shown in Figure 4. 8, and the contribution of added PEO
from the additive was much smaller than the observed permeability improvements,
suggesting that PDMS content in the additive had significant contribution to CO2 transport
improvement in the blended membranes.
On the other hand, the gas permeation property of the Pebax1074 blended membrane did
not change very much from that of the pristine membrane as shown in Figure 4. 9, possibly
due to the poor miscibility between PEO and the additive within the Pebax1074 blended
membranes. Detailed discussion of the phase structure in the blended membrane will be
presented in a journal paper in preparation as part of this project.
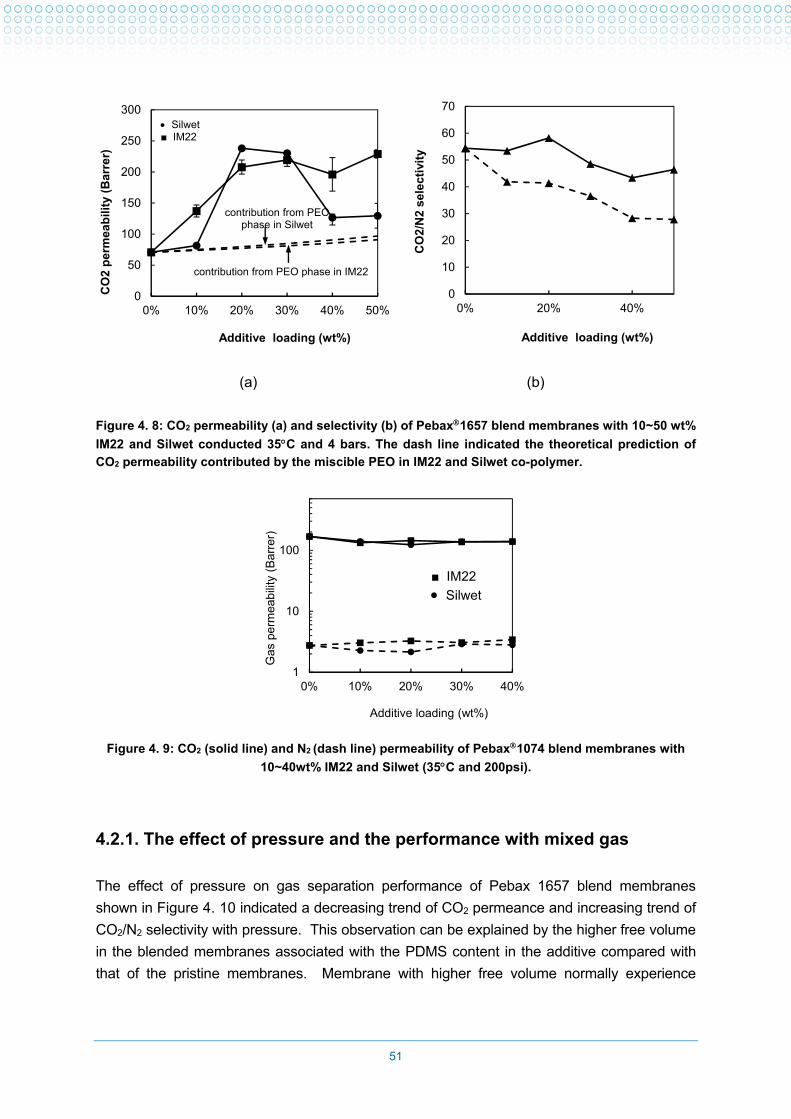
51
(a) (b)
Figure 4. 8: CO2 permeability (a) and selectivity (b) of Pebax1657 blend membranes with 10~50 wt%
IM22 and Silwet conducted 35C and 4 bars. The dash line indicated the theoretical prediction of
CO2 permeability contributed by the miscible PEO in IM22 and Silwet co-polymer.
Figure 4. 9: CO2 (solid line) and N2 (dash line) permeability of Pebax1074 blend membranes with
10~40wt% IM22 and Silwet (35C and 200psi).
4.2.1. The effect of pressure and the performance with mixed gas
The effect of pressure on gas separation performance of Pebax 1657 blend membranes
shown in Figure 4. 10 indicated a decreasing trend of CO2 permeance and increasing trend of
CO2/N2 selectivity with pressure. This observation can be explained by the higher free volume
in the blended membranes associated with the PDMS content in the additive compared with
that of the pristine membranes. Membrane with higher free volume normally experience
0
50
100
150
200
250
300
0% 10% 20% 30% 40% 50%
CO
2 p
erm
eab
ility
(B
arre
r)
Additive loading (wt%)
Silwet■ IM22
contribution from PEO phase in IM22
contribution from PEO phase in Silwet
0
10
20
30
40
50
60
70
0% 20% 40%
CO
2/N
2 se
lect
ivit
y
Additive loading (wt%)
1
10
100
0% 10% 20% 30% 40%
Gas
per
mea
bilit
y (B
arre
r)
Additive loading (wt%)
■ IM22
Silwet
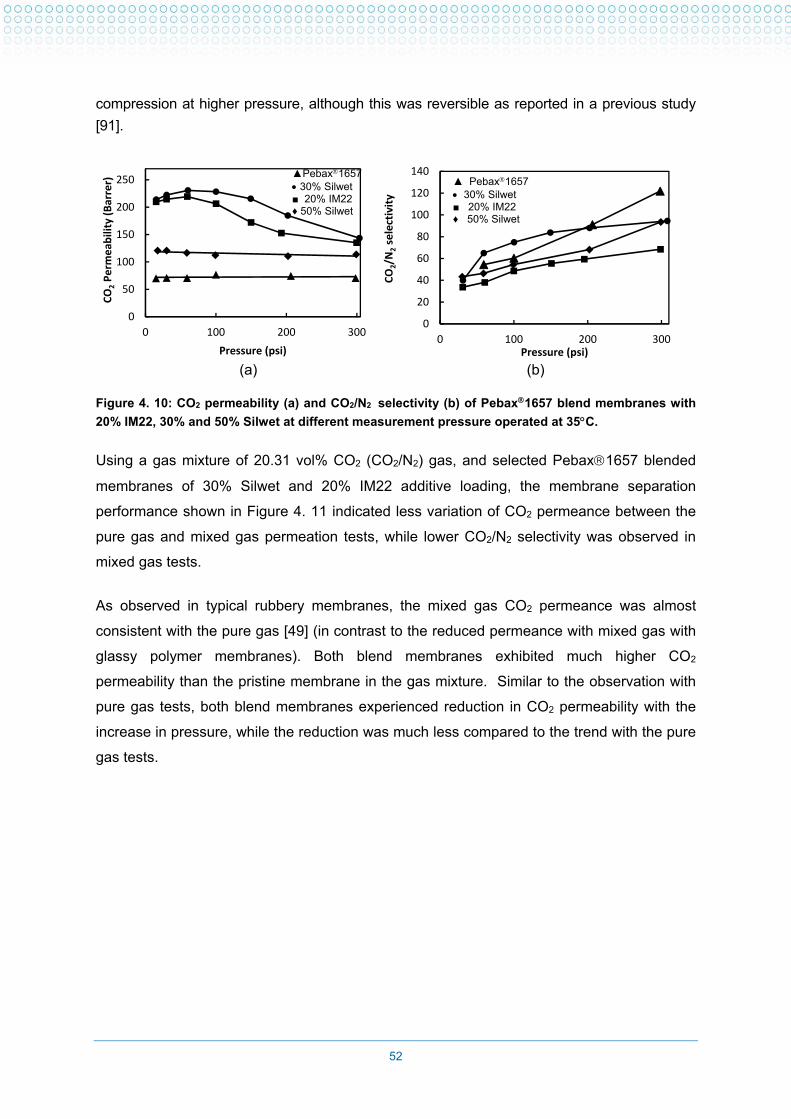
52
compression at higher pressure, although this was reversible as reported in a previous study
[91].
(a) (b)
Figure 4. 10: CO2 permeability (a) and CO2/N2 selectivity (b) of Pebax1657 blend membranes with
20% IM22, 30% and 50% Silwet at different measurement pressure operated at 35C.
Using a gas mixture of 20.31 vol% CO2 (CO2/N2) gas, and selected Pebax1657 blended
membranes of 30% Silwet and 20% IM22 additive loading, the membrane separation
performance shown in Figure 4. 11 indicated less variation of CO2 permeance between the
pure gas and mixed gas permeation tests, while lower CO2/N2 selectivity was observed in
mixed gas tests.
As observed in typical rubbery membranes, the mixed gas CO2 permeance was almost
consistent with the pure gas [49] (in contrast to the reduced permeance with mixed gas with
glassy polymer membranes). Both blend membranes exhibited much higher CO2
permeability than the pristine membrane in the gas mixture. Similar to the observation with
pure gas tests, both blend membranes experienced reduction in CO2 permeability with the
increase in pressure, while the reduction was much less compared to the trend with the pure
gas tests.
0
50
100
150
200
250
0 100 200 300
CO2Perm
eab
ility (Barrer)
Pressure (psi)
▲Pebax1657 30% Silwet■ 20% IM22 ♦ 50% Silwet
0
20
40
60
80
100
120
140
0 100 200 300
CO2/N
2selectivity
Pressure (psi)
▲ Pebax1657 30% Silwet■ 20% IM22 ♦ 50% Silwet

53
Figure 4. 11: CO2 permeability (a) and CO2/N2 selectivity (b) of Pebax1657 blend membranes with 20%
IM22 and 30% Silwet in pure gas (dash line) and CO2/N2 mixture (solid line) as a function of pressure
tested at 35C.
Development of thin-film composite (TFC) membranes
4.3.1. Flat sheet TFC membrane
While many block co-polymers have demonstrated superior CO2 permeability compared with
other commonly used polymers that has made them good candidates for preparation of
membranes for CO2 capture from flue gas, some of those materials were difficult to be made
into membrane configurations suitable for large scale application. For example, dense films
prepared from those materials normally have weak mechanical strength and need to be
supported with substrate [31].
In fabrication of composite membrane using Pebax as selective layer, flat sheet PES
microporous membrane (with a pore size of 0.45 µm) was used as substrate for dip-coating
of Pebax solution as selective layer for gas separation performance evaluation. As shown in
a SEM image of a cross-section of this TFC membrane in Figure 4. 12, a selective layer of
about 4 m was formed on top of the PES support.
0
50
100
150
200
250
0 100 200 300 400 500
CO2Perm
eab
ility (Barrer)
Total pressure (psi)
▲ Pebax1657 30% Silwet■ 20% IM22
0
20
40
60
80
100
120
140
0 100 200 300 400 500
CO2/N
2Selectivity
Total pressure (psi)
▲ Pebax1657 30% Silwet■ 20% IM22
(a) (b)

54
Figure 4. 12: SEM image of the PES composite membrane with PEBAX® as the coating layer.
The PES-PEBAX® composite membrane shows a permeability one order of magnitude
higher than all the aforementioned membranes including the PEBAX® benchmark (Table
4-5). However the CO2/N2 selectivity was much lower than the benchmark. On the other
hand, the selective layer thickness of 4 µm was still too thick.
Table 4-5: CO2 separation performance of PES-PEBAX® composite membrane
Materials CO2 Permeance CO2/N2 selectivity
Benchmark PES-PEBAX® composite membrane [31]
17 ~ 40 GPU 17 ~ 30
In-house fabricated PES-PEBAX® composite membrane
> 700 GPU ~ 5
4.3.2. Composite hollow fiber membranes
In this development, a purpose-built dip coating facility (funded by CO2CRC) suitable for
hollow fiber dip coating was designed and built at UNSW for this project. An IDEA stepper
motor (Haydon Kerk Motion Solutions Inc.) programmed and controlled by a computer was
selected for operation of the dip-coating process that included control of the membrane fiber
immersion speed, control of the resident time of fibers in the coating solution and the control
of fiber withdraw speed from the solution as illustrated in Figure 4. 13. Apart from the
previous evaluation of targeted PEO-PA block copolymer Pebax® as the selective material,
selection of substrate and consideration of gutter layer as well as application of protective
layer were all investigated in order to achieve high membrane separation performance of the
desired composite membranes.

55
Figure 4. 13: Schematic representation of the dip coating facility and the sandwich-like coating layer structure of a composite membrane
4.3.3. Screening the substrate
Three different types of polymeric microporous hollow fibres (0.02µm PES, 0.05µm PVDF
0.2µm PP membranes) were tested for their suitability as substrate.
Due to the big pore size and high porosity, the mechanical strength of microporous PP was
not strong enough to withstand the operation pressure above 1 bar. Therefore it was
excluded from further development of the composite membrane for this study. In contrast,
composite membranes made with PES and PVDF hollow fiber as substrates could withstand
pressures up to 6 bars and therefore were selected for further tests.
The water flux of the PVDF fibre with a bigger nominal pore size of 0.05 µm was 2.6 times
higher than that of the PES fibre as measured with water flux shown in Table 4-6.
Table 4-6: Water flux of hollow fibre substrate (pump rate=20mL/min)
Substrate Water flux (mL/min cm2)
HF PES 0.49
HF PVDF 1.27
PES and PVDF hollow fibers coated with multiple PDMS gutter layers exhibited the CO2/N2
selectivity close to unity, similar to the value of a PDMS dense membrane (CO2/N2 =1.1)
prepared in this study with a thickness of 100-150 µm (results not shown) made with the

56
same material. On the other hand, the permeance of PES substrate coated with PDMS was
much less than that of PVDF substrates coated with PDMS as shown in Table 4-7.
Table 4-7: CO2 permeability and CO2/N2 selectivity of PES and PVDF substrates coated with gutter layers only (tested at room temperature)
Membrane CO2 (GPU) N2 (GPU) CO2/N2
PES substrate + gutter
2 layers PDMS 965 (93) 798 (192) 1.22 (0.14) 4 layersPDMS 1102 (240) 918 (23) 1.20 (0.23) PVDF substrate+ gutter
2 layers PDMS 9910 (1662) 10712 (1734) 0.94 (0.02) 4 layers PDMS 3941(304) 4034 (266) 0.98 (0.01)
The severe penetrations of PDMS materials into the pores of the PES substrate were
evidenced by the silicon concentration at up to 4 µm depth from the outer surface of the
substrate hollow fiber as estimated with EDX analysis, whereas less than 1 µm silicon
penetration was observed in PVDF substrates as shown in Figure 4. 14. This was in good
agreement with the observed PDMS materials filling the pores at around 1-2 µm in the top
region of PVDF substrates in SEM images that will be presented in the following section.
The EDX relative silicon concentration profile was obtained by line-scanning the 10 µm depth
from the top surface for both substrates coated with 2 layers of PDMS solution (Figure 4. 14).
The silicon concentration decreased along the depth gradually, and moderate silicon
concentration was still detectable at 10 µm depth. This indicated the extent of pore penetration
of PDMS coating for both substrates. While the accuracy of EDX analysis could be affected by
the porous structure of substrate, the relative silicon concentration profiles obtained in this
study provide an indication of the relative amount of Si inside the hollow fiber pores.
Gas permeation tests results shown in Table 4-8 also suggested superior separation results
with PVDF substrates with much high CO2 permeance as well as higher CO2/N2 selectivity.

57
Figure 4. 14: Relative silicon concentration profile within 10 µm depth obtained from EDX analysis
for TFC membranes coated with two gutter layers.
Table 4-8: Gas permeation test results of composite hollow fibers with PES and PVDF substrates
Membrane CO2 (GPU) N2 (GPU) CO2/N2
HF PES substrate
2PDMS/1Pebax1657/1PDMS 5.9 (0.3) 0.95 (0.11) 6.3 (1.02)
4PDMS/1Pebax1657/1PDMS 13.4 (2.6) 4.2 (2.67) 4.6 (2.33)
HF PVDF substrate
2PDMS/1Pebax1657/1PDMS 55 (12) 1.38 (0.08) 40 (7.2)
4PDMS/1Pebax1657/1PDMS 76 (7.2) 1.22 (0.45) 66 (15.6)
4PDMS/1Pebax1074/1PDMS 174 (16.4) 3.74 (0.50) 47 (1.7)
Pebax1074 dense membrane 70Barrer 1.11Barrer 63
Pebax1657 dense membrane 49Barrer 0.60Barrer 82
Note: 3% Pebax1657 and 1% Pebax1074 solutions were used for dip-coating. The gas permeation tests were conducted at 15 psi with gutter layers only and 60 psi with selective and protective layers.
Comparison of the composite hollow fiber membranes coated with multiple gutter layers,
selective layer using PEBAX1657 and1074 followed by coating of PDMS as protective layer
indicated that the selectivity of the composite membrane with Pebax1657 selective layer on
PVDF substrates approached the intrinsic value of PEBAX dense films. Coating of 4
PDMS gutter layers resulted in much higher CO2 permeance and selectivity than that of 2
layers of coating.
0
20
40
60
80
100
120
0 1 2 3 4 5 6 7 8 9 10
Rel
ativ
e si
licon
con
cent
ratio
n (%
)
Distance from the outer surface (µm)
PES/2PDMS
PVDF/2PDMS
PVDF/2PTMSP

58
Similarly, composite hollow fiber with Pebax1074 as selective layer on top of 4 layers of
PDMS coating achieved high CO2 permeance at 174 GPU with CO2/N2 selectivity at 47 (also
close to the intrinsic value of 63).
Those results demonstrated that the hollow fibre PVDF substrate with the relatively big pores
and spongy microporous structure was best suited as the substrate for the preparation of
TFC membrane.
Screening the gutter material
In order to further improve the quality of gutter layer, a different material with reported
highest CO2 permeability namely poly((trimethylsilyl) propyne) (PTMSP), with chemical
structure shown in Figure 4. 15 and mean molecular weight at 210 kDa [122] was tested for
its suitability. The chemical structure of PTMSP is shown in Figure 4. 15.
Figure 4. 15: Chemical structure /formular of PTMSP ([123]).
SEM images of a cross-section of composite hollow fibers made at different conditions
shown in Figure 4. 16 suggested that PTMSP gutter layers were thinner than the PDMS
gutter layer, due to the smoother surface of fibers coated with different materials and
different layers of coating as shown in Figure 4. 17.
: SEM images of out surface of PVDF hollow fiber substrates coated with PDMS and
PTMSP with 2 and 4 layers of coating.
Table 4-9 suggested that coatings of 1 layer of PTMSP could have resulted in some defects
in the gutter layer with lower CO2/N2 selectivity than a dense film could achieve, while
coating of 2 and 4 layers of PTMSP resulted in a defect free coating of the PVDF substrate
with the CO2/N2 selectivity at the value of the dense membrane. For the same gutter (2 and
4 layers of PTMSP coating) and protective layer coating condition, composite hollow fibers
with 1 layer of Pebax®1074 achieved higher CO2 permeance than that of Pebax®1657,
while higher selectivity was achieved with Pebax®1657 composite fiber. The best result of

59
560 GPU was achieved with the coating of Pebax1074 selective layer on 4 PTMSP gutter
layers.
Figure 4. 16: SEM outer cross-section images of TFC membranes with PVDF substrate.
Figure 4. 17: SEM images of out surface of PVDF hollow fiber substrates coated with PDMS and
PTMSP with 2 and 4 layers of coating.
2PDMS/1Pebax1657/1PDMS
(1)+(2)+(3)
PVDF + 2 PTMSP PVDF + 4 PTMSP
PVDF + 2 PDMS PVDF + 4 PTMSP

60
Table 4-9: CO2 permeability and CO2/N2 selectivity of composite hollow fiber membranes using PTMSP as gutter layer.
Membrane CO2 (GPU) N2 (GPU) CO2/N2
1PTMSP 986 (19) 278 (21) 3.6 (0.20)
1PTMS/1Pebax1657/1PTMSP 72 (4.7) 3.83 (0.56) 19 (4.05)
1PTMS/1Pebax1074/1PTMSP 194 (7) 3.69 (0.31) 53 (2.60)
2PTMSP 4625 (84) 741 (13) 6.2 (0.00)
2PTMSP/1Pebax1657/1PTMSP 125 (5) 2.08 (0.21) 67 (2.45)
2PTMSP/1Pebax1074/1PTMSP 354 (64) 6.53 (0.30) 49 (2.63)
4PTMSP 3296(345) 598 (75) 5.5 (0.16)
4PTMSP/1Pebax1657/1PTMSP 101(6.6) 1.18 (0.07) 86 (4.33)
4PTMSP/1Pebax1074/1PTMSP 560 (17) 12.07 (0.35) 46 (1.83)
PTMSP dense membrane 56145Barrer 10122Barrer 5.6
4.3.4. Stability of PTMSP gutter layer
While superior gas separation property was achieved in composite hollow fibers using
PTMSP as gutter material, it has been reported in the literature that PTMSP polymer
membrane may be vulnerable to severe physical aging due to the loss of free volume as well
as oxidation aging due to oxygen attack of the double bonds [124]. Therefore the long-term
stability of the composite hollow fiber was evaluated in this study.
This was carried out by measuring the CO2 permeance and CO2/N2 selectivity of the
composite hollow fiber membranes with 4 PTMSP gutter layers only as well as with fibers
that were coated with Pebax selective layer and protective layer, at 5 days, 12 days and 3
month after fabrication. While the fibres coated with 4 PTMSP gutter layers only
demonstrated approximately 23% reduction in CO2 permeance and slight increase in CO2/N2
selectivity, stable separation performance of Pebax1074 coated composite hollow fiber
membrane with constant CO2 permeance and CO2/N2 selectivity over 3 months time was
observed as shown in Figure 4. 18. This consistent performance could be explained by the
controlling mechanism of the Pebax selective layer in overall gas transport through the
composite membrane, that some increase in transport resistance contributed by the PTMSP
gutter layer (much smaller compared to the selective layer) would not have affected the
overall gas transport resistance and the separation performance.

61
Figure 4. 18: CO2 permeance and CO2/N2 permselectivity of TFC membrane measured during the
extensive period (room temperature).
4.3.5. Comparison with TFC membranes in literature
The performance of the multi-layer composite hollow fiber membranes fabricated in this
study were compared with ones reported in the literature that demonstrated high CO2
permeance as well as CO2/N2 permselectivity over 30 as shown in Figure 4. 19. MTR
PolarisTM is a well-known commercial TFC membrane with high CO2 permeance achieving
1000 GPU and CO2/N2 permselectivity of 50 (at 30 C). The economic assessment
conducted by Merkel et al. concluded that with this performance, CO2 capture cost could be
reduced to around $33 with the technical targets of 90 % carbon capture at 5 bar pressure
ratio and membrane skid cost of $50, making membrane technology competitive with the
conventional amine scrubbing process at a cost of $40-$100 [4].
0
10
20
30
40
50
60
100
1000
10000
0 20 40 60 80 100 120
CO
2/N
2 p
erm
sele
ctiv
ity
CO
2pe
rmea
nce
(GP
U)
Days after fabrication
♦ 4PTMSP gutter layers ■ 4PTMSP/1Pebax1074/1PTMSP

62
Figure 4. 19: High performance TFC membranes reported in literatures. ▲ hollow fibre
[31, 52, 125, 126]; □ flat sheet [4, 34, 48-50, 108, 127]; ♦ this study (at room
temperature) the grey frame indicates the target region defined by MTR for high performance TFC membrane.
Tests of the composite hollow fiber membrane with multiple coatings of
4PTMSP/1Pebax1074/1PTMSP at a temperature of 35ºC (commonly used in the literature),
showed that the CO2 permeance reached a value of 969 GPU with CO2/N2 selectivity of 33
(35C), surpassing the highest reported performance of composite hollow fiber membranes
found in the literature. The membranes developed in this study therefore show great
potential for CO2 capture.
0
10
20
30
40
50
60
70
80
90
100
10 100 1000 10000
CO
2/N
2 p
erm
sele
ctiv
ity
CO2 permeance (GPU)
MTR PolarisTM
HF 4PTMSP/Pebax1074/1PTMSP Commercial CA

63
5. Membrane performance in the presence of NO and water vapour
Matrimid blended hollow fiber membranes
5.1.1. Effect of NO in the feed mixture
In the Phase 2 membrane screening, the CO2 capture performance of the 1st generation
membrane in the presence of NO was assessed, and compared with the permeation results
obtained from CO2/N2 gas mixture without NO impurity (12.06 % CO2 balanced with N2). The
synthetic flue gas used in this work has a composition of 12.03 % CO2, 0.0365 % NO
(0.0366 % total NOX containing 0.0001 % NO2), balanced with N2. The removal of water
(1.4 %) was considered when establishing these compositions. As for O2, it permeates
through polymeric membrane slower than CO2. Furthermore, it is normally considered as an
inert gas, meaning it has minimal impact on membrane separation performance. Therefore it
was not considered as essential to include in the laboratory tests. The purpose of the field
test was to be able to test a more extended range of impurities present.
Figure 5. 1: Schematic representation of the membrane permeation set-up for the pure and mixed-gas as well as for water vapour tests.

64
Using a mixed-gas permeation test rig shown in Figure 5. 1 the feed gas was provided from
the gas cylinder containing the mixed-gas with 12 % of CO2 balanced with N2, with/without
traces of NOX. The pressures on both feed and permeate sides were measured and
recorded, while the flow rate of the permeate and retentate were measured with digital
bubble flow meters. A needle valve was installed on the permeate line in order to maintain a
low stage cut (the ratio of the flow rate between the permeate and feed), thus limiting the
negative effect of concentration polarisation on the feed side. The mixed-gas composition on
the permeate side was measured by gas chromatography.
Based on their performance presented in the previous chapter, Matrimid® hollow fibre
membrane with 4 wt % Silwet L-7607 blending was selected as the membrane candidate in
the Phase 1 membrane screening. Four hollow fibre modules were prepared with the hollow
fibres fabricated from the same polymer solution: 26 % Matrimid®, 0.1 % Silwet L-7607 (4
% Silwet/Matrimid®), 48 % NMP, 16 % THF, and 9.75 % EtOH. The fabrication conditions
were changed slightly over these 4 membrane modules to examine the effects of the air gas
distance and take up speed on the membrane separation performance. The codes used in
Figure 5. 2 (module 1, 2, 3 and 4) indicate the batch number of the hollow fibre prepared
with different operating parameters.
Two modules were made from each batch, one for the tests with feed without NO and the
other one with feed that contained NO. The choice of such an experimental protocol was to
avoid the introduction of plasticisation history to the module which could potentially affect the
subsequent measurements. Prior to exposing both membrane modules to synthetic flue gas
with or without NO, O2/N2 pure gas permeation tests were carried out to ensure both
modules offer similar separation performance (less than 10 % difference in permeance and
selectivity). Such a variation in performance was deemed acceptable considering that the
small membrane area offered in each module usually leads to a higher performance
variation. The O2/N2 pure gas separation performance is not included in the report.

65
(A) (B)
Figure 5. 2: Comparison of the CO2/N2 gas separation performance with/without NO from Matrimid®
hollow fibre membranes with 4 % Silwet L-7607 (The numbers show on the top of each column are
the actual permeance and selectivity with/without NO): (A) CO2 permeance, and (B) CO2/N2 selectivity
As shown in Figure 5. 2, the presence of NO generally decreased the CO2 permeance by
between 10 % and 17 %. In one case (module 3), the permeance increased by 14 %. This
decrease in CO2 permeance was expected due to the competitive sorption behaviour.
Importantly, the CO2/N2 selectivity was only reduced by an average of 5 % (range 1 – 9 %).
It should be noted that module 3 exhibited much higher permeance compared with its
counterparts. Such a result was expected as a shorter air gap was applied when fabricating
this series of membrane. A shorter air gap discourages the evaporation of the solvents,
leading to a thinner selective skin layer, thus producing membranes with higher permeance
but lower selectivity.
Such a negligible impact on membrane separation performance from NO can be rationalised
by the low concentration and the physical and chemical properties of NO. A consensus has
been established in the literature that the gas transport behaviour through polymeric
membrane is controlled by both solubility and diffusivity [128]. Due to the much lower critical
temperature of NO (-93°C) compared to 31°C for CO2, much less sorption should be
expected for NO in comparison with CO2. In terms of the diffusion, the kinetic diameter for
NO is around 3.17 Å compared to 3.3 Å for CO2, so NO should diffuse faster than CO2. In
this regard, whether the sorption or diffusion will dominate the overall gas transport is
dictated by the nature of the polymeric membrane. The Matrimid® hollow fibre membrane

66
fabricated in this work is considered to be a solubility-selective membrane, as the addition of
Silwet L-7607 significantly enhances the CO2 solubility because this additive is CO2-philic.
With this in mind, CO2 permeation will dominate the gas transport behaviour through such
membranes, and the presence of NO should not greatly affect the membrane separation
performance as confirmed in this study.
The decrease in selectivity when introducing NO into gas mixture was within the
experimental error. Therefore it was not conclusive that the small decrease in selectivity was
caused by the small concentration of NO. Theoretically, increasing the NO content should
result in a decrease in permeance as a result of competitive sorption. However the focus of
this testing was to test the membrane at a concentration of NO similar to that anticipated in
the field. Testing at other concentrations therefore was not investigated.
To our knowledge, no work has been carried out to examine how the concentration of minor
gas components affects the degree of competitive sorption. However, it is speculated that
this effect will be negligible as the increase in NO concentration will have little impact on the
decrease in the concentration of the major components such as CO2 and N2.
Such a minor decrease in performance as a result of the introduction of minor component
will not significantly increase the clean-up requirement. We have carried out a simulation to
assess the effect of the CO2/N2 selectivity on the CO2 purity in the permeate as shown in
Figure 5. 3. Based on this simulation, a marginal change in selectivity will not greatly
change the CO2 content in the permeate, thus will not significantly increase the product
clean-up requirement.

67
Figure 5. 3: Simulation results of the CO2 concentration in permeate as function of CO2/N2 selectivity (CO2 permeance is assumed at 20 GPU).
5.1.2. The effect of water vapour and temperature
The presence of water vapor in the gas feed can cause competitive sorption (Figure 5. 4)
and induce plasticization in membrane separation processes. In the solution diffusion gas
transport in membrane gas separation, with a high critical temperature, water molecules
compete very strongly with other penetrants (including CO2) for adsorption sites which lead
to reduced solubility of other penetrants, and consequently depress the permeabilities of
other penetrants [129]. Koros et al. [130] at a very low partial pressure of water vapor in the
feed stream.
On the other hand, the sorbed water molecules in the membrane have a tendency to cluster
which could then cause pore filling of the membrane micro-voids with increased resistance
to gas diffusion [131] coupled with swelling of polymeric membrane matrix caused by the
H2O-induced plasticization, thus increasing the diffusivity of all gas species (N2 and CO2 in
this study) through the membrane and reduction in selectivity.
Water activity (partial pressure of water vapour in the gas mixture) and its influence on
membrane separation performance can be affected by temperature. The temperature of
untreated raw flue gas are in the range of 50 – 70oC, however, most studies on the effect of
water on membrane separation performance in the literature were conducted at 35oC or
lower.
0
0.2
0.4
0.6
0.8
1
10 100 1000CO
2concentration in
perm
eate
CO2/N2 selectivity

68
Figure 5. 4: Schematic representation of competitive sorption caused by water vapour.
This study examined the effect of water on membrane separation performance using
humidified pure gases and gas mixture 22.03 % CO2 and 77.97 % N2. As shown in Figure 5.
5, the CO2 permeance was significantly affected by the presence of water vapour in the feed,
while the selectivity was also severely reduced. The percentage of reduction is given in
Table 5-1.
.
14
16
18
20
22
24
26
28
30 40 50 60 70 80
CO2 Perm
ean
ce (GPU)
Temperature(oC)
Pure Dry Gas
Pure Wet Gas α = 0.61
Pure Wet Gas α = 0.86

69
Figure 5. 5: The effect of temperature and water vapour activity on separation of humidified CO2
Table 5-1: Percentage change in CO2 and CO2/N2 selectivity for humidified pure gas
Vapour activity Temperature (o
C)
Percentage change(%)
CO2 permeance CO
2/N
2 selectivity
0.61
35 -9.2 -26.4
55 -11.4 -28.1
75 -11.7 0.05
0.86
35 -10.1 -55.4
55 -15.9 -38.2
75 -12.7 -18.5
The temperature also affected the separation performance using dry and wet gas mixture as
shown in Figure 5. 6 in terms of CO2 permeance and the selectivity. Similar to the
observation with pure gas tests, the CO2 permeance increased with the increase of
temperature tested with the mixed dry gas, the CO2 permeance was more or less stable with
the increase in temperature with the wet mixed gases. The increased performance of the
membrane at higher temperature is due to the Arrhenius temperature dependence in the
permeability P = P0 exp (–EP/RT), where EP is the activation energy for permeation (the
0
5
10
15
20
25
30 40 50 60 70 80
CO
2/N
2 S
elec
tivi
ty
Temperature (oC)
Pure Dry GasPure Wet Gas α = 0.61Pure Wet Gas α = 0.86

70
minimum energy required to initiate the permeation reaction). For the CO2/N2 selectivity with
the mixed dry gas, the trend of temperature influence differed from that of the dry pure gas,
while the increasing trend was maintained with the wet mixed gas. Note that CO2 permance
of the dry mixed gas shown in Figure 5.6 was higher than that of the dry pure gas shown in
Figure 5.5, which is different from normal expectation. The possible reason is that the
membrane module used for the tests with mixed gas have been exposed in previous tests
involving CO2 at relatively high pressure, due to the plasticization effect and hysteresis
effect, the CO2 permeance was much higher in Figure 5.6 than in Figure 5.5.
Figure 5. 6: The effect of water vapour in the feed evaluated with gas mixture. The legends in both
figures are the same.
Pebax composite hollow fiber membranes
Three different membrane modules were tested to evaluate their separation performance
with the mixed gas feed and with gas mixture doped with minor components, in this case,
NO and water vapour. The tested membrane modules were
PVDF/4PDMS/Pebax1657/1PDMS,
PVDF/4 PDMS/Pebax1074/1PDMS
PVDF/4PTMSP/Pebax1074/1PTMSP (green, circular).
The comparison of the separation performance tested with pure gases and CO2/N2 gas
mixture are shown in Figure 5. 7, only marginal loss of CO2 permeance and CO2/N2
selectivity were observed with mixed gas (CO2/N2 20/80 vol %) when compared with pure
feed gas.
0
10
20
30
40
50
60
70
30 50 70 90
CO
2Perm
ean
ce (GPU)
Temperature (oC)
0
5
10
15
20
25
30
35
30 50 70 90
CO
2/N
2Selectivity
Temperature (oC)
Mixed Wet Gas α = 0.86
Mixed Wet Gas α = 0.61
Mixed Dry Gas

71
Figure 5. 7: Comparison of the CO2/N2 gas separation performance with pure gas and mixed gas (CO2/N2 20/80 vol %) under 35 °C (dashed line: pure gas, solid line: mixed gas).
PVDF/4PDMS/Pebax1657/1PDMS (red, diamond),
PVDF/4 PDMS/Pebax1074/1PDMS (blue, square) and
PVDF/4PTMSP/Pebax1074/1PTMSP (green, circular).
The comparison of the membrane separation performance with and without NO was
conducted with tests using 12.03% CO2 and 87.97% N2 (without NO) and 0.035% NO, 12.03%
CO2, balanced with N2 (with NO) and the results are presented in Figure 5. 8 (the dashed
lines representing mixed gas results without NO, and the solid lines representing mixed gas
with NO). The small variations between the mixes gas with and without the presence of NO,
suggested that the presence of NO has not significantly affected the membrane separation
performance in those tests. With an added small amount of water vapour (at low activity
level between 0.08 to 0.16, restricted by the test facility) in the mixed gas with NO, the gas
separation performance was also similar to that of the dry mixed gases (with and without NO)
as show with the dashed lines in Figure 5. 8.
Water vapour has higher permeability than most gas species in the polymer membrane due
to its smaller kinetic diameter (2.65Ǻ) and higher condensability (the critical temperature
647K) [130]. Very high water vapour permeability has been reported for Pebax®

72
membranes (e.g. water permeability of 5,000-20,000 Barrer with water/N2 permselectivity of
20,000-35,000 (30ºC) [128, 132] in a Pebax®1074 dense film, water vapour permeance of a
flat Pebax®1657 composite membrane with a 2 µm selective layer was about 1800 GPU
with water/N2 selectivity at 1800 (0.32 water activity) [133]).
Moreover, the water vapour permeation through PEO-based block copolymers was found to
be independent of the water activity in the water/N2 mixture when the water activity was
maintained below 0.6, whereas a significant increase in permeation occurred at water
activity above 0.8 [35, 128, 132, 134]. Therefore, at low water activity level (without water
condensation and cluster formation), the composite hollow fiber membrane fabricated in this
study could tolerate the presence of water vapour. A gas mixture with high water activity
level was not tested in the current study due to restrictions in the lab test facility capacity.
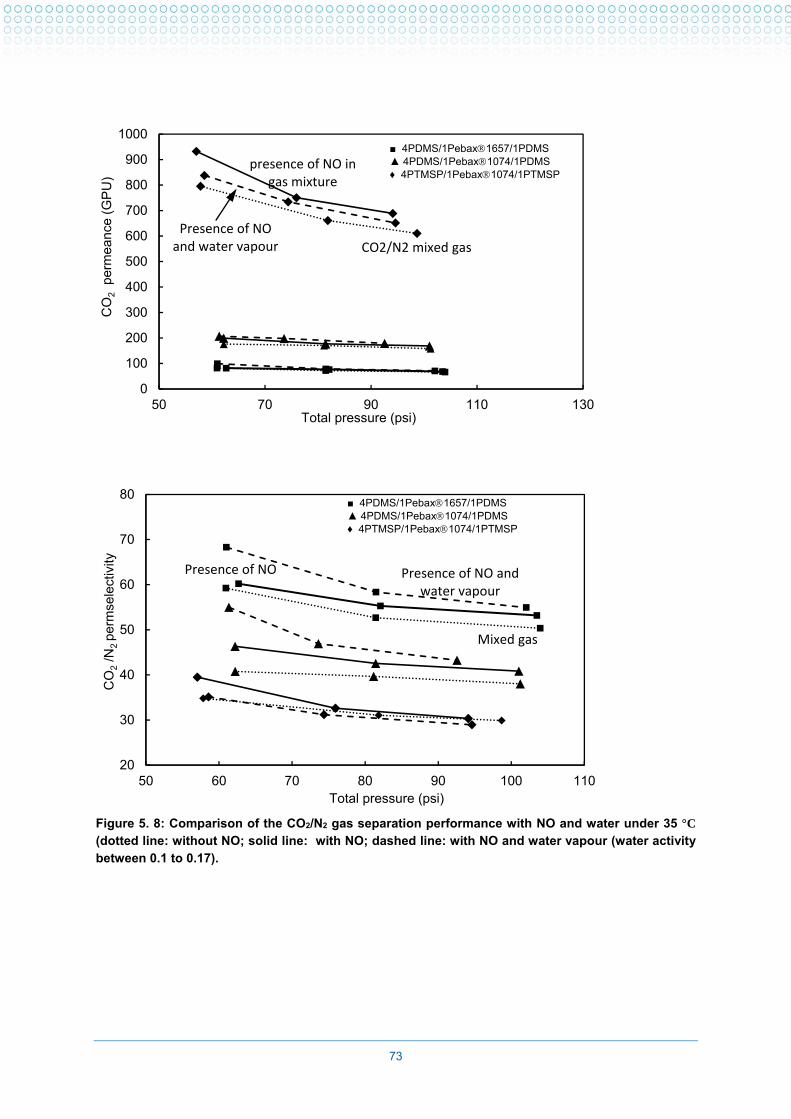
73
Figure 5. 8: Comparison of the CO2/N2 gas separation performance with NO and water under 35 °C (dotted line: without NO; solid line: with NO; dashed line: with NO and water vapour (water activity between 0.1 to 0.17).
0
100
200
300
400
500
600
700
800
900
1000
50 70 90 110 130
CO
2pe
rmea
nce
(GP
U)
Total pressure (psi)
■ 4PDMS/1Pebax1657/1PDMS▲ 4PDMS/1Pebax1074/1PDMS♦ 4PTMSP/1Pebax1074/1PTMSP
CO2/N2 mixed gas
presence of NO in gas mixture
Presence of NO and water vapour
20
30
40
50
60
70
80
50 60 70 80 90 100 110
CO
2/N
2 p
erm
sele
ctiv
ity
Total pressure (psi)
■ 4PDMS/1Pebax1657/1PDMS▲ 4PDMS/1Pebax1074/1PDMS♦ 4PTMSP/1Pebax1074/1PTMSP
Mixed gas
Presence of NO Presence of NO and water vapour

74
6. Pilot Plant Design
To assess the performance of in-house fabricated membranes under a real flue gas
environment, a purpose designed mobile membrane test unit was constructed at UNSW and
installed at the Vales Point Power Station.
Feed composition property
The flue gas compositions used for the design of the membrane unit for on-site tests in the
power station were provided by the Delta Electricity (Table 6-1). The membrane unit was
expected to take the flue gas feed after FPT column with the specifications highlighted. In
this feed stream, the water content was much less (1.4%) than that of the raw flue gas (6%).
Table 6-1. Flue gas composition at the Vales Point Power Station
Components Raw flue gas
Existing raw flue gas treatment at the Vales Point Power Station
After PCC blower After FPT column
Temperature (°C) 120 35-40 15-20
H2O (%, wet) 6.0 3.6 1.4
CO2 (%, wet) 11.9 11.9 11.9
O2 (%, wet) 6.7 6.7 6.7
NOX (ppm, wet) 380 380 380
SOX (ppm, wet) 280 280 10
N2 (balanced) 75.0 77.8 79.9
Ash (mg/m3, dry) < 10
As seen in Table 6-1, the raw flue gas has high temperature and high level of SOX and NOX
content. To avoid damage to the post-combustion capture (PCC) blower due to the high
temperature, a heat exchanger was expected to be installed by Delta Electricity before the
blower to lower the temperature of the gas stream. To lower the level of SOX, a flue gas pre-
treatment (FPT) column containing sodium hydroxide was also expected to be installed by
Delta Electricity to desulfurize the flue gas.

75
The inlet gas stream for our membrane testing rig was designed to be connected to the duct
after the FPT column which means the flue gas we expected to be the feed would have a
temperature between (15~20°C) and low SOX content (10 ppm). However, in the execution of
this project the heat exchanger was deemed not necessary as the connection pipe to the flue
gas was of small diameter (1/2” stainless steel tube) and relatively long (10 meters) so that
the gas temperature at inlet of membrane was not much higher than atmospheric. The FPT
column designed for SOx removal was not installed due to changes in the connection with
CSIRO capture facility.
Selection of equipment
The inlet gas stream for our membrane testing rig has a flow rate of approximately 6
standard L/min and a CO2 content of around 12%. A small air compressor was placed on the
feed line of the membrane unit to increase the feed pressure up to 5 bar, so as to provide
sufficient driving force for membrane separation.
To minimize membrane contamination by the feed stream, a filter and water separator were
added to the feed line to remove the remaining ash and water vapour in the feed after FPC
column. Furthermore, the feed line was designed to be heated to above the dew point to
avoid condensation of water on the membrane surface. These steps were designed for the
(Stage 2) on-site testing to provide evaluation of the membrane performance for ‘clean’ flue
gas. Depending on results from Stage 2, contaminants would be introduced to the feed at
controlled manner to the membrane unit to examine the tolerance of the membrane to the
untreated gas stream.
Initially, three membrane modules were designed to be installed and tested in parallel.
However, the rig was designed with sufficient flexibility to accommodate more membrane
modules when necessary. This configuration has the flexibility to either test several samples
of the same membrane at the same time or remove them sequentially to assess changes
over time, or, to test different membranes at the one time.
The feed, permeate and retentate pressure were monitored with digital pressure indicators
while the feed flow rate was controlled and monitored with a digital flow controller installed on
the retentate line to manipulate the stage cut of the membrane. The feed temperature was
monitored with a digital temperature indicator to ensure the gas temperature in the feed line
was above the dew point but below the upper limit of the operating temperature of the feed
flow meter. All the signals were monitored and recorded in real time using Labview®. The

76
feed, permeate, and retentate gas samples were periodically collected with sampling
cylinders and analysed in the laboratory. Swagelok quick connects were installed at the
sampling points to provide a simple solution for sampling. Isolation valves were placed on the
permeate lines to isolate the other two pipelines while taking the permeate samples. The
specifications of the major equipment are given in Table 5.2.
Table 6-2: Specifications of the major equipment
Equipments Specification
Particulate filter Stainless Steel Tee-Type Particulate Filter, 1/2 in. Swagelok Tube Fitting, 0.5 Micron Pore Size
Oilless air compressor (P-101)
1/6HP 220V 07054-27, 1/4" NPT(F) port size, max flow: 36.8 L/min, max pressure: 6.9 bar
Pressure indicator Transducer E/P 0-150 PSI ¼, 0~150 psi, 4~20 mA output, 1.25scfm
Relief valve SS Low-Pressure Proportional Relief Valve, 1/2 in. Swagelok Tube Fitting, Set pressure: 0.68~15.5 bar
One-way check valve SS Poppet Check Valve, Fixed Pressure, 1/2 in. Swagelok Tube Fitting, 100 psig (6.9 bar)
Feed flow meter 0.1~10 LPM, operating temperature: -10~50°C, maximum pressure: 9.9 bar, in-put, out-put signal: 5VDC, 1/4" NPT (F)
Membrane module (M-101, 102, 103)
Three hollow fibre modules
Permeate flow meter 0.05~5 LPM, operating temperature: -10~50 degree C, maximum pressure: 9.9 bar, in-put, out-put signal: 5VDC, 1/4" NPT (F)
Retentate flow controller 0.1~10 LPM, operating temperature: -10~50 degree C, maximum pressure: 9.9 bar, in-put, out-put signal: 5VDC, 1/4" NPT (F)
Sampling bomb 304L SS Double-Ended DOT-Compliant Sample Cylinder, 1/4 in. FNPT, 50 cm3, 1800 psig (124 bar)
Rotary vane pump RZ 9 two (P-102)
Operation temperature: -20~40°C, maximum pump speed: 8.9m3/h, ultimate vacuum: 0.002 mbar, water vapour tolerance: 40 mbar
Main pipeline Stainless steel 316 ½” Swagelok
An automatic shut-down device was installed for emergencies. Relief valves were installed
both on by-pass and permeate lines in case of sudden increase of feed pressure or
permeate pressure. One-way check valves were installed on the permeate line in case of
membrane rupture in one module which could potentially cause back-flow into the other
modules. Several potential hazards associated with the membrane separation unit are listed
in Table 6-3.

77
Table 6-3: Potential hazards, causes, consequences and controls
Hazard Causes Consequences Controls
High feed flow rate
Unstable gas supply
Process upset, compressor damage, inability to control flow in desired range
Relief valve
High permeate flow rate
Membrane rupture
Back-flow into other membrane modules, vacuum pump damage
One-way check valve, relief valve
High feed temperature
Unstable gas supply, heating tape failure
Flow meter damage, process upset
None
Change in composition
Variation in feed gas composition
Process flow may be inadequate to blow condensate through, process upset
None
High feed pressure
Pipe blockage Membrane rupture, back flow, compressor, vacuum pump damage
Relief valve, one-way check valve
High permeate pressure
Downstream pump restriction
Vacuum pump damage Relief valve
All the drawings (Figure 6. 1, Figure 6. 2, Figure 6. 3) were reviewed by Delta Electricity and
a full hazard and operability study (HAZOP) and other safety evaluations were conducted
prior the construction of the membrane unit.
The process conditions and gas composition for each pipeline are presented in Table 6-4
and Table 6-5 respectively.

78
Table 6-4: Design conditions and sizing of the membrane capture pilot plant
Parameter Operating condition
Pipeline specifications
OD (inch) ½
Maximum pressure (bar) 180
Hollow fibre dimension
OD (mm) 0.8
Length (mm) 500
Numbers of fibers in three modules 100
Membrane area in total (cm2) 1256
Hollow fiber module OD (inch) ½
CO2 condition in the feed
CO2 concentration in the feed 0.12
Membrane performance (for mass balance calculation only)
CO2 permeance (GPU) 20
CO2/N2 selectivity 10
Operating conditions
Temperature at the feed (°C) 20
Temperature after the heating tapes (°C) 40
Stage cut 0.1
Feed pressure after compressor (bar) 5
Permeate pressure before vacuum pump (bar) 0.1
Pressure ratio 50

79
Table 6-5: Process conditions and gas composition for each line
Line number CO2 concentration
N2 concentration
H2O concentration
Ash Pressure Temperature Flow rate
% % % mg/m3 bar °C l/min
L-1 12 88 <1 <10 1 20 5.9
L-2 12 88 <1 ― 1 20 5.9
L-3 12 88 <1 ― 5 20 1.2
L-4 12 88 ― ― 5 20 1.2
L-5 12 88 ― ― 5 50 1.3
L-6, 7, 8 12 88 ― ― 5 50 0.4
L-9, 11, 13 7 93 ― ― 5 20 0.4
L-10, 12, 14 55 45 ― ― 0.1 20 0.04
L-15 7 93 ― ― 5 20 1.2
L-16 55 45 ― ― 0.1 20 0.12
L-17 55 45 ― ― 1 20 12

80
Figure 6. 1: Legend for the P&ID and PFD.
H
G
F
E
D
C
B
A
8 7 6 5 4 3 2 1
H
G
F
E
D
C
B
A
8 7 6 5 4 3 2 1
LEGEND‐PIPING AND INSTRUMENTATION DIAGRAM
SIZE FSCM NO DWG NO REV
A3
SCALE NOT TO SCALE SHEET 1 of 1
DRAWN BY
GUANGXI DONG
DATE
CHECKED BY
APPROVED BY
3
2
1
REV. DATE BY CHECKED APPROVEDDESCRIPTION
ISSUED FOR REVIEW
ISSUED FOR REVIEW
APPROVED FOR CONSTRUCTION
FIGURE DESCRIPTION
BALL VALVE
POWERED VALVE
RELIEF VALVE
NEEDLE VALVE
FIGURE DESCRIPTION
FLOW METER/CONTROLLERMEMBRANE UNIT
WATER SEPARATOR
PARTICULATE FILTER
FIGURE DESCRIPTION
THERMAL INSULATION
AIR COMPRESSOR
ROTARY VANE VACUUM PUMP
PI
TI
PRESSURE INDICATOR
TEMPERATURE INDICATOR
APSAMPLING POINT
HE HEATING TAPE

81
Figure 6. 2: P&ID of the membrane capture pilot plant at he Vales Point Power Station
H
G
F
E
D
C
B
A
8 7 6 5 4 3 2 1
H
G
F
E
D
C
B
A
8 7 6 5 4 3 2 1
POST COMBUSTION CO2 CAPTURE MEMBRANE PILOT PLANTPIPING AND INSTRUMENTATION DIAGRAM
SIZE FSCM NO DWG NO REV
A3 3
SCALE NOT TO SCALE SHEET 1 of 1
DRAWN BY
GUANGXI DONG
DATE
CHECKED BY
APPROVED BY
EQUIPMENT TAG F‐101 P‐101 H‐101 H‐102 M‐101 M‐102 M‐103 P‐102
EQUIPMENT NAME PARTICULATE FILTER AIR COMPRESSOR WATER SEPARATOR LINE HEATER MEMBRANE UNIT MEMBRANE UNIT MEMBRANE UNIT ROTARY VANE PUMP
DESIGN TEMPERATURE 20°C 20°C 20°C 50°C 50°C 50°C 50°C 20~50°C
DESIGN PRESSURE 1 bar 5 bar 5 bar 5 bar 5 bar 5 bar 5 bar 0.1 bar
3
2
1
REV. DATE BY CHECKED APPROVEDDESCRIPTION
ISSUED FOR REVIEW
ISSUED FOR REVIEW
APPROVED FOR CONSTRUCTION
FLUE GAS SUPPLY V‐2FC‐101
101
101101
F‐101
V‐5
FIC
P‐101
SS‐½”‐L‐2
H‐101
SS‐½”‐L‐3
V‐8
SS‐½”‐L‐4
101
PI
H‐102
V‐9
V‐10
102PI
AP
FM‐102
SS‐½”‐L‐5
102
FIFM‐101
101FM‐103
FI
103
FI
101
TI
V‐11 V‐19 V‐27
V‐12 V‐20 V‐28
V‐13
SS‐½”‐L‐3
FM‐104
101
TIC
101
PIC
V‐21
FM‐105105
FI
V‐29
FM‐106
V‐15
FC‐102102
FIC
V‐23
FC‐103
V‐31
FC‐104
103
PIV‐17
V‐18
104PI
AP
105
PIV‐25
V‐26
106PI
AP
103
PI
105
PIV‐33
V‐34
108PI
AP
107
PI
107
PI
V‐41
V‐14 V‐22 V‐30
V‐35FM‐107
107
107
FI
109
PI
109
PI
V‐36
M‐101 M‐102 M‐103
V‐37V‐40
V‐38
V‐39
110PI
AP
P‐102EXHAUST
I
I
I
I
101101
I
V‐1 V‐3 V‐4
V‐6 V‐7 PP
PPPP
104
FI
106
FI
FAH FAHH
MF
I‐231
I
MF
PAH PAHH
FAL
107
FAHH
I
SS‐½”‐L‐15
SS‐½”‐L‐16
SS‐½”‐L‐17
V‐16 V‐24
103
FIC
V‐32
104
FIC
HE
I
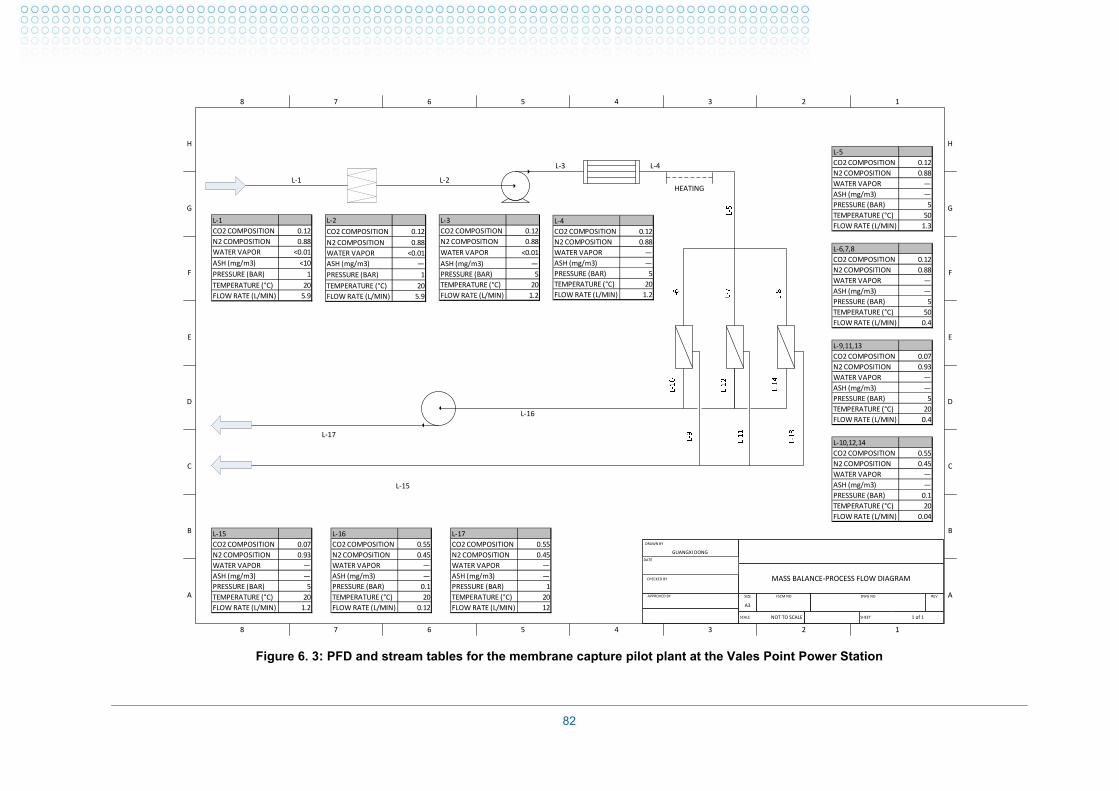
82
Figure 6. 3: PFD and stream tables for the membrane capture pilot plant at the Vales Point Power Station
H
G
F
E
D
C
B
A
8 7 6 5 4 3 2 1
H
G
F
E
D
C
B
A
8 7 6 5 4 3 2 1
MASS BALANCE‐PROCESS FLOW DIAGRAM
SIZE FSCM NO DWG NO REV
A3
SCALE NOT TO SCALE SHEET 1 of 1
DRAWN BY
GUANGXI DONG
DATE
CHECKED BY
APPROVED BY
L‐1 L‐2
L‐3 L‐4
L‐15
L‐16
L‐17
L‐1
CO2 COMPOSITION 0.12
N2 COMPOSITION 0.88
WATER VAPOR <0.01
ASH (mg/m3) <10
PRESSURE (BAR) 1
TEMPERATURE (°C) 20
FLOW RATE (L/MIN) 5.9
L‐2
CO2 COMPOSITION 0.12
N2 COMPOSITION 0.88
WATER VAPOR <0.01
ASH (mg/m3) ―
PRESSURE (BAR) 1
TEMPERATURE (°C) 20
FLOW RATE (L/MIN) 5.9
L‐10,12,14
CO2 COMPOSITION 0.55
N2 COMPOSITION 0.45
WATER VAPOR ―
ASH (mg/m3) ―
PRESSURE (BAR) 0.1
TEMPERATURE (°C) 20
FLOW RATE (L/MIN) 0.04
L‐16
CO2 COMPOSITION 0.55
N2 COMPOSITION 0.45
WATER VAPOR ―
ASH (mg/m3) ―
PRESSURE (BAR) 0.1
TEMPERATURE (°C) 20
FLOW RATE (L/MIN) 0.12
HEATING
L‐3
CO2 COMPOSITION 0.12
N2 COMPOSITION 0.88
WATER VAPOR <0.01
ASH (mg/m3) ―
PRESSURE (BAR) 5
TEMPERATURE (°C) 20
FLOW RATE (L/MIN) 1.2
L‐4
CO2 COMPOSITION 0.12
N2 COMPOSITION 0.88
WATER VAPOR ―
ASH (mg/m3) ―
PRESSURE (BAR) 5
TEMPERATURE (°C) 20
FLOW RATE (L/MIN) 1.2
L‐5
CO2 COMPOSITION 0.12
N2 COMPOSITION 0.88
WATER VAPOR ―
ASH (mg/m3) ―
PRESSURE (BAR) 5
TEMPERATURE (°C) 50
FLOW RATE (L/MIN) 1.3
L‐6,7,8
CO2 COMPOSITION 0.12
N2 COMPOSITION 0.88
WATER VAPOR ―
ASH (mg/m3) ―
PRESSURE (BAR) 5
TEMPERATURE (°C) 50
FLOW RATE (L/MIN) 0.4
L‐9,11,13
CO2 COMPOSITION 0.07
N2 COMPOSITION 0.93
WATER VAPOR ―
ASH (mg/m3) ―
PRESSURE (BAR) 5
TEMPERATURE (°C) 20
FLOW RATE (L/MIN) 0.4
L‐15
CO2 COMPOSITION 0.07
N2 COMPOSITION 0.93
WATER VAPOR ―
ASH (mg/m3) ―
PRESSURE (BAR) 5
TEMPERATURE (°C) 20
FLOW RATE (L/MIN) 1.2
L‐17
CO2 COMPOSITION 0.55
N2 COMPOSITION 0.45
WATER VAPOR ―
ASH (mg/m3) ―
PRESSURE (BAR) 1
TEMPERATURE (°C) 20
FLOW RATE (L/MIN) 12

83
Nomenclature
FPT Flue gas pre‐treatment
GPU Gas permeation unit
HAZOP Hazard and operability study
LPM Litre per minute
NPT National pipe thread
P&ID Piping and instrumentation diagram
PCC Post combustion capture
PDMS Polydimethylsiloxane
PES Polyethersulfone
PFD Process flow diagram
PI Polyimide
PIM Polymer with intrinsic micro‐porosity
PSf Polysulfone
SEM Scanning electron microscopy

84
7. On-site tests at Vales Point Power Plant (Milestone 4)
On-site installation
The CO2CRC mobile membrane unit is a compact system with the main components
installed inside a metal cabinet as shown in Figure 7. 1, Figure 7. 2, and Figure 7. 3. In this
mobile membrane unit, 3 membrane modules can be installed in parallel to conduct
comparative studies. Both 1st and 2nd generation hollow fibre membranes fabricated at
UNSW were tested in the laboratory before taking to Vales Point.
Figure 7. 1: Overall dimensions of the mobile membrane unit

85
Figure 7. 2: Sampling side of the mobile membrane unit
Figure 7. 3: The system control side of the mobile membrane unit

86
As indicated in the design section, flue gas provided from the power station was continuously
fed into the three parallel membrane modules during operation. The feed, permeate and
retentate pressures were monitored by pressure transducers, while the temperature of the
feed was monitored by a temperature indicator. The flow rate of the permeate was monitored
by flow meters/controllers. All of the operating parameters were recorded with a data logging
system via a computer using LabView® software.
Feed and permeate gas samples were collected on a daily basis, and were brought back to
UNSW for analysis in the laboratory with a gas chromatograph. The results were used to
calculate the permeance and selectivity for membrane performance evaluation.
Floor Plan for the CO2CRC Membrane CO2 Capture Facility
The CO2CRC mobile membrane unit at Vales Point was located in the same purpose built
facility as dedicated for a CSIRO solvent and adsorption pilot units. It has a concrete slab for
facility installation and an office (Figure 7. 4). This facility was managed by CSIRO.

87
Figure 7. 4: Floor plan for the CO2CRC mobile membrane unit at Vales Point
On-Site Test of the 1st Generation Membrane (Milestone 5)
7.3.1. Raw Flue Gas Composition
The flue gas entering the CO2CRC mobile membrane test facility has the following
characteristics as given in Table 7-1, part of this data was provided by the CSIRO adsorption
research team. Note that the composition is different from what was expected in the design
stage of the project which was used for construction of the mobile test unit.
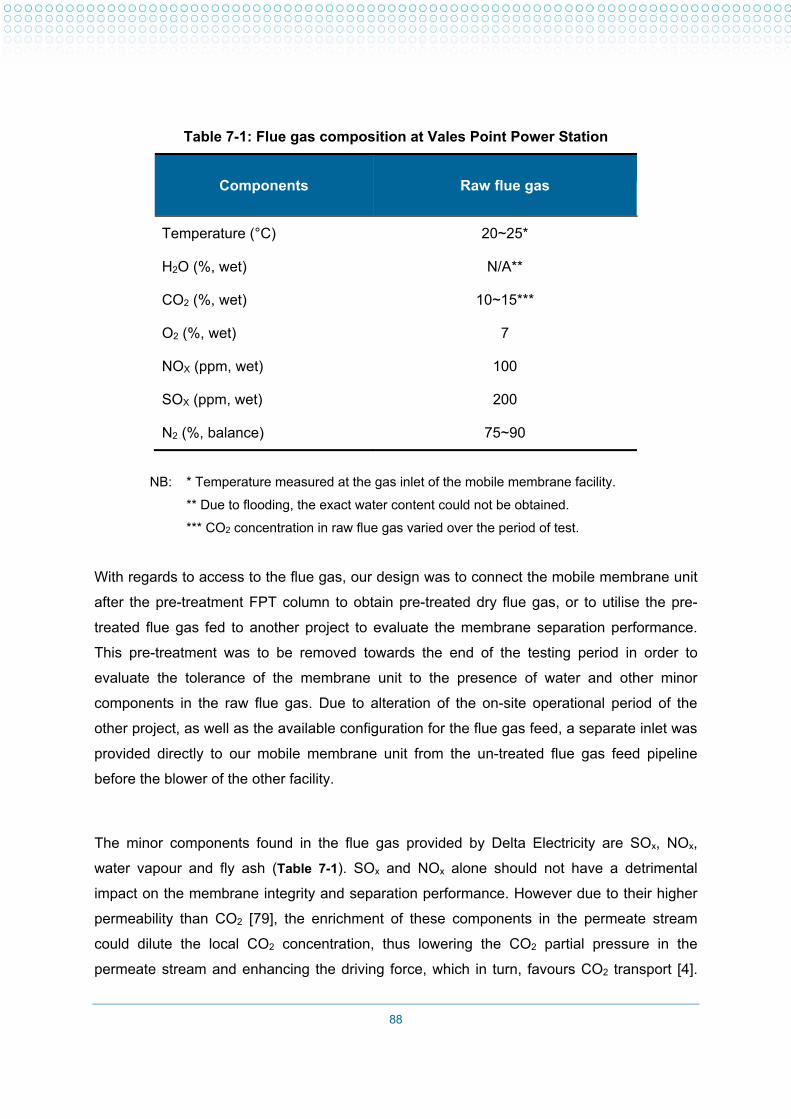
88
Table 7-1: Flue gas composition at Vales Point Power Station
Components Raw flue gas
Temperature (°C) 20~25*
H2O (%, wet) N/A**
CO2 (%, wet) 10~15***
O2 (%, wet) 7
NOX (ppm, wet) 100
SOX (ppm, wet) 200
N2 (%, balance) 75~90
NB:
* Temperature measured at the gas inlet of the mobile membrane facility.
** Due to flooding, the exact water content could not be obtained.
*** CO2 concentration in raw flue gas varied over the period of test.
With regards to access to the flue gas, our design was to connect the mobile membrane unit
after the pre-treatment FPT column to obtain pre-treated dry flue gas, or to utilise the pre-
treated flue gas fed to another project to evaluate the membrane separation performance.
This pre-treatment was to be removed towards the end of the testing period in order to
evaluate the tolerance of the membrane unit to the presence of water and other minor
components in the raw flue gas. Due to alteration of the on-site operational period of the
other project, as well as the available configuration for the flue gas feed, a separate inlet was
provided directly to our mobile membrane unit from the un-treated flue gas feed pipeline
before the blower of the other facility.
The minor components found in the flue gas provided by Delta Electricity are SOx, NOx,
water vapour and fly ash (Table 7-1). SOx and NOx alone should not have a detrimental
impact on the membrane integrity and separation performance. However due to their higher
permeability than CO2 [79], the enrichment of these components in the permeate stream
could dilute the local CO2 concentration, thus lowering the CO2 partial pressure in the
permeate stream and enhancing the driving force, which in turn, favours CO2 transport [4].

89
However, once combined with water, these compounds can form acids which could
potentially degrade the polymeric membrane. In this regard, the essential pre-treatment step
to be considered is the removal of water vapour to avoid the condensation of water on the
membrane surface which can create undesired mass transfer resistance and also react with
SOx and NOx. A water trap was installed in the existing set-up as a safeguard to the
membrane modules.
Fly ash can accumulate on the membrane surface or even clog the membrane pores. As
such it is crucial to remove fly ash prior to membrane separation. In the existing set-up, a
micro-filter was included in the feed stream, which removed most of the fly ash.
7.3.2. On-Site Tests of blended Matrimid hollow fiber membranes
Seven membrane modules made of Matrimid blended with additive were prepared for the on-
site test (all with membrane area of 380 cm2). CO2/N2 pure gas permeation tests were
performed in the laboratory prior to the on-site tests (Table 7-2). Apart from the control
module (pure Matrimid®), all the membrane modules have 4 % Silwet additive. These all
show better CO2 permeance and CO2/N2 selectivity than the control (pure Matrimid®)
module.

90
Table 7-2: CO2/N2 separation performance of the selected membrane modules tested with dry pure gases at 2 bars in the laboratory.
Module
No.
Membrane modules CO2 permeance
(GPU) CO2/N2 selectivity
Polymer Silwet
concentration
Air gap length
(cm)
1 Pure Matrimid®
(control)
0 15 17-21 24-38
2 Matrimid® 4 15
24-27 22-30 3 Matrimid® 4 15
4 Matrimid® 4 15
5 Matrimid® 4 10
27-34 26-34 6 Matrimid® 4 10
7 Matrimid® 4 10
7.3.3. Results from On-site Test (1st generation membrane)
The campaign was originally planned for two weeks (2 days installation, and 8 days
operation). However due to the severe flooding of the pre-treatment facilities and leaking
along the pipeline, as well as data logging problems, the membrane modules were only
tested for up to 4 days.
The first batch of valid data was collected on February 20th 2014 on Modules 1, 2 and 5.
These three modules were selected representing pure Matrimid® membrane (the control
module, Module 1) and two Matrimid® membranes with 4 % additive produced using 10 cm
(Module 5) and 15 cm (Module 2) air gaps. However, the performance of two modules
(Modules 1 and 5) was compromised as a result of flooding on February 21st, along with a
few other issues. Module 1 exhibited much higher flux after February 21st, indicating the loss
of integrity of the membrane module, which might be due to the presence of high level of
SOX. The combination of SOX and water can form acid which can be corrosive to both the
polymeric membranes and the glue used to seal the module and hold the fibres in place. As
a result, the membrane module lost its separation functionality, indicated by the substantially
higher permeation flux (above 50 ml/min) than the normally observed range (between 3 and

91
15 ml/min). Module 5, on the other hand, displayed much lower permeation flux (less than 1
ml/min), which might be caused by the intrusion of an excessive amount of water inside the
membrane.
The on-site testing was interrupted by the flooding on February 21st, resumed on February
25th, and completed on February 27th, with 3 days of valid data collected from Modules 2, 3
and 6 (Modules 3 and 6 to replace the damaged Modules 1 and 5). The separation
performances of these modules are shown in Figure 7. 5 and Figure 7. 7.
Figure 7. 5: CO2 permeance profiles over 3 days on-site operation
Figure 7. 6: CO2/N2 selectivity profiles over 3 days on-site operation

92
As on-line gas analysis was not available, gas samples were collected on a daily basis,
giving three data points for each module. This provides some information about performance.
Modules 2 and 3 displayed reasonable separation performance both in terms of CO2
permeance and CO2/N2 selectivity. Both parameters were lower than the results obtained
from the pure gas permeation tests performed in the laboratory prior to the on-site operation,
which is expected due to:
(1) mixed-gas separation performance always being lower than those from pure
gases due to the competitive sorption effect,
(2) the presence of minor components reducing the separation performance.
In addition, we have demonstrated in previous chapters that the presence of NO can cause
close to a 10 % reduction in CO2 permeance and CO2/N2 selectivity. Most significantly, the
membranes were exposed to wet flue gas with minimal pre-treatment (with a water trap and
small capacity silica gel) rather than to treated flue gas as was originally anticipated. Thus
we progressed straight to tolerance testing of the membranes to contaminants that should
only have been conducted in the final stage of our research.
Fortunately, the loss of performance over the testing time was marginal, suggesting that the
contaminants in the raw flue gas had negligible impact on Modules 2 and 3. To confirm the
integrity of these two modules, pure gas permeation tests were carried out back in the
laboratory. Both modules provided similar laboratory separation performance before and
after the on-site testing. Further testing with 1st generation membranes were conducted after
modification of the tie-in connection (described below).
Module 6, however, experienced significant loss in terms of CO2/N2 selectivity (dropping to
around 3 from 19), indicating that the membrane integrity was compromised.

93
Figure 7. 7: Permeation flux profile of Module 2 over 3 days operation
The hourly flux data was compiled as another indicator of the membrane performance. The
flux profile of Module 2 as a function of operating time is shown in Figure 7. 7; similar trends
were observed for Module 3. A reasonably stable flux was observed over the 3 days
operation with marginal decrease over time, further indicating good membrane integrity.
7.3.4. Modifications on the Flue Gas Feed Inlet Connection
During the initial test period, it was realised that the flue gas feed pipe to the mobile
membrane unit was connected to the drain line of the gas feed to another facility, which
resulted in the condensed water in that line being drawn to the mobile membrane unit as
shown in Figure 11. This caused major flooding of the pre-treatment units in the mobile
membrane unit that was not identified by the HAZOP.
A decision was made to move the flue gas feed pipe to the mobile membrane unit from the
lowest point in the feed pipe to the top of the pipe in March 2014. Tests were resumed
afterwards.

94
Figure 7. 8: Modification of flue gas in-let pipe connection.
On-Site Test of the composite hollow fiber Membranes (Milestone 6)
7.4.1. Modifications on the membrane unit for the 2nd generation membrane test
During the on-site test of the 1st generation membrane, several issues related to the operation
of the membrane unit were discovered. The most critical one was difficulty in continuous
operation of the unit. During the test of 1st generation membrane, the membrane module
permeation flux was manually monitored by a handheld gas flow meter, which made the
continuous data logging very difficult especially overnight. In addition, the gas/water separator
had a very small volume, and after a few hours of operation the separator needed to be
emptied. It forced the shut-down of the whole system for water drainage.
In order to rectify these problems, work was carried out on-site to modify the membrane unit.
This included installation of 3 gas flow rate monitors in the permeation outlet of each

95
separated membrane modules; upgrading of the automatic data logging system that was
programmed to continuously monitor the change of the permeation flow (flux). In addition, a
2 L stainless steel water trap bottle was installed along the membrane feed pipeline in order
to improve the water trap capacity and to prevent the condensed water from entering the
membrane module as shown in Figure 7. 9. With the installation of the water trap bottle,
longer continuous operation was possible. The inclusion of the water trap bottle also
provided additional benefit of acting as feed pressure damping device which minimised the
fluctuation of the feed gas pressure to the membrane unit.
Figure 7. 9: Modifications of the on-site membrane unit for the 2nd generation membrane testing (upper: gas flow rate monitor, and lower: 2 L water trap)
In addition, a flow meter was also added at the retentate outline so the stage cut of the
membrane unit could be calculated. During the test of the 2nd generation membrane, a stage
cut of 1 % was applied to minimize the concentration polarization (the increase in N2
concentration near the feed side membrane surface that could reduce the separation driving
force) near the membrane surface. Further, in order to understand the effect of water vapour
to the membrane performance for the on-site test, a PhyMetrix portable moisture analyzer
(Model: PPMa) was installed. During the all on-site tests, both the feed gas and permeation
gas were saturated with water vapour.
7.4.2. Results from on-site test (2nd generation membrane)
The on-site test of the 2nd generation membrane was originally planned to start in June 2014.
However, due to the unexpected generator emergency shut-down (13th June to 16th July),
flue gas isolation (21th July to late-July), generator scheduled maintenance (early-Aug to mid-

96
Oct) and flue gas system re-configuration (early-Oct to mid-Oct), the on-site test of the 2nd
generation membrane was resumed on the 24th Oct.
The first batch of valid data was collected between 27th Oct and 11th Nov, 2014 (17 days in
total). Among all the candidate composite hollow fiber membranes developed in this study
shown in Table 7-3, the selected modules were PTMSP and Pebax 1074 based. The
detailed information of the membrane modules were:
Model 1: PVDF/4PTMSP/Pebax1074/1PTMSP
Model 2 and 3: PVDF/2PTMSP/ Pebax1074/1PTMSP
Table 7-3: Composite hollow fiber membranes developed in this study with permeation tests conducted in the lab with dry pure gases. Selected modules for tests on site with flue gas were highlighted.
Composite hollow fiber membranes
CO2 (GPU) N2 (GPU) CO2/N2
2PDMS/1Pebax1657/1PDMS 55 (12) 1.38 (0.08) 40 (7.2)
4PDMS/1Pebax1657/1PDMS 76 (7.2) 1.22 (0.45) 66 (15.6)
4PDMS/1Pebax1074/1PDMS 174 (16.4) 3.74 (0.50) 47 (1.7)
1PTMSP/1Pebax1657/1PTMSP 72 (4.7) 3.83 (0.56) 19 (4.05)
1PTMSP/1Pebax1074/1PTMSP 194 (7) 3.69 (0.31) 53 (2.60)
2PTMSP/1Pebax1657/1PTMSP 125 (5) 2.08 (0.21) 67 (2.45)
2PTMSP/1Pebax1074/1PTMSP 354 (64) 6.53 (0.30) 49 (2.63)
4PTMSP/1Pebax1657/1PTMSP 101(6.6) 1.18 (0.07) 86 (4.33)
4PTMSP/1Pebax1074/1PTMSP 560 (17) 12.07 (0.35) 46 (1.83)
The 17 days of on-site operation was conducted in two stages. In the first stage, the
desiccant column was changed every 36-48 hours and the water trap bottle was emptied
regularly to minimize water entering the membrane module.
In the second stage, the membrane unit was operated without the change of desiccant
column and water trap bottle emptying (referred as unattended operation). Thus membrane
flooding occurred after the initial 50 hours during the second stage operation. As shown in
Figure 7. 10, during the initial 14 days, the permeation flux for module 1 was relatively stable:
it only reduced by 15 % by the end of the stage. A similar profile was also observed with the
CO2/N2 selectivity during this period. However, a significant deterioration in the membrane
performance was observed in the second stage operation: both permeation flux and
selectivity displayed an obvious reduction. During the unattended operation, condensed

97
water most likely entered the membrane module and led to flooding, which reduced the
effective membrane area and increased the competitive sorption. All those aspects led to the
loss of membrane performance. Furthermore, the corrosive acid formed when SOx dissolved
in water may have resulted in permanent damage to the membrane structure and led to
irreversible loss of membrane performance.
Figure 7. 10: The membrane performance profiles for the composite hollow fiber (or 2nd generation) membrane over 17 days on-site operation (module 1)(upper: permeance and permeation flux, lower:
CO2/N2 selectivity)
All three selected modules were tested during the on-site work. In terms of the CO2
permeance, module 2 and 3 displayed much lower initial value when compared with module
1 (Figure 7. 10). This observation was consistent with the lab test results that module 1 had
much higher CO2 permeance than module 2 and 3. In terms of CO2/N2 selectivity, the module

98
2 and 3 also had comparable selectivity performances to the module 1 over the whole testing
period. However, it should be noted that both CO2 permeance and CO2/N2 selectivity for all
three modules were lower than the values obtained in the lab with pure gas. The detailed
reason could be attributed to competitive adsorption effect and the presence of minor
components. The presence of saturated water vapour also imposed extra mass transfer
resistance when it condensed on the membrane surface. More detailed discussion can be
found above.
Figure 7. 11: The 2nd generation membrane performance profiles over 17 days on-site operation (module 1-3) (upper: CO2 permeance, lower: CO2/N2 selectivity)

99
In order to better understand the loss of membrane performance during the on-site testing,
after some operating time the membrane module was brought back to the laboratory and
tested with pure gas after drying of the membrane.
Results in Table 7-4 shows that the CO2 permeance of module 1 was relatively unchanged
after nearly 350 hours continuous operation. However, during the unattended operation
severe membrane flooding occurred which deteriorated the membrane performance: only 15
GPU of CO2 permeance was obtained after the membrane flooding. For module 2 and 3, the
membrane flooding resulted in the loss of membrane integrity: the modules lost the
selectivity between CO2 and N2.
Apart from that, the dissolved SOx in the water led to the formation of corrosive acid, which
could have damaged the membrane structure and compromised the membrane separation
performance. At the end of this test, the membrane module fitting material was also corroded
by the acid, indicating the strong corrosiveness of the membrane flooding liquid (Figure 7. 12).
Table 7-4: Comparison of the membrane pure gas test results in lab before and after the on-site test
Membrane
modules Flue gas testing time (hours) CO2 permeance (GPU)
CO2/N2
selectivity
4PTMSP/1Pebax1
074/1PTMSP
(module 1)
0 500 ± 18 31.2 ± 1.2
346
(before module flooding) 441 ± 9 29.6 ± 0.5
418
(after module flooding) 15 ± 1 28.8 ± 1.3
2PTMSP/1Pebax1
074/1PTMSP
(module 2)
0 235 ± 20 32.2 ± 1.2
418
(after module flooding) 107 ± 13 1.08 ± 0.1
2PTMSP/1Pebax1
074/1PTMSP
(module 3)
0 320 ± 35 31.6 ± 1.7
418
(after module flooding) 831 ± 120 1.01 ± 0.5

100
Figure 7. 12: Corrosion of the copper membrane module fitting after membrane flooding.

101
8. Conclusions and recommendations
Conclusions
Based on the State-of-the-Art assessment of material selection and baseline performance
criteria with considerations of large-scale deployment pathway, and benchmark materials
identified at early stage of this study, we selected two materials for hollow fiber membrane
development for laboratory and on-site tests with flue gas in this project. They are:
(1) the 1st generation membrane: hollow fiber membranes fabricated using Matrimid
blended with selected PEO and PEO-PDMS copolymer additives with improved
separation performance and long term performance sustainability;
(2) the 2nd generation membrane: composite hollow fibre membranes developed in this
study with multi-layer coating using selected CO2- philic PEO-PA block copolymers
(PEBAX) as selective layer with superior separation performance..
Membranes of both generations were fabricated in house with their separation performance
tested with “clean” CO2 and N2 pure gases (no impurities) and CO2/N2 gas mixture in the
laboratory. For the 1st generation membranes, improved CO2 permeance (between 24-34
GPU) and CO2/N2 selectivity (between 30-40) than commercially available products were
achieved.
For the 2nd generation membranes, a new protocol for dissolving Pebax®1074 grade polymer
using simple and environmentally friendly mixed solvent solution was developed followed by
systematic studies on the phase structure of Pebax® dense membranes (including blended
membranes) and their related gas separation performances. Based on this fundamental
knowledge, composite hollow fiber membrane development was conducted through selection
of suitable microporous substrates, selection of materials for gutter layer protective layer, and
design and construction of a unique dip-coating facility suitable for hollow fiber composite
membranes. At the best combination of the conditions screened in this study, CO2
permeance up to 560 GPU and CO2/N2 selectivity above 46 was achieved at room
temperature, whereas 950 GPU and CO2/N2 selectivity of 30 achieved at the commonly
reported temperature of 35ºC. This performance was better than the best reported results in
the literature for composite hollow fibers for CO2 capture.

102
In the Phase 2 membrane development, the separation performance of the candidate
Matrimid hollow fibre membrane was evaluated in the laboratory for tolerance to NO
impurity (the primary impurity present in the flue gas) and water by testing with a synthesised
CO2/N2/NO gas mixture. The test results indicated that the trace amounts of NO only had
minor impact on the CO2/N2 separation performance for the Matrimid hollow fibre membrane
with 4 % Silwet® L-7607. Both CO2 permeance and CO2/N2 selectivity dropped less than 10
% compared with the mixed-gas permeation results without NO. However, the performance
tested with humidified gas (gas feed passing through a water humidifier to add water vapour
to the feed to the membrane), indicated severe reduction in both CO2 permeance (up to
16%) and CO2/N2 selectivity (reduction as high as 70% at room temperature at water vapour
activity between 0.6 and 0.86) stressing the importance of water removal pre-treatment
process in in membrane application in flue gas treatment.
In evaluation of the composite hollow fiber membranes, we observed that, similar to
Matrimid® based hollow fibers, the presence of NO did not affect the membrane separation
performance significantly. The presence of a small amount of water at low activity level of
0.08 and 0.16 also had an insignificant influence on the separation performance. Evaluation
at higher water activity level was not conducted due to the restricted resource in the lab
environment.
With the purpose designed and constructed mobile membrane test unit, the on-site test with
the 1st generation Matrimid hollow fibre membrane was conducted at Delta Electricity in
Vales Point with untreated flue gas. Seven membrane modules were prepared with 5
modules tested on-site. A decrease in both CO2 permeance (15 GPU at the highest) and
CO2/N2 selectivity (up to 15) in comparison with the results obtained with pure gases in the
laboratory was observed. However, 2 of them (both with 4 % Silwet® additive, fabricated with
15 cm air gap) exhibited minimal loss of separation performance after 3 days operation with
untreated real flue gas, indicating good integrity against real industrial conditions. Despite the
good chemical and mechanical stability of the 1st generation membrane, these membranes
were not considered suitable for CO2 capture from power station flue gas and the durability
test was terminated after 3 days operation, as they failed to reach the performance target set
for this project.
The on-site test of the 2nd generation membrane composite hollow fiber membranes made
with polyvinylidene fluoride (PVDF) microporous fiber as substrate, coated with multiple
103
(Polymer poly[1-(trimethylsilyl)-1-propyne]) (PTMSP) as gutter layer and PEBAX as
selective layer were conducted with three membrane modules that had been evaluated in lab
tests. In the first 14 days of tests, minimal pre-treatment of the flue gas feed was facilitated
through regular change of the desiccant column and draining of the water trap bottle (used
for collection of condensed water in the piping line), relatively stable permeance and
selectivity were observed with all three modules with CO2 permeance of 90-120 GPU and
CO2/N2 selectivity of 3.5. While the CO2 permeance and the CO2/N2 selectivity was lower
than what was achieved in lab with synthetic gas mixture, the mechanical integrity of the
membrane was maintained through the flue gas challenge, in that, when the membrane
module was brought back to the UNSW and dried followed by testing with pure gas, only
12% reduction of CO2 permeance (from 500 to 441 GPU) and 5% reduction in CO2/N2
selectivity (31.2 to 29.6) was experienced.
When the membrane was subjected to the flue gas without any pre-treatment, severe loss of
permeance and selectivity of all three modules were observed, and permanent damage to
the membrane mechanical integrity was suspected evidenced by the irreversible reduction of
membrane selectivity after drying tested in the lab. The damage to the membrane was most
likely due to flooding of the membrane module by condensed water in the feed line.

104
Recommendations
This project demonstrated that it is feasible to apply membrane technology, particularly
membranes developed in this project, for CO2 capture from black coal based flue gas. The
main issue in translating laboratory performance to industrial applications is the pre-
treatment processes, particularly removal of water from the feed gas so as to avoid water
condensation on the membrane surface and in the membrane module. Raising the feed gas
temperature above the dew point would prevent water condensation inside the connection
tubes and avoid flooding of the membrane. However, capillary condensation and water
molecule cluster formation within the membrane structure and membrane module may still
affect the long term performance and need to be thoroughly investigated.
Further study of membrane tolerance to water under more controlled conditions should be
conducted, with better control of water activity levels to evaluate the actual performance
reduction.

105
9. References 1. Kesting, R.E. and A.K. Fritzschz, Polymeric gas separation membranes. 1993, New York:
John Wiley & Sons. 2. Yampolskii, Y., I. Pinnau, and B.D. Freeman, Materials science of membranes for gas and
vapor separation. 2006, Chichester: John Wiley & Sons Inc. 3. Baker, R.W., Future directions of membrane gas separation technology. Industrial &
Engineering Chemistry Research, 2002. 41: p. 1393-1411. 4. Merkel, T.C., et al., Power plant post-combustion carbon dioxide capture: An opportunity for
membranes. Journal of membrane science, 2010. 359(1-2): p. 126-139. 5. Huibers, M., L. Daal, and P. Raats. NanoGLOWA post-combustion CO2 capture membranes -
Progess, performance and pilot testing at six industrial test sites. in Post-Combustion Capture Conference. 2011. Abu Dhabi.
6. Khan, A.L., X. Li, and I.F.J. Vankelecom, Mixed-gas CO2/CH4 and CO2/N2 separation with sulfonated PEEK membranes. Journal of Membrane Science, 2011. 372(1–2): p. 87-96.
7. Loeb, S. and S. Sourirajan, Sea water demineralization by means of an osmotic membrane. Advances in Chemistry Series, 1962. 38: p. 117-132.
8. Robeson, L.M., The upper bound revisited. Journal of Membrane Science, 2008. 320: p. 390-400.
9. Tin, P.S., et al., Effects of cross-linking modification on gas separation performance of Matrimid membranes. Journal of Membrane Science, 2003. 225(1-2): p. 77-90.
10. Chung, T.S., et al., Characterization of permeability and sorption in Matrimid/C60 mixed matrix membranes. Journal of Membrane Science, 2003. 211: p. 91-99.
11. Perez, E.V., et al., Mixed-matrix membranes containing MOF-5 for gas separations. Journal of Membrane Science, 2009. 328(1-2): p. 165-173.
12. Peter, J. and K.V. Peinemann, Multilayer composite membranes for gas separation based on crosslinked PTMSP gutter layer and partially crosslinked Matrimid® 5218 selective layer. Journal of Membrane Science, 2009. 340(1-2): p. 62-72.
13. Hellums, M.W., et al., Fluorinated polycarbonates for gas separation applications. Journal of Membrane Science, 1989. 46(1): p. 93-112.
14. Barbari, T.A., W.J. Koros, and D.R. Paul, Polymeric membranes based on bisphenol-A for gas separations. Journal of Membrane Science, 1989. 42(1-2): p. 69-86.
15. Huang, Z., et al., Enhanced gas separation properties by using nanostructured PES-Zeolite 4A mixed matrix membranes. Journal of Applied Polymer Science, 2006. 101(6): p. 3800-3805.
16. McHattie, J.S., W.J. Koros, and D.R. Paul, Gas transport properties of polysulphones: 1. Role of symmetry of methyl group placement on bisphenol rings. Polymer, 1991. 32(5): p. 840-850.
17. Lin, H. and B.D. Freeman, Gas solubility, diffusivity and permeability in poly(ethylene oxide). Journal of Membrane Science, 2004. 239(1): p. 105-117.
18. Pixton, M.R. and D.R. Paul, Gas transport properties of polyarylates part I: Connector and pendant group effects. Journal of Polymer Science Part B: Polymer Physics, 1995. 33(7): p. 1135-1149.
19. Pixton, M.R. and D.R. Paul, Gas transport properties of polyarylates part II: Tetrabromination of the bisphenol. Journal of Polymer Science Part B: Polymer Physics, 1995. 33(9): p. 1353-1364.
20. Pixton, M.R. and D.R. Paul, Gas Transport Properties of Polyarylates: Substituent Size and Symmetry Effects. Macromolecules, 1995. 28(24): p. 8277-8286.
21. Pixton, M.R. and D.R. Paul, Gas transport properties of polyarylates based on 9,9-bis(4-hydroxyphenyl)anthrone. Polymer, 1995. 36(14): p. 2745-2751.
22. Pixton, M.R. and D.R. Paul, Gas transport properties of adamantane-based polysulfones. Polymer, 1995. 36(16): p. 3165-3172.
23. Budd, P.M., et al., Gas separation membranes from polymers of intrinsic microporosity. Journal of Membrane Science, 2005. 251: p. 263-269.
24. Lin, W.-H., R.H. Vora, and T.-S. Chung, Gas transport properties of 6FDA-durene/1,4-phenylenediamine (pPDA) copolyimides. Journal of Polymer Science Part B: Polymer Physics, 2000. 38(21): p. 2703-2713.

106
25. Tanaka, K., et al., Effect of methyl substituents on permeability and permselectivity of gases in polyimides prepared from methyl-substituted phenylenediamines. Journal of Polymer Science Part B: Polymer Physics, 1992. 30(8): p. 907-914.
26. Car, A., et al., Tailor-made Polymeric Membranes based on Segmented Block Copolymers for CO2 Separation. Advanced Functional Materials, 2008. 18(18): p. 2815-2823.
27. Wang, D.L., K. Li, and W.K. Teo, Polyethersulfone hollow fiber gas separation membranes prepared from NMP/alcohol solvent systems. Journal of Membrane Science, 1996. 115: p. 85-108.
28. Wang, D.L., K. Li, and W.K. Teo, Highly permeable polyethersulfone hollow fiber gas separation membranes prepared using water as non-solvent additive. Journal of Membrane Science, 2000. 176: p. 147-158.
29. Dong, G.X., H.Y. Li, and V. Chen, Factors affect defect-free Matrimid hollow fiber gas separation performance in natural gas purification. Journal of Membrane Science, 2010. 353: p. 17-27.
30. Follmann, P.M., et al., Membrane gas separation processes for post combustion CO2 capture from coal fired power plants, in International Congress on Membranes and Membrane Processes. 2011.
31. Liu, L., A. Chakma, and X. Feng, Preparation of hollow fiber poly(ether block amide)/polysulfone composite membranes for separation of carbon dioxide from nitrogen. Chemical Engineering Journal, 2004. 105(1–2): p. 43-51.
32. Chung, T.S., W.H. Lin, and R.H. Vora, The effect of shear rates on gas separation performance of 6FDA-durene polyimide hollow fibers. Journal of Membrane Science, 2000. 167: p. 55-66.
33. Hirayama, Y., et al., Permeation properties to CO2 and N2 of poly(ethylene oxide)-containing and crosslinked polymer films. Journal of Membrane Science, 1999. 160(1): p. 87-99.
34. Car, A., et al., Pebax®/polyethylene glycol blend thin film composite membranes for CO2 separation: Performance with mixed gases. Separation and Purification Technology, 2008. 62(1): p. 110-117.
35. Reijerkerk, S.R., et al., Highly hydrophilic, rubbery membranes for CO2 capture and dehydration of flue gas. International Journal of Greenhouse Gas Control, 2011. 5(1): p. 26-36.
36. Reijerkerk, S.R., et al., Poly(ethylene glycol) and poly(dimethyl siloxane): Combining their advantages into efficient CO2 gas separation membranes. Journal of Membrane Science, 2010. 352: p. 126-135.
37. Bondar, V.I., B.D. Freeman, and I. Pinnau, Gas sorption and characterization of poly(ether-b-amide) segmented block copolymers. Journal of Polymer Science Part B: Polymer Physics, 1999. 37(17): p. 2463-2475.
38. Bondar, V.I., B.D. Freeman, and I. Pinnau, Gas transport properties of poly(ether-b-amide) segmented block copolymers. Journal of Polymer Science Part B: Polymer Physics, 2000. 38(15): p. 2051-2062.
39. Kim, J.H. and Y.M. Lee, Gas permeation properties of poly(amide-6-b-ethylene oxide)-silica hybrid membranes. Journal of Membrane Science, 2001. 193(2): p. 209-225.
40. Baker, R.W., Membranes and Modules, in Membrane Technology and Applications. 2012, John Wiley & Sons, Ltd. p. 97-178.
41. Young, T.-H. and L.-W. Chen, A diffusion-controlled model for wet-casting membrane formation. Journal of Membrane Science, 1991. 59(2): p. 169-181.
42. Robeson, L.M., Correlation of separation factor versus permeability for polymeric membranes. Journal of Membrane Science, 1991. 62(2): p. 165-185.
43. Robeson, L.M., The upper bound revisited. Journal of Membrane Science, 2008. 320(1–2): p. 390-400.
44. Puri, P.S., Fabrication of hollow fibre gas separation membranes. Gas Separation & Purification, 1990. 4: p. 29-36.
45. Baker, R.W., Future Directions of Membrane Gas Separation Technology. Industrial & Engineering Chemistry Research, 2002. 41(6): p. 1393-1411.
46. Wang, Y., H. Li, and V. Chen, High performance PEO-PA thin film composite hollow fibre membranes for post combustion CO2 capture. To be submitted, 2015.
47. Puri, P.S., Fabrication of hollow fibre gas separation membranes. Gas Separation & Purification, 1990. 4(1): p. 29-36.
48. J. Mater. Chem. A, (1(15)): p. 4610-4630.

107
49. Yave, W., et al., CO2-Philic Polymer Membrane with Extremely High Separation Performance. Macromolecules, 2009. 43(1): p. 326-333.
50. Li, S., et al., Interfacially polymerized thin film composite membranes containing ethylene oxide groups for CO2 separation. Journal of Membrane Science, 2013. 436(0): p. 121-131.
51. Liu, L., A. Chakma, and X. Feng, CO2/N2 Separation by Poly(Ether Block Amide) Thin Film Hollow Fiber Composite Membranes. Industrial & Engineering Chemistry Research, 2005. 44(17): p. 6874-6882.
52. Chen, H.Z., Y.C. Xiao, and T.-S. Chung, Multi-layer composite hollow fiber membranes derived from poly(ethylene glycol) (PEG) containing hybrid materials for CO2/N2 separation. Journal of Membrane Science, 2011. 381(1–2): p. 211-220.
53. Chung, T.-S., et al., Fabrication of multi-layer composite hollow fiber membranes for gas separation. Journal of Membrane Science, 1999. 152(2): p. 211-225.
54. Cabasso, I. and K.A. Lundy, Method of making membranes for gas separation and the composite membranes. 1990, Google Patents.
55. Struik, L.C.E., Physical aging in plastics and other glassy materials. Polymer Engineering and Science, 1977. 17: p. 165-173.
56. Bartos, J., J. Muller, and J.H. Wendorff, Physical aging of isotropic and anisotropic polycarbonate. Polymer, 1990. 31: p. 1678-1684.
57. Chung, T.S. and S.K. Teoh, The aging phenomenon of polyethersulphone hollow fiber membranes for gas separation and their characteristics. Journal of Membrane Science, 1999. 152: p. 175-188.
58. Dorkenoo, K.D. and P.H. Pfromm, Experimental evidence and theoretical analysis of physical aging in thin and thick amorphous glassy polymer films. Journal of Polymer Science Part B Polymer Physics, 1999. 37: p. 2239-2251.
59. Kim, J.H., W.J. Koros, and D.R. Paul, Effects of CO2 exposure and physical aging on the gas permeability of thin 6FDA-based polyimide membranes Part 1 without crosslinking. Journal of Membrane Science, 2006. 282: p. 21-31.
60. Pfromm, P.H. and W.J. Koros, Accelerated physical aging of thin glassy polymer films: evidence from gas transport measurements. Polymer, 1995. 36: p. 2379-2387.
61. Scholes, C.A., S.E. Kentish, and G.W. Stevens, Carbon dioxide separation through polymeric membrane systems for flue gas applications. Recent Patents on Chemical Engineering, 2008. 1(1): p. 52-66.
62. McCaig, M.S. and D.R. Paul, Effect of film thickness on the changes in gas permeability of a glassy polyarylate due to physical aging Part 1 Experimental observations. Polymer, 2000. 41: p. 629-637.
63. McCaig, M.S., D.R. Paul, and J.W. Barlow, Effect of film thickness on the changes in gas permeability of a glassy polyarylate due to physical aging Part 2 Mathematical model. Polymer, 2000. 41: p. 639-648.
64. Punsalan, D. and W.J. Koros, Thickness-dependent sorption and effects of physical aging in a polyimide sample. Journal of Applied Polymer Science, 2005. 96: p. 1115-1121.
65. Ismail, A.F. and W. Lorna, Penetrant-induced plasticization phenomenon in glassy polymers for gas separation membrane. Separation and Purification Technology, 2002. 27: p. 173-194.
66. Dong, G., H. Li, and V. Chen, Plasticization mechanisms and effects of thermal annealing of Matrimid hollow fiber membranes for CO2 removal. Journal of Membrane Science, 2011. 369(1–2): p. 206-220.
67. Bos, A., et al., CO2 induced plasticization phenomena in glassy polymers. Journal of Membrane Science, 1999. 155: p. 67-78.
68. Krol, J.J., M. Boerrigter, and G.H. Koops, Polyimide hollow fiber gas separation membranes: preparation and the suppression of plasticization in propane/propylene environments. Journal of Membrane Science, 2001. 184: p. 275-286.
69. Petropoulos, J.H., Plasticization effects on the gas permeability and permselectivity of polymer membranes. Journal of Membrane Science, 1992. 75: p. 47-59.
70. Visser, T., Mixed gas plasticization phenomena in asymmetric membranes. 2006, University of Twente. p. 191.
71. Krause, B., et al., Bicontinuous Nanoporous Polymers by Carbon Dioxide Foaming. Macromolecules, 2001. 34(25): p. 8792-8801.
72. Wessling, M., et al., Plasticization of gas separation membranes. Gas Separation and Purification, 1991. 5: p. 222-228.

108
73. Huang, Y. and D.R. Paul, Effect of film thickness on the gas-permeation characteristics of glassy polymer membranes. Industrial & Engineering Chemistry Research, 2007. 46: p. 2342-2347.
74. Jordan, S.M., M.A. Henson, and W.J. Koros, The effects of carbon dioxide conditioning on the permeation behavior of hollow fiber asymmetric membranes. Journal of Membrane Science, 1990. 54: p. 103-118.
75. Sanders, E.S., Penetrant-induced plasticization and gas permeation in glassy polymers. Journal of Membrane Science, 1988. 37: p. 63-80.
76. Story, B.J. and W.J. Koros, Comparison of three models for permeation of CO2/CH4 mixtures in poly(phenylene oxide). Journal of Polymer Science, 1989. 27: p. 1927-1948.
77. White, L.S., et al., Properties of a polyimide gas separation membrane in natural gas streams. Journal of Membrane Science, 1995. 103: p. 73-82.
78. Visser, T., G.H. Koops, and M. Wessling, On the subtle balance between competitve sorption and plasticization effects in asymmetric hollow fiber gas separation membranes. Journal of Membrane Science, 2005. 252: p. 265-277.
79. Scholes, C.A., S. Kentish, and G. Stevens, Effects of minor components in carbon dioxide capture using polymeric gas separation membranes. Separation and Purification Reviews, 2009. 38: p. 1-44.
80. Chern, R.T., et al., “Second component” effects in sorption and permeation of gases in glassy polymers. Journal of Membrane Science, 1983. 15(2): p. 157-169.
81. Pye, D.G., H.H. Hoehn, and M. Panar, Measurement of gas permeability of polymers 1. permeabilities in constant volume/variable pressure apparatus. Journal of Applied Polymer Science, 1976. 20: p. 1921-1931.
82. Bounaceur, R., et al., Membrane processes for post-combustion carbon dioxide capture: A parametric study. Energy, 2006. 31(14): p. 2556-2570.
83. Hussain, A. and M.-B. Hägg, A feasibility study of CO2 capture from flue gas by a facilitated transport membrane. Journal of Membrane Science, 2010. 359(1–2): p. 140-148.
84. Favre, E., Carbon dioxide recovery from post-combustion processes: Can gas permeation membranes compete with absorption? Journal of Membrane Science, 2007. 294: p. 50-59.
85. Follmann, P.M., et al., Chapter 7 Membrane Gas Separation Processes for Post-combustion CO2 Capture, in Membrane Engineering for the Treatment of Gases: Gas-separation Problems with Membranes. 2011, The Royal Society of Chemistry. p. 196-214.
86. Ho, M.T., G.W. Allinson, and D.E. Wiley, Reducing the Cost of CO2 Capture from Flue Gases Using Membrane Technology. Industrial & Engineering Chemistry Research, 2008. 47(5): p. 1562-1568.
87. Favre, E., Membrane processes and postcombustion carbon dioxide capture: Challenges and prospects. Chemical Engineering Journal, 2011. 171(3): p. 782-793.
88. Piroux, F., E. Espuche, and R. Mercier, The effects of humidity on gas transport properties of sulfonated copolyimides. Journal of Membrane Science, 2004. 232(1-2): p. 115-122.
89. Sijbesma, H., et al., Flue gas dehydration using polymer membranes. Journal of Membrane Science, 2008. 313(1–2): p. 263-276.
90. Khan, A.L., X. Li, and I.F.J. Vankelecom, SPEEK/Matrimid blend membranes for CO2 separation. Journal of Membrane Science, 2011. 380(1-2): p. 55-62.
91. Reijerkerk, S.R., et al., Poly(ethylene glycol) and poly(dimethyl siloxane): Combining their advantages into efficient CO2 gas separation membranes. Journal of Membrane Science, 2010. 352(1–2): p. 126-135.
92. Li, J., et al., Effect of polyethyleneglycol (PEG) on gas permeabilities and permselectivities in its cellulose acetate (CA) blend membranes. Journal of Membrane Science, 1998. 138(2): p. 143-152.
93. Li, J., et al., Preparation of polyethyleneglycol (PEG) and cellulose acetate (CA) blend membranes and their gas permeabilities. Journal of Applied Polymer Science, 1995. 58(9): p. 1455-1463.
94. Lin, H. and B.D. Freeman, Materials selection guidelines for membranes that remove CO2 from gas mixtures. Journal of Molecular Structure, 2005. 739(1–3): p. 57-74.
95. Merkel, T.C., et al., Gas sorption, diffusion, and permeation in poly(dimethylsiloxane). Journal of Polymer Science Part B: Polymer Physics, 2000. 38(3): p. 415-434.
96. Hu, T., et al., Improved CO2 separation performance with additives of PEG and PEG-PDMS copolymer in poly(2,6-dimethyl-1,4-phenylene oxide)membranes. Journal of Membrane Science, 2013. 432: p. 13-24.

109
97. Hu, T., et al., Effect of PEG and PEO−PDMS copolymer additives on the structure and performance of Matrimid® hollow fibers for CO2 separation. Journal of Membrane Science, 2014. 468(0): p. 107-117.
98. Baker, R.W., Gas Separation, in Membrane Technology and Applications. 2012, John Wiley & Sons, Ltd. p. 325-378.
99. Zhao, H.-Y., et al., Poly(ethylene oxide) induced cross-linking modification of Matrimid membranes for selective separation of CO2. Journal of Membrane Science, 2008. 320(1–2): p. 179-184.
100. Lin, H., et al., Transport and structural characteristics of crosslinked poly(ethylene oxide) rubbers. Journal of Membrane Science, 2006. 276(1–2): p. 145-161.
101. Lin, H., et al., Plasticization-Enhanced Hydrogen Purification Using Polymeric Membranes. Science, 2006. 311(5761): p. 639-642.
102. Patel, N.P., A.C. Miller, and R.J. Spontak, Highly CO2-Permeable and Selective Polymer Nanocomposite Membranes. Advanced Materials, 2003. 15(9): p. 729-733.
103. Barillas, M.K., et al., The CO2 permeability and mixed gas CO2/H2 selectivity of membranes composed of CO2-philic polymers. Journal of Membrane Science, 2011. 372(1–2): p. 29-39.
104. Okamoto, K.-i., et al., Gas permeation properties of poly(ether imide) segmented copolymers. Macromolecules, 1995. 28(20): p. 6950-6956.
105. Park, H.B., C.K. Kim, and Y.M. Lee, Gas separation properties of polysiloxane/polyether mixed soft segment urethane urea membranes. Journal of Membrane Science, 2002. 204(1–2): p. 257-269.
106. Husken, D., et al., CO2 permeation properties of poly(ethylene oxide)-based segmented block copolymers. Journal of Membrane Science, 2010. 346(1): p. 194-201.
107. Li, H., B.D. Freeman, and O.M. Ekiner, Gas permeation properties of poly(urethane-urea)s containing different polyethers. Journal of Membrane Science, 2011. 369(1–2): p. 49-58.
108. Blume, I. and I. Pinnau, Composite membrane, method of preparation and use. 1990, Membrane Technology and Research Inc., Menlo Park, California, U.S.A.
109. Yave, W., et al., Design, synthesis, characterization and optimization of PTT-b-PEO copolymers: A new membrane material for CO2 separation. Journal of Membrane Science, 2010. 362(1–2): p. 407-416.
110. Chen, H., Y. Xiao, and T.-S. Chung, Synthesis and characterization of poly (ethylene oxide) containing copolyimides for hydrogen purification. Polymer, 2010. 51(18): p. 4077-4086.
111. Yoshino, M., et al., Effects of hard-segment polymers on CO2/N2 gas-separation properties of poly(ethylene oxide)-segmented copolymers. Journal of Polymer Science Part B: Polymer Physics, 2000. 38(13): p. 1707-1715.
112. Reijerkerk, S.R., et al., Tuning of mass transport properties of multi-block copolymers for CO2 capture applications. Journal of Membrane Science, 2010. 359(1–2): p. 54-63.
113. Car, A., et al., PEG modified poly(amide-b-ethylene oxide) membranes for CO2 separation. Journal of Membrane Science, 2007. 307(1): p. 88-95.
114. Yave, W., A. Car, and K.-V. Peinemann, Nanostructured membrane material designed for carbon dioxide separation. Journal of Membrane Science, 2010. 350(1–2): p. 124-129.
115. Yave, W., et al., Gas permeability and free volume in poly(amide-b-ethylene oxide)/polyethylene glycol blend membranes. Journal of Membrane Science, 2009. 339(1–2): p. 177-183.
116. Xia, J., S. Liu, and T.-S. Chung, Effect of End Groups and Grafting on the CO2 Separation Performance of Poly(ethylene glycol) Based Membranes. Macromolecules, 2011. 44(19): p. 7727-7736.
117. Xia, J., et al., Liquidlike Poly(ethylene glycol) Supported in the Organic–Inorganic Matrix for CO2 Removal. Macromolecules, 2011. 44(13): p. 5268-5280.
118. Reijerkerk, S.R., M. Wessling, and K. Nijmeijer, Pushing the limits of block copolymer membranes for CO2 separation. Journal of Membrane Science, 2011. 378(1–2): p. 479-484.
119. Chen, H.Z. and T.-S. Chung, CO2-selective membranes for hydrogen purification and the effect of carbon monoxide (CO) on its gas separation performance. International Journal of Hydrogen Energy, 2012. 37(7): p. 6001-6011.
120. Yan, Y., et al., Influence of Hydrocarbon Surfactant on the Aggregation Behavior of Silicone Surfactant: Observation of Intermediate Structures in the Vesicle−Micelle Transition. The Journal of Physical Chemistry B, 2006. 110(11): p. 5621-5626.

110
121. Inc., M.P.M. CoatOSil and Silwet additives for high performance coatings and inks, available from <http://www.momentive.com/Products/home.aspx?id=21495>. 2014; Available from: http://www.momentive.com/Products/home.aspx?id=21495.
122. Kelly, S.M. Praxair’s Oxygen Transport Membranes for Oxycombustion and Syngas Applications. 2014; Available from: http://www.netl.doe.gov/File%20Library/Events/2014/2014%20NETL%20CO2%20Capture/S-Kelly-PRAXAIR-Praxair-s-Oxygen-Transport-Membranes.pdf.
123. Xiao-Yan, W., et al., Modeling Transport Properties in High Free Volume Glassy Polymers, in New Polymeric Materials. 2005, American Chemical Society. p. 187-200.
124. Wang, Y., et al., The effect of fabrication and operation conditions on CO2 permeation performance of PEO-PA block copolymer membranes To be submitted
125. Chen, H.Z., et al., High performance composite hollow fiber membranes for CO2/H2 and CO2/N2 separation. International Journal of Hydrogen Energy, 2014. 39(10): p. 5043-5053.
126. Ji, P., et al., Impacts of coating condition on composite membrane performance for CO2 separation. Separation and Purification Technology, 2010. 71(2): p. 160-167.
127. Ren, X., et al., Poly (amide-6-b-ethylene oxide) multilayer composite membrane for carbon dioxide separation. International Journal of Greenhouse Gas Control, 2012. 8(0): p. 111-120.
128. Koros, W.J. and G.K. Fleming, Membrane-based gas separation. Journal of Membrane Science, 1993. 83(1): p. 1-80.
129. Kawakami, M., et al., Gas permeabilities of cellulose nitrate/poly(ethylene glycol) blend membranes. Journal of Applied Polymer Science, 1982. 27(7): p. 2387-2393.
130. Ghosal, K., et al., Effect of Basic Substituents on Gas Sorption and Permeation in Polysulfone. Macromolecules, 1996. 29(12): p. 4360-4369.
131. Brown George, L., Clustering of Water in Polymers, in Water in Polymers. 1980, AMERICAN CHEMICAL SOCIETY. p. 441-450.

CONTACT US
Canberra
Ms Tania Constable
Chief Executive Offi cerPO Box 225
DICKSON ACT 2602
CSIRO Headquarters
Limestone Ave
Campbell ACT 2612
Ph: +61 3 90 363 149
Email: [email protected]
Sydney
Prof Dianne Wiley
Program Manager for CO2 CaptureThe University of New South Wales
NSW 2052
Ph: + 61 2 9385 4755
Email: [email protected]
MelbourneLevel 3, Earth Sciences Building
University of Melbourne
253–283 Elgin Street, VIC 3010
PO Box 1182, Carlton VIC 3053
Corporate offi ce: +61 3 9035 9729
Ms Tania Constable
Chief Executive Offi cerEmail: [email protected]
Ms Ching Gee
Business ManagerEmail: [email protected]
Dr Matthias Raab
Program Manager for CO2 StorageEmail: [email protected]
Mr Rajindar Singh
Otway Operations ManagerEmail: [email protected]
Adelaide
Prof John Kaldi
Chief ScientistAustralian School of Petroleum
The University of Adelaide, SA 5005
Ph: + 61 8 8303 4291
Fax: + 61 8 8303 4345
Email: [email protected]
Perth
Mr David Hilditch
Commercial ManagerPO Box 1130, Bentley, WA 6102
Ph: + 61 8 6436 8655
Fax: + 61 8 6436 8555
Email: [email protected]

researching carbon capture and storage