Embed Size (px)
Citation preview

EVALUATION OF DEICER APPLICATIONS ON OPEN
GRADED PAVEMENTS
Final Report
SPR 616


EVALUATION OF DEICER APPLICATIONS ON OPEN GRADED PAVEMENTS
Final Report
SPR 616
by
Felix C. Martinez, ODOT Research Unit Richard A. Poecker, ODOT Office of Maintenance - Clean Water Program
for
Oregon Department of Transportation Research Unit
200 Hawthorne Avenue SE – Suite B-240 Salem OR 97301-5192
and
Federal Highway Administration
400 Seventh Street S.W. Washington, DC 20590
April 2006


i
1. Report No.
FHWA-OR-RD-06-12
2. Government Accession No.
3. Recipient’s Catalog No.
5. Report Date
April 2006
4. Title and Subtitle EVALUATION OF DEICER APPLICATIONS ON OPEN GRADED PAVEMENTS
6. Performing Organization Code
7. Author(s) Felix C. Martinez, Oregon Department of Transportation Research Unit Richard A. Poecker, ODOT Office of Maintenance - Clean Water Program
8. Performing Organization Report No.
10. Work Unit No. (TRAIS)
9. Performing Organization Name and Address Oregon Department of Transportation Research Unit 200 Hawthorne Ave. SE, Suite B-240 Salem, Oregon 97301-5192
11. Contract or Grant No. SPR 616
13. Type of Report and Period Covered Final Report
12. Sponsoring Agency Name and Address Oregon Department of Transportation Federal Highway Administration Research Unit 400 Seventh Street SW 200 Hawthorne Ave. SE – Suite B-240 Washington, D.C. 20590 Salem, Oregon 97301-5192
14. Sponsoring Agency Code
15. Supplementary Notes
16. Abstract
The Oregon Department of Transportation (ODOT) winter maintenance practices include plowing, sanding, and applying winter anti-icing/deicing liquids. These activities are performed on dense-graded as well as open-graded pavements. During the winters of 2002 and 2003, several accidents occurred on ODOT highways constructed with open-graded pavement, after winter maintenance chemicals had been applied. The people involved in these accidents believed that the application of deicers on the surface of the road may have reduced the friction of the surface, creating a hazardous traction condition. The scope of this research was to study the effects of liquid magnesium chloride on open-graded pavements. Four sections on two different highways in Oregon were selected to be skid tested under three conditions: 1) No deicer application; 2) after a deicer application rate of 15 gallons/lane mile; and 3) after a deicer application rate of 30 gallons/lane mile. The results of the skid tests were plotted and compared for any notable changes in friction. It was found that the application of deicer on either type of pavement at either application rate appeared to have little if any effect on the Friction Number (FN). The Friction Numbers obtained in the skid tests were also compared with those recommended in an FHWA study, and they turned out to be well above the FHWA recommended FN values. Due to the difficulty in controlling for variables, additional study is recommended, perhaps in a lab or in a location where the researches can maintain more control over the variables.
17. Key Words
Open-graded pavement, skid resistance, deicer chemical, skid testing, Friction Number, winter maintenance
18. Distribution Statement
Copies available from NTIS, and online at http://www.oregon.gov//ODOT/TD/TP_RES/
19. Security Classification (of this report)
Unclassified
20. Security Classification (of this page)
Unclassified
21. No. of Pages
42
22. Price
Technical Report Form DOT F 1700.7 (8-72) Reproduction of completed page authorized A Printed on recycled paper

ii
SI*
(MO
DE
RN
ME
TR
IC) C
ON
VE
RSI
ON
FA
CT
OR
S A
PPR
OX
IMA
TE
CO
NV
ER
SIO
NS
TO
SI U
NIT
S A
PPR
OX
IMA
TE
CO
NV
ER
SIO
NS
FRO
M S
I UN
ITS
Sym
bol
Whe
n Y
ou K
now
M
ultip
ly B
y To
Fin
d Sy
mbo
l Sy
mbo
l W
hen
You
Kno
w
Mul
tiply
By
To F
ind
Sym
bol
LE
NG
TH
L
EN
GT
H
in
inch
es
25.4
m
illim
eter
sm
m m
mm
illim
eter
s 0.
039
inch
esin
ft
feet
0.
305
met
ers
m m
met
ers
3.28
feet
ft y
d ya
rds
0.91
4 m
eter
sm
mm
eter
s 1.
09ya
rds
yd m
i m
iles
1.61
ki
lom
eter
skm
km
kilo
met
ers
0.62
1m
iles
mi
AR
EA
A
RE
A i
n2 sq
uare
inch
es
645.
2 m
illim
eter
s squ
ared
mm
2 m
m2
mill
imet
ers s
quar
ed0.
0016
squa
re in
ches
in2
ft2
squa
re fe
et
0.09
3 m
eter
s squ
ared
m2
m2
met
ers s
quar
ed10
.764
squa
re fe
etft2
yd2
squa
re y
ards
0.
836
met
ers s
quar
edm
2 h
ahe
ctar
es
2.47
acre
sac
ac
acre
s 0.
405
hect
ares
ha k
m2
kilo
met
ers s
quar
ed0.
386
squa
re m
iles
mi2
mi2
squa
re m
iles
2.59
ki
lom
eter
s squ
ared
km2
VO
LU
ME
VO
LU
ME
m
Lm
illili
ters
0.
034
fluid
oun
ces
fl oz
fl o
z flu
id o
unce
s 29
.57
mill
ilite
rsm
L L
liter
s 0.
264
gallo
nsga
l g
al
gallo
ns
3.78
5 lit
ers
L m
3m
eter
s cub
ed
35.3
15cu
bic
feet
ft3
ft3
cubi
c fe
et
0.02
8 m
eter
s cub
edm
3 m
3m
eter
s cub
ed
1.30
8cu
bic
yard
syd
3
yd3
cubi
c ya
rds
0.76
5 m
eter
s cub
edm
3M
ASS
NO
TE: V
olum
es g
reat
er th
an 1
000
L sh
all b
e sh
own
in m
3 . g
gram
s 0.
035
ounc
esoz
MA
SS
kg
ki
logr
ams
2.20
5po
unds
lb o
z ou
nces
28
.35
gram
sg
Mg
meg
agra
ms
1.10
2sh
ort t
ons (
2000
lb)
T l
b po
unds
0.
454
kilo
gram
skg
TE
MPE
RA
TU
RE
(exa
ct)
T
shor
t ton
s (20
00 lb
) 0.
907
meg
agra
ms
Mg
°CC
elsi
us te
mpe
ratu
re1.
8C+
32Fa
hren
heit
°FT
EM
PER
AT
UR
E (e
xact
)
°F
Fahr
enhe
it te
mpe
ratu
re
5(F-
32)/9
C
elsi
us te
mpe
ratu
re
°C
* SI
is th
e sy
mbo
l for
the
Inte
rnat
iona
l Sys
tem
of M
easu
rem
ent
(4-7
-94
jbp)
iii
ACKNOWLEDGEMENTS The authors would like to acknowledge the members of the Technical Advisory Committee for their oversight and guidance of this study:
Anne Holder and Larry Christianson, ODOT Transportation Safety John Coplantz, ODOT Construction – Pavement Unit Nick Fortey, Federal Highway Administration – Oregon Division Greg Hansen, Washington State Department of Transportation Liz Hunt ODOT Construction, Pavement Unit Luci Moore, ODOT Office of Maintenance Steve Hande, ODOT District 3 (Salem) Dave Polly, ODOT Roadway Section Tom Satchell, ODOT Construction – Pavement Unit Kevin Haas, ODOT Traffic Engineering Services Dawn Anderson, ODOT Office of Maintenance Darrin Neavoll, ODOT District 7 (Roseburg)
The authors would also like to thank the members of the ODOT Research Unit for their sage advice and technical assistance in the data analysis and preparation of this report.
DISCLAIMER This document is disseminated under the sponsorship of the Oregon Department of Transportation and the United States Department of Transportation in the interest of information exchange. The State of Oregon and the United States Government assume no liability of its contents or use thereof. The contents of this report reflect the views of the author(s) who are solely responsible for the facts and accuracy of the material presented. The contents do not necessarily reflect the official views of the Oregon Department of Transportation or the United States Department of Transportation. The State of Oregon and the United States Government do not endorse products of manufacturers. Trademarks or manufacturers’ names appear herein only because they are considered essential to the object of this document. This report does not constitute a standard, specification, or regulation.

iv

v
EVALUATION OF DEICER APPLICATIONS ON OPEN GRADED PAVEMENTS
TABLE OF CONTENTS
1.0 INTRODUCTION..................................................................................................................1 1.1 PROBLEM DESCRIPTION................................................................................................1 1.2 OBJECTIVES OF THE STUDY.........................................................................................2
2.0 LITERATURE REVIEW .....................................................................................................3
3.0 SURVEY OF STATE DOT AGENCIES.............................................................................7 3.1 RESULTS OF THE SURVEY ............................................................................................7
4.0 TESTING PROCEDURES ...................................................................................................9 4.1 SKID RESISTANCE TEST ................................................................................................9 4.2 DEICER APPLICATIONS................................................................................................10
4.2.1 Winter anti-icing/deicing liquids at work..................................................................10 4.3 TEST SITES AND TESTING PLAN................................................................................12 4.4 SKID TESTS AS PERFORMED BY ODOT PAVEMENTS UNIT ................................14 4.5 TEST DATA COLLECTION............................................................................................14
5.0 SKID TEST RESULTS .......................................................................................................17 5.1 FHWA FRICTION NUMBER VALUES .........................................................................17
5.1.1 Definition of roadway segments................................................................................18 5.2 OREGON ROUTE 138 - NORTH UMPQUA HIGHWAY..............................................19 5.3 OREGON ROUTE 22 - NORTH SANTIAM HIGHWAY...............................................21
5.3.1 OR 22 open graded pavement ...................................................................................21 5.3.2 OR 22 dense graded pavement ..................................................................................23
6.0 CONCLUSIONS ..................................................................................................................25
7.0 REFERENCES.....................................................................................................................27
APPENDICES APPENDIX A: STATE DOT SURVEY QUESTIONNAIRE APPENDIX B: STATE DOT SURVEY RESULTS

vi
List of Figures Figure 4.1: Tow truck and skid test trailer...................................................................................................................10 Figure 4.2: Deicer truck...............................................................................................................................................11 Figure 4.3: Computer inside deicer truck ....................................................................................................................11 Figure 4.4: Sections tested on OR 138 ........................................................................................................................12 Figure 4.5: Sections tested on OR 22 ..........................................................................................................................13 Figure 5.1: Typical Oregon road section geometry .....................................................................................................18 Figure 5.2: Skid test results on OR 138 open-graded pavement..................................................................................20 Figure 5.3: Skid test results on OR 138 dense-graded pavement ................................................................................21 Figure 5.4: Skid test results on OR 22 open-graded pavement....................................................................................22 Figure 5.5: Skid test results on OR 22 dense-graded pavement ..................................................................................23
List of Tables
Table 4.1: Skid test sites ............................................................................................................................................12 Table 4.2: Skid tests performed on test sections .....................................................................................................14 Table 4.3: Skid test computer recording sample.....................................................................................................15 Table 4.4: Friction Number guidelines for highway segments (Meyer 1982) .......................................................17

1
1.0 INTRODUCTION
1.1 PROBLEM DESCRIPTION
The Oregon Department of Transportation (ODOT) winter maintenance practices include plowing, sanding, and applying winter anti-icing/deicing liquids. The combination of practices used at each site may vary to accommodate the different climate, traffic, and storm conditions encountered. The following is a brief description of each one of the ODOT maintenance practices:
1. Plowing: use of snowplows and other equipment to remove snow and ice from bridges and roads.
2. Sanding: application of material (various sizes of gravel or cinders) specified for each area on hills, curves, and bridges to improve vehicle traction.
3. Anti-icing/deicing: liquid products are used in several ways: • To help prevent snow and ice from sticking to the road surface (anti-icing). • To melt snow and ice on the road surface (deicing). • In conjunction with sand to help the sand stick to icy roads (pre-wetting sand).
The scope of this research was to study the effects of winter liquid anti-icing/deicing products on open-graded pavements. ODOT may use one of the following types of winter anti-icing/deicing liquids:
1. Magnesium chloride: • Contains a corrosion inhibitor to reduce impacts to vehicles. • Works well at very cold temperatures. • Fairly inexpensive.
2. Calcium magnesium acetate: • Acetic acid (strong vinegar) mixed with lime. • Less corrosive than tap water. • Does not work well at very cold temperatures. • Moderately expensive.
The anti-icing/deicing liquids used by ODOT are selected for their ability to meet the needs of Oregon’s various temperature, weather, and environmental conditions. These chemicals may be applied to the road surface in order to lower the freezing temperature of water and to prevent ice and snow from forming a bond to the roadway surface. Application of these chemicals is usually for one of three purposes:
1. Anti-icing: The product is applied to the road before a storm to reduce the buildup of snow and ice, to prevent the ice or snow from forming a bond to the roadway surface and to help in removal of the snow or ice after the storm.

2
2. Deicing: The product is applied to a layer of ice or snow that is on the road. This will assist in melting the ice or snow.
3. Pre-wetting: The product is mixed into sanding materials. This makes the sanding material stick to the ice or snow, and helps to prevent traffic from blowing the sanding material off the road.
The use of winter maintenance chemicals has been an effective tool in helping ODOT maintain passable roads during winter weather. Their use can reduce the need for sanding material that may be harmful to environmentally sensitive areas. Because of the benefits to both the public and the environment, ODOT has expanded its winter maintenance chemical program statewide over the past several years.
During the winters of 2002 and 2003, several accidents occurred on ODOT highways constructed with open-graded pavement, after winter maintenance chemicals had been applied. The people involved in these accidents believed that the application of deicers on the surface of the road may have reduced the friction of the surface, creating a hazardous traction condition. This change was not observed on nearby stretches of road, constructed of dense-graded material. This alleged change in road surface friction condition was believed to occur throughout the state, specifically on open-graded pavement. Open-graded pavement represents approximately 21 percent of all ODOT road miles.
Thus a research project was undertaken to skid test segments of highway treated with deicer, in order to examine their friction characteristics.
1.2 OBJECTIVES OF THE STUDY
The objective of this study was to evaluate the effects of magnesium chloride on the friction characteristics of open-graded pavement, to determine if its use is associated with any changes in the road surface traction that result in slick conditions. The information gained from this study would be used to help ODOT evaluate and modify winter maintenance practices, if necessary, to ensure the safety of the traveling public.
3
2.0 LITERATURE REVIEW
The literature review involved an extensive review of available studies, reports, and records documenting road surface friction associated with the use of winter maintenance chemicals.
There is a large body of research on anti-icing and deicing chemicals. These studies deal with issues such as the types of salt to use, how much to use, where to store it, and how to store it. There is also a body of literature dealing with open-graded pavements and their effectiveness during the winter season. However, there are very few research publications that combine the two in order to study their relationship. No research was found that specifically addresses the question of whether deicer applications on pavements are associated with a reduction in the coefficient of friction of the road surface.
The earliest study found on deicing applications on open-graded pavements (OGP) was conducted during the 1976-1977 winter season (Besselievre 1979). The Federal Highway Administration sponsored four studies which were designed to determine if more salt was needed to clear open-graded asphalt surfaces during winter storms than was needed to clear dense-graded asphalt pavements. The four states that participated in the study were Maine, Michigan, Utah, and Vermont. Maine, Michigan, and Utah were to observe the application rates necessary to clear the snow and ice from two open-graded pavement sections and two dense-graded control sections. Vermont was to do the same observation on one open-graded section and one control section.
Following is a brief summary of their findings:
1. Maine found that the amount of salt needed to effectively clear the snow or ice on open-graded pavement was practically the same as the amount needed to clear dense-graded pavement.
2. Michigan almost concurred with Maine’s findings, except that they found that slightly less salt per storm was needed on an open-graded pavement than was needed on a dense-graded pavement.
3. Vermont concluded that it took less salt and less sand to keep open-graded pavement in safe driving conditions than it did on dense-graded pavement.
4. In contrast to the other three states, Utah observed that more salt was needed to clear open-graded pavements.
Although the findings from the different states differed, three out of four found that more salt was not needed to maintain an equal level-of-service on open-graded asphalt pavements during a winter season than was needed on dense-graded pavements. The applications rates required to clear road surfaces on OGP and dense-graded pavements appeared to be the about the same. One cannot conclude, however, that this finding implies that the two pavements behave the same during deicing applications. Traffic behavior and skid tests suggest that the skid resistance characteristics of OGP are regularly superior to those found on dense-graded pavements during
4
winter storms. Although the snow-filled voids of an OGP surface may give a slippery appearance, the protruding aggregates on the mix provide a skid-resistant surface.
Research conducted in Japan compared the performance of OGP with “conventional” or dense-graded asphalt pavement under wintry conditions (Iwata, et al. 2002). The study concluded that accidents may be reduced under snowy and icy conditions due to the higher friction found on the surface of the OGP. It was also concluded that there is no significant difference between OGP and dense-graded asphalt pavement in terms of road surface characteristics such as road surface temperature, road surface conditions, effect of anti-skidding chemicals and skid resistance. Therefore, no major modifications were required to the existing road maintenance method for the winter season.
In contrast to these studies, research conducted in Belgium by Heystraeten and Diericx (2002) found that under wintry conditions OGP surfaces do not behave like conventional closed surfaces for the following reasons:
1. Moisture is entrapped almost permanently in the pores in winter and may in some cases lead to solid condensation at the road surface;
2. The porosity of OGP prevents salts spread for an anti-icing or deicing purpose from staying active on the surface; and
3. Their lower thermal conductivity causes their surface temperature to drop more sharply and severely under certain climatic conditions. As a result, this study found that larger amounts of conventional deicing salts have to be spread to keep the roads clear from ice.
The study cites the need for deicing salts that are more appropriate on open-graded road surfaces. The report goes on to present possible solutions, such as the following: to use a mixture of 1/3 calcium chloride and 2/3 coarse sodium chloride grains that are up to 5 mm (0.2 in) in size.
The most recent research on this topic was published by the Virginia Transportation Research Council (VTRC) (Flintsch 2004). It was a joint effort by VTRC and the University of Virginia. The goal of this research was to study “the relative functional performance” of five hot-mix asphalt (HMA) surfaces and a Portland Cement Concrete (PCC) highway surface during controlled wet and wintry weather conditions. The measures of performance included skid resistance. The study compared how these surfaces responded to different deicing and anti-icing snow removal and ice control practices under artificial wintry conditions.
The roadway test sections were subjected to anti-icing and deicing chemical applications and then skid tested. The discussion of the results as found in the publication is a follows:
The plots appear to indicate that none of the sections showed a significant difference in performance under the treatments applied. Furthermore, the plots also reinforce the fact that there were no clear differences between the test and control lanes, which indicates that the treatments applied in the test section were not effective. This happened in spite of the fact that, in several of the tests, the chemical application was higher than what is normally used by VDOT maintenance crews.

5
The maintenance treatments’ inability to improve the condition of the road is suspected to be due to the quality of the snow. The snowmaking equipment produced an artificial snow that may have been too wet for this type of testing; while normal snow has an equivalent water coefficient of 1:10 (1 in. of equivalent water for every 10 in. of snow), the water equivalent for the artificial snow was, on average, approximately 1:4. The extra amount of water could have diluted the chemicals and reduced their effectiveness. Snow produced on a very cold day while testing the towers had a visual quality very similar to that of natural snow. However, such low temperatures were not reached during any of the experiments.
Another factor that may have had a negative impact is the limited amount of traffic applied; the traffic applied may have not been enough to facilitate the dilution of the chemical and the formation of a liquid layer with a low condensation point that would prevent the bonding between the pavement and the packed snow. However, the research team felt that the traffic applied did not differ substantially from that of a typical rural road in Virginia during a winter storm (Flintsch 2004).
The author recommends additional experiments to evaluate the skid resistance of OGP under natural winter driving conditions, using the same methodology they developed in this experiment.
Thus, while some studies suggest that open-graded pavements compare favorably to dense-graded pavements in freezing conditions and deicer treatments, at least one (Heystraeten and Diericx 2002) suggests that OGP surfaces require different deicer treatment in order to maintain desirable friction characteristics. No study indicated any tendency for OGP surfaces to exhibit lower friction from the application of deicer chemicals.

6

7
3.0 SURVEY OF STATE DOT AGENCIES
In addition to a review of other research, a survey of state transportation agencies was also conducted, to document any experiences they may have had with the effects of deicer chemicals on pavements. A brief questionnaire, consisting of seven questions, was sent by e-mail to all contacts on the American Association of State Highway and Transportation Officials (AASHTO) Research Advisory Committee (RAC) list – about 60 agencies in total. The e-mail requested that the RAC member forward the questionnaire to the most appropriate personnel, such as someone in the agency’s maintenance force.
The principal questions in the survey asked: 1) whether the agency had received any complaints, concerns, warnings or comments (formal or informal) regarding negative effects of anti-icer chemicals when applied to open-graded asphalt surfaces; 2) whether there had been any incidents or accidents after an application of anti-icer on open-graded asphalt roads; and 3) whether the agency had conducted any research related to this issue. A copy of the questionnaire is included in Appendix A.
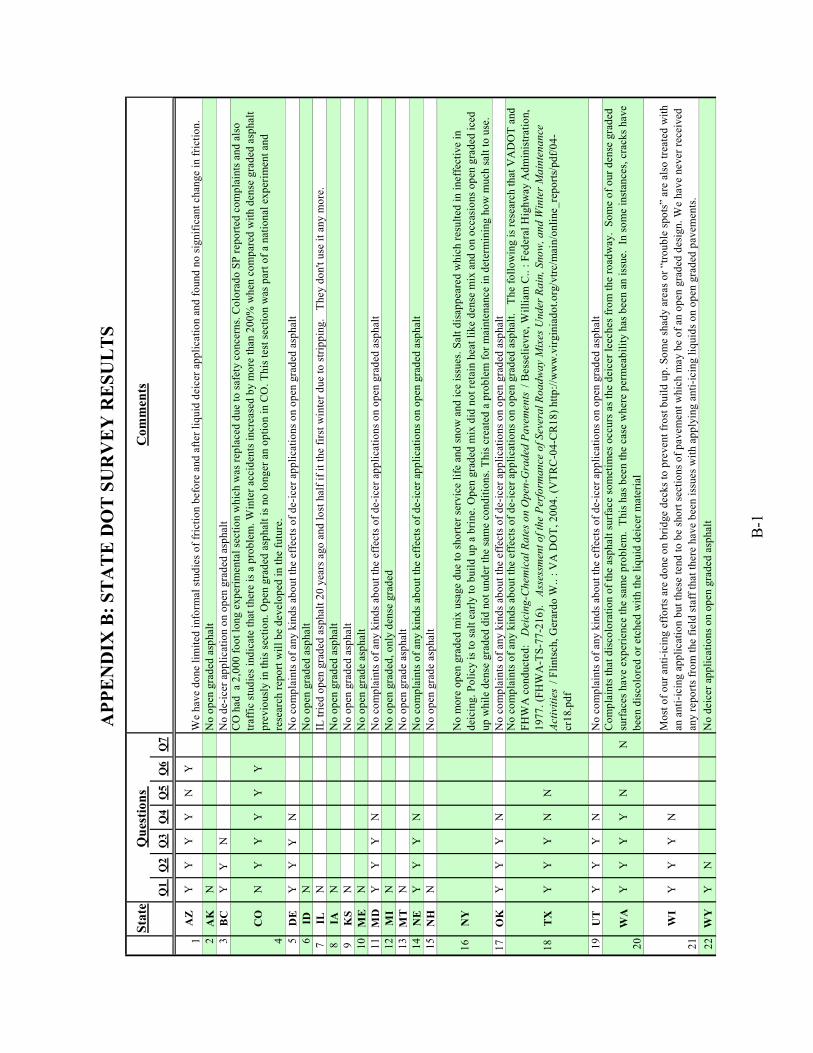
3.1 RESULTS OF THE SURVEY
The results of the survey are shown in Appendix B. A total of 22 state transportation agencies responded to the survey. Half of the respondents indicated that they had open-graded asphalt road sections in their states. Most of those (9 out of 11) said they use anti-icers or deicers on open-graded pavements during the winter season. Only three states (Colorado, Arizona and Washington) reported receiving any complaints or comments about negative effects of deicer applications on open-graded pavements.
The Colorado DOT alluded to a problem with increased winter accidents on an open-graded section. Further investigation revealed that the open-graded pavement was reported to show a greater tendency to freeze than nearby dense-graded sections. No accidents, however, were specifically linked to the application of deicer on open-graded asphalt.
The Arizona DOT indicated they had done some limited friction testing of the road surface before and after liquid deicer applications and found no significant changes.
The complaints reported by the Washington DOT were related to discoloration of the asphalt. This problem was not mentioned by any other respondent.

8

9
4.0 TESTING PROCEDURES
4.1 SKID RESISTANCE TEST
The procedure for the skid resistance test is outlined in the ODOT Pavement Services Unit 2004 Friction Testing Report (ODOT 2004):
The testing vehicle is a K.J. Law locked-wheel pavement friction tester, consisting of a tow vehicle and a trailer (Figure 4.1). The tow vehicle is a one ton heavy-duty pickup truck equipped with a 300 gallon water tank and a computer console that collects, calculates, and stores the dynamic Friction Numbers. A transducer, which is mounted on the axle of the trailer, measures the horizontal tractive force and the dynamic vertical load on the left wheel.
The friction test equipment is calibrated prior to the start of each testing season at ODOT’s Salem repair facility, using an air platform. The platform load cell verifies that the test system accurately measures tractive and load forces while a range of horizontal forces are applied to the skid trailer. Every three years the skid test trailer is taken to the Texas Transportation Institute’s (TTI) Central/Western Field Test and Evaluation Center for calibration. The friction test equipment is evaluated and calibrated for accuracy of its force measurement system and velocity measurement system, and for its water flow rate and distribution. The calibration platform is also checked at this time. A correlation to the National Reference Standard is performed using the test center's Reference System. ODOT's friction testing system was calibrated at TTI in April 2003.
Friction testing is done in the left wheel path of the right lane of travel. The test tire used is as specified in the American Society for Testing and Materials (ASTM) E 501, Specification for Standard Rib Tire for Pavement Skid-Resistance Tests (ASTM 2004b). The test vehicle is brought to the desired speed of 40 mph ±1 mph (or the posted speed limit, if less than 40 mph). Water is delivered ahead of the test tire and the braking system is activated to lock the test tire. The tractive and load forces on the test wheel are measured and averaged for one second while the wheel is locked. The “Friction Number” is then calculated by dividing the tractive force by the load and multiplying the result by 100. These tests are performed in accordance with ASTM E 274, Standard Test Method for Skid Resistance of Paved Surfaces Using a Full-Scale Tire (ASTM 2004a).

10
Figure 4.1: Tow truck and skid test trailer
4.2 DEICER APPLICATIONS
Anti-icing/deicing liquids are selected for their ability to meet the needs of various temperature, weather, and environmental conditions. Winter anti-icing/deicing liquids are used as tools to improve safety, improve the efficiency of time spent plowing, and address environmental concerns resulting from other methods of snow removal. States that have used winter anti-icing/deicing liquids have had reductions in wintertime motor vehicle crashes. Additionally, the anti-icing/deicing liquids can be cheaper than sanding and may reduce the amount of time spent plowing.
4.2.1 Winter anti-icing/deicing liquids at work
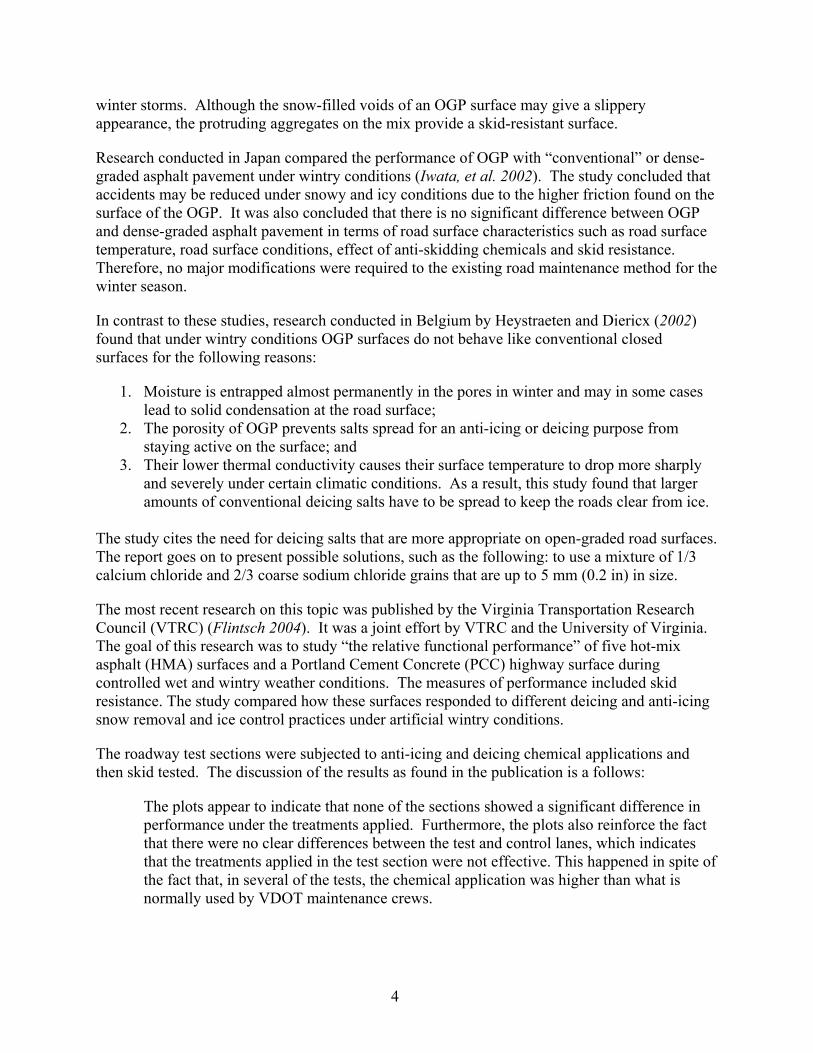
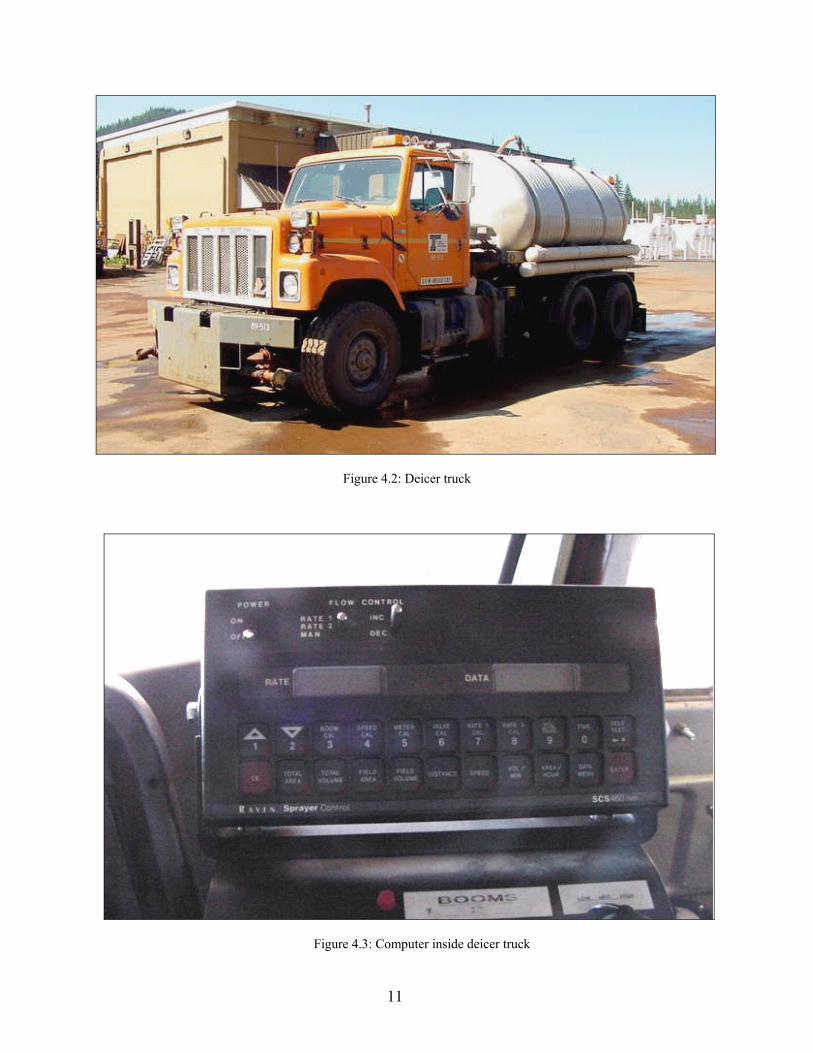
Winter anti-icing/deicing liquids are applied to the road in order to lower the freezing temperature of water and to prevent ice and snow from forming a bond to the roadway surface. These products are applied to the road by using trucks equipped with tanks, pumps, and spray bars and nozzles, as shown in Figure 4.2. The product application rates typically range from 15 gallons per lane mile to 50 gallons per lane mile. Application rates are determined by the current road conditions and the anticipated weather and road conditions. These rates are controlled using a computer located inside the truck (Figure 4.3).
11
Figure 4.2: Deicer truck
Figure 4.3: Computer inside deicer truck

12
4.3 TEST SITES AND TESTING PLAN
To determine changes in friction values due to the use of winter maintenance chemicals, the ODOT Pavements Unit planned a series of skid tests on open- and dense-graded pavement types under various conditions. Two sites were selected for testing:
• North Umpqua Highway (OR 138), between milepost 10 and 24; and
• North Santiam Highway (OR 22), between milepost 17 and 19.
Each site had roadway sections of both open-graded and dense-graded asphalt pavement within close geographic proximity to each other; thus the two types of pavement were subject to similar environmental conditions. The test sections designated at each site are shown in Table 4.1.
Table 4.1: Skid test sites
Test Site Location Pavement Type MP 18.0 – 21.0, eastbound MP 21.0 – 24.0, eastbound Dense Graded
MP 10.0 – 13.0, eastbound OR 138 – North Umpqua Hwy
MP 13.0 – 16.0, eastbound Open Graded
MP 17.0 – 18.0, eastbound MP 18.0 – 19.0, eastbound Dense Graded
MP 19.0 – 18.0, westbound OR 22 - North Santiam Hwy
MP 18.0 – 17.0, westbound Open Graded
The map in Figure 4.4 below shows the approximate starting and ending mile points on Highway OR 138 where skid tests were conducted with deicer.
Figure 4.4: Sections tested on OR 138
MP 10
MP 16MP 18
MP 24

13
The map in Figure 4.5 shows the approximate location on OR 22 where skid tests were conducted with deicer.
Figure 4.5: Sections tested on OR 22
The testing plan included the following steps:
1. First baseline skid tests: to be conducted at the end of summer on each test section.
2. Second baseline skid tests: to be conducted after the first fall rain (¼ inch of precipitation or more) on each test section.
3. Early winter skid tests: to be conducted between 30 minutes and two hours after treatment of each pavement type at each site with deicer at 30 gallons per lane mile on one section and 15 gallons per lane mile on the other.
MP 17
MP 19

14
4. Late winter skid tests: to be conducted between 30 minutes and two hours after treatment of each pavement type at each site with deicer at 30 gallons per lane mile on one section and 15 gallons per lane mile on the other.
4.4 SKID TESTS AS PERFORMED BY ODOT PAVEMENTS UNIT
The fall and winter seasons of 2004-2005 were very atypical. As the skid test crew was preparing to do the baseline testing in early September 2004, when rainfall was not expected, the weather pattern changed, resulting in an early rainfall. Thus the first baseline testing prior to any rainfall did not take place. In addition, the early winter season was unseasonably warm, preventing this testing step from occurring as well. Thus the weather changes forced the crew performing the skid testing to deviate from the original plan.
Although the original plan could not be fulfilled, the testing crew took advantage of the fact that the Highway 22 test site had a dense-graded pavement in the eastbound lane and an open-graded pavement in the westbound lane along the same stretch of highway. On the same day that the deicer applications were tested on each pavement type, the crew also collected baseline data for direct comparison with the deicer application data. Thus the data collected for this study are based on the skid tests shown in Table 4.2.
Table 4.2: Skid tests performed on test sections
Test Site
Location Pavement Type
Summer Baseline Skid Test
Fall 1st Rain Baseline Skid Test
Early Winter deicer
Application
Late Winter deicer
Application
Late Winter Baseline
MP 18.0 – 21.0, eastbound
Dense Graded Not done Tested Not done 15 gal. per
lane mile
MP 21.0 – 24.0, eastbound
Dense Graded Not done Tested Not done 30 gal. per
lane mile
MP 10.0 – 13.0, eastbound
Open Graded Not done Tested Not done 15 gal. per
lane mile
OR
138
– N
orth
U
mpq
ua H
wy
MP 13.0 – 16.0, eastbound
Open Graded Not done Tested Not done 30 gal. per
lane mile
MP 17.0 – 18.0, eastbound
Dense Graded Not done Tested Not done 15 gal. per
lane mile Tested
MP 18.0 – 19.0, eastbound
Dense Graded Not done Tested Not done 30 gal. per
lane mile Tested
MP 19.0 – 18.0, westbound
Open Graded Not done Tested Not done 15 gal. per
lane mile Tested
OR
22
- Nor
th
Sant
iam
Hw
y
MP 18.0 – 17.0, westbound
Open Graded Not done Tested Not done 30 gal. per
lane mile Tested
4.5 TEST DATA COLLECTION
In order to better understand the data, it is necessary to briefly explain how this data is collected. When the skid trailer has been calibrated and is ready for testing, the computer is then set to lock the left wheel every 1/10th of a mile. (See section 5.1.) Once the truck is in motion, it tries to maintain a constant speed of 40 mph. Thus, every time the skid trailer wheel locks, the computer

15
reads and records the Friction Number (FN), the mile point (MP), the speed of the truck, and other data. A recording from the computer includes the data shown in Table 4.3 below.
Table 4.3: Skid test computer recording sample Hwy MP Direction Lane Date Wheel
pathFriction Number
Speed (MPH)
Temperature ( ºF )
Time
073 10.00 EB right 9/20/2004 left 50.7 40.1 68 17:17073 10.10 EB right 9/20/2004 left 50.4 40.3 68 17:18073 10.20 EB right 9/20/2004 left 51.1 40.4 68 17:18073 10.30 EB right 9/20/2004 left 51.3 40.4 68 17:18073 10.40 EB right 9/20/2004 left 50.1 40.4 68 17:18073 10.50 EB right 9/20/2004 left 52.1 40.1 68 17:18073 10.60 EB right 9/20/2004 left 47.2 40.3 68 17:18073 10.70 EB right 9/20/2004 left 50.5 40.3 68 17:18073 10.80 EB right 9/20/2004 left 49.2 40.4 68 17:19073 10.90 EB right 9/20/2004 left 49.0 40.4 68 17:19073 11.00 EB right 9/20/2004 left 51.5 40.4 68 17:19
Once the data was collected by the computer, it was transferred to a spreadsheet application. It was then plotted and analyzed to compare the Friction Numbers recorded for different treatment conditions. The skid test results for each test section are discussed in the next chapter.

16
17
5.0 SKID TEST RESULTS
5.1 FHWA FRICTION NUMBER VALUES
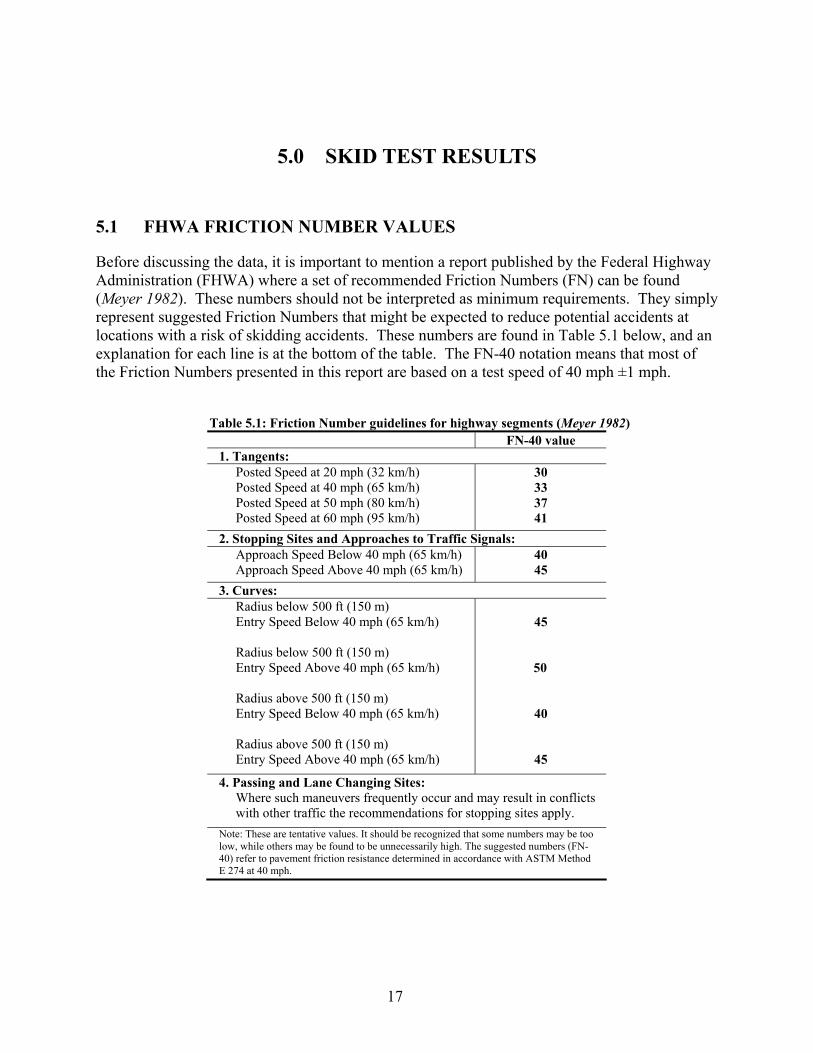
Before discussing the data, it is important to mention a report published by the Federal Highway Administration (FHWA) where a set of recommended Friction Numbers (FN) can be found (Meyer 1982). These numbers should not be interpreted as minimum requirements. They simply represent suggested Friction Numbers that might be expected to reduce potential accidents at locations with a risk of skidding accidents. These numbers are found in Table 5.1 below, and an explanation for each line is at the bottom of the table. The FN-40 notation means that most of the Friction Numbers presented in this report are based on a test speed of 40 mph ±1 mph.
Table 5.1: Friction Number guidelines for highway segments (Meyer 1982) FN-40 value 1. Tangents:
Posted Speed at 20 mph (32 km/h) Posted Speed at 40 mph (65 km/h) Posted Speed at 50 mph (80 km/h) Posted Speed at 60 mph (95 km/h)
30 33 37 41
2. Stopping Sites and Approaches to Traffic Signals: Approach Speed Below 40 mph (65 km/h) Approach Speed Above 40 mph (65 km/h)
40 45
3. Curves: Radius below 500 ft (150 m) Entry Speed Below 40 mph (65 km/h) Radius below 500 ft (150 m) Entry Speed Above 40 mph (65 km/h) Radius above 500 ft (150 m) Entry Speed Below 40 mph (65 km/h) Radius above 500 ft (150 m) Entry Speed Above 40 mph (65 km/h)
45
50
40
45
4. Passing and Lane Changing Sites: Where such maneuvers frequently occur and may result in conflicts with other traffic the recommendations for stopping sites apply.
Note: These are tentative values. It should be recognized that some numbers may be too low, while others may be found to be unnecessarily high. The suggested numbers (FN-40) refer to pavement friction resistance determined in accordance with ASTM Method E 274 at 40 mph.
18
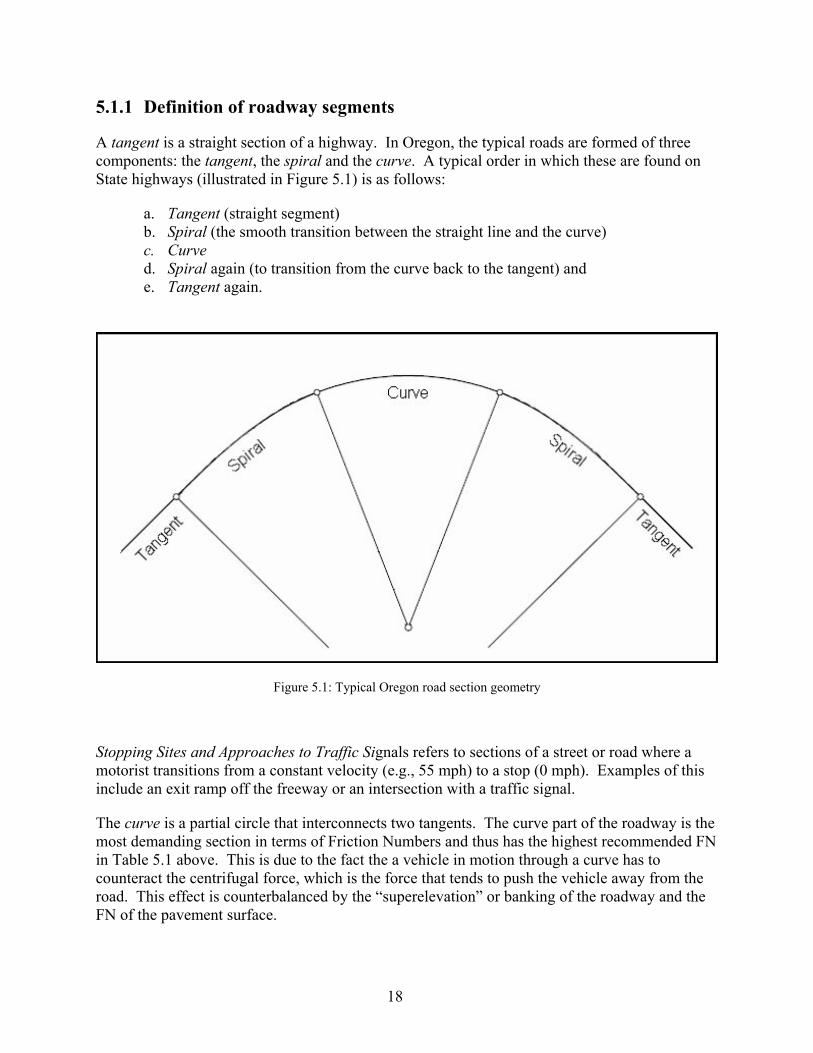
5.1.1 Definition of roadway segments
A tangent is a straight section of a highway. In Oregon, the typical roads are formed of three components: the tangent, the spiral and the curve. A typical order in which these are found on State highways (illustrated in Figure 5.1) is as follows:
a. Tangent (straight segment) b. Spiral (the smooth transition between the straight line and the curve) c. Curve d. Spiral again (to transition from the curve back to the tangent) and e. Tangent again.
Figure 5.1: Typical Oregon road section geometry
Stopping Sites and Approaches to Traffic Signals refers to sections of a street or road where a motorist transitions from a constant velocity (e.g., 55 mph) to a stop (0 mph). Examples of this include an exit ramp off the freeway or an intersection with a traffic signal.
The curve is a partial circle that interconnects two tangents. The curve part of the roadway is the most demanding section in terms of Friction Numbers and thus has the highest recommended FN in Table 5.1 above. This is due to the fact the a vehicle in motion through a curve has to counteract the centrifugal force, which is the force that tends to push the vehicle away from the road. This effect is counterbalanced by the “superelevation” or banking of the roadway and the FN of the pavement surface.
19
As Table 5.1 above clearly shows, a small curve radius in combination with a high speed demands a high FN to counteract the centrifugal force. In a situation where the radius is large and the speed is not very high, the FN needed to keep the vehicle on the road will be lower.
5.2 OREGON ROUTE 138 - NORTH UMPQUA HIGHWAY
Road surface friction may be a function of many variables. Temperature, moisture, and humidity are but a few of the variables that affect it. At a given location, if a skid test is done on a dry morning, the Friction Number will differ from that of a skid test performed on the same day on a rainy afternoon. Likewise, seasons also play an important role in surface friction. At the Oregon Route 138 test site the baseline data and the deicer application data were recorded almost 6 months apart in different seasons and under different climate situations. Therefore, to make any comparisons between the baseline data and the deicer application data is problematic. Nevertheless, some useful observations can be made.
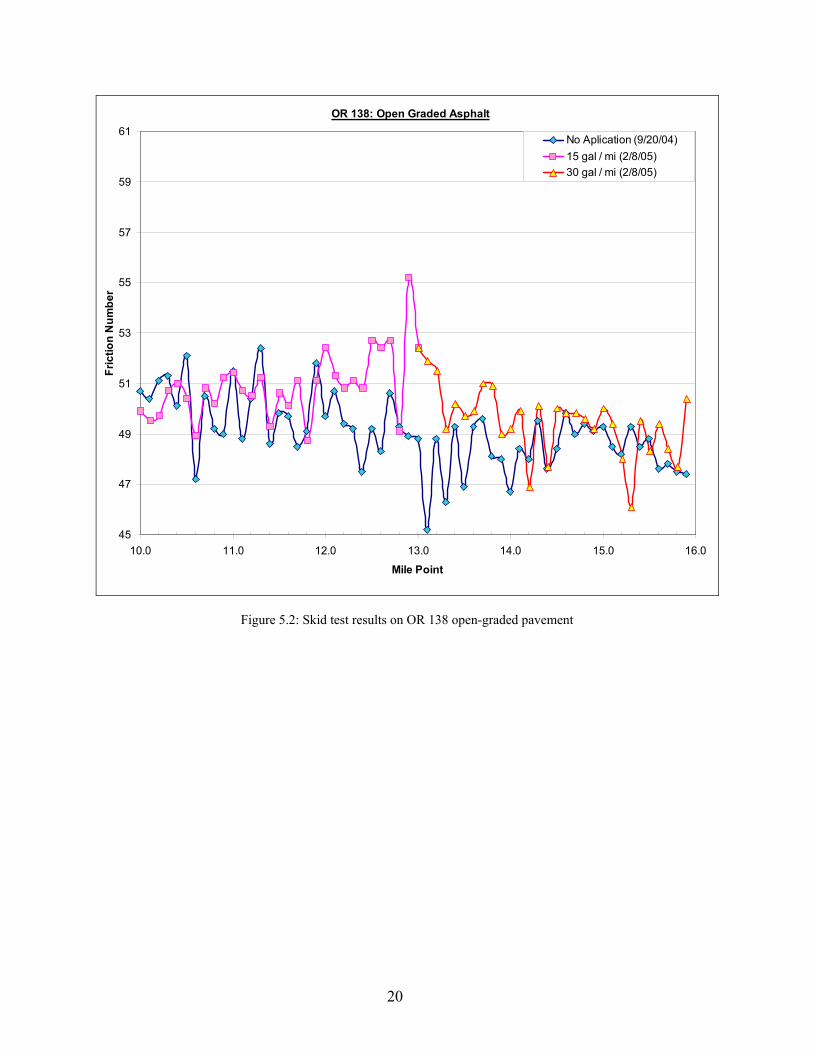
The graphs in Figures 5.2 and 5.3 show the comparison of the Friction Numbers recorded on the open-graded pavement sections and dense-graded sections, respectively. The following observations can be made:
1. The Friction Numbers did not appear to be strongly affected by the two different deicer application rates, 15 gallons/lane mile vs. 30 gallons/lane mile.
2. The Friction Numbers tended to be greater when the deicer was applied, regardless of the application rate, compared with the Friction Numbers recorded without any deicer application.
20
OR 138: Open Graded Asphalt
45
47
49
51
53
55
57
59
61
10.0 11.0 12.0 13.0 14.0 15.0 16.0
Mile Point
Fric
tion
Num
ber
No Aplication (9/20/04)15 gal / mi (2/8/05)30 gal / mi (2/8/05)
Figure 5.2: Skid test results on OR 138 open-graded pavement

21
OR 138: Dense Graded Asphalt
45
47
49
51
53
55
57
59
61
18.0 19.0 20.0 21.0 22.0 23.0 24.0
Mile Point
Fric
tion
Num
ber
No Application (9/20/04)15 gal / mi (2/8/05)30 gal / mi (2/8/05)
Figure 5.3: Skid test results on OR 138 dense-graded pavement
5.3 OREGON ROUTE 22 - NORTH SANTIAM HIGHWAY
5.3.1 OR 22 open graded pavement
As indicated in Section 4.4, baseline skid resistance tests were performed in the fall of 2004. However, since baseline readings were also taken at the same time as the deicer applications, these baseline readings were the ones used in examining the data from the Oregon Route 22 test site, in order to consider only the data that was collected under similar conditions and on the same date. Figure 5.4 shows a comparison of the baseline data with the two deicer application rates. It also includes the three FHWA guidelines discussed in Section 5.1.

22
OR 22 WB : Open Graded Pavement
0
10
20
30
40
50
60
17 18 19
Mile Point
Fric
tion
Num
ber
30 gallon / mile Application (2/7/05)
15 gallon / mile Application (2/7/05)
No Application Left Lane (2/7/05)
Tangent (60 MPH)
Curves (radius<500 ft)
Stopping Sites & Intersection Approaches(Above 40 MPH)
Figure 5.4: Skid test results on OR 22 open-graded pavement
The graph shows that the difference in skid resistance when different rates of deicer are applied is slight. In addition, following the same pattern as the one found at the OR 138 test site, the application of deicer on open-graded pavement appears to slightly increase the friction factor, providing more friction between the tire and the surface of the road.
The average FN value at 15 gallons per lane mile was 57.97, while the average FN value at 30 gallons per mile was 58.55. These are only slightly greater than the no-application average FN value of 55.20. All of these values are noticeably higher than the FHWA guidelines for tangents, curves and stopping sites.

23
5.3.2 OR 22 dense graded pavement
Figure 5.5 shows a comparison of the baseline data with the two deicer application rates on the dense-graded section of OR 22. It also includes the three FHWA guidelines discussed in Section 5.1.
OR 22 EB : Dense Graded Pavement
0
10
20
30
40
50
60
17 18 19
Mile Point
Fric
tion
Num
ber
15 gallon / mile Application (2/7/05)
30 gallon / mile Application (2/7/05)
No Application Left Lane (2/7/05)
Tangent (60 MPH)
Curves (radius < 500 ft)
Stopping Sites & Intersection Approaches (Above 40 MPH)
Figure 5.5: Skid test results on OR 22 dense-graded pavement
As with the open-graded section, the amount of deicer application had little if any effect on the friction values on the dense-graded section of road. The average FN value at 15 gallons per lane mile was 59.55, while the average FN value at 30 gallons per mile was 58.58. These show little difference from the no-application average FN value of 60.22. Again, all of these values are markedly higher than the FHWA guidelines for tangents, curves and stopping sites.

24

25
6.0 CONCLUSIONS
The question addressed by this study was whether the friction characteristics of open-graded pavement were affected by the liquid magnesium chloride ODOT uses in its winter road maintenance program. While the planned data collection was prevented by unexpected weather conditions, the study did produce a limited set of data. The data from one test site allowed for a direct comparison of friction values when no deicer was applied and with two levels of deicer application, both on open-graded pavement and on dense-graded pavement.
From this limited set of data, the only clear-cut conclusion that can be drawn is that all of the field-measured friction values – baseline and two deicer application levels – were well above the FHWA guidelines for pavement friction. The data suggested that the deicer applications had little if any effect on either the open-graded or the dense-graded pavement friction. Given the number of variables that might affect the behavior of the deicer on the pavement, however, the data were insufficient to conclusively determine whether the friction of the open-graded pavement was affected by the application of magnesium chloride.
Since it is not entirely clear what all the variables are that may influence how deicer affects the skid resistance on open-graded pavement, it is recommended that future research be designed in a way that the variables which contribute to deicer characteristics and pavement friction can be better controlled. A study in a lab or in a controlled field environment is advised. One place for such a study could be the Virginia Smart Road.1 A carefully controlled test of various application levels of deicer on open-graded pavement could be carried out at such a location.
1 A joint project of Virginia Department of Transportation, Virginia Tech’s Transportation Institute and Federal Highway Administration, located in Montgomery County, Virginia.

26

27
7.0 REFERENCES
American Society for Testing and Materials. E 274-97 Standard Test Method for Skid Resistance of Paved Surfaces Using a Full-Scale Tire. Annual Book of ASTM Standards, Volume 04.03. American Society for Testing and Materials. West Conshohocken, PA. 2004a.
American Society for Testing and Materials. E 501-94 Specification for Standard Rib Tire for Pavement Skid-Resistance Tests. Annual Book of ASTM Standards, Volume 04.03. American Society for Testing and Materials. West Conshohocken, PA. 2004b.
Besselievre, William C. “Deicing chemical rates on open-graded pavements.” Snow Removal and Ice Control Research. TRB Special Report 185. Transportation Research Board. Washington, DC. 1979.
Flintsch Gerardo W. Assessment of the performance of several roadway mixes under rain, snow, and winter maintenance activities. Report No. VTRC 04-CR18. Virginia Transportation Research Council. Charlottesville, VA. February 2004.
Heystraeten, G.V. and R. Diericx. “A rapid and effective deicing agent for open-graded road surfacings.” New Challenges for Winter Road Service. XIth PIARC International Winter Road Congress Conference. Sapporo, Japan. 2002.
Iwata, H., T. Watanabe, and T. Saito. “Study on the performance of porous asphalt pavement on winter road surface conditions.” New Challenges for Winter Road Service. XIth PIARC International Winter Road Congress Conference Sapporo, Japan. 2002.
Meyer, W. E. Synthesis of frictional requirements research. Report No. FHWA-RD-81-159. Federal Highway Administration. Washington, DC. Pages 83-84. June 1982.
Oregon Department of Transportation. 2004 Friction Testing Report. Oregon Department of Transportation, Construction Section, Pavement Management Group. January 4, 2004.


APPENDICES


A-1
APPENDIX A: STATE DOT SURVEY QUESTIONNAIRE 1. Does your highway system have any open-graded asphalt segments?
YES_________ NO__________ (If you answer NO, there is no need to continue with this questionnaire) 2. Does your maintenance force use any form of de-icers or anti-icers on highways during the winter
season?
YES_________ NO__________ (If you answer NO, there is no need to continue with this questionnaire) 3. Does your maintenance department use anti-icer on open-graded asphalt during the winter season?
YES_________ NO__________ (If you answer NO, there is no need to continue with this questionnaire) 4. Have you received any complaints, concerns, warnings or comments (formal or informal) regarding
negative effects of anti-icer when applied to open-graded asphalt surfaces?
YES_________ NO__________ (If you answer NO, there is no need to continue with this questionnaire) 5. Has there been any incidents or accidents after an application of anti-icer on open graded asphalt
roads?
YES_________ NO__________ (If you answer NO, there is no need to continue with this questionnaire) 6. Have you taken any actions as a result of these incidents? If yes, please describe. 7. Has your DOT produced or managed any study or research related to this situation? If yes, please
provide the information (titles, publication #, links, etc) of any documents published of this research.

B-1
APP
EN
DIX
B: S
TA
TE
DO
T S
UR
VE
Y R
ESU
LT
S
Stat
eC
omm
ents
Q1
Q2
Q3
Q4
Q5
Q6
Q7
1A
ZY
YY
YN
YW
e ha
ve d
one
limite
d in
form
al st
udie
s of f
rictio
n be
fore
and
afte
r liq
uid
deic
er a
pplic
atio
n an
d fo
und
no si
gnifi
cant
cha
nge
in fr
ictio
n.2
AK
NN
o op
en g
rade
d as
phal
t3
BC
YY
N
No
de-ic
er a
pplic
atio
n on
ope
n gr
aded
asp
halt
4
CO
NY
YY
YY
CO
had
a 2
,000
foot
long
exp
erim
enta
l sec
tion
whi
ch w
as re
plac
ed d
ue to
saf
ety
conc
erns
. Col
orad
o SP
repo
rted
com
plai
nts a
nd a
lso
traff
ic st
udie
s ind
icat
e th
at th
ere
is a
pro
blem
. Win
ter a
ccid
ents
incr
ease
d by
mor
e th
an 2
00%
whe
n co
mpa
red
with
den
se g
rade
d as
phal
t pr
evio
usly
in th
is s
ectio
n. O
pen
grad
ed a
spha
lt is
no
long
er a
n op
tion
in C
O. T
his t
est s
ectio
n w
as p
art o
f a n
atio
nal e
xper
imen
t and
re
sear
ch re
port
will
be
deve
lope
d in
the
futu
re.
5D
EY
YY
N
No
com
plai
nts o
f any
kin
ds a
bout
the
effe
cts o
f de-
icer
app
licat
ions
on
open
gra
ded
asph
alt
6ID
NN
o op
en g
rade
d as
phal
t7
ILN
IL tr
ied
open
gra
ded
asph
alt 2
0 ye
ars
ago
and
lost
hal
f if i
t the
firs
t win
ter d
ue to
stri
ppin
g.
They
don
't us
e it
any
mor
e.8
IAN
No
open
gra
ded
asph
alt
9K
SN
No
open
gra
ded
asph
alt
10M
EN
No
open
gra
de a
spha
lt11
MD
YY
YN
No
com
plai
nts o
f any
kin
ds a
bout
the
effe
cts o
f de-
icer
app
licat
ions
on
open
gra
ded
asph
alt
12M
IN
No
open
gra
ded,
onl
y de
nse
grad
ed13
MT
NN
o op
en g
rade
asp
halt
14N
EY
YY
NN
o co
mpl
aint
s of a
ny k
inds
abo
ut th
e ef
fect
s of d
e-ic
er a
pplic
atio
ns o
n op
en g
rade
d as
phal
t15
NH
NN
o op
en g
rade
asp
halt
16N
YN
o m
ore
open
gra
ded
mix
usa
ge d
ue to
shor
ter s
ervi
ce li
fe a
nd s
now
and
ice
issu
es. S
alt d
isap
pear
ed w
hich
resu
lted
in in
effe
ctiv
e in
de
icin
g. P
olic
y is
to sa
lt ea
rly to
bui
ld u
p a
brin
e. O
pen
grad
ed m
ix d
id n
ot re
tain
hea
t lik
e de
nse
mix
and
on
occa
sion
s ope
n gr
aded
iced
up
whi
le d
ense
gra
ded
did
not u
nder
the
sam
e co
nditi
ons.
This
cre
ated
a p
robl
em fo
r mai
nten
ance
in d
eter
min
ing
how
muc
h sa
lt to
use
.
17O
KY
YY
NN
o co
mpl
aint
s of a
ny k
inds
abo
ut th
e ef
fect
s of d
e-ic
er a
pplic
atio
ns o
n op
en g
rade
d as
phal
t
18T
XY
YY
NN
No
com
plai
nts o
f any
kin
ds a
bout
the
effe
cts
of d
e-ic
er a
pplic
atio
ns o
n op
en g
rade
d as
phal
t. T
he fo
llow
ing
is re
sear
ch th
at V
AD
OT
and
FHW
A c
ondu
cted
: D
eici
ng-C
hem
ical
Rat
es o
n O
pen-
Gra
ded
Pave
men
ts /
Bes
selie
vre,
Will
iam
C..
: Fed
eral
Hig
hway
Adm
inis
tratio
n,
1977
. (FH
WA
-TS-
77-2
16).
Ass
essm
ent o
f the
Per
form
ance
of S
ever
al R
oadw
ay M
ixes
Und
er R
ain,
Sno
w, a
nd W
inte
r Mai
nten
ance
Ac
tiviti
es /
Flin
tsch
, Ger
ardo
W..
: VA
DO
T, 2
004.
(VTR
C-0
4-C
R18
) http
://w
ww
.virg
inia
dot.o
rg/v
trc/m
ain/
onlin
e_re
ports
/04-
cr18
19U
TY
YY
NN
o co
mpl
aint
s of a
ny k
inds
abo
ut th
e ef
fect
s of d
e-ic
er a
pplic
atio
ns o
n op
en g
rade
d as
phal
t
20W
AY
YY
YN
NC
ompl
aint
s tha
t dis
colo
ratio
n of
the
asph
alt s
urfa
ce so
met
imes
occ
urs a
s the
dei
cer l
eech
es fr
om th
e ro
adw
ay.
Som
e of
our
den
se g
rade
d su
rfac
es h
ave
expe
rienc
e th
e sa
me
prob
lem
. Th
is h
as b
een
the
case
whe
re p
erm
eabi
lity
has b
een
an is
sue.
In
som
e in
stan
ces,
crac
ks h
ave
been
dis
colo
red
or e
tche
d w
ith th
e liq
uid
deic
er m
ater
ial
21
WI
YY
YN
Mos
t of o
ur a
nti-i
cing
eff
orts
are
don
e on
brid
ge d
ecks
to p
reve
nt fr
ost b
uild
up.
Som
e sh
ady
area
s or “
troub
le s
pots
” ar
e al
so tr
eate
d w
ith
an a
nti-i
cing
app
licat
ion
but t
hese
tend
to b
e sh
ort s
ectio
ns o
f pav
emen
t whi
ch m
ay b
e of
an
open
gra
ded
desi
gn. W
e ha
ve n
ever
rece
ived
an
y re
ports
from
the
field
staf
f tha
t the
re h
ave
been
issu
es w
ith a
pply
ing
anti-
icin
g liq
uids
on
open
gra
ded
pave
men
ts.
22W
YY
NN
o de
icer
app
licat
ions
on
open
gra
ded
asph
alt
Que
stio
ns