Embed Size (px)
Citation preview
FIELD EVALUATION OF A
CORROSION INHIBITING DEICER
INITIAl REPORT 90 - 1
JANUARY 1990
Reporting On Work Plan BB-R-10
STATE OF VERMONT
AGENCY OF TRANSPORTATION
Paul R. Philbrook, Secretary Robert l. Merchant, Acting Director of Engi neering
Milan W. lawson, P.E. , Materials and Research Engineer
Prepared By Ronald I. Frascoia
Research and Development Supervisor
• l wson , P. E. and Research Engineer

1. Report No. 2. Government Accession No.
4. Ti tie and Subtitle
Field Evaluation of a Corrosion Inhibiting Deicer
7. Author( s)
Ronald I. Frascoia
9. Performing Organization Nome and ·Address ·
VT Agency of Transportation Materials & Research Division 133 State Street - State Administration Bl dg.
TECHNICAL REPORT STANDARD TITLE PAGE
3. Recipient's Catalog No.
5. Report Date
January 1990 6. Performing Organization Code
8. Perfo rming Organization R~port No.
90 - 1
10. Work Unit No.
DTFH 71-89-605-VT-13 11 . Contract or Grant No.
t--;LM~nm~t.·~.nllJ;OP•..l.l..l.iis;. P•L>..r--lVLJ-T _ _O..l.!l~56~0~2-------------~ 13. Type of Re port ond Period Covered 12. Sponsorin\l. Age ncy Name and Address In i t i a 1 Report Federal Highway Administration Demonstration Projects Division (HH0-41) First year of Evaluation 400 Seventh Street, SW Washington, DC 20590
14. Sponsoring Agency Coda
15. Supp lementary Notes
FHWA Project Manager, Mr. Robert C. Kelly
16. Abst ract
The Vermont Agency of Transportati on was invited to participate in the field evaluation of a new proprietary deicing product reported to have inhibited saltinduced corrosion of reinforced concrete samples in an extensive laboratory research program.
An 8.5 mile section of Vermont Route 14 which featured a bare deck with an extensive corrosion history wa s selected as the test site. Base li ne rate of corrosion values obtained with a 3LP- NB2 corros ion rate meter averaged 3.?. mils per year (MPY) in November 1988 prior to t he appl ication of the experimental deicer on Bridge 124.
Approximate ly 240 tons of the treated salt was applied on 52 11 Snow days .. for an application of 920 pound s on the bridge deck .
The test ing in t he spring of 1989 disclosed the rate of corrosion was more than twice t he i nitial fal l values but subsequent tests i n August, September, October, and November revealed a gradual decrease to an average of 3.9 MPY.
Significant decreases were recorded in October at all five test locations on the southbound lane wi th November values average only 0.3 MPY at the same locations. Such results may indi cate t he experimental deicer has reduced the corrosion activit) on the southbound lane, although it is not clear why the product has not produced the same effect at some of the less active northbound locations.
Further field testing will be required to confi rm the effectiveness of the corrosion inhibiting deicer and determine t he benefits which may be derived from it 's use.
17. KeyWords 18. Di stri bution Statement
deicing product rate of corros ion,
mil s per year (MPY) No restrictions
19. Security Classif. (of this report) 20 . Security Cia n i f. (of thi s page) 21. No. o f Pages 22. Price
Uncl assified Unclassified 14 Form DOT F 1700.7 ! B·69 l
i
TABLE OF CONTENTS
Standard Titl e Page
Introduction
Product Information
Cost Informati on. 2
Study Location. 3
Fi el d Testi ng 5
Di scussion 9
Summary . . 1 2
Prel iminary Conclusion . . 14
Follow Up . . 14
Di sclaimer "The contents of t his report refl ect the views of the author who is responsible
for · the facts and accuracy of the data presented herein . This report does not constitute a standard, specification, or regulation. Anyone other than the Agency using this report does so with the awareness that the Agency does not guarantee the opi nions, findings or concl us i ons contained herein. 11
INTRODUCTION
In early 1988, representatives of DOMTAR'S SIFTO SALT Division, a
Canadian company headquartered in Mississauga, Ontario approached the
Vermont Agency of Transportation r egarding the possibility of fi e ld
t esting a c orrosion inhibiting d e icer. The treated sodium c hloride
known as TCI , had minimized salt-induced corros ion in reinforced
c oncrete a nd also reduced the half- cel l potential and the rate of
corrosion i n chloride contaminated specimen s evaluated in an ext ensive
laboratory research program .
After several meetings, which included the review of the product
infor mation a nd approval by the Ve rmont Agency of Natural Resources,
for t h e u se of the t reated salt, agreement was reached to search
for a s uitable test site. Cooperation of the Maintenance Division was
assured when DOMTAR agreed to provide sufficient material to cover the
e ntire plow route of one maintenance truck. That procedure guaranteed
there would be no mix-up between standard and treated salt
applic ations.
This r e port describes t h e experimental location selected , the
evaluations conducted and the perfor mance of the treatment t h rough the
first year of testing.
PRODUCT INFORMATION
Th e sodi um c hloride provided for the field test was suppl ied from
the Montreal region of DOMTAR'S Sifto Salt Div ision. The inhibitor
1
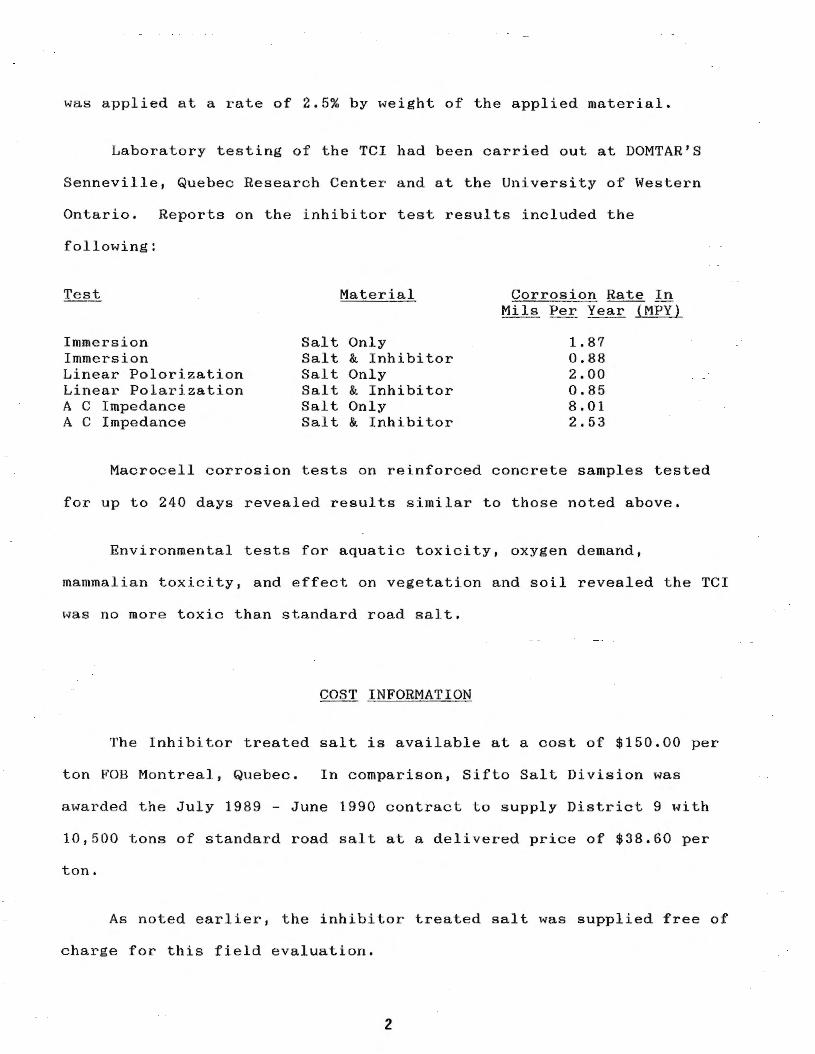
was applied at a rate of 2.5% b y weight of the applied mater ial .
Laboratory testing of the TCI had been carried out at DOMTAR'S
Senneville , Quebec Researc h Center and at the University of Western
Ontario . Reports on the inhibitor test results included the
following:
Immersion Immersion Linear Polarization Linear Polarization A C Impedance A C Impedance
Material
Salt Only Salt & Inhibitor Salt Only Salt & Inhibitor Salt Only Salt & Inhibitor
Corrosion Rate I n Mils Per Year (MPY)
1. 87 0.88 2 . 00 0 . 85 8 . 01 2.53
Macrocell corrosion tests on reinforced concrete samples tested
for up to 240 days revealed results simi lar to those noted above .
Environmental tests for aquatic toxicity, oxygen demand,
mammalian toxicity , and effect on vegetation and soil revealed t he TCI
was no more toxic than standard road salt.
COST INFORMATION
The Inhibitor treated salt is available at a cost of $150 . 00 per
ton FOB Montreal, Quebec. In compari son, Sifto Salt Division was
awarded the J uly 1989 - June 1990 contract to suppl y District 9 with
10,500 tons of standard road salt at a d elivered price of $38.60 per
ton.
As noted earlier , the inhibitor treated salt was supplied free of
c harge for t hi s fie ld evaluation .
2
STUDY LOCATION
A number of conditions had to be met to insure t he field test
could take place . Some of the more i mportant r e quire me nts incl ude d
the fo llowing:
1. Location of a route with on e or more bridge decks with active
corrosion ;
2 . Agreement t hat t h e bridge deck(s) selected would no t be programmed for
rehabiitation prior to t h e completion of the study ;
3. Availability of a sal t storage shed where the TCI could be kept
seperate from t h e standard winter salt;
4. Compl ete cooperati on of the Maintenance personne l in the
District chosen.
A number of sites were considered but only one met all of t he
major requirements. It also included a bare PC concrete deck on whic h
an extensive corr osion potent ial history had b een recorded d u ring 11 of
t h e 20 years since it h ad been reconstructed.
The site selected is a 8 . 5 mile section of Vermont Route 14
located in Orleans County in Mainte nance District No . 9 . The test
section i nc ludes one mi l e in Alba n y beginning at MM 5 . 7+ and con tinues
north for 7.35 mi l es in Irasburg a nd 0.1 mile in Coventry . The
treated salt is bein g stored in a new covered salt s hed at a
Maintenance Garage located approximately one mile south of t h e
Route 1 4 junction with US Route 5 in Coventry. On an average winter ,
t h e 8 .5 mile section of roadway would r e quire approximately 150 tons
of salt to mai n tain satisfactory driving conditions.
3
The 8.5 mile route i n c ludes two deck s wi t h bituminous overlays,
BR 118 at MM 6 . 09 i n Albany a nd BR 123 at MM 2 . 34 in Irasburg , plus
an exposed PC concrete deck, BR 124 at MM 3.13, in Irasburg.
A brief description of the t hree bridges and their condition
follows :
Bridge 118 is an 89 ' simple span over the Black River,
constructed (33 years ago) in 1956 . A deck survey conducted in 1977 b y
Material s and Research personnel disclosed corros ion activity of -0.3 5
vo l ts or greater on 52% of t h e deck area. Re habi l itatio n by
main tenance f orces in August 1977 , included removal of t he bituminous
overlay , patching of 20 minor spalls and 3 larger areas totaling 70 +
square feet , plus a nd 18'' wide area along b oth c urbl ines. The work
was completed with t h e a pplication of t ar e mu ls ion and 2 courses of
bituminous pavement .
Bridge 123 is a 90 ' by 27 . 8 ' wide simple span con structed (30
years ago) in 1959. The dec k is covered with several courses of
bituminous pavement totaling 3 l/2 to 5 inches in thickness .
Bridge 124 is a n 86 ' by 27 . 3' wide simple span i n itial ly
constructed in 1939 and rehabilitated with a new P C concrete
deck ( 21 years ago) in 1968 . Corrosion s urveys were c onduc ted o n t h e
bare deck during 11 of t he 14 years between 1972 and 19 85. At the time of
the 1985 s urvey , 67% of the deck had active corrosion, concrete
delamination was present on approximately 1 5% of t h e s u rface area and
ch loride levels averaged over 10 lbs . per c ubic yard i n the top inch
of conc r ete at t h e l ocations tested .
4
The test site is located in an area wh ich has a mean freezing
index of 1450 . Freeze- thaw cycles average 90 per year and snoHfall
averages 130 inches .
Average dai l y traffic at the three bridge sites ranges from 830
to 1 , 20 0 with 1 0% truck traffic .
FIELD TEST ING
Preliminary fie l d testing on Bridge 1 18 on September 2, 1 988 ,
revealed c orrosion potential activity of -0 . 35 volts o r greater on
only 10% of t h e deck . Similar testing was compl eted on Bridge 123
on October 12 , 1988. The 29 year old simp l e span h ad severe concrete
deterioration and reb ar corrosion visible along both curbl ess facias
but only on e active l ocation Has recorded o n t h e i n te r ior portion of
the deck . The comb ination of bitum i no u s courses and c h ip seals
totaling up to five inch es plus a two + percent grade appears to h ave
been s uccessfu l in keeping c hloride from the interi or rein forc]ng
steel .
The lack of corrosion activity on Bridges 118 a nd 123 led to a
decision to concentrate product performance testing on Bridge 124. The
latter deck also off ered t h e advan tage of having the corrosion
potent]al h istory available a nd t h e a b sence o f a bi t uminous overlay
would be expected to allow t h e TCI q u ick e r access to t h e area of t h e
reinforcing steel.
In late October and early November of 1 988 , corrosion rate
meas urements were made at eigh t locations o n the north bound lane a nd
five locat]ons on the south bound lane. The values were obtained with
5
a 3LP-NB2 corros ion r ate meter manufactured b y K. C . Cl ear, I n c . Unit
GG 201 Davis Dr ive , Sterling , Virginia 22170 , telephone (703) 430 -
2786. The equi pme n t measures the rate of corros ion u s ing a t est
procedure based u pon the "three e l ectrode l i n ear polarization"
technique or a s l igh t t e st var i ation known as the "pol arization
resistance" meth od t-~i th ohmic resistance compensation.
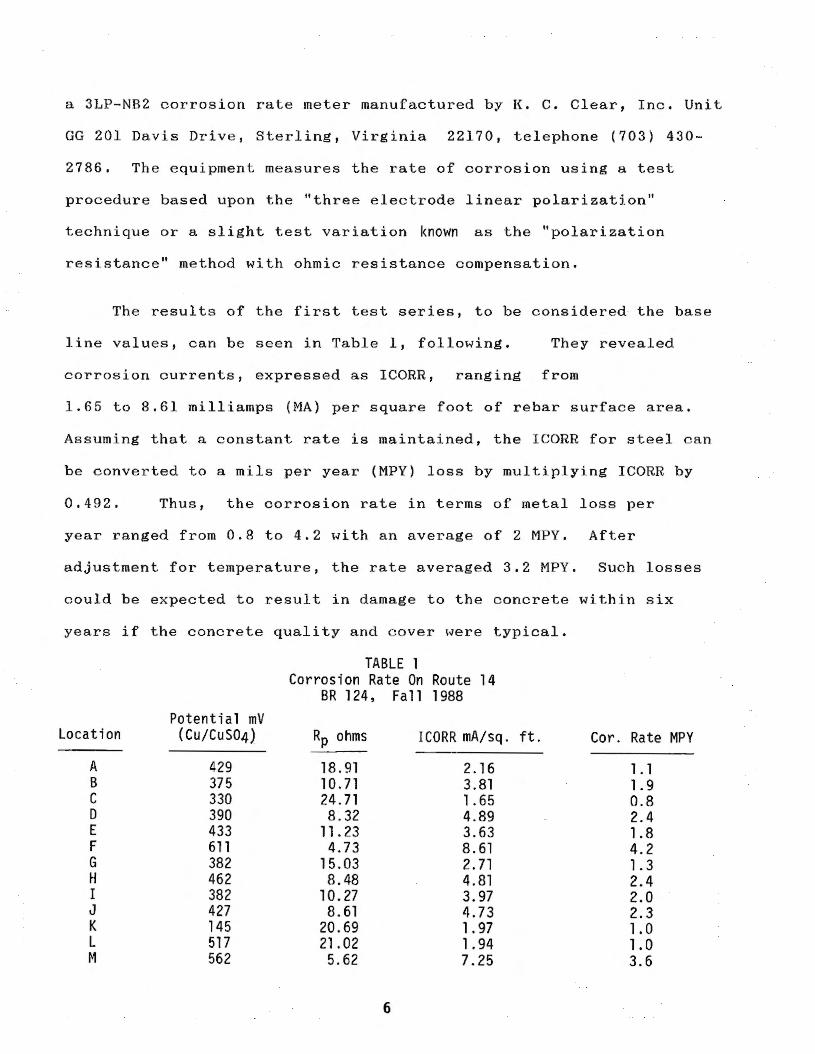
The resu lts o f the first test series , to be cons idered the base
l ine values , can b e seen in Tabl e 1, fol lowing. The y revealed
corrosion c urre n ts, expressed as ICORR, ranging from
1. 65 to 8 . 61 milliamps (MA) per s quare foot of rebar surface area .
Assuming t h a t a con s t ant rate is maintai ned , t he ICORR for steel can
b e converted to a mils per year (MPY ) loss by multiplyi ng ICORR by
0. 492 . Thus , the corros ion rate in terms o f metal loss per
year ranged f rom 0.8 to 4 . 2 with a n averag e of 2 MPY . After
adjustme n t fo r temperature , t h e rate averaged 3 . 2 MPY . Such losses
c ould b e expect ed to result in damage to t h e c onc r ete within six
years if the conc r ete qua lity and cover were typical.
Potent i al mV locat i on (Cu/ CuS04)
A 429 B 375 c 330 D 390 E 433 F 611 G 382 H 462 I 382 J 427 K 145 l 517 M 562
TABLE 1 Corros i on Rate On Route 14
BR 124 , Fall 1988
Rp ohms ICORR mA/ sq.
18 . 91 2. 16 10.71 3.81 24. 71 l. 65 8.32 4.89
11.23 3.63 4.73 8. 61
15.03 2.71 8.48 4.81
10.27 3.97 8.61 4. 73
20.69 l. 97 21.02 l. 94 5.62 7.25
6
ft. Cor. Rate MPY
1 . 1 1. 9 0.8 2.4 1.8 4.2 1. 3 2. 4 2.0 2. 3 1. 0 1.0 3. 6
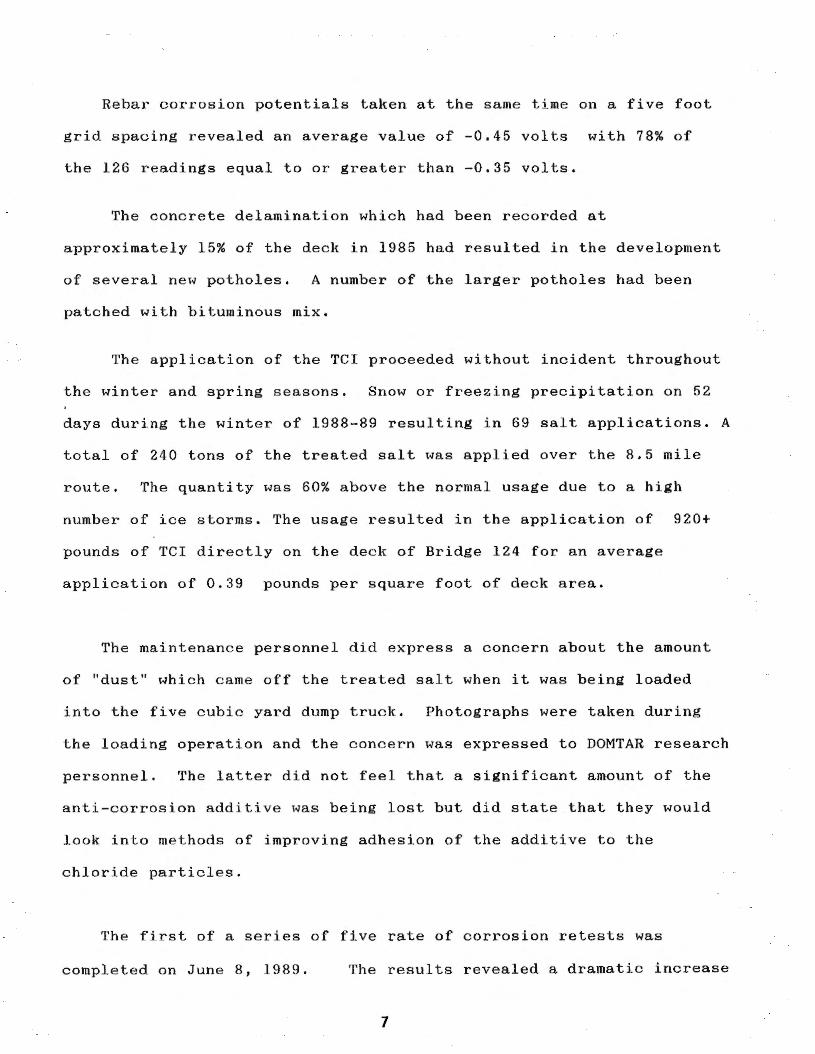
Rebar corros i on potentials taken at t h e same time on a five foot
grid s pacing revealed an average value of -0 .45 volts with 78% o f
t he 126 readings e qual to or greater than -0 . 35 volts .
The concrete d e lamination which had been recorded a t
approximately 1 5% of the deck in 1985 had resul ted in t he d evelopme n t
of several n ew potholes . A numbe r of the larger potholes h a d been
patched with bituminous mix.
The a pplication of t h e TCI proceeded without inc ide nt throughout
the winter and spring season s . Snow or freez ing precip itat ion o n 52
days during the winter of 1988-89 resulting in 69 salt application s . A
t o tal of 240 tons of the treated salt was applied over the 8 .5 mile
route . The quantity was 60% above the normal usage due t o a high
number of ice storms . The usage resulted in the application of 920+
pounds of TCI directly on the deck o f Bridge 124 for a n average
application o f 0.39 pounds per s qua r e foot of deck area.
The maintenance personnel did express a concern about t h e amount
of "dus t" which came off the t r eat e d salt when it was b eing loaded
into the five c ubic yard dump truck . Photographs were tak e n dur i ng
the loading operation a nd the c oncern was expressed to DOMTAR researc h
personne l. The latter did not feel that a significant amount of the
anti-corrosion additive was b eing l ost but d i d s tate that they would
look into methods of i mproving adhesion of t he a ddi t i ve to t h e
c h loride particles.
Th e f irst of a ser i es of five rate of corrosion retests was
completed on June 8, 1989. The results revealed a dramatic increase
7
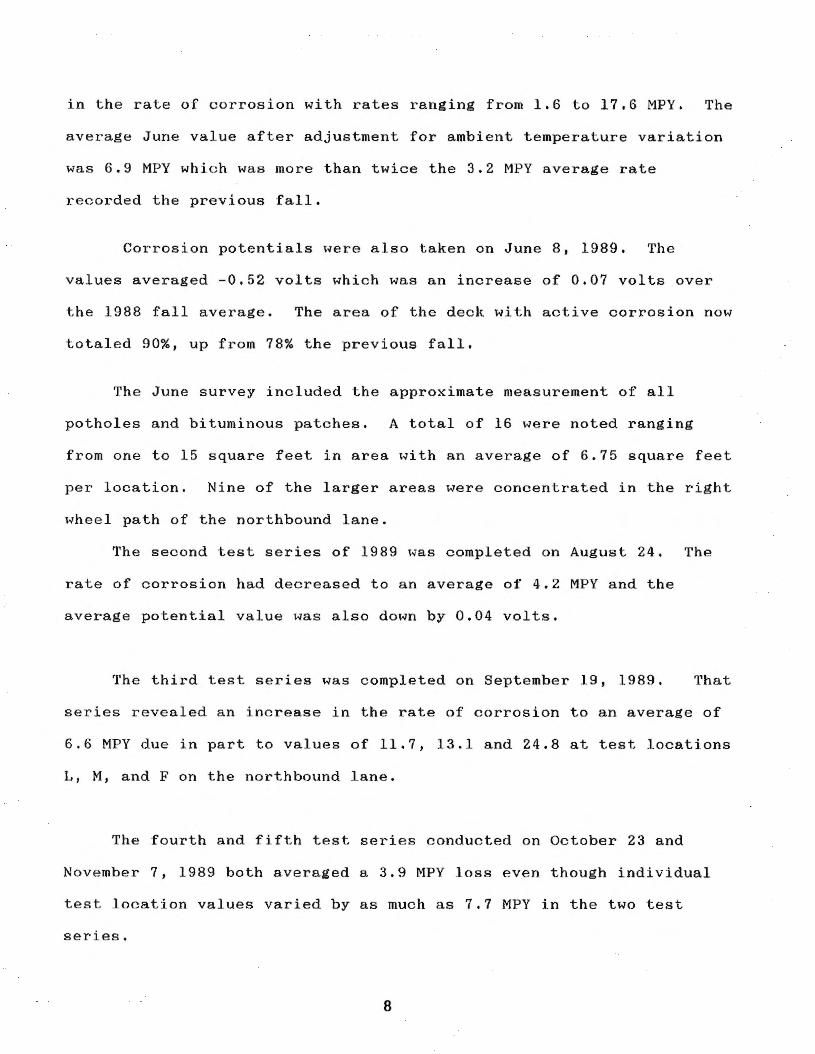
in t h e rate of corrosion with rates ranging from 1.6 to 17 . 6 MPY. The
average June value after adjustment for a mbient t e mperature variation
was 6 . 9 MPY which wa s more than twice the 3.2 MPY average rate
record e d the previous fall.
Corrosion po tenti a l s were also taken on June 8, 1989 . The
values a veraged - 0. 52 volts which was an increase o f 0.07 volts over
t h e 1988 fall average . The area of the deck with active c orros ion now
totaled 90% , up from 78% t h e previous f all .
The June s urvey include d the approximate meas urement o f all
potholes and bituminous patches . A total of 16 were noted ranging
from o ne to 15 square f eet in area with an average of 6.75 square f eet
per location. Ni n e of the larger areas were concentrated in the righ t
wh eel path of the northbound lane .
The second test series of 1989 was c ompleted on August 24 . The
rate of corros i on ha d decreased to an average of 4 . 2 MPY a nd the
average potential valu e was also down by 0.04 volts.
The third test s e ries was comple t e d on September 19, 1989. That
seri es revealed a n i nc r ease i n t h e rate of c orrosion to a n average of
6.6 MPY d ue i n part to values of 11.7, 13 . 1 and 24.8 at test locations
L, M, a nd F on t h e northbound l a n e .
Th e fourth and fifth t est series conduc ted on October 23 a nd
November 7 , 1989 both averaged a 3.9 MPY loss e v e n though i ndividual
test locat ion values varied by as muc h as 7 . 7 MPY in the two tes t
seri es .
8
DISCUSSION
The increase in corrosion rates recorded after the first winter 1S
application of TCI suggests the product did not have a significant
impact on the level of corrosi on activity during the first seven
months of the study. At least part of the increase may have
been due to the h igher electrical conductivity of the concrete
resulting from the winter salt still present in the upper surface of
the deck.
Differen ces in the physical condition of the northbound (NB) and
southbound (SB) lanes were v i sually apparent a nd also documented by
the corrosion rate and corrosion potential testing. The August 24th
testing series revealed the NB lane was 98% active with an average
value of -0.51 volts while the SB lane was 73% active with an average
value of -0.44 volts .
A number of different factors may have caused the difference in
the extent of d e t e rioration of t he two lanes. Since the deck was
reconstructed one lane at a time to allow maintenance of one-way
traffic, differences in the water - cement rat io and the resulting
c oncret e permeability and resistivity would have resulted in different
c hloride p e netration rates on the two lanes. The difference in
concrete cover ove r the top mat of reinforc ing steel is a major factor .
Cover on the SB lane averages approximately 2 1/2 inches while the NB
lane i s in the range of 1 3/4 inches .
9
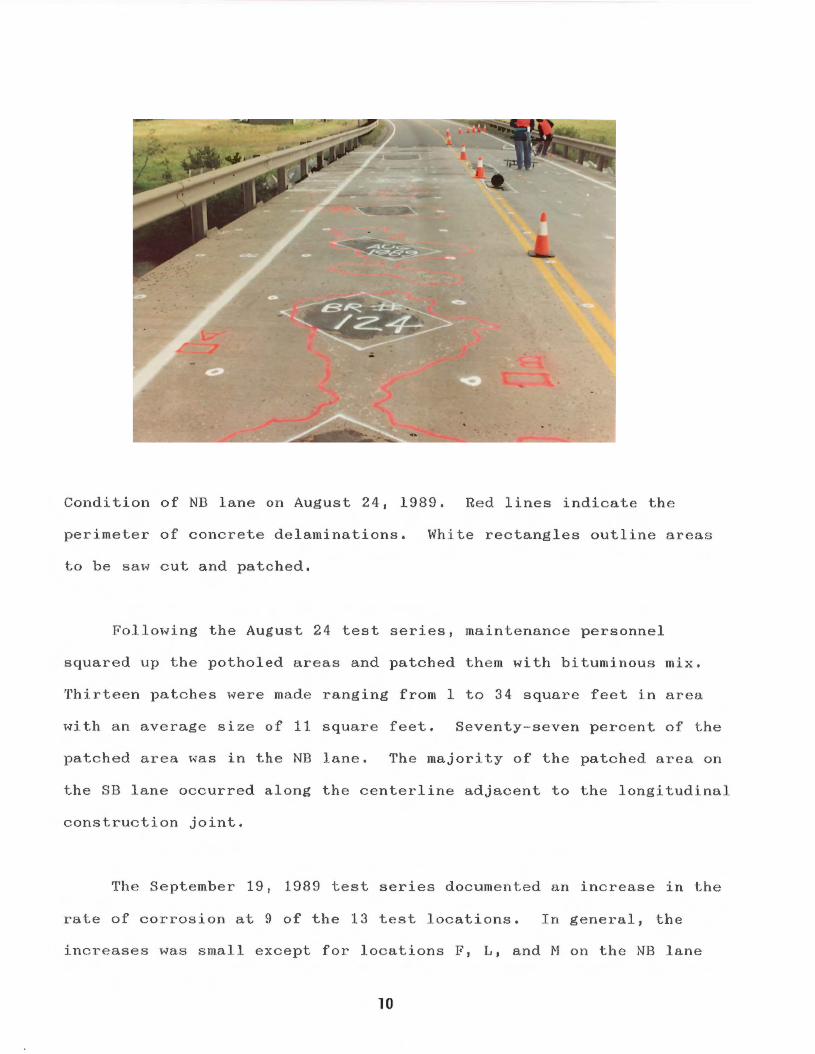
Condition of ND lane on August 24, 1989. Red lines indicate the
perimeter of concrete delaminations. White rectangles outline areas
Lo be saw cut and patched.
Fol lowing the August 24 test series, maintenance personnel
squared up the potholed areas and patched the m with bituminous mix.
Thirteen patches were made ranging from 1 to 34 square feet in area
lvith an average size of 11 square feet. Seventy-seven percent of the
patched area was in the NB lane. The majority of the patched area on
the SB l a n e occurred along th e centerline adjacent to the longitudinal
construction joint.
The September 19, 1989 test series documented an increase in the
raLe of corrosion at 9 of the 13 test locations. In general, the
increases was small except for locations F , L, and M on the NB lane
10

whi c h rose by 18 . 3 , 6 . 4 and 5 .1 MPY respectivel y . Follo~oiing
compl e tion of t he corrosion testing , soundings made wi Lh a h ammer
r evealed thaL concrete delamination was present at l ocat i on F. It could
be assume d that the fracture plane in t h e concrete contributed to the
extremely high reading at t hat test l ocation . Soundings made at t h e
oLher 12 l ocations revealed no a udible delamination. However,
de lami nation was noted along t h e west and sou t h edges of location M
and within four inches of l ocation L . Since both locations were much
more active i n September and locat ion L was even h ighe r in November it
is possible t hat delaminat ion has occurred but the f r acture plane is
not yet severe e n o ugh to detect by sounding . All other test locations
were at least 12 inches away from the nearest a udible delamination.
With the completion of the October testing, i t became appar e n t
t ha t the corrosion rate activity had decreased signi ficantly at t h e
five locations on t h e SB lane. The results can be seen in Table 2 .
TABLE 2 Summary Of Corrosion Rates (MPY) Adjusted To 20°C (70°F)
Location Nov 88 June 89 Aug 89 Se~t 89 Oct 89 Nov 89
North Bound A 1.8 4.4 4.8 6.2 5.6 5.0 B 3. 1 2.6 4. 4 3.6 4.8 4.2 c 1.3 2.3 1.3 1.8 1. 3 1.2 D 3.9 7. 5 5.9 7.8 4.6 6.6 E 2.9 8.7 6.8 8.0 13 .4 7.2 F 6.8 17.6 6. 5 24.8 ** L 1.6 4.0 5. 3 11.7 9. 2 16.9 t~ 5.9 9.5 8.0 13 . 1 5.8 4.8 Avg. 3. 4 7.1 5.4 9.6 6. 4 6.5
South Bound G 2.1 5.3 1.8 2.0 0.5 0. 3 H 3.9 14.1 2. 3 2.1 0.5 0.3 I 3.3 5.0 2.5 1.9 0.4 0.3 J 3.7 7.0 4.2 2.0 0.5 0.3 K 1.6 1.6 0.36 0.8 0.4 0. 2 Avg. 2.9 6.6 2. 2 1.8 0.5 0. 3
Avg A 11 Tests 3.2 6.9 4.2 6.6 3.9 3.9
** Delaminated
11
Further reductions were recorded on the November 7, 1989 test
series with the values averaging l ess than 0 .3 MPY. Su c h a low rate
could continue for 20 or more years before corrosion damage might be
expected . It is assumed that t h e reductions in the rate of corrosion
have occurred due to the application of the non-corrosive deicer .
However , it is not c l ear why the material has not had a similar
positive effect on the NB lane . Although variations in t h e rate of
corros ion between lanes would appear reasonable due to the differences
noted in the condition of the two lanes , no significant reductions
beneath the base values were achieved on any of the NB test locations .
As a minimum, reductions in the rate of corrosion below 1 MPY should
have been achievable on NB points A and C since they were lower
initially and also i n the spring t est series than t h e five SB test
location s .
Due in part to the di screpancy in the rate of corrosion between
lanes, further field testing will b e required to confirm the
effectivenes of the experimental deicer and d etermine the benefits
which may be derived from its use.
SUMMARY
The majo r activities completed and results obtaine d during t he
first year of this research project include the following:
The Agency agreed to undertake a fie l d study designed to evaluate the
effectiveness of a corrosion inhibiting deicer.
The fie ld site selected included a bare concrete bridge deck that had
been tested for corrosion potentials during 11 of it ' s 20 years of
service .
12
Prior to the application of the treated salt , 78% of t he deck had
active potential s and the rate of corrosion averaged 3 . 2 MPY at t h e 13
locations tested . The continuation of corrosion at this rate wou ld be
expected to result in damage to a concrete within six years .
Approximatel y 240 tons of TCI were applied i n 69 salt
applications during the winter of 1988-89. The usage resulted in the
appl ication of approximately 920 pounds of TCI directly on the
bridge dec k for a n average of 0.39 pounds per square foot of deck
area .
The spring of 1989 testing disc losed an additional 12% of
the deck had active potentials and the rate of corrosion had more than
doubled to an average of 6 . 6 MPY .
Four additional test series revealed a general decrease in both
potential s and the rate of corrosion t h rough November 1989 .
The October and November testing indicated a very low rate of
corrosion was occurring at all sou thbound test locations while the
northbound locations were still approximately double t he initial 1988
values.
PRELIMINARY CONCLUSION
Significant reductions in the rate of corrosion have been
documented on the SB lane of the bridge deck under study. The on ly
factor known to h ave c hanged during the test period was t h e
application of t he experimental corrosion inh ibiting deicer a nd ,
it is assumed that the product was responsible for t h e reduction in
corrosion activity. However, because simi l ar reduct i ons in the rate
13
of corrosion have not occurred on the NB lane , the overall
effec t iveness of t he product r e mains in question a nd will require
f urth er study.
FOLLOW UP
Further fie l d testing will continue a nd be expanded to include
additional rate of corrosion test location s , identification of al l
concrete delaminat ions , and d etermination of chlor ide content a t the
rebar level.
14