Embed Size (px)
Citation preview

Marquette Universitye-Publications@Marquette
Master's Theses (2009 -) Dissertations, Theses, and Professional Projects
Evaluation of Die Trim Morphology Made byCAD/CAM TechnologyPratiksha AgrawalMarquette University
Recommended CitationAgrawal, Pratiksha, "Evaluation of Die Trim Morphology Made by CAD/CAM Technology" (2016). Master's Theses (2009 -). Paper346.http://epublications.marquette.edu/theses_open/346
EVALUATION OF DIE TRIM MORPHOLOGY MADE BY CAD/CAM
TECHNOLOGY
By
Pratiksha Agrawal B.D.S.
A Thesis submitted to the Faculty of the Graduate School,
Marquette University,
in Partial Fulfillment of the Requirements for
the Degree of Master of Science
Milwaukee, Wisconsin
May 2016

ABSTRACT
EVALUATION OF DIE TRIM MORPHOLOGY MADE BY CAD/CAM
TECHNOLOGY
Pratiksha Agrawal, B.D.S.
Marquette University, 2016
Purpose: The purpose of this vitro study was to evaluate the accuracy of the
morphology of digitally trimmed dies in comparison with the subgingival contour of a
prepared tooth to be restored with a single crown.
Materials and Methods: 20 human extracted teeth, 10 incisors and 10 molars were
disinfected, mounted on dentoforms. The teeth were prepared for a single all ceramic
restoration. Digital impressions of the preparations were made using the 3M Lava COS.
With the data, the SLA models were fabricated with removable dies. The prepared tooth
and the corresponding dies were then compared with the Rhino software.
Results: Three different parameters were tested angle, length and volume to compare
the accuracy of the digital die to the subgingival morphology of the prepared teeth. Paired
t test was used to compare the teeth to their corresponding dies. For the angle analysis of
CAD/CAM die trim morphology, the incisor group demonstrated significant difference at
the BL surfaces. On the contrary, the molar group showed significant difference at the
MD surfaces. For the evaluation of length and volume of CAD/CAM die trim
morphology, the incisor group showed significant difference at zone D of both BL and
MD surfaces. However, significant differences at zone C and D of BL surfaces and all
zones of MD surfaces was noticed in the molar group.
Conclusions: Within the limitations of this study, the following conclusion was
made: Incisor group - the CAD/CAM (SLA) dies were bigger in the Zone D in both BL
and MD direction. Molar group – the CAD/CAM dies were bigger in all the zones in both
BL and MD direction. The angle measurements showed the teeth had a tendency to be
more narrow and flat while the SLA dies were more concave.

i
ACKNOWLEDGEMENTS
Pratiksha Agrawal, B.D.S.
.
First of all, I would like to thank God, for always being there with me and helping me
accomplish this project.
Special thanks to my parents for believing in me and for their unconditional love and
support.
To my husband, Ankur for being my inspiration. For his support during the three years of
my residency, for his patience, love and understanding. For helping me in achieving my
goals and accomplishing my dreams.
To my family for always being there my elder brothers, my in-laws and lastly my four
nephews and niece.
I would like to express my deepest gratitude to Dr. Geoffrey Thompson, my thesis advisor
and Director of the Graduate Prosthodontics program for his enormous help, guidance,
constant encouragement and support for this project. Dr. Thompson has been a great
mentor and guide which has helped me immensely in growing in my career.
I would also like to extend my appreciation to my committee members: Dr. Seok-Hwan
Cho for helping me take every step that got me closer to completing my thesis and for his
guidance and Dr. Gerald Ziebert for his advice.
I would like to thank my fellow residents and staff for their help and for making
Marquette Prosthodontics Department feel like home and family.
I would like to thank Naveen Bansal for his enormous help with data and statistical
analysis.
Special thanks to the American Academy of Fixed Prosthodontics Tylman Research Fund
for funding the project. Special thanks to Brittney Hoper at the D&S Dental laboratory who
helped me scan all my samples using the 3M Lab scanner. Also, Steve from D&S Lab for
his help, they made me feel welcomed at the Lab.
Without the guidance and help of these people this project would not have been possible.

ii
TABLE OF CONTENTS
Acknowledgements………………………………………………………………........i
List of tables and Graphs.....................................................................................….....iii
List of figures…………………………………………………………………….......iv
Introduction…………………………………………………………………………...1
Literature review……………………………………………………………………...4
Methods and materials……………………………………………………………….20
Results……………………………………………………………………………….36
Discussion…………………………………………………………………………...39
Conclusion…………………………………………………………………………..48
Bibliography………………………………………………………………………...49
Appendix A…………………………………………………………………………52

iii
LIST OF TABLES
Table 1. Four CAD/CAM Systems ……........................................................................12
Table 2. Tooth number and corresponding die number-Incisors………………………28
Table 3. Tooth number and corresponding die number-Molars ………………............28
Table 4. Angle results……………….……………………………................................36
Table 5. Length results………………….…………………………………………......37
Table 6. Volume results………………………………………………………..………38
Graph 1 and 2 Length results………………………………………………………….43
Graphs 3 and 4 Length results ………………………………..………………………44
Graphs 5 and 6 Volume results……………………………………………………….45

iv
LIST OF FIGURES
Figure 1. CAD/CAM Flow Chart …………………………………………..…………18
Figure 2. and 3. Mounted teeth …………………………………..……………………21
Figure 4. and 5. Prepared teeth…………….………………………………………….22
Figure 6. Maxillary impression …………..……..…………………………………....23
Figure 7. Mandibular impression………………………………………….…………24
Figure 8. and 9. Bite registration......………….…………………………………24 - 25
Figure 10. and 11. SLA casts………….……………….…………………………….26
Figure 12.and 13. Tooth preparation and die………………….……………………..27
Figure 14. STL files …………………………...…………...………….……………29
Figure 15. 16. 17. 18. and 19. Volume and zone………….……...……….…......30-32
Figure 20. Length……………………………………………..…………………….33
Figure 21. Angle ………………………………..…………………….……..….....34
Figure 22. Angle difference…………………………………………………...…...41
Figure 23. Natural inclination……..………………………………………..…..…42
Figure 24. Molar furcation ...……………………………………………………...46

1
CHAPTER I
INTRODUCTION
Traditionally, a cast-die system has been used to produce fixed dental prostheses in
the laboratory.[1] However, intraoral digital scans are now being used with increasing
frequency. The digital information from these scans are used to create virtual casts and
cast-die systems. In either case, accurate die trimming is a critical step in the fabrication of
a fixed dental prostheses.[2]
Direct fabrication of patterns in the mouth for extra and intra-coronal restorations
is possible; however, the procedure is inconvenient for the patient, difficult to accomplish
well, requires additional time at the chair, and is nearly impossible to do in some situations.
Therefore, cast-die systems were developed to overcome the challenges of direct pattern
fabrication. A cast-die system is necessary to replicate the clinical situation so that this
information can be transferred to the laboratory. A die is a working replica of a single tooth
or several teeth.[2]
An ideal die possesses certain requirements. For example, it should reproduce fine
details and sharp margins and possess good color contrast with other materials like inlay
wax or porcelain. The die material should not interact with impression materials and it
should undergo minimal dimensional change upon setting. Usually, die materials expand
upon setting and compensates for the polymerization shrinkage of impression materials.
Die materials should remain stable over time. Desirable mechanical properties such as
high strength and abrasion resistance are important. A high strength die reduces the

2
likelihood of accidental breakage, and abrasion resistance allows carving of a wax pattern
without damage to the die. Finally, die materials must be economical and easy to use.
After an intraoral impression is made and cast in stone, the dies must be prepared
or trimmed to remove unnecessary information prior to manufacture of a cast restoration.
The trimmed region is usually soft tissue, but may be a reproduction of the retraction
cord, blood or saliva. Trimming of this excess material will help visualize the prepared
finish line on the die. Die trimming areas are divided into three parts: (1) marginal zone;
(2) body; and (3) the base. The marginal zone is the area which extends from the finish
line to 3-5 mm apically. This zone is the most critical die trimming area, as it determines
emergence profile and contour of the restoration made on the die. The body is the
connection between the marginal zone and the base. The third part is the dies base, which
is the most apical extent of the die and it determines the stop point of the die when placed
on the cast.[3]
The conventional die trimming technique is a two-stage procedure. The first stage
is the gross reduction of the die. The second stage is the fine reduction near the margins
of the preparation using hand instruments, under magnification and high illumination.
This technique has been used by dental technicians for a long time.[2, 4]
Accurate die fabrication is very important because an over-trimmed marginal
zone may produce a large and over-contoured restoration. However, an under-trimmed
marginal zone will produce a restoration with a flat and straight contour. Therefore, die
trimming must attempt to reproduce the sub-gingival contour of teeth being restored in
order to achieve an appropriate emergence profile.The term “emergence profile” was first
used in 1977 by Stein and Kuwata to describe tooth and crown contours as they traversed

3
soft tissue and rose toward the contact area interproximally and height of contour facially
and lingually. Emergence profile is defined as the contour of a tooth or restoration, such
as a crown on a prepared tooth or dental implant abutment, as it relates to the adjacent
tissues.[5]
In 1989, B. M. Croll defined emergence profile as the portion of axial tooth
contour extending from the base of the gingival sulcus past the free gingival margin into
the oral environment. Croll said that emergence profile is the most crucial link between
tooth form and gingival health. The emergence profile is important for giving a prepared
look to a restoration, maintaining gingival health, preventing plaque retentive areas, and
facilitating maintenance of oral hygiene. Clinical longevity of prostheses may be directly
related to proper coronal contours. This involves integrating periodontal and
prosthodontic principles during the fabrication of the prostheses, such as, properly
locating the restoration margin so that it will not violate the biologic width.[6]

4
CHAPTER II
LITERATURE REVIEW
1. Dies
Many different materials are used for fabrication of dies, for example: Type 4
dental stone (high strength), Type 5 dental stone (high strength and high expansion), and
resin materials such as epoxy and polyurethane. Some die materials are amenable to
electroplating with copper or silver, producing more durable dies. Metals and metal
sprays have been used, as well as, flexible materials for making interim restorations.
Various die trimming systems are available in the market like working casts with
removable dies (Straight dowel pin, Curved dowel pin, Di-lok tray, Pindex system), or
working casts with separate dies (DVA model system, Zeiser model system). There are
many studies in the literature that have evaluated and compared the advantages and
disadvantages, and accuracy of various die systems. Following is a review of some of the
available die materials and die systems.
History of Dies and Die materials in dentistry
1. Die Materials
Sverker Toreskog et al (1966) conducted a comparative study of the pertinent
properties for die materials. They evaluated dimensional stability, hardness, detail
duplication, compatibility and abrasion resistance of 8 classes of die materials. The
evaluated materials included stone (Silky Rock (+ water), Glastone (+ water), Kryptex
(silico phosphate cement), Diamond Die Material, Micra Die, Perma Rock and Devcon);
F2 (epoxy resin); Cerrolow 136, silver plated-metallized with silver powder; copper

5
plated-metallized with silver powder; and copper plated-metallized with bronze. It was
concluded that no one material proved to be superior in all properties. The stones were
superior from the standpoint of dimensional accuracy but their abrasion resistance was
low. All of the dies, with the exception of those made from stone or low-fusing alloy,
were undersize at the cervical margin of the simulated full cast crown preparation. The
dies made from the ceramic material, silico-phosphate cement, one of the resins and by
electrodeposition were superior in abrasion resistance. The surface of the electroplated
dies, the ceramic material, stones and silico-phosphate cement provided excellent
duplication of detail. Differences were observed in the compatibility of certain die
materials and rubber impression products as compared to the duplication produced when
the die material was poured against an inert surface. [7]
James A. Stackhouse (1970) conducted a study concerning the accuracy of stone
dies as affected by the dimensional changes in rubber impressions. He also tested
difference in accuracy using three different techniques: (1) technique I – relief area; (2)
technique II – perforated; and (3) technique III – simultaneous double mix. The three
silicones tested were Plastosil, Elasticon and Lastic 55 and the thiokol was Permlastic.
The authors concluded more uniform dies were produced from silicone than from
mercaptan rubber. Perforated tray technique caused the dies to be undersized in diameter,
the other two techniques. Relief area and simultaneous double mix were not significantly
different from each other. Bench setting caused the stone dies to be shorter in length and
thicker in diameter.[8]

6
Crispin et al conducted 2 studies (1984). The purpose of the first study was to
determine the acceptability of silver-plated dies and the time required for initial plating of
dies made from the 4 groups of elastomers with the use of standard or modified plating
techniques. Acceptable silver-plated dies were obtained from Permlastic and Impregum.
and condensation-reaction silicones with Xantopren-Optosil. From the polyvinylsiloxane
group, Reprosil and President produced acceptable dies. The technique modification
studied was not effective for Citricon and President. The surface quality of silver-plated
dies and the consistency of plating varied with materials. They in general concluded
silver-plated dies may be less accurate than stone dies.[9]
The second study by Crispin et al used clinically applicable techniques to test the
marginal accuracy of castings made on stone and silver-plated dies fabricated from 4
groups of elastomeric impression materials. Accuracy of crowns fabricated on the silver-
plated dies were statistically as accurate as that of crowns fabricated on stone dies in all
cases and significantly more accurate in some instances. Silver-plated dies fabricated
from Reprosil produced more accurate crowns than all other dies tested. Acceptable
crown margins were obtainable from either stone or silver-plated dies when judged by
clinical criteria.[9, 10]
Jack D. Gerrow et al (1998) conducted an in vitro study to compare the surface
detail reproduction of 7 flexible die material systems used in combination with 7
elastomeric impression materials. Flexible die materials have been advocated for making
interim crowns and indirect composite acrylic resin inlays. This is another compatibility
study looking at different impression material and die material combinations. They
concluded that dies made with Impregum F from Extrude Light impressions reproduced

7
better surface detail than the control dies (elastomeric material with type IV dental stone).
Reproduction of surface detail on dies made with Agarloid/Imprint, Proof/Extrude
medium, or Agarloid/Impregum F impression/die combinations were similar to the
surface detail reproduction on the control dies. Certain combinations like Impregum F
impressions were incompatible with Blu-Mousse, Impregum F, or Imprint used as die
materials and should not be used to fabricate flexible dies. Polyvinyl siloxane
impressions were incompatible with polyvinyl siloxane dies unless a separator was used.
When a separator was used, the surface detail reproduction was not as good as the control
die system.[11]
Brian Kenyon et al (2005) compared the linear dimensional accuracy and the
handling characteristics of 7 die materials. They looked at conventional Type IV dental
stone, Type V dental stone, resin impregnated Type IV dental stone, epoxy resin,
polyurethane resin, copper plated and Bis-acryl composite resin. It was determined that
Type IV resin-impregnated dental stone and copper-plated dies most closely
approximated the dimensions of the master die. Conventional Types IV and V dental
stone dies exhibited setting expansion within the range of acceptability for gypsum.
Epoxy resin die materials demonstrated shrinkage. Polyurethane dies displayed a
combination of linear expansion and shrinkage. Bis-acryl composite resin dies had
excessive shrinkage.[12]
Rosario Prisco et al (2008) conducted a study to determine if retarding the setting
reaction during polymerization and altering the base-to-catalyst ratio can be
recommended for resinous die materials to reduce the inaccuracy. A Blue Star Type E
epoxy resin die material was tested. It was concluded that alteration of the base-to-

8
catalyst ratio did not improve its dimensional accuracy, instead the material exhibited
higher contraction variability across all tested groups. This shrinkage could significantly
affect the dimension of the master cast.[13]
2. Die Systems
Gerald T Nomura et al (1980) evaluated the accuracy, fit, detail registration and
Knoop hardness of 3 commercially available resin die systems (Pandent, Epoxydent and
Precision) and compared them with die stone (Vel-Mix). They tested the difference
between full coverage crown and mesio-occlusal-distal preparation dies. It was concluded
that complete crown epoxy resin dies were undersized and mesio-occlusal-distal onlay
epoxy resin dies were accurate. Detail duplication of epoxy resin dies was comparable to
die stone; however, hardness values of epoxy resin were less than that of die stone.[14]
M. Myers and J.H. Hembree (1982) conducted a study on the relative accuracy of
4 removable die systems (brass dowel pin, Plastipin, J-pin, and Logix Model System).
They investigated vertical shift and the horizontal shift of the dies and concluded that
Plastipin exhibited least amount of horizontal shift and the brass dowel pin exhibited
greatest shift in both directions though the difference was not statistically significant.[15]
3. Die hardener
Habib et al (1983) evaluated the effects of an application of cyanoacrylate on die
stone, to include changes in the dimension, surface hardness, and numbers of layers of
cyanoacrylate that can be safely applied. They concluded the application of one coat of
cyanoacrylate adhesive on the surface of trimmed and marked dies increases the surface

9
hardness and scratch resistance, will not appreciably change the dimensions of the die,
and renders the margin marking more permanent. The use of hardener instead of water is
recommended for mixing Type IV dental stone.[16]
4. Die trimming
Aaron G. Segal et al (1984) presented an alternative method to trimming a die.
The technique described use of a dead soft wax, such as boxing or carding wax, flowed
onto the gingival surface of the impression and around the prepared teeth. This allowed
tooth structure gingival to the finish line in the impression to remain on the die.
Trimming could be nearly eliminated, and the root surface remaining on the die
facilitated the development of proper axial contours on the restoration.[17]
Richard J Windhorn in (1998) described a similar technique of flowing wax onto
the gingival surface of the impression around the prepared teeth followed by pouring a
cast. The difference was he utilized the technique not to fabricate the die but to make a
solid cast that would aid the technician with perfecting the interproximal contacts of fixed
prostheses.[18]
V. Diego (1992) described a technique to protect the finish line of die stone
during trimming. The technique recommended the use of sticky wax around the margins
of the preparation to make a protective thick cap during trimming. This was a simple and
inexpensive technique that can be used by dentists and technicians in protecting the
margins of the dies.[19]
II. CAD/CAM – Computer aided designing/Computer aided machining
10
For many years, researchers have investigated the dimensional accuracy, size,
marginal accuracy, surface detail, and compatibility between the different impression
materials and die materials. However, there are few studies that have investigated the
dimensional and anatomical accuracy of digitally trimmed dies. Though popularity of
digital dentistry is growing, research and scientific evidence in the digital field is lacking.
Therefore, the purpose of this research is to evaluate the accuracy of digitally trimmed
dies using the 3M Lava COS in comparison with the subgingival contour of a tooth
prepared for restoration with a complete all-ceramic crown.
CAD/CAM – History
Computer Aided Design/Computer Aided Manufacturing (CAD/CAM) was first
employed for the aviation and automotive manufacturing industries in the 1960’s and was
first utilized in the field of dentistry on an experimental level approximately 10 years
later. The first CAD/CAM system for dentistry was the Sopha system which was
developed by Francois Duret of France in 1984. [20] It consisted of an optical scanner
that acquired a digital impression of the prepared tooth, a computer with the necessary
software to design a restoration and finally a numerically controlled milling machine that
produced the designed restoration. Dr. Mormann was the developer of the first
commercial CAD/CAM system. In 1985, his team performed the first chairside inlay
using a combination of their optical scanner and milling device. They called the device
CEREC, an acronym for Computer Assisted Ceramic Reconstruction. At about the same
time, Dr. Andersson developed the Procera (now known as Nobel Procera, Nobel

11
Biocare, Zurich, Switzerland) method of manufacturing high-precision dental crowns in
1983.
There are many different imaging/milling systems available in market today, for
example:
1. CEREC – by Sirona Dental System GMBH (DE)
2. iTero – by CADENT LTD (IL)
3. E4D – by D4D TECHNOLOGIES, LLC (US)
4. Lava™ COS – by 3M ESPE (US)
5. IOS FastScan – by IOS TECHNOLOGIES, INC. (US)
6. DENSYS 3D – by DENSYS LTD. (IL)
7. DPI-3D – by DIMENSIONAL PHOTONICS INTERNATIONAL, INC.
(US)
8. 3D Progress – by MHT S.p.A. (IT) and MHT Optic Research AG (CH)
9. directScan – by HINT - ELS GMBH (DE)
10. trios – by 3SHAPE A/S (DK)
Four products are more commonly used for digital impressions in the dental
office, they are the CEREC AC, iTero, E4D Dentist and the Lava COS systems. The
CEREC and the E4D can be combined with in-office design and milling whereas the
iTero and Lava COS are only reserved for data/image acquisition. In-office milling
allows for same day insertion of restorations.

12
Table 1 shows comparison between these 4 major systems.
CEREC E4D iTero LAVA
COS
Full-arch Yes No Yes Yes
Powder Yes Yes No Yes
In-Office Milling Yes Yes No No
Connectivity to Labs Yes No Yes Yes
In-Office Designing Yes Yes No No
Bridge 3 unit No Full Yes
Focal Distance Focuses
automatically
Distance
constant
using 2
rubber feet
Any 15 mm
Lava Chairside Oral Scanner
The Lava™ Chairside Oral Scanner (COS) was created at Brontes Technologies
in Lexington, Massachusetts, and was acquired by 3M ESPE (St. Paul, MN) in October
2006. The product was officially launched in February 2008. The Lava COS system
consists of a mobile cart containing a central processing unit, a touch screen display, and
a scanning wand. The Lava COS camera contains a highly complex optical system
comprised of 22 lens systems and 192 blue light emitting diode cells. The Lava COS
wand has a 13.2-mm wide tip and weighs 390 grams.

13
The Lava COS. introduced an entirely new method of capturing 3D data based on
the principle of active wavefront sampling with structured light projection. This scanning
method has been named “3D-in-Motion technology”. The Lava system uses the
triangulation or sampling principle of imaging, and typically applies one angled cone of
light to capture a single image. The single rotating aperture allows projection of images at
several positions which in turn increases the spatial resolution and enhances the
measurement sensitivity. The Lava COS is a 3D video system that captures 20 3D
frames per second, which are registered in real time. After the scanning process a post
processing cycle recalculates the registration and compensates potential errors.
Triangulation/sampling scanners require teeth to be coated with scanning powder that
contains titanium oxide.
Once the scan is signed off the data is sent wirelessly to 3M where the technician
reviews and synthesizes the images before creating a model. A Lava COS physical model
is fabricated using stereolithography, an additive fabrication process building the model
one layer at a time.[21]
3M Lava COS – Literature review
Andreas Syrek et al (2010) conducted an in vivo study to compare the fit of all-
ceramic crowns fabricated from intraoral digital impressions using the Lava Chairside
Oral Scanner (Lava COS; 3M ESPE), with the fit of all-ceramic crowns fabricated from
conventional 2 step silicone impressions. The results showed a median marginal gap in
the conventional impression group of 71 microns and in the digital impression group 49
microns. It was concluded that crowns produced from intraoral scans possessed a

14
significantly better marginal fit than crowns produced from silicone impressions.
Marginal discrepancies in both groups were within the limits of clinical acceptability.
Crowns from intraoral scans tended to show better interproximal contact area quality.
Crowns from both groups performed equally well with regard to occlusion.[22]
Paul Seelbach et al (2013) conducted an in vitro study to compare the accuracy of
complete ceramic crowns obtained from Lava Chairside Oral Scanner COS (3M ESPE,
St. Paul, Minn.), CEREC AC with Bluecam (Sirona, Bensheim, Germany), and iTero
(AlignTechnology, San Jose, Calif.) with conventional elastic impressions. They
concluded that internal fit and accessible marginal inaccuracy of the crowns made by
digital impressions is comparable to the crowns made by conventional impressions. The
digital impression technique can be considered as a clinical alternative to conventional
impressions for fixed dental prostheses.[23]
Thorsten Grunheid et al (2014) aimed to assess accuracy, scan time, and patient
acceptance of chairside oral scanner (Lava COS; 3M ESPE, St Paul, Minn) compared
with alginate impressions when used for full-arch scans in the orthodontic setting.
Intraoral scans (Lava COS; 3M ESPE, St Paul, Minn) and alginate impressions were
made on 15 patients. Based on survey results, 73% of the patients preferred impressions
because they were “easier” or “faster,” and 27% preferred the scan because it was “more
comfortable”. The casts made from alginate impressions and cast made using the
intraoral scanner were digitally superimposed to assess accuracy; it was concluded that
digital models produced from intraoral scans can be as accurate as those made from
alginate impressions.[24]

15
Sebastian Patzelt et al (2014) conducted an in vitro study using 3 different
intraoral scanners. The scanners were the Lava Chairside Oral Scanner COS (3M ESPE,
St. Paul, Minn.), CEREC AC with Bluecam (Sirona, Bensheim, Germany), and iTero
(Align Technology, San Jose, Calif.). A single abutment (scenario 1) was digitalized, as
well as, a short-span fixed dental prosthesis (scenario 2), and a complete arch prosthesis
preparation (scenario 3). They measured the durations of each procedure for each
scenario. Data was compiled and contrasted with the procedure duration for 3
conventional impression materials. The mean total procedure duration for making digital
impressions were: scenario1, 5 minutes 57 seconds; scenario2, 6 minutes 57 seconds; and
scenario3, 20 minutes 55 seconds. The mean total procedure durations for making
conventional impressions for S1 and S2 ranged between 18 minutes 15 seconds and 27
minutes 25 seconds, S3 ranged between 21 minutes 25 seconds and 30 minutes 25
seconds. time measurements for each scanner for the hardware startup, software setting,
powdering or coating (if required by the manufacturer), scanning of the abutments,
scanning of the antagonists, bite registration scan and data processing and for the
conventional impressions summing the manufacturers provided working times for the
adhesive, impression material, antagonist impression material, bite registration material
and disinfectant. The authors found that computer-aided impression making was
significantly faster for all tested scenarios. This suggests that computer-aided impression
making might be beneficial in establishing a more time-efficient work flow.[25]
In another study, Sebastian Patzelt et al (2014) determined the accuracy of
CAD/CAM generated dental casts based on intraoral scanner data. The mean trueness
values of Lava Chairside Oral Scanner COS (3M ESPE, St. Paul, Minn.), CEREC AC

16
with Bluecam (Sirona, Bensheim, Germany) and iTero (AlignTechnology, San Jose,
Calif.) were looked at. All of the casts showed an acceptable level of accuracy; however,
the SLA-based casts (CEREC AC with Bluecam and Lava Chairside Oral Scanner COS)
seemed to be more accurate than milled casts (iTero).[26]
Jan-Frederick Guth et al conducted an in vitro study to determine the accuracy of
digital models obtained by direct and indirect data capturing. Twelve datasets were
generated using: (1) the Lava Chairside Oral Scanner (COS); (2) by digitizing polyether
impressions (IMP); and (3) by scanning the referring gypsum cast by the Lava Scan ST
laboratory scanner (ST) at a time. Using inspection software, these datasets were
superimposed by a best fit algorithm with the reference dataset. Within the limitations of
this in vitro study, the direct digitalization with Lava COS showed statistically
significantly higher accuracy compared to the conventional procedure of impression
taking and indirect digitalization. [27]
Robert G. Nedelcu et al in 2014 conducted an in vitro study comparing the
scanning accuracy and precision in 4 intraoral scanners. The scanners were the 3M Lava
COS, Cerec AC/Bluecam, E4D, and iTero. Models were fabricated in 3 materials
(polymethyl methacrylate [Telio CAD], titanium, and zirconia) and reference scanned
with an industrial optical scanner. Each reference model was scanned 10 times. An
additional 10 scans were performed, in which the Telio CAD reference model was coated
with an excessive amount of powder to assess any effect of oversaturating the surface.
Data were evaluated using 3-dimensional analysis with “3D compare” software
commands (3D compare analysis) regarding standard, mean, and maximum deviations,
with subsequent statistical analysis. The 3M Lava COS, Cerec AC/Bluecam, and iTero

17
generally displayed similar results regarding deviations. Maximum deviations, however,
increased by several factors for the non-coating scanners (iTero and E4D). Significant
differences were found between coating and non-coating scanners. There are specific
scanning errors for the system using parallel confocal microscopy (iTero) for translucent
material (Telio CAD) body materials. Specific areas of sizable deviation for E4D using
laser triangulation technology was explained by the scanner design and non-coating
technology. Excessive coating shows no negative effect.[28]
Eneko Solaberrieta et al in 2016 conducted an in vitro study to determine the
requirements, quantity, and dimensions of the virtual occlusal record procedure in order
to locate the mandibular casts 3-dimensional (3D) spatial position in reference to its
corresponding maxillary cast on a virtual articulator. An industrial 3D scanner (ATOS
Compact Scan 5M; GOM GmbH) was used to digitize the casts and to obtain their virtual
occlusal records. They concluded the combination of left and right lateral occlusal
records was the most convenient. Additionally, the minimum optimum dimension for a
virtual occlusal record was 12×15 mm.[29]
Figure 1: An overview of current dental CAD/CAM systems using for the fabrication of
crown-bridge restorations.

18
Today, there are many different systems and scanners available in the market.
Currently, there are no laboratory or clinical studies that have assessed accuracy of digital
die trimming. Therefore, the purpose of this study will be to evaluate the accuracy of
digitally trimmed dies made using the 3M lava COS in comparison with the subgingival
contour of a extracted tooth to be restored with a full coverage all-ceramic crown.
Two null hypotheses will be considered. First, there will be no difference between
the original tooth morphology and the die made using CAD/CAM technology. In
addition, it is hypothesized there will be no difference between anterior and posterior
teeth.

19
CHAPTER III
MATERIAL AND METHODS
A power analysis was performed and it was determined for a difference of 95%
that a sample size of 20 specimens would be sufficient to test the hypotheses with a
power of 80% and medium effect size.
Twenty extracted human teeth (10 maxillary incisors and 10 molars) were utilized
in this study. The teeth were cleared of adherent material by scrubbing with detergent and
water, followed by immersion in 5.25% sodium hypochlorite solution for 10 minutes.
The teeth were stored in distilled water until mounted. The teeth were mounted on an
endodontic dentoform (ModuPro Endo; Acadental) using Aquasil easy mix putty
(Dentsply Caulk). The coronal one third of the root was covered with Durabase (Dental
Mfg. Co), which simulated the gingiva. Each tooth was mounted in its respective position
in the dentoform. One dentoform simulated a patient with a single crown preparation.
Two groups were made: Incisor group - with maxillary Incisors to be prepared; and
Molar group with 11 molars to be prepared.

20
Figure 2: Mounted incisor teeth in the dentoform
Figure 3: Mounted molar teeth in the dentoform
Each tooth was prepared to receive a single all-ceramic restoration. Preparations
were made with a total convergence angle of 10-20 degrees, incisal reduction or occlusal
reduction of 2 mm, uniform axial reduction of 1.5mm, and a deep chamfer for the facial

21
and a chamfer for the lingual finish lines. All finish lines were placed 1 mm supra-
gingival. All crown preparations were done by one experienced prosthodontist.
Figure 4: The prepared incisor tooth with titanium oxide spray applied before impression
making
Figure 5: The prepared molar tooth with titanium oxide spray applied before impression
making

22
Twenty digital impressions were made using the Lava™ Chairside Oral Scanner
(COS) (3M ESPE, St. Paul, Minn.) digital intra-oral scanning system. 3M Lava requires a
light powder coating (titanium oxide), which was applied with a battery-operated device
(Lava COS Powder Sprayer; 3M). During the scan, a pulsating blue light is emitted from
the wand head and an on-screen image of the teeth appears instantaneously. The “stripe
scanning” was completed as the wand was returned to scanning the occlusal of the
starting tooth. Once the scan was confirmed, a quick scan of the rest of the arch was
obtained. If there were holes in the scan and in areas where data was critical, the operator
scanned that specific area and the software then patched the hole. The buccal surfaces on
one side of the dentoform was lightly powdered, and a scan of the occluding teeth was
captured. The maxillary and mandibular scans are then digitally articulated on the screen.
Figures 6: The completed maxillary scan
23
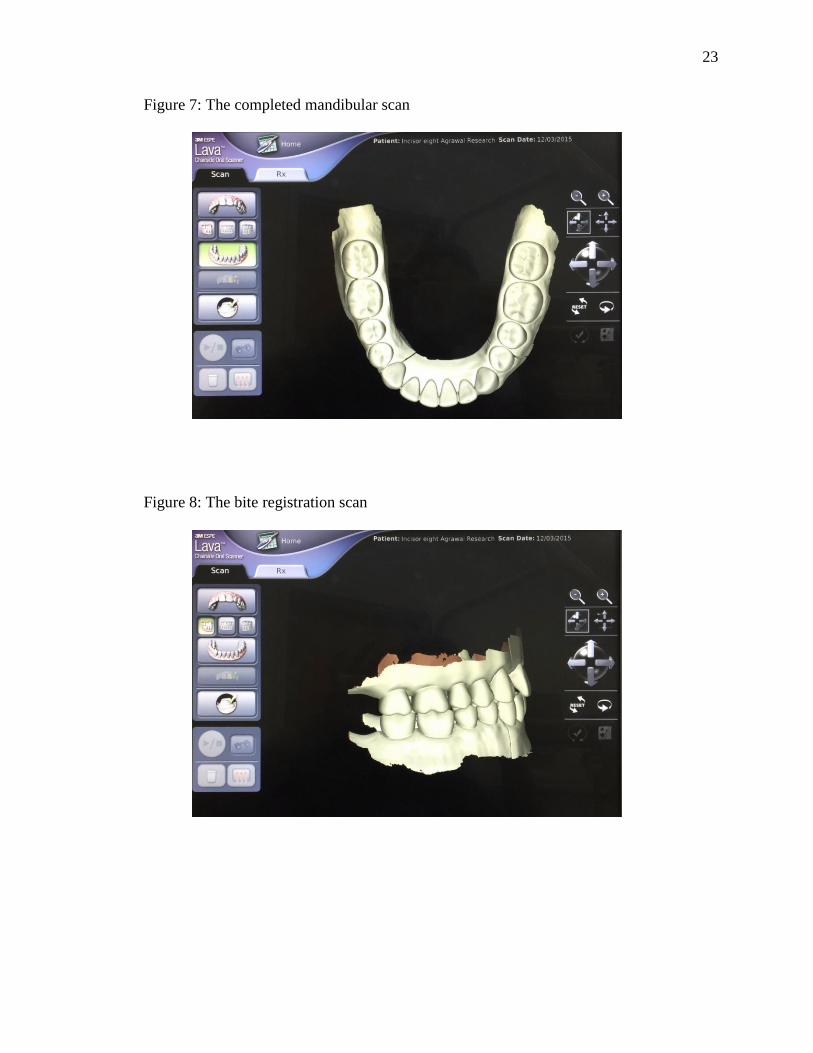
Figure 7: The completed mandibular scan
Figure 8: The bite registration scan

24
Figure 9: An anterior view of both arches in occlusion
After digital impressions and the bite registration were captured, data was
transferred to the 3M laboratory for fabrication of 20 SLA casts. The dies for the
preparations were digitally trimmed and the SLA casts with the dies were returned from
the laboratory to make measurements.
25
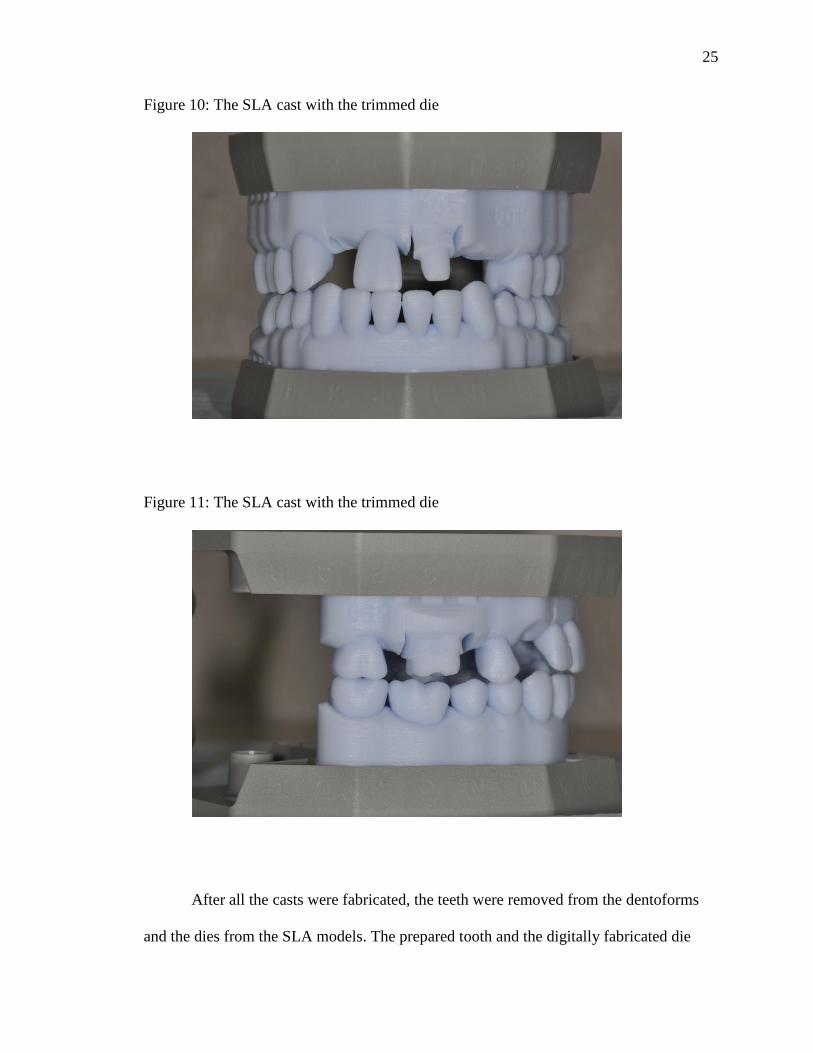
Figure 10: The SLA cast with the trimmed die
Figure 11: The SLA cast with the trimmed die
After all the casts were fabricated, the teeth were removed from the dentoforms
and the dies from the SLA models. The prepared tooth and the digitally fabricated die

26
corresponding to the preparation were then digitized by using the 3D lab scanner (D8100,
3 shape) in order to produce STL files.
Figure 12: The prepared tooth and SLA die
Figure 13: The prepared tooth and SLA die

27
Table 2: The tooth number and the corresponding model number
Incisor Number Model Number Tooth Number
I1 578674 #9
I2 573915 #9
I3 626341 #9
I4 626457 #9
I5 626564 #9
I6 626671 #9
I7 634535 #9
I8 634857 #9
I9 635144 #9
I10 647404 #9
Table 3: The tooth number and the corresponding model number
Molar Number Model Number Tooth Number
M1 574087 #18
M2 574095 #30
M3 573808 #3
M4 573949 #14
M5 573956 #30
M6 573964 #3
M7 574079 #18
M8 578690 #3
M9 609586 #30
M10 609693 #3
M11 579193 #30
Using the Rhino program (Rhino 5; McNeel North America), each prepared tooth
and the SLA model die were compared. The root surface area between the finish line and
2mm below the finish line were then compared to the subgingival morphology to
determine the accuracy. Statistical analyses were performed to compare the Volumes
(Total, Bucco-Lingual, Mesio-Distal), Distances and Angles of Prepared teeth and SLA
models.

28
Figure 14: The STL file images of the prepared tooth with its corresponding die
Three different parameters Volume, Length and Angle were tested and compared
between the teeth and the SLA die. The difference in volume were tested in 4 zones
named A, B, C, and D; the 4 zones were made by sectioning the tooth at 5 levels. Zone A
is an area between the lowest point on the margin of the preparation to the second level at
0.5mm, B zone extended from 0.5mm to 1mm, C zone from 1mm - 1.5mm, and D zone
1.5mm – 2mm. The bucco-lingual (BL) and mesio-distal (MD) volumes were also
calculated by sectioning the zones in BL and MD areas. The volume was measured for
both Incisors and Molars.

29
Figure 15: The sections and the zones A B C and D
Figure 16: The sections and the zones A B C and D

30
Figure 17: The 4 zones Model – zone A – black, zone B – gray zone, C – green zone, D –
cyan and Tooth –zone A – orange, zone B – gold, zone C – pink, zone D – magenta from
the interproximal aspect
Figure 18: The same 4 A B C and D zones from the buccal aspect

31
Figure 19: The bucco-lingual and the mesio-distal sections
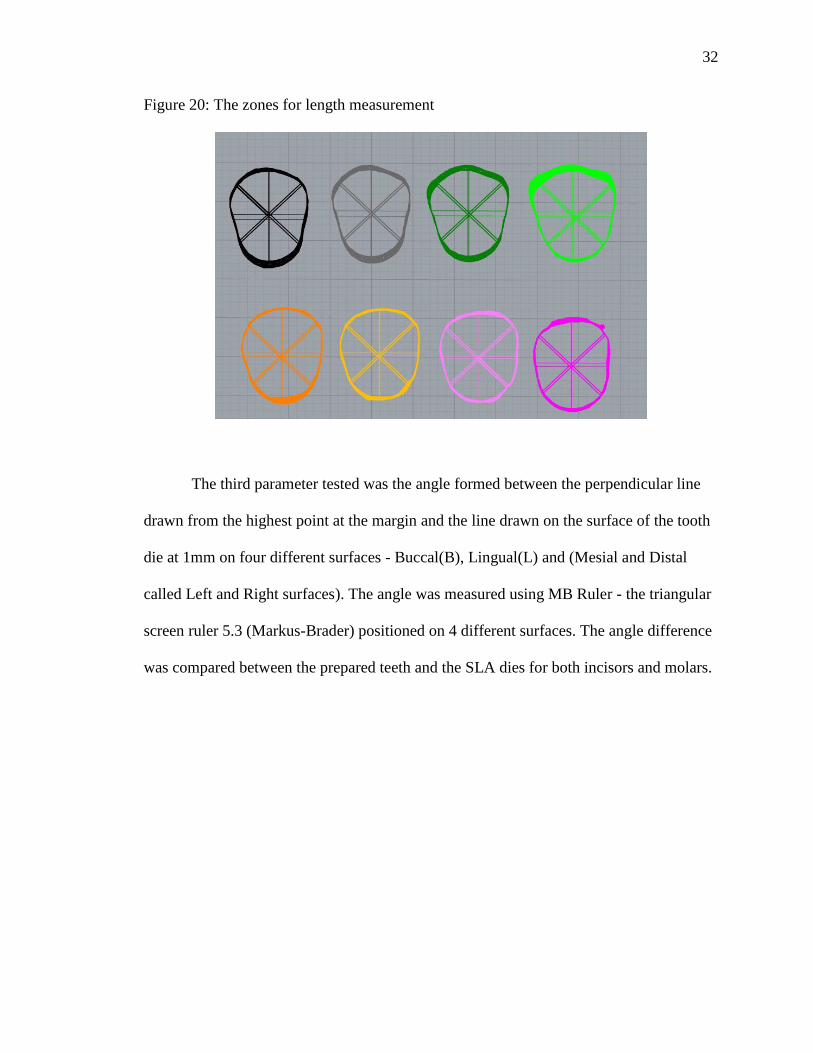
The second parameter tested was length. The BL and the MD length was
measured for zones A, B, C, and D. The length was measured at the upper and the lower
surface of each zone and an average was obtained for each zone. The lengths were
compared between teeth and SLA model and measured for both incisors and molars.
32
Figure 20: The zones for length measurement
The third parameter tested was the angle formed between the perpendicular line
drawn from the highest point at the margin and the line drawn on the surface of the tooth
die at 1mm on four different surfaces - Buccal(B), Lingual(L) and (Mesial and Distal
called Left and Right surfaces). The angle was measured using MB Ruler - the triangular
screen ruler 5.3 (Markus-Brader) positioned on 4 different surfaces. The angle difference
was compared between the prepared teeth and the SLA dies for both incisors and molars.

33
Figure 21: A schematic representation of an angle measurement
Statistical Analysis
One examiner (P.B.) collected all the data for angle, length and volume. These
measurements were recorded in a spreadsheet (Excel 2013, Microsoft). All statistical
computations were done in IBM SPSS Statistics 23.
Statistical analyses were performed to compare the volumes, length and angles of
prepared teeth and SLA models using paired t-test, at the bucco-lingual (BL) and mesio-
distal (MD) surfaces. Based on the Q-Q plots, no significant departure from normal
distributions was observed, p-values were adjusted by Bonferroni correction to address
the multiplicity of hypotheses testing with familywise error rate controlled of 0.05.

34
CHAPTER IV
RESULTS
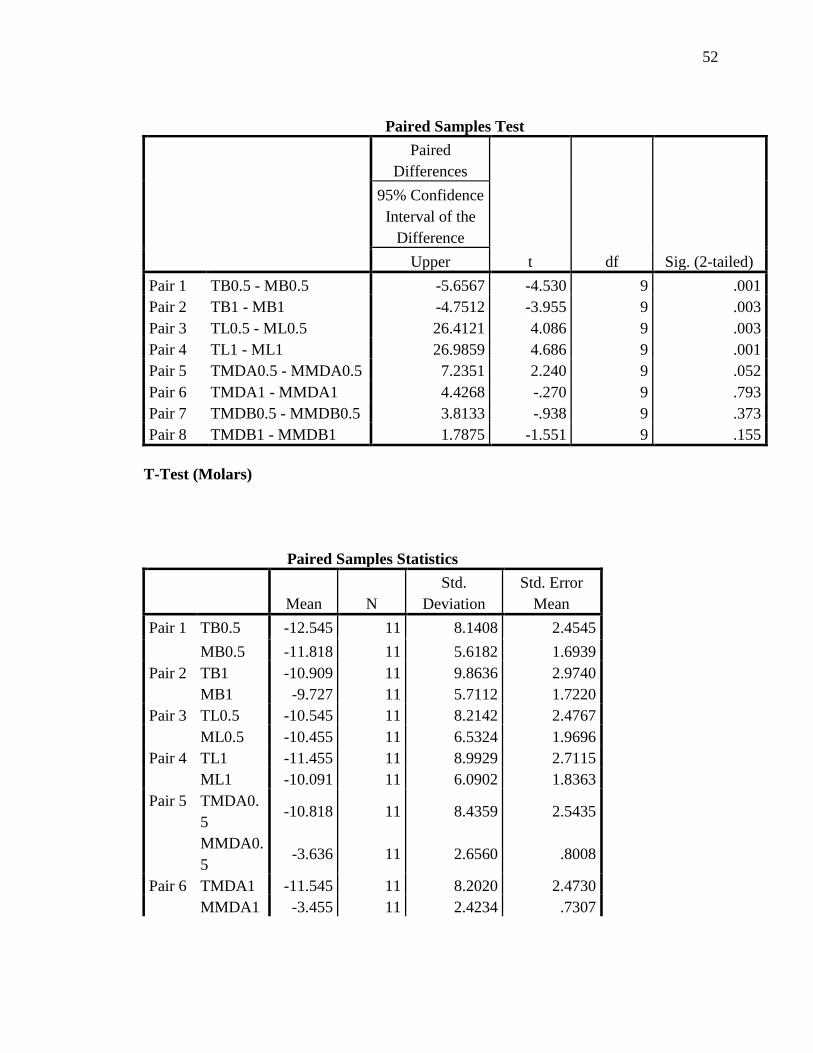
Angle analysis in degree (0)
Table 4: shows the mean and standard deviations for angle comparison measured on four
surfaces – buccal, lingual, mesial and distal for both teeth and SLA models, and for
incisors and molars. In the incisor group, statistically significant difference was noted on
bucco-lingual surfaces between the teeth and the SLA models (P value<0.05) whereas for
the molar group there was a statistically significant difference in mesio-distal surfaces (P
value<0.05)
Note: * indicates the statistical significant difference between same alphabets
superscripted
Incisors Molars
Mean (○) SD Mean (
○) SD
Bucco-
Lingual
(BL)
Teeth (B) -3.3a 8.39 -10.9 9.86
SLA (B) 7.8a* 3.36 -9.7 5.71
Teeth (L) -3.2b 13.87 -11.5 8.99
SLA (L) -21.4b* 5.38 -10.1 6.09
Mesio-
Distal
(MD)
Teeth (M) -4.5 7.25 -11.5c 8.20
SLA (M) -3.9 3.60 -3. 5c* 2.42
Teeth (D) -11.3 8.07 -15.1d 5.19
SLA (D) -7.4 3.83 -8.2d* 5.34

35
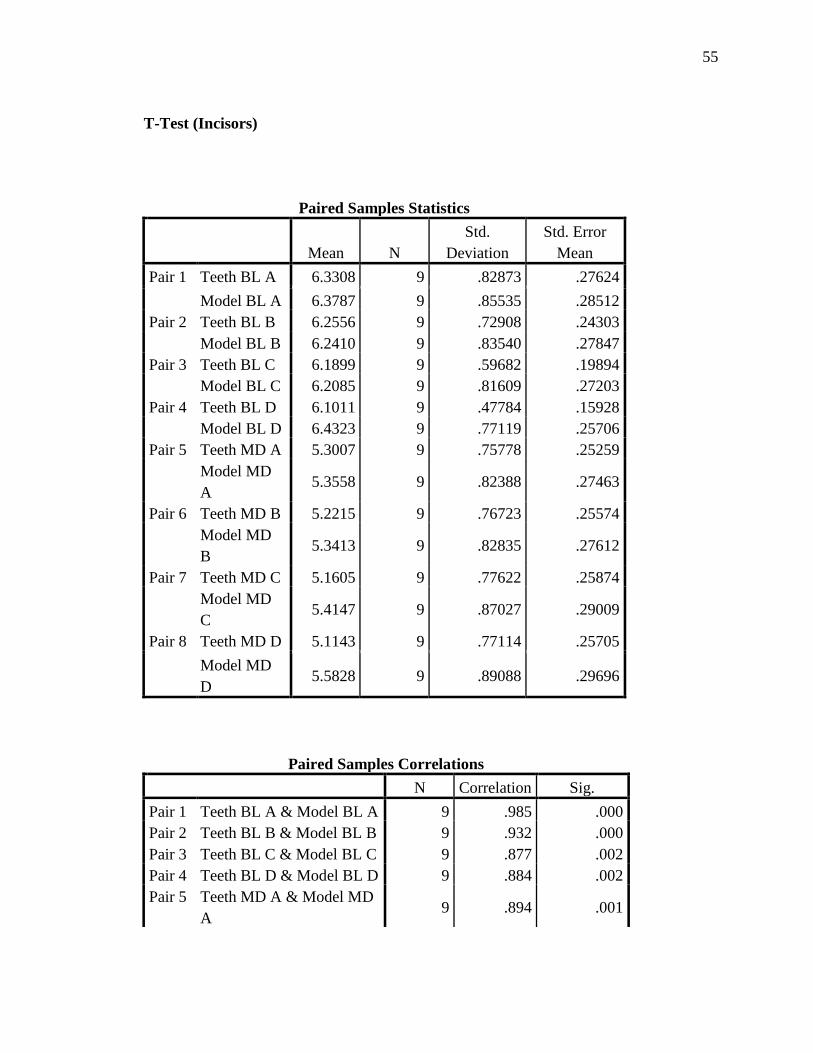
Length measured in millimeter (mm)
Table 5: shows the mean and standard deviations for length comparison measured at
Zone A, B, C, and D for both teeth and SLA models. The table also shows the numbers
for both incisors and molars. In the incisor group statistically significant difference was
noted in Zone D for both bucco-lingual and mesio-distal surfaces between the teeth and
the SLA models (P value<0.05) whereas for the molar group there was statistical
significant difference in Zone C and D for bucco-lingual (P value <0.05) and Zone A, B,
C, and D for mesio-distal surfaces (P value <0.05)
Zone Incisors Molars
Mean (mm) SD Mean (mm) SD
BL A Teeth 6.33 .83 10.08 1.77
SLA 6.38 .86 10.19 1.47
B Teeth 6.26 .73 9.76 1.86
SLA 6.24 .84 9.96 1.50
C Teeth 6.19 .60 9.42 c 1.98
SLA 6.21 .87 9.99 c* 1.43
D Teeth 6.10 a .48 9.14 d 2.12
SLA 6.43 a* .77 10.28 d* 1.40
M
D
A Teeth 5.30 .76 8.87 e .96
SLA 5.36 .82 9.49 e* 1.11
B Teeth 5.22 .77 8.65 f .95
SLA 5.34 .83 9.47 f* 1.13
C Teeth 5.16 .78 8.37 g .86
SLA 5.41 .87 9.58 g* 1.21
D Teeth 5.11 b .77 8.17 h .83
SLA 5.58 b* .89 9.81 h* 1.27
Note: * indicates the statistical significant difference between same alphabets
superscripted

36
Volume (mm3)
Table 6: shows the mean and standard deviations for volume comparison measured at
Zone A, B, C, and D for teeth and SLA models. The table also shows the numbers for
both incisors and molars. In the incisor group statistically significant difference was
noted in Zone D for both bucco-lingual (P value<0.05) and mesio-distal surfaces (P
value<0.05) between the teeth and the SLA models whereas for the molar group there
was statistical significant difference in Zone C and D for bucco-lingual (P value<0.05)
and Zone A, B, C, and D for mesio-distal surfaces (P value<0.05)
Volume Incisors Molars
Mean (mm3) SD Mean (mm3) SD
BL A Teeth 7.50 1.91 21.43 7.10
SLA 7.72 2.10 21.88 6.30
B Teeth 7.54 1.69 20.74 6.63
SLA 7.60 1.89 21.30 6.09
C Teeth 7.14 1.62 19.78 c 6.37
SLA 7.60 1.88 21.26 c* 6.04
D Teeth 7.10 a 1.13 18.73 d 6.46
SLA 8.28 a* 1.93 22.76 d* 5.89
M
D
A Teeth 5.64 1.14 17.67 e 3.72
SLA 6.38 1.82 19.85 e* 4.96
B Teeth 5.64 1.22 16.82 f 3.32
SLA 6.32 1.81 19.29 f* 4.20
C Teeth 5.50 1.29 15.90 g 3.00
SLA 6.48 1.91 19.70 g* 4.36
D Teeth 5.44 b 1.28 15.02 h 2.72
SLA 7.00 b* 2.09 21.02 h* 4.77
Note: * indicates the statistical significant difference between same alphabets
superscripted.

37
CHAPTER V
DISCUSSION
The comparison of die trim morphology made by CAD/CAM technology was
investigated. The present study was designed to test the accuracy of the die trimmed
using the Lava COS scanner to the root morphology of the prepared tooth. Three
different parameters were tested the angle, volume and length. The null hypotheses was
rejected as there is statistically significant difference between the CAD/CAM generated
dies and the corresponding prepared teeth in both incisor and molar groups.
An over-contoured restoration has margin overhangs at the edge of the tooth, food
and bacterial plaque can accumulate along the margins, leading to inflammation and
caries. Also, the overcontoured restorations in many studies have found to be more
detrimental to the surrounding tissue than an undercontoured/flat crown.[30, 31] Perel
conducted a study on dogs and stated overcontour produced inflammation whereas
undercontour did not.[31] Parkinson did a study on 50 restorations (25 cast metal and 25
PFM crowns). He found that there was an increase in faciolingual dimension in the final
restorations and that the plaque index was significantly higher for both the PFM and full
cast metal crowns versus control teeth. The less axial accentuation of prominences on full
crown restorations, the less the quantity of plaque.[32] Hence, importance should be
given to developing a normal contour to the restoration. In 1969, Kraus et al gave the
anatomic theory which stated anatomic or biological concept of a tooth contour are
important and that stimulated natural, healthy, self-protecting teeth.[33] The clinical
implication being that an area 2-3 mm below the finish line determines the emergence

38
profile of a final restoration. Emergence profile plays a key role in development of a life-
like final restoration and maintenance of gingival health. For this reason, clinicians and
technicians attempt to capture and replicate tooth subgingival morphology below the
finish line of the preparation. Gingival retraction materials such as retraction cords,
lasers, retraction paste and other methods enable clinicians to capture the critical area
below the finish line. Laboratory technicians have given importance to trimming the dies
at the marginal zone, area the 2-3 mm below the finish line; however, until now there
have been no studies evaluating the accuracy of die trimming morphology made using
CAD/CAM technology, compared with the subgingival tooth surfaces. Robert Nedelcu et
al conducted a study to compared accuracy of casts made with different intraoral scanners
and casts poured by conventional impression techniques.[28] Segal et al (1984) and
Diego (1992) placed huge importance on capturing and maintaining the 2 mm marginal
zone on a die, by purposing different die trimming techniques to maintain this critical
area.[17, 19] They reasoned that it was necessary for development of an ideal emergence
profile restorations/crowns and would mimic the cervical third of the unprepared tooth.
This study took into account this concept and applied it to CAD/CAM trimmed dies.
With respect to angle values for Incisors, there were statistically significant
differences on the buccal and lingual surfaces. The buccal surface angle of the SLA dies
had positive value (7.8°) compared with negative value (-3.3°) of the teeth. In addition,
the lingual surface angle (-21.4°) of the SLA dies demonstrated the very large values
difference compared with the teeth (-3.2°). For this difference of incisors, the certain
angulation of maxillary anterior teeth should be taken into consideration (Figures 22 and
23). Andrews et al discussed the six keys for normal occlusion, the six keys being molar

39
relationship, crown angulation - the mesio-distal tip, crown inclination (labio-lingual or
bucco-lingual inclination), rotations, tight contacts and occlusal plane. He explained that
the maxillary central and lateral incisors have a natural labio-lingual inclination which
may be different in individuals which might be a reason for the difference noted between
the prepared teeth and the SLA model dies.[34]
Figure 22: Ange difference in bucco-lingual direction between teeth and SLA model

40
Figure 23: Andrews article showing the natural inclination in maxillary anterior teeth
While the maxillary anterior teeth have certain angulation towards labial
direction, the SLA dies were trimmed parallel to the long axis of the tooth, which could
produce large different angle values at the buccal and lingual surface compared with the
teeth subgingival morphology.
On the other hands, molars have the different angulation patterns, such as curve of
Spee and curve of Wilson. Due to curve of Spee, the mandibular molars have the
tendency to tilt toward mesial direction. The present study showed only MD surfaces of
molars had significant difference, which can be explained by the curve of Spee.[34]
With regards to length for incisors, statistically significant differences were found
in zone D bucco-lingually (BL) and mesio-distally (MD) wherein the length values of
SLA dies were greater than the values of the prepared tooth. Graphs 1 and 2 shows the
trend line for the BL length changes: the graph shows the value difference between the
length of the certain zone and the length of zone A. The prepared teeth became narrower,
while SLA dies became greater in zones D after zone C.

41
Graphs 1: Bucco-Lingual length changes between zones: Incisors
Graphs 2: Mesio-Distal length changes between zones: Incisors
In terms of the length of molars, there was statistically significant difference in
the zones C and D at BL surfaces wherein the SLA model is greater than the prepared
tooth. Graph 3 indicates the trend line for the BL length of molars; the prepared teeth
became narrower while the SLA dies become bigger in zones C and D. There was
statistically significant difference in all four zones mesio-distally wherein the SLA model
is bigger than the prepared tooth. The trend line Graph 4 for the MD length shows that
-0.3
-0.2
-0.1
0
0.1
B-A C-A D-A
Incisor - BL length Comparison
Natural Model
-0.3
-0.2
-0.1
0
0.1
0.2
0.3
B-A C-A D-A
Incisor - MD length Comparison
Natural Model

42
the prepared tooth becomes narrower compared to the SLA model where the trend is
similar to teeth in Zones A and B but changes to become bigger in Zones C and D.
Graphs 3: Bucco-Lingual length changes between zones: Molars
Graphs 4: Mesio-Distal length changes between zones: Molars
Note: B-A: value difference between the length of zone A and zone B; C-A: value
difference between the length of zone A and zone C: D-A: value difference between the
length of zone A and zone D
For the total volume of the incisors, there was statistically significant difference
for zones C and D wherein the SLA model was greater in volume than the prepared tooth.
-1.5
-1
-0.5
0
B-A C-A D-A
Molar - BL length Comparison
Natural Model
-1
-0.5
0
0.5
B-A C-A D-A
Molar - MD length Comparison
Natural Model

43
Graphs 5 and 6 demonstrates the trend line, which shows that the prepared teeth
becomes narrower , compared to the SLA model where the volume decreases from zone
A to B but increases from zone C to D.
Graphs 5: The total volume change between zones: Incisors
Graphs 6: The total volume change between zones: Molars
Note: B-A: value difference between the total volume of zone A and zone B; C-A: value
difference between the total volume of zone A and zone C: D-A: value difference
between the total volume of zone A and zone.
The trend line shows that volume values showed similar trends as the bucco-
-10
-5
0
5
10
15
B-A C-A D-A
Incisor - Volume Change
Natual Model
-80
-60
-40
-20
0
20
40
B-A C-A D-A
Molar - Volume Change
Natural Model

44
lingual and mesio-distal lengths. The volume and length data emphasized on the fact that
natural teeth are more flat in profile and the corresponding SLA die is more concave
which might clinically imply that the final restorations made of these dies would be
overcontoured. In addition, furcation involvement should be taken into consideration for
the molars as the dies do not account for the taper and narrow area of furcation.
Figure 24: The SLA die is not trimmed considering the furcation which can be
appreciated between the mesial and the distal roots of the mandibular molar
One of the reason why the BL volume of the SLA dies was larger than the volume
of the prepared tooth was the SLA dies did not consider the furcation involvement in
molars, which could affect the proposed restoration contour and the periodontal
maintenance associated with the contour.
There are several limitations of this research with respect to methods, material,
and technology used. Future scope for research in this topic would be the repeat the same

45
study and add a third group of dies made using the conventional impression technique
and die trim technology, then comparing the accuracy between teeth, stone dies and
CAD/CAM dies. Also, final crowns could be fabricated on these dies and compared to
the unprepared corresponding tooth and more definitive conclusions could be derived
regarding the relation between the over/under trimming a die and over/under contouring a
restoration. The current study used only incisors and molar teeth the study could possibly
be repeated with premolars and canines and evaluate the possibility of difference
depending on the location and anatomy of the teeth more precisely. The current study
used only the Lava COS the results cannot be directly applied to other systems so there is
a scope to repeat the same study with different scanning systems.

46
CHAPTER VI
CONCLUSIONS
Within the limitations of this study, the following conclusions have been drawn:
1. For the angle analysis of CAD/CAM die trim morphology, the incisor group
demonstrated significant difference at the BL surfaces. On the contrary, the molar
group showed significant difference at the MD surfaces.
2. For the evaluation of length and volume of CAD/CAM die trim morphology, the
incisor group showed significant difference at zone D of both BL and MD
surfaces. However, significant differences at zone C and D of BL surfaces and all
zones of MD surfaces was noticed in the molar group.

47
BIBLIOGRAPHY
1. Chan, D.C., et al., The accuracy of optical scanning: influence of convergence
and die preparation. Oper Dent, 2011. 36(5): p. 486-91.
2. Mansueto, M.A. and R.D. Phoenix, A comprehensive approach to die trimming. J
Prosthodont, 1994. 3(4): p. 251-5.
3. Tanquist, R.A., Die trimming: a guide to physiologic contour. J Prosthet Dent,
1982. 48(4): p. 485-9.
4. Beck, D.B., Precision technique for trimming dies using a magnification device. J
Prosthet Dent, 1980. 43(5): p. 590-1.
5. Croll, B.M., Emergence profiles in natural tooth contour. Part I: Photographic
observations. J Prosthet Dent, 1989. 62(1): p. 4-10.
6. Croll, B.M., Emergence profiles in natural tooth contour. Part II: Clinical
considerations. J Prosthet Dent, 1990. 63(4): p. 374-9.
7. Sverker Toreskog, D.D.S., M.S.D.,” Ralph W. Phillips, M.S., D.Sc.,*” and and
D.D.S. Richard J. Schnell, M.S., Properties of Die Materials: A Comparative
Study. Journal of Prosthetic Dentistry, 1966. 16(1): p. 119-131.
8. Stackhouse, J.A., Jr., The accuracy of stone dies made from rubber impression
materials. J Prosthet Dent, 1970. 24(4): p. 377-86.
9. Crispin, B.J., et al., Silver-plated dies. Part I: Platability of impression materials.
J Prosthet Dent, 1984. 51(5): p. 631-6.
10. Crispin, B.J., J.F. Watson, and K.R. Frawley, Silver-plated dies. Part II: Marginal
accuracy of cast restorations. J Prosthet Dent, 1984. 51(6): p. 768-73.
11. Gerrow, J.D. and R.B. Price, Comparison of the surface detail reproduction of
flexible die material systems. J Prosthet Dent, 1998. 80(4): p. 485-9.
12. Kenyon, B.J., et al., Dimensional accuracy of 7 die materials. J Prosthodont,
2005. 14(1): p. 25-31.
13. Prisco, R., G. Cozzolino, and P. Vigolo, Dimensional accuracy of an epoxy die
material using different polymerization methods. J Prosthodont, 2009. 18(2): p.
156-61.
14. Nomura, G.T., M.H. Reisbick, and J.D. Preston, An investigation of epoxy resin
dies. J Prosthet Dent, 1980. 44(1): p. 45-50.

48
15. Myers, M. and J.H. Hembree, Jr., Relative accuracy of four removable die
systems. J Prosthet Dent, 1982. 48(2): p. 163-5.
16. Ghahremannezhad, H.H., et al., Effects of cyanoacrylates on die stone. J Prosthet
Dent, 1983. 49(5): p. 639-46.
17. Segal, A.G., M.J. Gibbons, and L. Zaslow, An alternative to trimming dies. J
Prosthet Dent, 1984. 52(1): p. 138-9.
18. Windhorn, R.J., A simple technique for exposing margins on a solid working cast.
J Prosthet Dent, 1998. 80(2): p. 246-8.
19. Velasquez, D., Protecting the finish of stone dies during trimming. J Prosthet
Dent, 1992. 68(3): p. 557-8.
20. Duret, F. and J.D. Preston, CAD/CAM imaging in dentistry. Curr Opin Dent,
1991. 1(2): p. 150-4.
21. Miyazaki, T., et al., A review of dental CAD/CAM: current status and future
perspectives from 20 years of experience. Dent Mater J, 2009. 28(1): p. 44-56.
22. Syrek, A., et al., Clinical evaluation of all-ceramic crowns fabricated from
intraoral digital impressions based on the principle of active wavefront sampling.
J Dent, 2010. 38(7): p. 553-9.
23. Seelbach, P., C. Brueckel, and B. Wostmann, Accuracy of digital and
conventional impression techniques and workflow. Clin Oral Investig, 2013.
17(7): p. 1759-64.
24. Grunheid, T., S.D. McCarthy, and B.E. Larson, Clinical use of a direct chairside
oral scanner: an assessment of accuracy, time, and patient acceptance. Am J
Orthod Dentofacial Orthop, 2014. 146(5): p. 673-82.
25. Patzelt, S.B., et al., The time efficiency of intraoral scanners: an in vitro
comparative study. J Am Dent Assoc, 2014. 145(6): p. 542-51.
26. Patzelt, S.B., et al., Accuracy of computer-aided design/computer-aided
manufacturing-generated dental casts based on intraoral scanner data. J Am
Dent Assoc, 2014. 145(11): p. 1133-40.
27. Guth, J.F., et al., Accuracy of digital models obtained by direct and indirect data
capturing. Clin Oral Investig, 2013. 17(4): p. 1201-8.
28. Nedelcu, R.G. and A.S. Persson, Scanning accuracy and precision in 4 intraoral
scanners: an in vitro comparison based on 3-dimensional analysis. J Prosthet
Dent, 2014. 112(6): p. 1461-71.

49
29. Solaberrieta, E., et al., Determining the requirements, section quantity, and
dimension of the virtual occlusal record. J Prosthet Dent, 2016. 115(1): p. 52-6.
30. Jameson, L.M. and W.F. Malone, Crown contours and gingival response. J
Prosthet Dent, 1982. 47(6): p. 620-4.
31. Perel, M.L., Axial crown contours. J Prosthet Dent, 1971. 25(6): p. 642-9.
32. Parkinson, C.F., Excessive crown contours facilitate endemic plaque niches. J
Prosthet Dent, 1976. 35(4): p. 424-9.
33. Dahlberg, A.A., Physical Anthropology: Dental Anatomy and Occlusion: A Study
of the Masticatory System. BERTRAM S. KRAUS, RONALD E. JORDAN, and
LEONARD ABRAMS. American Anthropologist, 1971. 73(4): p. 941-942.
34. Andrews, L.F., The six keys to normal occlusion. American journal of
orthodontics, 1972. 62(3): p. 296-309.
50
APPENDIX A
Statistical Tables –
1. Angle
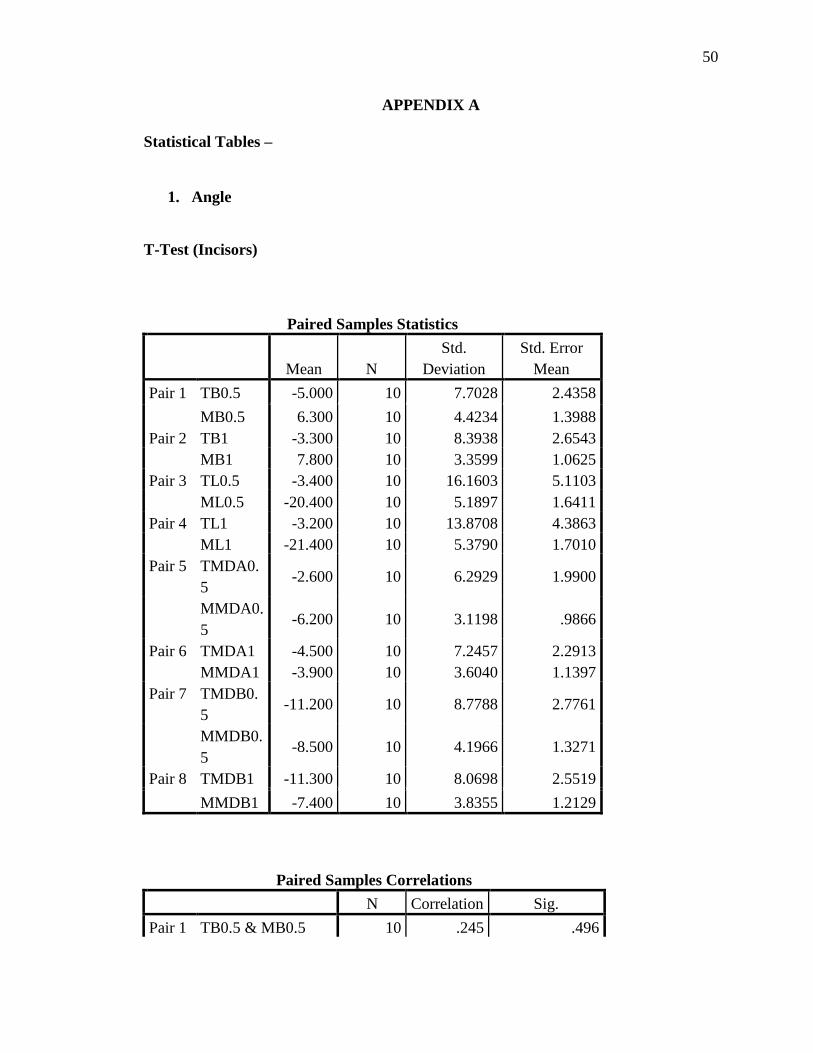
T-Test (Incisors)
Paired Samples Statistics
Mean N
Std.
Deviation
Std. Error
Mean
Pair 1 TB0.5 -5.000 10 7.7028 2.4358
MB0.5 6.300 10 4.4234 1.3988
Pair 2 TB1 -3.300 10 8.3938 2.6543
MB1 7.800 10 3.3599 1.0625
Pair 3 TL0.5 -3.400 10 16.1603 5.1103
ML0.5 -20.400 10 5.1897 1.6411
Pair 4 TL1 -3.200 10 13.8708 4.3863
ML1 -21.400 10 5.3790 1.7010
Pair 5 TMDA0.
5 -2.600 10 6.2929 1.9900
MMDA0.
5 -6.200 10 3.1198 .9866
Pair 6 TMDA1 -4.500 10 7.2457 2.2913
MMDA1 -3.900 10 3.6040 1.1397
Pair 7 TMDB0.
5 -11.200 10 8.7788 2.7761
MMDB0.
5 -8.500 10 4.1966 1.3271
Pair 8 TMDB1 -11.300 10 8.0698 2.5519
MMDB1 -7.400 10 3.8355 1.2129
Paired Samples Correlations
N Correlation Sig.
Pair 1 TB0.5 & MB0.5 10 .245 .496

51
Pair 2 TB1 & MB1 10 .053 .885
Pair 3 TL0.5 & ML0.5 10 .685 .029
Pair 4 TL1 & ML1 10 .472 .168
Pair 5 TMDA0.5 &
MMDA0.5 10 .599 .067
Pair 6 TMDA1 &
MMDA1 10 .308 .386
Pair 7 TMDB0.5 &
MMDB0.5 10 .160 .659
Pair 8 TMDB1 &
MMDB1 10 .269 .453
Paired Differences
Mean
Std.
Deviatio
n
Std. Error
Mean
95% Confidence
Interval of the
Difference
Lower
Pair
1
TB0.5 -
MB0.5
-
11.3000 7.8888 2.4947 -16.9433
Pair
2
TB1 -
MB1
-
11.1000 8.8751 2.8065 -17.4488
Pair
3
TL0.5 -
ML0.5 17.0000 13.1572 4.1607 7.5879
Pair
4
TL1 - ML1 18.2000 12.2819 3.8839 9.4141
Pair
5
TMDA0.5
-
MMDA0.5
3.6000 5.0816 1.6069 -.0351
Pair
6
TMDA1 -
MMDA1 -.6000 7.0269 2.2221 -5.6268
Pair
7
TMDB0.5
-
MMDB0.5
-2.7000 9.1049 2.8792 -9.2133
Pair
8
TMDB1 -
MMDB1 -3.9000 7.9505 2.5142 -9.5875
52
Paired Samples Test
Paired
Differences
t df Sig. (2-tailed)
95% Confidence
Interval of the
Difference
Upper
Pair 1 TB0.5 - MB0.5 -5.6567 -4.530 9 .001
Pair 2 TB1 - MB1 -4.7512 -3.955 9 .003
Pair 3 TL0.5 - ML0.5 26.4121 4.086 9 .003
Pair 4 TL1 - ML1 26.9859 4.686 9 .001
Pair 5 TMDA0.5 - MMDA0.5 7.2351 2.240 9 .052
Pair 6 TMDA1 - MMDA1 4.4268 -.270 9 .793
Pair 7 TMDB0.5 - MMDB0.5 3.8133 -.938 9 .373
Pair 8 TMDB1 - MMDB1 1.7875 -1.551 9 .155
T-Test (Molars)
Paired Samples Statistics
Mean N
Std.
Deviation
Std. Error
Mean
Pair 1 TB0.5 -12.545 11 8.1408 2.4545
MB0.5 -11.818 11 5.6182 1.6939
Pair 2 TB1 -10.909 11 9.8636 2.9740
MB1 -9.727 11 5.7112 1.7220
Pair 3 TL0.5 -10.545 11 8.2142 2.4767
ML0.5 -10.455 11 6.5324 1.9696
Pair 4 TL1 -11.455 11 8.9929 2.7115
ML1 -10.091 11 6.0902 1.8363
Pair 5 TMDA0.
5 -10.818 11 8.4359 2.5435
MMDA0.
5 -3.636 11 2.6560 .8008
Pair 6 TMDA1 -11.545 11 8.2020 2.4730
MMDA1 -3.455 11 2.4234 .7307

53
Pair 7 TMDB0.
5 -14.455 11 6.8317 2.0598
MMDB0.
5 -9.636 11 5.9879 1.8054
Pair 8 TMDB1 -15.091 11 5.1856 1.5635
MMDB1 -8.182 11 5.3445 1.6114
Paired Samples Correlations
N Correlation Sig.
Pair 1 TB0.5 & MB0.5 11 .153 .653
Pair 2 TB1 & MB1 11 -.125 .715
Pair 3 TL0.5 & ML0.5 11 .470 .144
Pair 4 TL1 & ML1 11 .498 .119
Pair 5 TMDA0.5 &
MMDA0.5 11 .608 .047
Pair 6 TMDA1 &
MMDA1 11 .248 .462
Pair 7 TMDB0.5 &
MMDB0.5 11 -.049 .885
Pair 8 TMDB1 &
MMDB1 11 -.080 .815
Paired Differences
Mean
Std.
Deviati
on
Std.
Error
Mean
95% Confidence
Interval of the
Difference
Lower
Pair 1 TB0.5 -
MB0.5 -.7273 9.1552 2.7604 -6.8778
Pair 2 TB1 -
MB1 -1.1818
11.998
5 3.6177 -9.2425
Pair 3 TL0.5 -
ML0.5 -.0909 7.7260 2.3295 -5.2813

54
Pair 4 TL1 -
ML1 -1.3636 7.9658 2.4018 -6.7152
Pair 5 TMDA0.
5 -
MMDA0
.5
-7.1818 7.1389 2.1525 -11.9778
Pair 6 TMDA1
-
MMDA1
-8.0909 7.9556 2.3987 -13.4355
Pair 7 TMDB0.
5 -
MMDB0
.5
-4.8182 9.3040 2.8052 -11.0687
Pair 8 TMDB1
-
MMDB1
-6.9091 7.7389 2.3334 -12.1082
Paired Samples Test
Paired
Differences
t df Sig. (2-tailed)
95% Confidence
Interval of the
Difference
Upper
Pair 1 TB0.5 - MB0.5 5.4233 -.263 10 .798
Pair 2 TB1 - MB1 6.8789 -.327 10 .751
Pair 3 TL0.5 - ML0.5 5.0995 -.039 10 .970
Pair 4 TL1 - ML1 3.9879 -.568 10 .583
Pair 5 TMDA0.5 - MMDA0.5 -2.3859 -3.337 10 .008
Pair 6 TMDA1 - MMDA1 -2.7463 -3.373 10 .007
Pair 7 TMDB0.5 - MMDB0.5 1.4323 -1.718 10 .117
Pair 8 TMDB1 - MMDB1 -1.7100 -2.961 10 .014
2. Length
55
T-Test (Incisors)
Paired Samples Statistics
Mean N
Std.
Deviation
Std. Error
Mean
Pair 1 Teeth BL A 6.3308 9 .82873 .27624
Model BL A 6.3787 9 .85535 .28512
Pair 2 Teeth BL B 6.2556 9 .72908 .24303
Model BL B 6.2410 9 .83540 .27847
Pair 3 Teeth BL C 6.1899 9 .59682 .19894
Model BL C 6.2085 9 .81609 .27203
Pair 4 Teeth BL D 6.1011 9 .47784 .15928
Model BL D 6.4323 9 .77119 .25706
Pair 5 Teeth MD A 5.3007 9 .75778 .25259
Model MD
A 5.3558 9 .82388 .27463
Pair 6 Teeth MD B 5.2215 9 .76723 .25574
Model MD
B 5.3413 9 .82835 .27612
Pair 7 Teeth MD C 5.1605 9 .77622 .25874
Model MD
C 5.4147 9 .87027 .29009
Pair 8 Teeth MD D 5.1143 9 .77114 .25705
Model MD
D 5.5828 9 .89088 .29696
Paired Samples Correlations
N Correlation Sig.
Pair 1 Teeth BL A & Model BL A 9 .985 .000
Pair 2 Teeth BL B & Model BL B 9 .932 .000
Pair 3 Teeth BL C & Model BL C 9 .877 .002
Pair 4 Teeth BL D & Model BL D 9 .884 .002
Pair 5 Teeth MD A & Model MD
A 9 .894 .001

56
Pair 6 Teeth MD B & Model MD
B 9 .887 .001
Pair 7 Teeth MD C & Model MD
C 9 .883 .002
Pair 8 Teeth MD D & Model MD
D 9 .883 .002
Paired Differences
Mean
Std.
Deviat
ion
Std.
Error
Mean
95% Confidence
Interval of the
Difference
Lower
Pair 1 Teeth BL A -
Model BL A -.04794 .14702 .04901 -.16095
Pair 2 Teeth BL B -
Model BL B .01456 .30628 .10209 -.22087
Pair 3 Teeth BL C -
Model BL C -.01861 .40940 .13647 -.33330
Pair 4 Teeth BL D -
Model BL D -.33128 .41462 .13821 -.64998
Pair 5 Teeth MD A -
Model MD A -.05511 .36997 .12332 -.33949
Pair 6 Teeth MD B -
Model MD B -.11983 .38417 .12806 -.41513
Pair 7 Teeth MD C -
Model MD C -.25422 .40888 .13629 -.56851
Pair 8 Teeth MD D -
Model MD D -.46844 .41889 .13963 -.79043
Paired Samples Test
Paired
Differences t df
Sig. (2-
tailed)
57
95% Confidence
Interval of the
Difference
Upper
Pair 1 Teeth BL A - Model BL A .06506 -.978 8 .357
Pair 2 Teeth BL B - Model BL B .24998 .143 8 .890
Pair 3 Teeth BL C - Model BL C .29608 -.136 8 .895
Pair 4 Teeth BL D - Model BL D -.01257 -2.397 8 .043
Pair 5 Teeth MD A - Model MD A .22927 -.447 8 .667
Pair 6 Teeth MD B - Model MD B .17546 -.936 8 .377
Pair 7 Teeth MD C - Model MD C .06007 -1.865 8 .099
Pair 8 Teeth MD D - Model MD D -.14646 -3.355 8 .010
T-Test (Molars)
Paired Samples Statistics
Mean N
Std.
Deviation
Std. Error
Mean
Pair 1 Teeth BL A 10.0846 11 1.76651 .53262
Model BL A 10.1868 11 1.47102 .44353
Pair 2 Teeth BL B 9.7593 11 1.86018 .56086
Model BL B 9.9561 11 1.49778 .45160
Pair 3 Teeth BL C 9.4216 11 1.97509 .59551
Model BL C 9.9922 11 1.43002 .43117
Pair 4 Teeth BL D 9.1374 11 2.11914 .63895
Model BL D 10.2846 11 1.40469 .42353
Pair 5 Teeth MD A 8.8728 11 .96194 .29003
Model MD A 9.4890 11 1.11154 .33514
Pair 6 Teeth MD B 8.6542 11 .94862 .28602
Model MD B 9.4656 11 1.12862 .34029
Pair 7 Teeth MD C 8.3726 11 .86117 .25965
Model MD C 9.5781 11 1.20705 .36394
Pair 8 Teeth MD D 8.1655 11 .82981 .25020
Model MD D 9.8150 11 1.27251 .38368

58
Paired Samples Correlations
N Correlation Sig.
Pair 1 Teeth BL A & Model BL
A 11 .987 .000
Pair 2 Teeth BL B & Model BL
B 11 .976 .000
Pair 3 Teeth BL C & Model BL
C 11 .948 .000
Pair 4 Teeth BL D & Model BL
D 11 .876 .000
Pair 5 Teeth MD A & Model MD
A 11 .924 .000
Pair 6 Teeth MD B & Model MD
B 11 .891 .000
Pair 7 Teeth MD C & Model MD
C 11 .841 .001
Pair 8 Teeth MD D & Model MD
D 11 .778 .005
Paired Differences
Mean
Std.
Deviati
on
Std.
Error
Mean
95% Confidence
Interval of the
Difference
Lower
Pair 1 Teeth BL A -
Model BL A -.10215 .39487 .11906 -.36742
Pair 2 Teeth BL B -
Model BL B -.19686 .51464 .15517 -.54261
Pair 3 Teeth BL C -
Model BL C -.57059 .76862 .23175 -1.08696
Pair 4 Teeth BL D -
Model BL D
-
1.14723
1.1174
2 .33691 -1.89792
Pair 5 Teeth MD A -
Model MD A -.61627 .42945 .12948 -.90478
Pair 6 Teeth MD B -
Model MD B -.81141 .51556 .15545 -1.15777

59
Pair 7 Teeth MD C -
Model MD C
-
1.20545 .67173 .20253 -1.65673
Pair 8 Teeth MD D -
Model MD D
-
1.64941 .81552 .24589 -2.19729
Paired Samples Test
Paired
Differences
t df
Sig. (2-
tailed)
95% Confidence
Interval of the
Difference
Upper
Pair 1 Teeth BL A - Model BL A .16312 -.858 10 .411
Pair 2 Teeth BL B - Model BL B .14888 -1.269 10 .233
Pair 3 Teeth BL C - Model BL C -.05422 -2.462 10 .034
Pair 4 Teeth BL D - Model BL D -.39653 -3.405 10 .007
Pair 5 Teeth MD A - Model MD A -.32777 -4.760 10 .001
Pair 6 Teeth MD B - Model MD B -.46505 -5.220 10 .000
Pair 7 Teeth MD C - Model MD C -.75418 -5.952 10 .000
Pair 8 Teeth MD D - Model MD D -1.10153 -6.708 10 .000
3. Total Volume
T-Test (Incisor)
Paired Samples Statistics
Mean N Std. Deviation
Std. Error
Mean
Pair 1 TA 13.413222222
222222 9
3.3897027442
60099
1.1299009147
53366
MA 14.093888888
888888 9
3.8649389530
89830
1.2883129843
63277

60
Pair 2 TB 13.500777777
777780 9
3.0819550523
07617
1.0273183507
69206
MB 13.914888888
888887 9
3.6405366858
62554
1.2135122286
20852
Pair 3 TC 12.958444444
444444 9
2.9480995620
53117
.98269985401
7706
MC 14.074777777
777777 9
3.7378374689
71123
1.2459458229
90374
Pair 4 TD 12.812111111
111111 9
2.4912442395
54025
.83041474651
8008
MD 15.279000000
000003 9
3.9738009512
30446
1.3246003170
76815
Paired Samples Correlations
N Correlation Sig.
Pair 1 TA &
MA 9 .921 .000
Pair 2 TB &
MB 9 .985 .000
Pair 3 TC &
MC 9 .956 .000
Pair 4 TD &
MD 9 .948 .000
Paired Differences
Mean
Std.
Deviatio
n
Std.
Error
Mean
95% Confidence
Interval of the
Difference
Lower Upper

61
Pair 1 TA
-
MA
-
.6806666
6666666
5
1.515226
6332136
59
.5050755
4440455
3
-
1.8453729
60651522
.48403962
7318191
Pair 2 TB
-
MB
-
.4141111
1111110
8
.8109589
1456417
9
.2703196
3818806
0
-
1.0374693
14598309
.20924709
2376093
Pair 3 TC
-
MC
-
1.116333
3333333
33
1.258559
3947049
13
.4195197
9823497
1
-
2.0837477
22861086
-
.14891894
3805581
Pair 4 TD
-
MD
-
2.466888
8888888
92
1.797429
0281151
88
.5991430
0937172
9
-
3.8485151
46075758
-
1.0852626
31702027
Paired Samples Test
t df Sig. (2-tailed)
Pair 1 TA - MA -1.348 8 .215
Pair 2 TB - MB -1.532 8 .164
Pair 3 TC - MC -2.661 8 .029
Pair 4 TD - MD -4.117 8 .003
T-Test (Molar)
Paired Samples Statistics
Mean N
Std.
Deviation
Std. Error
Mean
Pair 1 TA 39.10600000
0000000 11
9.843355403
519674
2.967883322
872012

62
MA 41.73172727
2727270 11
10.49717274
4038359
3.165016668
320059
Pair 2 TB 37.56145454
5454550 11
8.716721635
610906
2.628190460
663127
MB 40.59600000
0000000 11
9.394416054
231364
2.832523016
034227
Pair 3 TC 35.68563636
3636360 11
7.849252388
256187
2.366638641
513345
MC 40.96372727
2727276 11
9.463782627
373782
2.853437824
771149
Pair 4 TD 33.74599999
9999995 11
7.495492832
362660
2.259976122
158655
MD 43.78709090
9090914 11
9.701624239
832682
2.925149769
140176
Paired Samples Correlations
N Correlation Sig.
Pair 1 TA &
MA 11 .952 .000
Pair 2 TB &
MB 11 .975 .000
Pair 3 TC &
MC 11 .947 .000
Pair 4 TD &
MD 11 .879 .000
Paired Differences
Mean
Std.
Deviatio
n
Std.
Error
Mean
95% Confidence
Interval of the
Difference
Lower Upper
Pair 1 TA
-
MA
-
2.625727
2727272
68
3.209214
1433973
87
.9676144
7141372
2
-
4.7817066
70228344
-
.46974787
5226192

63
Pair 2 TB
-
MB
-
3.034545
4545454
44
2.140514
0673976
60
.6453892
7454868
6
-
4.4725623
71822608
-
1.5965285
37268281
Pair 3 TC
-
MC
-
5.278090
9090909
13
3.228000
6336599
57
.9732788
1135268
7
-
7.4466912
42480855
-
3.1094905
75700973
Pair 4 TD
-
MD
-
10.04109
0909090
919
4.741287
0078607
42
1.429551
8207691
74
-
13.226330
861874434
-
6.8558509
56307403
Paired Samples Test
t df Sig. (2-tailed)
Pair 1 TA – MA -2.714 10 .022
Pair 2 TB – MB -4.702 10 .001
Pair 3 TC – MC -5.423 10 .000
Pair 4 TD – MD -7.024 10 .000
4. Bucco-lingual and mesio-distal Volume
T-Test (Incisors)
Paired Samples Statistics
Mean N
Std.
Deviation
Std. Error
Mean
Pair 1 TA_BL 7.50467 9 1.907106 .635702
MA_BL 7.71633 9 2.095804 .698601
Pair 2 TB_BL 7.54478 9 1.692488 .564163
MB_BL 7.59711 9 1.886084 .628695

64
Pair 3 TC_BL 7.13633 9 1.624514 .541505
MC_BL 7.59644 9 1.877397 .625799
Pair 4 TD_BL 7.10078 9 1.125495 .375165
MD_BL 8.28078 9 1.933770 .644590
Pair 5 TA_M
D 5.63556 9 1.135637 .378546
MA_M
D 6.37756 9 1.815509 .605170
Pair 6 TB_MD 5.64256 9 1.222653 .407551
MB_N
D 6.31856 9 1.810269 .603423
Pair 7 TC_MD 5.50456 9 1.288500 .429500
MC_N
D 6.47811 9 1.909663 .636554
Pair 8 TD_M
D 5.43689 9 1.276632 .425544
MD_M
D 6.99822 9 2.091474 .697158
Paired Samples Correlations
N Correlation Sig.
Pair 1 TA_BL &
MA_BL 9 .910 .001
Pair 2 TB_BL &
MB_BL 9 .958 .000
Pair 3 TC_NL &
MC_BL 9 .874 .002
Pair 4 TD_BL &
MD_BL 9 .916 .001
Pair 5 TA_MD &
MA_MD 9 .712 .031
Pair 6 TB_MD &
MB_MD 9 .572 .108
Pair 7 TC_MD &
MC_MD 9 .489 .181
Pair 8 TD_MD &
MD_MD 9 .541 .133
65
Paired Differences
Mean
Std.
Deviatio
n
Std. Error
Mean
95% Confidence
Interval of the
Difference
Lower
Pair
1
TA_BL
-
MA_BL
-.211667 .870454 .290151 -.880757
Pair
2
TB_BL
-
MB_BL
-.052333 .555617 .185206 -.479419
Pair
3
TC_BL
-
MC_BL
-.460111 .911179 .303726 -1.160505
Pair
4
TD_BL
-
MD_BL
-
1.18000
0
1.01042
5 .336808 -1.956681
Pair
5
TA_M
D -
MA_M
D
-.742000 1.28415
3 .428051 -1.729087
Pair
6
TB_MD
-
MB_M
D
-.676000 1.49671
4 .498905 -1.826476
Pair
7
TC_MD
-
MC_M
D
-.973556 1.70264
3 .567548 -2.282323
Pair
8
TD_M
D -
MD_M
D
-
1.56133
3
1.76499
1 .588330 -2.918026
Paired Samples Test

66
Paired
Differences
t df Sig. (2-tailed)
95% Confidence
Interval of the
Difference
Upper
Pair 1 TA_BL - MA_BL .457424 -.730 8 .487
Pair 2 TB_BL - MB_BL .374752 -.283 8 .785
Pair 3 TC_NL - MC_BL .240283 -1.515 8 .168
Pair 4 TD_BL - MD_BL -.403319 -3.503 8 .008
Pair 5 TA_MD - MA_MD .245087 -1.733 8 .121
Pair 6 TB_MD - MB_ND .474476 -1.355 8 .212
Pair 7 TC_MD - MC_ND .335211 -1.715 8 .125
Pair 8 TD_MD - MD_MD -.204641 -2.654 8 .029
T-Test (Molars)
Paired Samples Statistics
Mean N
Std.
Deviation
Std. Error
Mean
Pair 1 TA_BL 21.43282 11 7.095169 2.139274
MA_BL 21.88136 11 6.302548 1.900290
Pair 2 TB_BL 20.74036 11 6.633205 1.999987
MB_BL 21.30164 11 6.094115 1.837445
Pair 3 TC_BL 19.78245 11 6.365794 1.919359
MC_BL 21.26318 11 6.039708 1.821040
Pair 4 TD_BL 18.72645 11 6.464173 1.949022
MD_BL 22.76455 11 5.894535 1.777269
Pair 5 TA_M
D 17.67318 11 3.719011 1.121324
MA_M
D 19.85036 11 4.962079 1.496123
Pair 6 TB_MD 16.82109 11 3.316027 .999820
MB_M
D 19.29436 11 4.195267 1.264921
Pair 7 TC_MD 15.90318 11 3.002771 .905370

67
MC_M
D 19.70055 11 4.364780 1.316031
Pair 8 TD_M
D 15.01955 11 2.719026 .819817
MD_M
D 21.02255 11 4.767632 1.437495
Paired Samples Correlations
N Correlation Sig.
Pair 1 TA_BL &
MA_BL 11 .980 .000
Pair 2 TB_BL &
MB_BL 11 .987 .000
Pair 3 TC_BL &
MC_BL 11 .967 .000
Pair 4 TD_BL &
MD_BL 11 .910 .000
Pair 5 TA_MD &
MA_MD 11 .907 .000
Pair 6 TB_MD &
MB_MD 11 .950 .000
Pair 7 TC_MD &
MC_MD 11 .901 .000
Pair 8 TD_MD &
MD_MD 11 .890 .000
Paired Differences
Mean
Std.
Deviation
Std. Error
Mean
95%
Confidence
Interval of the
Difference
Lower

68
Pair 1 TA_B
L -
MA_B
L
-.448545 1.565123 .471902 -1.500009
Pair 2 TB_B
L -
MB_B
L
-.561273 1.164296 .351049 -1.343458
Pair 3 TC_B
L -
MC_B
L
-1.480727 1.617561 .487713 -2.567420
Pair 4 TD_B
L -
MD_B
L
-4.038091 2.673865 .806201 -5.834418
Pair 5 TA_M
D -
MA_M
D
-2.177182 2.232266 .673054 -3.676839
Pair 6 TB_M
D -
MB_M
D
-2.473273 1.474626 .444616 -3.463940
Pair 7 TC_M
D -
MC_M
D
-3.797364 2.106795 .635223 -5.212728
Pair 8 TD_M
D -
MD_M
D
-6.003000 2.656616 .801000 -7.787739
Paired Samples Test

69
Paired
Differences
t df Sig. (2-tailed)
95% Confidence
Interval of the
Difference
Upper
Pair 1 TA_BL - MA_BL .602919 -.951 10 .364
Pair 2 TB_BL - MB_BL .220912 -1.599 10 .141
Pair 3 TC_BL - MC_BL -.394035 -3.036 10 .013
Pair 4 TD_BL - MD_BL -2.241764 -5.009 10 .001
Pair 5 TA_MD - MA_MD -.677525 -3.235 10 .009
Pair 6 TB_MD - MB_MD -1.482606 -5.563 10 .000
Pair 7 TC_MD - MC_MD -2.381999 -5.978 10 .000
Pair 8 TD_MD - MD_MD -4.218261 -7.494 10 .000