Embed Size (px)
Citation preview
Sains Malaysiana 41(6)(2012): 747–754
Evaluation of Dry Deposition Velocity of SO2 by Bowen Ratio and Resistance Model Over Rice Paddy in Tropical Climate
(Pengukuran Halaju Pemendapan Kering SO2 Menggunakan Model Nisbah Bowen dan Rintangan di Kawasan Penanaman Padi Beriklim Tropika)
ORACHORN CHIMJAN* & POJANEE KHUMMONGKOL
ABSTRACT
The Bowen ratio method was applied to determine dry deposition velocity of SO2 over rice paddy in the tropical climate condition (hot and humid). The meteorological parameters and SO2 concentration required by the method were monitored online during July – December 2007. The deposition velocity was evaluated under the wet and dry climatic conditions. The median values of the velocity in daytime in the wet season were in ranges of 0.24 - 0.41 cm s-1, and 0.42 - 0.77 cm s-1 in the dry season. The SO2 dry deposition velocity was found to be very low for all the nighttime measurements and independent of seasonal variation. A relationship between the deposition velocity and the humidity was seen in which the SO2 velocity inversely increased with the relative humidity. The velocity determined by the Bowen ratio study was compared to Wesely resistance model. The comparative study showed that the SO2 deposition velocity obtained by the resistance model was higher than the Bowen ratio in the wet season (high humidity) but lower in the dry season (low humidity). This indicated the effect of humidity on the deposition velocity under the tropical climatology. The parameterization terms to calculate the SO2 deposition in the resistance model need to be modified for the tropical region.
Keywords: Bower Ratio method; dry deposition of SO2; resistance model; tropical region
ABSTRAK
Kaedah Nisbah Bowen telah digunakan untuk menentukan halaju pemendapan kering SO2 di kawasan penanaman padi beriklim tropika (panas dan lembab). Parameter meteorologi dan SO2 yang diperlukan bagi kaedah ini telah diukur secara berterusan dari bulan Julai hingga Disember 2007. Penentuan halaju pemendapan telah ditentukan dalam keadaan iklim basah dan kering. Nilai median halaju di siang hari pada musim hujan adalah dalam julat 0.24 - 0.41 cm s-1, dan 0.42 - 0.77 cm s-1 pada musim kering. Halju pemendapan kering SO2 didapati sangat rendah untuk semua ukuran pada waktu malam dan ianya tidak bergantung kepada variasi musim. Hubungan antara halaju pemendapan dan dan kelembapan dapat diperhatikan di mana halaju pemendapan SO2 adalah berkadar songsang dengan kelembapan relatif. Halaju pemendapan Bowen juga telah dibandingkan dengan Model Rintangan Wesely. Kajian perbandingan menunjukkan halaju pemendapan SO2yang diperoleh daripada model rintangan adalah lebih tinggi berbanding nisbah Bowen pada musim hujan (kelembapan tinggi) tetapi lebih rendah pada musim kering (kelembapan rendah). Ini menunjukkan kesan kelembapan kepada halaju di kawasan beriklim tropika. Terma penggunaan parameter bagi pengiraan pemendapan SO2 dalam model rintangan harus di ubahsuai bagi penggunaan di rantau tropika.
Kata kunci: Pemendapan kering SO2; kaedah nisbah Bowen; model rintangan; rantau tropika
INTRODUCTION
Dry deposition can be measured explicitly by employing the natural surface, the surrogated surface, or the micrometeorological instrument to determine the flux of the material. The natural surface (water, plant leaves, tree trunk, etc.) and the surrogated surface (wax, chemical impregnated filters) are less sophisticated. The materials to be collected are adsorbed directly onto the surfaces. The micrometeorological methods, although are more sophisticated but they are most suitable for determining the dry deposition (Fowler & Duyzer 1989). Several micrometeorological measuring methods exist for measuring dry deposition. The aerodynamic method directly measures the rapid fluctuations of vertical wind
speed. The product of the vertical wind speed and the concentration gradient are the flux of the acid deposition. The indirect methods, i.e. eddy correlation and Bowen ratio measure the meteorological variables and relate the term with the concentration of the depositing material. Once the flux is determined the deposition velocity can be obtained. The studies on SO2 dry deposition which mostly employed the micrometeorological methods are conducted in North America (Finkelstein 2001; Mayer & Baldocchi 1988; Wesely 1989; Wesely & Hicks 2000; Zhang et al. 2003), Europe (Erisman 1994; Feliciano et al. 2001) and in the upper Asia (Matsuda et al. 2001; Sorimachi et al. 2003, Utiyama et al. 2005). The parameterizations terms to
748
determine the SO2 deposition velocity are hence developed for the temperate regions. Only a few experiments on the acid deposition in the tropical region were studied. Jitto et al. (2007) and Saueprasearsit & Khummongkol (2009) reported the average value of deposition velocity of SO2 over the rice paddy and the cassava plantation to be 1.14 cm s-1 and 0.14 cm s-1, respectively. Matsuda et al. (2006) estimated O3 deposition velocity in daytime and nighttime over the teak forest to be 0.32 cm s-1 and 0.04 cm s-1, respectively. The purpose of this study was to estimate the dry deposition flux of SO2 using the Bowen ratio method. The Bowen ratio formula for flux measurement is derived from the energy balance in the turbulent boundary layer where fluxes of momentum, heat, water vapor and any other entrained gas are constant with height (Monteith & Unsworth 1990). Bulk rates of exchange between the canopy and the air flowing over it can be determined by measuring vertical fluxes in this part of the boundary layer. Once, the SO2 flux is obtained, the deposition velocity for the tropical region can be determined. The deposition velocity value determined by the Bowen ratio will be compared with the Wesely’s parameterization method in the resistance model with selective land use type and seasonal categories applicable for the tropical region.
MATERIAL AND METHOD
The experiment was conducted in Chachoengsao province, central Thailand (13°56’N 100°56’E) between July and December 2007. The micrometeorological instrument was installed on the 5 m tower height above the rice paddy field with a flat fetch about 300 m × 400 m and homogeneous rice field. The full growth rice stands for 1.5 m. The climate in Thailand can be broadly classified into wet and dry. The wet season covers a period of May to September and the dry season covers a period of October to April. The 10 year average amounts of rainfall from the beginning of the wet season to the peak were in ranges of 60-250 mm and in the dry season were in ranges of 0-60 mm. The average temperature is 28.7ºC and 26.7ºC for the wet and dry seasons, respectively. For this study, July to September were chosen to represent the wet season and November to December represented the dry season. The SO2 concentrations, temperature and humidity were measured at two positions, 2 m and 4 m above the ground level using ultra-violet fluorescence analyzer (API 100 MA Model), temperature and relative humidity sensor (Wisco-HT120). The solar radiation and net radiation were measured at 3 m. above the ground level using the solar radiometer (LSI DPA568) and net radiometer (LSI DPA548). The soil heat flux measured under the ground and 4 m away from the tower using the heat flux plate (Campbell Scientific, Inc. HFT3). The SO2 concentration was measured every 5 min at both heights. Other parameters were measured every minute and the raw data were averaged over 10 min for recording on a data logger. In interpreting the data, daytime is taken between 8:00 h – 17:00 h and nighttime is between 18:00 hr – 7:00 hr
METHODOLOGy
The SO2 deposition flux (F, μg mhr-1) was measured on the basis of the Bowen ratio technique. The flux was determined as the product of the transfer coefficient (D, cm s-1) and the average vertical concentration difference (ΔC, μg m-3):
F = DΔC (1)
The transfer coefficient is defined according to the Bowen ratio equation as shown in (2) (Jitto et al, 2007; Saueprasearsit & Khummongkol 2009; Mointeith & Unsworth 1990) (2)
where Rn is the net radiation (W m-2); G is the soil heat flux (W m-2); ρa is the air density (g cm-3); λ is the heat of vaporization (cal.g); P is the atmospheric pressure (mmHg); cp is the heat capacity of air (cal g-1 °C-1); ΔT2-1 is the temperature difference (∆oC) ; Δe2-1 is the water vapor pressure difference (mmHg). The dry deposition velocity (Vd, cm s-1) was calculated by (3):
(3)
where C is the average value of SO2 concentration. To estimate the Vd based on the resistance model (Wesely & Hicks 2000), the dry deposition velocity is defined to be the inverse of total resistances:
(4)
The total resistances consist of the aerodynamic resistance (Ra), the quasi-laminar resistance (Rb) and the canopy resistance (Rc). Ra and Rb were calculated base on the meteorological measurements by the following equation (Lamaud et al. 2002):
(5)
where u is the wind speed, u* is the friction velocity, Sc is the Schmidt number and Pr is the Prandtl number. Rc was calculated from Wesely resistance model (Erisman 1994; Matsuda et al. 2001; Wesely 1989):
(6)
where the first and second terms are resistances in the upper canopy, which include the stomatal (Rs), mesophyll (Rm) and outer surface resistances (Rlu), the third term is resistances in the lower canopy, which include the
749
resistance to transfer by buoyant convection (Rdc) and the resistance to uptake by exposed surfaces (Rcl), and the fourth term is resistances to transfer (Rac) and uptake (Rg) at the ground.
RESULTS AND DISCUSSION
DETERMINATION OF THE TRANSFER COEFFICIENT
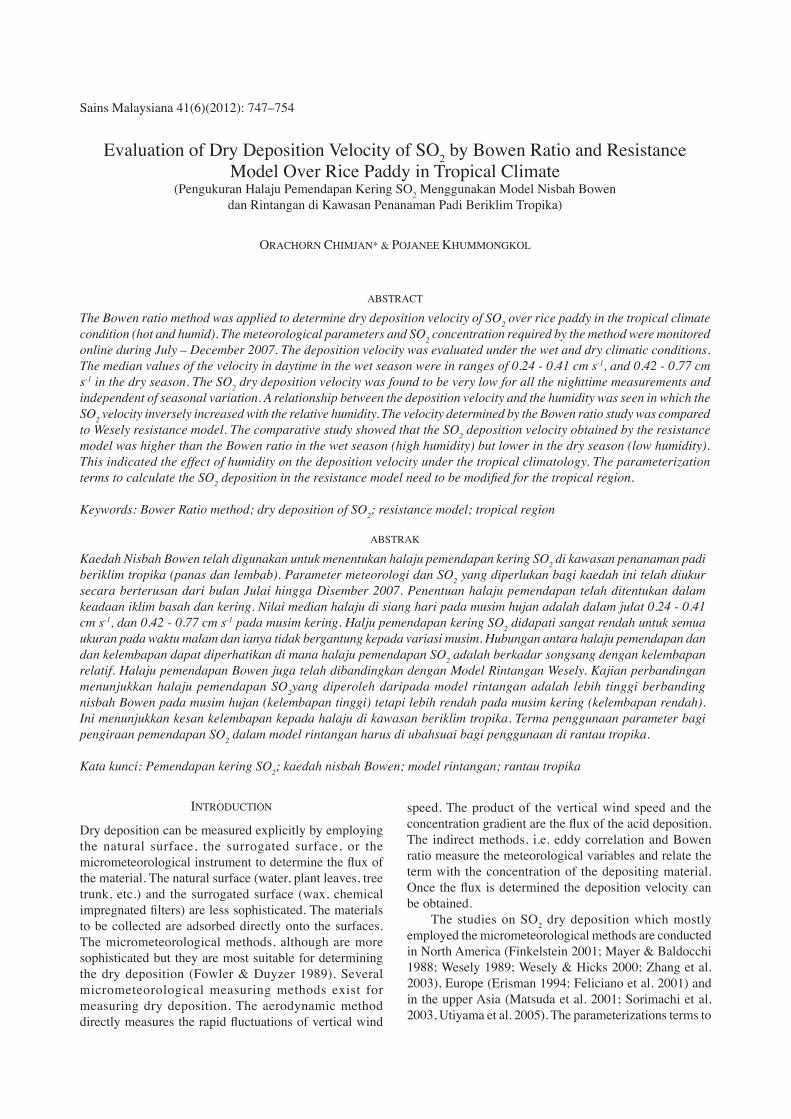
The transfer coefficient, D is an important meteorological parameter to determine the SO2 flux (Equation 2). The terms rely on the measured Rn, G, Δe2-1 and ΔT2-1 inputs. The net energy term Rn– G has asserted large influences on the dry deposition. Its magnitude is much greater than other parameters, i.e. Δe2-1 and ΔT2-1 around noon time. In Figure 1, the diurnal Rn – G, Δe2-1 and ΔT2-1 increased in the morning and reached the maximum value in the afternoon. The values of Rn – G, Δe2-1 and ΔT2-1 decreased to near zero to negative values at nighttime. The diurnal transfer coefficients were in ranges of 5.02 - 6.62 cm s-1 and 7.65 – 8.79 cm s-1 for the wet season (July – September) and dry season (November - December) ambient conditions, respectively. The nocturnal transfer coefficients were in ranges of 0.37 – 0.51 cm s-1 and 0.30 – 0.62 cm s-1 for the wet and dry ambient, respectively. There is an increasing trend of transfer coefficient from wet to dry conditions. The minimal value of the transfer coefficient during nighttime indicated it is strongly effected by energy driving force, Rn – G.
FLUx ESTIMATION FOR SO2
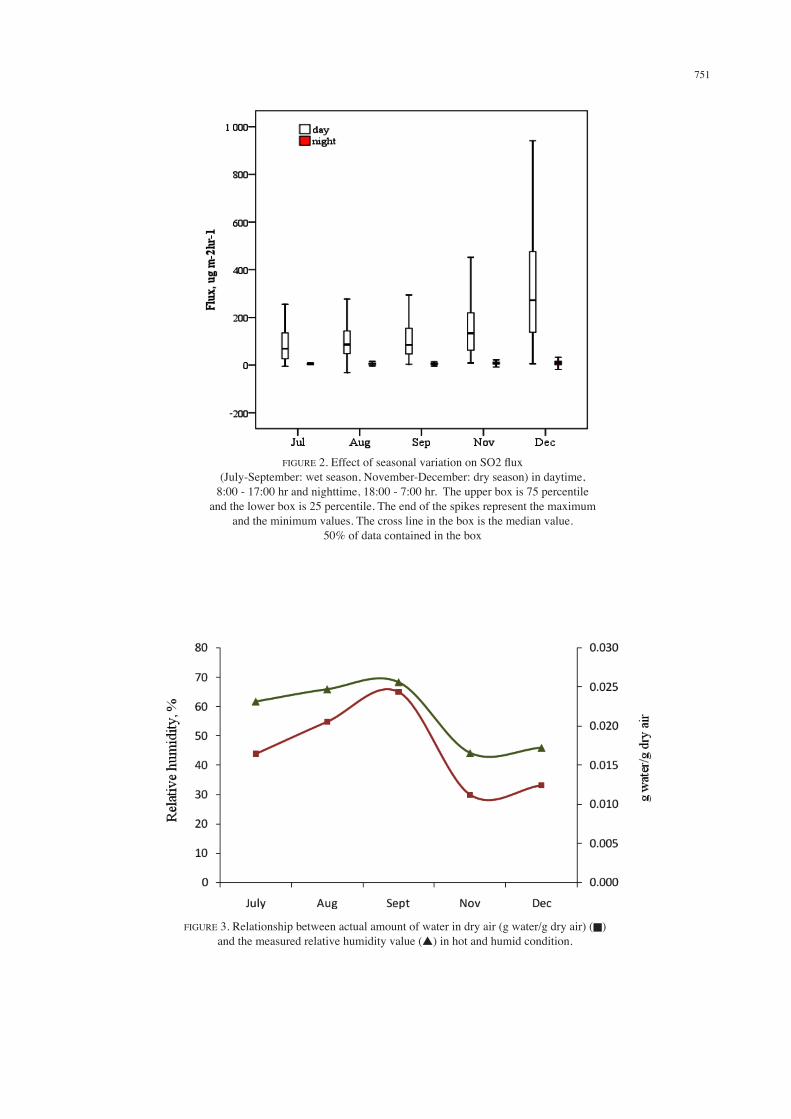
The average values of SO2 concentration were measured to be 7.7, 8.7, 10.8, 10.0, 9.7 and 10.7 μg m-3 in July to December, respectively. The SO2 concentrations were not differentiated significantly during the day and within the month. The monthly median values of SO2 flux were evaluated to be 82.49, 99.64, 99.36, 145.6 and 288.2 μg m-2 hr-1 in July to December, respectively (Figure 2). The flux values are low in the wet season and high in the dry season. Since the diurnal SO2 concentration were not significantly varying during the period of measurements throughout the year, the seasonal dependency of the SO2 flux was to be influenced by 2 meteorological terms: the net radiation and the soil heat flux difference, Rn – G and the relative humidity. The term, Rn – G was the driving force for the flux movement downward. The SO2 fluxes were very low during nighttime where the Rn – G is nearly zero and sometimes negative values. The SO2 flux reached the maximum value around the midday where the net radiation has reached the highest (Figure 1). The other important meteorological parameter indicated by this study is the relative humidity. The SO2 flux inversely increased with the relative humidity. It is believed to be caused by some dissolution of SO2 in the presence of water vapor under hot and humid condition. Although, the relative humidity does not vary directly with the actual amount of water in dry air or absolute humidity (g water/g dry air), in the tropical
region and as shown in Figure 3, the actual amount of water in dry air (evaluated from psychrometric chart at the same temperature) shows a similarity trend with the measured relative humidity values. Hence, the relative humidity can be seen as one of important meteorological parameters affecting the amount of SO2 deposition. Buzorius et al. (1998) has pointed out that the errors induced in deposition flux may be large under warm humid conditions.
EVALUATION OF SO2 DRy DEPOSITION VELOCITy By BOWEN RATIO METHOD
The diurnal dry deposition velocities of SO2 were in ranges of 0.24 - 0.41 cm s-1 in the wet season and 0.42 - 0.77 cm s-1 in the dry season. The deposition velocity obtained by this experiment was in agreement with the previous study by Jitto et al. (2007) and Saueprasearsit & Khummongkol (2009) where the velocity was effected by seasonal variation. The deposition velocity during the night is very small. This indicated the effect which is caused by the buoyancy upward of the air parcel during the night. The higher heat capacity of soil kept the soil surface to remain high during the night while the atmospheric air temperature was decreasing. The SO2 deposition velocity varied inversely with the relative humidity for both daytime and nighttime (Figure 4). Dissolution of SO2 while descending downward is believed to slow down the movement. It is noted that the Vd at nighttime was almost zero. This is because the nighttime Vd was not only affected by the relative humidity which is generally greater than the daytime in tropical climate, but it is also affected much more by very small net solar energy driving force at nighttime.
EVALUATION OF SO2 DRy DEPOSITION VELOCITy By RESISTANCE MODEL
The deposition velocity, Vd can be evaluated by resistance parameterization method (Erisman 1994; Matsuda et al. 2001; Matsuda et al. 2006; Wesely 1989) coupled with the meteorological parameters. In Southeast Asia, the characteristics of meteorology and climate are differences from Europe, North America and East Asia on the parameterization of Rc (An et al. 2002; Matsuda et al. 2001; Matsuda et al. 2004; Uno et al. 2000; Wesely 1989; Zhang et al. 2003b). Therefore, this study attempted to fit the Wesely’s parameterization, Rc for estimating of SO2 deposition velocity for the tropical climate. The meteorological parameters to be used in estimating Ra, Rb and Rc (Table 1). For wet and dry seasons, the transition spring with partially green short annuals categoried by the Wesely’s parameterization was used. The Vd and Rc were calculated by the resistance model in Equation 4 and Equation 6, respectively. The results of calculations of Ra, Rb and Rc are shown in Figure 5 for only daytime. In the figure, the canopy resistance is affected by the first 3 terms in Equation 6: the stomatal resistances (Rs), the mesophyll (Rm) and outer surface resistances (Rlu). These terms are very much dependent on the radiation energy and
750
FIGURE 1. Left side, median diurnal variation of measured meteorological parameters: net radiation and soil heat flux difference (Rn – G), temperature difference (ΔT), water vapor difference (Δe) and right side, median diurnal variation of transfer
coefficient for the wet season (July – September) and dry season (November – December)
751
FIGURE 2. Effect of seasonal variation on SO2 flux (July-September: wet season, November-December: dry season) in daytime,
8:00 - 17:00 hr and nighttime, 18:00 - 7:00 hr. The upper box is 75 percentile and the lower box is 25 percentile. The end of the spikes represent the maximum
and the minimum values. The cross line in the box is the median value. 50% of data contained in the box
FIGURE 3. Relationship between actual amount of water in dry air (g water/g dry air) (n)and the measured relative humidity value (s) in hot and humid condition.
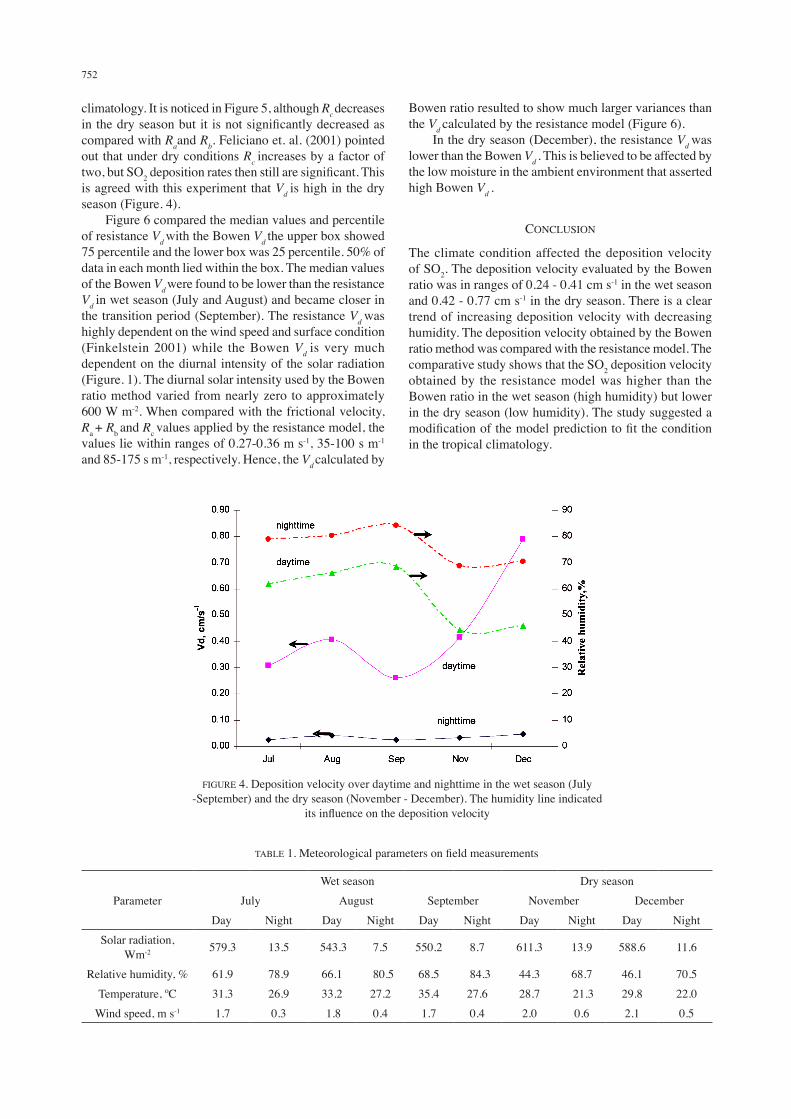
752
FIGURE 4. Deposition velocity over daytime and nighttime in the wet season (July -September) and the dry season (November - December). The humidity line indicated
its influence on the deposition velocity
climatology. It is noticed in Figure 5, although Rc decreases in the dry season but it is not significantly decreased as compared with Raand Rb. Feliciano et. al. (2001) pointed out that under dry conditions Rc increases by a factor of two, but SO2 deposition rates then still are significant. This is agreed with this experiment that Vd is high in the dry season (Figure. 4). Figure 6 compared the median values and percentile of resistance Vd with the Bowen Vd the upper box showed 75 percentile and the lower box was 25 percentile. 50% of data in each month lied within the box. The median values of the Bowen Vd were found to be lower than the resistance Vd in wet season (July and August) and became closer in the transition period (September). The resistance Vd was highly dependent on the wind speed and surface condition (Finkelstein 2001) while the Bowen Vd is very much dependent on the diurnal intensity of the solar radiation (Figure. 1). The diurnal solar intensity used by the Bowen ratio method varied from nearly zero to approximately 600 W m-2. When compared with the frictional velocity, Ra + Rb and Rc values applied by the resistance model, the values lie within ranges of 0.27-0.36 m s-1, 35-100 s m-1 and 85-175 s m-1, respectively. Hence, the Vd calculated by
TABLE 1. Meteorological parameters on field measurements
ParameterWet season Dry season
July August September November DecemberDay Night Day Night Day Night Day Night Day Night
Solar radiation, Wm-2 579.3 13.5 543.3 7.5 550.2 8.7 611.3 13.9 588.6 11.6
Relative humidity, % 61.9 78.9 66.1 80.5 68.5 84.3 44.3 68.7 46.1 70.5Temperature, ºC 31.3 26.9 33.2 27.2 35.4 27.6 28.7 21.3 29.8 22.0
Wind speed, m s-1 1.7 0.3 1.8 0.4 1.7 0.4 2.0 0.6 2.1 0.5
Bowen ratio resulted to show much larger variances than the Vd calculated by the resistance model (Figure 6). In the dry season (December), the resistance Vd was lower than the Bowen Vd . This is believed to be affected by the low moisture in the ambient environment that asserted high Bowen Vd .
CONCLUSION
The climate condition affected the deposition velocity of SO2. The deposition velocity evaluated by the Bowen ratio was in ranges of 0.24 - 0.41 cm s-1 in the wet season and 0.42 - 0.77 cm s-1 in the dry season. There is a clear trend of increasing deposition velocity with decreasing humidity. The deposition velocity obtained by the Bowen ratio method was compared with the resistance model. The comparative study shows that the SO2 deposition velocity obtained by the resistance model was higher than the Bowen ratio in the wet season (high humidity) but lower in the dry season (low humidity). The study suggested a modification of the model prediction to fit the condition in the tropical climatology.
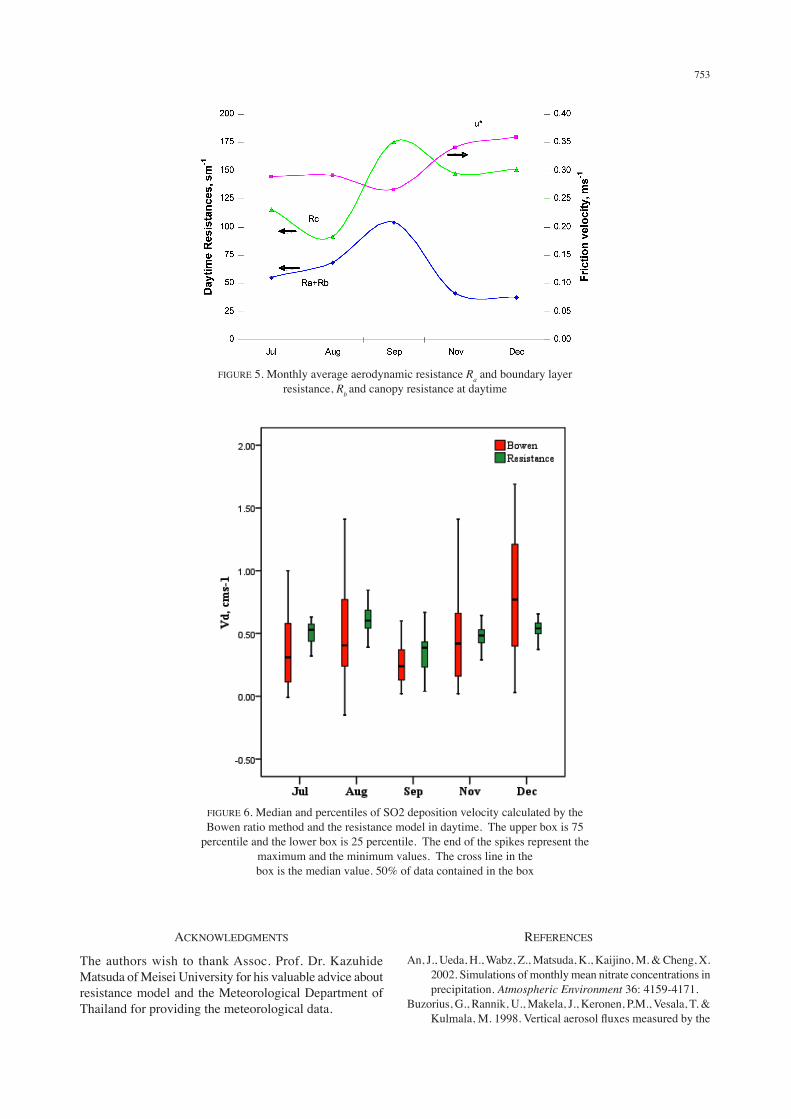
753
FIGURE 5. Monthly average aerodynamic resistance Ra and boundary layer resistance, Rb and canopy resistance at daytime
ACKNOWLEDGMENTS
The authors wish to thank Assoc. Prof. Dr. Kazuhide Matsuda of Meisei University for his valuable advice about resistance model and the Meteorological Department of Thailand for providing the meteorological data.
FIGURE 6. Median and percentiles of SO2 deposition velocity calculated by theBowen ratio method and the resistance model in daytime. The upper box is 75
percentile and the lower box is 25 percentile. The end of the spikes represent themaximum and the minimum values. The cross line in thebox is the median value. 50% of data contained in the box
REFERENCES
An, J., Ueda, H., Wabz, Z., Matsuda, K., Kaijino, M. & Cheng, x. 2002. Simulations of monthly mean nitrate concentrations in precipitation. Atmospheric Environment 36: 4159-4171.
Buzorius, G., Rannik, U., Makela, J., Keronen, P.M., Vesala, T. & Kulmala, M. 1998. Vertical aerosol fluxes measured by the
754
eddy covariance technique using a condensational particle counter. Journal of Aerosol Science 29: 157-171.
Erisman, J.W. 1994. Evaluation of a surface resistance parameterization of sulphur dioxide. Atmospheric Environment 28: 2583-2594.
Feliciano, M.S., Pio, C.A. & Vermeulen, A.T. 2001. Evaluation of SO2 dry deposition over short vegetation in Protugal. Atmospheric Environment 35: 3633-3643.
Finkelstein, P.L. 2001. Deposition velocities of SO2 and O3 over agricultural and forest ecosystems. Water, Air & Soil Pollution: Focus 1: 49-57.
Fowler, D. & Duyzer, J.H.H. 1989. Micrometeorological techniques for the measurement of trace gas exchange. In edited by Exchange of Trace Gases Between Terestrial Ecosystems and the Atmosphere, M.O. Andrae & D.S. Schimel (eds.) New york: John Wiley and Sons.
Jitto, P., Vinitnantarat, S. & Khummongkol, P. 2007. Dry deposition velocity of sulfur dioxide over rice paddy in the tropical region. Atmospheric Research 85: 140-147.
Lamaud, E., Carrara, A., Erunet, y., Lopez, A. & Druihet, A. 2002. Ozone fluxes above and within a pine forest canopy in dry and wet conditions. Atmospheric Environment 36: 77-88.
Matsuda, K., Aoki, M.M. & Zhang, S. D. 2001. Dry deposition velocity of sulfur dioxides on a red pine forest in Nagano Japan. Journal of Japan Society for Atmospheric Environment 37: 387-392.
Matsuda, K., Sakurai, T., Fujita, S. & Totsuka, T. 2004. The influence of Miyakejima volcano on wet and dry deposition of sulfer in Japan. Journal of Japan Society for Atmospheric Environment 39: 148-157.
Matsuda, K., Watanabe, I., Wingpud, V., Theramongkol, P. & Ohizumi, T. 2006. Deposition velocity of O3 and SO2 in the dry and wet season above a tropical forest in northern Thailand. Atmospheric Environment 40: 7557-7564.
Mayers, T.P. & Baldocchi, D.D. 1988. A comparison of models for deriving dry deposition fluxes of O3 and SO2 to a forest canopy. Tellus 40B: 270-284.
Monteith, J.L. & Unsworth, M. 1990. Principles of Environmental Physics, 2nd ed. London: Butterworth-Heinemann.
Saueprasearsit, P. & Khummongkol, P. 2009. Evaluation of SO2 dry deposition over a cassava plantation in Rayong, Thailand. International Journal of Environment and Pollution 36: 255-261.
Sorimachi, A., Sakamoto, K., Ishihara, H., Fukuyama, T., Utiyama, M., Liu, H., Wang, W., Tang, D., Dong, x. & Quan, H. 2003. Measurements of sulfur dioxide and ozone dry deposition over short vegetation in northern China- a preliminary study. Atmospheric Environment 31: 3157-3166.
Uno, I., Jang, E.S., Shimohara, T., Oishi, O., Utsumoniya, A., Hatakeyama, S., Murano, K., Tang, x. & Kim, y.P. 2000. Winter time intermittent transboundary air pollution over East Asia simulated by a long-rang transport model. Global Environmental Research 4: 3-12.
Utiyama, M., Fukuyama, T., Sakamoto, K., Ishihara, H., Sorimachi, A., Tanonaka, T., Dong x., Quan, H., Wang, W. & Tang, D. 2005. Sulfur dioxide dry deposition on the loss surface-surface reaction concept for measuring dry deposition flux. Atmospheric Environment 39: 329-335.
Wesely, M.L. 1989. Parameterization of surface resistance to gaseous dry deposition in regional scale numerical model. Atmospheric Environment 23: 1293-1304.
Wesely, M.L. & Hicks, B.B. 2000. A review of the current status of knowledge on dry deposition. Atmospheric Environment 32: 2261-2282.
Zhang, L., Brook, J.R. & Vet, R. 2003a. A revised parameterization for gaseous dry deposition in air-quality models. Atmospheric Chemistry and Physics 3: 2067-2082.
Zhang, L., Brook, J.R. & Vet, R. 2003b. Evaluation of a non-stomata resistance parameterization for SO2 dry deposition. Atmospheric Environment 37: 2941-2947.
Environmental Technology DivisionSchool of Energy, Environment and MaterialsKing Mongkut’s University of Technology Thonburi 126 Pracha-U-Thit Rd., Bangmod, Thungkru Bangkok 10140, Thailand
* Corresponding author; email: [email protected]
Received: 13 October 2011Accepted: 4 January 2012