Embed Size (px)
Citation preview
Atmos. Chem. Phys., 14, 8869–8882, 2014www.atmos-chem-phys.net/14/8869/2014/doi:10.5194/acp-14-8869-2014© Author(s) 2014. CC Attribution 3.0 License.
Measurements of dust deposition velocity in a wind-tunnelexperiment
J. Zhang1,2, Y. Shao2, and N. Huang1
1Key Laboratory of Mechanics on Disaster and Environment in Western China of the Ministry of Education of China,Lanzhou University, 730000 Lanzhou, China2The Institute for Geophysics and Meteorology, University of Cologne, 50973 Cologne, Germany
Correspondence to:J. Zhang ([email protected])
Received: 28 November 2013 – Published in Atmos. Chem. Phys. Discuss.: 8 April 2014Revised: 2 July 2014 – Accepted: 18 July 2014 – Published: 1 September 2014
Abstract. In this study, we present the results of a wind-tunnel experiment on dust deposition. A new method is pro-posed to derive dust deposition velocity from PDA (particledynamics analysis) particle-velocity and particle-size mea-surements. This method has the advantage that the motionsof individual dust particles are directly observed and all rele-vant data for computing dust deposition velocity is collectedusing a single instrument, and thus the measurement uncer-tainties are reduced. The method is used in the wind-tunnelexperiment to measure dust deposition velocities for differ-ent particle sizes, wind speeds and surface conditions. Forsticky-smooth wood and water surfaces, the observed dustdeposition velocities are compared with the predictions usinga dust deposition scheme, and the entire data set is comparedwith the data found in the literature. From the wind-tunnelexperiments, a relatively reliable data set of dust depositionvelocities is obtained, which is valuable for the developmentand validation of dust deposition schemes.
1 Introduction
In the past few decades, the dust research community hasbeen struggling to develop dust emission and depositionschemes for large scale dust models. As far as dust emis-sion is concerned, several wind-tunnel and field observations(e.g. Gillette, 1977; Shao et al., 1993; Ishizuka et al., 2008)have been carried out, which serve as the basis for the con-ceptualization of dust emission schemes (Shao, 2001, 2004;Marticorina and Bergamatti, 1995; Alfaro and Gomes, 2001).The understanding of dust deposition is at least as poor as
that of dust emission (Goossens and Offer, 2000). The sam-plers used for dust-deposition measurements in field exper-iments have been found to be quite inefficient (Sow et al.,2006). The large uncertainties in dust-deposition estimatesin regional and global dust models have been documented byUno et al. (2006) and Textor et al. (2006, 2007). Our prelim-inary tests of existing dust deposition schemes show that thescheme estimates can easily differ by an order of magnitude,and it is often unclear how the scheme parameters should bespecified in regional and global dust models.
We must come to terms with several problems in dust-deposition parameterizations, but the most outstanding is theserious lack of high-quality and cohesive data sets for testingdust-deposition theories and schemes. Field observations ondust deposition over time intervals of days and weeks havebeen made using direct or indirect techniques (e.g. Gao etal., 1997; Liu et al., 2004). Such observations are valuablein determining the order of magnitude of dust depositionfor given areas, but do not provide sufficient details for theconceptualization and derivation of dust-deposition theories.Chamberlain (1967) conducted a wind-tunnel experiment onthe deposition of particles of various sizes over a surface ofartificial sticky grass. His data have proved to be very use-ful for the verification of dust-deposition schemes. However,natural surfaces are very different from a sticky grass surfacein physical and aerodynamic characteristics. Only very fewsurface types have been investigated in wind-tunnel studiesso far, and to our knowledge no equivalent field experimentshave ever been carried out.
Dust deposition is mostly parameterized through deposi-tion velocity,wd, and in most dust-deposition experimental
Published by Copernicus Publications on behalf of the European Geosciences Union.
8870 J. Zhang et al.: Measurements of dust deposition velocity in a wind-tunnel experiment
0.01 0.1 1 101E-5
1E-4
1E-3
0.01
0.1
1
wd (
m s-1
)
Dp (μm)
Surface u* (m s-1)Wind Tunnel:
Chamberlain (1967) Grass 0.7 Chamberlain (1967) Sticky grass 0.7 Clough (1973) Filter paper 0.24 Clough (1975) Dry tray 0.37-0.87 Clough (1975) Wet tray 0.37-0.87
Field: Gallagher et al. (1988) Moorland 0.57 Nemitz et al. (2002) Moorland 0.1-0.7 Beswick et al. (1991) Spruce 0.37-0.7 Bleyl (2001) Spruce / Groenholm et al. (2007) Pine 0.08-1.28 Gallagher et al. (1997) Fir 0.15-0.75 Pryor et al. (2007) Forest / Slinn's scheme (1982) 0.25 50
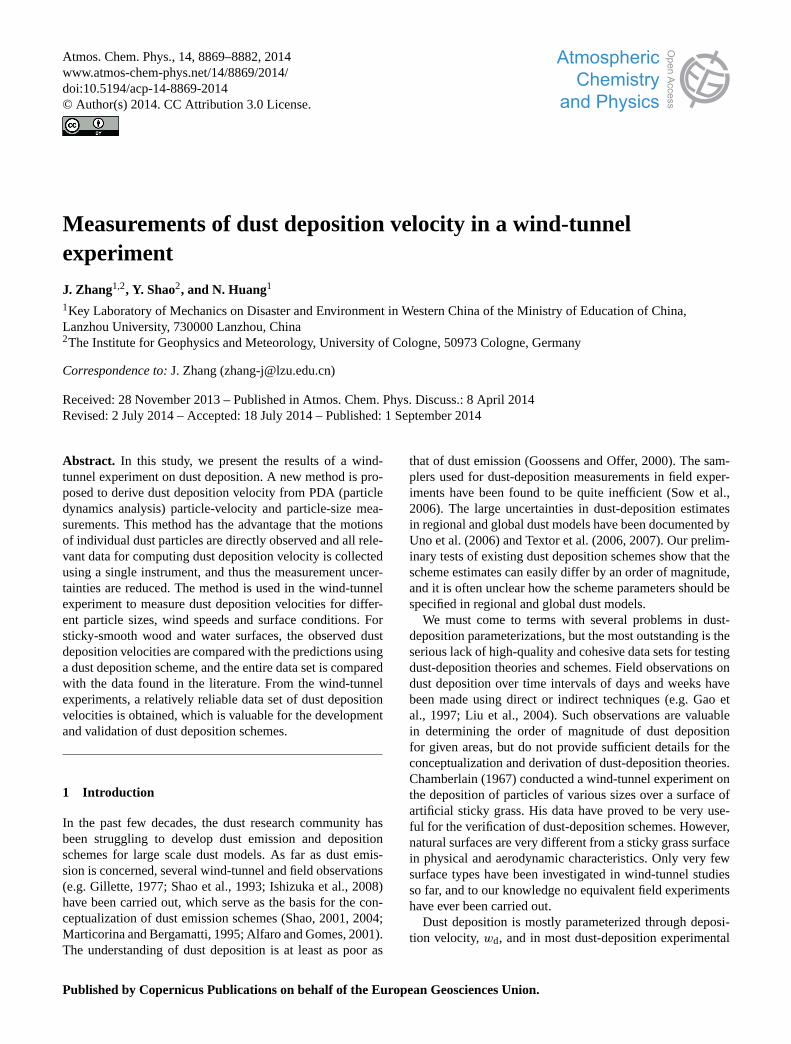
Figure 1. Some existing measurements of deposition velocities against particle size for different surfaces.
studies, measurements of dust flux and/or concentration aremade for the estimation ofwd (Sehmel, 1971; Wesley et al.,1983; Gallagher et al., 1997; Ould-Data, 2002; Pryor et al.,2008). Various techniques and devices have been used (Se-infeld and Pandis, 2006) and measurements made under dif-ferent conditions. As a consequence, the comparability be-tween the data sets has been poor (Wesely et al., 1985; Hickset al., 1989; Goossens and Rajot, 2008). As shown in Fig. 1,a large scatter over orders of magnitude among the measure-ments published in the literature exists. The scatter may becaused by the uncertainty in measuring techniques and thedifferences in experimental conditions. The lack of knowl-edge in measurement precision and the unrecorded informa-tion of experimental conditions undermine the value of themeasurements for the validation of models. A considerablediscrepancy between the measurements and the model esti-mates is also apparent, due to reasons which are yet to befully explained.
In this paper, we propose a new method for measuring dustdeposition velocity using a single device: a particle dynam-ics analysis (PDA). This technique has the advantage of ob-serving the motion of individual particles and avoids uncer-tainties arising from using a combination of devices. Wind-tunnel experiments are carried out by using the PDA to mea-sure dust deposition velocities for various surfaces, rangingfrom a sticky-smooth wood surface (wood surface hereafter)to a rough vegetation surface, and a reliable data set is ob-tained. The measurements are then used to test the Slinn andSlinn (1980, SS80 hereafter) scheme for smooth (wood andwater) surfaces. The advantages of our technique are demon-strated and the possible improvements required in the SS80scheme are identified. The dust deposition velocities mea-sured in our experiments are compared with those of severalother experiments published in the literature after correctionof all data to 1 m above the zero-plane displacement height.
2 Particle dynamics analysis (PDA) and wind-tunnel ex-periment
PDA is an extension of LDA (laser Doppler anemometry),which can measure both the velocity and size of a parti-cle passing through the measuring point. Particle velocity ismeasured by using the laser Doppler effect and particle sizeaccording to the phase shift between two signals of the scat-tered light detected by different detectors (Dantec DynamicsA/S, 2006).
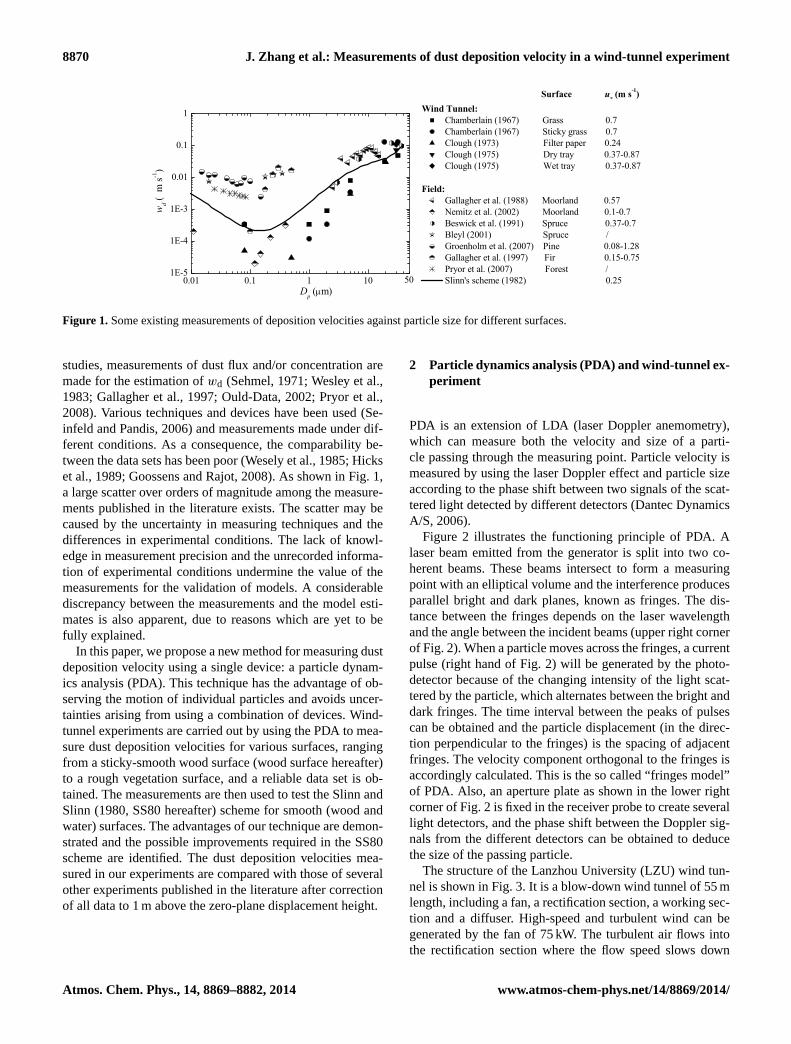
Figure 2 illustrates the functioning principle of PDA. Alaser beam emitted from the generator is split into two co-herent beams. These beams intersect to form a measuringpoint with an elliptical volume and the interference producesparallel bright and dark planes, known as fringes. The dis-tance between the fringes depends on the laser wavelengthand the angle between the incident beams (upper right cornerof Fig. 2). When a particle moves across the fringes, a currentpulse (right hand of Fig. 2) will be generated by the photo-detector because of the changing intensity of the light scat-tered by the particle, which alternates between the bright anddark fringes. The time interval between the peaks of pulsescan be obtained and the particle displacement (in the direc-tion perpendicular to the fringes) is the spacing of adjacentfringes. The velocity component orthogonal to the fringes isaccordingly calculated. This is the so called “fringes model”of PDA. Also, an aperture plate as shown in the lower rightcorner of Fig. 2 is fixed in the receiver probe to create severallight detectors, and the phase shift between the Doppler sig-nals from the different detectors can be obtained to deducethe size of the passing particle.
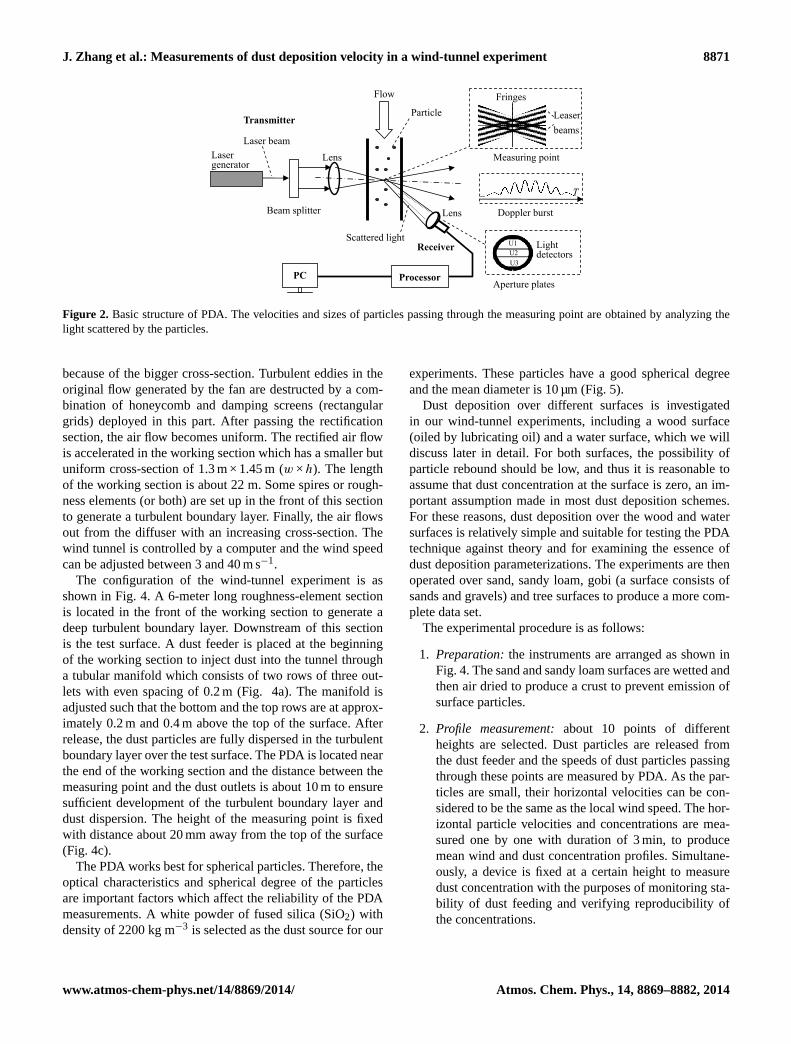
The structure of the Lanzhou University (LZU) wind tun-nel is shown in Fig. 3. It is a blow-down wind tunnel of 55 mlength, including a fan, a rectification section, a working sec-tion and a diffuser. High-speed and turbulent wind can begenerated by the fan of 75 kW. The turbulent air flows intothe rectification section where the flow speed slows down
Atmos. Chem. Phys., 14, 8869–8882, 2014 www.atmos-chem-phys.net/14/8869/2014/
J. Zhang et al.: Measurements of dust deposition velocity in a wind-tunnel experiment 8871
Flow Fringes
PC
Particle
Laser generator
Lens
Lens
Scattered light
Beam splitter
Measuring point
Receiver
Laser beam
U1 U2 U3
Light detectors
Aperture plates Processor
Doppler burst
T
Transmitter Leaser beams
Figure 2. Basic structure of PDA. The velocities and sizes of particles passing through the measuring point are obtained by analyzing thelight scattered by the particles.
because of the bigger cross-section. Turbulent eddies in theoriginal flow generated by the fan are destructed by a com-bination of honeycomb and damping screens (rectangulargrids) deployed in this part. After passing the rectificationsection, the air flow becomes uniform. The rectified air flowis accelerated in the working section which has a smaller butuniform cross-section of 1.3 m × 1.45 m (w ×h). The lengthof the working section is about 22 m. Some spires or rough-ness elements (or both) are set up in the front of this sectionto generate a turbulent boundary layer. Finally, the air flowsout from the diffuser with an increasing cross-section. Thewind tunnel is controlled by a computer and the wind speedcan be adjusted between 3 and 40 m s−1.
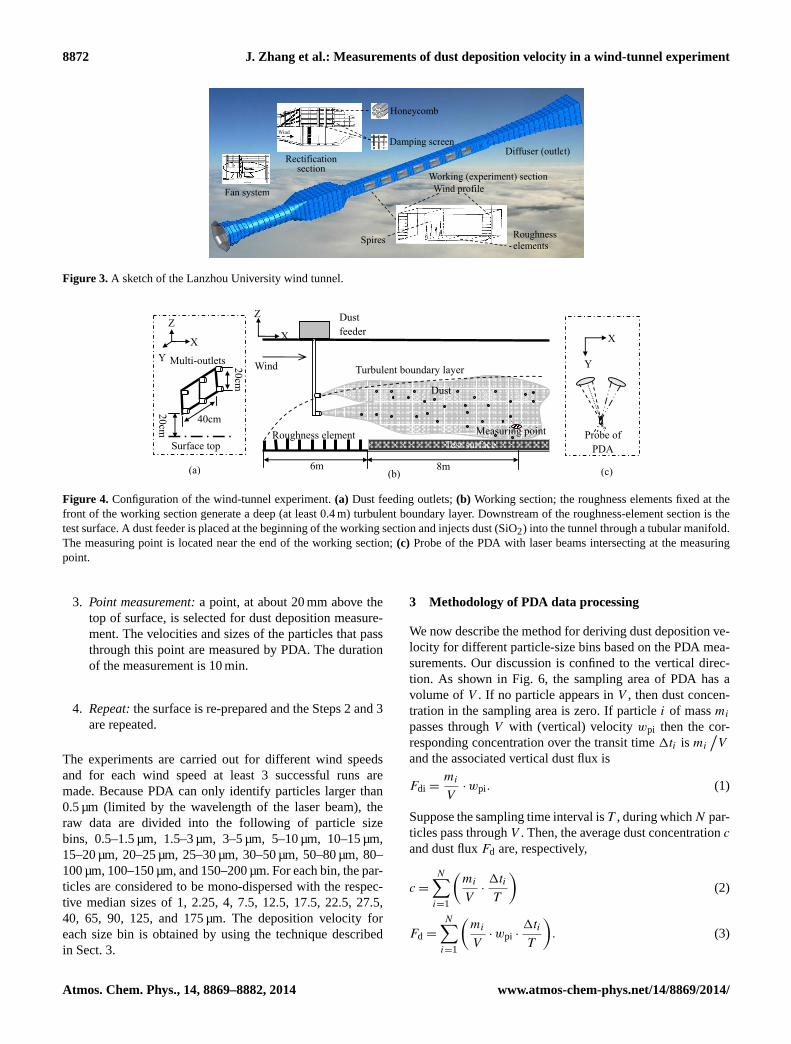
The configuration of the wind-tunnel experiment is asshown in Fig. 4. A 6-meter long roughness-element sectionis located in the front of the working section to generate adeep turbulent boundary layer. Downstream of this sectionis the test surface. A dust feeder is placed at the beginningof the working section to inject dust into the tunnel througha tubular manifold which consists of two rows of three out-lets with even spacing of 0.2 m (Fig. 4a). The manifold isadjusted such that the bottom and the top rows are at approx-imately 0.2 m and 0.4 m above the top of the surface. Afterrelease, the dust particles are fully dispersed in the turbulentboundary layer over the test surface. The PDA is located nearthe end of the working section and the distance between themeasuring point and the dust outlets is about 10 m to ensuresufficient development of the turbulent boundary layer anddust dispersion. The height of the measuring point is fixedwith distance about 20 mm away from the top of the surface(Fig. 4c).
The PDA works best for spherical particles. Therefore, theoptical characteristics and spherical degree of the particlesare important factors which affect the reliability of the PDAmeasurements. A white powder of fused silica (SiO2) withdensity of 2200 kg m−3 is selected as the dust source for our
experiments. These particles have a good spherical degreeand the mean diameter is 10 µm (Fig. 5).
Dust deposition over different surfaces is investigatedin our wind-tunnel experiments, including a wood surface(oiled by lubricating oil) and a water surface, which we willdiscuss later in detail. For both surfaces, the possibility ofparticle rebound should be low, and thus it is reasonable toassume that dust concentration at the surface is zero, an im-portant assumption made in most dust deposition schemes.For these reasons, dust deposition over the wood and watersurfaces is relatively simple and suitable for testing the PDAtechnique against theory and for examining the essence ofdust deposition parameterizations. The experiments are thenoperated over sand, sandy loam, gobi (a surface consists ofsands and gravels) and tree surfaces to produce a more com-plete data set.
The experimental procedure is as follows:
1. Preparation: the instruments are arranged as shown inFig. 4. The sand and sandy loam surfaces are wetted andthen air dried to produce a crust to prevent emission ofsurface particles.
2. Profile measurement:about 10 points of differentheights are selected. Dust particles are released fromthe dust feeder and the speeds of dust particles passingthrough these points are measured by PDA. As the par-ticles are small, their horizontal velocities can be con-sidered to be the same as the local wind speed. The hor-izontal particle velocities and concentrations are mea-sured one by one with duration of 3 min, to producemean wind and dust concentration profiles. Simultane-ously, a device is fixed at a certain height to measuredust concentration with the purposes of monitoring sta-bility of dust feeding and verifying reproducibility ofthe concentrations.
www.atmos-chem-phys.net/14/8869/2014/ Atmos. Chem. Phys., 14, 8869–8882, 2014
8872 J. Zhang et al.: Measurements of dust deposition velocity in a wind-tunnel experiment
Fan system
Rectification section
Wind
Honeyc
Dampin
Spires
Working (experi
comb
ng screen
Wind profile
Diffuser (outle
iment) section
Roughness elements
t)
Figure 3. A sketch of the Lanzhou University wind tunnel.
20cm
Y
20cm
X
Z
Surface top
40cm
Multi-outlets
(a) 6m (b)
X
Z
Wind
Dust feeder
Roughness element
Turbulent boundary layer
Dust
Test surface Measuring point
8m (c)
Probe of PDA
X
Y
Figure 4. Configuration of the wind-tunnel experiment.(a) Dust feeding outlets;(b) Working section; the roughness elements fixed at thefront of the working section generate a deep (at least 0.4 m) turbulent boundary layer. Downstream of the roughness-element section is thetest surface. A dust feeder is placed at the beginning of the working section and injects dust (SiO2) into the tunnel through a tubular manifold.The measuring point is located near the end of the working section;(c) Probe of the PDA with laser beams intersecting at the measuringpoint.
3. Point measurement:a point, at about 20 mm above thetop of surface, is selected for dust deposition measure-ment. The velocities and sizes of the particles that passthrough this point are measured by PDA. The durationof the measurement is 10 min.
4. Repeat:the surface is re-prepared and the Steps 2 and 3are repeated.
The experiments are carried out for different wind speedsand for each wind speed at least 3 successful runs aremade. Because PDA can only identify particles larger than0.5 µm (limited by the wavelength of the laser beam), theraw data are divided into the following of particle sizebins, 0.5–1.5 µm, 1.5–3 µm, 3–5 µm, 5–10 µm, 10–15 µm,15–20 µm, 20–25 µm, 25–30 µm, 30–50 µm, 50–80 µm, 80–100 µm, 100–150 µm, and 150–200 µm. For each bin, the par-ticles are considered to be mono-dispersed with the respec-tive median sizes of 1, 2.25, 4, 7.5, 12.5, 17.5, 22.5, 27.5,40, 65, 90, 125, and 175 µm. The deposition velocity foreach size bin is obtained by using the technique describedin Sect. 3.
3 Methodology of PDA data processing
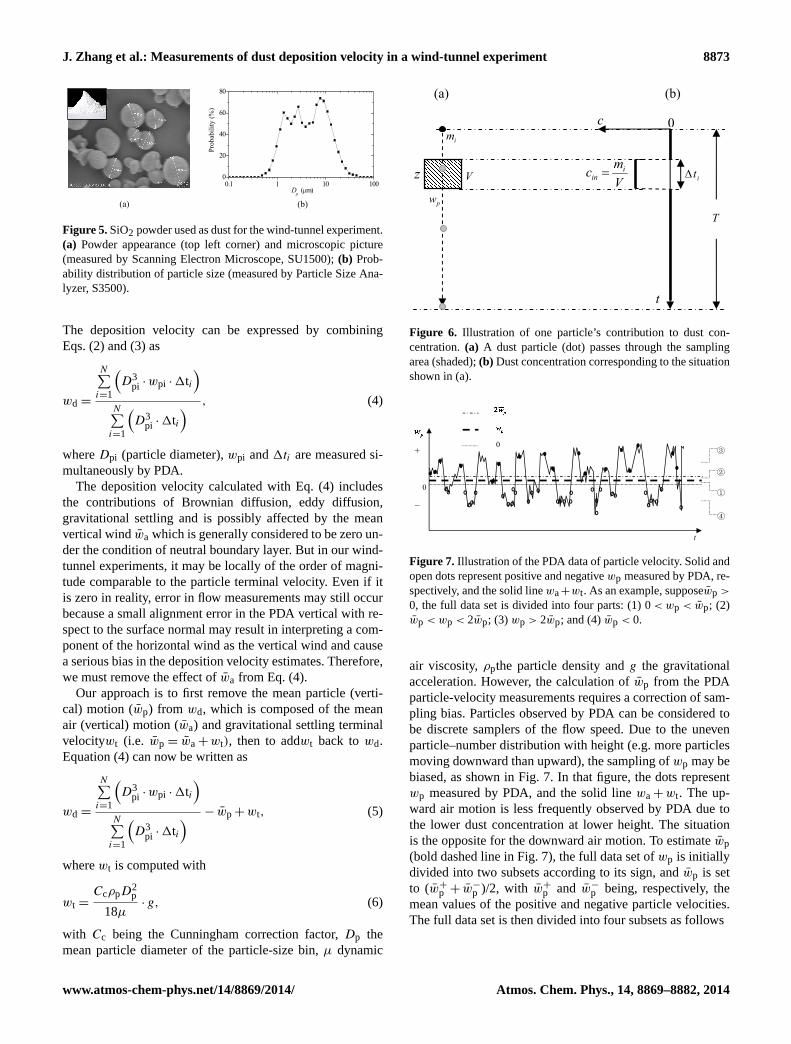
We now describe the method for deriving dust deposition ve-locity for different particle-size bins based on the PDA mea-surements. Our discussion is confined to the vertical direc-tion. As shown in Fig. 6, the sampling area of PDA has avolume ofV . If no particle appears inV , then dust concen-tration in the sampling area is zero. If particlei of massmi
passes throughV with (vertical) velocitywpi then the cor-responding concentration over the transit time1ti is mi
/V
and the associated vertical dust flux is
Fdi =mi
V· wpi. (1)
Suppose the sampling time interval isT , during whichN par-ticles pass throughV . Then, the average dust concentrationc
and dust fluxFd are, respectively,
c =
N∑i=1
(mi
V·1ti
T
)(2)
Fd =
N∑i=1
(mi
V· wpi ·
1ti
T
). (3)
Atmos. Chem. Phys., 14, 8869–8882, 2014 www.atmos-chem-phys.net/14/8869/2014/
J. Zhang et al.: Measurements of dust deposition velocity in a wind-tunnel experiment 8873
(a) (b)
0.1 1 10 1000
20
40
60
80
Dp (μm)
Prob
abili
ty (%
)
Figure 5.SiO2 powder used as dust for the wind-tunnel experiment.(a) Powder appearance (top left corner) and microscopic picture(measured by Scanning Electron Microscope, SU1500);(b) Prob-ability distribution of particle size (measured by Particle Size Ana-lyzer, S3500).
The deposition velocity can be expressed by combiningEqs. (2) and (3) as
wd =
N∑i=1
(D3
pi · wpi · 1ti)
N∑i=1
(D3
pi · 1ti) , (4)
whereDpi (particle diameter),wpi and1ti are measured si-multaneously by PDA.
The deposition velocity calculated with Eq. (4) includesthe contributions of Brownian diffusion, eddy diffusion,gravitational settling and is possibly affected by the meanvertical windwa which is generally considered to be zero un-der the condition of neutral boundary layer. But in our wind-tunnel experiments, it may be locally of the order of magni-tude comparable to the particle terminal velocity. Even if itis zero in reality, error in flow measurements may still occurbecause a small alignment error in the PDA vertical with re-spect to the surface normal may result in interpreting a com-ponent of the horizontal wind as the vertical wind and causea serious bias in the deposition velocity estimates. Therefore,we must remove the effect ofwa from Eq. (4).
Our approach is to first remove the mean particle (verti-cal) motion (wp) from wd, which is composed of the meanair (vertical) motion (wa) and gravitational settling terminalvelocitywt (i.e. wp = wa+ wt), then to addwt back towd.Equation (4) can now be written as
wd =
N∑i=1
(D3
pi · wpi · 1ti)
N∑i=1
(D3
pi · 1ti) − wp + wt, (5)
wherewt is computed with
wt =CcρpD
2p
18µ· g, (6)
with Cc being the Cunningham correction factor,Dp themean particle diameter of the particle-size bin,µ dynamic
T
itΔ
0
t
z
pw
V
imc
(a) (b)
Vmc i
in =
Figure 6. Illustration of one particle’s contribution to dust con-centration.(a) A dust particle (dot) passes through the samplingarea (shaded);(b) Dust concentration corresponding to the situationshown in (a).
0
0
+
①
②
④
③
−
t
Figure 7. Illustration of the PDA data of particle velocity. Solid andopen dots represent positive and negativewp measured by PDA, re-spectively, and the solid linewa+wt. As an example, supposewp >
0, the full data set is divided into four parts: (1) 0< wp < wp; (2)wp < wp < 2wp; (3) wp > 2wp; and (4)wp < 0.
air viscosity,ρpthe particle density andg the gravitationalacceleration. However, the calculation ofwp from the PDAparticle-velocity measurements requires a correction of sam-pling bias. Particles observed by PDA can be considered tobe discrete samplers of the flow speed. Due to the unevenparticle–number distribution with height (e.g. more particlesmoving downward than upward), the sampling ofwp may bebiased, as shown in Fig. 7. In that figure, the dots representwp measured by PDA, and the solid linewa+ wt. The up-ward air motion is less frequently observed by PDA due tothe lower dust concentration at lower height. The situationis the opposite for the downward air motion. To estimatewp(bold dashed line in Fig. 7), the full data set ofwp is initiallydivided into two subsets according to its sign, andwp is setto (w+
p + w−p )/2, with w+
p and w−p being, respectively, the
mean values of the positive and negative particle velocities.The full data set is then divided into four subsets as follows
www.atmos-chem-phys.net/14/8869/2014/ Atmos. Chem. Phys., 14, 8869–8882, 2014
8874 J. Zhang et al.: Measurements of dust deposition velocity in a wind-tunnel experiment
(a) (b)
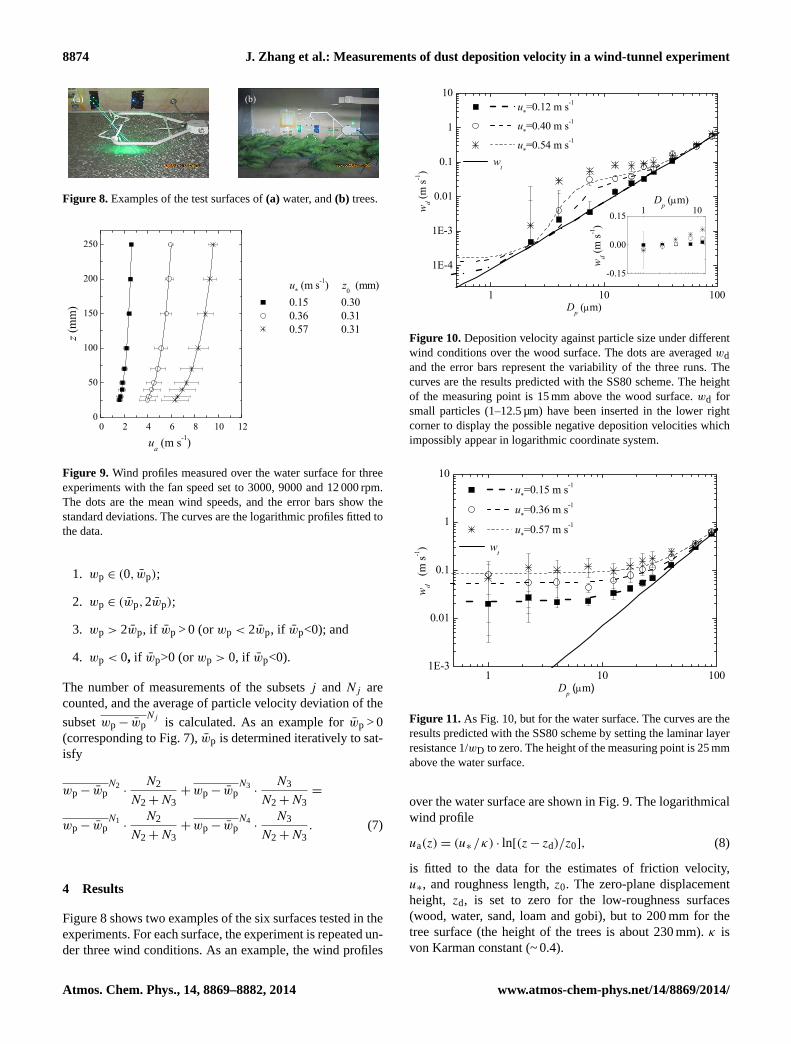
Figure 8. Examples of the test surfaces of(a) water, and(b) trees.
0
50
100
150
200
250
0 2 4 6 8 10 12
z (
mm
)
ua (m s-1)
u* (m s-1) z0 (mm) 0.15 0.30 0.36 0.31 0.57 0.31
Figure 9. Wind profiles measured over the water surface for threeexperiments with the fan speed set to 3000, 9000 and 12 000 rpm.The dots are the mean wind speeds, and the error bars show thestandard deviations. The curves are the logarithmic profiles fitted tothe data.
1. wp ∈ (0, wp);
2. wp ∈ (wp,2wp);
3. wp > 2wp, if wp > 0 (orwp < 2wp, if wp<0); and
4. wp < 0, if wp>0 (orwp > 0, if wp<0).
The number of measurements of the subsetsj andNj arecounted, and the average of particle velocity deviation of the
subsetwp − wpNj is calculated. As an example forwp > 0
(corresponding to Fig. 7),wp is determined iteratively to sat-isfy
wp − wpN2
·N2
N2 + N3+ wp − wp
N3·
N3
N2 + N3=
wp − wpN1
·N2
N2 + N3+ wp − wp
N4·
N3
N2 + N3. (7)
4 Results
Figure 8 shows two examples of the six surfaces tested in theexperiments. For each surface, the experiment is repeated un-der three wind conditions. As an example, the wind profiles
1 10 100
1E-4
1E-3
0.01
0.1
1
10
1 10
-0.15
0.00
0.15
Dp (μm)
wd (
m s-1
)
u*=0.12 m s-1
u*=0.40 m s-1
u*=0.54 m s-1
wt
wd (
m s-1
)
Dp (μm)
Figure 10.Deposition velocity against particle size under differentwind conditions over the wood surface. The dots are averagedwdand the error bars represent the variability of the three runs. Thecurves are the results predicted with the SS80 scheme. The heightof the measuring point is 15 mm above the wood surface.wd forsmall particles (1–12.5 µm) have been inserted in the lower rightcorner to display the possible negative deposition velocities whichimpossibly appear in logarithmic coordinate system.
1 10 1001E-3
0.01
0.1
1
10
u*=0.15 m s-1
u*=0.36 m s-1
u*=0.57 m s-1
wt
wd
(m s-1
)
Dp (μm)
Figure 11.As Fig. 10, but for the water surface. The curves are theresults predicted with the SS80 scheme by setting the laminar layerresistance 1/wD to zero. The height of the measuring point is 25 mmabove the water surface.
over the water surface are shown in Fig. 9. The logarithmicalwind profile
ua(z) = (u∗ /κ) · ln[(z − zd)/z0], (8)
is fitted to the data for the estimates of friction velocity,u∗, and roughness length,z0. The zero-plane displacementheight, zd, is set to zero for the low-roughness surfaces(wood, water, sand, loam and gobi), but to 200 mm for thetree surface (the height of the trees is about 230 mm).κ isvon Karman constant (~ 0.4).
Atmos. Chem. Phys., 14, 8869–8882, 2014 www.atmos-chem-phys.net/14/8869/2014/
J. Zhang et al.: Measurements of dust deposition velocity in a wind-tunnel experiment 8875
1E-4
1E-3
0.01
0.1
1
10
1 10
-0.03
0.00
0.03
wd (m
s-1)
Dp (μm)
u*=0.14 m s-1
u*=0.32 m s-1
u*=0.49 m s-1 wt
wd (m
s-1)
(a)
1 10
-0.1
0.0
0.1
Dp (μm)
wd (m
s-1)
u*=0.17 m s-1
u*=0.40 m s-1
u*=0.60 m s-1
wt
(b)
1 10 100
1E-3
0.01
0.1
1
10
1 10
-0.3
0.0
0.3
Dp (μm)
wd (m
s-1)
u*=0.19 m s-1
u*=0.43 m s-1
u*=0.67 m s-1
wt
wd (m
s-1)
Dp (μm)
(c)
1 10 100
Dp (μm)
u*=0.24 m s-1
u*=0.50 m s-1
u*=1.06 m s-1 wt
(d)
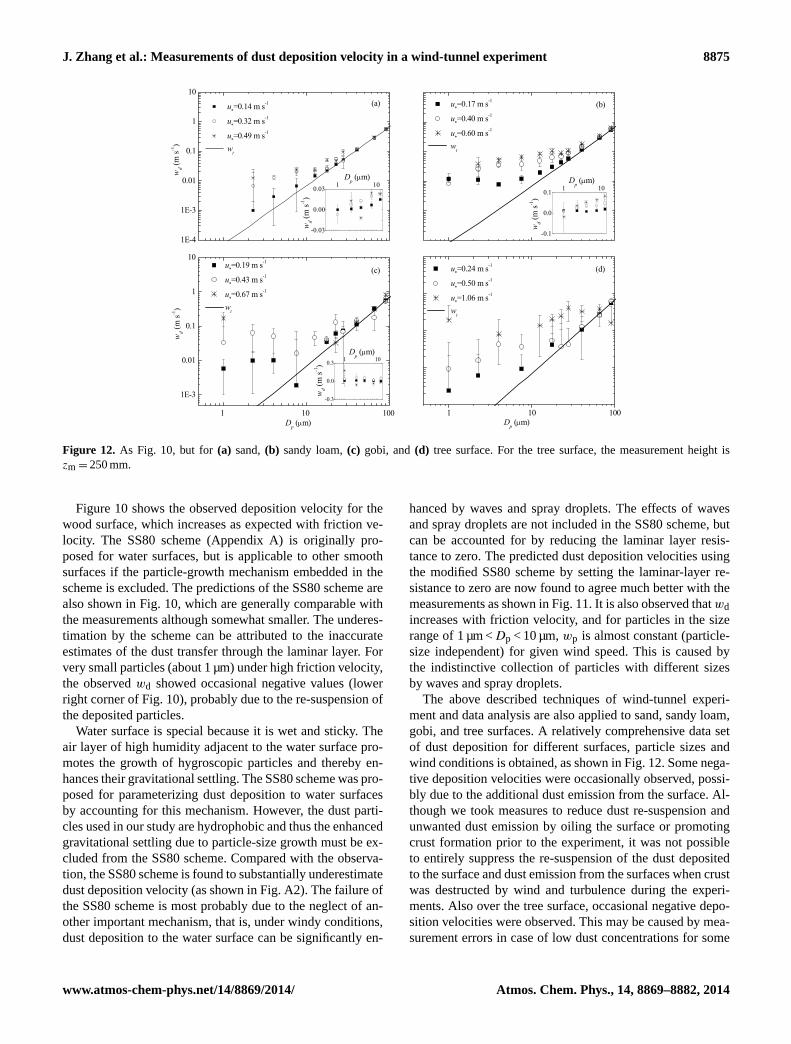
Figure 12. As Fig. 10, but for(a) sand,(b) sandy loam,(c) gobi, and(d) tree surface. For the tree surface, the measurement height iszm = 250 mm.
Figure 10 shows the observed deposition velocity for thewood surface, which increases as expected with friction ve-locity. The SS80 scheme (Appendix A) is originally pro-posed for water surfaces, but is applicable to other smoothsurfaces if the particle-growth mechanism embedded in thescheme is excluded. The predictions of the SS80 scheme arealso shown in Fig. 10, which are generally comparable withthe measurements although somewhat smaller. The underes-timation by the scheme can be attributed to the inaccurateestimates of the dust transfer through the laminar layer. Forvery small particles (about 1 µm) under high friction velocity,the observedwd showed occasional negative values (lowerright corner of Fig. 10), probably due to the re-suspension ofthe deposited particles.
Water surface is special because it is wet and sticky. Theair layer of high humidity adjacent to the water surface pro-motes the growth of hygroscopic particles and thereby en-hances their gravitational settling. The SS80 scheme was pro-posed for parameterizing dust deposition to water surfacesby accounting for this mechanism. However, the dust parti-cles used in our study are hydrophobic and thus the enhancedgravitational settling due to particle-size growth must be ex-cluded from the SS80 scheme. Compared with the observa-tion, the SS80 scheme is found to substantially underestimatedust deposition velocity (as shown in Fig. A2). The failure ofthe SS80 scheme is most probably due to the neglect of an-other important mechanism, that is, under windy conditions,dust deposition to the water surface can be significantly en-
hanced by waves and spray droplets. The effects of wavesand spray droplets are not included in the SS80 scheme, butcan be accounted for by reducing the laminar layer resis-tance to zero. The predicted dust deposition velocities usingthe modified SS80 scheme by setting the laminar-layer re-sistance to zero are now found to agree much better with themeasurements as shown in Fig. 11. It is also observed thatwdincreases with friction velocity, and for particles in the sizerange of 1 µm <Dp < 10 µm,wp is almost constant (particle-size independent) for given wind speed. This is caused bythe indistinctive collection of particles with different sizesby waves and spray droplets.
The above described techniques of wind-tunnel experi-ment and data analysis are also applied to sand, sandy loam,gobi, and tree surfaces. A relatively comprehensive data setof dust deposition for different surfaces, particle sizes andwind conditions is obtained, as shown in Fig. 12. Some nega-tive deposition velocities were occasionally observed, possi-bly due to the additional dust emission from the surface. Al-though we took measures to reduce dust re-suspension andunwanted dust emission by oiling the surface or promotingcrust formation prior to the experiment, it was not possibleto entirely suppress the re-suspension of the dust depositedto the surface and dust emission from the surfaces when crustwas destructed by wind and turbulence during the experi-ments. Also over the tree surface, occasional negative depo-sition velocities were observed. This may be caused by mea-surement errors in case of low dust concentrations for some
www.atmos-chem-phys.net/14/8869/2014/ Atmos. Chem. Phys., 14, 8869–8882, 2014
8876 J. Zhang et al.: Measurements of dust deposition velocity in a wind-tunnel experiment
particle-size bins, which result in inaccurate estimates ofwpand hencewd.
The sand, sandy-loam, gobi, and tree surfaces are rel-atively rough surfaces. We have tested the existing dustdeposition schemes against our data, but good agreementsbetween the model predictions and the measurements cannotbe achieved by setting the scheme parameters in reasonableranges. A new scheme needs to be developed to overcomethe deficiencies of existing schemes in parameterizing dustdeposition over rough surfaces, which we will discuss in de-tail in a companion paper (Zhang and Shao, 2014).
It is appropriate to put our data set in perspective to theexisting data published in the literature. However, dust de-position velocity is dependent on the reference height,zr, atwhich dust concentration is also measured to compute dustdeposition flux. The measurement heights for existing ex-periments, including our work, are normally different. Thesame reference height is required to achieve a proper compar-ison. By considering the similar aerodynamic characteristicover different surfaces (logarithmic wind profile), the termof “same reference height” is defined as the same distanceaway from the zero-plane displacement height (here, we takezr − zd = 1 m). To facilitate comparison, we have thereforecorrected all data to this same reference height by solvingdust concentration equation under the assumptions of steadyand horizontal homogenous
Kp ·∂c
∂z+ wt · c = −Fd = wd · c. (9)
Here, the dust diffusivityKp is set toκu∗(z−zd) and the dustdeposition fluxFd is considered as a constant.
Then we have
wd(zr) =
{[1
wd(zm)−
1
wt
](zm − zd
zr − zd
) wtκu∗
+1
wt
}−1
, (10)
wherewd(zr) is the deposition velocity atzr andzm height ofthe measuring point.
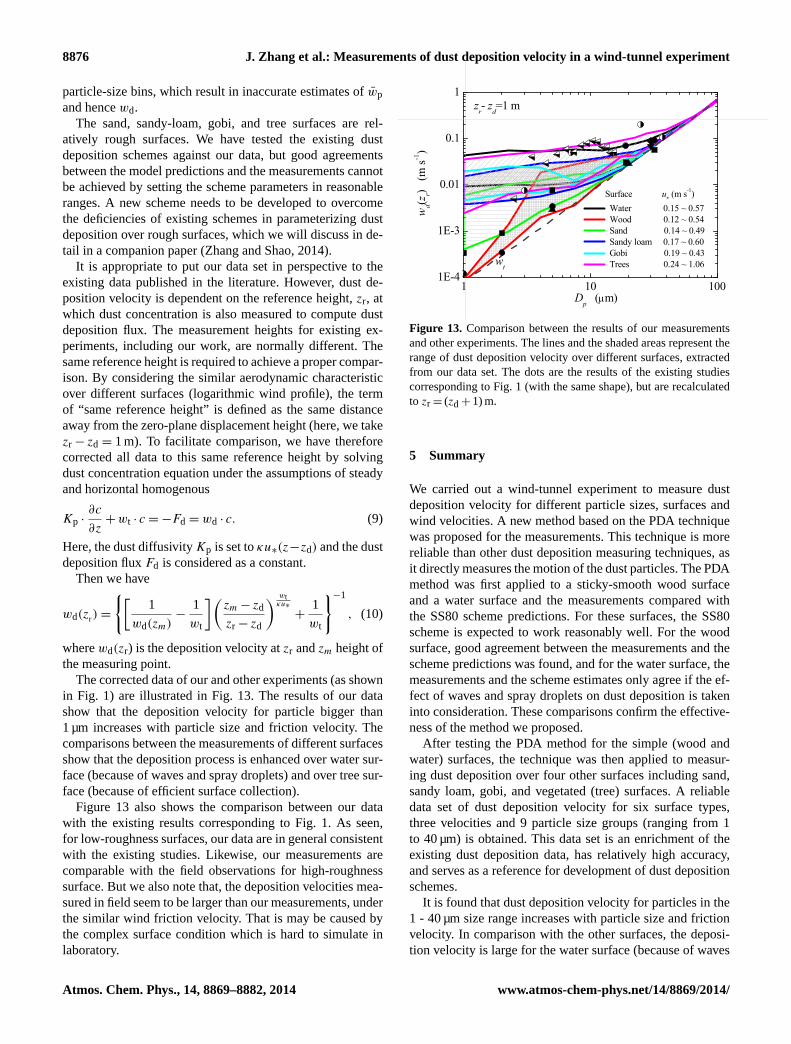
The corrected data of our and other experiments (as shownin Fig. 1) are illustrated in Fig. 13. The results of our datashow that the deposition velocity for particle bigger than1 µm increases with particle size and friction velocity. Thecomparisons between the measurements of different surfacesshow that the deposition process is enhanced over water sur-face (because of waves and spray droplets) and over tree sur-face (because of efficient surface collection).
Figure 13 also shows the comparison between our datawith the existing results corresponding to Fig. 1. As seen,for low-roughness surfaces, our data are in general consistentwith the existing studies. Likewise, our measurements arecomparable with the field observations for high-roughnesssurface. But we also note that, the deposition velocities mea-sured in field seem to be larger than our measurements, underthe similar wind friction velocity. That is may be caused bythe complex surface condition which is hard to simulate inlaboratory.
1 10 1001E-4
1E-3
0.01
0.1
1
Surface u* (m s-1) Water 0.15 ~ 0.57 Wood 0.12 ~ 0.54 Sand 0.14 ~ 0.49 Sandy loam 0.17 ~ 0.60 Gobi 0.19 ~ 0.43 Trees 0.24 ~ 1.06
wd(z
r) (m
s-1)
Dp (m)
wt
zr- zd=1 m
Figure 13. Comparison between the results of our measurementsand other experiments. The lines and the shaded areas represent therange of dust deposition velocity over different surfaces, extractedfrom our data set. The dots are the results of the existing studiescorresponding to Fig. 1 (with the same shape), but are recalculatedto zr = (zd + 1) m.
5 Summary
We carried out a wind-tunnel experiment to measure dustdeposition velocity for different particle sizes, surfaces andwind velocities. A new method based on the PDA techniquewas proposed for the measurements. This technique is morereliable than other dust deposition measuring techniques, asit directly measures the motion of the dust particles. The PDAmethod was first applied to a sticky-smooth wood surfaceand a water surface and the measurements compared withthe SS80 scheme predictions. For these surfaces, the SS80scheme is expected to work reasonably well. For the woodsurface, good agreement between the measurements and thescheme predictions was found, and for the water surface, themeasurements and the scheme estimates only agree if the ef-fect of waves and spray droplets on dust deposition is takeninto consideration. These comparisons confirm the effective-ness of the method we proposed.
After testing the PDA method for the simple (wood andwater) surfaces, the technique was then applied to measur-ing dust deposition over four other surfaces including sand,sandy loam, gobi, and vegetated (tree) surfaces. A reliabledata set of dust deposition velocity for six surface types,three velocities and 9 particle size groups (ranging from 1to 40 µm) is obtained. This data set is an enrichment of theexisting dust deposition data, has relatively high accuracy,and serves as a reference for development of dust depositionschemes.
It is found that dust deposition velocity for particles in the1 - 40 µm size range increases with particle size and frictionvelocity. In comparison with the other surfaces, the deposi-tion velocity is large for the water surface (because of waves
Atmos. Chem. Phys., 14, 8869–8882, 2014 www.atmos-chem-phys.net/14/8869/2014/
J. Zhang et al.: Measurements of dust deposition velocity in a wind-tunnel experiment 8877
and spray droplets) and the tree surface (because of efficientsurface collection). We have used the measurements to testthe performance of some existing schemes and have foundthat they generally perform poorly for rough surfaces. Thisfinding suggests that better representation of surface rough-ness elements in dust deposition schemes is required. In acompanion paper, we will propose a new dust depositionscheme and validate the scheme with the observations fromour wind-tunnel experiments.
www.atmos-chem-phys.net/14/8869/2014/ Atmos. Chem. Phys., 14, 8869–8882, 2014
8878 J. Zhang et al.: Measurements of dust deposition velocity in a wind-tunnel experiment
Constant Flux layer: Turbulent
transfer and settling
Mean wind at reference height
Deposition layer: Impaction, Brownian diffusion, settling and particle size growth Water surface
zr
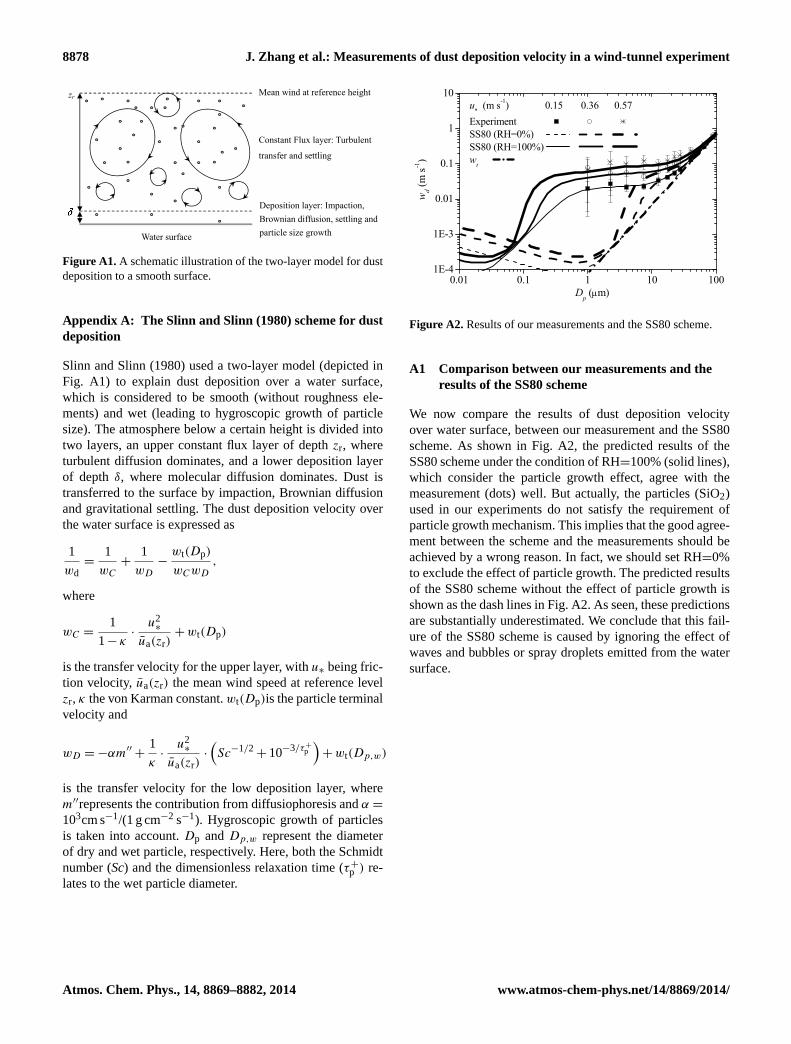
Figure A1. A schematic illustration of the two-layer model for dustdeposition to a smooth surface.
Appendix A: The Slinn and Slinn (1980) scheme for dustdeposition
Slinn and Slinn (1980) used a two-layer model (depicted inFig. A1) to explain dust deposition over a water surface,which is considered to be smooth (without roughness ele-ments) and wet (leading to hygroscopic growth of particlesize). The atmosphere below a certain height is divided intotwo layers, an upper constant flux layer of depthzr, whereturbulent diffusion dominates, and a lower deposition layerof depth δ, where molecular diffusion dominates. Dust istransferred to the surface by impaction, Brownian diffusionand gravitational settling. The dust deposition velocity overthe water surface is expressed as
1
wd=
1
wC
+1
wD
−wt(Dp)
wCwD
,
where
wC =1
1− κ·
u2∗
ua(zr)+ wt(Dp)
is the transfer velocity for the upper layer, withu∗ being fric-tion velocity, ua(zr) the mean wind speed at reference levelzr, κ the von Karman constant.wt(Dp)is the particle terminalvelocity and
wD = −αm′′+
1
κ·
u2∗
ua(zr)·
(Sc−1/2
+ 10−3/τ+p
)+ wt(Dp,w)
is the transfer velocity for the low deposition layer, wherem′′represents the contribution from diffusiophoresis andα =
103cm s−1/(1 g cm−2 s−1). Hygroscopic growth of particlesis taken into account.Dp andDp,w represent the diameterof dry and wet particle, respectively. Here, both the Schmidtnumber (Sc) and the dimensionless relaxation time (τ+
p ) re-lates to the wet particle diameter.
0.01 0.1 1 10 1001E-4
1E-3
0.01
0.1
1
10
u* (m s-1) 0.15 0.36 0.57Experiment SS80 (RH=0%) SS80 (RH=100%) wt
wd (m
s-1)
Dp (m)
Figure A2. Results of our measurements and the SS80 scheme.
Figure A2. Results of our measurements and the SS80 scheme.
A1 Comparison between our measurements and theresults of the SS80 scheme
We now compare the results of dust deposition velocityover water surface, between our measurement and the SS80scheme. As shown in Fig. A2, the predicted results of theSS80 scheme under the condition of RH=100% (solid lines),which consider the particle growth effect, agree with themeasurement (dots) well. But actually, the particles (SiO2)used in our experiments do not satisfy the requirement ofparticle growth mechanism. This implies that the good agree-ment between the scheme and the measurements should beachieved by a wrong reason. In fact, we should set RH=0%to exclude the effect of particle growth. The predicted resultsof the SS80 scheme without the effect of particle growth isshown as the dash lines in Fig. A2. As seen, these predictionsare substantially underestimated. We conclude that this fail-ure of the SS80 scheme is caused by ignoring the effect ofwaves and bubbles or spray droplets emitted from the watersurface.
Atmos. Chem. Phys., 14, 8869–8882, 2014 www.atmos-chem-phys.net/14/8869/2014/
J. Zhang et al.: Measurements of dust deposition velocity in a wind-tunnel experiment 8879
Appendix B: Data set of the wind-tunnel experiment
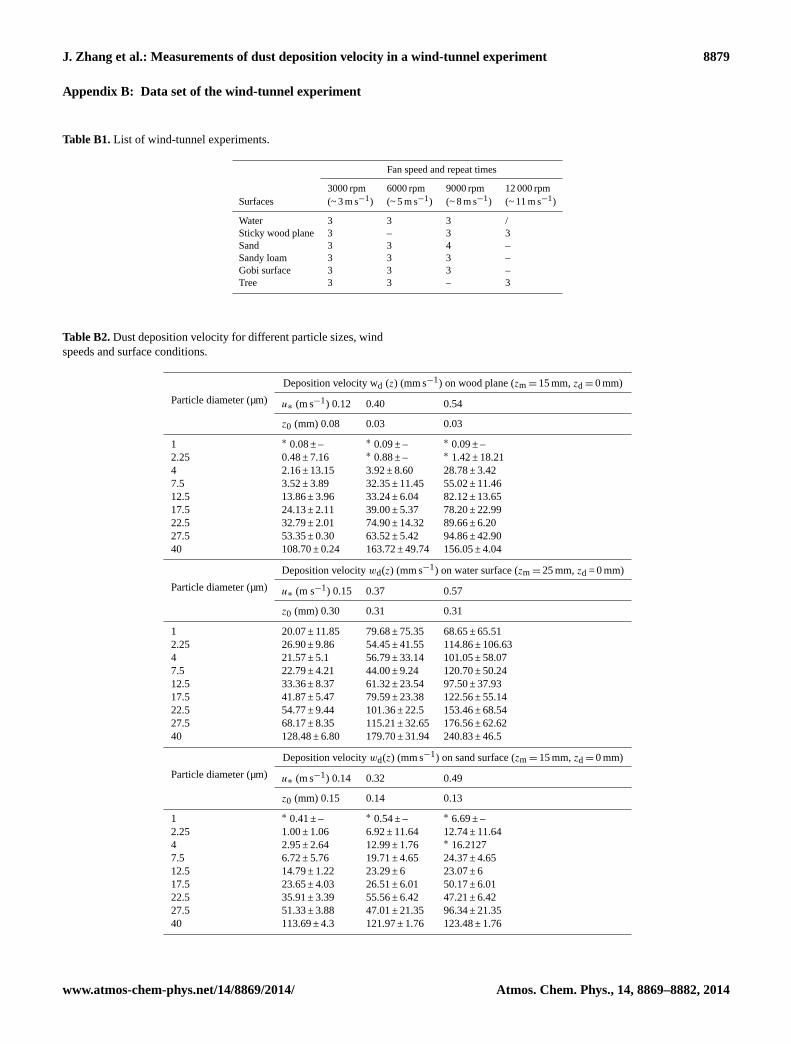
Table B1.List of wind-tunnel experiments.
Fan speed and repeat times
3000 rpm 6000 rpm 9000 rpm 12 000 rpmSurfaces (~ 3 m s−1) (~ 5 m s−1) (~ 8 m s−1) (~ 11 m s−1)
Water 3 3 3 /Sticky wood plane 3 – 3 3Sand 3 3 4 –Sandy loam 3 3 3 –Gobi surface 3 3 3 –Tree 3 3 – 3
Table B2.Dust deposition velocity for different particle sizes, windspeeds and surface conditions.
Particle diameter (µm)
Deposition velocity wd (z) (mm s−1) on wood plane (zm = 15 mm,zd = 0 mm)
u∗ (m s−1) 0.12 0.40 0.54
z0 (mm) 0.08 0.03 0.03
1 ∗ 0.08 ± – ∗ 0.09 ± – ∗ 0.09 ± –2.25 0.48 ± 7.16 ∗ 0.88 ± – ∗ 1.42 ± 18.214 2.16 ± 13.15 3.92 ± 8.60 28.78 ± 3.427.5 3.52 ± 3.89 32.35 ± 11.45 55.02 ± 11.4612.5 13.86 ± 3.96 33.24 ± 6.04 82.12 ± 13.6517.5 24.13 ± 2.11 39.00 ± 5.37 78.20 ± 22.9922.5 32.79 ± 2.01 74.90 ± 14.32 89.66 ± 6.2027.5 53.35 ± 0.30 63.52 ± 5.42 94.86 ± 42.9040 108.70 ± 0.24 163.72 ± 49.74 156.05 ± 4.04
Particle diameter (µm)
Deposition velocitywd(z) (mm s−1) on water surface (zm = 25 mm,zd = 0 mm)
u∗ (m s−1) 0.15 0.37 0.57
z0 (mm) 0.30 0.31 0.31
1 20.07 ± 11.85 79.68 ± 75.35 68.65 ± 65.512.25 26.90 ± 9.86 54.45 ± 41.55 114.86 ± 106.634 21.57 ± 5.1 56.79 ± 33.14 101.05 ± 58.077.5 22.79 ± 4.21 44.00 ± 9.24 120.70 ± 50.2412.5 33.36 ± 8.37 61.32 ± 23.54 97.50 ± 37.9317.5 41.87 ± 5.47 79.59 ± 23.38 122.56 ± 55.1422.5 54.77 ± 9.44 101.36 ± 22.5 153.46 ± 68.5427.5 68.17 ± 8.35 115.21 ± 32.65 176.56 ± 62.6240 128.48 ± 6.80 179.70 ± 31.94 240.83 ± 46.5
Particle diameter (µm)
Deposition velocitywd(z) (mm s−1) on sand surface (zm = 15 mm,zd = 0 mm)
u∗ (m s−1) 0.14 0.32 0.49
z0 (mm) 0.15 0.14 0.13
1 ∗ 0.41 ± – ∗ 0.54 ± – ∗ 6.69 ± –2.25 1.00 ± 1.06 6.92 ± 11.64 12.74 ± 11.644 2.95 ± 2.64 12.99 ± 1.76 ∗ 16.21277.5 6.72 ± 5.76 19.71 ± 4.65 24.37 ± 4.6512.5 14.79 ± 1.22 23.29 ± 6 23.07 ± 617.5 23.65 ± 4.03 26.51 ± 6.01 50.17 ± 6.0122.5 35.91 ± 3.39 55.56 ± 6.42 47.21 ± 6.4227.5 51.33 ± 3.88 47.01 ± 21.35 96.34 ± 21.3540 113.69 ± 4.3 121.97 ± 1.76 123.48 ± 1.76
www.atmos-chem-phys.net/14/8869/2014/ Atmos. Chem. Phys., 14, 8869–8882, 2014
8880 J. Zhang et al.: Measurements of dust deposition velocity in a wind-tunnel experiment
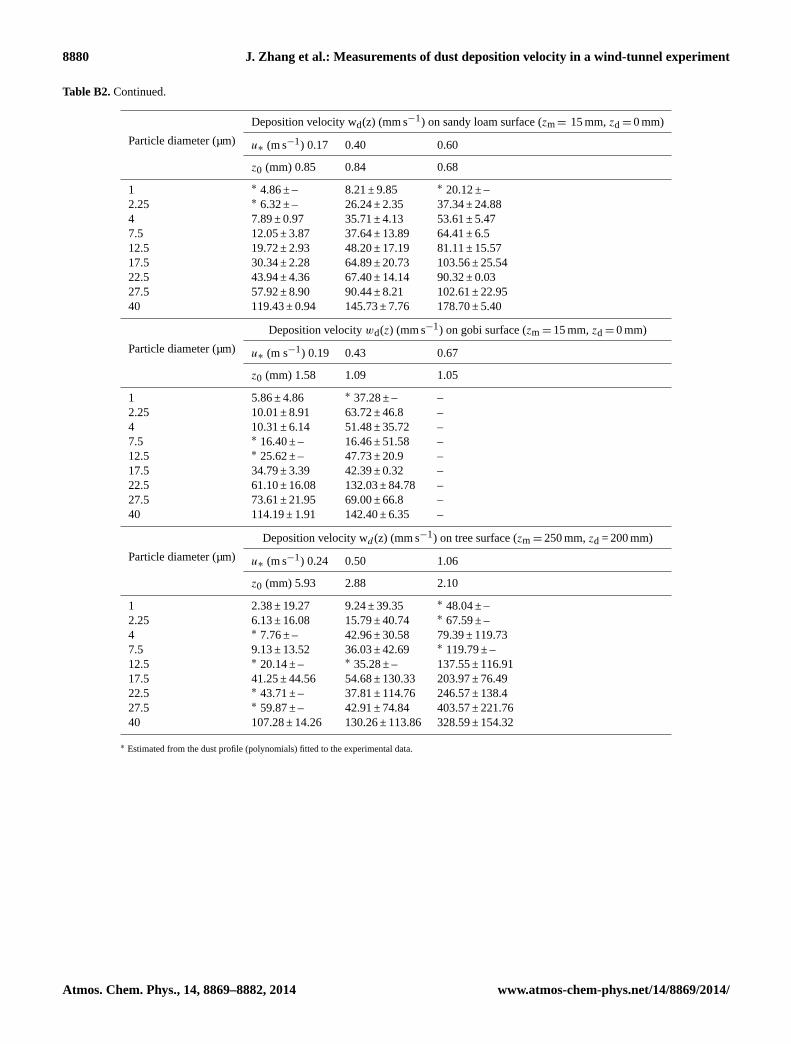
Table B2.Continued.
Particle diameter (µm)
Deposition velocity wd(z) (mm s−1) on sandy loam surface (zm= 15 mm,zd = 0 mm)
u∗ (m s−1) 0.17 0.40 0.60
z0 (mm) 0.85 0.84 0.68
1 ∗ 4.86 ± – 8.21 ± 9.85 ∗ 20.12 ± –2.25 ∗ 6.32 ± – 26.24 ± 2.35 37.34 ± 24.884 7.89 ± 0.97 35.71 ± 4.13 53.61 ± 5.477.5 12.05 ± 3.87 37.64 ± 13.89 64.41 ± 6.512.5 19.72 ± 2.93 48.20 ± 17.19 81.11 ± 15.5717.5 30.34 ± 2.28 64.89 ± 20.73 103.56 ± 25.5422.5 43.94 ± 4.36 67.40 ± 14.14 90.32 ± 0.0327.5 57.92 ± 8.90 90.44 ± 8.21 102.61 ± 22.9540 119.43 ± 0.94 145.73 ± 7.76 178.70 ± 5.40
Particle diameter (µm)
Deposition velocitywd(z) (mm s−1) on gobi surface (zm = 15 mm,zd = 0 mm)
u∗ (m s−1) 0.19 0.43 0.67
z0 (mm) 1.58 1.09 1.05
1 5.86 ± 4.86 ∗ 37.28 ± – –2.25 10.01 ± 8.91 63.72 ± 46.8 –4 10.31 ± 6.14 51.48 ± 35.72 –7.5 ∗ 16.40 ± – 16.46 ± 51.58 –12.5 ∗ 25.62 ± – 47.73 ± 20.9 –17.5 34.79 ± 3.39 42.39 ± 0.32 –22.5 61.10 ± 16.08 132.03 ± 84.78 –27.5 73.61 ± 21.95 69.00 ± 66.8 –40 114.19 ± 1.91 142.40 ± 6.35 –
Particle diameter (µm)
Deposition velocity wd (z) (mm s−1) on tree surface (zm = 250 mm,zd = 200 mm)
u∗ (m s−1) 0.24 0.50 1.06
z0 (mm) 5.93 2.88 2.10
1 2.38 ± 19.27 9.24 ± 39.35 ∗ 48.04 ± –2.25 6.13 ± 16.08 15.79 ± 40.74 ∗ 67.59 ± –4 ∗ 7.76 ± – 42.96 ± 30.58 79.39 ± 119.737.5 9.13 ± 13.52 36.03 ± 42.69 ∗ 119.79 ± –12.5 ∗ 20.14 ± – ∗ 35.28 ± – 137.55 ± 116.9117.5 41.25 ± 44.56 54.68 ± 130.33 203.97 ± 76.4922.5 ∗ 43.71 ± – 37.81 ± 114.76 246.57 ± 138.427.5 ∗ 59.87 ± – 42.91 ± 74.84 403.57 ± 221.7640 107.28 ± 14.26 130.26 ± 113.86 328.59 ± 154.32
∗ Estimated from the dust profile (polynomials) fitted to the experimental data.
Atmos. Chem. Phys., 14, 8869–8882, 2014 www.atmos-chem-phys.net/14/8869/2014/
J. Zhang et al.: Measurements of dust deposition velocity in a wind-tunnel experiment 8881
Acknowledgements.This work is supported by the DFG (DeutscheForschungsgemeinschaft) project “A Wind-tunnel Study onDust-deposition Mechanisms and Validation of Dust-depositionSchemes”, the National Natural Science Foundation of China(Project 11172118) and the Innovative Research Groups of theNational Natural Science Foundation of China (Project 11121202).We are grateful to Prof. Xiaojing Zheng for supporting thisproject and to the colleagues of Lanzhou University for providingassistance to carrying out the wind-tunnel experiments.
Edited by: A. Kiendler-Scharr
References
Alfaro, S. C. and Gomes, L.: Modeling mineral aerosol productionby wind erosion: Emission intensities and aerosol size distribu-tions in source areas, J. Geophys. Res., 106, 18075–18084, 2001.
Beswick, K. M., Hargreaves, K. J., Gallagher, M. W., Choularton, T.W., and Fowler, D.: Size-resolved measurements of cloud dropletdeposition velocity to a forest canopy using an eddy correlationtechnique, Q. J. Roy. Meteor. Soc., 117, 623–645, 1991.
Bleyl, M.: Experimentelle Bestimmung der Depositions-geschwindigkeit Luftgetragener Partikel mit Hilfe der Eddy-Kovarianzmethode über einem Fichtenaltbestand im Solling,Ph.D. Thesis, Georg-August-Universität, Göttingen, 2001.
Chamberlain, A. C.: Transport of Lycopodium spores and othersmall particles to rough surfaces, Proc. Roy. Soc. Ldn., 296, 45–70, 1967.
Clough, W. S.: Transport of particles to surfaces, J. Aerosol Sci., 4,227–234, 1973.
Clough, W. S.: The deposition of particles on moss and grass sur-faces, Atmos. Environ., 9, 1113–1119, 1975.
Dantec Dynamics A/S: BSA Flow Software Installation and User’sGuide, Version 4.10, Skovlunde, 2006.
Gallagher, M. W., Beswick, K. M., Duyzer, J., Westrate, H.,Choularton, T. W., and Hummelshøj, P.: Measurements ofaerosol fluxes to speulder forest using a micrometeorologicaltechnique, Atmos. Environ., 31, 359–373, 1997.
Gallagher, W., Choularton, T., Morse, A., and Fowler, D.: Measure-ments of the size dependence of cloud droplet deposition at a hillsite, Q. J. Roy. Meteorol. Soc., 114, 1291–1303, 1988.
Gao, Y., Arimoto, R., Duce, R. A., Zhang, X. Y., Zhang, G. Y., An,Z. S., Chen, L. Q., Zhou, M. Y., and Gu, D. Y.: Temporal andspatial distributions of dust and its deposition to the China Sea,Tellus 49B, 172–189, 1997.
Gillette, D. A.: Fine particulate emissions due to wind erosion,Trans. Am. Soc. Agricult. Eng., 20, 890–897, 1977.
Goossens, D. and Offer, Z. Y.: Wind tunnel and field calibrationof six aeolian dust samplers, Atmos. Environ., 34, 1043–1057,2000.
Goossens, D. and Rajot, J. L.: Techniques to measure the dry aeo-lian deposition of dust in arid and semi-arid landscapes: a com-parative study in West Niger, Earth Surf. Proc. Land., 33, 178–195, 2008.
Grönholm, T., Aalto, P. P., Hiltunen, V., Rannik, Ü., Rinne, J.,Laakso, L., Hyvönen, S., Vesala, T., and Kulmala, M.: Measure-ments of aerosol particle dry deposition velocity using the re-laxed eddy accumulation technique, Tellus B, 59, 381–386, 2007.
Hicks, B. B., Matt, D. R., McMillen, R. T., Womack, J. D., Wesely,M. L., Hart, R. L., Cook, D. R., Lindberg, S. E., de Pena, R. G.,and Thomson, D. W.: A field investigation of sulfate fluxes to adeciduous forest, J. Geophys. Res., 94, 13003–13011, 1989.
Ishizuka, M., Mikami, M., Leys, J., Yamada, Y., Heidenreich, S.,Shao, Y., and McTainsh, G. H.: Effects of soil moisture anddried raindroplet crust on saltation and dust emission, J. Geo-phys. Res., 113, D24212, doi:10.1029/2008JD009955, 2008.
Liu, L. Y., Shai, P. J., Gao, S. Y., Zou, X. Y., Erdon, H., Yan, P.,Li, X. Y., Ta, W. Q., Wang, W. Q., and Zhang, C. L.: Dustfallin China’s western loess plateau as influenced by dust storm andhaze events, Atmos. Environ., 38, 1699–1703, 2004.
Marticorena, B. and Bergametti, G.: Modeling the atmospheric dustcycle: 1. Design of a soil-derived dust emission scheme, J. Geo-phys. Res., 100, 16415–16430, 1995.
Nemitz, E., Gallagher, M. W., Duyzer, J. H., and Fowler, D.: Mi-crometeorological measurements of particle deposition veloci-ties to moorland vegetation, Q. J. Roy. Meteor. Soc., 128, 2281–2300, 2002.
Ould-Dada, Z.: Dry deposition profile of small particles within amodel spruce canopy, Sci. Total Environ., 286, 83–96, 2002.
Pryor, S. C., Larsen, S. E., Sørensen, L. L., Barthelmie, R. J.,Grönholm, T., Kulmala, M., Launiainen, S., Rannik, Ü. andVesala, T.: Particle fluxes over forests: Analyses of flux meth-ods and functional dependencies, J. Geophys. Res., 112, D07205,doi:10.1029/2006JD008066, 2007.
Pryor, S. C., Larsen, S. E., Sørensen, L. L., and Barthelmie, R. J.:Particle fluxes above forests: observations, methodological con-siderations and method comparisons, Environ. Pollut., 152, 667–678, 2008.
Sehmel, G. A.: Particle diffusivities and deposition velocities overa horizontal smooth surface, J. Colloid Interf. Sci., 37, 891–906,1971.
Seinfeld, J. H. and Pandis, S. N.: Atmospheric chemistry andphysics: from air pollution to climate change, second edition,John Wiley & Sons, Inc., Hoboken, 923–927, 2006.
Shao, Y.: A model for mineral dust emission, J. Geophys. Res., 106,20239–20254, 2001.
Shao, Y.: Simplification of a dust emission scheme andcomparison with data, J. Geophys. Res., 109, D10202,doi:10.1029/2003JD004372, 2004.
Shao, Y., McTainsh, G. H., Leys, J. F., and Raupach, M. R.: Ef-ficiencies of sediment samplers for wind erosion measurement,Soil Res., 31, 519–532, 1993
Slinn, S. A. and Slinn, W. G. N.: Predictions for particle depositionon natural waters, Atmos. Environ., 14, 1013–1016, 1980.
Slinn, W. G. N.: Predictions for particle deposition to vegetativecanopies, Atmos. Environ., 16, 1785–1794, 1982.
Sow, M., Goossens, D., and Rajot, J. L.: Calibration of the MDCOdust collector and of four versions of the inverted frisbee dustdeposition sampler, Geomorphology, 82, 360–375, 2006.
Textor, C., Schulz, M., Guibert, S., Kinne, S., Balkanski, Y., Bauer,S., Berntsen, T., Berglen, T., Boucher, O., Chin, M., Dentener, F.,Diehl, T., Easter, R., Feichter, H., Fillmore, D., Ghan, S., Ginoux,P., Gong, S., Grini, A., Hendricks, J., Horowitz, L., Huang, P.,Isaksen, I., Iversen, I., Kloster, S., Koch, D., Kirkevåg, A., Krist-jansson, J. E., Krol, M., Lauer, A., Lamarque, J. F., Liu, X., Mon-tanaro, V., Myhre, G., Penner, J., Pitari, G., Reddy, S., Seland,Ø., Stier, P., Takemura, T., and Tie, X.: Analysis and quantifica-
www.atmos-chem-phys.net/14/8869/2014/ Atmos. Chem. Phys., 14, 8869–8882, 2014
8882 J. Zhang et al.: Measurements of dust deposition velocity in a wind-tunnel experiment
tion of the diversities of aerosol life cycles within AeroCom, At-mos. Chem. Phys., 6, 1777–1813, doi:10.5194/acp-6-1777-2006,2006.
Textor, C., Schulz, M., Guibert, S., Kinne, S., Balkanski, Y., Bauer,S., Berntsen, T., Berglen, T., Boucher, O., Chin, M., Dentener,F., Diehl, T., Feichter, J., Fillmore, D., Ginoux, P., Gong, S.,Grini, A., Hendricks, J., Horowitz, L., Huang, P., Isaksen, I. S.A., Iversen, T., Kloster, S., Koch, D., Kirkevåg, A., Kristjans-son, J. E., Krol, M., Lauer, A., Lamarque, J. F., Liu, X., Mon-tanaro, V., Myhre, G., Penner, J. E., Pitari, G., Reddy, M. S.,Seland, Ø., Stier, P., Takemura, T., and Tie, X.: The effect ofharmonized emissions on aerosol properties in global models –an AeroCom experiment, Atmos. Chem. Phys., 7, 4489–4501,doi:10.5194/acp-7-4489-2007, 2007.
Uno, I., Wang, Z., Chiba, M., Chun, Y. S., Gong, S. L., Hara, Y.,Jung, E., Lee, S. S., Liu, M., Mikami, M., Music, S., Nick-ovic, S., Satake, S., Shao, Y., Song, Z., Sugimoto, N., Tanaka,T., and Westphal, D. L.: Dust model intercomparison DMIPstudy over Asia: overview, J. Geophys. Res., 111, D12213,doi:10.1029/2005JD006575, 2006.
Wesely, M. L., Cook, D. R., and Hart, R. L.: Fluxes of gases and par-ticles above a deciduous forest in wintertime, Bound.-Lay. Me-teorol., 27, 237–255, 1983.
Wesely, M. L., Cook, D. R., Hart, R. L., and Speer, R. E.: Measure-ments and parameterization of particulate sulfur dry depositionover grass, J. Geophys. Res., 90, 2131–2143, 1985.
Zhang, J. and Shao, Y.: A new parameterization of dust dry de-position over rough surfaces, Atmos. Chem. Phys. Discuss., 14,8063–8094, doi:10.5194/acpd-14-8063-2014, 2014.
Atmos. Chem. Phys., 14, 8869–8882, 2014 www.atmos-chem-phys.net/14/8869/2014/