Embed Size (px)
Citation preview

University of Central Florida University of Central Florida
STARS STARS
Electronic Theses and Dissertations, 2004-2019
2014
Evaluation of Iron and Manganese Control for a Volcanic Surface Evaluation of Iron and Manganese Control for a Volcanic Surface
Water Supply Treated with Conventional Coagulation, Water Supply Treated with Conventional Coagulation,
Sedimentation and Filtration Processes Sedimentation and Filtration Processes
Christine Hall University of Central Florida
Part of the Environmental Engineering Commons
Find similar works at: https://stars.library.ucf.edu/etd
University of Central Florida Libraries http://library.ucf.edu
This Masters Thesis (Open Access) is brought to you for free and open access by STARS. It has been accepted for
inclusion in Electronic Theses and Dissertations, 2004-2019 by an authorized administrator of STARS. For more
information, please contact [email protected].
STARS Citation STARS Citation Hall, Christine, "Evaluation of Iron and Manganese Control for a Volcanic Surface Water Supply Treated with Conventional Coagulation, Sedimentation and Filtration Processes" (2014). Electronic Theses and Dissertations, 2004-2019. 4615. https://stars.library.ucf.edu/etd/4615

EVALUATION OF IRON AND MANGANESE CONTROL FOR A VOLCANIC SURFACE WATER SUPPLY TREATED WITH CONVENTIONAL COAGULATION,
SEDIMENTATION AND FILTRATION PROCESSES
by
CHRISTINE HALL, E.I. B.S.C.E., B.S.Env.E, University of Central Florida, 2012
A thesis submitted in partial fulfillment of the requirements for the degree of Master of Science
in the Department of Civil, Environmental, and Construction Engineering in the College of Engineering and Computer Science
at the University of Central Florida Orlando, Florida
Spring Term
2014

ii
© 2014 Christine M. Hall
iii
ABSTRACT
A research project assessing the effectiveness of potassium permanganate (KMnO4) for the
treatment of iron (Fe) and manganese (Mn) has been conducted by the University of Central
Florida (UCF) on behalf of the United States Navy with regards to the water supply on the island
of Guam, located in the Marianas Islands. The study consisted of three basic investigative
components: one that examined the use of potassium permanganate for iron and manganese
control for Fena Lake, a second that examined the existing unit operations that comprised the
Navy’s water treatment plant (NWTP), and a third that examined iron and manganese field
sampling analytical procedures.
In the first and primary component of the research, surface water from Fena Lake located within
the Naval Magazine in proximity of Santa Rita, Guam was collected at several different lake
depths and initially analyzed for iron and manganese using inductively coupled plasma.
Subsequent aliquots of Fena Lake collected at the various water depths were transferred to jars
then dosed with varying amounts of potassium permanganate after which iron and manganese
content was determined. The jars were covered to simulate actual lake to plant transfer
conditions experienced at the Navy’s on-island facilities. A portion of the jars was dosed with
potassium permanganate prior to metals analysis in order to allow for comparisons of baseline
conditions. To represent conventional treatment processes, the water samples were then
coagulated with aluminum sulfate prior to filtration to remove the oxidized manganese and iron
formed from the addition of the potassium permanganate. Coagulated aliquots were filtered and
collected to evaluate residual dissolved iron and manganese content. Based on the results of the

iv
jar tests it was determined that manganese was reduced by 95% or greater and that iron was
completely removed to below the analytical detection limit (0.001 mg/L). It was determined that
the potassium permanganate dose required for oxidation of iron was 0.94 mg/mg iron and for
manganese was 1.92 mg/mg manganese. It was also observed that when the jars containing
aliquots that turned brown in color after potassium permanganate dosing meant that iron and
manganese were present and were being oxidized; however, water samples that turned pink were
found to be over-dosed with potassium permanganate. The pink water is an undesired
characteristic and could result in customer complaints when distributed to the system.
The second component of research focused on NWTP existing conditions. Water samples were
collected after each key unit operation within the NWTP and analyzed for iron and manganese.
This was to determine if pre-chlorination at Fena Lake was effective at removing iron and
manganese that could be present in the source water. Analysis was conducted where pre-
chlorination at Fena Lake was practiced as well as when no pretreatment was practiced prior to
the NWTP. It was determined that the iron and manganese were not detected downstream of the
coagulation unit operation within the NWTP even when pre-chlorination was not practiced.
Consequently pre-chlorination of Fena Lake source water was not required for controlling iron
and manganese under the conditions experienced in this study.
A third study was also implemented to confirm that 0.1-micron filters are appropriate for use in
preparing samples for analytical determination of iron and manganese analysis at various points
within the NWTP. The filtration step is important to delineate between dissolved and suspended
iron and manganese forms. Standard Methods 3120B recommends the use of 0.45-micron filters,

v
although based on literature it has been shown that oxidized manganese particles may be smaller
than a 0.45-micron pore size. Unless a coagulant was used, the oxidized manganese may not be
fully removed via the 0.45-micron filter. To verify the effectiveness of using a 0.1-micron filter,
a jar test was conducted to compare the use of a 0.1-micron filter, a 0.45-micron filter, and a
0.45-micron filter after the sample has been coagulated. It was found that the use of a 0.1-micron
filter was superior to the use of 0.45-micron filters even with coagulant addition when directly
comparing between dissolved and suspended iron and manganese forms. It is recommended that
0.1-microns be utilized in lieu of historically recommended 0.45-micron filters for sample
preparation procedures.

vi
This thesis is dedicated to the Hall family: Carolyn, Martin, Scott, Jennifer, and Leslie
vii
ACKNOWLEDGMENTS
This study would not have been possible without the support of a number of individuals who
assisted in this research. The author would like to thank Dr. Steven Duranceau for the
opportunity to perform this research and for serving as my committee chair. The author is
tremendously grateful for his support in the authors’ continuing education. Thank you to Dr.
Andrew Randall and Dr. Woo Hyoung Lee for serving as committee members and donating their
time and expertise in reviewing this document. The author wishes to acknowledge the efforts of
Mrs. Maria Real-Robert, the Civil, Environmental, and Construction Engineering (CECE)
laboratory coordinator, for her guidance and assistance. The author would also like to express
great appreciation to Erica LaBerge for support and help while on campus and in Guam. The
author is also grateful to the assistance of UCF students Danielle Barnhill, Paul Biscardi, Shane
Clark, Andrea Cumming, Carlyn Higgins, Samantha Jeffrey, Tiffany Miller, Erin Reed, Angie
Rodriguez, Mike Semago, Tyler Smith, and David Yonge.
The author would also like to express their gratitude to the laboratory staff in Santa Rita, Guam,
DZSP21. Without their help none of the testing that occurred on-island or in the UCF laboratory
would have been possible. Also, thank you to the Naval Facilities Engineering Command
(NAVFAC), especially Maria Lewis, for allowing UCF to conduct research for the Navy Water
Treatment Plant (NWTP) in Santa Rita, Guam. The author would also like to express gratitude to
Brown & Caldwell, specifically Doug Lee and Bill Persich for their guidance throughout the course
of this research.

viii
TABLE OF CONTENTS
LIST OF FIGURES ....................................................................................................................... xi
LIST OF TABLES ....................................................................................................................... xiii
LIST OF EQUATIONS ............................................................................................................... xiv
LIST OF ABBREVIATIONS ....................................................................................................... xv
1. INTRODUCTION ..................................................................................................................... 1
Project Description ...................................................................................................................... 1
2. LITERATURE REVIEW........................................................................................................... 4
Manganese Chemistry ................................................................................................................. 4
Iron Chemistry ............................................................................................................................. 8
Oxidant Selection ...................................................................................................................... 10
Chlorine as an Oxidant .............................................................................................................. 12
Potassium Permanganate as an Oxidant .................................................................................... 13
3. EXISTING CONDITIONS ...................................................................................................... 15
Description of Raw Water Sources ........................................................................................... 15
Description of the NWTP Process Unit Operations .................................................................. 16
4. MATERIALS AND METHODS ............................................................................................. 19
Experimental Plan ..................................................................................................................... 20
Testing Locations ...................................................................................................................... 21
Procedures ................................................................................................................................. 21

ix
Iron and Manganese Analysis ................................................................................................ 21
Potassium Permanganate Stock Solution ............................................................................... 22
Potassium Permanganate Jar Testing ..................................................................................... 24
Laboratory Filter Method ....................................................................................................... 29
Cleaning Procedures ............................................................................................................... 30
Field and Laboratory Quality Control ....................................................................................... 30
Accuracy ................................................................................................................................ 31
Precision ................................................................................................................................. 32
5. RESULTS AND DISCUSSION .............................................................................................. 34
Fena Lake Iron and Manganese Profile ..................................................................................... 34
Almagosa and Bona Springs Iron and Manganese Content ...................................................... 35
Effectiveness of Fena Lake Chlorine Pretreatment for Fe and Mn Control Prior to NWTP
Processes ................................................................................................................................... 36
Cessation of Fena Lake Chlorine Pretreatment and Subsequent Effects on Water Quality ...... 43
Effectiveness of Potassium Permanganate Pretreatment for Iron and Manganese Control ...... 50
Laboratory Filter Method Verification ...................................................................................... 54
Quality Control Results ............................................................................................................. 55
6. CONCLUSIONS AND RECOMMENDATIONS .................................................................. 57
Conclusions ............................................................................................................................... 57
Recommendations ..................................................................................................................... 58
APPENDIX A: IRON AND MANGANESE DATA ................................................................... 60

x
REFERENCES ............................................................................................................................. 68

xi
LIST OF FIGURES
Figure 2-1: Manganese Biogeochemical Cycle (Roccaro, Barone et al., 2007) ............................. 5
Figure 2-2: Pourbaix Diagram for Manganese (Scheffer et al., 1989) ........................................... 7
Figure 2-3: Pourbaix Diagram for Iron (Scheffer et al., 1989) ....................................................... 9
Figure 3-1: NWTP Process Flow Diagram ................................................................................... 17
Figure 4-1: Potassium Permanganate Test Stock Solution ........................................................... 23
Figure 4-2: Sample Collection at the Navy Reservoir Pump Station ........................................... 26
Figure 4-3: Potassium Permanganate Jar Test .............................................................................. 27
Figure 5-1: Total Manganese Concentration at Various Depths .................................................. 34
Figure 5-2: Total Iron Concentration at Various Depths .............................................................. 35
Figure 5-3: Total Manganese Throughout the Water Treatment Process (Pre-chlorination) [5/30/2013 to 8/15/2013] .............................................................................................................. 39
Figure 5-4: Dissolved Manganese Throughout the Water Treatment Process (Pre-chlorination) [5/30/2013 to 8/15/2013] .............................................................................................................. 40
Figure 5-5: Total Iron Throughout the Water Treatment Process (Pre-chlorination) [5/30/2013 to 8/15/2013] ..................................................................................................................................... 41
Figure 5-6: Dissolved Iron Throughout the Water Treatment Process (Pre-chlorination) [5/30/2013 to 8/15/2013] .............................................................................................................. 42
Figure 5-7: Total Manganese Throughout the Water Treatment Process (No Pre-chlorination) [8/29/2013 to 10/29/2013] ............................................................................................................ 44
Figure 5-8: Dissolved Manganese Throughout the Water Treatment Process (No Pre-chlorination) [8/29/2013 to 10/29/2013] ....................................................................................... 45

xii
Figure 5-9: Total Iron Throughout the Water Treatment Process (No Pre-chlorination) [8/29/2013 to 10/29/2013 .............................................................................................................. 46
Figure 5-10: Total Manganese (With and Without Chlorine) ...................................................... 47
Figure 5-11: Dissolved Manganese (With and Without Chlorine) ............................................... 48
Figure 5-12: Total Iron (With and Without Chlorine) .................................................................. 49
Figure 5-13: Dissolved Iron (With and Without Chlorine) .......................................................... 49
Figure 5-14: Results of Jar Test Corresponding to Table 5-2 ....................................................... 51
Figure 5-15: Results of Jar Test Corresponding to Table 5-3 ....................................................... 52
Figure 5-16: Results of Jar Test Corresponding to Table 5-4 ....................................................... 53
Figure 5-17: Filtering Results ....................................................................................................... 54
Figure 5-18: Control Chart for Metals Precision .......................................................................... 55

xiii
LIST OF TABLES
Table 2-1: Manganese Oxidation States ......................................................................................... 5
Table 2-2: Reactions of Fe(II) With Alternative Oxidants and the Theoretical Reaction Stoichiometry ................................................................................................................................ 11
Table 2-3: Reactions of Mn(II) With Alternative Oxidants and the Theoretical Reaction Stoichiometry ................................................................................................................................ 11
Table 4-1: List of Methods and Equipment Used ......................................................................... 19
Table 5-1: Almagosa and Bona Springs Iron and Manganese Data ............................................. 36
Table 5-2: Jar Test Water Quality (Run 1) ................................................................................... 51
Table 5-3: Jar Test Water Quality (Run 2) ................................................................................... 52
Table 5-4: Jar Test Water Quality (Run 3) ................................................................................... 53
Table A-1: Iron and Manganese Concentrations .......................................................................... 61

xiv
LIST OF EQUATIONS
2-1 ................................................................................................................................................. 12
2-2 ................................................................................................................................................. 14
4-1 ................................................................................................................................................. 31
4-2 ................................................................................................................................................. 32
4-3 ................................................................................................................................................. 32
4-4 ................................................................................................................................................. 33
4-5 ................................................................................................................................................. 33
xv
LIST OF ABBREVIATIONS
B1283 Building 1283 B1285 Building 1285 BDL below detection limit CECE Civil, Environmental, and Construction Engineering CT contact time DBPs disinfection byproducts ESEI Environmental Systems Engineering Institute FD field duplicate FWTP Fena Water Treatment Plant HAAs halo acetic acids HDPE high-density polyethylene ICP inductively coupled plasma LCL/LWL lower control limit/lower warning limit MCL maximum contaminant level MG/MGD million gallons/million gallons per day NAVFAC Naval Facilities Engineering Command NOM natural organic matter NSDWRs National Secondary Drinking Water Regulations NTU nephelometric turbidity unit NWTP Navy Water Treatment Plant PWS public water system RPD relative percent difference RPM revolutions per minute SDWA Safe Drinking Water Act SM standard methods SMCLs secondary maximum contaminant levels THMs trihalomethanes TTHMs total trihalomethanes UCF University of Central Florida UCL/UWL upper control limit/upper warning limit USEPA/EPA United States/Environmental Protection Agency V volts WTP water treatment plant

1
1. INTRODUCTION
Project Description
The U.S. Navy’s Public Water System’s (PWS) Fena Water Treatmen Plant (FWTP), located
on the island of Guam in the Marianas Islands, draws its source water from the U.S. Navy’s
Reservoir at Fena Valley; in addition, a portion of the water supply for the Navy’s water system
is derived from the Bona and Almagosa Spring. Fena Lake, Bona Spring, and the Almagosa
Spring are located within the Naval Magazine, a secure military compound. The Navy’s Fena
Lake Reservoir serves as the primary source water for the PWS and raw water is withdrawn
from a constructed screen house complex that allows supply water to be taken at depths that
range from the surface to up to 50 feet (ft); water is typically drawn from a 12-ft depth. Raw
water from the reservoir and the springs is pumped to, and treated by, the U.S. Navy’s FWTP, a
conventional surface water treatment plant.
A schematic of the Navy’s PWS that depicts the primary water sources and identifies the key
unit operations is provided as a general process diagram in Figure 3-1. Historically, chlorine
was added at the Fena Lake Pump Station’s Building 1285 (B1285) for iron, manganese, taste,
and odor control. The WTP processes include chemical addition and rapid mixing of alum, lime
and/or polymer prior to coagulation, flocculation, and sedimentation. The coagulation and
sedimentation process occurs as a combined-unit operation; the Navy operates two clarifiers
either in parallel or series configuration, depending on season, demand, or quality (turbidity
levels entering plant).

2
After the clarification process, the water is chlorinated prior to filtration. The water then
proceeds through six dual-media, anthracite-sand filters, followed by post-filter fluoridation,
disinfection with ultraviolet (UV) and sodium hypochlorite. The finished water then continues to
a rectangular, dual- compartment, baffled clearwell for meeting contact time (CT)
requirements. Finished water collected within the 1.06-million-gallon (MG) clearwell is
distributed to the Naval Magazine (0.72 MG), Maanot (0.59 MG), Apra Heights (0.5 MG) and
Tupo (5.0 MG) Reservoirs. From these primary finished water storage reservoirs, potable
water is then distributed to secondary reservoirs and throughout the Navy’s water distribution
system.
In January of 2013 the U.S. Navy retained Brown & Calwell (Honolulu, HI) and the University
of Central Florida (UCF) Civil, Environmental, and Construction Engineering (CECE)
department to conduct research to investigate iron, manganese and DBP water quality issues
within the Navy’s Guam PWS. At the time that this research component reported herein was
conducted, the U.S. Navy used free chlorine oxidation (from chlorine ton containers) at the Fena
Lake Pump Station B1285 (B1285); it was determined that this practice contributed to the
formation of disinfection byproducts (DBPs). Since the pre-chlorination was contributing to an
increase in DBPs, a decision was made to cease pre-chlorination at Fena Lake. Consequently,
a key portion of the research reported herein was conducted to evaluate an alternative oxidant,
potassium permanganate, for use in treating Fena Lake iron and manganese in lieu of gaseous
chlorine addition at Pump Station B1285.

3
The primary objective of this research was to conduct a study on the efficiency of potassium
permanganate as an alternate oxidant for the removal of iron and manganese. To perform this
research, jar tests were performed to simulate plant operations. Water samples were collected at
strategic locations within Fena Lake and downstream facilities including the NWTP. Potassium
permanganate was added to the samples prior to addition of coagulant to conventional process.
Samples were then taken from the jars for iron and manganese analysis to determine treatment
effectiveness.

4
2. LITERATURE REVIEW
The USEPA has established National Secondary Drinking Water Regulations (NSDWRs) that
set non-mandatory water quality standards for 15 contaminants, including iron and manganese.
These secondary maximum contaminant levels are not enforceable, unless a state decides to do
so (for example Florida enforces NSDWRs), and are established for aesthetic considerations,
such as taste, color, and odor. These contaminants are not considered to present a risk to human
health at the SMCL, but iron and manganese can contribute to taste and odor problems, as well
as color, which in turn, may result in consumers’ avoidance in drinking water from their public
water systems, even though the water is safe. The SMCL for iron and manganese is 0.3 mg/L and
0.05 mg/L, respectively (USEPA 1979).
Manganese Chemistry
Since manganese is a transition metal, it may exist in various oxidation states as shown in Table
2-1. Within the drinking water community, the most relevant manganese species include the
manganous ion (Mn2+), particulate manganese dioxide (MnO2), and the permanganate ion
(MnO4--). These three species may exist in one of three physical-chemical forms, which include
particulate, colloidal, or soluble. Of the three oxidation states and physical-chemical forms,
soluble manganese, Mn2+, is the most common in groundwater supplies, as well as impounded
surface water supplies.

5
Table 2-1: Manganese Oxidation States
Oxidation State Compound Name Appearance
0 Mn Elemental Silvery solid IIa Mn2+ Manganous ion Clear in water IIIa Mn3+ Manganic ion Red/violet in water
Mn2O3(s) Manganese (III) oxide Dark brown/black solid IVa MnO2(s) Manganese dioxide Black solid V MnO4
3- Hypomanganate ion Turquoise in water VI MnO4
2- Manganate ion Green in water VIIa MnO4
- Permanganate ion Purple in water a: Manganese commonly present in the drinking water industry
If oxidizing and reducing bacteria are present, they may be responsible for the cycling of
manganese between the soluble and particulate manganese forms as shown in Figure 2-1
(Carlson and Knocke 1999). Anaerobic bacteria in the reservoir sediments minimize the
formation of manganese dioxide precipitates during respiration, and soluble Mn2+ is released into
the water column where it is utilized as an energy source by manganese-oxidizing bacteria. The
solid manganese dioxide then precipitates to the bottom, allowing the cycle to repeat. During
stratification, the anoxic conditions may disturb the biogeochemical cycle and more soluble
Mn2+ is released than can be used by the manganese oxidizers, which results in more dissolved
manganese. (Roccaro, Barone et al., 2007).
Figure 2-1: Manganese Biogeochemical Cycle (Roccaro, Barone et al., 2007)

6
Insoluble manganese dioxide occurs primarily as manganese dioxide while dissolved manganese
occurs as a soluble free metal divalent cation. If the manganese is not oxidized, the dissolved
manganese can pass easily through the water treatment processes. Once this soluble manganese
is in the distribution system, it may become oxidized to insoluble manganese (manganese oxide),
causing several problems, such as water discoloration, metallic taste, odor, turbidity, biofouling,
corrosion, and staining of laundry and plumbing fixtures (Roccaro, Barone et al., 2007).
Manganese oxide solids involving Mn (III) or both the Mn (III) and Mn (IV) oxidation states
may be present when the background water chemistry has been changed due to the addition of
other oxidants (Pontius, LeChevallier et al. 2002). Therefore, manganese oxide solids are more
accurately described as MnOx(s), where x is between 1.5 and 2 and manganese oxide solids are
referred to as MnOx(s).
The permanganate species, MnO4-, does not occur naturally in water, but is an important
manmade chemical frequently used by water utilities. The permanganate ion is a strong oxidant
capable of oxidizing many contaminants that may be present in water due to its high oxidation
state, +VII. Permanganate is commonly used for taste and odor control, as well as iron, and
manganese treatment. Due to its high oxidation state, the permanganate ion acts as an oxidant in
oxidation/reduction reactions; this results in the soluble MnO4- being reduced to particulate
MnO2(s).
The species of manganese that may be present in water are controlled by the background
oxidation/ reduction potential and pH of the water, along with the presence of other contaminants
that can combine with manganese to form other manganese compounds. The Pourbaix diagram,

7
or EH-pH diagram, shown in Figure 2-2, better depicts the manganese species that may be
present in the system over a range of background oxidation/reduction and pH conditions. The
shaded area of Figure 2-2 represents the typical conditions of the water for the research
performed by UCF. The y-axis of this diagram represents the oxidation/reduction potential of the
system. The oxidizing conditions are present at the top of the diagram, and the reducing ions in
acidic conditions are to the left and the basic are toward the right. This Pourbaix diagram
provides basic insight to how the manipulation of oxidation/reduction potential and pH may be
used to convert untreated manganese to suitable species of manganese that may be treated.
Figure 2-2: Pourbaix Diagram for Manganese (Scheffer et al., 1989)

8
The Pourbaix diagram presents the stable forms of manganese in pure water containing
manganese and carbonate. The soluble Mn2+ ion is soluble and present over a wide range of pH
and oxidation/reduction conditions. Based on the diagram, at a pH of less than five, manganese is
highly soluble. At a moderate pH, between five and eight, manganese is highly soluble under
reducing conditions, but insoluble under oxidizing conditions. At pH levels typical of a water
treatment plant (pH 6.0 to 8.0), soluble Mn2+ may or may not be stable. This depends on the
oxidation/reduction state of the water and how much carbonate is present. Under an elevated pH
(greater than eight), or strongly oxidizing conditions, Mn2+ is unstable and will precipitate to
form a visible insoluble oxide, hydroxide or carbonate solid. If the pH is further increased, the
manganese forms various insoluble oxides. One of the reasons that manganese causes problems
for water utilities is that typical water quality conditions are in the range from which manganese
can be readily cycled between soluble and insoluble forms. This explains why water that may be
colored by manganese can seem to appear and disappear from a system.
Iron Chemistry
Similar to manganese, the behavior of iron in water is primarily controlled by
oxidation/reduction potential and the pH of the water in which iron occurs. This is better shown
in the Pourbaix diagram for iron, Figure 2-3, where the shaded region represents the typical
conditions of the water for the research performed by UCF. Like manganese, the combination of
oxidation/reduction potential and pH has a strong influence on the species of iron that may be
present in the source water. The species of iron present also has an influence on its solubility. In
natural waters, iron is commonly present in two oxidation states, ferrous (Fe(II)) and ferric

9
(Fe(III)). Based on the figure shown, at a pH less than five, iron oxidation states are more
soluble, like manganese. At a pH between five and eight, iron tends to be more sensitive to
changes in water’s oxidation/reduction potential. When the pH is greater than eight, iron tends to
be insoluble like manganese (Branhuber, Clark et al. 2013).
Figure 2-3: Pourbaix Diagram for Iron (Scheffer et al., 1989)
Another relevant aspect of iron chemistry is that the transfer of only one electron is needed for
iron to transition from its soluble form, ferrous, to its insoluble form, ferric whereas manganese
requires two electrons to transfer. Therefore, on a molar basis, twice as much oxidant is needed,

10
in comparison to iron, for soluble manganese to convert to insoluble. In general, iron is far easier
to oxidize than manganese due to the fast rate of oxidation as well as the transfer of only one
electron. Therefore, the presence of soluble iron in water exerts an oxidant demand, which must
be satisfied prior to completing the oxidation of manganese.
At a moderate pH, that is typical of drinking water, iron oxidation proceeds at a quicker rate than
manganese oxidation. Iron is also easily oxidized at a moderate pH if chlorine or oxygen is
present. Unlike iron, when chlorine or oxygen is present, the oxidation of manganese is slower.
Therefore, oxygen or chlorine may be used to effectively oxidize iron when manganese is not a
concern. However, it is noted that chlorine and oxygen do not provide effective removal for
manganese. Utilities often believe that manganese is being oxidized and precipitated by the
presence of free chlorine, when, in fact, the manganese is being removed through the process of
sorption and catalyzed surface oxidation onto a media filter.
Oxidant Selection
Various oxidants are available for iron and manganese oxidation within a water treatment plant.
Chemicals that can effectively oxidize dissolved manganese include potassium permanganate,
chlorine dioxide, ozone, chlorine, and oxygen. These oxidants are shown in Table 2-2 and Table
2-3, as well as their stoichiometric equations, in correspondence to iron and manganese. Each
oxidant only works effectively when at the appropriate pH. For the pH range between
approximately 6.5 and 8.5, direct oxidation of dissolved manganese may be accomplished using
one or a combination of three strong oxidants, which includes potassium permanganate, chlorine
dioxide, or ozone. At a high pH, greater than nine, oxidation using chlorine or oxygen may be

11
performed. Based on the history of the NWTP, pre-chlorination has been implemented in the
past, so chlorine and the alternate oxidant of choice, potassium permanganate, will be discussed.
Table 2-2: Reactions of Fe(II) With Alternative Oxidants and
the Theoretical Reaction Stoichiometry
Metal/Oxidant Reaction Stoichiometry O2 (aq) 2Fe2++1/2O2(aq)+5H2O2Fe(OH)3(s)+4H+ 0.14 mg O2/mg Fe
O3(aq) O2(aq) 2Fe2++O3(aq)+5H2O2Fe(OH)3(s)+O2(aq)+4H+ 0.43 mg O3/mg Fe HOCl 2Fe2++HOCl+5H2O2Fe(OH)3(s)+Cl-+5H+ 0.64 mg HOCl/mg Fe
ClO2ClO2- Fe2++ClO2+3H2OFe(OH)3(s)+ClO2
-+3H+ 1.20 mg ClO2/mg Fe KMnO4 3Fe2++MnO4
-+2H2O3Fe(OH)3(s)+MnO2(s)+5H+ 0.94 mg KMnO4/mg Fe
Table 2-3: Reactions of Mn(II) With Alternative Oxidants and
the Theoretical Reaction Stoichiometry
Metal/Oxidant Reaction Stoichiometry O2 (aq) Mn2++1/2O2(aq)+H2OMnO2(s)+2H+ 0.29 mg O2/mg Mn
O3(aq) O2(aq) Mn2++O3(aq)+H2OMnO2(s)+O2(aq)+2H+ 0.88 mg O3/mg Mn HOCl Mn2++HOCl+H2OMnO2(s)+Cl-+3H+ 1.30 mg HOCl/mg Mn
ClO2ClO2- Mn2++2ClO2+2H2OMnO2(s)+2ClO2
-+4H+ 2.45 mg ClO2/mg Mn KMnO4 3Mn2++2MnO4
-+2H2O5MnO2(s)+4H+ 1.92 mg KMnO4/mg Mn
Some undesired water qualities might be obtained from dosing too high (above the
stoichiometric requirements) or too low (below the stoichiometric requirements). Therefore,
dosing a specific oxidant may be constrained or controlled by undesired byproducts of the
oxidant or the impacts of dosing too high or too low. The dose of chlorine dioxide may be
minimal due to the byproducts chlorate and chlorite that may form. The dose of potassium
permanganate must be strictly controlled, since overdosing may result in pink water formation.
The addition of free chlorine can form disinfection byproducts (DBPs) due to organics being
present; therefore, when selecting an oxidant, many factors must be considered.

12
Chlorine as an Oxidant
An elevated pH above 9.0, chlorine oxidizes manganous manganese to the manganic form
relatively quickly. Based on stoichiometry, the dose for chlorine to oxidize iron and manganese
is shown in Equation 2-1. When the pH is lower, the time for oxidation is longer, which may
prove unfavorable to a water treatment plant. As the pH increases past eight, the time
requirements decrease (Gregory and Carlson 2003). Studies performed proved that, even with
chlorine doses four times greater than the stoichiometric requirements, a minimum contact time
of two hours was required to reduce 1 mg/L of manganese to 0.7 mg/L at a pH of seven (Knocke,
W.R. et al. 1990).
1.30 �𝑀𝑛,𝑚𝑔𝐿� + 0.64 �𝐹𝑒,𝑚𝑔
𝐿� = 𝐶ℎ𝑙𝑜𝑟𝑖𝑛𝑒 𝐷𝑜𝑠𝑒,𝑚𝑔/𝐿 (2-1)
For free chlorine, pH has a significant and important impact on the rate of manganese oxidation.
In a water treatment plant, the typical pH is between six and eight, which results in the rate of
oxidation rate being relatively slow for chlorine. However, if the pH is increased to a pH of 9.0
or above, the oxidation rate relatively quick. A typical situation of using chlorine as an oxidant is
when a water treatment plant applies lime and chlorine after sedimentation, but prior to media
filtration, resulting in a higher pH, typically between 9.5 and 10. Based on studies, within one
hour, Mn2+ was effectively oxidized below the SMCL of 0.05 mg/L. It has also been determined
that, along with pH, temperature is also a factor in Mn2+ oxidation (Knocke, W.R. et al. 1990).
Not only is the high pH required for oxidation of iron and manganese an obstacle in the water
treatment industry, the use of pre-chlorination at a water treatment plant may form undesired

13
DBPs. When chlorine reacts with natural organic matter (NOM), DBPs form. Under the Safe
Drinking Water Act (SDWA), DBPs are regulated and may not exceed Maximum Contaminant
Levels (MCLs) of 80 μg/L for total trihalomethanes (TTHMs) and 60 μg/L for haloacetic acids
(HAAs). Since utilizing pre-chlorination may increase the overall formation of regulated DBPs,
an alternate and more effective oxidant may be recommended for use.
Potassium Permanganate as an Oxidant
Potassium permanganate can be used to control taste and odor, remove color, control biological
growth, and remove iron and manganese in water treatment plants. Another benefit of using
potassium permanganate is that it may be useful in minimizing the formation of trihalomethanes
(THMs) and other DBPs by oxidizing precursors and reducing the demand for other disinfectants
(Bryant, Fulton et al. 1992). Moving the point of chorine application farther downstream of the
treatment process and utilizing potassium permanganate upstream to control taste and odor,
color, and algae may achieve a reduction in DBPs. Although potassium permanganate has many
potential uses as an oxidant, it is not an effective disinfectant (USEPA 1999).
A primary use of potassium permanganate is iron and manganese removal. When potassium
permanganate is added to water containing iron and manganese, the iron will oxidize soluble
ferrous iron (Fe2+) to particulate ferric iron (Fe(OH)3). It will also oxidize soluble manganese to
particulate manganese dioxide. In conventional treatment plants, potassium permanganate is
added to the raw water intake, usually at the rapid mix in conjunction with coagulants, or at
clarifiers upstream of the filter. This is due to the fact that the manganese dioxide that is formed
from oxidation is small enough to pass through the filters. Therefore, it is recommended to add

14
the potassium permanganate upstream of the coagulant due to the coagulants’ ability to
destabilize the particles and allow for the filtration of the manganese dioxide at the filters
(USEPA 1991).
The reactions for the oxidation of iron and manganese are shown in Equation 2-2. Based on the
stoichiometry, the potassium permanganate dose required for oxidation is 0.94 mg/mg iron and
1.92 mg/mg of manganese (HDR 2001). When the potassium permanganate is added to control
iron and manganese, the oxidation time ranges from five to 10 minutes, provided the pH is more
than seven (Kawamura 2000). As previously stated, if excess potassium permanganate is added,
the water will turn pink in color.
1.92 �𝑀𝑛,𝑚𝑔𝐿� + 0.94 �𝐹𝑒,𝑚𝑔
𝐿� = 𝑃𝑜𝑡𝑎𝑠𝑠𝑖𝑢𝑚 𝑃𝑒𝑟𝑚𝑎𝑛𝑔𝑎𝑛𝑎𝑡𝑒 𝐷𝑜𝑠𝑒,𝑚𝑔/𝐿 (2-2)
Potassium permanganate can also be used for removing taste and odor compounds. Potassium
permanganate may be used to treat earthy, musty smelling compounds in drinking water
(Lalezary, Pirbazari et al. 1986). The dose of potassium permanganate used to treat taste and
odor compounds may range from 0.25 to 20 mg/L.
Pretreatment with potassium permanganate in combination with post-treatment chlorination will
typically result in lower DBP concentrations than would otherwise occur from traditional pre-
chlorination for iron and manganese oxidation (Ficek and Boll 1980). Under this approach, not
only are iron and manganese oxidized, but the concentration of NOM, responsible for DBP
formation, may also be reduced.

15
3. EXISTING CONDITIONS
Description of Raw Water Sources
The union of two volcanoes formed Guam; therefore, the island has two different geological
compositions. The southern features are mainly volcanic with an elongated mountain ridge
dividing the coastline and the inland, which creates the Fena Valley watershed. The Fena Valley
watershed of the Naval Magazine provides water to most naval facilities, as well as some civilian
communities. Additionally, the northern distribution system has groundwater wells, which
supplement the primary raw water sources.
This section provides an overview of the source water that feeds the NWTP. The raw water
sources include Fena Lake and the springs (Bona and Almagosa). Fena Lake is located in an
inactive volcano crater and has an active storage capacity of 2,100 million gallons (MG) for the
zone between the pump intake and the dam spillway. Fena Lake supplies approximately 63
percent (eight million gallons per day (MGD)) to the Navy’s water system (Kennedy Engineers,
1980).
The Almagosa Spring supply is from the Upper Dobo, Lower Dobo, and Chepek springs.
Approximately 22 percent (2.9 MGD) is supplied from Almagosa Spring to the water system.
Bona Spring emits from two springs within limestone cavities, which supplies approximately 15
percent (1.9 MGD) to the water system. Since spring water is highly dependent upon rainfall, the
yield from both springs may vary from 0.5 MGD during the dry season to three MGD during the

16
wet season. A series of low hills of limestone formation acts as natural water storage, which
allows for the continual feeding to the springs at a low rate.
Description of the NWTP Process Unit Operations
The NWTP is a conventional surface water treatment plant designed to produce 13.5 MGD of
potable water to consumers within the service area. Current production varies during wet and dry
seasons. According to the U.S. Navy, the flow rate may vary between 10.5 MGD during the wet
season and 12.5 MGD during the dry season (Ríos 2003). The NWTP treats the combination of
Fena Lake water, as well as Almagosa and Bona Springs. Prior to the start of this study, the lake
water, prior to being combined with the springs, underwent pre-chlorination. Once combined
with the spring water, it would enter the WTP and be treated with alum, lime and polymer
addition, coagulation, flocculation, sedimentation, filtration, disinfection, fluoridation, and
storage prior to entry of the distribution system. Under normal circumstances, the raw water is
routed to the original conventional rapid mix, flocculation, and sedimentation unit processes.
When turbidity levels are high, the raw water may be routed to the ballasted flocculation system
to manage these high levels of turbidity. A diagram of the overall process is shown in Figure 3-1.
At the time this research project was initiated, the raw water was pre-chlorinated once more after
pre-chlorination at the lake at the influent control structure. This pre-chlorinated water then flows
into the rapid mix chamber where the alum, lime, and polymer are added. The water from the
baffled chamber then flows into a rapid mixer flocculation cell in the center of a 125-foot
diameter sedimentation tank where coagulation and flocculation occur.

17
Figure 3-1: NWTP Process Flow Diagram

18
The coagulated/flocculated water flows under the flocculation cell skirt into the sedimentation
tank. A weir around the tank periphery allows the settled water to pass onto the filters while the
agglomerated solids settle to form a sludge blanket. The settled sludge, consisting of organic and
inorganic solids, is raked by a rotating arm into a center hopper and then pumped to a backwash-
settling tank for residual solids handling.
The settled water from the sedimentation tank is chlorinated again to prevent the algal growth on
the filters. The chlorinated water then flows to six dual-media (sand and anthracite) filters to
remove suspended particles. When a sand filter becomes loaded with solids, an automatic
backwash system is initiated where water is used to expand and clean the bed. The solid-laden
backwash water from the backwashing process is conveyed to a backwash-settling tank, where
the heavy solids are separated by dewatering on sand drying beds. The clear supernatant is re-
circulated to the influent control structure for blending and reprocessing with the raw water.

19
4. MATERIALS AND METHODS
This chapter presents the experimental plan, methods, materials, and procedures used to conduct
this study. Table 4-1 provides a list of test methods and equipment used during this research.
Analyses were conducted both in the field and in the laboratory, and included the parameters of
pH, temperature, conductivity, turbidity, iron and manganese.
Table 4-1: List of Methods and Equipment Used
Test Test Location Standard Method (SM) Equipment
Description
Method Detection
Level
pH Lab/Field SM: 4500-H+ B Electrometric Method
HQ40d Portable pH, Conductivity, and
Temperature Meter
0.01 pH Units
Temperature Lab/Field SM: 2550 B Laboratory Method
HQ40d Portable pH, Conductivity, and
Temperature Meter 0.01 °C
Conductivity Lab/Field SM:2510 B Laboratory HQ40d Portable pH,
Conductivity, and Temperature Meter
0.01 μS/cm
Turbidity Lab/Field SM: 2130 B Nephelometric Method
Hach 2100q Portable Turbidimeter 0.01 NTU
Iron Lab
SM: 3120 B Inductively Coupled Plasma (ICP)
Method/Inductively Coupled Plasma Spectrometer
Perkin Elmer Optima 2100 DV ICP-OES 0.001 mg/L
Manganese Lab
SM: 3120 B Inductively Coupled Plasma (ICP)
Method/Inductively Coupled Plasma Spectrometer
Perkin Elmer Optima 2100 DV ICP-OES 0.001 mg/L

20
Experimental Plan
The primary goal of this research was to determine if an alternate oxidant, potassium
permanganate, could be utilized in lieu of the use of chlorine for the removal of iron and
manganese at the Navy Reservoir, Fena Lake. Jar testing equipment was utilized in the
experiments to evaluate oxidant effectiveness and to simulate the water treatment processes
employed at the NWTP. An initial total and dissolved concentration for iron and manganese was
measured using a Perkin Elmer Optima 2100 DV ICP-OES. A potassium permanganate stock
solution was used to generate, and various doses that were added to the jars. The samples were
then coagulated with aluminum sulfate and filtered. Water samples were collected from the jars
and then analyzed for iron and manganese concentrations via Inductively Coupled Plasma (ICP).
The jar testing equipment was designed to simulate the coagulation, flocculation, and
sedimentation processes that take place currently at the NWTP. The water was first dosed with
potassium permanganate followed by the conventional water treatment process. Water was
collected from the Navy Reservoir in plastic one-liter amber bottles. The depths varied for each
jar test performed. The most common depths drawn were 40-ft and 50-ft. These depths were
chosen because they had higher iron and manganese concentrations. When these depths did not
have an adequate amount of iron and manganese suitable for jar testing (due to seasonal
changes), iron and manganese was added to the shipped samples prior to dosing with potassium
permanganate.
Also, the content of water samples collected at various locations within the NWTP were
determined. Samples that were collected at the various sampling points were shipped to UCF for

21
iron and manganese analysis. This better determined if the pre-chlorination at the Navy
Reservoir was serving its purpose of oxidizing iron and manganese present in the source water.
Testing Locations
Samples were shipped monthly by the Navy to UCF for water quality analysis. In this manner,
seasonal data could be collected and evaluated with regards to the Navy’s Fena Lake Reservoir,
Bona Spring, and Almagosa Spring. Samples were collected from various lake depths, as well as
the following locations:
o Building 1283 (B1283) (before raw water chlorination)
o Building 1285 (B1285) (after raw water chlorination)
o Navy Water Treatment Plant (NWTP) (Fena Pipe Influent to the NWTP)
o Combined springs (Almagosa and Bona)
o Combined raw (Fena Lake, Almagosa and Bona Springs)
o Filtered water (post-filter)
o Clearwell
Procedures
Iron and Manganese Analysis
Sample collection and water quality analyses were performed in accordance with Standard
Methods for the Examination of Water and Wastewater (Eaton 2005). The method followed for
iron and manganese analysis was Standard Method 3120B, ICP Method for iron and
manganese in aqueous solution. The samples were collected in 125-mL high-density
22
polyethylene (HDPE) bottles for both total and dissolved analysis. The samples collected for
total metals analyses were preserved with nitric acid (HNO3) to a pH of less than two.
Typically, this required 0.2-mL to 0.4-mL of concentrated nitric acid being added to the
sample. The dissolved samples were first filtered through a membrane filter and then acidified.
The samples were packed into a cooler with ice packs to maintain a cool temperature and then
shipped to UCF. Upon arrival at the UCF Laboratory, the samples were stored in a refrigerator
at 4°C until they were prepared for metals analysis. From each sample, 10-mL were taken and
placed into a 15-mL vial. The inductively coupled plasma (ICP) machine measured the
interference of each sample by using an argon flame. From this value and the standard curve
created, the concentration was calculated.
Potassium Permanganate Stock Solution
Since the potassium permanganate used was in a crystal form, a solution had to be prepared for
dosing. The potassium permanganate stock solution was prepared by first making a stock
solution that may then be diluted to provide a more accurate dose for the case of when iron
and manganese concentrations were less than 1 mg/L. The stock solution was prepared by
weighing out one gram of potassium permanganate crystals on a weighing dish. Next, the solid
potassium permanganate was transferred to a 100-mL volumetric flask. The weighing dish was
rinsed with distilled water into the volumetric flask and the potassium permanganate in the
volumetric flask was diluted with distilled water to 100-mL. The volumetric flask was then
covered with parafilm and mixed thoroughly. Since the stock solution of potassium

23
permanganate is dark purple, it can be difficult to see whether or not the crystals are
completely dissolved. Therefore, the volumetric flask was shaken vigorously prior to use.
Once the stock solution was prepared, the test stock solution was prepared. To prepare the test
stock solution, one-mL was measured from the stock solution using an Eppendorf Pipette from
the stock solution that was prepared and placed into a 100-mL volumetric flask. A one-mL
aliquot was then diluted to 100-mL with distilled water. The volumetric flask was then covered
with parafilm and shaken vigorously. The final solution is shown in Figure 4-1. From this
solution, 10-mL was equal to one mg/L potassium permanganate.
Figure 4-1: Potassium Permanganate Test Stock Solution

24
Potassium Permanganate Jar Testing
It was previously noted that the U.S. Navy historically applied chlorine gas to Fena Lake raw
water for iron and manganese control. Chlorine reacts slowly with manganese unless the pH is
greater than nine. The pH is seven when treated with chlorine. Based on the study stated prior by
Knocke et al, unless the pH is greater than nine the oxidation rate of iron and manganese is
relatively slow and may take hours. Given the slow manganese oxidation reaction kinetics that
may take hours at pH seven and the other competing chlorine demands, the actual required dose
of chlorine to promote significant Mn2+ oxidation may be many times higher than the theoretical
stoichiometry depending on pH. In turn may result in elevated disinfection byproduct
concentrations within the distribution system (Knocke et al. 1990).
It was reported by plant operators that they believed that the decision was made to add
chlorine at Fena Lake due to elevated iron and manganese concentrations. A review of data
collected indicated that the iron and manganese quality varied in lake depth; however, samples
taken from the depth that the water was drawn and pumped to the Fena WTP (typically around
12-ft depth) was relatively low (typically dissolved iron and manganese concentrations were
found to be below the SMCLs at the shallow depths) and did not require pretreatment. The
elevated iron and manganese levels that were experienced in the distribution system may have
been due to pipe deposits breaking off within the distribution system and NWTP. It was also
determined that iron that may have been present was removed by aluminum sulfate during the
coagulation process. Preliminary findings of a parallel study revealed that the majority of the
distribution system DBP concentrations were formed by pre-chlorination of Fena Lake Reservoir

25
raw water prior to conventional treatment at the Fena WTP. Disinfection byproduct formation
potential studies performed by UCF and DZSP21 confirmed that TTHMs were above the
regulated MCL of 80 μg/L after a 24-hour holding time (US Navy Laboratory DZSP21, May
2013). Therefore, it was recommended that chlorine addition at the Navy Reservoir pump
station be discontinued. Those DBP study component efforts will be reported under separate
cover.
During times where the Navy WTP may experience iron and manganese concentrations greater
than the SMCLs, was utilized as an oxidant at the Navy Reservoir pump station. In this study
an alternate oxidant, potassium permanganate, was utilized as a replacement to the use of
chlorine. Potassium permanganate has been used for decades as a chemical for oxidation of
dissolved iron and manganese and taste and odor control in water treatment operations (HDR
2001). The oxidation kinetics of potassium permanganate with iron and manganese is fairly fast
(within 5 to 10 minutes) at a pH of six or greater in comparison to chlorine, which takes hours
when the pH is below nine (Brandhuber 2013).
Water was collected in bulk from Fena Lake using a crane and a container that locked in the
water at the desired depth. The bulk water was then transferred to a plastic amber bottle and then
prepared for shipping. Figure 4-2 shows the crane and the container used for collection. Water
that was shipped was placed in a cooler with ice packs to maintain a cooler temperature. Upon
arrival to UCF, the bottles were transferred to a refrigerator kept at 4°C.
The Phipps & Bird jar tester used for treatment simulations consisted of six two-liter square jars.
The paddles may be altered to perform at various revolutions per minute (rpm). The volume of

26
water in each jar was fixed at one-liter each. The bulk water that was acquired from the Navy
Reservoir, after being mixed thoroughly, was allowed to warm to room temperature, measured
in a graduated cylinder at 1000-mL, and then transferred to the jar. The initial conductivity, pH,
temperature, and turbidity were recorded from each of the jars.
Figure 4-2: Sample Collection at the Navy Reservoir Pump Station
Next, the jars were dosed at various amounts. When potassium permanganate is added to the
water, the sample will turn varying shades of brown, indicating the presence of oxidized iron
and manganese. The samples that retained a brown or yellow color indicated that the oxidation
process is incomplete and required the addition of additional potassium permanganate. When

27
the water had reached its endpoint, the water exhibited a pink color. This pink color remained
for at least 10 minutes. Over time, the pink color dissipates.
As shown in Figure 4-3, potassium permanganate was not added to the first jar (far left). The
remaining five jars contained various doses of potassium permanganate with the recommended
dose being jar four (third from right). The recommended dose was determined based on Equation
2-2. The last two jars were dosed higher than the recommended dose. These two jars resulted in
pink water, which was undesirable. The jars were mixed, covered, and stirred at 120 rpm for two
hours to simulate pipe flow. According to the plant operators, the water takes two hours to reach
the NWTP Fena Pipe Influent from Building 1285.
Figure 4-3: Potassium Permanganate Jar Test

28
As stated previously, when a strong oxidant is added, the particulate byproduct manganese oxide
(MnOx(s)) is formed. The manganese oxide that is formed is small enough to pass through 0.45-
micron filters. Studies have shown that, when possible, the potassium permanganate should be
added upstream prior to the coagulation and flocculation process (Branhuber, Clark et al. 2013).
Manganese oxide is colloidal in nature and has a particle size below one-micron. Adding the
coagulant after the oxidant is added destabilizes the particles and the particles appropriately
aggregate for subsequent solid-liquid separation (Branhuber, Clark et al. 2013). Therefore, once
the jars were mixed for two hours, aluminum sulfate was then added to each of the jars. The
aluminum sulfate they use at the NWTP was shipped to the UCF Laboratory from the laboratory
group in Guam, DZSP 21.
During the coagulation-flocculation phase, paddle speeds were chosen based on typical jar tests
performed with a coagulant. The different coagulation-flocculation phases consisted of a rapid
mix at a speed of 150 rpm for three minutes and a slow agitation phase at the speed of 25 rpm
for 15 minutes (Zogo, Bawa et al. 2011). The water was then allowed to settle for one hour for
sedimentation. The addition of the aluminum sulfate took place during the rapid mix. The dose
was determined to be 35-40 mg/L based on daily plant operations data acquired from the
NWTP. This was based on a day of operation when the water was the most turbid when entering
the coagulation-flocculation chamber. Once settled, the final conductivity, pH, temperature, and
turbidity were taken from each of the jars. Samples were also taken for metals analysis.
Once the jars were coagulated and settled, samples were then collected for analysis in 250-mL
Erlenmeyer flasks. A vacuum filter apparatus was used to filter the collected samples through a

29
0.1-micron filter. In between each filtered sample, the vacuum apparatus was cleaned and a new
filter was used for each new sample. The samples were then acidified with nitric acid to a pH
less than two pH units. Once acidified, the samples were left in a refrigerator for 24 hours or
longer at 4°C.
Laboratory Filter Method
Based on Standard Methods for the Examination of Water and Wastewater (Eaton 2005),
3120B, Inductively Coupled Plasma (ICP) Method, it is recommended to filter through 0.45-
micron filters for dissolved manganese analysis. It has been shown in some literature that
chemically oxidized manganese has the potential to pass through 0.45-micron filters
(Branhuber, Clark et al. 2013). A study was performed to determine if naturally oxidized
manganese has the potential to pass through the 0.45-micron filter. A comparison was
performed between a 0.45-micron filter, 0.1-micron filter, and coagulant addition followed by a
0.45-micron filter. A sample was taken from each jar prior to coagulation. Part of this sample
was filtered through a 0.45-micron filter and acidified while the rest of the sample was filtered
through a 0.1-micron filter and acidified. These samples were then analyzed for iron and
manganese. The remaining water in each jar was dosed with 35 mg/L of aluminum sulfate to
simulate the coagulation, flocculation, and sedimentation process. Once settled for one hour, a
sample was taken from each jar, filtered through a 0.45-micron filter, and acidified for iron and
manganese analysis.

30
Cleaning Procedures
Laboratory quality control measures were taken to monitor and assess the data collected during
this research. One aspect of quality control is glassware cleaning, hence, used glassware or
plastic bottles were cleaned per a standard procedure. Glassware and plastic bottles were
scrubbed with soap and then rinsed with tap water until soapy residues were gone. Once cleaned
with soap, the bottles were rinsed with 1:1 hydrochloric acid and rinsed three times with distilled
water. The bottles were then allowed to air dry. This was accomplished for the plastic one-liter
amber bottles used for bulk water sampling and the 125-mL plastic bottles used for metals
analysis that were shipped from Guam to UCF. Once cleaned, the bottles were shipped back to
Guam for further sampling. When sampling was performed, the clean bottles were rinsed with
the sample prior to filling with the sample.
Field and Laboratory Quality Control
Field and laboratory quality control measures were applied throughout the research that was
conducted. Duplicate samples were collected in the field once every 10 samples, which was at
the clearwell. During metals analysis, a duplicate and a spike were created for every 10 samples
evaluated. A similar procedure was also implemented when collecting samples from the jars
during potassium permanganate testing. Additionally, quality control requirements for data
analysis were followed according to the analytical methods listed in the Laboratory Quality
Assurance Procedures for the UCF Environmental Systems Engineering Institute (ESEI) housed
within the Civil, Environmental, and Construction Department (Real-Robert, 2011). Quality

31
control measures for laboratory data collection were performed according to the Standard
Methods for the Examination of Water and Wastewater (Eaton 2005).
Accuracy
Percent recovery for each spiked sample processed through the ICP Spectrophotometer was
determined using Equation 4-1. The percent recovery of each spike was plotted on an accuracy
chart to assess the consistency and performance of the ICP Spectrophotometer.
% 𝑅𝑒𝑐𝑜𝑣𝑒𝑟𝑦 = 𝐶𝑠𝑎𝑚𝑝𝑙𝑒+𝑠𝑝𝑖𝑘𝑒−𝐶𝑠𝑎𝑚𝑝𝑙𝑒
𝐶𝑠𝑝𝑖𝑘𝑒∗ 100 (4-1)
Where,
𝐶𝑠𝑎𝑚𝑝𝑙𝑒+𝑠𝑝𝑖𝑘𝑒 = 𝑡ℎ𝑒 𝑐𝑜𝑛𝑐𝑒𝑛𝑡𝑟𝑎𝑡𝑖𝑜𝑛 𝑜𝑓 𝑡ℎ𝑒 𝑠𝑝𝑖𝑘𝑒𝑑 𝑠𝑎𝑚𝑝𝑙𝑒 �𝑚𝑔𝐿�
𝐶𝑠𝑎𝑚𝑝𝑙𝑒 = 𝑡ℎ𝑒 𝑐𝑜𝑛𝑐𝑒𝑛𝑡𝑟𝑎𝑡𝑖𝑜𝑛 𝑜𝑓 𝑡ℎ𝑒 𝑠𝑎𝑚𝑝𝑙𝑒 �𝑚𝑔𝐿�
𝐶𝑠𝑝𝑖𝑘𝑒 = 𝑡ℎ𝑒 𝑐𝑜𝑛𝑐𝑒𝑛𝑡𝑟𝑎𝑡𝑖𝑜𝑛 𝑜𝑓 𝑡ℎ𝑒 𝑠𝑝𝑖𝑘𝑒 �𝑚𝑔𝐿�
The upper and lower control limits (UCL and LCL) are 120 percent and 80 percent, respectively.
Whenever a percent recovery was outside of these limits, the sample set was rejected, re-
prepared and analyzed again.
The relative percent difference (RPD) was calculated using Equation 4-2. The RPD was used in
replicate and duplicate analysis and was considered acceptable if the RPD was within the range

32
of 90 percent to 110 percent. If outliers were present, the sample results were rejected and the
samples were prepared and analyzed again.
𝑅𝑃𝐷 (%) = 𝑆−𝐷(𝑆+𝐷)/2
∗ 100 (4-2)
Where,
𝑆 = 𝑠𝑎𝑚𝑝𝑙𝑒 𝑟𝑒𝑠𝑢𝑙𝑡 �𝑚𝑔𝐿�
𝐷 = 𝐷𝑢𝑝𝑖𝑐𝑎𝑡𝑒 𝑠𝑎𝑚𝑝𝑙𝑒 𝑟𝑒𝑠𝑢𝑙𝑡 �𝑚𝑔𝐿�
Precision
The industrial statistic, or I-statistic, was calculated using Equation 4-3 in order to create control
charts relative to evaluate the precision of metals analysis. Control charts are a graphical,
statistical method to monitor process variation due to either assignable causes or random
variation. The industrial statistic was calculated using Equation 4-3 in order to create control
charts for the precision of metals analysis. Control charts are a graphical, statistical method to
screen process variation due to assignable causes or random variation (Devore 2000).
𝐼 = |𝑆−𝐷|(𝑆+𝐷)
(4-3)
Where,
𝑆 = 𝑠𝑎𝑚𝑝𝑙𝑒 𝑟𝑒𝑠𝑢𝑙𝑡 �𝑚𝑔𝐿�

33
𝐷 = 𝐷𝑢𝑝𝑖𝑐𝑎𝑡𝑒 𝑠𝑎𝑚𝑝𝑙𝑒 𝑟𝑒𝑠𝑢𝑙𝑡 �𝑚𝑔𝐿�
The upper control limit (UCL) was defined as shown in Equation 4-4. The upper warning limit
(UWL) for the precision chart was determined based on Equation 4-5.
𝑈𝐶𝐿 = 3.267 ∗ 𝑅𝑎𝑛𝑔𝑒𝑎𝑣𝑔 (4-4)
𝑈𝑊𝐿 = 2.512 ∗ 𝑅𝑎𝑛𝑔𝑒𝑎𝑣𝑔 (4-5)
34
5. RESULTS AND DISCUSSION
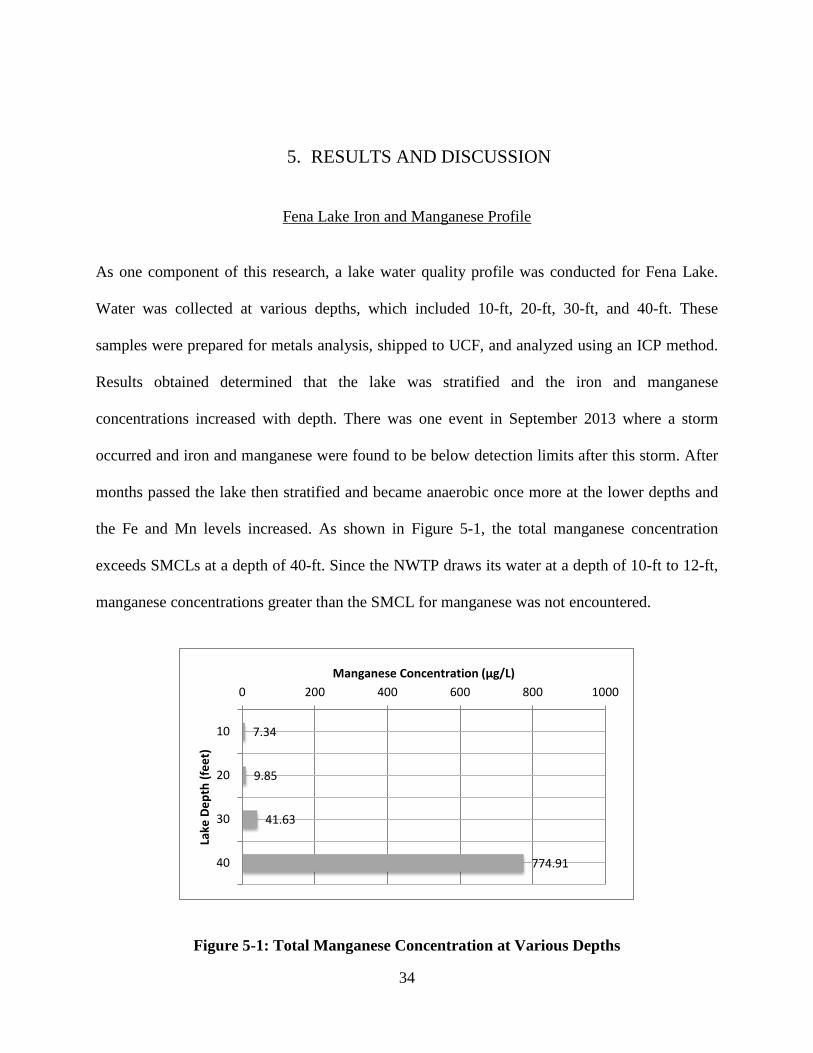
Fena Lake Iron and Manganese Profile
As one component of this research, a lake water quality profile was conducted for Fena Lake.
Water was collected at various depths, which included 10-ft, 20-ft, 30-ft, and 40-ft. These
samples were prepared for metals analysis, shipped to UCF, and analyzed using an ICP method.
Results obtained determined that the lake was stratified and the iron and manganese
concentrations increased with depth. There was one event in September 2013 where a storm
occurred and iron and manganese were found to be below detection limits after this storm. After
months passed the lake then stratified and became anaerobic once more at the lower depths and
the Fe and Mn levels increased. As shown in Figure 5-1, the total manganese concentration
exceeds SMCLs at a depth of 40-ft. Since the NWTP draws its water at a depth of 10-ft to 12-ft,
manganese concentrations greater than the SMCL for manganese was not encountered.
Figure 5-1: Total Manganese Concentration at Various Depths
7.34
9.85
41.63
774.91
0 200 400 600 800 1000
10
20
30
40
Manganese Concentration (μg/L)
Lake
Dep
th (f
eet)

35
Figure 5-2 presents the total iron concentration at various lake depths. It can be observed that
once a depth of 40-ft is encountered, the SMCL for iron is exceeded. As stated prior, since the
NWTP draws its raw water from a higher depth, this high concentration of iron observed at 40-ft
is not of concern.
Figure 5-2: Total Iron Concentration at Various Depths
Almagosa and Bona Springs Iron and Manganese Content
During a site visit to the NWTP in Santa Rita, Guam, water was collected from Almagosa Spring
and Bona Spring within the Naval Magazine. Water was for iron and manganese analysis to
determine if the springs were contributing to iron and manganese concentrations. These samples
were prepared for metals analysis and analyzed using an ICP method. Based on monthly samples
provided by the NWTP of the combined springs and the data collected from the site visit, it was
determined that the springs do not contribute to iron and manganese concentrations and in fact
8.82
23.91
30.75
577.98
0 100 200 300 400 500 600 700
10
20
30
40
Iron Concentration (μg/L)
Lake
Dep
th (f
eet)

36
help to decrease the concentrations once combined with Fena Lake water. Table 5-1 shows the
iron and manganese concentrations determined during the site visit in May 2013.
Table 5-1: Almagosa and Bona Springs Iron and Manganese Data
Location Total
Manganese (μg/L)
Dissolved Manganese
(μg/L)
Total Iron (μg/L)
Dissolved Iron (μg/L)
Bona Springs 0.92 0.42 1.10 ND Almagosa Springs 0.85 0.45 1.42 ND
For this particular sampling event, dissolved iron was below detection limits and therefore the
iron present was oxidized. This oxidized iron would later be removed via conventional treatment
processes in the plant. As for manganese there was some total and dissolved manganese present
but much less than is experienced at Fena Lake, therefore this low concentration manganese
water may aid in diluting manganese concentrations when combined with Fena Lake water upon
entering the NWTP.
Effectiveness of Fena Lake Chlorine Pretreatment for Fe and Mn Control Prior to NWTP
Processes
Water samples collected throughout the plant were shipped from Guam to the UCF laboratory.
The samples provided were prepared for both total and dissolved iron and manganese
concentration determinations. The samples were shipped in a cooler with ice packs to maintain
a cooler temperature. Once the samples arrived to UCF, they were taken from the cooler and
placed in a refrigerator that was maintained at 4°C.

37
Inductively coupled plasma was used to determine the iron and manganese concentrations
following Standard Methods for the Examination of Water and Wastewater 3120B,
Inductively Coupled Plasma (ICP) Method. This procedure states that analysis for dissolved
metals must be filtered through a 0.45-micron filter. However, it has been noted through
literature that MnOx is well below one micron and, therefore, the smallest available filter
was used: 0.1-micron. These samples were analyzed both prior to and after the cessation of
full-scale plant pre-chlorination. Overall, the iron and manganese concentrations remained
relatively low before and after the use of pre-chlorination.
Box and whisker plots were developed to better quantify and visualize the collected data. The
bottom half (solid) of the box represents the fiftieth percentile where the top half (hatched) is
the seventy-fifth percentile. Error bars were also constructed for maximum and minimum
values based on data values and quartile values. The data analyzed is shown in Appendix A of
this report. This was performed for total and dissolved iron and manganese concentrations
during full-scale plant pre-chlorination. It appears that iron is removed at the point where the
aluminum sulfate is added at the rapid mix. It can also be noted that there is an increase in both
iron and manganese when the water reaches Building 1285 of the treatment process. At this
location where chlorine gas has been added that results in a decrease in pH and an increase in
both metals. This may be due to the aged pipelines containing accumulated iron and manganese
within the system. The total manganese concentration leaving the plant was approximately 1.2
μg/L when lake pre-chlorination was practiced. During chlorine shutoff, discussed in the next
section, the total manganese concentration was 3.1 μg/L. Note in either case the concentrations
are well below the secondary maximum contaminant level of 50 μg/L for manganese.
38
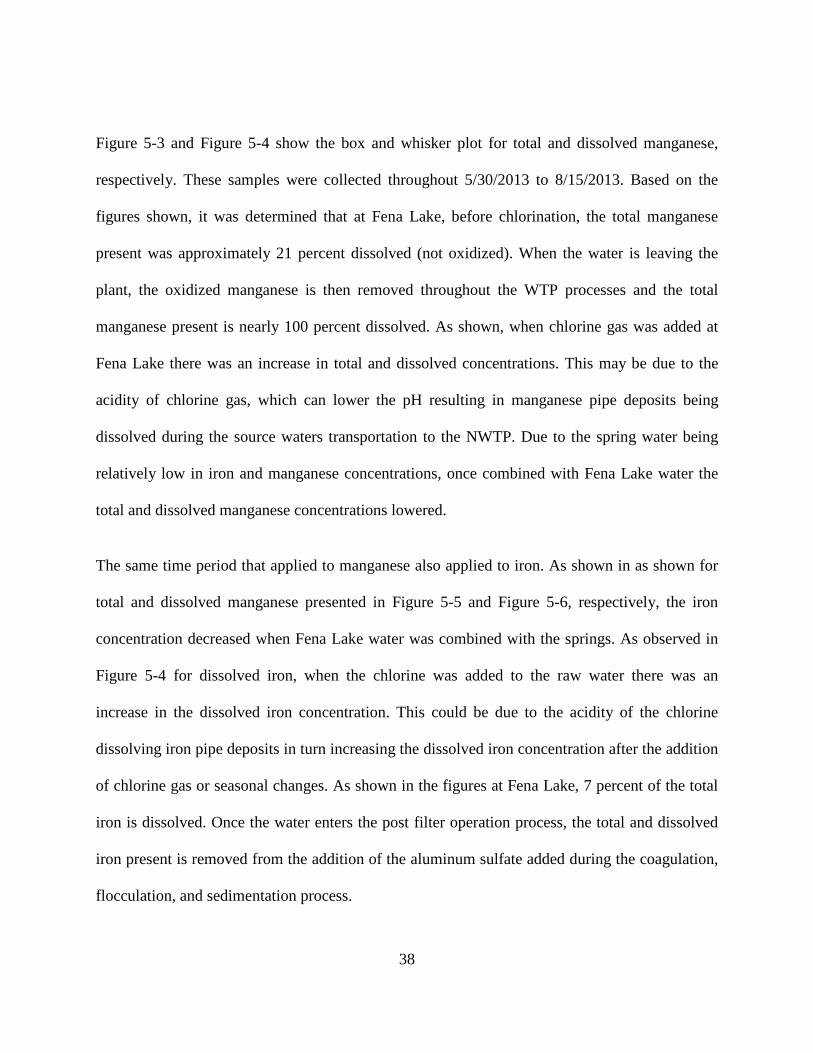
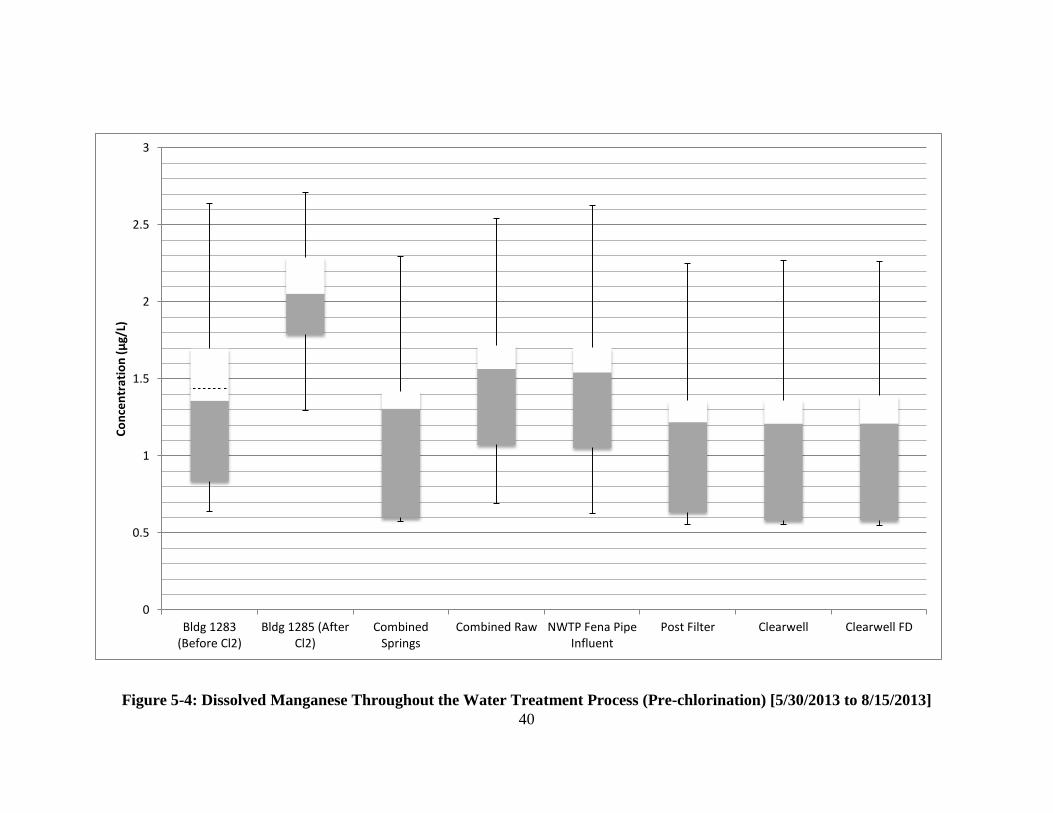
Figure 5-3 and Figure 5-4 show the box and whisker plot for total and dissolved manganese,
respectively. These samples were collected throughout 5/30/2013 to 8/15/2013. Based on the
figures shown, it was determined that at Fena Lake, before chlorination, the total manganese
present was approximately 21 percent dissolved (not oxidized). When the water is leaving the
plant, the oxidized manganese is then removed throughout the WTP processes and the total
manganese present is nearly 100 percent dissolved. As shown, when chlorine gas was added at
Fena Lake there was an increase in total and dissolved concentrations. This may be due to the
acidity of chlorine gas, which can lower the pH resulting in manganese pipe deposits being
dissolved during the source waters transportation to the NWTP. Due to the spring water being
relatively low in iron and manganese concentrations, once combined with Fena Lake water the
total and dissolved manganese concentrations lowered.
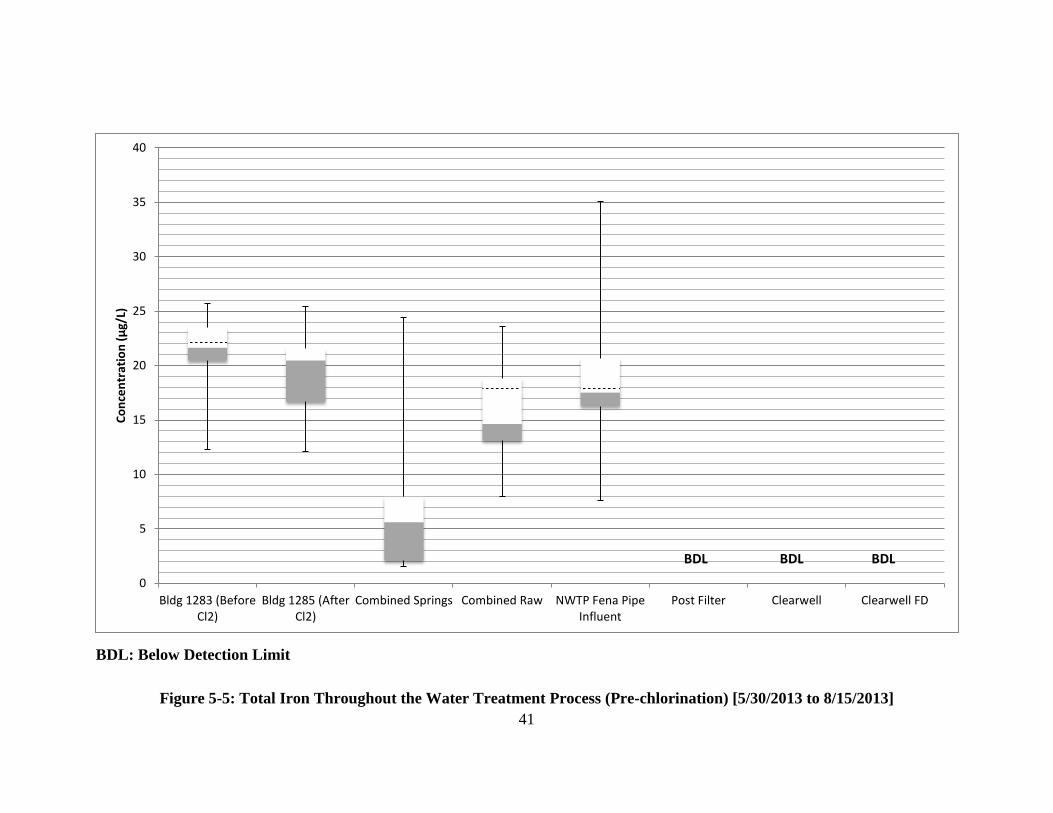
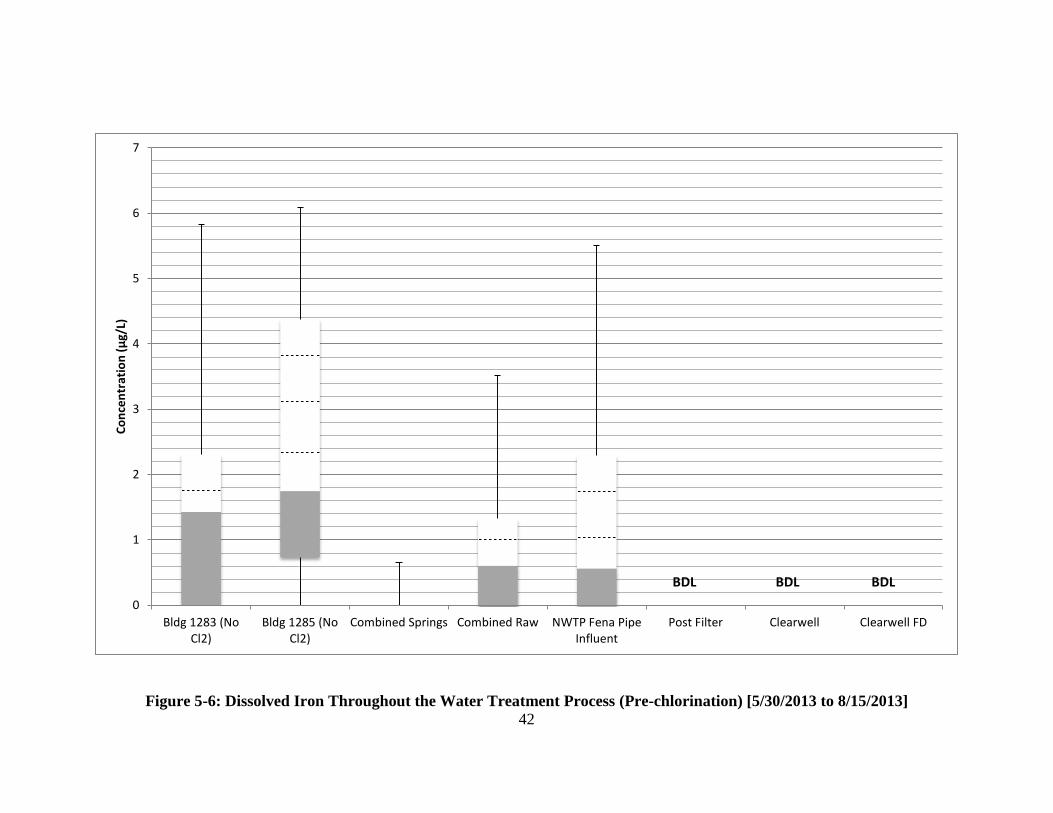
The same time period that applied to manganese also applied to iron. As shown in as shown for
total and dissolved manganese presented in Figure 5-5 and Figure 5-6, respectively, the iron
concentration decreased when Fena Lake water was combined with the springs. As observed in
Figure 5-4 for dissolved iron, when the chlorine was added to the raw water there was an
increase in the dissolved iron concentration. This could be due to the acidity of the chlorine
dissolving iron pipe deposits in turn increasing the dissolved iron concentration after the addition
of chlorine gas or seasonal changes. As shown in the figures at Fena Lake, 7 percent of the total
iron is dissolved. Once the water enters the post filter operation process, the total and dissolved
iron present is removed from the addition of the aluminum sulfate added during the coagulation,
flocculation, and sedimentation process.

39
FD: Field Duplicate
Figure 5-3: Total Manganese Throughout the Water Treatment Process (Pre-chlorination) [5/30/2013 to 8/15/2013]
0
5
10
15
20
Bldg 1283(Before Cl2)
Bldg 1285 (AfterCl2)
CombinedSprings
Combined Raw NWTP Fena PipeInfluent
Post Filter Clearwell Clearwell FD
Conc
entr
atio
n (μ
g/L)
40
Figure 5-4: Dissolved Manganese Throughout the Water Treatment Process (Pre-chlorination) [5/30/2013 to 8/15/2013]
0
0.5
1
1.5
2
2.5
3
Bldg 1283(Before Cl2)
Bldg 1285 (AfterCl2)
CombinedSprings
Combined Raw NWTP Fena PipeInfluent
Post Filter Clearwell Clearwell FD
Conc
entr
atio
n (μ
g/L)
41
BDL: Below Detection Limit
Figure 5-5: Total Iron Throughout the Water Treatment Process (Pre-chlorination) [5/30/2013 to 8/15/2013]
0
5
10
15
20
25
30
35
40
Bldg 1283 (BeforeCl2)
Bldg 1285 (AfterCl2)
Combined Springs Combined Raw NWTP Fena PipeInfluent
Post Filter Clearwell Clearwell FD
Conc
entr
atio
n (μ
g/L)
BDL BDL BDL
42
Figure 5-6: Dissolved Iron Throughout the Water Treatment Process (Pre-chlorination) [5/30/2013 to 8/15/2013]
0
1
2
3
4
5
6
7
Bldg 1283 (NoCl2)
Bldg 1285 (NoCl2)
Combined Springs Combined Raw NWTP Fena PipeInfluent
Post Filter Clearwell Clearwell FD
Conc
entr
atio
n (μ
g/L)
BDL BDL BDL

43
Cessation of Fena Lake Chlorine Pretreatment and Subsequent Effects on Water Quality
Since the NWTP was exceeding the MCLs for TTHMs, it was believed that the chlorine at
Fena Lake might have been the reason for this increase. Since iron and manganese
concentrations being below SMCLs, an idea was proposed to shutoff the chlorine at Fena
Lake. In late August, the decision was made to shut off pre-chlorination at Fena Lake. This
was performed to decrease the production of disinfection byproducts.
Also, in late September of 2013, a storm occurred at the NWTP. From this, Fena Lake
became more turbid, yet iron and manganese concentration were below detection limits. It
is believed that soil near Fena Lake entered the lake during the storm causing adsorption to
take place, explaining the turbidity in the lake and the decrease in iron and manganese.
This conclusion has yet to be verified and will requires an additional study not presented
herein.
Figure 5-7 and Figure 5-8 show box and whisker plots during chlorine cessation at Fena
Lake for total and dissolved manganese, respectively. There was a slight increase in
dissolved and total manganese at the point where pre-chlorination had previously been
practiced. This could be due to the age of the pipeline and manganese deposits being
present in the pipe at that location. Once mixed with the springs there was a decrease in
manganese. Figure 5-9 presents a box and whisker plot for total iron. Again there was an
increase at the same location as there was for manganese. The same conclusion may be
speculated as was for manganese and pipe deposits. Dissolved iron was not present during
chlorine cessation; therefore a box and whisker plot was not developed.

44
Figure 5-7: Total Manganese Throughout the Water Treatment Process (No Pre-chlorination) [8/29/2013 to 10/29/2013]
0
40
80
120
160
200
240
280
320
360
400
0
2
4
6
8
10
12
14
16
18
20
Bldg 1283 (NoCl2)
Bldg 1285 (NoCl2)
CombinedSprings
Combined Raw(Right Axis)
NWTP Fena PipeInfluent (Right
Axis)
Post Filter Clearwell Clearwell FD
Conc
entr
atio
n (u
g/L)
Conc
entr
atio
n (u
g/L)

45
Figure 5-8: Dissolved Manganese Throughout the Water Treatment Process (No Pre-chlorination) [8/29/2013 to 10/29/2013]
0
1
2
3
4
5
6
7
Bldg 1283 (NoCl2)
Bldg 1285 (NoCl2)
Combined Springs Combined Raw NWTP Fena PipeInfluent
Post Filter Clearwell Clearwell FD
Conc
entr
atio
n (μ
g/L)

46
Figure 5-9: Total Iron Throughout the Water Treatment Process (No Pre-chlorination) [8/29/2013 to 10/29/2013
0
100
200
300
400
500
600
700
800
900
1000
0
50
100
150
200
250
Bldg 1283 (NoCl2)
Bldg 1285 (NoCl2)
CombinedSprings
Combined Raw NWTP FenaPipe Influent(Right Axis)
Post Filter Clearwell Clearwell FD
Conc
entr
atio
n (μ
g/L)
Conc
entr
atio
n (μ
g/L)
BDL BDL BDL

47
During chlorine cessation, three sample sets were sent to UCF for analysis. As shown in Figure
5-10 and Figure 5-11, the total and dissolved manganese was measured when the chlorine was
shut off. The total manganese with pre-chlorination active was averaged and graphed, as well as
the total manganese during the cessation of pre-chlorination. The data collected while pre-
chlorination was practiced spans the timeframe between 5/30/2013 to 8/15/2013 whereas the data
acquired without pre-chlorination is shown in the three data sets between 8/29/2013 and
10/29/2013. The corresponding data collected throughout this project is presented in Appendix
A. As shown in these figures, when pre-chlorination was not practiced the iron and manganese
levels slightly increased but still below the SMCL of 50 μg/L.
Figure 5-10: Total Manganese (With and Without Chlorine)
0
2
4
6
8
10
12
Bldg 1283 Bldg 1285 Post Filter Clearwell
Conc
entr
atio
n (μ
g/L)
With Chlorine
Without Chlorine
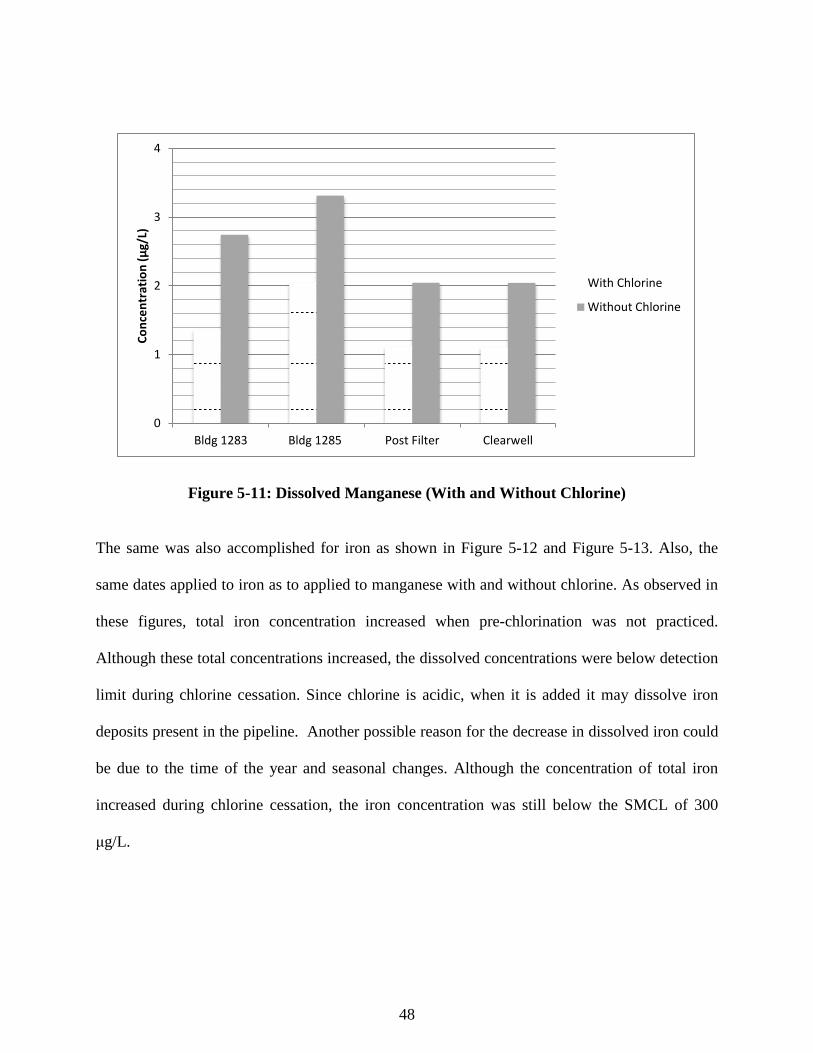
48
Figure 5-11: Dissolved Manganese (With and Without Chlorine)
The same was also accomplished for iron as shown in Figure 5-12 and Figure 5-13. Also, the
same dates applied to iron as to applied to manganese with and without chlorine. As observed in
these figures, total iron concentration increased when pre-chlorination was not practiced.
Although these total concentrations increased, the dissolved concentrations were below detection
limit during chlorine cessation. Since chlorine is acidic, when it is added it may dissolve iron
deposits present in the pipeline. Another possible reason for the decrease in dissolved iron could
be due to the time of the year and seasonal changes. Although the concentration of total iron
increased during chlorine cessation, the iron concentration was still below the SMCL of 300
μg/L.
0
1
2
3
4
Bldg 1283 Bldg 1285 Post Filter Clearwell
Conc
entr
atio
n (μ
g/L)
With Chlorine
Without Chlorine

49
Figure 5-12: Total Iron (With and Without Chlorine)
Figure 5-13: Dissolved Iron (With and Without Chlorine)
0
10
20
30
40
50
60
70
80
90
Bldg 1283 Bldg 1285 Post Filter Clearwell
Conc
entr
atio
n (μ
g/L)
With Chlorine
Without Chlorine
BDL BDL BDL BDL
0
1
2
3
Bldg 1283 Bldg 1285 Post Filter Clearwell
Conc
entr
atio
n (μ
g/L)
With Chlorine
Without Chlorine
BDL BDL BDL BDL BDL BDL

50
Effectiveness of Potassium Permanganate Pretreatment for Iron and Manganese Control
As shown in Figure 4-3, once the dose was increased past the recommended dose, pink water
formed in jars five and six. Over time, the pink water dissipated, in some cases 30 minutes.
Doses in jars two, three, and four were at or below the recommended dose, calculated using
Equation 4-2. The dose varied each time depending on the initial iron and manganese
concentrations measured. The jars dosed at those levels turned brown in color, which signifies
that the iron and manganese was being oxidized. The jars were dosed with potassium
permanganate solution, mixed, and covered to simulate pipe flow for two hours. The two-hour
duration was chosen based on a typical raw water travel time from the Fena Lake Pump Station
to the influent pipeline of the plant.
Once mixed, aluminum sulfate was added and the samples underwent a rapid mix at 150 rpm
for three minutes, flocculated at 20 rpm for 15 minutes, and then were allowed to settle for one
hour. The coagulant dose varied depending on the turbidity of the water, which usually was
between the range of 25 to 40 mg/L of aluminum sulfate. Once settled, samples were then taken
and filtered through 0.45-micron filters for iron and manganese analysis. The doses and water
quality data is shown in Table 5-2, Table 5-3, and Table 5-4. Water quality analyzed included
pH, conductivity, temperature, turbidity, dissolved iron, and dissolved manganese. The graphs
correlated to the manganese concentrations after the potassium permanganate was added are
shown in Figure 5-14, Figure 5-15, and Figure 5-16. The dose varied for each water shipment
received and tested. As shown in the figures, once the dose exceeded the recommended
stoichiometric dose, the water exhibited an undesired pink water color.

51
Table 5-2: Jar Test Water Quality (Run 1)
Before Permanganate Dose Potassium
Permanganate Dose (mg/L)
pH Conductivity (μS/cm)
Temperature (°C)
Turbidity (NTU)
Dissolved Iron
(μg/L)
Dissolved Manganese
(μg/L) 0 7.19 219 20.2 4.30
73.6 56.1
1 7.22 220 20.3 4.28 1.1 7.27 220 20.3 4.37 1.25 7.27 220 20.7 4.34 1.4 7.39 221 20.2 4.29 1.5 7.28 220 20.5 4.32
After Permanganate Dose Potassium
Permanganate Dose (mg/L)
pH Conductivity (μS/cm)
Temperature (°C)
Turbidity (NTU)
Dissolved Iron
(μg/L)
Dissolved Manganese
(μg/L) 0 (Right Axis) 7.59 225 20.4 0.90 ND 43
1 7.61 224 20.5 0.88 ND 2.6 1.25 7.59 224 20.5 0.91 ND 2.4 1.75b 7.62 224 20.7 0.81 ND 2.3 2.25 7.63 223 20.4 0.85 ND 3.4
3 7.59 222 20.5 0.89 ND 3.1 b: Recommended dose based on stoichiometry
Figure 5-14: Results of Jar Test Corresponding to Table 5-2
2.60 2.40 2.30
3.40 3.10
43.0
0
15
30
45
60
00.5
11.5
22.5
33.5
4
0 (RightAxis)
1 1.25 1.75 2.25 3
Mn
Con
cent
ratio
n (μ
g/L
)
Mn
Con
cent
ratio
n (μ
g/L
)
Potassium Permanganate Dose (mg/L)
At or below stoichiometric dose Over stoichiometric dose (pink water)

52
Table 5-3: Jar Test Water Quality (Run 2)
Before Permanganate Dose
Potassium Permanganate Dose (mg/L)
pH Conductivity (μS/cm)
Temperature (°C)
Turbidity (NTU)
Dissolved Iron
(μg/L)
Dissolved Manganese
(μg/L)
0 7.13 143 20.7 5.70
130 290 0.5 7.18 144 20.6 5.74 0.68 7.23 144 20.7 5.73 0.85 7.29 144 20.5 5.80
After Permanganate Dose
Potassium Permanganate Dose (mg/L)
pH Conductivity (μS/cm)
Temperature (°C)
Turbidity (NTU)
Dissolved Iron
(μg/L)
Dissolved Manganese
(μg/L)
0 (Right Axis) 7.02 182 20.9 0.99 ND 63 0.5 7.04 182 20.8 0.99 ND 4.4
0.68b 7.03 183 20.7 0.93 ND 4.1 0.85 7.05 185 20.6 0.95 ND 5.6
b: Recommended dose based on stoichiometry
Figure 5-15: Results of Jar Test Corresponding to Table 5-3
4.40 4.10
5.60 63.0
0
25
50
75
0
1
2
3
4
5
6
0 (Right Axis) 0.5 0.68 0.85
Mn
Con
cent
ratio
n (μ
g/L
)
Mn
Con
cent
ratio
n (μ
g/L
)
Potassium Permanganate Dose (mg/L)
At or below stoichiometric dose Over stoichiometric dose (pink water)

53
Table 5-4: Jar Test Water Quality (Run 3)
Before Permanganate Dose
Potassium Permanganate Dose (mg/L)
pH Conductivity (μS/cm)
Temperature (°C)
Turbidity (NTU)
Dissolved Iron
(μg/L)
Dissolved Manganese
(μg/L)
0 7.12 159 20.6 5.80
150 780 1.25 7.09 158.4 20.5 6.10 1.65 7.10 159.1 20.3 5.92 2.05 7.16 161 20.5 5.89
After Permanganate Dose
Potassium Permanganate Dose (mg/L)
pH Conductivity (μS/cm)
Temperature (°C)
Turbidity (NTU)
Dissolved Iron
(μg/L)
Dissolved Manganese
(μg/L)
0 (Right Axis) 7.10 205.9 20.7 0.60 ND 741 1.25 7.09 201.5 20.5 0.75 ND 47.8 1.65b 7.10 200 20.4 0.74 ND 3.6 2.05 7.15 199.7 20.5 0.85 ND 5.1
b: Recommended dose based on stoichiometry
Figure 5-16: Results of Jar Test Corresponding to Table 5-4
47.80
3.60 5.10
741
0
130
260
390
520
650
780
0
10
20
30
40
50
60
0 (Right Axis) 1.25 1.65 2.05
Mn
Conc
entr
atio
n (μ
g/L)
Mn
Conc
entr
atio
n (μ
g/L)
Potassium Permanganate Dose (mg/L)
At or below stoichiometric dose Over stoichiometric dose (pink water)

54
Laboratory Filter Method Verification
Another set of studies were performed to verify that 0.45-micron filters were not removing the
oxidized manganese present in the water. This specific component of the study was performed
using a series of jar test. Four jars were used in total; from each jar an initial sample was taken
and then filtered through 0.45-micron filters and 0.1-micron filters. These samples were then
analyzed with an ICP Spectrophotometer to determine the dissolved manganese concentration.
Coagulant was added to each of the jars, which then underwent rapid mix, flocculation, and
sedimentation processes. Once settled, samples were then again taken and filtered through a
0.45-micron filter. Figure 5-17 interprets these results. Based on these results, this verifies that
the 0.45-micron filters removed less than the 0.1-micron filters and is not effective in
removing oxidized manganese particulate mater. It is recommended that when taking monthly
samples from the WTP, the samples should be filtered through a 0.1-micron filter.
Figure 5-17: Filtering Results
0
100
200
300
400
500
600
700
800
900
Jar 1 Jar 2 Jar 3 Jar 4
Mn
Conc
entr
atio
n (u
g/L)
0.45-micron
0.1-micron
Coagulant & 0.45-micron

55
Quality Control Results
Control charts were plotted for both precision and accuracy. Precision was based on the I-
statistic as shown in Equation 4-3. Accuracy was based on percent recovery as shown in
Equation 4-1. The graphs related for precision and accuracy are shown in Figure 5-18 and Figure
5-19, respectively. As shown in Figure 5-18 the data collected during the time of this research
was within the control limits for precision and did not exceed the UWL or the UCL.
Figure 5-18: Control Chart for Metals Precision

56
Figure 5-20: Control Chart for Accuracy
As shown in Figure 5-20, the data collected throughout this research did not exceed the UCL of
120 percent or the LCL of 80 percent. There were some cases where the data came close to the
upper warning limits, but it was not necessary to discard that data due to not exceeding the upper
control limit.
0
20
40
60
80
100
120
140
0 5 10 15 20 25 30 35 40 45 50
Perc
ent R
ecov
ery
(%)
UCL
LCL

57
6. CONCLUSIONS AND RECOMMENDATIONS
Conclusions
A . Fena Lake iron and manganese concentrations increase with lake depth-. It was
observed though that at lake depth of 40-ft, the manganese levels did exceed its SMCL.
As for iron, at a lake depth of 40-ft, its SMCL was exceeded. Based on these results it
may be concluded that the depth of 10-ft to 12-ft is sufficient for source water that does
not exceed the SMCLs for iron and manganese.
B . Pre-chlorination is not necessary to control Fe and Mn levels- Based on the experiments
conducted in the research reported herein, it was found that the iron and manganese
concentrations throughout the WTP and at the point-of-entry are well below the
secondary iron and manganese MCLs of 0.3 mg/L and 0.05 mg/L, respectively. It
appeared that chlorine treatment offered no significant benefit when compared to
oxygen oxidation (Fena Lake) when drawing from the surface (10-12 foot) lake level.
Therefore, the chlorine at Fena Lake should be discontinued permanently as a
pretreatment tool, as the chlorine does not significantly aid in manganese or iron
oxidation and removal.
C. Potassium permanganate is effective in oxidizing Fe and Mn but over dosing causes
pink water formation- Potassium permanganate was evaluated as an alternative to
chlorine pre-treatment at the Fena Pump Station. The results showed that there was at
least a 95 percent decrease, sometimes more, in the manganese concentration when
potassium permanganate is added to raw Fena Lake water. The optimal doses were

58
confirmed to be 0.94 mg KMnO4 per mg Fe and 1.92 mg KMnO4 per mg Mn. However,
a slight over-dosage of excess permanganate leads to the formation of pink water.
Caution must be taken so as to not overdose. The data developed in this work
indicates that pink water formation can occur with less than 0.5 mg/L of a
permanganate overdose. Therefore, iron and manganese concentrations in the source
water must be monitored closely so that an accurate permanganate dose may be
determined and subsequently applied if this oxidizer is to be used. An overdose that
results in pink water will contribute to customer complaints.
Recommendations
A. Potassium permanganate as an alternate oxidant to chlorine pretreatment- Due to the fact
that the tolerance in permanganate is so tight (< 0.5 mg/L) that the formation of pink
water is possible. Consequently, the use of potassium permanganate as a pretreatment
chemical is not recommended for the remotely located NWTP site.
B. Chlorine dioxide as an alternate oxidant to chlorine pretreatment- Since the use of
potassium permanganate may present a difficult target for the operations staff to
accurately control permanganate dosages, it is recommended that an alternate oxidant,
chlorine dioxide, be researched for use as a manganese and iron control chemical. Due to
the fact that chlorine was also historically used for taste and odor control during times of
drought when algae could be problematic, an alternative control method would also
provide possible additional benefits. Chlorine dioxide has been shown to control iron,
manganese, provide taste and odor control, and does not contribute to the formation of
59
regulated total trihalomethanes and halogenated acetic acids for many water purveyors
across the U.S. (AWWA and AwwaRF 1995; AwwaRF 2009).
C. Study of storm event impacts on Fe and Mn lake water quality- It is recommended that a
study be performed to verify the cause of the decreased iron and manganese
concentrations that occurred at Fena Lake after the storm event that occurred during
September 2013. Iron and manganese concentrations at a 40-ft depth were usually in the
range of 580 μg/L and 780 μg/L prior to the storm event. After the storm event occurred,
the 40-ft depth iron and manganese concentrations were below detection limits. This may
be due to the increased rainfall or from the introduction of soil to the lake allowing for
sand adsorption. Further studies will need to be performed to verify these conclusions.
D. Filter studies-Further studies should be performed to verify that a 0.1-micron filter should
be utilized for analyzing dissolved manganese. Although this study was conducted
throughout this research, it is recommended that more studies be performed to verify
these results.

60
APPENDIX A: IRON AND MANGANESE DATA

61
Table A-1: Iron and Manganese Concentrations
5/30/2013 Location Total
Manganese (μg/L)
Dissolved Manganese
(μg/L)
Percent Dissolved
(%)
Total Iron
(μg/L)
Dissolved Iron
(μg/L)
Percent Dissolved
(%)
Navy reservoir 10' 4.40 0.60 14.3 8.90 ND ND Navy reservoir 30' 99.9 0.80 0.80 42.6 ND ND Bldg 1283 (before chlorination) 5.00 0.80 16.1 25.7 5.80 22.6 Bldg 1285 (after chlorination) 7.40 1.70 22.5 19.9 6.00 30.3 Combined springs 1.20 0.60 51.1 1.70 ND ND Combined raw 4.50 0.70 15.4 12.5 0.60 4.80 NWTP Fena Pipe Influent 5.20 0.60 12.0 18.8 0.30 1.40 Filtered water 0.70 0.60 80.3 ND ND ND Clearwell 0.60 0.60 94.6 ND ND ND Clearwell field duplicate 0.60 0.60 94.4 ND ND ND
6/6/2013 Location Total
Manganese (μg/L)
Dissolved Manganese
(μg/L)
Percent Dissolved
(%)
Total Iron
(μg/L)
Dissolved Iron
(μg/L)
Percent Dissolved
(%)
Navy reservoir 10' 7.70 1.40 18.5 15.9 ND ND Navy reservoir 30' 15.0 1.30 8.80 42.3 ND ND Bldg 1283 (before chlorination) 6.40 1.40 21.3 23.4 2.40 10.4 Bldg 1285 (after chlorination) 9.30 2.10 22.2 22.2 1.7 7.90 Combined springs 1.90 1.40 71.7 1.80 ND 0.10 Combined raw 6.80 1.80 26.3 14.3 1.10 8.00 NWTP Fena Pipe Influent 8.20 1.70 21.0 22.4 2.20 10.0 Filtered water 1.30 1.30 96.8 ND ND ND Clearwell 1.30 1.30 99.9 ND ND ND Clearwell field duplicate 1.30 1.40 105.3 ND ND ND

62
6/13/2013 Location Total
Manganese (μg/L)
Dissolved Manganese
(μg/L)
Percent Dissolved
(%)
Total Iron
(μg/L)
Dissolved Iron (μg/L)
Percent Dissolved
(%)
Navy reservoir 10' 16.4 0.60 3.90 11.3 0.70 5.90 Navy reservoir 30' 18.4 0.60 3.00 13.0 ND ND Bldg 1283 (before chlorination) 9.10 0.70 7.90 21.6 2.10 9.90 Bldg 1285 (after chlorination) 17.1 1.30 7.60 21.1 6.10 28.8 Combined springs 1.60 0.60 38.2 24.4 0.60 2.70 Combined raw 15.9 0.90 5.40 23.0 0.80 3.60 NWTP Fena Pipe Influent 17.8 0.80 4.60 21.3 1.10 5.10 Filtered water 0.70 0.60 82.7 ND ND ND Clearwell 0.60 0.60 94.5 ND ND ND Clearwell field duplicate 0.60 0.60 92.5 ND ND ND
6/20/2013 Location Total
Manganese (μg/L)
Dissolved Manganese
(μg/L)
Percent Dissolved
(%)
Total Iron
(μg/L)
Dissolved Iron (μg/L)
Percent Dissolved
(%)
Navy reservoir 10' 9.00 0.60 7.00 6.70 ND ND Navy reservoir 30' 30.4 6.20 20.5 17.3 0.20 1.40 Bldg 1283 (before chlorination) 6.50 0.90 13.3 17.2 1.10 6.10 Bldg 1285 (after chlorination) 10.0 1.40 14.4 12.2 1.50 12.1 Combined springs 1.10 0.60 51.7 1.50 ND ND Combined raw 6.10 0.80 13.4 8.20 2.20 26.8 NWTP Fena Pipe Influent 13.9 0.80 5.80 12.2 2.30 19.2 Filtered water 0.60 0.70 108 ND ND ND Clearwell 0.60 0.60 86.7 ND ND ND Clearwell field duplicate 0.60 0.60 90.3 ND ND ND

63
6/27/2013 Location Total
Manganese (μg/L)
Dissolved Manganese
(μg/L)
Percent Dissolved
(%)
Total Iron
(μg/L)
Dissolved Iron (μg/L)
Percent Dissolved
(%)
Navy reservoir 10' 5.50 1.00 18.3 7.40 ND ND Navy reservoir 30' 22.7 1.00 4.40 15.9 ND ND Bldg 1283 (before chlorination) 5.70 1.30 22.9 20.3 1.40 7.00 Bldg 1285 (after chlorination) 9.30 2.00 22.0 25.4 1.60 6.20 Combined springs 1.80 1.00 55.5 7.20 ND ND Combined raw 15.2 1.30 8.40 20.6 ND ND NWTP Fena Pipe Influent 21.6 1.30 6.00 35.1 0.60 1.60 Filtered water 1.00 1.00 95.0 ND ND ND Clearwell 1.00 1.00 98.6 ND ND ND Clearwell field duplicate 1.00 1.00 95.6 ND ND ND
7/5/2013 Location Total
Manganese (μg/L)
Dissolved Manganese
(μg/L)
Percent Dissolved
(%)
Total Iron
(μg/L)
Dissolved Iron (μg/L)
Percent Dissolved
(%)
Navy reservoir 10' 8.80 1.50 16.8 ND ND ND Navy reservoir 30' 71.9 1.40 1.90 ND ND ND Bldg 1283 (before chlorination) 6.30 1.50 23.7 23.6 2.20 9.30 Bldg 1285 (after chlorination) 10.5 1.90 18.1 20.8 3.20 15.3 Combined springs 5.80 1.50 25.7 12.4 ND ND Combined raw 7.30 1.60 22.5 15.9 1.50 9.50 NWTP Fena Pipe Influent 7.40 1.60 22.0 16.2 2.50 15.40 Filtered water 1.50 1.40 91.9 ND ND ND Clearwell 1.40 1.40 98.2 ND ND ND Clearwell field duplicate 1.50 1.40 97.2 ND ND ND

64
7/11/2013 Location Total
Manganese (μg/L)
Dissolved Manganese
(μg/L)
Percent Dissolved
(%)
Total Iron
(μg/L)
Dissolved Iron (μg/L)
Percent Dissolved
(%)
Navy reservoir 10' 6.40 1.40 21.5 8.0 ND ND Navy reservoir 30' 62.6 1.40 2.2 62.4 ND ND Bldg 1283 (before chlorination) 6.70 1.70 24.8 23.2 ND ND Bldg 1285 (after chlorination) 9.40 2.70 28.3 20.5 2.60 12.7 Combined springs 2.20 1.50 67.1 2.30 ND ND Combined raw 6.50 1.60 24.0 14.6 ND ND NWTP Fena Pipe Influent 7.80 1.50 19.7 18.1 ND ND Filtered water 1.40 1.40 100.5 ND ND ND Clearwell 1.30 1.40 101.9 ND ND ND Clearwell field duplicate 1.40 1.40 100.7 ND ND ND
7/18/2013 Location Total
Manganese (μg/L)
Dissolved Manganese
(μg/L)
Percent Dissolved
(%)
Total Iron
(μg/L)
Dissolved Iron (μg/L)
Percent Dissolved
(%)
Navy reservoir 10' 2.50 1.40 57.3 4.80 ND ND Navy reservoir 30' 3.30 1.40 43.3 3.10 ND ND Bldg 1283 (before chlorination) 2.40 1.70 71.6 12.3 ND ND Bldg 1285 (after chlorination) 5.00 2.40 47.3 12.1 ND ND Combined springs 1.50 1.40 93.0 7.10 ND ND Combined raw 2.60 1.80 70.0 7.90 ND ND NWTP Fena Pipe Influent 2.90 2.00 68.7 7.60 ND ND Filtered water 1.30 1.30 99.0 ND ND ND Clearwell 1.30 1.30 100.3 ND ND ND Clearwell field duplicate 1.30 1.30 100.1 ND ND ND

65
7/25/2013 Location Total
Manganese (μg/L)
Dissolved Manganese
(μg/L)
Percent Dissolved
(%)
Total Iron
(μg/L)
Dissolved Iron (μg/L)
Percent Dissolved
(%)
Navy reservoir 10' 5.50 1.30 23.1 7.60 ND ND Navy reservoir 30' 8.20 1.40 16.6 16.9 ND ND Bldg 1283 (before chlorination) 5.50 1.80 32.3 21.1 ND ND Bldg 1285 (after chlorination) 8.10 2.20 26.6 17.7 ND ND Combined springs 1.90 1.30 68.8 8.70 ND ND Combined raw 11.7 1.60 13.3 13.7 ND ND NWTP Fena Pipe Influent 6.70 1.70 25.0 16.4 ND ND Filtered water 1.40 1.20 89.7 ND ND ND Clearwell 1.40 1.20 88.0 ND ND ND Clearwell field duplicate 1.40 1.20 88.1 ND ND ND
8/15/2013 Location Total
Manganese (μg/L)
Dissolved Manganese
(μg/L)
Percent Dissolved
(%)
Total Iron
(μg/L)
Dissolved Iron (μg/L)
Percent Dissolved
(%)
Navy reservoir 20' 8.10 2.30 28.1 6.00 ND ND Navy reservoir 40' 989.3 986.2 99.7 685.1 5.00 0.70 Bldg 1283 (before chlorination) 8.30 2.60 31.9 20.6 ND ND Bldg 1285 (after chlorination) 10.5 2.70 25.7 15.6 ND ND Combined springs 2.90 2.30 79.8 5.60 ND ND Combined raw 8.80 2.50 28.8 17.0 ND ND NWTP Fena Pipe Influent 9.90 2.60 26.6 16.9 ND ND Filtered water 2.30 2.20 99.6 ND ND ND Clearwell 2.20 2.30 101.3 ND ND ND Clearwell field duplicate 2.20 2.30 100.8 ND ND ND

66
8/29/2013 Location Total
Manganese (μg/L)
Dissolved Manganese
(μg/L)
Percent Dissolved
(%)
Total Iron
(μg/L)
Dissolved Iron (μg/L)
Percent Dissolved
(%)
No Chlorine
Navy reservoir 20' 4.60 2.1 46.1 38.6 ND ND Navy reservoir 40' 698 690 98.8 329.8 210.6 63.9 Bldg 1283 (before chlorination) 4.50 2.8 62.8 19.3 ND ND Bldg 1285 (after chlorination) 5.80 4.1 71.6 18.0 ND ND Combined springs 2.30 2.0 86.6 10.7 ND ND Combined raw 10.2 2.2 21.5 18.4 ND ND NWTP Fena Pipe Influent 15.4 2.1 13.8 22.0 ND ND Filtered water 2.0 2.0 98.6 ND ND ND Clearwell 2.0 1.9 98.0 ND ND ND Clearwell field duplicate 2.0 1.9 95.6 ND ND ND
9/16/2013 Location Total
Manganese (μg/L)
Dissolved Manganese
(μg/L)
Percent Dissolved
(%)
Total Iron
(μg/L)
Dissolved Iron (μg/L)
Percent Dissolved
(%)
No Chlorine
Navy reservoir 20' 16.9 4.30 25.4 38.6 ND ND Navy reservoir 40' 637.4 629.3 98.7 719.0 6.20 0.90 Bldg 1283 (before chlorination) 12.1 5.40 44.6 19.3 ND ND Bldg 1285 (after chlorination) 17.7 5.80 32.8 18.0 ND ND Combined springs 4.70 4.20 89.4 10.7 ND ND Combined raw 298.7 4.50 1.50 18.4 ND ND NWTP Fena Pipe Influent 365.4 4.40 1.20 22.0 ND ND Filtered water 4.30 4.20 97.7 ND ND ND Clearwell 4.30 4.20 97.7 ND ND ND Clearwell field duplicate 4.30 4.20 97.7 ND ND ND

67
10/29/2013 Location Total
Manganese (μg/L)
Dissolved Manganese
(μg/L)
Percent Dissolved
(%)
Total Iron
(μg/L)
Dissolved Iron (μg/L)
Percent Dissolved
(%)
No Chlorine
Navy reservoir 20' 8.10 ND ND 173.6 ND ND Navy reservoir 40' 5.50 ND ND 182.3 ND ND Bldg 1283 (before chlorination) 4.70 ND ND 169.5 ND ND Bldg 1285 (after chlorination) 9.70 ND ND 204.3 ND ND Combined springs 0.10 ND ND 17.7 ND ND Combined raw 32.8 ND ND 195.7 ND ND NWTP Fena Pipe Influent 33.5 ND ND 879 ND ND Filtered water ND ND ND ND ND ND Clearwell ND ND ND ND ND ND Clearwell field duplicate ND ND ND ND ND ND
68
REFERENCES
AWWA and AwwaRF. Chlorine Dioxide: Drinking Water and Wastewater Issues.
Proceedings of the Third International Symposium, New Orleans, LA; September 14-15,1995.
Branhuber, P., Sarah Clark, William Knocke, and John Tobiason (2013). Guidance for the
Treatment of Manganese, Water Research Foundation.
Bryant, E. A., George P. Fulton, George C. Budd (1992). Disinfection Alternatives for Safe
Drinking Water. New York, NY, Van Nostrand Reinhold.
Carlson, K. H. and W. R. Knocke (1999). "Modeling Manganese Oxidation with KMnO4 for
Drinking Water Treatment." Journal of Environmental Engineering 125(10): 892.
Devore, J. L. (2000). Probability and statistics for engineering and the sciences / Jay L. Devore,
Pacific Grove, CA : Duxbury c2000. 5th ed.
Eaton, Andrew D., and M. A. H. Franson. 2005. Standard Methods for the Examination of
Water & Wastewater. Washington, DC: American Public Health Association, 2005.
Engineering, H. D. R. (2001). Handbook of Public Water Systems. New York, Wiley.
Ficek, K. J. and J. E. Boll (1980). "Potassium Permanganate: An Alternative to Prechlorination."
Aqua(7): 153-156.

69
Gregory, D. and K. Carlson (2003). "EFFECT OF soluble Mn concentration on oxidation
kinetics." Journal (American Water Works Association) 95(1): 98-108.
Kennedy Engineers (1980). Rehabilitation of the Fena Water Treatment Facility: Public Works
Center, Guam: Phase I Identification of Defects and Preliminary Recommendations. Department
of the Navy Pacific Division Naval Facilities Engineering Command. Contract No. N62742-79-
R-0049 KE 9087.
Kawamura, S. (2000). Integrated design and operation of water treatment facilities / Susumu
Kawamura, New York : John Wiley & Sons, c2000. 2nd ed.
Knocke, W.R. et al. (1990). "Alternate Oxidants for the Removal of Soluble Iron and Mn."
AWWA Research Foundation.
Lalezary, S., et al. (1986). "Oxidation of five earthy-musty taste and odor compounds." Journal:
American Water Works Association 78: 62-69.
Pontius, F. W., et al. (2002). Manganese control and related issues / prepared by Robin J. Casale
and Mark W. LeChevallier and Frederick W. Pontius, Denver, CO : AWWA Research
Foundation and American Water Works Association, c2002.
Ríos, S. M. G. (2003). TOC removal from a surface water supply on a volcanic island using
enhanced coagulation and granular activated carbon / by Sheila María Guevara Ríos, 2003.

70
Roccaro, P., et al. (2007) "Removal of manganese from water supplies intended for human
consumption: a case study." Desalination 210: 205-214.
Scheffer F., et al. (1989). Lehrbuch der Bodenkunde. Enke Verlag, Stuttgart
USEPA (1979). National secondary drinking water regulation / United States Environmental
Protection Agency, Office of Drinking Water, [Washington] : Environmental Protection Agency,
Office of Drinking Water, 1979.
USEPA (1991). Guidance Manual for Compliance with the Filtration and Disinfection
Requirements for Public Water Systems Using Surface Water Sources. Washington D.C.
USEPA (1999). Alternative disinfectants and oxidants guidance manual, [Washington, D.C.] :
U.S. Environmental Protection Agency, Office of Water, [1999].
Zogo, D., et al. (2011). "Influence of Pre-Oxidation with Potassium Permanganate on the
Efficiency of Iron and Manganese Removal from Surface Water by Coagulation-Flocculation
Using Aluminium Sulphate: Case of the Okpara Dam in the Republic of Benin." Journal of
Environmental Chemistry and Ecotoxicology 3(1): 1-8.