Embed Size (px)
Citation preview
RESEARCH ARTICLE
Evaluation of iTRAQ and SWATH-MS for theQuantification of Proteins Associated withInsulin Resistance in Human DuodenalBiopsy SamplesSylvie Bourassa1, Frédéric Fournier1, Benjamin Nehmé1, Isabelle Kelly1, André Tremblay2,Valéry Lemelin2, Benoit Lamarche2, Patrick Couture2, Arnaud Droit1*
1 Proteomics Center, CHU de Québec Research Center and Department of Molecular Medicine, LavalUniversity, Quebec, Canada, 2 Lipid Research Center, Centre Hospitalier de l’Université Laval ResearchCenter, Laval University, Quebec, Canada
AbstractInsulin resistance (IR) is associated with increased production of triglyceride-rich lipopro-
teins of intestinal origin. In order to assess whether insulin resistance affects the proteins in-
volved in lipid metabolism, we used two mass spectrometry based quantitative proteomics
techniques to compare the intestinal proteome of 14 IR patients to that of 15 insulin sensitive
(IS) control patients matched for age and waist circumference. A total of 3886 proteins were
identified by the iTRAQ (Isobaric Tags for Relative and Absolute Quantitation) mass spec-
trometry approach and 2290 by the SWATH-MS strategy (Serial Window Acquisition of The-
oretical Spectra). Using these two methods, 208 common proteins were identified with a
confidence corresponding to FDR < 1%, and quantified with p-value < 0.05. The quantifica-
tion of those 208 proteins has a Pearson correlation coefficient (r2) of 0.728 across the two
techniques. Gene Ontology analyses of the differentially expressed proteins revealed that
annotations related to lipid metabolic process and oxidation reduction process are overly
represented in the set of under-expressed proteins in IR subjects. Furthermore, both meth-
ods quantified proteins of relevance to IR. These data also showed that SWATH-MS is a
promising and compelling alternative to iTRAQ for protein quantitation of complex mixtures.
IntroductionInsulin resistance (IR) is associated with dyslipidemia, which contributes to the pathogenesis ofatherosclerosis and increases the risk of cardiovascular disease [1]. Studies have also consistent-ly supported the concept that inducing IR in various animal models is associated with signifi-cant up-regulation of the expression of key intestinal genes involved in lipid and lipoproteinmetabolism [2, 3]. We recently showed that IR in humans was associated with a significantdown-regulation of several key genes involved in intestinal fatty acid and lipoprotein
PLOSONE | DOI:10.1371/journal.pone.0125934 May 7, 2015 1 / 16
a11111
OPEN ACCESS
Citation: Bourassa S, Fournier F, Nehmé B, Kelly I,Tremblay A, Lemelin V, et al. (2015) Evaluation ofiTRAQ and SWATH-MS for the Quantification ofProteins Associated with Insulin Resistance inHuman Duodenal Biopsy Samples. PLoS ONE 10(5):e0125934. doi:10.1371/journal.pone.0125934
Academic Editor: Heping Cao, USDA-ARS,UNITED STATES
Received: November 17, 2014
Accepted: March 19, 2015
Published: May 7, 2015
Copyright: © 2015 Bourassa et al. This is an openaccess article distributed under the terms of theCreative Commons Attribution License, which permitsunrestricted use, distribution, and reproduction in anymedium, provided the original author and source arecredited.
Data Availability Statement: All 126 files have beensubmitted to the PRIDE database(ProteomeXchange) with identifier PXD001506.
Funding: AD holds a Réseau de médecinegénétique appliquée (RMGA) salary award. Thefunder had no role in study design, data collectionand analysis, decision to publish, or preparation ofthe manuscript.
Competing Interests: The authors have declaredthat no competing interests exist.
metabolism [4]. However, no study has yet examined duodenal protein expression using globalquantitative proteomics analyses from IR vs insulin sensitive (IS) patients.
A number of techniques and strategies can be used for the relative comparison of protein ex-pression between different conditions. Isotopic labeling and label-free methods are currentlyused for this task. There are some publications and reviews comparing both methods in the lastyears [5–10], but no consensus has been made on which method is superior, each of them hav-ing its own strengths and weaknesses.
The most popular labeling approaches are iTRAQ (isobaric tag for relative and absolutequantitation), SILAC (stable isotope labeling by amino acids in cell culture) and TMT (tandemmass tag). The iTRAQ reagents as well as the TMT reagents react with peptide amino-terminior lysine residues, and hence label most peptides and proteins of the cells. Upon collision-in-duced dissociation (CID) or higher-energy collisional dissociation (HCD), iTRAQ or TMT re-porter ions (4 or 8 for iTRAQ and 6 or 10 for TMT) are released in the MS/MS spectra. Theintensity of these peaks will be used for the relative quantification of peptides and proteins.
In recent years, label-free quantification based on precursor signal intensity has gained pop-ularity because of its fast and low-cost measurement. Peak intensity based comparative LC/MSand spectral count based LC-MS/MS are the most commonly used label-free quantificationmethods [11–13]. New label-free mass spectrometry strategies have recently emerged and holdgreat promise. An interesting review [6] present the advantages and limitations of the data-in-dependent analysis (DIA) and hyper reaction monitoring. Selected Reaction Monitoring(SRM) and Multiple Reaction Monitoring enable the quantification of predetermined proteinsby targeting specific peptides (detected in previous experiments). The targeted approach is veryspecific, reproducible, sensitive, and allows either relative or absolute quantification. However,this technique is also time consuming since optimization work must be done prior analysis toobtain optimal specificity and sensitivity.
Most label-based and label-free approaches use data-dependent acquisition (DDA) where asurvey scan is used to determine which precursor will be selected for product ion scanning [6,14]. However, with DDA, low intensity ions are often missed and thus cannot be quantified[14]. The SWATH approach [15] (Sequential Window Acquisition of all Theoretical MassSpectra) circumvent this effect since it uses DIA for the quantification. DIA operates withoutany prior knowledge of the precursor ion to trigger acquisition of fragment ion spectra. Indeed,data are acquired by repeatedly cycling through predefined sequential windows over the wholechromatographic elution range generating a complete recording of all analytes in the sample.Despite its present incompatibility with conventional database searching, SWATH is a nicetool for quantification of a large number of proteins from a complex mixture. Unlike MRM,SWATH has the capability and flexibility to re-mine the data post-analytically.
There are some studies comparing labeled and label-free strategies. iTRAQ has been com-pared to gel and label-free LC-MS/MS [8] on theMethylocella silvestris bacterium. The studyconcludes that the three methods were comparable for the number of proteins identified if sin-gle peptides were used for protein identification. There is also a good correlation between therelative quantification by iTRAQ and label-free LC-MS/MS. However, the experiments werenot conducted on the same instrument (QTOF global Ultima compared with QTOF premier).
Another group compared iTRAQ and peak-intensity-based label-free approaches on Chla-mydomonas reinhardtii strains on the LTQ orbitrap velos platform [10]. Quantification wascalculated by summing the abundances of all peptides of the respective proteins. A scatter plotcomparing the quantified proteins by the two methods showed a good correlation coefficientof 0.78. However, label-free approach led to more protein being identified and quantified, butthe reproducibility was better with iTRAQ.
Evaluation of iTRAQ and SWATH-MS for Protein Quantification
PLOS ONE | DOI:10.1371/journal.pone.0125934 May 7, 2015 2 / 16
A recent article [9] comparing iTRAQ and label-free proteomics in human lung adenovirusinfection suggested that the label-free method is more accurate than the iTRAQ method. How-ever, the comparison was performed on different instruments (MALDI-TOF-TOF for iTRAQand LTQ-FT-ICR mass spectrometer for label-free). A higher dynamic range was found withthe label-free approach.
Lambert et al [16] showed some comparisons of SWATH data and iTRAQ. They usediTRAQ and AP-Western for validation of the SWATH results. More recently, Zhang et al [17]used iTRAQ and SWATH for the identification of cancer-related proteins in metastatic non-small-cell lung cancer (NSCLC). Using both methods, they found that CD109 could be a po-tential biomarker for NSCLC.
In this study, we evaluated and compared the iTRAQ labeling technique and the label-freeSWATH-MS strategy in duodenal biopsy of IR vs IS subjects. This picture of the differentialproteome corroborates previous positions about the effects of insulin resistance and raises in-teresting hypothesis about the implication of other proteins such as PACAP and MARCKS inthe onset of insulin resistance in duodenum.
Materials and Methods
Patient samples and duodenal biopsyFourteen nondiabetic, insulin-resistant (IR) males and fifteen insulin-sensitive (IS) malesmatched for age and waist circumference were recruited in the Quebec City area to participate inthe study. IR subjects had to have plasma triglyceride (TG) levels> 1.7 mmol/L, HDL-C< 1.1mmol/L, plasma insulin levels> 90 ρmol/L and a waist circumference> 94 cm. Subjects wereexcluded if they had elevated blood pressure, monogenic hyperlipidemia such as familial hyper-cholesterolemia, plasma TG levels> 4.5 mmol/L, a recent history of alcohol or drug abuse, dia-betes mellitus or a history of cancer. Furthermore, all participants were unrelated at the first andsecond degrees. The research protocol was approved by the Laval University Medical Center eth-ical review committee and written informed consent was obtained from each subject. Biopsieswere obtained from the second portion of the duodenum during gastro-duodenoscopy. Six biop-sy samples were collected using multiple sample single-use biopsy forceps and immediately flashfrozen in liquid nitrogen and stored at -80°C before protein extraction.
Protein extractionFrozen duodenal tissue biopsies (15 IS and 14 IR patients) were weighted (6 to 20mg), and dis-rupted using a mortar and pestle. Samples were kept frozen on dry ice, and grinded to fine pow-der. Then lysis buffer (50mM ammonium bicarbonate, 50mM dithiothreitol (DTT), 0.5%sodium deoxycholate (SDC)) containing protease inhibitors cocktail (Roche) was added, and thesample preparation was homogenized on ice by sonication with a Sonic Dismembrator (Fisher)with 1 second pulse (20 times). Samples were centrifuged 10 min at 16000g. The supernatantswere mixed with 5 volumes of acetone (stored at -20°C) and incubated overnight at -20°C. Pre-cipitated proteins were centrifuged 15min at 16000g. Protein pellets were air dried, and then re-suspended in 0.5M Triethylammonium bicarbonate (TEAB) containing 0.5% SDC. Finally, theprotein concentration of each sample was determined by colorimetric Bradford assay.
iTRAQ sample labelling and isoelectric focusing (IEF)Equal amounts of protein (50μg) from each control (IS) or IR sample were combined to give acontrol group and a IR group, respectively (Fig 1). Experimentation was performed in dupli-cates. Protein concentrations in pooled control (IS) and IR groups were determined using the
Evaluation of iTRAQ and SWATH-MS for Protein Quantification
PLOS ONE | DOI:10.1371/journal.pone.0125934 May 7, 2015 3 / 16
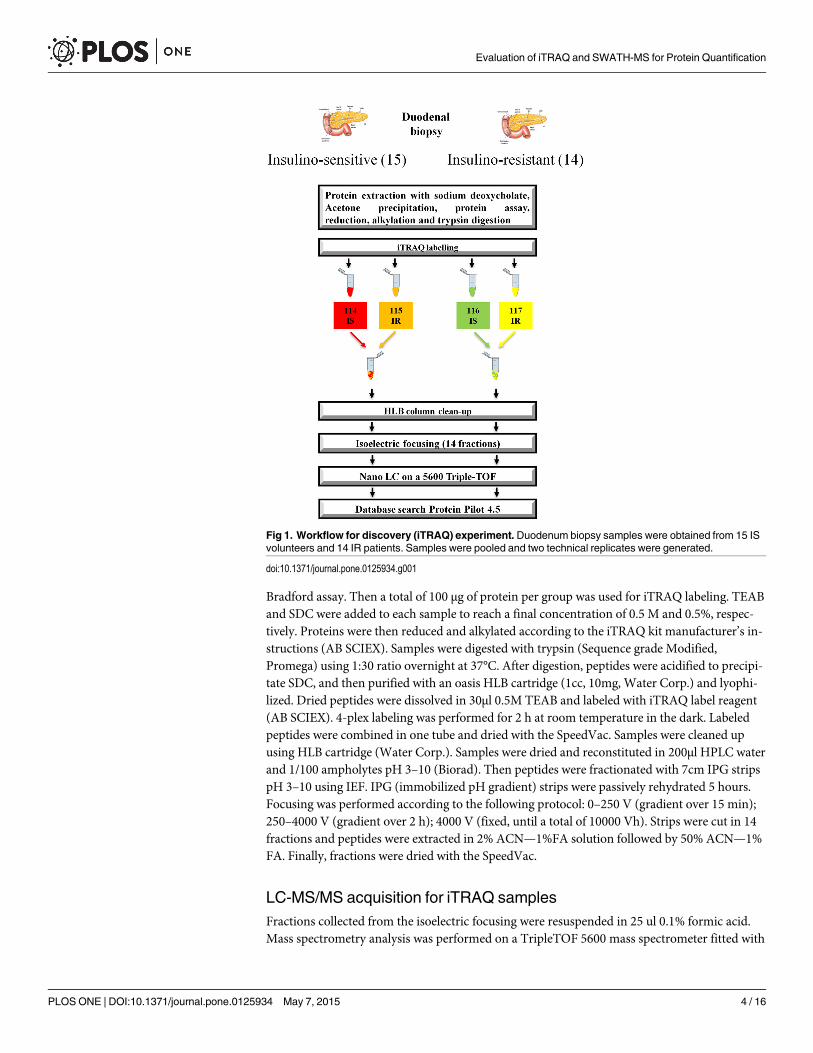
Bradford assay. Then a total of 100 μg of protein per group was used for iTRAQ labeling. TEABand SDC were added to each sample to reach a final concentration of 0.5 M and 0.5%, respec-tively. Proteins were then reduced and alkylated according to the iTRAQ kit manufacturer’s in-structions (AB SCIEX). Samples were digested with trypsin (Sequence grade Modified,Promega) using 1:30 ratio overnight at 37°C. After digestion, peptides were acidified to precipi-tate SDC, and then purified with an oasis HLB cartridge (1cc, 10mg, Water Corp.) and lyophi-lized. Dried peptides were dissolved in 30μl 0.5M TEAB and labeled with iTRAQ label reagent(AB SCIEX). 4-plex labeling was performed for 2 h at room temperature in the dark. Labeledpeptides were combined in one tube and dried with the SpeedVac. Samples were cleaned upusing HLB cartridge (Water Corp.). Samples were dried and reconstituted in 200μl HPLC waterand 1/100 ampholytes pH 3–10 (Biorad). Then peptides were fractionated with 7cm IPG stripspH 3–10 using IEF. IPG (immobilized pH gradient) strips were passively rehydrated 5 hours.Focusing was performed according to the following protocol: 0–250 V (gradient over 15 min);250–4000 V (gradient over 2 h); 4000 V (fixed, until a total of 10000 Vh). Strips were cut in 14fractions and peptides were extracted in 2% ACN—1%FA solution followed by 50% ACN—1%FA. Finally, fractions were dried with the SpeedVac.
LC-MS/MS acquisition for iTRAQ samplesFractions collected from the isoelectric focusing were resuspended in 25 ul 0.1% formic acid.Mass spectrometry analysis was performed on a TripleTOF 5600 mass spectrometer fitted with
Fig 1. Workflow for discovery (iTRAQ) experiment. Duodenum biopsy samples were obtained from 15 ISvolunteers and 14 IR patients. Samples were pooled and two technical replicates were generated.
doi:10.1371/journal.pone.0125934.g001
Evaluation of iTRAQ and SWATH-MS for Protein Quantification
PLOS ONE | DOI:10.1371/journal.pone.0125934 May 7, 2015 4 / 16
a nanospray III ion source (AB SCIEX, Concord, ON) and coupled to an Agilent 1200 HPLC(Agilent, California). Two ul samples were injected by the Agilent 1200 autosampler onto atrapping column (Zorbax 300SB-C18) 5 u, 5 x 0.3mm at ten ul/min for desalting then onto a0.075 mm (internal diameter) self-packed PicoFrit column (New Objective) packed with a iso-propanol slurry of 5um Jupiter C18 (Phenomenex) stationary phase using a pressure vessel(Proxeon) set at 700 psi. The length of the column was 15 cm. Samples were run using a 90min gradient from 5–35% solvent B (solvent A 0.1% formic acid in water; solvent B: 0.1% for-mic acid in acetonitrile) at a flow rate of 300 nl/min. Data were acquired using an ion sprayvoltage of 2.4 kV, curtain gaz of 30 psi, nebulizer gaz of 8 psi and an interface heater tempera-ture of 125°C. A DDAmethod was set up with the MS survey range set between 400 amu and1250 amu (250msec) followed by dependent MS/MS scans with a mass range set between 100and 1800 amu (50m sec) of the 20 most intense ions in the high sensitivity mode with a 2+ to 5+ charge state. Dynamic exclusion was set for a period of 12 sec and a tolerance of 100 ppm.Rolling collision energy was used and iTRAQ reagent collision energy adjustment was on.
Data files were submitted for simultaneous searches using Protein Pilot version 4.5 software(AB SCIEX) utilizing the Paragon and Progroup algortihms [18] and the integrated false dis-covery rate (FDR) analysis function [19]. Protein Pilot was set up to search the uniprot ‘com-plete proteome’ human proteins database (84848 sequences) with MMTS as a fixedmodification on cysteine. Variable peptide modifications included methionine (M) oxidationand iTRAQ labeling of the N-terminal, lysine (K) and tyrosine (Y). Automatic normalizationof quantitative data (bias correction) was performed to correct any experimental orsystematic bias.
The detected protein threshold in the software was set to the value which corresponded to1% FDR. The following criteria were required to consider a protein for further statistical analy-sis: the p-value of the protein quantitation had to be� 0.05. All data files are available in thePRIDE database (submission number: 1-20141114-204).
Library generation for SWATH analysis200 ug of tryptic peptides from IS and IR samples in which we spiked 20 pmol of bovine serumalbumin peptides (as an internal standard) were fractionated by IEF into 14 fractions (as de-scribed above). Two hundred fifty ng from each fraction was injected on the TripleTOF 5600(AB SCIEX) in DDA mode using the same chromatography conditions and the same acquisi-tion parameters as used for iTRAQ (except for the extra CE for iTRAQ) and then searchedagainst the uniprot ‘Complete Proteome’ human database (release of March 2013, 84848 se-quences) with Protein Pilot 4.5. The resulting protein pilot. group file was used to generate thelibrary which was used for SWATH processing and quantification.
SWATH analysisTryptic peptide samples from IR (200ng) and IS (200ng) were injected in 6 replicates in dataindependent acquisition (DIA) mode for SWATH analysis. 3 replicates of IR and IS contained10 fmol of BSA and the 3 other replicates of IR and IS contained 50fmol of BSA (Fig 2). TheSWATH conditions were essentially the same as in Gillet et al. [15] with the same chro-matographic conditions described in the iTRAQ experiment. The mass spectrometer was oper-ated with a 50 ms TOF MS scan followed by product ion mode of 100 ms 24 x 25 amu isolationwindow covering a mass range of 400–1000 with cycle time of 2.5 sec. An overlap of 1 Da be-tween each SWATH was used. Material eluted in a linear gradient of 5–35% acetonitrile over90 min as in the generation of the SWATH library.
Evaluation of iTRAQ and SWATH-MS for Protein Quantification
PLOS ONE | DOI:10.1371/journal.pone.0125934 May 7, 2015 5 / 16
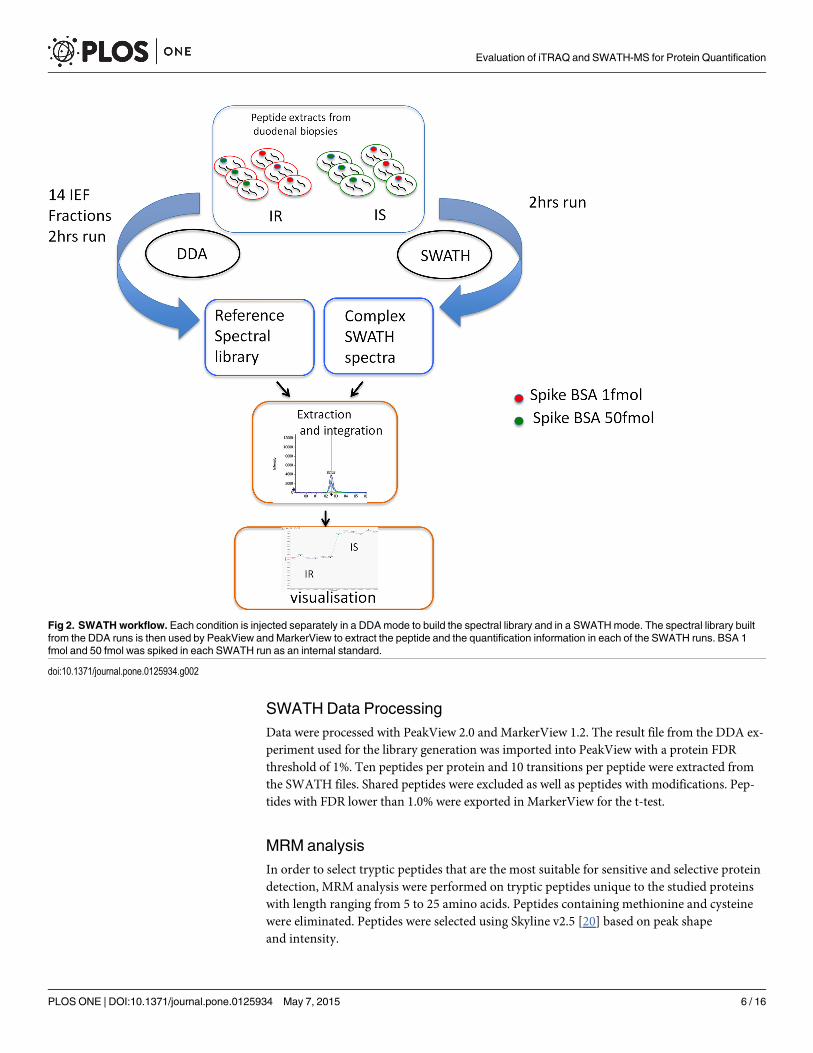
SWATH Data ProcessingData were processed with PeakView 2.0 and MarkerView 1.2. The result file from the DDA ex-periment used for the library generation was imported into PeakView with a protein FDRthreshold of 1%. Ten peptides per protein and 10 transitions per peptide were extracted fromthe SWATH files. Shared peptides were excluded as well as peptides with modifications. Pep-tides with FDR lower than 1.0% were exported in MarkerView for the t-test.
MRM analysisIn order to select tryptic peptides that are the most suitable for sensitive and selective proteindetection, MRM analysis were performed on tryptic peptides unique to the studied proteinswith length ranging from 5 to 25 amino acids. Peptides containing methionine and cysteinewere eliminated. Peptides were selected using Skyline v2.5 [20] based on peak shapeand intensity.
Fig 2. SWATH workflow. Each condition is injected separately in a DDAmode to build the spectral library and in a SWATHmode. The spectral library builtfrom the DDA runs is then used by PeakView and MarkerView to extract the peptide and the quantification information in each of the SWATH runs. BSA 1fmol and 50 fmol was spiked in each SWATH run as an internal standard.
doi:10.1371/journal.pone.0125934.g002
Evaluation of iTRAQ and SWATH-MS for Protein Quantification
PLOS ONE | DOI:10.1371/journal.pone.0125934 May 7, 2015 6 / 16
Purified synthetic peptides containing 13C6 Lys and13C6 Arg were obtained from JPT (Ger-
many) and reconstituted in 0.1% formic acid to a final concentration of 500 pmol/μL. A solu-tion containing 10 fmol/μL of each peptide was prepared from the stock solutions and used toreconstitute the samples after tryptic digestion for relative quantification. 1.25 ug of peptides (in5 ul) were analyzed on a AB SCIEX 5500QTRAP hybrid triple quadrupole/linear ion trap massspectrometer equipped with an Eksigent nanoLC AS2 cHiPLC nanoflex controlled by Analyst1.6 and with a nanospray ionization source. MS analysis was conducted in positive ion modewith an ion spray voltage of 2300V. Peptides were desalted on a 200um x 0.5 mm chip trap col-umn packed with ChromXP C18, 3 um, (Eksigent) at 2 ul/min of Solvent A (formic 0.1%) thenswitched in line at a flow rate of 300 nL/min on a 75um x 15 cm chip column packed withChromXP C18, 3 um (Eksigent) with a 20 min linear gradient from 5 to 25% of solvent B (ACN0.1% FA), then a 2 min linear gradient from 25 to 80% B, followed by a 8 min linear gradient.Nebulizer gas was set to 8 (Gas1), curtain gas to 20, heater to 150°C and declustering potential(DP) to 70 V. LC-MRM/MS analyses were performed using three transitions on two peptidesfor each of the target proteins and quantification done with MultiQuant 2.1 was based on therelative areas of the SIS and endogenous peptides. The MRM transition that gave the highestarea counts was used for the quantitation, with the other two transitions acting as qualifier tran-sitions to confirm peptide retention times and the fragment ion ratios. A blank solvent injectionwas run between biological samples to prevent sample carryover on the HPLC column and thesamples were injected in random order. Samples were analyzed in duplicate. Samples contain-ing 5 fmol of digested BSA were injected periodically in order to confirm system stability.
BioinformaticsStatistical analysis was done on the R/Bioconductor plateform [21] using R v3.0.1 and Biocon-ductor release 2.12. For the gene ontology analyses, the software packages GOstats v2.28 [22]and biomaRt v2.18 [23] were used as well as the annotation packages GO.db and org.Hs.eg.db(both at v2.10.1). The enrichment in annotations was calculated for the list of under-expressedand over-expressed proteins for every GO annotation in the three ontologies (cellular compo-nent, molecular function and biological process). The selection of the key GO terms was donefirstly on the basis of p-value of the annotation enrichment (min p-value of 1e-2), secondly onthe basis of number of differential proteins described by the GO term (minimum 2), and third-ly on the basis of the relevance of the annotation to the current study. Whereas the two firststeps are fully automated, the third step implies a manual choice guided by the context of thecurrent experiment.
Results and DiscussionIn this study, we evaluated and compared two quantitative proteomics strategies, the iTRAQlabeling technique and the label-free SWATH-MS strategy, to discover the proteins that are po-tentially associated with insulin resistance in duodenal biopsy samples from IR and IS subjects.
Protein identification and quantificationTryptic peptides of proteins extracted from duodenal biopsy samples of IS and IR patients werelabeled with the four-plex iTRAQ reagents in duplicates. After labeling, sample IR #1 was pooledwith sample IS#1 and sample IR#2 was pooled with sample IS#2 creating two replicates. Thosetwo technical replicates were treated separately for the subsequent steps according to Fig 1.
Using Protein Pilot, a total of 3886 protein groups were identified in at least one iTRAQ rep-licates with global FDR< 1% (S1 Table). Three hundred of these proteins were quantified with
Evaluation of iTRAQ and SWATH-MS for Protein Quantification
PLOS ONE | DOI:10.1371/journal.pone.0125934 May 7, 2015 7 / 16
a p-value<0.05 (S2 Table and S3 Table) as calculated by Protein Pilot based on two-tailed t-tests where the degree of freedom is equal to the number of distinct peptide minus one.
For the SWATH analysis, a spectral library of 2290 proteins was created with FDR<1% byinjecting a new set of 14 fractions with a Data Dependent Acquistion method on the 5600 tri-ple-TOF mass spectrometer (Fig 2 and S4 Table).
A SWATH experiment was performed on 6 replicates of IS and 6 of IR from which 3 sam-ples of IR and 3 of IS were spiked with BSA 1fmol and the 3 others with BSA 50 fmol (Fig 2).
The library and the 12 SWATH files were uploaded into PeakView. One thousand threehundred twenty-six proteins with at least one peptide with a FDR< 1% were exported intoMarkerView. Marker View performed t-test comparing IS and IR groups for each protein: 798proteins were quantified with p-value below 0.05 (S5 Table).
Comparison of the differentially expressed proteins between iTRAQ andSWATHIn this study, more proteins were detected by iTRAQ than in the SWATH experiment sincethe iTRAQ protein identifications came from the two replicates of 14 fractions whereas theSWATH library was created using 14 fractions. In order to increase the SWATH library, theiTRAQ dataset was used to build the SWATH library by using a conversion option designedfor this in the PeakView software. Unfortunately, we observed that the peptides detected fromthe iTRAQ experiment often produced ions of higher charge state than the same peptide froma non-labeled experiment and were not the ones giving the best signals in the SWATH experi-ment. This probably explains why using the data from the iTRAQ experiment as a library forSWATH produced sub-optimal results. To increase the size of the SWATH library, more injec-tions from duodenal extract would be needed.
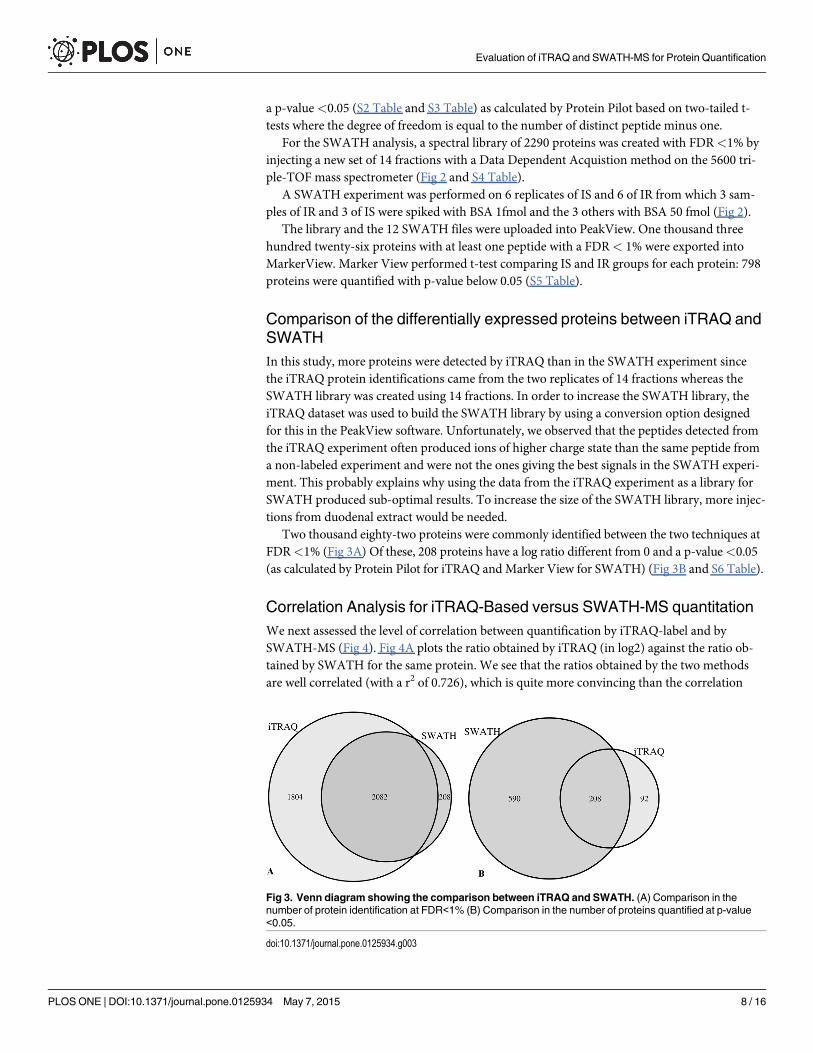
Two thousand eighty-two proteins were commonly identified between the two techniques atFDR<1% (Fig 3A) Of these, 208 proteins have a log ratio different from 0 and a p-value<0.05(as calculated by Protein Pilot for iTRAQ and Marker View for SWATH) (Fig 3B and S6 Table).
Correlation Analysis for iTRAQ-Based versus SWATH-MS quantitationWe next assessed the level of correlation between quantification by iTRAQ-label and bySWATH-MS (Fig 4). Fig 4A plots the ratio obtained by iTRAQ (in log2) against the ratio ob-tained by SWATH for the same protein. We see that the ratios obtained by the two methodsare well correlated (with a r2 of 0.726), which is quite more convincing than the correlation
Fig 3. Venn diagram showing the comparison between iTRAQ and SWATH. (A) Comparison in thenumber of protein identification at FDR<1% (B) Comparison in the number of proteins quantified at p-value<0.05.
doi:10.1371/journal.pone.0125934.g003
Evaluation of iTRAQ and SWATH-MS for Protein Quantification
PLOS ONE | DOI:10.1371/journal.pone.0125934 May 7, 2015 8 / 16
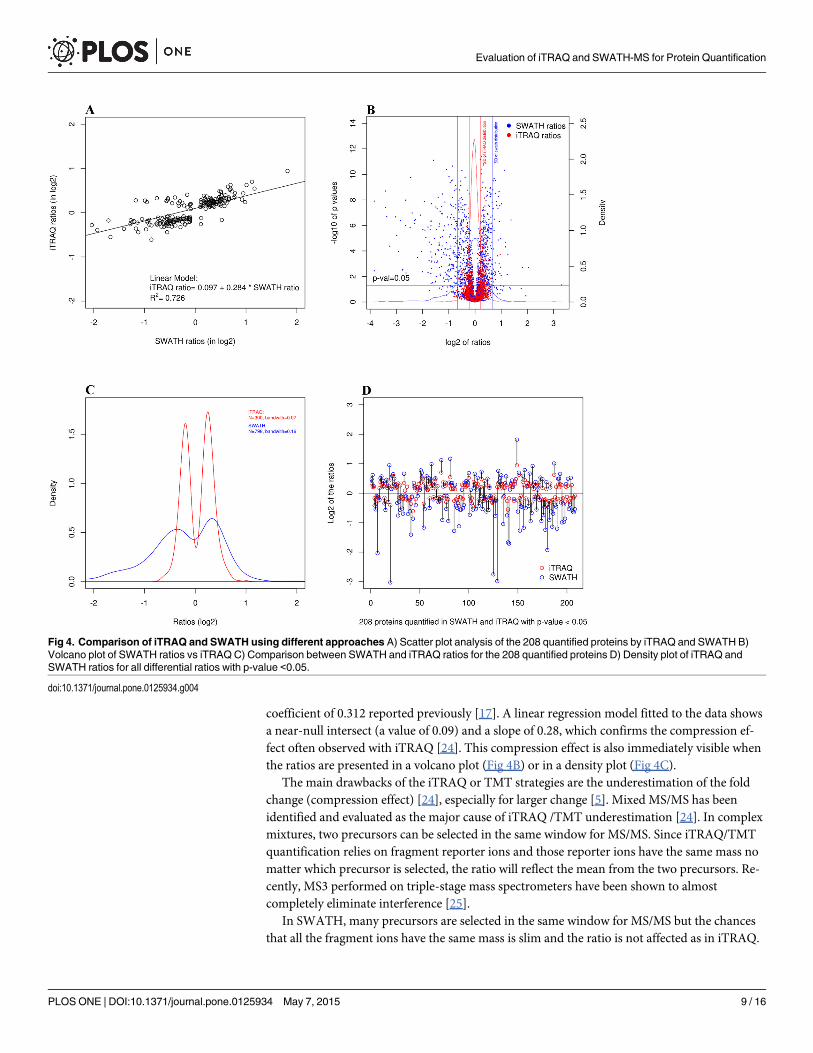
coefficient of 0.312 reported previously [17]. A linear regression model fitted to the data showsa near-null intersect (a value of 0.09) and a slope of 0.28, which confirms the compression ef-fect often observed with iTRAQ [24]. This compression effect is also immediately visible whenthe ratios are presented in a volcano plot (Fig 4B) or in a density plot (Fig 4C).
The main drawbacks of the iTRAQ or TMT strategies are the underestimation of the foldchange (compression effect) [24], especially for larger change [5]. Mixed MS/MS has beenidentified and evaluated as the major cause of iTRAQ /TMT underestimation [24]. In complexmixtures, two precursors can be selected in the same window for MS/MS. Since iTRAQ/TMTquantification relies on fragment reporter ions and those reporter ions have the same mass nomatter which precursor is selected, the ratio will reflect the mean from the two precursors. Re-cently, MS3 performed on triple-stage mass spectrometers have been shown to almostcompletely eliminate interference [25].
In SWATH, many precursors are selected in the same window for MS/MS but the chancesthat all the fragment ions have the same mass is slim and the ratio is not affected as in iTRAQ.
Fig 4. Comparison of iTRAQ and SWATH using different approaches A) Scatter plot analysis of the 208 quantified proteins by iTRAQ and SWATH B)Volcano plot of SWATH ratios vs iTRAQ C) Comparison between SWATH and iTRAQ ratios for the 208 quantified proteins D) Density plot of iTRAQ andSWATH ratios for all differential ratios with p-value <0.05.
doi:10.1371/journal.pone.0125934.g004
Evaluation of iTRAQ and SWATH-MS for Protein Quantification
PLOS ONE | DOI:10.1371/journal.pone.0125934 May 7, 2015 9 / 16
Since quantification experiments often produce a classification into ‘over-expressed’ and‘under-expressed’ lists, the direction of the fold-change is especially important. Indeed, a largedifference in quantitation of log2 ratio of 0.5 and 3 (corresponding to ‘fold changes’ of 1.4 and8 respectively) will have little impact on downstream gene-ontology and pathway analyses. Buta comparatively smaller difference in quantitation between reported log2 ratios of -0.4 and 0.4will have important implications for downstream analyses. Our results show that iTRAQ andSWATH agree on the ‘direction’ of the fold change over 92% of the time when differential ra-tios are chosen solely on the basis of a t-test p-value threshold. (See Fig 4D for a representationof the data that makes the changes in ‘fold change direction’ easy to notice). But the proportionof agreement on the change ‘direction’ between the two methods increases meaningfully if weuse a value threshold in addition to the t-test to determine which ratios are ‘differential’. Tochoose this threshold, we fitted a normal distribution on the data and used 1 standard deviationas the value threshold for a ratio to be deemed differential. This meant that the absolute valueof the log2 ratios had to be superior to 0.66 for SWATH and superior to 0.23 for iTRAQ. Usingthis 1 standard deviation value threshold, the agreement on the ‘direction of the change’ be-tween iTRAQ and SWATH climbed over 98%.
It should be noted that SWATH seems to have a higher precision than iTRAQ since for thesame p-value threshold SWATH reports differential ratios that are closer to 0 (see the areaaround 0 in Fig 4D). This has the surprising effect that SWATH reports more proteins to bedifferential than iTRAQ even though the SWATH experiment was based on a library com-posed of 30% less proteins than the number of proteins identified in the iTRAQ experiment.Our hypothesis about this phenomenon is that the increased statistical power of the SWATHmethod might come from an increased number of measure points used and a smaller variancebetween these measures. SWATH can use more measures than iTRAQ since for a given identi-fied ms2 spectrum, the SWATHmethod allows many peaks (i.e. many measure points) to beused for the quantitation, whereas the iTRAQ method can use only one pair of peaks to com-pare two conditions. Furthermore, the SWATH quantitation will not be based on every possi-ble measure points from a given spectrum, but on the X best ones (where X is determined bythe user, and where ‘best’ is determined mainly by the intensity of the peaks). The fact that apossible measure point might not be used in the SWATHmethod based on a quality criteriawhereas the iTRAQmethod necessarily use its only measure might provide an advantage instatistical power to SWATH. With increasingly small ratios being statistically significant, it be-comes evident that statistical significance can be very different from biological meaningfulness.This is why we recommend the use of two criteria: a criterion for the statistical significance(the p-value), and a criterion for biological meaningfulness (for example a threshold based onthe distribution of the observed ratios).
To evaluate the compression effect of the SWATH quantitation, we spiked a bovine serumalbumin digest into both conditions (IR and IS). 1fmol of BSA digest was spiked into 3 repli-cates of IS and 3 replicates of IR and 50 fmol of BSA was spiked in 3 other replicates of IS andIR. The SWATH experiment reported ratio values of 29.5 +/- 5 (mean +/- SD for the three rep-licates) (S1 Fig). This shows a small compression effect, since we expected a ratio of 50, but thiscompression effect is far less important than the one seen in iTRAQ [24]. Indeed, in a previousABRF study (Association of Biomolecular Research Facility [26], myoglobin was spiked in a E.coli cell lysate at a real 10 fold ratio and the iTRAQ technique reported a ratio of 2.5.
Gene ontology analysisWe used the proteins reported as differentially expressed by both the iTRAQ and SWATH ex-periments and performed Gene Ontology analysis using the three main ontologies (Cellular
Evaluation of iTRAQ and SWATH-MS for Protein Quantification
PLOS ONE | DOI:10.1371/journal.pone.0125934 May 7, 2015 10 / 16
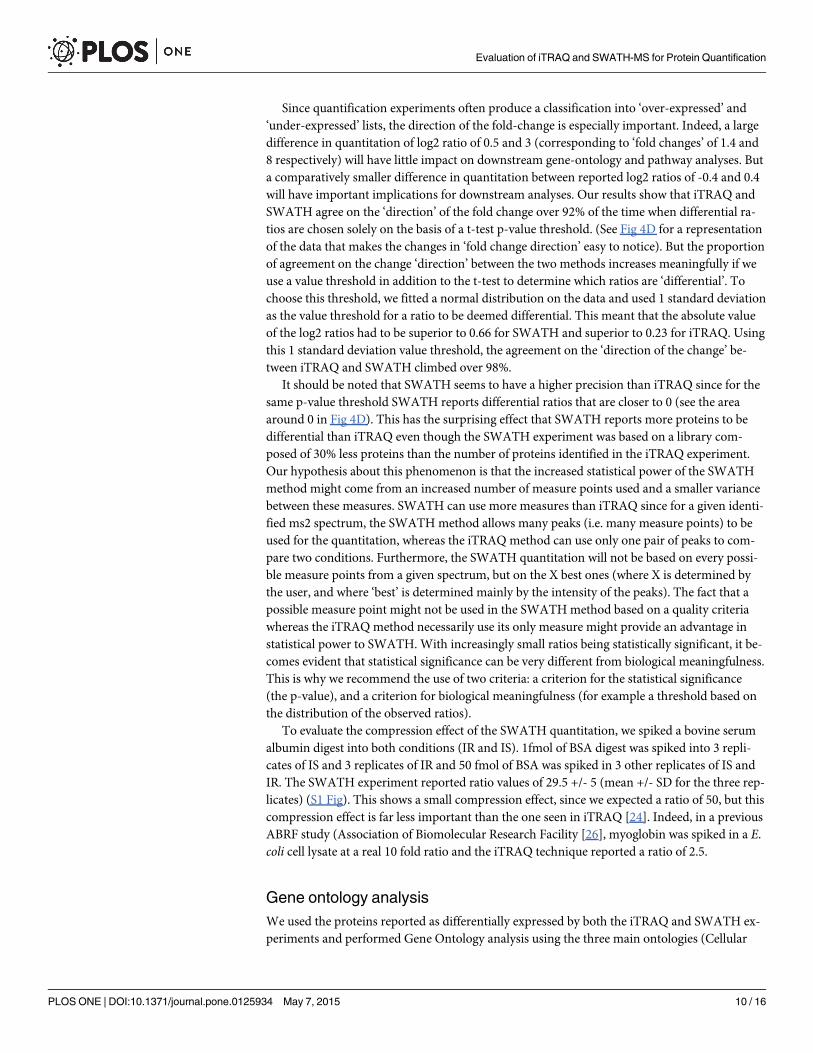
Component, Biological Process and Molecular Function). We found that proteins from theunder-expressed list were far more likely to be associated with metabolic process and oxydo-re-duction process than a random selection of proteins (p-values of 3e-5 and 7e-5 respectively)(Fig 5). It was previously demonstrated in a gene expression study that insulin resistance is as-sociated with reduced expression of multiple genes encoding key enzymes in oxidative metabo-lism and mitochondrial function in skeletal muscle [27]. Our results in the duodenum seems tocorrelate with the one obtained in the skeletal muscle. We also found that many overexpressedproteins are related to the actin cytoskeleton (p-value for the overrepresentation of 1e-3). Thisis interesting in the present context given the documented role of the actin cytoskeleton in theregulation of insulin signals [28].
Confirmation of protein expressionOne of the objectives of the study was to find regulated proteins associated with insulin resis-tance and lipid metabolism, Fig 6 shows the results for 10 chosen proteins. Four proteins werefurther assessed using MRM, which provides a more accurate measure of peptide abundance.The four proteins validated by MRM confirmed the iTRAQ and SWATH results. Unfortunate-ly, due to lack of material, MRM results were not obtained for the other proteins.
However, one can observe that the ratio difference is greater in the MRM targeted experimentthan in the SWATH and iTRAQ experiments. As discussed earlier, it is due to the compressioneffect observed with iTRAQ [24] and to some extent with SWATH (as the compression offect
Fig 5. Functional analyses. Bioinformatic analyses reveal that proteins involved in lipid metabolic processand oxydation-reduction processed are mostly underexpressed in insulin resistant patients.
doi:10.1371/journal.pone.0125934.g005
Evaluation of iTRAQ and SWATH-MS for Protein Quantification
PLOS ONE | DOI:10.1371/journal.pone.0125934 May 7, 2015 11 / 16
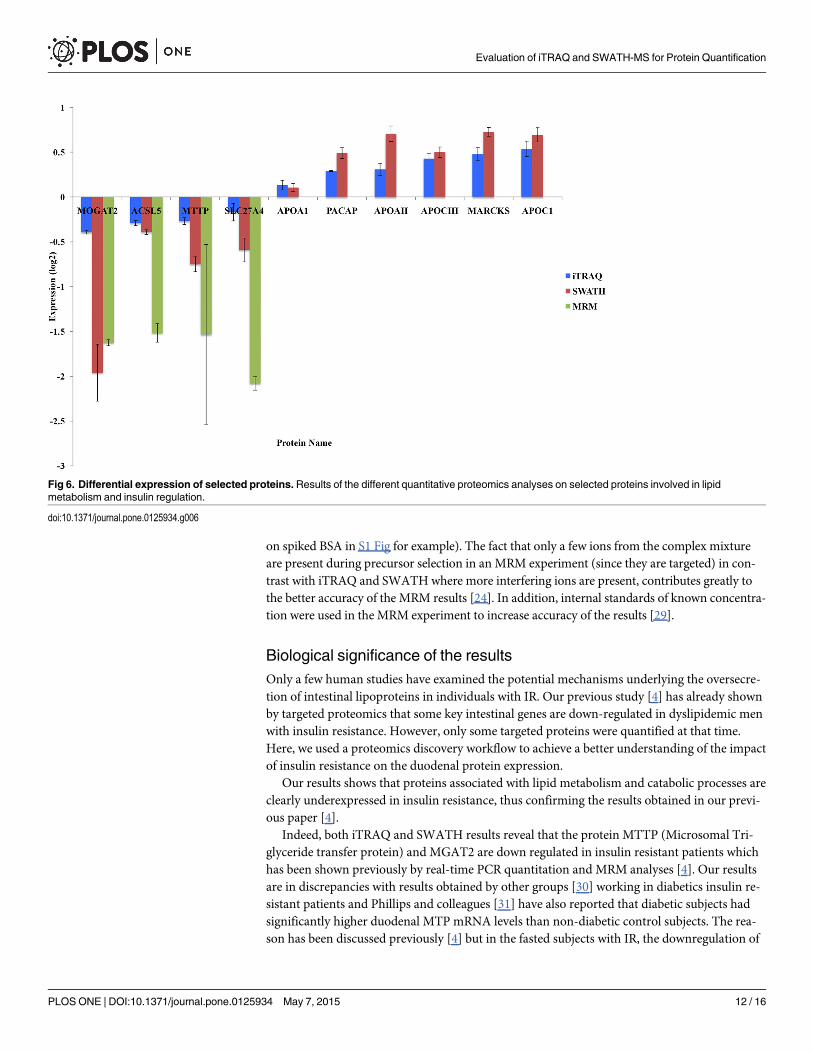
on spiked BSA in S1 Fig for example). The fact that only a few ions from the complex mixtureare present during precursor selection in an MRM experiment (since they are targeted) in con-trast with iTRAQ and SWATHwhere more interfering ions are present, contributes greatly tothe better accuracy of the MRM results [24]. In addition, internal standards of known concentra-tion were used in the MRM experiment to increase accuracy of the results [29].
Biological significance of the resultsOnly a few human studies have examined the potential mechanisms underlying the oversecre-tion of intestinal lipoproteins in individuals with IR. Our previous study [4] has already shownby targeted proteomics that some key intestinal genes are down-regulated in dyslipidemic menwith insulin resistance. However, only some targeted proteins were quantified at that time.Here, we used a proteomics discovery workflow to achieve a better understanding of the impactof insulin resistance on the duodenal protein expression.
Our results shows that proteins associated with lipid metabolism and catabolic processes areclearly underexpressed in insulin resistance, thus confirming the results obtained in our previ-ous paper [4].
Indeed, both iTRAQ and SWATH results reveal that the protein MTTP (Microsomal Tri-glyceride transfer protein) and MGAT2 are down regulated in insulin resistant patients whichhas been shown previously by real-time PCR quantitation and MRM analyses [4]. Our resultsare in discrepancies with results obtained by other groups [30] working in diabetics insulin re-sistant patients and Phillips and colleagues [31] have also reported that diabetic subjects hadsignificantly higher duodenal MTP mRNA levels than non-diabetic control subjects. The rea-son has been discussed previously [4] but in the fasted subjects with IR, the downregulation of
Fig 6. Differential expression of selected proteins.Results of the different quantitative proteomics analyses on selected proteins involved in lipidmetabolism and insulin regulation.
doi:10.1371/journal.pone.0125934.g006
Evaluation of iTRAQ and SWATH-MS for Protein Quantification
PLOS ONE | DOI:10.1371/journal.pone.0125934 May 7, 2015 12 / 16
intestinal MTP could be related to a greater inhibitory effect of insulin, whereas the oversecre-tion of intestinal lipoproteins observed in the constantly fed subjects with IR could reflect thefact that other factors, such as dietary lipid availability, are more important than the inhibitoryeffect of hyperinsulinism in determining MTP expression and lipoprotein secretion rates fromthe intestine.
ACSL5 expression was also decreased in IR (Fig 6). It has been previously shown [32] thatASCL5 is a target gene for SREBP-1c which is a transcription factor regulating the synthesis ofsterols and that the mRNA expression of ACSL5 was decreased in diabetic animals. Our resultsconfirms that ACSL5 seems to play a role in the response to insulin stimulus.
On the other hand, an increase in MARCKS levels (Fig 6), a protein which is involved in theregulation of insulin secretion is also observed in IR patients by both SWATH and iTRAQ. Ithas been previously shown [33] that insulin regulates MARCKS phosphorylation so there maybe a link between insulin resistance and the level of unphosphorylated MARCKS.
The protein plasma cell-induced resident endoplasmic reticulum protein (also namedPACAP) was found to be over-expressed in IR patients (Fig 6). It may have a role in the onsetof insulin resistance. It has been found that MEDA-7 secreted protein (which is a protein iso-mer of PACAP) was able to decrease insulin-dependent glucose uptake in 3T3-L1 cells. The au-thors suggested that, Meda-7 upregulation could contribute to the progression of insulinresistance in adipose tissue [34].
ConclusionsBy using 2 different quantitative approaches, this study have shown that insulin resistance af-fects the proteins involved in lipid metabolism. A comparison of proteomics quantitationusing iTRAQ and SWATHmethods was presented. It was shown that results from both meth-ods can have a high degree of correlation both in terms of actual quantitation and in terms ofthe ‘direction’ of the fold change. The methods also appear to have complementary aspects: fora given instrument time, the iTRAQ experiment will provide more protein identifications;however, the SWATH experiment can identify more differential ratios, being both more sensi-tive in the detection of small differential ratios and being able to cover a larger dynamic range.The differential proteins identified both confirm previous experiments (for example, the rolesof MTTP, MGAT2 and ACSL5), and raises interesting new hypothesis, as with MARCKS andPACAP. Proteins of relevance to IR were mostly associated with metabolic and oxydo-reduc-tion process and were found using both iTRAQ and SWATH-MS. These data also showed thatSWATH-MS is a promising and compelling alternative to iTRAQ for protein quantitation ofcomplex mixtures.
Supporting InformationS1 Fig. SWATH BSA response in the 12 samples.(TIFF)
S1 Table. The 3886 proteins identified by iTRAQ with FDR< 1%.(XLS)
S2 Table. The iTRAQ quantitative results from replicate one.(XLSX)
S3 Table. The iTRAQ quantitative results from replicate two.(XLSX)
Evaluation of iTRAQ and SWATH-MS for Protein Quantification
PLOS ONE | DOI:10.1371/journal.pone.0125934 May 7, 2015 13 / 16
S4 Table. The 2290 proteins identified in the SWATH library with FDR< 1%.(XLS)
S5 Table. The SWATH quantitative results.(XLS)
S6 Table. The quantitative results from the 208 common proteins between iTRAQ andSWATH with p-value< 0.05.(XLS)
AcknowledgmentsThe authors thank Brigitte Simons for helpful discussion on SWATH-MS and Joana Hunterfor revision of the manuscript. Benoît Lamarche leads the Chair on Nutrition at LavalUniversity.
Author ContributionsConceived and designed the experiments: SB BN IK AT VL BL PC AD. Performed the experi-ments: SB BN IK AT VL. Analyzed the data: SB FF BN IK. Contributed reagents/materials/analysis tools: SB FF BN IK BL PC AD. Wrote the paper: SB FF BN IK BL PC AD.
References1. Ginsberg HN. Insulin resistance and cardiovascular disease. J Clin Invest. 2000; 106(4):453–8. doi: 10.
1172/JCI10762 PMID: 10953019; PubMed Central PMCID: PMC380256.
2. Lally S, Owens D, Tomkin GH. The different effect of pioglitazone as compared to insulin on expressionof hepatic and intestinal genes regulating post-prandial lipoproteins in diabetes. Atherosclerosis. 2007;193(2):343–51. doi: 10.1016/j.atherosclerosis.2006.09.031 PMID: 17109865.
3. Lally S, Owens D, Tomkin GH. Genes that affect cholesterol synthesis, cholesterol absorption, and chy-lomicron assembly: the relationship between the liver and intestine in control and streptozotosin diabet-ic rats. Metabolism. 2007; 56(3):430–8. doi: 10.1016/j.metabol.2006.10.028 PMID: 17292734.
4. Couture P, Tremblay AJ, Kelly I, Lemelin V, Droit A, Lamarche B. Key intestinal genes involved in lipo-protein metabolism are downregulated in dyslipidemic men with insulin resistance. J Lipid Res. 2014;55(1):128–37. doi: 10.1194/jlr.M040071 PMID: 24142110; PubMed Central PMCID: PMC3927480.
5. Evans C, Noirel J, Ow SY, Salim M, Pereira-Medrano AG, Couto N, et al. An insight into iTRAQ: wheredo we stand now? Anal Bioanal Chem. 2012; 404(4):1011–27. doi: 10.1007/s00216-012-5918-6 PMID:22451173.
6. Law KP, Lim YP. Recent advances in mass spectrometry: data independent analysis and hyper reac-tion monitoring. Expert Rev Proteomics. 2013; 10(6):551–66. doi: 10.1586/14789450.2013.858022PMID: 24206228.
7. Liu NQ, Dekker LJ, Stingl C, Guzel C, De Marchi T, Martens JW, et al. Quantitative proteomic analysisof microdissected breast cancer tissues: comparison of label-free and SILAC-based quantification withshotgun, directed, and targeted MS approaches. Journal of proteome research. 2013; 12(10):4627–41.doi: 10.1021/pr4005794 PMID: 23957277.
8. Patel VJ, Thalassinos K, Slade SE, Connolly JB, Crombie A, Murrell JC, et al. A comparison of labelingand label-free mass spectrometry-based proteomics approaches. Journal of proteome research. 2009;8(7):3752–9. doi: 10.1021/pr900080y PMID: 19435289.
9. Trinh HV, Grossmann J, Gehrig P, Roschitzki B, Schlapbach R, Greber UF, et al. iTRAQ-Based andLabel-Free Proteomics Approaches for Studies of Human Adenovirus Infections. Int J Proteomics.2013; 2013:581862. doi: 10.1155/2013/581862 PMID: 23555056; PubMed Central PMCID:PMC3608280.
10. Wang H, Alvarez S, Hicks LM. Comprehensive comparison of iTRAQ and label-free LC-based quantita-tive proteomics approaches using two Chlamydomonas reinhardtii strains of interest for biofuels engi-neering. Journal of proteome research. 2012; 11(1):487–501. doi: 10.1021/pr2008225 PMID:22059437.
11. Chelius D, Bondarenko PV. Quantitative profiling of proteins in complex mixtures using liquid chroma-tography and mass spectrometry. Journal of proteome research. 2002; 1(4):317–23. PMID: 12645887.
Evaluation of iTRAQ and SWATH-MS for Protein Quantification
PLOS ONE | DOI:10.1371/journal.pone.0125934 May 7, 2015 14 / 16
12. Liu H, Sadygov RG, Yates JR 3rd. A model for random sampling and estimation of relative proteinabundance in shotgun proteomics. Analytical chemistry. 2004; 76(14):4193–201. doi: 10.1021/ac0498563 PMID: 15253663.
13. Megger DA, Bracht T, Meyer HE, Sitek B. Label-free quantification in clinical proteomics. Biochimica etbiophysica acta. 2013; 1834(8):1581–90. doi: 10.1016/j.bbapap.2013.04.001 PMID: 23567906.
14. Michalski A, Cox J, Mann M. More than 100,000 detectable peptide species elute in single shotgun pro-teomics runs but the majority is inaccessible to data-dependent LC-MS/MS. Journal of proteome re-search. 2011; 10(4):1785–93. doi: 10.1021/pr101060v PMID: 21309581.
15. Gillet LC, Navarro P, Tate S, Rost H, Selevsek N, Reiter L, et al. Targeted data extraction of the MS/MSspectra generated by data-independent acquisition: a new concept for consistent and accurate prote-ome analysis. Molecular & cellular proteomics: MCP. 2012; 11(6):O111 016717. doi: 10.1074/mcp.O111.016717 PMID: 22261725; PubMed Central PMCID: PMC3433915.
16. Lambert JP, Ivosev G, Couzens AL, Larsen B, Taipale M, Lin ZY, et al. Mapping differential interac-tomes by affinity purification coupled with data-independent mass spectrometry acquisition. Nat Meth-ods. 2013; 10(12):1239–45. doi: 10.1038/nmeth.2702 PMID: 24162924; PubMed Central PMCID:PMC3882083.
17. Zhang F, Lin H, Gu A, Li J, Liu L, Yu T, et al. SWATH- and iTRAQ-based quantitative proteomic analy-ses reveal an overexpression and biological relevance of CD109 in advanced NSCLC. J Proteomics.2014; 102:125–36. doi: 10.1016/j.jprot.2014.03.007 PMID: 24667143.
18. Shilov IV, Seymour SL, Patel AA, Loboda A, TangWH, Keating SP, et al. The Paragon Algorithm, anext generation search engine that uses sequence temperature values and feature probabilities toidentify peptides from tandemmass spectra. Molecular & cellular proteomics: MCP. 2007; 6(9):1638–55. doi: 10.1074/mcp.T600050-MCP200 PMID: 17533153.
19. TangWH, Shilov IV, Seymour SL. Nonlinear fitting method for determining local false discovery ratesfrom decoy database searches. Journal of proteome research. 2008; 7(9):3661–7. doi: 10.1021/pr070492f PMID: 18700793.
20. MacLean B, Tomazela DM, Shulman N, Chambers M, Finney GL, Frewen B, et al. Skyline: an opensource document editor for creating and analyzing targeted proteomics experiments. Bioinformatics.2010; 26(7):966–8. doi: 10.1093/bioinformatics/btq054 PMID: 20147306; PubMed Central PMCID:PMC2844992.
21. Gentleman RC, Carey VJ, Bates DM, Bolstad B, Dettling M, Dudoit S, et al. Bioconductor: open soft-ware development for computational biology and bioinformatics. Genome Biol. 2004; 5(10):R80. doi:10.1186/gb-2004-5-10-r80 PMID: 15461798; PubMed Central PMCID: PMC545600.
22. Falcon S, Gentleman R. Using GOstats to test gene lists for GO term association. Bioinformatics. 2007;23(2):257–8. doi: 10.1093/bioinformatics/btl567 PMID: 17098774.
23. Durinck S, Spellman PT, Birney E, Huber W. Mapping identifiers for the integration of genomic datasetswith the R/Bioconductor package biomaRt. Nat Protoc. 2009; 4(8):1184–91. doi: 10.1038/nprot.2009.97 PMID: 19617889; PubMed Central PMCID: PMC3159387.
24. Ow SY, Salim M, Noirel J, Evans C, Rehman I, Wright PC. iTRAQ underestimation in simple and com-plex mixtures: "the good, the bad and the ugly". Journal of proteome research. 2009; 8(11):5347–55.doi: 10.1021/pr900634c PMID: 19754192.
25. Ting L, Rad R, Gygi SP, HaasW. MS3 eliminates ratio distortion in isobaric multiplexed quantitativeproteomics. Nat Methods. 2011; 8(11):937–40. doi: 10.1038/nmeth.1714 PMID: 21963607; PubMedCentral PMCID: PMC3205343.
26. Falick AM, LaneWS, Lilley KS, MacCoss MJ, Phinney BS, Sherman NE, et al. ABRF-PRG07: ad-vanced quantitative proteomics study. J Biomol Tech. 2011; 22(1):21–6. PMID: 21455478; PubMedCentral PMCID: PMC3059538.
27. Patti ME, Butte AJ, Crunkhorn S, Cusi K, Berria R, Kashyap S, et al. Coordinated reduction of genes ofoxidative metabolism in humans with insulin resistance and diabetes: Potential role of PGC1 andNRF1. Proceedings of the National Academy of Sciences of the United States of America. 2003; 100(14):8466–71. doi: 10.1073/pnas.1032913100 PMID: 12832613; PubMed Central PMCID:PMC166252.
28. Tsakiridis T, Tong P, Matthews B, Tsiani E, Bilan PJ, Klip A, et al. Role of the actin cytoskeleton in insu-lin action. Microsc Res Tech. 1999; 47(2):79–92. doi: 10.1002/(SICI)1097-0029(19991015)47:2<79::AID-JEMT1>3.0.CO;2-S PMID: 10523787.
29. Kuzyk MA, Smith D, Yang J, Cross TJ, Jackson AM, Hardie DB, et al. Multiple reaction monitoring-based, multiplexed, absolute quantitation of 45 proteins in human plasma. Molecular & cellular proteo-mics: MCP. 2009; 8(8):1860–77. doi: 10.1074/mcp.M800540-MCP200 PMID: 19411661; PubMedCentral PMCID: PMC2722777.
Evaluation of iTRAQ and SWATH-MS for Protein Quantification
PLOS ONE | DOI:10.1371/journal.pone.0125934 May 7, 2015 15 / 16
30. Veilleux A, Grenier E, Marceau P, Carpentier AC, Richard D, Levy E. Intestinal lipid handling: evidenceand implication of insulin signaling abnormalities in human obese subjects. Arterioscler Thromb VascBiol. 2014; 34(3):644–53. doi: 10.1161/ATVBAHA.113.302993 PMID: 24407032.
31. Phillips C, Mullan K, Owens D, Tomkin GH. Intestinal microsomal triglyceride transfer protein in type 2diabetic and non-diabetic subjects: the relationship to triglyceride-rich postprandial lipoprotein composi-tion. Atherosclerosis. 2006; 187(1):57–64. doi: 10.1016/j.atherosclerosis.2005.08.020 PMID:16183064.
32. Achouri Y, Hegarty BD, Allanic D, Becard D, Hainault I, Ferre P, et al. Long chain fatty acyl-CoA synthe-tase 5 expression is induced by insulin and glucose: involvement of sterol regulatory element-bindingprotein-1c. Biochimie. 2005; 87(12):1149–55. doi: 10.1016/j.biochi.2005.04.015 PMID: 16198472.
33. Arnold TP, Standaert ML, Hernandez H, Watson J, Mischak H, Kazanietz MG, et al. Effects of insulinand phorbol esters on MARCKS (myristoylated alanine-rich C-kinase substrate) phosphorylation (andother parameters of protein kinase C activation) in rat adipocytes, rat soleus muscle and BC3H-1 myo-cytes. Biochem J. 1993; 295 (Pt 1):155–64. PMID: 8216211; PubMed Central PMCID: PMC1134832.
34. Zhang H, Chen X, SairamMR. Novel hormone-regulated genes in visceral adipose tissue: cloning andidentification of proinflammatory cytokine-like mouse and human MEDA-7: implications for obesity, in-sulin resistance and the metabolic syndrome. Diabetologia. 2011; 54(9):2368–80. doi: 10.1007/s00125-011-2212-7 PMID: 21688198.
Evaluation of iTRAQ and SWATH-MS for Protein Quantification
PLOS ONE | DOI:10.1371/journal.pone.0125934 May 7, 2015 16 / 16