Embed Size (px)
Citation preview

Evaluation of mental stress during cognitive activities through HRV data and kinesics study
Yao Tang
A Thesis
In
The Department
Of
Electrical and Computer Engineering
Presented in Partial Fulfillment of the Requirements
for the Degree of Master of Applied Science at
Concordia University
Montreal, Quebec, Canada
August 2009
© Yao Tang, 2009

1*1 Library and Archives Canada
Published Heritage Branch
395 Wellington Street OttawaONK1A0N4 Canada
Bibliotheque et Archives Canada
Direction du Patrimoine de I'edition
395, rue Wellington OttawaONK1A0N4 Canada
Your file Votre reference ISBN: 978-0-494-63155-3 Our file Notre reference ISBN: 978-0-494-63155-3
NOTICE:
The author has granted a nonexclusive license allowing Library and Archives Canada to reproduce, publish, archive, preserve, conserve, communicate to the public by telecommunication or on the Internet, loan, distribute and sell theses worldwide, for commercial or noncommercial purposes, in microform, paper, electronic and/or any other formats.
AVIS:
L'auteur a accorde une licence non exclusive permettant a la Bibliotheque et Archives Canada de reproduire, publier, archiver, sauvegarder, conserver, transmettre au public par telecommunication ou par I'lntemet, prefer, distribuer et vendre des theses partout dans le monde, a des fins commerciales ou autres, sur support microforme, papier, electronique et/ou autres formats.
The author retains copyright ownership and moral rights in this thesis. Neither the thesis nor substantial extracts from it may be printed or otherwise reproduced without the author's permission.
L'auteur conserve la propriete du droit d'auteur et des droits moraux qui protege cette these. Ni la these ni des extraits substantiels de celle-ci ne doivent etre imprimes ou autrement reproduits sans son autorisation.
In compliance with the Canadian Privacy Act some supporting forms may have been removed from this thesis.
Conformement a la loi canadienne sur la protection de la vie privee, quelques formulaires secondaires ont ete enleves de cette these.
While these forms may be included in the document page count, their removal does not represent any loss of content from the thesis.
Bien que ces formulaires aient inclus dans la pagination, il n'y aura aucun contenu manquant.
• + •
Canada

CONCORDIA UNIVERSITY School of Graduate Studies
This is to certify that the thesis prepared
By: Yao Tang I.D. 5835526
Entitled: "Evaluation of mental stress during cognitive activities through HRV data and
kinesics study"
and submitted in partial fulfillment of the requirements for the degree of
Master of Applied Science
complies with the regulations of the University and meets the accepted standards with
respect to originality and quality.
Signed by the final examining committee:
Chair
Examiner
Examiner
Supervisor
Approved by
Chair of Department or Graduate Program Director
Dean of Faculty
Date

ABSTRACT
Evaluation of mental stress during cognitive activities through HRV data and
kinesics study
Yao Tang
Many studies have been conducted to test and improve existing design methods,
which can be used for engineering production and development. In order to improve the
usability of design methods, the present thesis proposes a new approach to quantify the
human mental stresses during the design activities. Two sets of experiments are
implemented for this study. Kinesics analysis is used to quantify the designer's mental
stresses during the design activities. Meanwhile, heart rate variability (HRV) analysis has
been performed to verify the results from kinesics study.
The present thesis initiates the research that employs the kinesics study in the
quantification of the mental stresses.
in

ACKNOWLEDGMENTS
The author would like to express her sincere gratitude to her supervisor, Dr. Yong
Zeng, for his invaluable guidance, advice, friendship and financial support throughout the
course of this study.
The author would like to thank Dr. Shengji Yao and Thanh An Nguyen for their
assistance of the performance of protocol experiment and software programming. The
author is also appreciating the helpful discussion and suggestion from her colleagues in
the Design Laboratory.
Last but not least, the author is very grateful towards her parents whose constant
support made it possible to finish the project.
IV

TABLE OF CONTENTS
LIST OF FIGURES vn
LIST OF TABLES ix
LIST OF ACRONYMS x
CHAPTER 1 1 INTRODUCTION 1
1.1 OBJECTIVE 1 1.2 BACKGROUND AND APPLICATION 2 1.3 PROBLEMS 4 1.4 THESIS OUTLINE 5
CHAPTER 2 6 LITERATURE REVIEW 6
2.1 MENTAL STRESS 6 2.2 BODY LANGUAGE (KINESICS STUDY) 9 2.3 HEART RATE VARIABILITY (HRV) 11
2.3.1 INTRODUCTION 11 2.3.2 HISTORY 12
CHAPTER 3 15 KINESICS ANALYSIS 15
3.1 INTRODUCTION 15 3.2 METHOD 16
3.2.1 SELECTION OF PARTICIPANTS 17 3.2.2 MATERIALS 18 3.2.3 COGNITIVE ACTIVITIES DESIGN AND PROCEDURE 19 3.2.4 SEGMENTATION AND ANALYSIS METHOD 21 3.2.5 ANALYSIS METHOD 23
3.3 RESULT 25
CHAPTER 4 29 MENTAL STRESS ANALYSIS DURING COGNITIVE ACTIVITIES 29
4.1 INTRODUCTION 30 4.2 METHOD 31
4.2.1 TIME DOMAIN ANALYSIS 31 4.2.2 FREQUENCY DOMAIN ANALYSIS 33 4.2.3 NONLINEAR METHODS 34 4.2.4 SELECTION OF PARTICIPANTS 35 4.2.5 MATERIALS 36 4.2.6 COGNITIVE ACTIVITIES DESIGN AND PROCEDURE 37
4.3 RESULT 38
CHAPTERS 39 RESULT AND CONCLUSION 39
5.1 RESULT OF KINESICS ANALYSIS AND HRV ANALYSIS 39 5.1.1 ACCURACY, DIFFICULTY RATIO AND ELAPSED TIME ANALYSIS 39 5.1.2 HRV ANALYSIS 46 5.1.3 KINESICS ANALYSIS 49
v

5.2 CONCLUSIONS 55 5.3 DISCUSSION 56
5.3.1 CULTURE AND INDIVIDUAL DIFFERENCES 56 5.3.2 NUMBER OF PARTICIPANTS 56 5.3.3 HEALTH CONDITION OF PARTICIPANTS 57
5.4 SUMMARY OF CONTRIBUTIONS 58 5.5 FUTURE RESEARCH 59
REFERENCES 61
vi

LIST OF FIGURES
Figure 1. The human function curve [5] 2
Figure 2, Thesis organization 5
Figure 3. Structure of the mental stress evaluation system 17
Figure 4. Experiment set-up. 1 18
Figure 5. Design problem 18
Figure 6. Design sketches: examples 21
Figure 7. Evolution of the design process 22
Figure 8. Evaluation result of participant's mental stress 28
Figure 9. A data slot ofRR interval 32
Figure 10. NN interval & RMSSD 32
Figure 11. Poincare plot of a normal subject 35
Figure 12. Experiment set-up.2 37
Figure 13. (left) CWT accuracy variation of participant 1 38
Figure 14. (right) Difficulty ratio variation of participant 1 38
Figure 15. Elapsed time variation of participant 1 38
Figure 16. (left) CWT accuracy variation of participant 1 39
Figure 17. (right) Difficulty ratio variation of participant 1 39
Figure 18. (left) Elapsed time variation of participant 1 40
Figure 19. (right) CWT accuracy variation of participant 2 40
Figure 20. (left) Difficulty ratio variation of participant 2 40
Figure 21. (right) Elapsed time variation of participant 2 40
Figure 22. (left) CWT accuracy variation of participant 3 41
Figure 23. (right) Difficulty ratio variation of participant 3 41
Figure 24. (left) Elapsed time variation of participant 3 41
Figure 25. (right) CWT accuracy variation of participant 4 41
vii

Figure 26. (left) Difficulty ratio variation of participant 4 42
Figure 27. (right) Elapsed time variation of participant 4 42
Figure 28. (left) CWI'accuracy variation of participant 5 42
Figure 29. (right) Difficulty ratio variation of participant 5 42
Figure 30. Elapsed time variation of participant 5 43
Figure 31. (a) CWT accuracy variation; (b) Difficulty ratio variation; 44
Figure 32. Poincare plot of participant 3 during pre-test (left) and test (right) sections 49
Figure 33. Mental stress variation of participants during design experiment 50
Figure 34. Kinesics analysis of participant 1 52
Figure 35. Kinesics analysis of participant 2 53
Figure 36. Kinesics analysis of participant 3 53
Figure 37. Kinesics analysis of participant 4 53
Figure 38. Kinesics analysis of participant 5 54
viii

LIST OF TABLES
Table 1. Segmentation of design process (Record of body movements & sketching activities) 22
Table 2. Record of body language and sketching activities 27
Table 3. Performance analysis discussion 44
Table 4. Performance discussion 45
Table 5. HRV analysis result; Test* represents the color word test (CWT); Pre-test* & Post-test*
session represent the rest session 46
Table 6. LF/HF discussion; Test* represents the color word test (CWT); Pre-test* & Post-test* session
represent the rest session 47
Table 7. Mean and STD ofRR and HR of five participants 47
Table 8. Statistical analysis of five participants 48
Table 9. The descriptions of participants' design state 51
Table 10. Kinesics analysis; Test* represents the color word test (CWT); Pre-test* & Post-test*
session represent the rest session 54
Table 11. Mental stress ratio of kinesics analysis; Test* represents the color word test (CWT);
Pre-test* & Post-test* session represent the rest session 55
Table 12. Mental stress Ratio of LF/HF discussion; Test* represents the color word test (CWT);
Pre-test* & Post-test* session represent the rest session 56
Table 13. Number of participants 57
ix

LIST OF ACRONYMS
CWT Color-word test
ECG Electrocardiogram
EEG Electroencephalograph
FFT Fourier transform
HF High frequency
HR Heart rate
HRV Heart rate variability
LF Low frequency
NN interval Normal-to-normal interval
PSD Power spectral density
RR interval R peak to R peak interval
TLX NASA Task Load Index
ULF Ultra low frequency
VLF Very low frequency

CHAPTER 1
INTRODUCTION
1.1 OBJECTIVE
The present thesis aims to propose a new approach for quantifying human mental
stresses during the cognitive activities through his/her body language, i.e., kinesics. Heart
rate variability (HRV) is employed to support the present method.
In the past five decades, study of design science has attracted enormous attention
thanks to the modern engineering development. Design science was accepted by
engineers as the rules during the engineering lab work. Many studies have been
performed in the interest of determining the design rules and many efforts have been
concentrated on the utilization of design science on engineering production and
development. With the view of study in human factors in design science, the present
thesis proposes a new approach to quantify the human mental stresses during the
cognitive activities. Considering the complexity of the design process, independent
cognitive experiments are employed in the experiment. For the first experiment,
participants have been asked to design a litter-disposal system for passenger
compartments in a train carriage. Kinesics analysis has been exploited to quantify the
participants' mental stresses. In the next experiment, Stroop color word test (CWT) has
been employed in the experiments. Kinesics analysis has also been exploited to quantify
the participants' mental stresses. Meanwhile, HRV analysis has been performed to
understand the mental state of the participant, in addition to prove the conclusion of
kinesics study.
1

1.2 BACKGROUND AND APPLICATION
The study of mind can go back to the Ancient Greeks [1,2]. Philosophers such as
Plato and Aristotle tried to explain the mind and its operation from different perspectives.
Plato said: "the mind relates to the realm of abstract ideals". Aristotle said: "the mind is
what the brain or body does". Mental stresses are considered to be an elevation in a
person's state of arousal or readiness of the mind. This mental response, which is caused
by some stimulus or demand, determines human behavior. Yerkes and Dodson [3]
developed the Yerkes-Dodson (Y-D) law in 1908, which shows that there is a U-shape
correlation between arousal and performance. According to the Y-D law, the medium
level stress addresses to better performances. Sweller is known for formulating an
influential theory of cognitive load [4]. Peter Nixon, a British cardiologist, presented his
research result in 1979 (Figure 1) [5].
THE HUMAN FUNCTION CURVE
G o o d n e s s DISMISS
THE H U M P
Adapted U&m: Mwon, P: P*ac*ton*f, 1379.
Figure 1. The human function curve [5]
We can observe from the figure, initially, the increased mental stresses produce
increased performance. The "optimal" stress involves functional amounts of arousal
contributing to effective task performance. Once the stress over a point (the hump), more
2

stress produces decreased performance. Cognitive load theory (CLT) can provide
guidelines to assist in the presentation of information in a manner that encourages learner
activities that optimize intellectual performance. It is based on a cognitive architecture
that consists of a limited working memory and an unlimited long-term memory.
According to the theory, limitations of working memory can be circumvented by coding
multiple elements of information as one element in cognitive schemata, by automating
rules, and by using more than one presentation modality.
In the domain of design, some researchers have attempted to discover designer's
cognitive model during the design process. Kirschner [6] focuses on the increase of
germane cognitive load, which aims at further improving instructions by making
designers take advantage of otherwise unused working memory capacity during learning
process. Dong [7] attempts to quantify coherent thinking by using a latent semantic
analysis in a conversation mode, and this measurement also reveals patterns of
interrelations between an individual's ideas and the group's ideas. Stempfle and
Badke-Schaub [8] study on three laboratory teams solving a complex design problem to
investigate the cognitive processes of design teams during the design process.
Fuchs-Frohnhofen, et al. [9] use a methodology incorporating the taxonomy of mental
models to analyze the user's mental models in work setting and generate variants of
human-machine interfaces to match them.
There are several ways to measure mental stresses. On the one hand, one can tell
how stressful s/he feels under certain situation. NASA Task Load Index (TLX) is such a
tool for assessing the subjective rating score of mental workload [10]. The NASA Task
Load Index is a method for providing an overall workload score based on a weighted
3

average of ratings on six subscales, namely, mental demands, physical demands, temporal
demands, own performance, effort, and frustration [10]. This method gives a scale of the
workload that is proportional to mental stresses.
So far, there is no standard method for quantitatively evaluating mental stresses.
Researchers are still seeking the relationships between mental stresses and other
parameters.
1.3 PROBLEMS
The major issue of this study is to abstract the information to quantify mental
stresses based on the human behavior. We assume that human behavior is the actual
output of the human mental world. These behaviors can be presented in the physiological
parameters which are controlled by the body autonomic nervous system. The
nonspontaneous behavior, such as body movements and linguistic communication, are
generated after thinking process. Meanwhile, the spontaneous behavior such as, blink and
yawn, happens without any planning. Thus, we believe that the mental stresses are
represented by the nonspontaneous behavior. Following this lead, we have found that, the
participants trend to have less movements when they have a higher mental work load.
With the development of the research, spontaneous behavior has been realized to be
equally important. Therefore, the mental stresses are believed to be described by both
spontaneous and nonspontaneous behaviors.
In order to find the transformation function of mental stresses and human behavior,
experiments have been performed. Considering the complexity of the design process,
independent cognitive experiments are employed in the experiments. Kinesics analysis
has been exploited to quantify the participants' mental stresses. Nevertheless, the result
4

can only be verified according to the restating of the participants. Scientific test and
verification to the kinesics analysis are necessary. For that reason, HRV analysis has been
performed to understand the mental state of the participant, in addition to prove the
conclusion of kinesics study.
1.4 THESIS OUTLINE
The historical review including the existing research results in mental stresses,
human body language, and the heart rate variability is given in Chapter 2.
Research approaches are explained respectively in Chapter 3 and Chapter 4. The
final chapter describes the research result and gives the conclusion of the present
research.
Chapter 1 Introduction
' ' Chapter 2
Review of the Quantification o* Mental Stress
| +
Chapter <1 Quantify Mental Stress by HRV
An«lysis
1
+ Chapter 3
Quantify N'-snta; Stress by Kinesics
Analysis
| +
Chapter 5 Cttielusson as id
Future Work
Figure 2. Thesis organization
5

CHAPTER 2
LITERATURE REVIEW
2.1 MENTAL STRESS
Over the last few decades, various design methodologies have been proposed to
assist designers in generating quality designs in an effective manner [11-16]. There is no
doubt that the existing methodologies have been greatly influencing the industrial product
design process. However, a big challenge is still faced in applying those design
methodologies, which lies in two contrasting facts. On the one hand, design is a creative
act, which is rooted in the flexibility and freedom for exploring various avenues to
achieve design goals [17-19]. On the other hand, any design methodology implies a set of
well structured logical steps for solving a design problem. This contradiction between
flexibility and structure, also can be considered as the contradiction between freedom and
logic is made even more complicated by an intrinsic nature of design: design solutions
must pass an evaluation defined by design knowledge, that is interdependently and
recursively determined by the design solutions [15].
To develop an effective, structured and logical design methodology that can
accommodate flexibility and freedom, it is important to quantify the designer's cognitive
processes, particularly the designer's mental stresses. According to the Yerkes-Dodson
law [20], there is an inverted U-shaped curve correlation between performance and
mental stresses. An optimal level of arousal addresses the best performance for a given
task whereas performance will decrease when levels of arousal become either too low or
too high. Their research indicated that under the pressure of tight schedule, complex tasks,
6

and/or other intensive tasks, people can be stressed out; as a result, their performance
may degrade or even fail. Modest levels of supra-optimal stresses can be counteracted by
the performer through increased effort, resource mobilization, or straining [21-24]. A
design methodology, as a means to manage design tasks, can increase or decrease the
designer's mental stresses. Thus a design methodology may bring in the mental relaxation
by helping designers release mental workload while it may also lead to designer's
frustration if it is against the designer's conventional way of thinking and working [15].
Therefore, a good design methodology must be able to enhance the designer's
performance by keeping the designer's mental stresses within an optimal range. For this
purpose, it is essential to model the relationship between designer's mental stresses and
performance. As the first step of this modeling, the designer's mental stresses and
performance must be quantified. However, the quantification of designer's performance
is not the focus of this present thesis and will be discussed elsewhere. The objective of
the present thesis is to quantify designer's mental stresses during the conceptual design
process.
To the authors' best knowledge, no results have been reported in the literature
regarding the quantification of designer's mental stresses. Most of the reported work is
focused on understanding general cognitive processes in design, particularly on the roles
of sketches in the conceptual design process [25]. Through fluid gestures and smooth
hand-eye coordination during the sketching process, designers not only attempt to capture
their flow of thoughts but also use their sketches to generate new ideas and images in
their minds [26]. This visual thinking provides mental relaxation and helps in generating
fresh new ideas. It reduces the cognitive load on engineers during conceptual design and
7

encourages the free flow of creativity. By focusing on the increase of the germane
cognitive load, Kirschner aims at further improving instructions by making designers take
advantage of otherwise unused working memory during learning [27]. Dong attempts to
quantify coherent thinking by using a latent semantic analysis in a conversation mode,
and this measurement also reveals patterns of interrelations between an individual's ideas
and the group's ideas [7]. Stempfle and Badke-Schaub have investigated the cognitive
processes of design teams during the design process by studying three laboratory teams
solving a complex design problem [8]. Fuchs-Frohnhofen, et al. have analyzed the user's
mental models in the work setting and have generated variants of human-machine
interfaces matching the user's mental models by using a methodology incorporating the
taxonomy of mental models [8].
Despite the progress in developing designer's cognitive models, the existing studies
on design cognition suffer from a few problems. First, the investigation of mental stresses
is a result of an interdisciplinary study of the brain, but different disciplines (such as
philosophy, psychology, artificial intelligence, neuroscience, and linguistics) define the
mental stresses in different ways. Analysis of mental stresses has become increasingly
important for investigating designer's cognitive procedures. However, a concept of
mental stresses accorded with the domain of design has not yet been created. Secondly,
the observations and implications about designer's mental model and cognitive process
are based on experiments or beliefs from cognitive science. There is no method to
systematically reflect the nature and characteristics of a design process and to naturally
accommodate a designer's cognitive activities. Finally, encoding is an important and
critical part to analyze subject's protocol data. Most of the current protocol studies devise
8

the coding schemes according to specific design problems. If the design problem is
changed, the coding scheme will also be changed and therefore cannot be extended for
other applications. As a result, experiments from different sources are not comparable,
which brings a lot of subjectivity into the study.
There are two main models of mental stresses in the literature: object-based model,
subject-based model and relationship based model. An object-based model treats stress as
a function of external influences such as demanding workload, heat/cold, and time
constraint [28]. However, it ignores individual differences and neglects entirely the role
of emotion. By contrast, a subject-based model holds that stress is a composite of
response patterns (such as heart rate, blood pressure, and body temperature) that result
from exposure to a given stressor [29]. In this case, mental stresses can be associated with
an interaction between an individual and his or her working environment.
2.2 BODY LANGUAGE (KINESICS STUDY)
Hart and Staveland defined mental stresses as "the perceived relationship between
the amount of mental processing capability or resources and the amount required by the
task" [10]. The study of designer's mental stresses can help enhance the designer's
effectiveness in the innovative design process [30]. Studies have shown that people
actually perform better under appropriate pressure. Little pressure does not give people
enough incentives to fully pour their capacity into the task whereas too much pressure
will eventually disrupt performance [31]. An understanding of factors that affect
designer's mental stresses will help the development of tools supporting design activities.
The first step for this understanding is the quantification of mental stresses.
The research about understanding the meaning of nonverbal communications is
9

established in the middle of last century [32] although Darwin started his work around
150 years ago [33]. Serious study requires an interdisciplinary approach and an ability to
decode the expressive and communicative aspects of body movements. Therefore, after
decades of research, nonverbal communication is widely considered to be composed by
the following eight categories: kinesics, occulesics, artifacts, physical appearance, haptics,
proxemics, and the chronemics [6, 34]. During the design process, kinesics, namely body
movement, represents abundant information of designers' mental activities. Accordingly,
we choose to study the design behavior through the kinesics, in addition to our ongoing
efforts in protocol analysis and physiological data analysis.
Some researchers insist that body languages describe the involuntary movements of
responses while some others consider gestures, facial expressions, and poses are
intentionally made by a person [35]. In the present research, we will use kinesics to study
design behaviors. Kinesics, as the main subcategory of paralanguage, was defined to
describe all physical forms of human communication that are not verbal language, such
as the body movements, gestures, postures, gait, facial expressions, eye behaviors, and
some small movements that people are not aware of. Each body movement conveys a
meaning that depends upon the physical, social and cultural context [36].
Language is a dynamic set of visual, auditory, or tactile symbols of communication,
and the elements used to manipulate them. Whereas the paralanguage refers to the
non-verbal elements of communication used to modify meaning and convey emotion.
Some researches insist the body language describes the involuntary movements of
response, however, some others consider that gestures, facial expressions, and poses are
intentionally made by a person [35]. Whereas in this chapter, body language, as the main
10

subcategory of paralanguage, was defined to indicate all physical forms of human
communication that are not verbal language, such as the body movements, gestures,
poses, facial expressions, eye behaviors, and some small movements that people are not
aware of. Thus every part of the human body, either in motion or stillness, conveys a
meaning which depends upon the physical, social, and cultural context of the action [37].
Kinesics, similar to a verbal language, has many components such as movements
and their sequences. Those components correspond to the vocabulary and grammar that
build up sentences and paragraphs. In body language study, people express their invisible
mind by arranging the movement components. In order to find the "vocabulary" and the
"grammar" in a series of body expressions, this study abstract the important factors of the
continuous body movements. Meanwhile, a metric system has been used to quantify
human mental stresses. Therefore, by using the relation between the movements
components and the scaled matrix, we are able to get the relation between the body
movements and the designer's mental stresses.
2.3 HEART RATE VARIABILITY (HRV)
2.3.1 INTRODUCTION
Heart rate variability describes the variation between consecutive heartbeats. The
rhythm of the heart is controlled by the sinoatrial node, which is modulated by both the
sympathetic and parasympathetic branches of the autonomic nervous system.
Sympathetic activity tends to increase heart rate and its response is slow for few seconds
[38]. On the other hand, the parasympathetic branch tends to decrease the heart rate and
responses faster for 0.2-0.6 seconds [38].
11

HRV analyzes the modulation of the continuous sympathetic and parasympathetic
innervations, which is, the variability of heat rate in our research. Respiratory sinus
arrhythmia is the most perceptible periodic component of HRV, which is believed to
range from 0.15 to 0.4 Hz in frequency domain [38]. This so called high frequency band
(HF), which is physiologically influenced by the breathing, is generally on the behalf of
parasympathetic. The other widely studied component of HRV is the low frequency (LF),
which is believed to range from 0.04 to 0.15 Hz in frequency analysis [38]. LF band is
being thought to on the behalf of both sympathetic and parasympathetic, while some of
the researches indicate them to be mainly of sympathetic origin The fluctuation below
0.04 Hz has not been studied as much as the higher frequencies. These frequencies, which
have been divided into the very low frequency (VLF, 0.003-0.04 Hz) and ultra low
frequency (ULF, 0-0.003 Hz), have been considered to be the characteristic for HRV and
have been related to the humoral factors such as the thermoregulatory processes and
renin-angiotensin system [38]. Whereas during many research the ULF have been
omitted according to the short-term heart rate recording.
2.3.2 HISTORY
The physicians realize the potential importance of cardiac rhythms long before the
invention of electrocardiograph and the recent emergence of modern constructs of heart
rate variability. Before this century, techniques for the patterns of heart rate study were
limited, but physicians have already monitored heart sounds and heart rhythms by
auscultation and noticed that the beat to beat rhythm shifts according to the aging, illness,
and psychological states in the past several hundred years [39]. Chinese medical worker
have studied these rhythms for hundreds of years as the major component of Chinese
12

medical diagnostic systems [39]. However, science needs the accurate and reliable
quantification of the research result. Therefore, the technology has progressed from the
galvanometer, to the kymograph, to the ink-writing polygraph, and finally to digital
signal processing system [38].
The early work of Luigi Galvani and Alessandro Volta and the electromagnetic
principles deduced by Andre-Marie Ampere and Has Christian Oersted led to the
development of the galvanometer in early 19 century [38]. This device allowed the very
small electrical currents changes, including bio-potentials generated by heart, to be
monitored by machine, by evaluating on magnetic induction to rotate a pointer or a mirror.
The smoked kymograph, invented by Ludwing (1847), was able to record the mechanical
activities, such as the pressure pulses and the movement of a galvanometer needle, on a
smoked drum. MacKenzie (1894) invented an ink-writing polygraph, while Einthoven
(1988) integrated the galvanometer with photography to produce accurate and continuous
tracings of the electrical activity of heart [38]. With the development of these
technologies, monitor the normal and abnormal electrical conduction activity become
possible, hence, the beat to beat changes can be recorded for heart rate research.
It is hard to argue the origins of scientific study of heart rate variability predate the
development of electrocardiograph. Hales (1733) has observed a respiratory pattern in the
blood pressure and pulse of a horse, which is seen as the first documented observation of
heart rate variability. Thanks to the kymograph, Ludwig (1847) was able to observe a
increase of the rate of inspiration and a decrease of the exhalation rate of a dog. In 1868,
Donders focused his work on the relation between respiration, heart rate, and the vagus
nerve. The theory that brainstem nucleus controls heart rate which articulated by Traube
13

(1865), indicated the controlment could be influenced phasically by direct "irradiations"
from the medullary respiration centers [38]. As many of these studies directed the
connection among respiration sinus rhythm and heart rate, research on heart rate
variability moved initially in two directions. First, many researchers work on the
understanding of physiological mechanisms related to heart rate rhythm. Second, studies
have been performed on medical research of the relation between heart rate variability
and clinic status. Later in 1960s, with the availability of polygraphs in academic
laboratories, the third trend emerged as psycho-physiologists to investigate the relation
between psychological process and heart rate variability [40].
After decades of development, the heart rate variability began to attract attention
and to be treated as an interesting and potentially important phenomenon without
attributing it to any specific physiological mechanism. Three general perspectives were
credited to the previous studies: (a) an individual difference model that manage heart rate
variability as a markable variable that inclines toward foreseeable model of behavioral
and autonomic response [40-43]; (b) the measurement of heart rate variability as an index
of attention, mental effort, or mental load [44-48]; (c) the stimulus control of heart rate
variability by operant conditioning or biofeedback techniques [49, 50].
The research questions and the specific problems within these disciplines were
often distinguishable. At present, a common reorganization agrees that, the explications
and quantification of heart rate variability depend not only on a sufficient comprehension
of the physiological mechanism but also on the interaction between these mechanism and
behavioral process.
14

CHAPTER 3
KlNESICS ANALYSIS
3.1 INTRODUCTION
This chapter proposes an approach to evaluate the designer's mental stresses during
the conceptual design process. The proposed approach, combined with designer's
sketches, is based on the kinesics study, which looks into body movements. In this study,
participants were assigned a design task in which they need to look for conceptual
solutions. Each individual participant's design activities were recorded and analyzed for
quantifying the designer's mental stresses during the design process. During the
experiment, participants were required to design a litter-disposal system for the passenger
compartment. The system should be convenient for the passengers to deposit garbage and
meanwhile it is easy for the cleaners to collect the garbage. Three digital cameras and a
free sketching tablet were used to record the design activities and participants' body
expression. In the interest of finding the general statute of design process, participants
were unconstrained in both design method and body movement. The kinesics data is
collected through the video recording the designer's behavior in the design process. The
sketches are generated on a tablet and recorded by a screen recording system. It is
observed from the experiment that designer's mental stresses are closely related to the
frequency of the body movements. With a view to evaluate participants' mental stresses,
namely, to distinguish the stressful meaning from body language, several cognitive
experiments were performed in this study. Experiment method and data analysis will be
introduced in the following sections.
15

The rest of this chapter will be organized as follows: Section 2 introduces the
method that we used to collect and analyze designer's cognitive data. Section 3 shows our
observations from the experimental data. Section 4 discusses some relevant issues and
indicates the future research directions.
3.2 METHOD
Language is a dynamic set of visual, auditory, or tactile symbols of communication,
and the elements used to manipulate them. Whereas the paralanguage refers to the
non-verbal elements of communication used to modify meaning and convey emotion.
Some research insist the body language describe the involuntary movements of response,
however some others consider gestures, facial expressions, and poses are intentionally
made by a person [35]. Whereas in the present thesis, body language, as the main
subcategory of paralanguage, was defined to indicate all physical forms of human
communication that are not verbal language, such as the body movements, gestures,
poses, facial expressions, eye behaviors, and some small movements that people are not
aware of. Thus every part of the human body, either in motion or stillness, conveys a
meaning which depends upon the physical, social, and cultural context of the action [37].
Kinesics, similar to a verbal language, has many components such as movements
and their sequences. Those components correspond to the vocabulary and grammar that
build up sentences and paragraphs. In body language study, people express their invisible
mind by arranging the movement components. In order to find the "vocabulary" and the
"grammar" in a series of body expressions, this study abstract the important factors of the
continuous body movements. Meanwhile, a metric system has been used to quantify
human mental stresses. Therefore, by using the relation between the "language
16

components" and the scaled mental stresses, we are able to get the relation between the
body movements and the designer's internal mental stresses. Figure 3 shows the relation
between the four major components in our study. Body movements, which were used to
deduce the mental stresses, were collected by the cognitive design process. A kinesic
method was used to investigate the design behaviors, and a metric system was established
for studying the mental stresses. Hence, we can get the mental stresses level from the
kinesic information.
Body Movement
I
Bet/tic*
T
Deduc
Mental Stress
Figure 3. Structure of the mental stress evaluation system
3.2.1 SELECTION OF PARTICIPANTS
In the experiment of body language analysis during cognitive activities,
educational background, engineering design experience and language ability were
considered during the selection of the participants. Basic knowledge in engineering
design and the capability to perform a design task are required for participants. Human
research ethics approval for the study has been received from University Human
Research Ethics Committee. Seven graduate students with various cultural backgrounds
17

and engineering experience (5-10 yrs) volunteered as the participants in this study. They
are from mechanical engineering, electrical engineering and computer engineering,
respectively. Procedures of the experiment were explained by Design Lab, and all the
participants have signed a consent form prior to taking part in the study.
mmm
Figure 4. Experiment set-up. 1
("hair
Table
Chair
Chair
Table
Chair
1
Chair
—: 1
Chair
Chair
—. 1
Chair
Figure 5. Design problem
3.2.2 MATERIALS
To fulfill the research of body language analysis during cognitive activities, the
design problem used by Dorst and Cross [ 17] was adapted to our research. In response to
anticipated participants with diverse backgrounds, the problem is simple to be understood
and meanwhile being challenging enough. Participants were presented a pre-prepared
description of the design problem as follows:
Design a litter-disposal system for passenger compartments in a train, which is
shown in Figure 5. This system should be convenient for the passengers to deposit their
garbage and for the cleaners to collect the garbage.
Figure 4 shows the experiment set-up.
18

3.2.3 COGNITIVE ACTIVITIES DESIGN AND PROCEDURE
Experiment design
We assume that the mental stresses can be indicated by the body movements. By
observing the children behavior, we notices that the period when children are hard to
focus on one topic generally accompanied by amount of major physical motions, whereas
the concentration of one subject significantly reduces their body movements. The
curiosity caused by this observation initiates our study on body movements of adult
designers.
The objective of this study is to quantify the designer's mental stresses during the
design process. Comparisons in different states of design and the comparisons between
participants will be performed. In order to reduce the effects of differential external
factors, the environmental setups are required to be equal. Meanwhile, the human factors
of designers should be monitored. Human factors such as age, gender, health condition,
mental state, educational background, and work experiences should be considered.
One requirement of the present research is that the information determining the
designer's mental stresses must be recorded truthfully. Various approaches are required to
record the information. Another requirement is that the experiment should not interfere
with the designer's mental process, thereby the designer's mental stresses are not
influenced by the experimental approach.
Within the production of the mental stresses result, disadvantages of the
assumption about body language are revealed. The research results could not be verified
either by the surveys of participants nor the judgments of researcher. In order to replenish
the drawbacks, a wildly accepted method of evaluation of mental stresses and new
19
experiments (CWT) are introduced. By studying the body movements in established
stress sections and the rest sections in CWT, the proposed method is proved to be valid.
Alterations of the experiment details are made according to the matters that
emerged during the experiments and the data analysis process.
Experiment procedure
To quantify precisely the designer's mental stresses during the design process,
activities determining the designer's mental stresses must be recorded faithfully. Thus,
various recording approaches are needed. Meanwhile, the experiment procedures must
not interfere with the designer's mental process so that the designer's mental stresses are
not influenced by the adopted experimental approach.
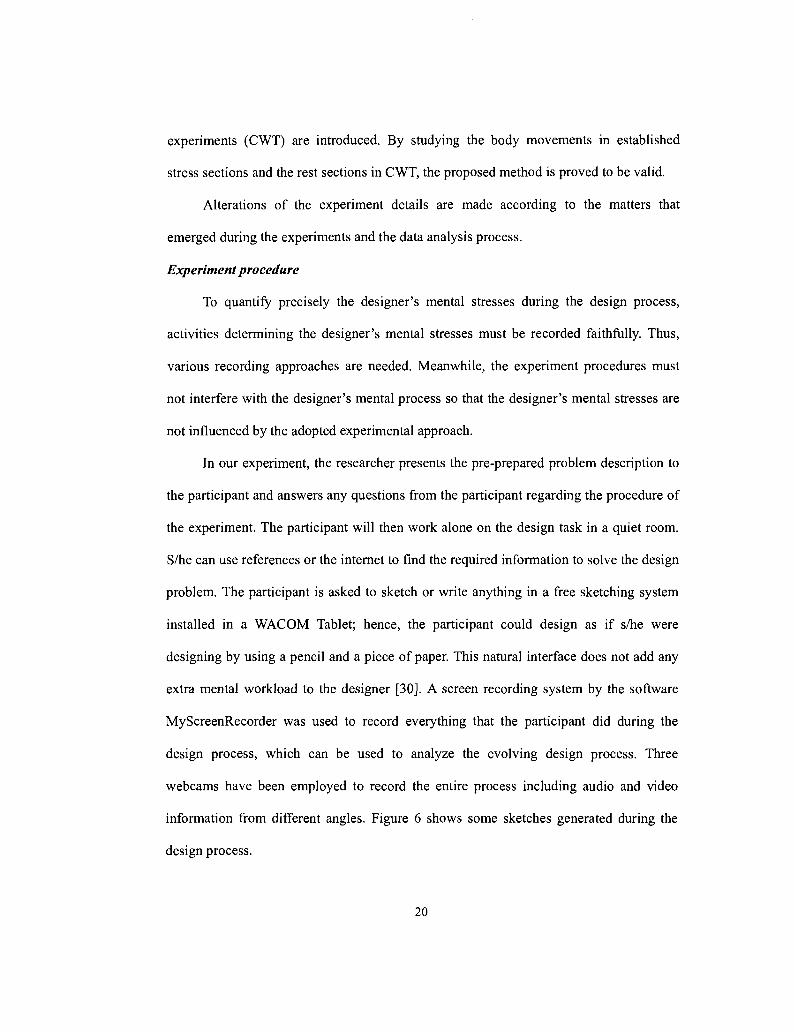
In our experiment, the researcher presents the pre-prepared problem description to
the participant and answers any questions from the participant regarding the procedure of
the experiment. The participant will then work alone on the design task in a quiet room.
S/he can use references or the internet to find the required information to solve the design
problem. The participant is asked to sketch or write anything in a free sketching system
installed in a WACOM Tablet; hence, the participant could design as if s/he were
designing by using a pencil and a piece of paper. This natural interface does not add any
extra mental workload to the designer [30]. A screen recording system by the software
MyScreenRecorder was used to record everything that the participant did during the
design process, which can be used to analyze the evolving design process. Three
webcams have been employed to record the entire process including audio and video
information from different angles. Figure 6 shows some sketches generated during the
design process.
20

Figure 6. Design sketches: examples.
3.2.4 SEGMENTATION AND ANALYSIS METHOD
According to the observation of the design process, participants received the design
problem and then begin their design process with problem decomposition. Participants
divided the problem into parts based on different principles. Some people extract the
information by levels, like peeling the onions. They started from the surface information
down to the hidden messages whereas the others prefer to proceed by following some
methodology, such as the seventh participant. Due to the analysis behaviors that exhibited
at the beginning of design process, we define the beginning state of design process as the
analysis state (State 1 in Figure 7). Generally, analysis state was represented by reading
the original question and generating some ideas in mind. Sketching and writing on the
tablet, on the other hand, represent the beginning of a new state, which is state 2 in Figure
7. During the first half of state 2, solution of question 1 was generated and been sketched
out, and new question (Problem 2) appeared, which leads the designer to analyze the
question 2 (State 2 in Figure 7). At the following state (State 3 in Figure 7), designer
produces the response followed by the generation of another question (Problem 3).
Consequently, designing proceeds in an evolution structure, as is shown in Figure 7.
21

Slat« 1
Origwvil Dewgn
Pro&tem
5wt» ;
Obtain
Problem* 2
Thlnkirg Process 2
S:,r.f? 3
Obtain ScAitaxr- 2 & I TNnkirg
kF i ra l SVslH |
Obtain Pinnt Soiutioi-
Figure 7. Evolution of the design process
Table 1 illustrates parts of the design states, along with the body movements and
sketching activities of the sixth participant. These states were abstracted from the
beginning, midway, and the ending of the design process. Segmentation was performed
based on the evolution structure of design process shown in Figure 7.
Table 1. Segmentation of design process (Record of body movements & sketching activities)
(By default, the participant is looking at the screen without body movements.)
State 3
State 35
Time
00:09:05-08
00:10:55-11:26
01:32:15-21
01:32:21-33:12
01:33:12-14 01:33:14-34:42
01:34:45-35:56
01:36:06-16
01:36:28-37:13
01:37:18-49
01:38:03-18
Body Movements
Right hand fingers under his nose and look at the screen;
Ask questions; The experimenter explain it to him; Right hand fist beside his lips; Move the chair to the dictionary, and check for something; Move back to the screen; Write on the screen;
Write on the screen;
Write on the screen;
Write on the screen;
Write on the screen;
Write on the screen;
Time
00:07:41-09:03
00:09:03-04
00:09:09-10 00:09:11-00:10:14
00:10:15-00:10:50
00:10:50-00:10:54
01:32:15-21
01:34:43-45
01:35:56-36:06
01:36:16-27
01:37:13-18
01:37:49-38:03
Sketch Behavior
Read the problem from the screen;
Line on the screen; Selected one sentence on the screen;
Cancel the selection; Roll the pages down to read the problem from the screen; Roll the pages back and forward; Roll the pages back;
Look at his product;
Roll down the window;
Roll down the window;
Roll up and down the window; Look at his product;
Erase something on the screen;
Erase something on the screen;
22

State 51
State 52
02:03:38
02:03:38-41
02:03:52-04:02 02:04:02-20 02:04:20
Left hand fingers cover his lips; look at his product;
Look at his product; W rite on the screen; Talk to the experimenter;
01:38:18-24
02:03:41-52
02:04:20-24:00
Roll down the window;
Add something into his product;
Look at his product; Give some explanation; Erase some words, and modify them; Highlight some words; Draw the detail of the product; Correct some grammar mistakes;
3.2.5 ANALYSIS METHOD
Compared with the other expression approaches, body movement as an effective
approach to express without speech is more connotative, and the stimulation of the
movements appears to be more unintentional. When someone feels annoyed, s/he may
knit her/his eye brows with or without consciousness of that movement, and s/he may
frown in the same way during deep concentration or in the other situation, s/he just does
it with no purpose at all. Therefore, Birdwhistell and Fast [37] have pointed out that, the
meaning of body movements cannot be defined without the context of the movement
maker. A body movement may mean nothing in a context, and yet be extremely
significant in another [37]. Accordingly, the learning of kinesics must be performed in
terms of the total pattern of movement, thus we must understand the pattern of movement
in terms of the "spoken language". The two, while sometimes contradictory, are also
inseparable.
In the present thesis, instead of studying the body movements independently, the
analyses were performed combined with the context, which were the recorded sketches
and the verbal protocol. The body movements were divided to two groups according to
the design context: Output-related movements; and Output-stimulated movements.
23

Output related movements, such as sketching, reading, and writing, are connected to the
purpose of accomplishing the design. However, the stimulated movements, such as
scratch, rub chin, bite lips and other little physical movements, were aroused under the
mental load during the design process. Research shows that, human body is more active
during the relaxation, while less movement during concentration [51]. Consequently, the
frequency of movements is an important factor for evaluating the mental stresses. The
following equation is used to calculate the relative quantity of mental stresses.
1 1 Mental Stress Level = — + — (3.1)
fr Is
fr = Ef, fs = y (3.2) 'r 's
where, Er and Tr represent the amount and the duration of the output-related
movements respectively, and Es and Ts represent the amount and the duration of the
output-stimulated movements respectively.
While in the color word test, which is the major cognitive test of the present thesis,
the experiment process separated in to three sections: Pre-test, test, and post-test. The
experiment started with the pre-test section, participants were required to look straight
while no subjects have been given in front until the test section began. When all CWT
finished, participants have been asked to stare straight again, no subject shows in front as
well, this is the post-test section.
Therefore, in the pre-test section and the post-test-section, no output-related
movements have been performed. The mental stresses evaluation function changes in this
circumstance. The corresponding equation is as follows:
i Mental Stress Levelvre_test or post-test section = T
(3.3) JS
24

fs = Ef (3-4) 's
where, Es and Ts represent the amount and the duration of the output-stimulated
movements respectively. In the test section, the output-related movements are the clicks
on the mouse (for choosing the right option of CWT). Frequency of these movements has
been set as constants. Details of the CWT parameters will be given in the following
chapters.
3.3 RESULT
In present research, differences existed between designers. It's hard to ignore that
some students had difficulties on information gathering. Interestingly, the same problems
were not difficult for other students, who trended to not gather a lot of information and
tended to solve the design problem rather than thought about the potential difficulties.
Designers were divided into two groups during the data analysis. The advanced
group was marked in terms of their creativities and good comprehension, as well as their
quick speed of the designing itself. They quickly indicated priorities. The other group
gathered lots of information, but then "gathering data" became a substituted activity of
the design work. For example, participant 4, participant 5 and participants 7 have
adequately set up the problem for the problem scoping, which included gathering a larger
amount and wider range of problem-related information did result in better design. On the
other hand, participant 2 and participant 6 stuck in problem-definition and did not
progress satisfactorily into further stages of the design process.
Changes in individual behavior were complex and variable. Some participants did
not change their behavior models, while the others spent more time on design projects
25

without any behavioral changes. Differences existed between the novice and experienced
designers. We have found significant differences between the behaviors of novice of
engineering design and experienced students. Participant 1 and participant 2 were junior;
participant 3 and participant 6 were intermediate; participant 4, participant 5, and
participant 7 were Senior. The novices used "trial and error" techniques of generating and
implementing a design modification, evaluating it, and then generating another, and so on
through much iteration. Experienced engineers were observed to make a preliminary
evaluation of their tentative decisions before implementation, and then making a final
evaluation at the end. In contrast to the novices "trial-and-error" approach, the
experienced designers employed integrated design strategies.
According to the recorded sketch, the participant had difficulties in performing the
design task in the first ten states, then he spent seventeen states to get prepared for the
design, after which he started to generate solutions. The most productive section was
states 35 to 39 and states 47 to 52, the participant generated most of his final solution.
States 40 to 46 were adjustment period when the participant conducted a lot of refinement
work.
Mental stresses value of a participant is given in Figure 8. The state 53 was added
to illustrate the end of the design process, where the mental stresses level was set to zero.
According to Figure 8, the participant had steady mental stresses in the first states. In the
middle of his design, the fluctuations of the mental stresses value are revealed. During
this section, the participant started to generate some solutions. Later, slight fluctuation
merged from the middle to the end of his design. These waves represent the generation
process of final results, which are the most productive states.
26

Table 2. Record of body language and sketching activities
Section Time Movement Summary Sketching Activities 00:41:16-01:19 In this period, he watched the :09 (Duration: problem for 9 minutes without any 00:37:53) movements or facial expression. States 11-28 Then he changed movements
frequently, and asked some questions. At first his voice was a little trembling, later he spoke clearly and confidently.
, / . , ' -•<•
01:19:50-01:32 In this period, the participant : 10 (Duration: touched his lips; touched hair; put 00:05:20) his hand against face cheek; drew States 28-35 on the screen; put his hand on the
chin; moved his body back and forth; He drew the position of the bin on the train. And according to the desktop records, he modified the pictures in the tablet, got some progress on the design.
01:33:30—01:42 During this period, the participant :05 (Duration: did eyes blink; drew on the screen; 00:09:35) stood up to draw on the screen; States 35-39 watched around; moved his body
when moving the chair; touched his lips; touched his face; He got some progress on the design, and then switched the design window to internet.
f,t/j
'ir*
» v - ^ r
1:42:05-01:57: In this period, the participant 32 (Duration: frowned; touched his lips; touched 00:15:27) his nose; put his hand on his States 39-47 forehead; moved his body back and
forth; He rectified his design and met some problems. He checked the original question and his design.
01:57:44-02:23 During this period, the participant :40 (Duration: pursed his mouth firmly; touched 00:25:56) his lips; touched nose; put his hand States 47-52 on forehead; scratched head and
neck; supported his head by left arm; moved body from side to side; His design was finished. Then he rectified it.
Participant was under a constant mental workload at the end of the design process.
The last wave accompany with the completion of the design task. Data summary of this
27

participant illustrates in Table 2. Summary of body movements, sketch behaviors, and the
times are provided in the table.
200 f
100
Mental Stress Level
p O L n o o t H m L n r * * . C T i r H Qj Qj ( j j * - H * H T - t r H r H
OJ Qi (D
r o L n r ^ C T i T H m m r ^ o i - r H
ro (O ro nj + J 4_> 4_i 4-« +-* * " i /> t / i i / > t / >
r s i r M f N r g f N m r o m m m Q j g j Q J O J t y Q J Q j q j d J Q J Q J Q J C U t U C U + J . M + - » + - » ' « - » 4 - » + J + J + - » + - ' + - ' - M + - ' - 4 - » - * - *
i / i i / i i / i i / i i / i i / i u i w i n i / i i r t i / i i / i i / i i / i i / i i / i i / i i / i i / i
Figure 8. Evaluation result of participant's mental stress
28

CHAPTER 4
MENTAL STRESS ANALYSIS DURING COGNITIVE ACTIVITIES
Cognitive activities have been analyzed to identify the mental state for the past
decades. Most of the researches were performed by clinic populations. As the world
bringing more attention into the research of design method and the design activities, a
significant approach was similarly used to represent the activities, namely, the
performance. Performance was abstracted from the design relevant activities. It can
estimate how the activities act on the design result. By quantifying the performance of the
design process, researchers elicit the design efficiency, thus obtain the feedback to the
design approach.
In this chapter, we will study the effect of human mental stresses on the human
design behavior, which will help us to understand the design process. According to the
present medical research result, mental stresses are accompanied by dynamic changes in
autonomic nervous system (ANS) activity [52], which affects heart rate, digestion,
perspiration, respiration rate, salivation, diameter of the pupils, micturition, and so on.
The variation in the timing between beats of the cardiac cycle, known as HRV, has been
shown to be an indicator of health [39, 52]. HRV analysis is a popular tool for assessing
the activities of autonomic nervous system.
In our experiment, participants were asked to seat on a height-fixed chair to
perform the standardized Stroop color word test (CWT). The Stroop CWT is a mental
stresses test involving sensory rejection and has been used as a model of the defense
reaction in humans. The present study was designed to investigate effects of CWT on
29

resting cardiac autonomic nervous system activity evaluated by analyses of HRV. The
participants were required to speak aloud the indicated vocabulary, and click on their
choices by using the left button on the mouse within the next 3 seconds, and given the
instructions that failing to click on the right position as well as mistakes were regarded as
errors and that error was recorded to give the level how well they performed. Participants
performed twelve sessions of CWT, i.e. mixed difficulty sessions, low difficulty sessions,
and high difficulty sessions. The order of these sessions was not randomized because we
expected the effect of novelty to be least pronounced in the last session.
The participants were monitored by a video camera, heart rate monitor and the
video camera were continuously monitored throughout these periods. Considered the
participants should carry the remaining workload to the following test stage, two seconds
rest intermission was placed between two response events. Each CWT response event
was composed by three steps, flash of the color word (1 second), response interval (2
seconds), and rest interval (2 seconds).
4.1 INTRODUCTION
In the end of last century, the study of HRV was proved to have the significant
relationship with the autonomic nervous system [39]. HRV study has been used to study
the cardiovascular disease, such as the sudden cardiac death, the arrhythmias, and then
encouraged the study of the signs of the autonomic activities.
The heart rate variability was firstly related to clinical way in 1965 when Hon and
Lee [53] noted that the alternations of the inter beat interval was preceded during a fatal
distress before any other significant changes occurred in the heart rate activities.
Analyzing the time series of beat to beat interval from the ECG or the beat to beat
30

interval from an arterial pressure tracing is usually the main way to calculate the HRV.
Many measures of heat rate variability have been proposed, perhaps the simplest to
perform are time domain analysis. Time domain measurements include the mean RR
interval (NN interval), the mean heart rate, the difference between the longest and
shortest RR interval, standard deviation, etc. Power spectral analysis (PSD), which was
performed in frequency domain, provided the power distribution as a function of
frequency. The application of PSD is a common frequency domain method to estimate
the power generated by RR interval.
Both time domain method and frequency domain method are affected by the length
of the data size. For example, the standard deviation of the NN interval (SDNN)
estimates decreases in the shorter monitoring period. And the very low frequency (VLF)
component, which is not firmly defined by the changes of autonomic modulation, has no
coherent properties with the alternate epoch. According to the HRV research methods in
the past decades, both time domain and frequency domain analysis are occurring in a
chosen time window (short term 5-min and long term 24-h ECG recording).
The rest of this chapter will be organized as follows: Section 2 introduces the
statistical method that employed to analysis the data. Section 3 shows the frequency
domain analysis theory that assisted to abstract the LF and HF components from the
experimental data. Section 4 discusses some Nonlinear methods.
4.2 METHOD
4.2.1 TIME DOMAIN ANALYSIS
31

The fastest way to indicate the changes in HR is to calculate the RR interval, which
can be derived from the ECG tracing. The occurrence of the R peak can be identified for
each heart beat, and the interval between each R peak is the RR Interval (Figure 9).
Furthermore, the NN (normal-to-normal) intervals represent the interval between two
successive sinus beats immediately preceding a sinus beat (Figure 10).
N-N-(N)
...... AJ: .A / \ i| A
-A-
Figure 9. A data slot ofRR interval
4 / 4 4 v NN'CVI
MNlt. *iH.u
^ /UI |M|^ • • • J\f>jyJ
Figure 10. NN interval & RMSSD
RMSSD,
RMSSD
\r
Statistical measures
Several statistical measures are calculated. Standard deviation of the NN interval
(SDNN) represents the square root of variance. Mathematically, the variance is equal to
the total power of spectral analysis, therefore, the SDNN reflects those components that
vary with the period of recording. Standard deviation of differences between adjacent NN
intervals (SDSD), the standard error (SENN), the square root of mean squared differences
of successive NN intervals (RMSSD) (Figure 10), the number of interval differences of
successive NN intervals more than 50ms (NN50), and the proportion derived by dividing
NN50 by the total number of NN intervals (pNN50) are the most commonly used
statistical variables derived from interval differences.
32

SDNN •
RMSSD
SDSD =
yjN-
.1-
yjN-3
yN
1 yw _2^n
:2[S(n) -
=3[«5(n)
[5(n) -
NN50
- s ] 2
-Sin
S(n-
- l ) ] 2
i) - sy
(6.1)
(6.2)
(6.3)
r (6.4) Total number of NN intervals
Geometric measures
In addition to the above statistical measures, geometric measures have been used to
analysis the RR interval histogram. The HRV triangular is obtained as the integral of the
histogram, such as the total number of the RR interval, divided by the height of the
histogram which depends on the selected bin width. A bin width of 1/128 seconds was
used in order to obtain comparable results [39]. The other geometric method, namely,
TINN, is the calculated by the baseline width of the RR histogram through triangular
interpolation [39].
The major advantage of geometric methods lies in their high correlation with the
standard deviation of all RR intervals. On the other hand, the major disadvantage of this
method is the requirement of a reasonable number of RR intervals, normally more than
20 minutes recording (but perfectly 24h). Consequently Geometric measures are
inappropriate to assess short-term changes in HRV.
4.2.2 FREQUENCY DOMAIN ANALYSIS
Methods of time domain are mathematically straightforward compared with
frequency domain methods. In the frequency domain methods, a power spectral density
(PSD) analysis has been employed to provide the basic information of power distribution
33

in the form of functions of frequencies. Calculating the fast Fourier transform (FFT) is a
common method to get the PSD. Parametric and non-parametric are the general two
classes of PSD calculation methods.
The standard PSD calculator assumes equidistant sampling rate, and the RR
interval series is converted to equidistantly sample rate by interpolation method prior to
the PSD calculation. In our study, an interpolation of 4 Hz has been chosen.
Spectral leakage effects exist due to the windowing process, it leads to masking of
weak signal that are present in the data. In order to avoid the problem of leakage and
provide better frequency resolution than non-parametric or classical method, the AR
method has be used to analysis the data in frequency domain in our research.
In the AR method, data have been modeled as output of a causal, all pole, discrete
filter whose input is white noise. AR method of order p is expressed as the following
equation:
x(n) = -YlP
k=1a(kMn-k) + w(n) (6.5)
where a(k) are AR coefficients and w(n) is white noise or variance equal to a2. AR (p)
model can be characterized by AR parameters {a[l], a[2],...,a[p],a2}. According to the
work of various accomplished research, such as the paper presented by Akaike [54], in
this study, we choose the order of the AR model p=16.
4.2.3 NONLINEAR METHODS
Poincare plot is a graphical analysis of each RR interval data as a function of the
previous RR interval. Two dimensional vectors, SD1 and SD2, have been elicited to
provide summery information as well as the beat to beat information on the behavior of
heart. Respectively, SD1 represents the beat to beat variability in HR, and SD2 indicates
34

the standard deviation of long-term RR intervals. Figure 11 shows the Poincare plot of a
participant.
Poincare Plot* SD1 = 30.4 ms <-» (Short-term HRV) SD2 = 66.7 rns <-> (Long-term HRV
0.9
0.85
s os
* 0.75
0.7
0.65
0.65 0.7 0.75 0.8 0.85 0.9 RRI.C*)
Figure 11. Poincare plot of a normal subject
4.2.4 SELECTION OF PARTICIPANTS
In the experiment of mental stresses analysis during cognitive activities,
educational background, design experience and language ability were not considered
during the selection of the participants. Five males and two females in good health
participated in the study. Participants were having education background in engineering
area with various cultural backgrounds volunteered as the participants in this study. They
are from mechanical engineering, electrical engineering, computer engineering,
information engineering, and chemical engineering, respectively. Three males have
engineering design experiences, two males are native Indian speaker and the rest of
participants were having native language of Chinese. Their mean age, height, and weight
were 28.2 (range from 24-32) yr, 174.8 (160-184) cm, and 68.3 (54.2-72.0) kg. Human
research ethics approval for the study has been received from University Human
Research Ethics Committee. Procedures of the experiment were explained by Design Lab,
35

and all the participants have signed a consent form prior to taking part in the study.
4.2.5 M A T E R I A L S
CWT (color word test) was first proposed by John Ridley Stroop in 1935. Current
research on the Stroop effect emphasizes the interference that automatic processing of
words has on the more mentally "effortful" task of just naming the colors. The task of
making an appropriate response — when two conflicting signals are given — has
tentatively been located in a part of the brain called the anterior cingulate. This is a region
that lies between the right and left halves of the frontal portion of the brain. It is involved
in a wide range of thought processes and emotional responses.
To fulfill the research of mental stresses analysis during cognitive activities, the
Stroop test was adapted to our research. The Stroop CWT is a mental stresses test
involving sensory rejection and has been used as a model of the defense reaction in
humans. The present study was designed to investigate effects of CWT on resting cardiac
autonomic nervous system activity evaluated by analyses of HRV. Participants were
presented a pre-prepared description of the design problem as follows:
Please read aloud the displayed vocabulary, and then click on the correct option
that indicates the color of the vocabulary.
Figure 12 shows the experiment set-up. The Figure (a) shows the installation and
the Figure (b) gives a demo of the screen of a CWT. In this demo, the answer with star
mark - "Purple" is the correct choice, whereas in the real CWT, no star will be displayed.
36

Yellow
Green Blue ': Purple
Yellow
a) Installation (b) Stroop test demo
Figure 12. Experiment set-up.2
4.2.6 COGNITIVE ACTIVITIES DESIGN AND PROCEDURE
To quantify precisely the designer's mental stresses during the CWT, activities that
determining the designer's mental stresses must be recorded faithfully. Thus, various
recording approaches are needed. Meanwhile, the experiment procedures must not
interfere with the designer's mental process so that the designer's mental stresses are not
influenced by the adopted experimental approach.
During the past decades, it was claimed that performance Statistic methods, such as
mean value, standard deviation, and the standard error were performed to evaluate the
participants' performance. In the present research, the researcher presents a demo of the
CWT to the participant and answers any questions from the participant regarding the
procedure of the experiment. The participant will then work alone on the CWT in a quiet
room. The participant is asked to take 15 minutes pre-test rest as the baseline, then around
15 minutes was consumed on the CWT, and at last 10 minutes post-test rest have
proceeded for the data comparing. Three webcams have been employed to record the
entire process including audio and video information from different angles. Correctness
37

and elapsed time of the CWT are recorded, as well as the Heart beat to beat interval. Data
such as, HF component, LF component, LF/HF (Ratio) are recorded for the mental
stresses analysis. Statistical analyses have been performed to study the numerical facts,
including the similarity between individuals, and the common character between
cognitive stages.
4.3 RESULT
Three principle elements have been considered for performances quantification.
They are CWT Accuracy, Difficulty Ratio level (congruent/incongruent level of the test),
Elapsed Time (the time duration from the stimulation and the time participant make the
choice). Results of participant 1 illustrate in the following figures:
JllJu Figure 13. (left) CWT accuracy variation of participant 1
Figure 14. (right) Difficulty ratio variation of participant 1
Figure 15. Elapsed time variation of participant 1
38

CHAPTER 5
RESULT AND CONCLUSION
5.1 RESULT OF KINESICS ANALYSIS AND HRV ANALYSIS
5.1.1 ACCURACY, DIFFICULTY RATIO AND ELAPSED TIME ANALYSIS
There are three elements included in a CWT test, CWT Accuracy, Difficulty Ratio
level (congruent/incongruent level of the test), Elapsed Time (the time duration from the
stimulation and the time participant make the choice).
The results of the experiment are shown in the following figures:
Slate Stale
Figure 16. (left) CWT accuracy variation of participant 1 Figure 17. (right) Difficulty ratio variation of participant 1
39

CWT Accuracy Variation
Figure 18. (left) Elapsed time variation of participant 1 Figure 19. (right) CWT accuracy variation of participant 2
Difficulty Ratio Variation Elapsed Time Variation
Figure 20. (left) Difficulty ratio variation of participant 2 Figure 21. (right) Elapsed time variation of participant 2
40

1 r
0.9 •
OB •
0.7 •
0 6 •
0 5 •
0 4 •
0 3 •
0.2 •
0.1 •
0 •
CWT Accuracy Variation
Figure 22. (left) CWT accuracy variation of participant 3 Figure 23. (right) Difficulty ratio variation of participant 3
CWT Accuracy Variation
Figure 24. (left) Elapsed time variation of participant 3 Figure 25. (right) CWT accuracy variation of participant 4
41

Difficulty Ratio Variation Elapsed Time Variation
Figure 26. (left) Difficulty ratio variation of participant 4 Figure 27. (right) Elapsed time variation of participant 4
CWT Accuracy Variation
1 2 3 4 5 6 7 8 9 10 11 12 13 14 State
Figure 28. (left) CWT accuracy variation of participant 5 Figure 29. (right) Difficulty ratio variation of participant 5
42

Elapsed Time Variation
Figure 30. Elapsed time variation of participant 5
1
0.95
0 9
0.85
s-
ga. < 0 7 5
07
065
0.6
1
i \
- 1/ V - 1 \
0 \
' i
i
o
/ 'i
\
k
?"
]>-..,
• -i +i
i
*
j\
\ \ \
o
•.
V ,
\ I v i>
1
; 7 / '
CWT Accuracy Variation
-q-~~
X / \ ;' \ V V V v \
o o
i t i
-n-. i i • • D
" ~
-" -
— a — Participant 1
+ Participant 2
o Participant 3 ••••••"" Participant 4 — « - - Participant 5
• B 10 12
Slate
1
0.3
0.B
I" f 0.6
° 0.5
0.4
0.3
0.2
(a) Difficulty Ratio Variation
-
A / 9-
11 1
1
I 1 1 " 1 1 1 "I
f ' / \ •' *• O
•/A\AV\A-/VA: '. W' ', \ / / \ o \l o \ / / f'A ,'
o '-^ o
I I I I I I I
- D - - Participant 1
""+"" Participant 2
o Participant 3
••*•— Participant 4
"-"— Participant 5
(b)
43

Elapsed Time Variation — ' i...... , . — D ~ Participant 1
+• Participant 2 • O Participant 3
•—%•— Participant 4 • — * — Participant 5
J i " ' ~ 0 2 4 6 8 10 12 14 16 1B
SI ale
(c)
Figure 31. (a) CWT accuracy variation; (b) Difficulty ratio variation; (c) Elapsed time variation
Correctness, elapsed time and difficulty ratio of the CWT have been recorded for
the performance analysis, as well as the HRV data. Figure 16 to Figure 30 illustrate the
histogram of accuracy variation, difficulty ratio variation, and elapsed time variation of
each participant. Figure 31 demonstrates the integrated data.
According to the above results, the performance analysis has been carried out, and
the results are shown as follows.
Table 3. Performance analysis discussion
Variable & Condition
Participant 1
Participant 2
Participant 3
Participant 4
Participant 5
Accuracy
Elapsed time (0-1)
Accuracy
Elapsed time (0-1)
Accuracy
Elapsed time (0-1)
Accuracy
Elapsed time (0-1)
Accuracy
Elapsed time (0-1)
Low difficulty test
0.958333
0.706218333
1
0.561546375
0.979166667
0.650880313
0.948148148
0.530181
0.944444444
0.646420514
High difficulty test
0.9498557
0.732866989
0.947777778
0.64405495
0.988636364
0.715111477
0.961111111
0.54568284
0.867777778
0.710478672
44
J I I L

According to the Table 3, participants perform better in the low difficulty levels,
comparing with the performance in the high difficulty levels. During the low difficulty
tests, the accuracy of the CWT was higher, and elapsed time was shorter. While in the
high difficulty tests, the accuracy is lower, and elapsed time was longer. The accuracy and
the elapsed time are not necessary related.
An interesting finding
We assume the accuracy is directly related to the performance. Additionally, we
consider the elapsed time is the inverse ratio of the efficiency, which is believed to be one
of the standards to evaluate performance. We simply calculate the accuracy divided by
the elapsed time to observe the results. The results are shown in Table 4. We observe from
the table that, generally, people perform better in easy tasks than hard tasks. And
participants, who perform the best in the easy tasks, also perform the best in the hard
tasks. If we range the participants by their performances in easy tasks, the range in hard
tasks will be almost the same. This result may prove a theory that people have different
mental capacities, and the high capacity normally defines the better performance, no
matter the task is hard or easy. The capacity detection and comparison between each
participant will feed back into the future researches.
Table 4. Performance discussion
Variable & Condition
Participant 1
Participant 2
Participant 3
Participant 4
Participant 5
Low difficulty ratio
1.356992527
1.780796822
1.504372843
1.788348032
1.461037241
High difficulty ratio
1.296081982
1.47157906
1.382492654
1.761299862
1.221398773
45

5.1.2 HRV ANALYSIS
Two groups of analysis have been performed and cross compared to elicit the
conclusion. By HRV analysis, we have used the power distribution, time domain analysis,
and the nonlinear method to abstract the information from the participant's heart rate
variability. Meanwhile, the Stroop test results have been analyzed by using the mean
value, variance and the standard deviation to deliver the message of the subject's
performance.
Table 5. HRV analysis result; Test represents the color word test (CWT); Pre-test & Post-test session represent the rest session.
Variable & Condition
participant 1
participant 2
participant 3
participant 4
participant 5
LF (ms )
HF (ms2)
LF/HF (Ratio)
LF (ms )
HF (ms2)
LF/HF (Ratio)
LF (ms2)
HF (ms2)
LF/HF (Ratio)
LF (ms2)
HF (ms2)
LF/HF (Ratio)
LF (ms2)
HF (ms2)
LF/HF (Ratio)
Pre-test
379
236
1.605
160
375
0.426
1254
561
2.235
397
1401
0.283
170
162
1.052
Test*
442
327
1.35
91
365
0.251
879
227
3.867
140
647
0.216
181
240
0.752
Post-test
N/A
N/A
N/A
161
487
0.33
1207
558
2.164
466
551
0.846
266
177
1.501
Table 5 and Table 6 show the HRV analysis results of all five participants.
According to the majority of the result, the HF component of HRV was significantly
reduced during the CWT compared with the other sessions, and the LF/HF ratio was
reduced in all data except the participant 3. The LF component and the HF components of
46
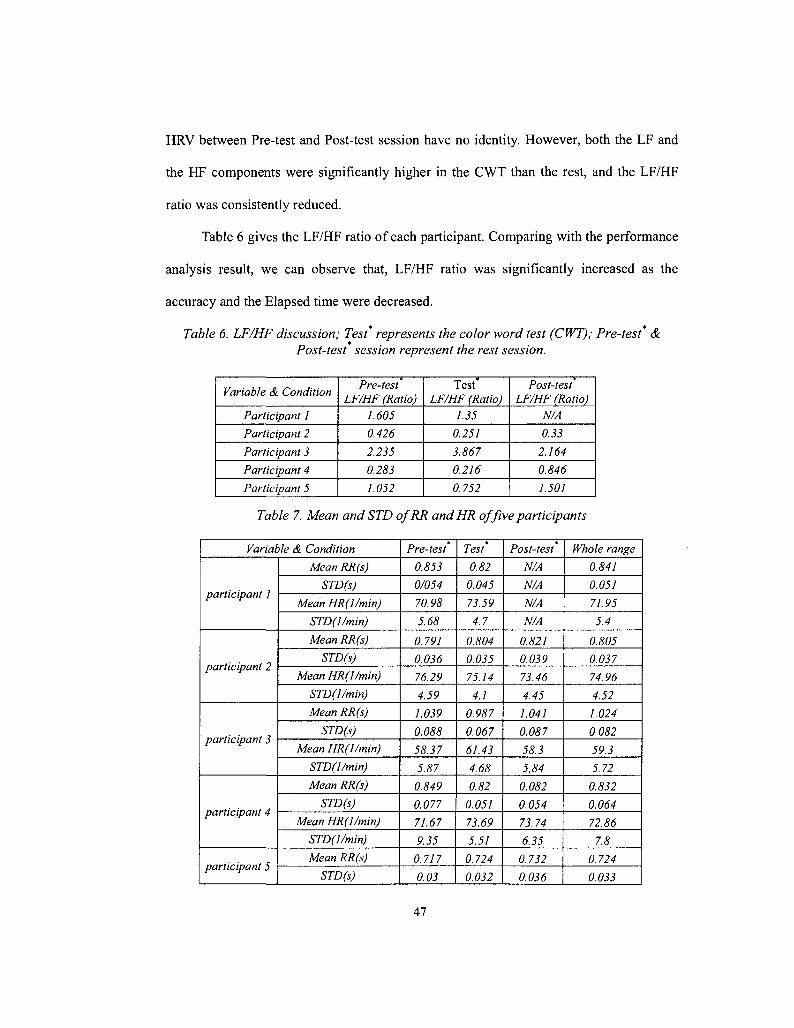
HRV between Pre-test and Post-test session have no identity. However, both the LF and
the HF components were significantly higher in the CWT than the rest, and the LF/HF
ratio was consistently reduced.
Table 6 gives the LF/HF ratio of each participant. Comparing with the performance
analysis result, we can observe that, LF/HF ratio was significantly increased as the
accuracy and the Elapsed time were decreased.
Table 6. LF/HF discussion; Test represents the color word test (CWT); Pre-test & Post-test session represent the rest session.
Variable & Condition
Participant 1
Participant 2
Participant 3
Participant 4
Participant 5
Pre-test LF/HF (Ratio)
1.605
0.426
2.235
0.283
1.052
Test LF/HF (Ratio)
1.35
0.251
3.867
0.216
0.752
Post-test LF/HF (Ratio)
N/A
0.33
2.164
0.846
1.501
Table 7. Mean and STD ofRR andHR of five participants
Variable & Condition
participant 1
participant 2
participant 3
participant 4
participant 5
Mean RR(s)
STD(s)
Mean HR(lfmin)
STD(Umin)
Mean RR(s)
STD(s)
Mean HR(l/min)
STD(Umin)
Mean RR(s)
STD(s)
Mean HR(l/min)
STD(Umin)
Mean RR(s)
STD(s)
Mean HR(Umin)
STD(Vmin)
Mean RR(s)
STD(s)
Pre-test
0.853
0/054
70.98
5.68
0.791
0.036
76.29
4.59
1.039
0.088
58.37
5.87
0.849
0.077
71.67
9.35
0.717
0.03
Test
0.82
0.045
73.59
4.7
0.804
0.035
75.14
4.1
0.987
0.067
61.43
4.68
0.82
0.051
73.69
5.51
0.724
0.032
Post-test
N/A
N/A
N/A
N/A
0.821
0.039
73.46
4.45
1.041
0.087
58.3
5,84
0.082
0.054
73.74
6.35
0.732
0.036
Whole range
0.841
0.051
71.95
5.4
0.805
0.037
74.96
4.52
1.024
0.082
59.3
5.72
0.832
0.064
72.86
7.8
0.724
0.033
47

Mean HR(l/min)
STD(Umin)
83.95
3.99
83.14 1 82.38 4.01 \ 5.3
83.16
4.53
Table 7 shows the mean and standard deviation of RR and HR data of a 1 five
participants. Statistical measures have been performed, and the results illustrate in Table
7. We observed from Table 8 that, standard deviations of RR and HR data are lower
during the test section, comparing with the pre-test and post-test sessions. This result
illustrates that the heart rates, or RR intervals closely distribute in a narrow area during
the test section, and loosely distribute in a wide area during the other sections (Figure
32).
Table 8. Statistical analysis of five participants
Variable & Condition
participant 1
participant 2
participant 3
participant 4
participant 5
RMSSD(ms)
NNSO(count)
pNN50(%)
RMSSD(ms)
NNSO(count)
pNN50(%)
RMSSD(ms)
NN50(count)
pNN50(%)
RMSSD(ms)
NN50(count)
pNN50(%)
RMSSD(ms)
NN50(count)
pNN50(%)
Pre-test
40.3
287
19.4
39
24.1
21.1
90.1
410
47.2
109.2
350
33.1
28.8
98
7.8
Test
36.8
139
15.9
39
159
21.5
70.9
319
44.1
73.9
185
25.4
33.7
118
14.3
Post-test
N/A
N/A
N/A
41.3
268
24.5
88.6
366
48.8
64.9
133
18.1
34.3
135
11
Whole range
39
426
18.1
39.8
666
22.4
84.1
1099
46.9
88.3
670
26.6
32.2
351
10.6
Figure 32 illustrates the poincare plot of participant 3 during the pre-test and the
test sections. The vector SD1 and the SD2 indicates the distribution trend. In the pre-test,
SD1 equals to 63.9 ms, SD2 equals to 135.0 ms. During the test, SD1 equals to 50.3 ms,
SD2 equals to 127.9 ms. The RMSSD value indicates the square root of mean squared
differences of successive NN intervals, the NN50 presents the number of interval
48

differences of successive NN intervals more than 50ms, and the proportion derived by
dividing NN50 by the total number of NN intervals is pNN50 value are illustrated in
Table 8. These statistical variables derived from interval differences indicate the heart
beat to beat features of participants.
U I I . I I LJ U.B b i i , . _
0.7 0.8 0.9 1 1.1 1.2 1.3 1.4 1.5 0.6 08 1 12 1.4
RRI (s) RRI (s)
Figure 32. Poincare plot of participant 3 during pre-test (left) and test (right) sections
5.1.3 KFNESICS ANALYSIS
Kinesics analysis of design experiment
Segmentations of design behaviors are generated according to the design product.
Messages have been taken in three columns from videos, which are "Body Language",
"Sketching Activities", and "Analysis". The group estimates two values, "Mental stresses
level in design process", and "performance level", in order to compare the differences
between the design performances and mental stresses level. Table 9 illustrated the design
states and the pertinent design behaviors. With respect to the segments of design states
shown in Table 9, we plot the mental stresses to illustrate the trend of real-time stresses
level and performance level of each participant. Participants' mental stresses during
design activities are shown in Figure 33.
49

-Mental stress of participant 2
State 1 State 2 State 3 State 4 State 5 State 1 State 2 State 3 State 4 State 5
4.5
4
3.5
3
2.5 -Mental stress of participant 4
State 1 State 2 State 3 State 4 State 5 State 6 State 1 State 2 State 3 State 4 State 5 State 6
-Mental stress of participant 6
State 1 State 2 State 3 State 4 State 5 State 6
5
4.5
4
3.5
3 •Mental stress of participant 7
State 1 State 2 State 3 State 4 State 5 State 6
Figure 33. Mental stress variation of participants during design experiment
Since the design experiments were conducted nearly four years ago, the data is not
complete for the analysis of mental stresses, which was not one of the objectives of the
experiment. Necessary data including health condition surveys and the heart rate records
were not recorded. This fact affects the analysis result but it is not fatal. The CWT
experiments were performed as a complement to the design experiment.
50
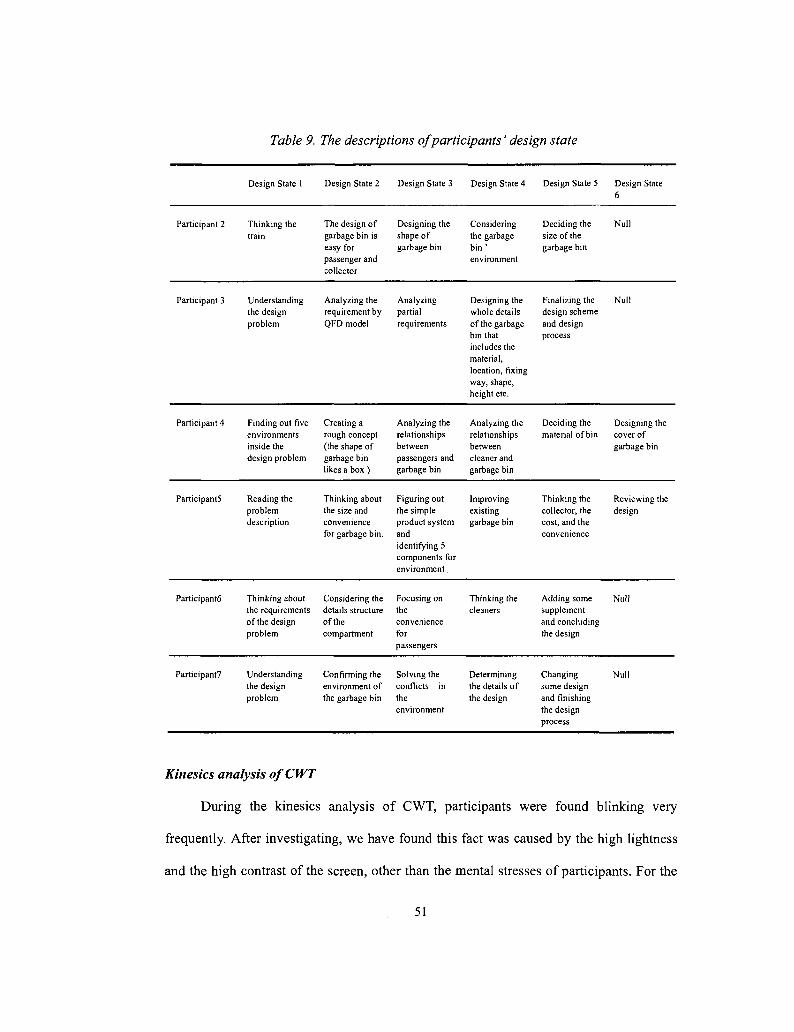
Table 9. The descriptions of participants' design state
Design State 1 Design State 2 Design State 3 Design State 4 Design State 5 Design State 6
Participant 2 Thinking the train
The design of garbage bin is easy for passenger and collector
Designing the shape of garbage bin
Considering the garbage bin ' environment
Deciding the size of the garbage bin
Null
Participant 3
Participant 4
Participants
Participant6
Participant?
Understanding the design problem
Finding out five environments inside the design problem
Reading the problem description
Thinking about the requirements of the design problem
Understanding the design problem
Analyzing the requirement by QFD model
Creating a rough concept (the shape of garbage bin likes a box)
Thinking about the size and convenience for garbage bin.
Considering the details structure of the compartment
Confirming the environment of the garbage bin
Analyzing partial requirements
Analyzing the relationships between passengers and garbage bin
Figuring out the simple product system and identifying 5 components for environment,
Focusing on the convenience for passengers
Solving the conflicts in the environment
Designing the whole details of the garbage bin that includes the material, location, fixing way, shape, height etc.
Analyzing the relationships between cleaner and garbage bin
Improving existing garbage bin
Thinking the cleaners
Determining the details of the design
Finalizing the design scheme and design process
Deciding the material of bin
Thinking the collector, the cost, and the convenience
Adding some supplement and concluding the design
Changing some design and finishing the design process
Null
Designing the cover of garbage bin
Reviewing the design
Null
Null
Kinesics analysis ofCWT
During the kinesics analysis of CWT, participants were found blinking very
frequently. After investigating, we have found this fact was caused by the high lightness
and the high contrast of the screen, other than the mental stresses of participants. For the
51
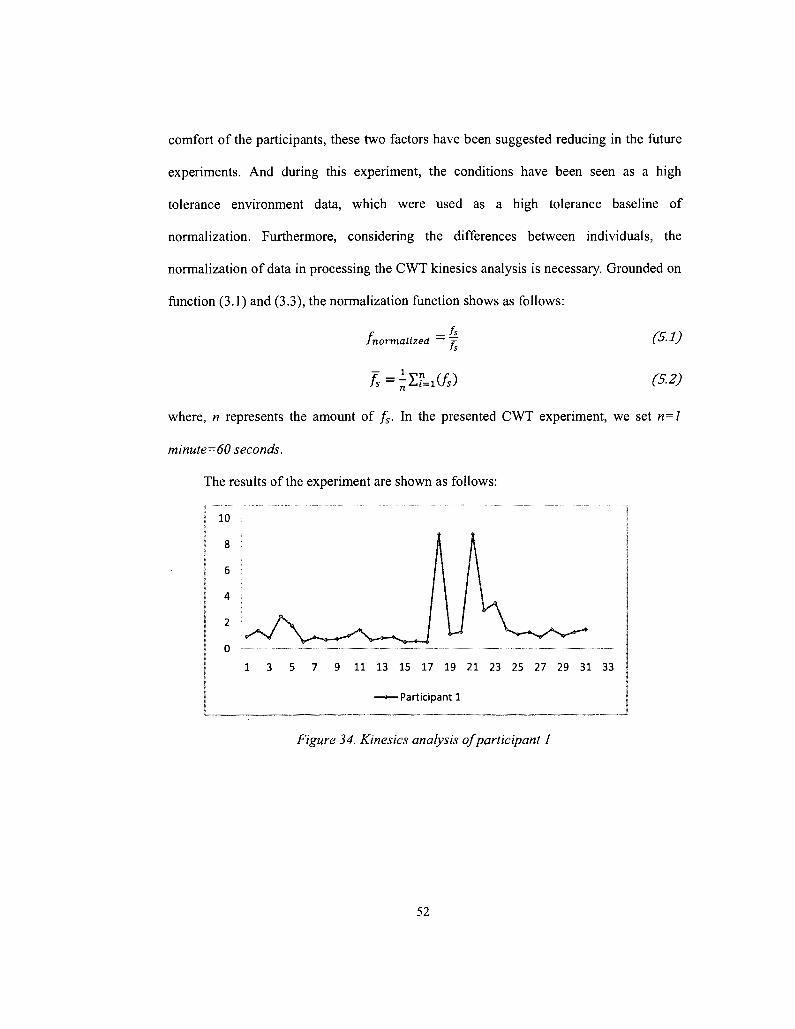
comfort of the participants, these two factors have been suggested reducing in the future
experiments. And during this experiment, the conditions have been seen as a high
tolerance environment data, which were used as a high tolerance baseline of
normalization. Furthermore, considering the differences between individuals, the
normalization of data in processing the CWT kinesics analysis is necessary. Grounded on
function (3.1) and (3.3), the normalization function shows as follows:
fs fr normalized
1 .
n '
fs (5.1)
A = ^Z?=i(/s) (5.2)
where, n represents the amount of fs. In the presented CWT experiment, we set n=l
minute=60 seconds.
The results of the experiment are shown as follows:
Figure 34. Kinesics analysis of participant 1
52

2.5
2
1.5
1
0.5
0
0 5 10 15 20 25 30 35
—©—Participant 2
Figure 35. Kinesics analysis of participant 2
| 6
5
4
3
2
1
0
0 5 10 15 20 25 30 35
—•—Participant 3
Figure 36. Kinesics analysis of participant 3
1 3 I
| 2.5
2
s 1 5
1
0.5
0 '•
1 3 5 7 9 11 13 15 17 19 21 23 25 27 29 31
—•—Participant 4
Figure 37. Kinesics analysis of participant 4
53

5
4
3
2
1
0 '
0 5 10 15 20 25 30
—«— Participant 5
Figure 38. Kinesics analysis of participant 5
Table 10 shows the kinesics analysis results of all five participants. According to
the results of participant 1, 2 and 5, the mental stresses levels were significantly increased
during test comparing with the other sections. For participant 4, the mental stresses level
during test session reduced 0.074% comparing with the pre-test session, but substantially
greater than the post-test session. For participant 3, the mental stresses level of test
session reduced 9.34% compare with the pre-test session, while the mental stresses level
reduced another 13.45% during the post-test session.
Table 10. Kinesics analysis; Test represents the color word test (CWT); Pre-test & Post-test session represent the rest session.
Variable & Condition
Participant 1
Participant 2
Participant 3
Participant 4
Participant 5
Pre-test Mental stress level
0.958008
0.904997
1342802
1.17522
1.325144
Test Mental stress level
2.575501
1.126112
1.21738
1.174346
1.56464
Post-test Mental stress level
N/A
0.983471
1.053624
0.720568
0.569286
54

5.2 CONCLUSIONS
Table 6 and Table 10 show the mental stresses ratios of all five participants. Table
11 and Table 12 are deducted from Table 10 and Table 6, respectively. The correlation
coefficient of these two matrices is 0.761085. In another word, the evaluation result of
mental stresses by using two approaches, which are kinesics analysis and HRV analysis,
have a good similarity, the alike degree with the percentage is 76.1085%. As a result, the
present research has proved that the kinesics analysis result have a 76.1085% similarity
comparing with the result that based on the physiological data analysis.
In virtue to the economic cost of the physiological equipment, the quantification of
mental stresses has been performed for decades but mainly restricted in clinic use. The
present thesis introduces a new economical approach, kinesics analysis, which can be
widely used in psychological study, behaviors study, and the human factor research in
engineering. Thanks to the contactless character, the device of kinesics detection can be
employed in remote operated environment, such as the study on astronauts in the outer
space.
Table 11. Mental stress ratio of kinesics analysis; Test represents the color word test (CWT); Pre-test & Post-test session represent the rest session.
Variable & Condition
Participant 1
Participant 2
Participant 3
Participant 4
Participant 5
Pre-test Mental stress level
-0.62803043
-0.196352583
0.103026171
0.000744244
-0.153067798
Test Mental stress level
1
1
1
1
1
Post-test Mental stress level
N/A
-0.12667
-0.13452
-0.38641
-0.63616
55
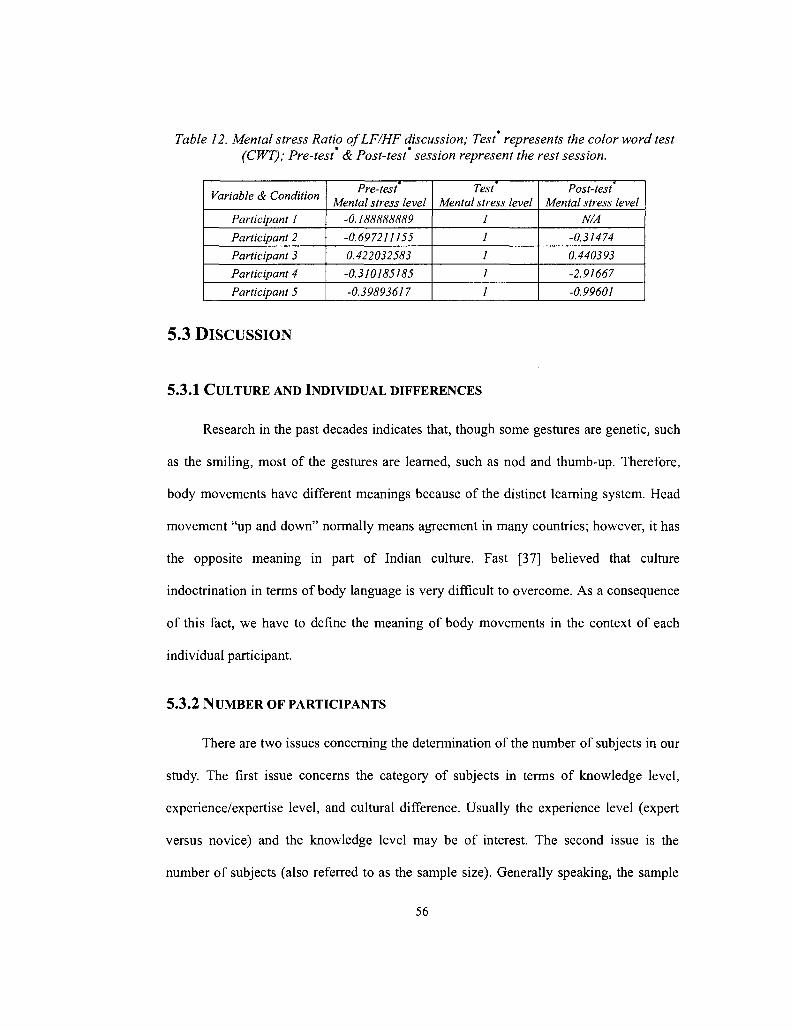
Table 12. Mental stress Ratio ofLF/HF discussion; Test represents the color word test (CWT); Pre-test & Post-test session represent the rest session.
Variable & Condition
Participant 1
Participant 2
Participant 3
Participant 4
Participant 5
« — •
Pre-test Mental stress level
-0.188888889
-0.697211155
0.422032583
-0.310185185
-0.39893617
Test Mental stress level
1
1
1
1
1
Post-test Mental stress level
N/A
-0.31474
0.440393
-2.91667
-0.99601
5.3 DISCUSSION
5.3.1 CULTURE AND INDIVIDUAL DIFFERENCES
Research in the past decades indicates that, though some gestures are genetic, such
as the smiling, most of the gestures are learned, such as nod and thumb-up. Therefore,
body movements have different meanings because of the distinct learning system. Head
movement "up and down" normally means agreement in many countries; however, it has
the opposite meaning in part of Indian culture. Fast [37] believed that culture
indoctrination in terms of body language is very difficult to overcome. As a consequence
of this fact, we have to define the meaning of body movements in the context of each
individual participant.
5.3.2 N U M B E R OF PARTICIPANTS
There are two issues concerning the determination of the number of subjects in our
study. The first issue concerns the category of subjects in terms of knowledge level,
experience/expertise level, and cultural difference. Usually the experience level (expert
versus novice) and the knowledge level may be of interest. The second issue is the
number of subjects (also referred to as the sample size). Generally speaking, the sample
56

size is dependent on the design of the experiment [55]. In a design study, usually the
response cannot be represented by a crisp value.
Table 13 shows some examples about how many participants are chosen in
ergonomic domain. Given the fact of complexity in human factors-related experiments,
Kotval determined the number of participants in his study using eye movement parameter
by simply surveying about 181 published papers in the area of eye movement study [56].
He found that thirteen participants was the best number, and that number was indeed used
for his experiment design. Paquet used five male college students to simulate 3 of 6
construction job tasks [57]. Ryan presented concurrent and retrospective verbal protocol
methods, which were used to collect thoughts from eighteen participants during a manual
handling task involving the repeated transfer of loads between locations at two tables [58].
To explore the interplay between designers' representations and their design activities
investigate the engineering students' use of external representations, Cadella selected four
students (two seniors and two freshmen) from the original dataset [59]. This method was
taken due to the difficulty in determining the sample size for human factors study using
those standard principles in statistics [55].
Table 13. Number of participants
Authors Number of Year participants
Kotval 13 1998 Paquet et al, 2001 5 2001 Ryan and Haslegrave 18 2007 Cadella 4 2006
5.3.3 HEALTH CONDITION OF PARTICIPANTS
Since this is not clinic research, health conditions of participants are not required
by our experiments. Self-reports are taken as valid information, as a convention in this
57

kind of research. Surveys of the health condition have been distributed to participants
preceding formal experiments. Height, weight, age, gender, as well as present diseases
have been recorded for the basic health data. All participants claimed healthy in the
experiments. No major health problem has been observed in any of our participants in six
months before and after experiments. In the further research, physical parameters, such as
blood pressure, heart rate, temperature, lung vital capacity, are expected to be detected to
ensure a better baseline.
5.4 SUMMARY OF CONTRIBUTIONS
Studies on mental stresses have been introduced for decades, as well as the
utilization of kinesics analysis on study human behaviors. It is not until the latest 30 years,
scientists have started to quantify the stresses by using the physiological parameters. But
no research was reported to employ the kinesics study quantifying of the mental stresses.
The present thesis proposes a new approach for quantifying human mental stresses during
the cognitive activities through his/her body language.
The original purpose of the present study was to evaluate the mental stresses during
the design process. Therefore, design experiments have been performed. During these
experiments, the participants have been asked to design a litter-disposal system for
passenger compartments in a train carriage. Kinesics analysis has been employed to
quantify the participants' mental stresses. To verify the evaluation result during the design
experiment, several independent cognitive experiments are employed in the second
session of our experiment. In this session, Stroop CWT has been employed to stimulate
the mental stresses. Kinesics analysis has also been employed to quantify the participants'
mental stresses. Meanwhile, HRV analysis has been applied to evaluate the mental
58

stresses, in addition to verify the result of kinesics study.
The present research result illustrated that kinesics analysis has 76% accuracy on
evaluation of mental stresses comparing with the quantification by using physiological
data. Furthermore, according to the economical feature of kinesics detection, the present
technique can be widely applied to many domains. Such as psychological research,
behaviors study, and the human factor research in engineering area, etc. Due to the
contactless character that is advanced to physiological technologies, the kinesics devices
can also be applied into remote operated environment, such as the study on astronauts in
the outer space.
5.5 FUTURE RESEARCH
The research results presented in the present thesis are preliminary. During the
design process, we noticed that participant's creativity varied as the design states, which
is preparation, acceptance, creation, confirmation, and solving problem. We can observe
the fluctuations of participants' attention and mental stresses through the above data.
Meanwhile, we approved the correlation between Yerkes-Dodson principle and our
experiment data, the results were satisfying.
During the CWT test, the mental stresses levels are represented in relative values.
Since the relative values are conducted from the baseline behaviors of single participant,
the comparison of the variations are within, and only within the physical system of
separated unit. It can be predict that, in the future, this technique can be applied to
evaluate the mental stresses as the unit of measurement, which could be named as
"Mental stresses quotient".
Mental stresses are accompanied by many bodily reactions, such as modifications
59

in the heat rate, blood pressure, blood volume, electrical properties of the skin, brain
waves, temperature and pupil size. These physiological changes can be measured through
some physiological parameters thanks to modern technologies. For example, the HRV
that we have introduced within the present thesis is widely accepted that is an indicator of
mental stresses. A lot of clinic studies have been done using this technique. The eye gaze
tracking system can be used to measure pupil size. It is shown that pupil size increases
with the level of mental stresses. The electroencephalogram (EEG) is also used for brain
waves. There are two measures of stresses and relaxation which can be observed from the
EEG. From the EEG spectrum, activity can be observed in the 8-12 Hz (alpha) frequency
band. A more sophisticated measure of stresses and relaxation is the phase coherence
which shows the phase synchrony, as a function of frequency, from two Merent spatial
locations on the surface of the scalp. It measures the degree to which EEG amplitude
increases or decreases are occurring simultaneously in these regions. It has been shown
that, during meditation, there is a remarkable increase in coherence, especially in the
alpha frequency band.
Newly research result introduces a Doppler radar device to quantify the body
movements. The device can convert all body movements into electrical signals, by
observing the size and the trajectory of the moving part of the body. The device would
help us to improve the manual detection of body movements, and the transformation of
movements signal into digital signals.
In our future experiment, all of above approaches/ techniques will be adopted.
Three web cameras in the lab can be used to monitor the testing participant. The EEG and
Eye-Gaze systems will be the main equipments we are going to explore for this project.
60
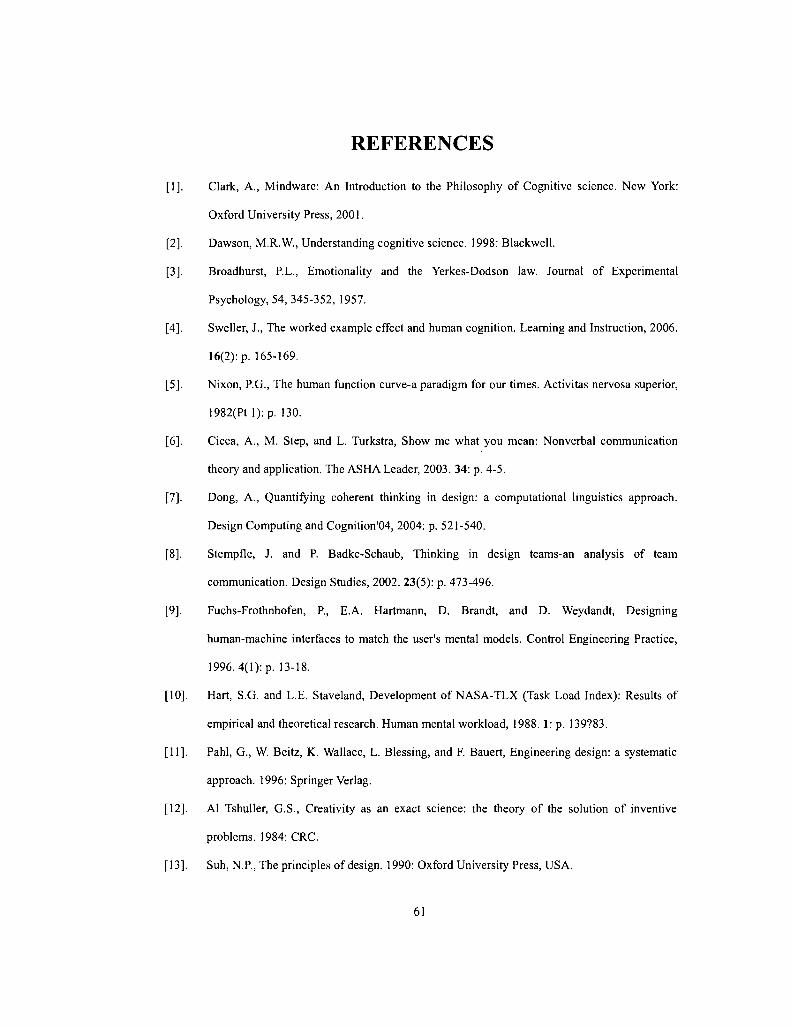
REFERENCES
[1]. Clark, A., Mindware: An Introduction to the Philosophy of Cognitive science. New York:
Oxford University Press, 2001.
[2]. Dawson, M.R.W., Understanding cognitive science. 1998: Blackwell.
[3]. Broadhurst, PL., Emotionality and the Yerkes-Dodson law. Journal of Experimental
Psychology, 54, 345-352, 1957.
[4]. Sweller, J., The worked example effect and human cognition. Learning and Instruction, 2006.
16(2): p. 165-169.
[5]. Nixon, P.G., The human function curve-a paradigm for our times. Activitas nervosa superior,
1982(Ptl):p. 130.
[6]. Cicca, A., M. Step, and L. Turkstra, Show me what you mean: Nonverbal communication
theory and application. The ASHA Leader, 2003. 34: p. 4-5.
[7]. Dong, A., Quantifying coherent thinking in design: a computational linguistics approach.
Design Computing and Cognition'04, 2004: p. 521-540.
[8], Stempfie, J. and P. Badke-Schaub, Thinking in design teams-an analysis of team
communication. Design Studies, 2002. 23(5): p. 473-496.
[9], Fuchs-Frothnhofen, P., E.A. Hartmann, D. Brandt, and D. Weydandt, Designing
human-machine interfaces to match the user's mental models. Control Engineering Practice,
1996. 4(1): p. 13-18.
[10], Hart, S.G. and L.E. Staveland, Development of NASA-TLX (Task Load Index): Results of
empirical and theoretical research. Human mental workload, 1988.1: p. 139783.
[11], Pahl, G., W. Beitz, K. Wallace, L. Blessing, and F. Bauert, Engineering design: a systematic
approach. 1996: Springer Verlag.
[12]. Al Tshuller, G.S., Creativity as an exact science: the theory of the solution of inventive
problems. 1984: CRC.
[13]. Suh, N.P, The principles of design. 1990: Oxford University Press, USA.
61

[14]. Gero, J.S., Artificial intelligence in design'OO. 2000: Kluwer Academic Publishers.
[15]. Zeng, Y, Axiomatic theory of design modeling. Journal of Integrated Design and Process
Science, 2002. 6(3): p. 1-28.
[16]. Maxwell, T.T., Harnessing complexity in design. Journal of Integrated Design and Process
Science, 2002. 6(3): p. 63-74.
[17]. Dorst, K. and N. Cross, Creativity in the design process: co-evolution of problem t i olution.
Design Studies, 2001. 22(5): p. 425-437.
[18]. Akin, O. and C. Akin, On the process of creativity in puzzles, inventions, and designs. Autom
Constr, 1998. 7(2): p. 123-138.
[19]. Dasgupta, S., Creativity in invention and design: Computational and cognitive explorations of
technological originality. 1994: Cambridge Univ Pr.
[20]. Yerkes, R.M. and J.D. Dodson, The relation of strength of stimulus to rapidity of habit
formation. Essential readings in sport and exercise psychology, 2007: p. 13.
[21]. Dyregrov, A., R. Solomon, and C.F. Bassoe, Mental mobilization processes in critical incident
stress situations. International Journal of Emergency Mental Health, 2000. 2(2): p. 73-82.
[22]. Gaillard, A.W.K., Comparing the concepts of mental load and stress. Ergonomics, 1993. 36(9):
p. 991-1005.
[23]. Gaillard, A.W.K. and C.J.E. Wientjes, Mental load and work stress as two types of energy
mobilization. Work & Stress, 1994. 8(2): p. 141-152.
[24], Bourne, L.E. and R.A. Yaroush, Stress and cognition: A cognitive psychological perspective.
Unpublished manuscript, NASA grant NAG2-1561, 2003.
[25]. Tovey, M., S. Porter, and R. Newman, Sketching, concept development and automotive
design. Design studies, 2003. 24(2): p. 135-153.
[26]. Goldschmidt, G., On visual design thinking: The vis kids of architecture. Design Studies,
1994. 15: p. 158-174.
[27], Kirschner, Cognitive load theory, in Learn. Instruct. 12(special issue): 1-154. 2002.
[28]. Stokes, A.F. and K. Kite, Flight stress: stress, fatigue, and performance in aviation. 1994:
62
Ashgate
[29]. Pollock, V., D. Cho, D. Reker, J. Volavka, and -. 167, Profile mood of states: The factors and
their correlates. Nervous Mental Disorders, 1979.167(10): p. 612-616.
[30]. Zhu, S., S.J. Yao, and Y. Zeng, A novel approach to quantifying designer's mental stress in the
conceptual design process. ASME DETC/CIE, DETC2007-35887, 2007.
[31]. Diermeier, D., W.J. Hopp, and S. Iravani, Innovating Under Pressure—Towards A Science of
Crisis Management.
[32]. Birdwhistell, R.L., Background to Kinesics. ETC.: A Journal of General Semantics, 1955. 13:
p. 10-18.
[33]. Darwin, C, A Monograph on the Sub-class Cirripedia : The Balanida; (or sessile cirrepedes)
the Verrucidae. 1854 (Ray society).
[34]. Donaldson, E.L., Identification of characteristic movement styles and their possible
relationship to tension and stress, in Communication. 1979, Simon Fraser University.
[35]. Argyle, M., Bodily communication 1990: New York: International Universities Press.
[36]. Hickson, M. and D.W. Stacks, NVC, nonverbal communication: studies and applications.
1985: WC Brown Publishers.
[37]. Fast, J., Body Language. 1970 (M. Evans and Company, Inc.).
[38]. Berntson, G.G., J. Thomas Bigger, D.L. Eckberg, P. Grossman, P.G. Kaufmann, M. Malik,
H.N. Nagaraja, S.W. Porges, J.P. Saul, and P.H. Stone, Heart rate variability: origins, methods,
and interpretive caveats. Psychophysiology, 1997. 34(6): p. 623-648.
[39]. Malik, M., Heart Rate Variability: Standards of Measurement, Physiological Interpretation,
and Clinical Use. Circulation, 1996. vol. 93: p. 1043-1065.
[40]. Forges, S.W. and D.C. Raskin, Respiratory and heart rate components of attention. Journal oj
Experimental Psychology, 1969. 81(3): p. 497-503.
[41]. Lacey, J.I. and B.C. Lacey, Verification and extension of the principle of autonomic
response-stereotypy. The American Journal of Psychology, 1958: p. 50-73.
[42], Price, A.D., Heart Rate Variability and Respiratory Concomitants of Visual and Nonvisual
63

"Imagery" and Cognitive Style. Journal of Research in Personality, 1975. 9: p. 341-355.
[43]. Thackray, R.I., K.N. Jones, and R.M. Touchstone, Personality and physiological correlates of
performance decrement on a monotonous task requiring sustained attention. British journal of
psychology (London, England: 1953), 1974. 65(3): p. 351.
[44]. Kahneman, D., Attention and effort. 1973: Englewood Cliffs, NJ: Prentice-Hall.
[45]. Kalsbeek, J.W.H. and J.H. Ettema, Scored regularity of the heart rate pattern and the
measurement of perceptual or mental load. Ergonomics, 1963. 6: p. 306-307.
[46]. Lacey, J.I., Somatic response patterning and stress: Some revisions of activation theory. In:
Appley, M.H. and Trumbull, R., Editors. Psychological stress: Issue in research, 1967: p.
14-37.
[47]. Porges, S.W. and D.C. Raskin, Respiratory and heart rate components of attention. Journal of
Experimental Psychology, 1969. 81: p. 497-503.
[48]. Sayers, B.M., Analysis of heart rate variability. Ergonomics, 1973.16: p. 17-32.
[49]. Lang, P.J., L.A. Sroufe, and J.E. Hastings, Effects of feedback and instructional set on the
control of cardiac-rate variability. Journal of Experimental Psychology, 1967. 75(4): p.
425-431.
[50]. Hnatiow, M. and P.J. Lang, Learned stabilization of cardiac rate. Psychophysiology, 1965.
1(4): p. 330-336.
[51]. Higuchi, T., K. Imanaka, and T. Hatayama, Freezing degrees of freedom under stress:
Kinematic evidence of constrained movement strategies. Human Movement Science, 2002.
21(5-6): p. 831-846.
[52]. Kumar, M., M. Weippert, R. Vilbrandt, S. Kreuzfeld, and R. Stoll, Fuzzy Evaluation of Heart
Rate Signals for Mental Stress Assessment. IEEE Transactions on Fuzzy Systems, 2007.
15(5): p. 791-808.
[53]. Hon, E.H., The electronic evaluation of the fetal heart rate: Preliminary report. Obstetrical &
Gynecological Survey, 1958. 13(5): p. 654.
[54]. Anita Boardman, F.S.S., Ana Paula Rocha, Argentina Leite, A study on the optimum order of
64

autoregressive models for heart rate variability. Physiological Measurement, 2002. 23: p.
325-336
[55]. Montgomery, D.C., Design and Analysis of Experiments (Fifth Edition). 2001: John Wiley
and Sons, Inc.
[56]. Kotval, X.P., Eye movement based evaluation of human-computer interfaces in Ph.D. 1998,
The Pennsylvania State University.
[57]. Paquet, V.L., L. Punnett, and B. Buchholz, Validity of fixed-interval observations for postural
assessment in construction work. Applied Ergonomics, 2001. 32(3): p. 215-224.
[58]. Ryan, B. and CM. Haslegrave, Use of concurrent and retrospective verbal protocols to
investigate workers?thoughts during a manual-handling task. Applied Ergonomics, 2007.
38(2): p. 177-190.
[59]. Cardella, M.E., C.J. Atman, and R.S. Adams, Mapping between design activities and external
representations for engineering student designers. Design Studies, 2006. 27(1): p. 5-24.
65


![Contents...[edit] Kinesics Information about the relationship and affect of these two skaters is communicated by their body posture, eye gaze and physical contact. The term "Kinesics"](https://img.pdfslide.net/doc/110x75/5f7dcc77b616ad57754f7a24/contents-edit-kinesics-information-about-the-relationship-and-affect-of-these.jpg)