Embed Size (px)
Citation preview

HAL Id: hal-00094074https://hal.archives-ouvertes.fr/hal-00094074
Submitted on 13 Jan 2021
HAL is a multi-disciplinary open accessarchive for the deposit and dissemination of sci-entific research documents, whether they are pub-lished or not. The documents may come fromteaching and research institutions in France orabroad, or from public or private research centers.
L’archive ouverte pluridisciplinaire HAL, estdestinée au dépôt et à la diffusion de documentsscientifiques de niveau recherche, publiés ou non,émanant des établissements d’enseignement et derecherche français ou étrangers, des laboratoirespublics ou privés.
Evaluation of ozone and water vapor fields from theECMWF reanalysis ERA-40 during 1991–1999 in
comparison with UARS satellite and MOZAIC aircraftobservations
E. Oikonomou, A. O’Neill
To cite this version:E. Oikonomou, A. O’Neill. Evaluation of ozone and water vapor fields from the ECMWF reanalysisERA-40 during 1991–1999 in comparison with UARS satellite and MOZAIC aircraft observations.Journal of Geophysical Research: Atmospheres, American Geophysical Union, 2006, 111, pp.D14109.�10.1029/2004JD005341�. �hal-00094074�

Evaluation of ozone and water vapor fields from the ECMWF
reanalysis ERA-40 during 1991–1999 in comparison with UARS
satellite and MOZAIC aircraft observations
E. K. Oikonomou1 and A. O’Neill2
Received 12 August 2004; revised 27 May 2005; accepted 13 March 2006; published 29 July 2006.
[1] The European Centre for Medium-Range Weather Forecasts (ECMWF) 40-year Re-analysis (ERA-40) ozone and water vapor reanalysis fields during the 1990s have beencompared with independent satellite data from the Halogen Occultation Experiment(HALOE) and Microwave Limb Sounder (MLS) instruments on board the UpperAtmosphere Research Satellite (UARS). In addition, ERA-40 has been compared withaircraft data from the Measurements of Ozone and Water Vapour by Airbus In-ServiceAircraft (MOZAIC) program. Overall, in comparison with the values derivedfrom the independent observations, the upper stratosphere in ERA-40 has about 5–10%more ozone and 15–20% less water vapor. This dry bias in the reanalysis appears tobe global and extends into the middle stratosphere down to 40 hPa. Most of thediscrepancies and seasonal variations between ERA-40 and the independent observationsoccur within the upper troposphere over the tropics and the lower stratosphere over thehigh latitudes. ERA-40 reproduces a weaker Antarctic ozone hole, and of less verticalextent, than the independent observations; values in the ozone maximum in the tropicalstratosphere are lower for the reanalysis. ERA-40 mixing ratios of water vapor areconsiderably larger than those for MOZAIC, typically by 20% in the tropical uppertroposphere, and they may exceed 60% in the lower stratosphere over high latitudes. Theresults imply that the Brewer-Dobson circulation in the ECMWF reanalysis system is toofast, as is also evidenced by deficiencies in the way ERA-40 reproduces the watervapor ‘‘tape recorder’’ signal in the tropical stratosphere. Finally, the paper examines thebiases and their temporal variation during the 1990s in the way ERA-40 compares to theindependent observations. We also discuss how the evaluation results depend on theinstrument used, as well as on the version of the data.
Citation: Oikonomou, E. K., and A. O’Neill (2006), Evaluation of ozone and water vapor fields from the ECMWF reanalysis ERA-
40 during 1991–1999 in comparison with UARS satellite and MOZAIC aircraft observations, J. Geophys. Res., 111, D14109,
doi:10.1029/2004JD005341.
1. Introduction
[2] During the last three decades satellites have been animportant source of atmospheric data. They have beenproviding measurements for a range of atmospheric species,with good temporal and geographical coverage. Thesemeasurements may, however, have substantially differentaccuracies; they are not uniformly distributed in space ortime; and data suppliers commonly release upgraded prod-ucts, so that research findings may need to be checked.[3] The above shortcomings have been ameliorated, to
some extent, as a result of improved methods in dataassimilation. The latest reanalysis, European Centre forMedium-Range Weather Forecasts (ECMWF) 40-year Re-
analysis (ERA-40) [Uppala, 2001], is based on the use of asingle, 3-D (variational) data assimilation scheme, whichhas processed data from September 1957 to August 2002 ina consistent manner. Together with the reanalysis fromNational Center for Atmospheric Research/National Centersfor Environmental Prediction (NCEP/NCAR), which spansthe period from 1948 onward [Kalnay et al., 1996; Kistler etal., 2001], ERA-40 provides global analyses of the atmo-sphere during this period. For atmospheric ozone and watervapor, ERA-40 currently represents the largest continuousdata sets available. ERA-40 was set up in order to improvefurther the results of the previous reanalysis, ERA-15,which was also produced by ECMWF covering the periodJanuary 1979 to February 1994 [Gibson et al., 1997].[4] Even though several difficulties are still encountered
in data assimilation schemes, they are considered an indis-pensable scientific technique, particularly when applied inweather forecasting and environmental monitoring. A prin-cipal question regarding the output of such schemes is towhat extent the reanalysis results are trustworthy, especially
JOURNAL OF GEOPHYSICAL RESEARCH, VOL. 111, D14109, doi:10.1029/2004JD005341, 2006
1Service d’Aeronomie, Centre National de la Recherche Scientifique,Verrieres Le Buisson, France.
2Department of Meteorology, University of Reading, Reading, UK.
Copyright 2006 by the American Geophysical Union.0148-0227/06/2004JD005341
D14109 1 of 27

Figure 1
D14109 OIKONOMOU AND O’NEILL: EVALUATION OF OZONE AND WATER VAPOR FIELDS
2 of 27
D14109

in areas and times where no observations are assimilatedinto the data assimilation system. To answer this question,the reanalysis results need to be validated against indepen-dent sets of data, i.e., those data that have not been used inproducing the reanalysis.[5] The purpose of the present work is to provide a
systematic evaluation of the ERA-40 ozone and water vaporproducts, two of the most fundamental and widely used inresearch atmospheric species. To do so, the ERA-40 ozoneand water vapor fields during the 1990s are compared withtwo sets of independent measurements that were not utilizedin generating the reanalysis. The first are measurementsfrom the Halogen Occultation Experiment (HALOE) andMicrowave Limb Sounder (MLS) instruments on board theUpper Atmosphere Research Satellite (UARS), which waslaunched in September 1991. These observations are used toevaluate their counterparts in ERA-40 in the stratosphere(1 to 100 hPa). The second set derives from the Measure-ment of Ozone and Water Vapour by Airbus In-ServiceAircraft (MOZAIC) project. The MOZAIC measurementsare used for the ERA-40 evaluation in the upper tropo-sphere/lower stratosphere (UTLS) region, typically between195 and 290 hPa, where data availability is scarce owing tolimitations of remote sensing and unreliability at thesealtitudes of sondes.[6] The aims of the present study are as follows: (1) to
derive the ERA-40 climatologies of ozone and water vapor;(2) to provide a quantitative reference of the ERA-40performance for ozone and water vapor in comparison withthe UARS and MOZAIC observations; (3) to examine theseasonal and geographical variations of these differences inthe stratosphere and the UTLS region; (4) to investigate theexistence of any biases and their temporal variation inthe reanalysis ozone and water vapor products throughoutthe 1990s; and (5) to study how ERA-40 captures specificphenomena of interest, such as the Antarctic and Arcticozone holes and the tape recorder signal in water vapor overthe tropics.[7] The ECMWF ERA-40 ozone and water vapor data
assimilation schemes are briefly described in section 2,along with the observations assimilated into the system.Section 3 describes the measurements against which ERA-40 is evaluated, and section 4 describes the method used.The results of the comparison for ozone and water vapor aregiven in sections 5 and 6, respectively. Results are discussedin section 7 and summarized in section 8.
2. ERA-40 Data Assimilation Scheme
[8] ERA-40 used a 3D-variational data assimilation sys-tem based on the Integrated Forecasting System (IFS)developed jointly by ECMWF and Meteo-France [Rabieret al., 1998]. ERA-40 has T159 spectral resolution in thehorizontal and 60 levels in the vertical, of which 26 are inthe stratosphere. The system produces a variety of three-dimensional fields, including ozone and water vapor.
[9] In ERA-40 the production and loss of ozone in thestratosphere are governed by an updated version of thechemistry parameterization scheme originally developed byCariolle and Deque [1986]. The scheme assumes that thechemical changes in ozone can be described by a linearrelaxation toward photochemical equilibrium, and the pa-rameterization makes use of the stratospheric equivalentcontent of chlorine (for further details, see Dethof and Holm[2002, 2004]). To minimize the model bias, ERA-40 makesuse of the ozone climatology derived from observationsfollowing Fortuin and Langematz [1994]. In order torepresent some diurnal variability in the ozone field, theparameterization scheme is on only during daylight. Ozonedestruction by chlorine activated on polar stratosphericclouds is parameterized when the temperature drops belowthe 195 K threshold.[10] With regard to the water vapor field, prior to 1999
and in a preoperational test version of the ECMWF model,the water vapor values in the tropical upper stratosphere andthroughout much of the extratropical stratosphere werefound to be too low [Simmons et al., 1999]. To avoid anunrealistic drying of the stratosphere, ERA-40 adopted asimple parameterization of the upper stratospheric moisturesource due to methane (CH4) oxidation and more details onthis scheme can be found in the ECMWF IFS documenta-tion (http://www.ecmwf.int/research/ifsdocs/) regardingboth the scheme used in ERA-40 (Cycle 23r4), as well asthe later operational versions of the scheme.[11] The ozone observations assimilated into ERA-40 are
only from satellites and no conventional data are includedin the scheme (surface, ozonesonde, profiler, pilot oraircraft measurements). ERA-40 assimilates (1) total col-umn ozone (version 7 data) retrieved from the Total OzoneMapping Spectrometer (TOMS) [McPeters et al., 1996]and (2) ozone vertical profiles derived from the nadir-viewing solar backscatter ultraviolet (SBUV) [Bhartia etal., 1996].[12] The water vapor data assimilated into ERA-40 are
humidity profiles from radiosondes, which only provide avery limited amount of information in the stratosphere, andradiances from a number of instruments. The radiance datacome from the following instruments: (1) the VerticalTemperature Profile Radiometer (VTPR) on board NOAA2–5 satellites [McMillin et al., 1973]; (2) the Special SensorMicrowave Imager (SSM/I) on board the NOAA satellitesof the Defense Meteorological Satellite Program (DMSP)[Hollinger, 1990; Hollinger et al., 1990]; and (3) the HighResolution Infrared Radiation Sounder (HIRS/2 andHIRS/3) instruments from both TIROS Operational Ver-tical Sounding (TOVS) and Advanced TOVS (ATOVS).Nevertheless, the stratospheric humidity fields from ERA-40are completely unaffected by assimilation of humidity obser-vations. This is because the analysis increments were forcedto be zero above a diagnosed model tropopause and thestratospheric humiditywas changed by the analysis procedure
Figure 1. Three-monthly HALOE, ERA-40, and HALOE–ERA-40 ozone zonal means for HALOE version 19 combinedsunrise and sunset measurements during the period 11 October 1991 to 31 December 1999 for (a) March-April-May(MAM), (b) June-July- AuJJA, (c) SON, and (d) DJF. The contour range for both HALOE and ERA-40 ozone fieldsis [0, 12] ppmv with a 1 ppmv step. The contour range for the HALOE–ERA-40 differences is [�4, 4] ppmv with a0.5 ppmv step.
D14109 OIKONOMOU AND O’NEILL: EVALUATION OF OZONE AND WATER VAPOR FIELDS
3 of 27
D14109

Figure 2
D14109 OIKONOMOU AND O’NEILL: EVALUATION OF OZONE AND WATER VAPOR FIELDS
4 of 27
D14109

only if it was necessary to remove supersaturation caused byan analysis increment in temperature.[13] The ERA-40 3D-variational assimilation system
adopts a univariate scheme for ozone, in which the back-ground errors of ozone are assumed uncorrelated withbackground errors in other variables. The ozone backgrounderrors are calculated using the method developed by Fisherand Anderson [2001]. For water vapor, calibrated (level 1c)radiances are assimilated directly [Andersson et al., 1998],except for total column water vapor derived from the SSM/Iradiances, which are assimilated via a 1D-variationalscheme, and the TOVS and VTPR measurements that areconverted from level 1b (raw radiances) to calibrated level1c radiances. The major changes undertaken in the ECMWFsystem and their advantages are summarized by McNally etal. [1999].
3. Independent Observations Used for theERA-40 Validation
3.1. Ozone and Water Vapor Data From the UARSSatellite
[14] The UARS satellite, launched in September 1991,orbits at an altitude of 600 km observing almost the entireglobe from 80�N to 80�S. Instruments on board includeHALOE and MLS [Reber, 1993]. HALOE makes daily 15sunrise and 15 sunset solar occultation measurements,giving global coverage typically in 3–4 weeks. Its operationhas been very stable; Flaud et al. [1990], Russell et al.[1993] and Marshall et al. [1994] give details of theHALOE retrieval algorithm and its errors, and Bruhl et al.[1996] and Hervig et al. [1996] give details of the instru-mental errors. The HALOE solar tracking system hasperformed stably enough to believe that ozone and watervapor trends observed by HALOE are not severely influ-enced by either the instrument’s orbital geometry or anysmall changes in the azimuth tracking. The eruption ofMount Pinatubo in 1991 released aerosols into the atmo-sphere that strongly affected the ozone channel below25 km. The estimation of errors in HALOE data used inthis paper includes aerosol-related error. The HALOEprocessing removes this error with better than 90% accuracy[Steele and Turco, 1997]. The official repository for UARSHALOE data is the NASA Goddard Space Flight Center’sDistributed Active Archive Center (DAAC). The HALOEarchive can be downloaded after registration on http://daac.gsfc.nasa.gov/data/dataset/UARS/HALOE/.[15] The MLS instrument, also on board UARS, takes
day and night measurements [Jarnot et al., 1996]. Itcomprises three radiometers operating at 63, 183 and205 GHz [Barath et al., 1993; Waters, 1993; Waters etal., 1999]. The MLS retrieval algorithms [Read et al., 2001;Rodgers, 1976] produce different levels of output data (J. R.Burke and T. A. Lungu, Upper Atmosphere ResearchSatellite, Microwave Limb Sounder standard formatted dataunits, 1996, distributed with MLS data, and available from
the MLS home page at http://mls.jpl.nasa.gov/). Despite thehigh-resolution specifications, MLS experienced severalproblems during its operation that resulted into periods ofsparse or even complete lack of data (see Livesey et al.[2003] for the full MLS calendar coverage). Giventhe problems and data uncertainties encountered in theMLS records, particularly in the LS, and since MLSretrievals were found to be affected by various error sources[Froidevaux et al., 1996], several data versions have beenproduced in order to improve the quality of the MLSarchive. A few changes were made between version 3[Froidevaux et al., 1996] and version 4 (V4). The latestversion 5 (V5) has improved the accuracy and precision ofvarious species in the LS, though the overall precision forozone data is poorer (except at 100 hPa) compared with V4[Livesey et al., 2003]. A further version 7.02 is available forwater vapor, derived from the MLS 183 GHz radiances[Read et al., 2004a]. Aerosols are believed to have anegligible effect on the MLS data because the signature ofMount Pinatubo is not observed in the measured MLSradiances, thus making MLS extremely valuable to correctother data sets affected by aerosols, such as the SAGE IIobservations [Cunnold et al., 1996a, 1996b]. Furthermore,studies suggest a 0.1–0.2%/year MLS stability (at least>25 km) when compared with SAGE II and HALOE, aswell as when comparing MLS temperatures in the tropicswith the NCEP archive [Stratospheric Processes and theirRole in Climate (SPARC), 1998]. In the LS, however, theMLS uncertainties are large and depend on the version used.The official repository for the UARS MLS data is DAAC,where MLS data can be directly download from http://daac.gsfc.nasa.gov/data/dataset/UARS/MLS/.
3.2. Ozone and Water Vapor Data From theMOZAIC Program
[16] MOZAIC offers a unique opportunity to evaluateERA-40 in the UTLS region, where data from the MLS andHALOE instruments are either unreliable or discontinuousin time at aircraft cruise levels. The MOZAIC program ofthe European Commission was originally developed tostudy atmospheric chemistry in the UTLS. MOZAIC makesuse of commercial flights from four European airlines:Lufthansa, Air France, Austrian Airlines and Sabena (oper-ated by Lufthansa since February 2003). For the purposes ofthe program, Airbus A340 aircraft have been equipped withspecially designed devices that measure in situ ozone[Marenco et al., 1998] and relative humidity (RH), fromwhich the water vapor mass mixing ratio is calculated byapplying the Goff-Gratch formula [Helten et al., 1998].[17] The MOZAIC program extends from January 1993
up to the present. It became fully operational on 1 August1994 and consists of three phases: (1) MOZAIC-I fromJanuary 1993 to June 1996: the ozone and water vapordevices were developed, tested and installed on board theMOZAIC aircraft (see Helten et al. [1998] for the humiditysensors and Thouret et al. [1998] for the ozone sensors);
Figure 2. Three-monthly MLS, ERA-40, and MLS–ERA-40 ozone zonal means for MLS version 5 measurements duringthe period 19 September 1991 to 27 July 1999 for (a) MAM, (b) JJA, (c) SON, and (d) DJF. The contour range for bothMLS and ERA-40 ozone fields is [0, 12] ppmv with a 1 ppmv step. The contour range for the MLS–ERA-40 differences is[�4, 4] ppmv with a 0.5 ppmv step.
D14109 OIKONOMOU AND O’NEILL: EVALUATION OF OZONE AND WATER VAPOR FIELDS
5 of 27
D14109

Figure 3
D14109 OIKONOMOU AND O’NEILL: EVALUATION OF OZONE AND WATER VAPOR FIELDS
6 of 27
D14109

(2) MOZAIC-II from October 1996 to September 1999: theozone and water vapor measurements from MOZAIC-Iwere continued and also evaluated; and (3) MOZAIC-IIIfrom February 2000 to the end of 2004: CO devices wereinstalled in all five MOZAIC aircraft between May 2001and February 2003 and one NOy measuring device wasinstalled on board one MOZAIC aircraft.[18] The MOZAIC aircraft routes provide good spatial
coverage in the UTLS around the tropics and midlatitudes,with the majority of the flights (in total 20,963 processedand available flights up to 31 August 2003) being over theNorth Atlantic air corridor: North America (48%), theCaribbean (4%) and Central America (8%), South America(8%), Africa (8%), the Middle East, Southern and SoutheastAsia (18%), and the Far East (China, Hong-Kong, Japan,18%). The MOZAIC data refer to five standard cruisealtitudes: 9 km (285–290 hPa), 10 km (263–248 hPa),10.6 km (242–237 hPa), 11.2 km (223–215 hPa) and11.8 km (207–195 hPa), with the majority of the flightsbetween 10.6 and 11.2 km.[19] Most of the MOZAIC devices are now considered
well calibrated and most of the intercomparisons haveshown an excellent agreement between different MOZAICaircraft when they are sufficiently close in time. TheMOZAIC ozone probes provide a detection limit of 2 ppbvand a precision of ±2 ppbv (or ±2%) in the troposphere[Marenco et al., 1998]. Higher ozone discrepancies are,however, found in the stratosphere for flights comparable intime and space [Thouret et al., 1998]. The MOZAIC ozonemeasurements agree by 3–13% with ozonesondes in thetroposphere and above the boundary layer, but larger differ-ences exist in the UTLS region where ozonesondes areunreliable as calibration devices. During the MOZAICprogram the relative humidity (RH) instruments providewater vapor information with a detection limit of 20 ppmv;and the water vapor calculations are within ±4% and ±7% ofthe RH in the middle troposphere and the UTLS, respec-tively. Comparisons of the MOZAIC RH devices with other
RH measuring techniques indicate a ±(5–10)% agreement[Helten et al., 1998].
4. Methodology
[20] In the present study, we use ERA-40 products onpressure levels and at full temporal resolution (i.e., at 6-hourintervals: 0000, 0600, 1200, and 1800 UTC each day). TheERA-40 data are then interpolated to the positions and timesof the satellite or aircraft measurements by using a cubicinterpolation scheme in the horizontal (see http://www.ecmwf.int/research), a logarithmic spline interpolationin the vertical, and a simple linear interpolation in time.[21] The HALOE retrieval algorithm was designed for the
stratosphere and above. With most problems affecting theHALOE ozone retrievals now considered solved, littleimprovement is expected beyond the current version ofthe HALOE data. The present study makes use of version19 level 2 HALOE data. Here we consider only the HALOEprofiles down to 100 hPa, in order to keep a vertical datahomogeneity for the ERA-40 versus HALOE comparisonthroughout the period from 11 October 1991 to 31 Decem-ber 1999, and also in order to compare ERA-40 withmeasurements from both HALOE and MLS. ERA-40 isavailable up to, and including, the highest model level of0.1 hPa, though accuracy declines close to the top modellevel, and ERA-40 products interpolated to standard pres-sure levels are available to users only up to 1 hPa. For thesereasons, and also the fact that the HALOE profile measure-ments are not given at set pressure, the ERA-40 evaluationagainst HALOE goes up only to 2 hPa.[22] The MLS ozone measurements have good temporal
coverage till June 1995, when MLS started operating withalternate on and off periods for power savings. Here theperiod of the ozone ERA-40 versus MLS evaluation isbetween the start of the MLS operation on 19 September1991 up to 27 July 1999, after which date no processedMLS data are publicly available at present. The Level 3ATMLS products are supplied in 37 preset pressure levels from
Table 1. HALOE–ERA-40 Ozone Differences
Pressure, hPa
HALOE–ERA-40 Ozone Differencesa
Global, ppmv Tropics,b ppmv Midlatitudes,c ppmv NH High Latitudes,d ppmv SH High Latitudes,e ppmv
2 �0.56 (�11.6%) �0.41 (�8.4%) �0.63 (�12.2%) �0.68 (�15.2%) �0.83 (�20.0%)4 �0.28 (�4.3%) �0.22 (�2.9%) �0.30 (�4.4%) �0.26 (�4.4%) �0.53 (�9.9%)10 0.20 (2.1%) 0.37 (3.8%) 0.05 (0.4%) 0.20 (3.7%) 0.003 (�0.3%)20 0.28 (4.0%) 0.50 (7.2%) 0.22 (3.5%) �0.16 (�4.3%) 0.004 (�0.4%)50 0.006 (2.5%) 0.20 (15.4%) �0.10 (�5.6%) �0.23 (�9.2%) �0.16 (�7.8%)70 �0.02 (�4.4%) 0.09 (21.6%) �0.12 (�9.7%) �0.10 (�5.4%) �0.06 (�2.4%)100 �0.06 (�26.5%) �0.04 (�33.8%) �0.09 (�19.5%) 0.005 (�0.9%) �0.08 (�46.6%)
aHALOE combined sunrise and sunset version 19 measurements for the period 11 September 1991 to 31 December 1999. In total, 2235 days of validmeasurements have been used for the validation, which represent 67,050 HALOE sunrise and sunset profiles (30 per day).
bTropics, 30�S to 30�N.cMidlatitudes, 30�–60�N and 30�–60�S.dNorthern Hemisphere high latitudes, >60�N. No HALOE data are available during NH winter (DJF).eSouthern Hemisphere high latitudes, >60�S. No HALOE data are available during SH winter (JJA).
Figure 3. Three-monthly MOZAIC, ERA-40, and MOZAIC–ERA-40 ozone zonal means during the period 1 August1994 to 31 December 1999 for (a) MAM, (b) JJA, (c) SON, and (d) DJF. The contour range for both MOZAIC and ERA-40ozone fields is [0, 600] ppmv with a 50 ppmv step. The contour range for the MOZAIC–ERA-40 differences is [�300,100] ppmv with a 0.25 ppmv step. PV = 2 pvu (thick white line). White areas represent data gaps.
D14109 OIKONOMOU AND O’NEILL: EVALUATION OF OZONE AND WATER VAPOR FIELDS
7 of 27
D14109

464 to 0.000464 hPa, though here we use only the ozoneMLS files between 1 and 68 hPa. This vertical range isappropriate for scientific applications because the MLSozone data at 100 hPa have significant uncertainty of largerthan 50% (see Table 10 from Livesey et al. [2003]). Onlydata flagged as good quality are used here. Several MLSdata versions have been produced owing to some instabilityin instrument performance. For comparison with the ERA-40 ozone field, we focus on the MLS V5 data.[23] The procedure described above for the MLS ozone
validation is also implemented for the MLS water vapordata obtained from the 183 GHz radiometer, which providedmeasurements for 19 months from 19 September 1991 tomid-April 1993 when the instrument failed. Although thisperiod is quite short, the data are still useful for evaluatingERA-40 water vapor. We use the recently released version7.02 (referred to as V7) for the 183 GHz channel. Thisversion is preferred to V5 and V4 because V7 fills the gaparound 100 hPa that exists in the previous MLS dataversions. Although V7 supplies data between 46 and316 hPa, we follow the recommendations of the UARSteam [Read et al., 2004a]: (1) use data between 56 and147 hPa; (2) since there is no cloud screening, reject anydata for which the goodness of the radiance fit betweenradiance measurements and calculated radiances is greaterthan a certain threshold; and (3) increase the MLS valueswater vapor at 147 hPa and 100 hPa by 30% and 20%,respectively, in order to minimize the biases in the tropics.[24] The MOZAIC observations used here cover the
period from 1 August 1994 to 31 December 1999. TheMOZAIC ozone archive contains in situ ozone aircraftmeasurements, and the water vapor archive contains datathat the MOZAIC scientific team has derived from the RHin situ aircraft observations by using the method of Helten etal. [1998]. Both MOZAIC ozone and water vapor data setsare now consider fully calibrated. Since the MOZAICaircraft take readings every 4 s, in contrast to the ERA-40six-hour interval, several artefacts appear in the ERA-40ozone and water vapor fields when interpolating ERA-40 tothe space and time of the aircraft measurements. Further-more, such a short interpolation time step was foundcomputationally expensive. Following initial tests withvarious ERA-40 interpolation time steps, it was finallydecided to consider the average value of continuous (whenavailable) aircraft observations over a 4-min interval. Interms of typical MOZAIC flight speeds and altitudes, thisrepresents an average horizontal distance of between half to
one third of the distance between two ERA-40 horizontalgrid points. Apart from the condition for the MOZAICmeasurements to be continuous during the 4-min interpola-tion step, a further condition was set by monitoring theaircraft vertical speed and pressure in order for the data torefer to the same pressure level, and not to be affected byany abrupt changes in the aircraft altitude. Results of theERA-40 comparison with MOZAIC are grouped into 2.5� �2.5� longitude/latitude boxes and into the five MOZAICcruise levels. Data from the 9.4 km cruise altitude were notused because data continuity was inadequate. Finally, thetropopause is defined here as the PV = 2 potential vorticityunits (pvu) surface.[25] Results of the ERA-40 evaluation for ozone (section 5)
and water vapor (section 6) are arranged so that initially ashort introduction is presented on the major scientific find-ings. This is followed by five subsections. The first threesubsections show the validation results for the stratospherearranged into three geographical areas: tropics (30�N to30�S), midlatitudes (60�–30�N and 30�–60�S), and highlatitudes (>60�N, >60�S). The remaining two subsectionsdiscuss (1) the evaluation of ERA-40 within the UTLS basedon MOZAIC data and (2) the evaluation of any bias withrespect to independent data, and whether the bias varies withtime during the 1990s. In addition, at the beginning ofsections 5 and 6 we present tables summarizing theERA-40 evaluation results (both actual values and per-centages), and we present figures of the seasonal variationof the percentage differences between ERA-40 and UARSat selected pressure levels and geographical regions. Wealso show plots of the 3-monthly ozone and water vaporzonal means. For the Northern Hemisphere, spring isdefined as March to May, summer as June to August,
Table 2. MLS–ERA-40 Ozone Differences
Pressure, hPa
MLS(V5)–ERA-40 Ozone Differencesa
Global, ppmv Tropics, ppmv Midlatitudes, ppmv NH High Latitudes, ppmv SH High Latitudes, ppmv
1 �0.07 (�2.0%) 0.02 (0.6%) �0.10 (�2.8%) �0.05 (�1.6%) �0.26 (�8.6%)2.154 �0.36 (�7.1%) �0.16 (�3.0%) �0.39 (�7.1%) �0.51 (�10.3%) �0.79 (�17.5%)4.641 �0.25 (�4.6%) �0.03 (�0.4%) �0.20 (�3.0%) �0.45 (�8.5%) �0.91 (�19.4%)10.0 0.29 (2.1%) 0.69 (7.0%) 0.20 (2.4%) �0.09 (�2.5%) �0.37 (�10.1%)21.54 0.19 (2.6%) 0.33 (5.2%) 0.30 (5.4%) �0.27 (�6.8%) �0.14 (�4.5%)46.46 0.08 (4.9%) 0.26 (14.8%) �0.03 (�1.8%) �0.08 (�2.8%) 0.04 (0.8%)68.13 0.16 (18.8%) 0.27 (40.5%) 0.05 (3.2%) 0.13 (5.5%) 0.15 (8.7%)
aMLS version 5 measurements for the period 19 September 1991 to 27 July 1999. In total, 1403 days of valid measurements have been used for thevalidation. Latitudinal zones are defined as in Table 1.
Table 3. MOZAIC–ERA-40 Ozone Differences
Altitude,km
MOZAIC–ERA-40 Ozone Differencesa
Tropics,b
ppbvNH Midlatitudes,
ppbvNH High Latitudes,c
ppbv
11.8 �19.7 (�56.3%) 33.6 (9.9%) 24.8 (3.8%)11.2 �19.3 (�54.2%) 42.1 (12.4%) 123.8 (25.3%)10.6 �19.7 (�65.8%) 37.0 (13.5%) 88.1 (24.4%)10.0 �18.6 (�61.2%) 16.2 (7.9%) 67.2 (23.4%)aMOZAIC flights for the period 1 August 1994 to 31 December 1999.
Total number of flights is 12,816.bTropics, 30�S to 30�N.cNH high latitudes, >60�N.
D14109 OIKONOMOU AND O’NEILL: EVALUATION OF OZONE AND WATER VAPOR FIELDS
8 of 27
D14109
autumn as September to November, and winter as De-cember to February.
5. ERA-40 Ozone Validation
[26] The global ozone climatology has been well estab-lished by previous studies and used either as the a prioriinformation for both the UARS ozone retrievals and theERA-40 fields, or it has been reconstructed on the basis ofthe UARS measurements themselves [Wang et al., 1999].The ozone distribution is now known to be affected by bothlong-term processes, such as the solar cycle, and strato-spheric circulation that lead to ozone changes of interannual,decadal and seasonal scales, including the stratosphericquasi-biennial oscillation (QBO). UARS data showed con-clusive evidence that chlorofluorocarbons (CFCs), ratherthan other anthropogenic or natural emissions, arethe dominant ozone depletion constituent over Antarctica[Russell et al., 1996]. Estimations of the chemical loss of
polar ozone in the LS became possible by using UARSmeasurements of chemical species, such as MLS ClO [Wuand Dessler, 2001]. Besides the initial focus on ozone overAntarctica, equally important UARS findings have beenreported over the Arctic LS [Manney et al., 1997]. On thebasis of the above results, it is of particular interest howERA-40 captures the ozone tropical maximum and both theAntarctic and Arctic ozone holes.[27] ERA-40 reproduces realistically the ozone field
when compared with both the satellite and the aircraftobservations. Shown here is the seasonal variation of thezonal means of the ERA-40 ozone comparison withHALOE V19 (Figure 1), MLS V5 (Figure 2), and MOZAIC(Figure 3). In addition, Tables 1–3 present both the actualand percentage differences at selected pressure levels andgeographical areas of the ERA-40 ozone comparison withHALOE (Table 1), MLS (Table 2), and MOZAIC (Table 3)throughout the entire period of the observations used fromeach of these three data sources. Also, Figure 4 presents the
Figure 4. UARS–ERA-40 ozone seasonal zonal mean differences expressed as percentage of theoriginal UARS measurements for (a–d) HALOE V19 sunrise and sunset measurements for the period11 October 1991 to 31 December 1999 and (e–h) MLS V5 for the period 19 September 1991 to 27 July1996. Spring is MAM for NH and SON for SH, summer is JJA for NH and DJF for SH, autumn is SONfor NH and MAM for SH, and winter is DJF for NH and JJA for SH. Latitudinal zones: tropical (30�N to30�S, red line), midlatitudes (60�–30�N and 30�–60�S, green line), and high latitudes (>60�N and>60�S, blue line). Dotted lines indicate the standard deviations. HALOE has no coverage poleward of 60o
during winter for both hemispheres.
D14109 OIKONOMOU AND O’NEILL: EVALUATION OF OZONE AND WATER VAPOR FIELDS
9 of 27
D14109

seasonal variation of the UARS–ERA-40 ozone percentagedifferences arranged in three geographical areas (i.e.,tropics, middle and high latitudes). In comparison withUARS ERA-40 overestimates by 5–10% the ozone con-centration on a global scale in the upper stratosphere butunderestimates it by 5–10% over the tropics at the level ofthe ozone tropical maximum (i.e., slightly above 10 hPa or30–35 km) and down to 30 hPa (20–25 km, Figure 4).Below 30 hPa in the middle stratosphere, and in the LS overthe middle and high latitudes, results of the ERA-40 ozonecomparison with independent data become highly depen-dent on both season and altitude (Figure 4).
5.1. Tropical Stratospheric Ozone
[28] At the level of the tropical ozone maximum, theERA-40 deviations from the UARS measurements seem tohave a seasonal variation over the equator, with positiveUARS–ERA-40 differences being larger to the north(south) of the equator during northern (southern) winter toearly spring months (Figures 1 and 2). Regarding the actualvalue of the tropical ozone maximum, ERA-40 captures it
consistently lower than UARS by typically 0.5–1.2 ppmv(�4%) compared to HALOE and by 0.8–1.2 ppmv (�8%)compared to MLS V5 (Figure 5). A seasonal dependencecan be detected in the way ERA-40 reproduces the tropicalozone maximum, with largest UARS–ERA-40 differencesoccurring from late October to February and smallest differ-ences encountered from late April to early June (Figure 5).[29] Furthermore, from May to August during the
1990s, ERA-40 places the tropical ozone maximum at alower height than does the UARS data. A similarsituation regarding the altitude of the ozone maximumis also found over the South Pole [Dethof, 2003] wherein comparison with ground based observations duringthe SH spring months prior to 1979 the ozone maximumis located at lower altitude in ERA-40 than in theobservations.[30] Below the level of the ozone tropical maximum and
down to 70 hPa, ERA-40 consistently underestimates ozoneover the tropics compared with the independent data. Moreprecisely, between 10 hPa and 50 hPa ERA-40 under-estimates the ozone concentration over the tropics by 5–10% in comparison with HALOE (Figures 4a–4d) andMLS (Figures 4e–4h). At the levels between 50 hPa and70 hPa we find the maxima positive deviations from theUARS measurements of 20–30% in comparison withHALOE, particularly during summer and autumn, and of30–40% throughout the year in comparison with MLS.However, in the layer 20–50 hPa, ERA-40 occasionallyoverestimates tropical ozone by over 1 ppmv (20%). Al-though this tendency does not seem to depend on season, itis confined over the tropical Atlantic and Indian Ocean. Atthe tropical tropopause level (i.e., 100 hPa), ERA-40seriously overestimates the ozone concentration by 40–60% in comparison with HALOE.
5.2. Midlatitude Stratospheric Ozone
[31] In the upper stratosphere and down to 7 hPa ERA-40consistently overestimates the ozone concentration overmidlatitudes by the order of 10% in comparison withHALOE (Table 1) and by only a few percent in comparisonwith MLS (Table 2). At the levels of 7–10 hPa the generaltendency of ERA-40 to underestimate the ozone concentra-tion spreads also over the midlatitudes in both hemispheres,though with greater variations and seasonal dependencethan over the tropics. Nevertheless, during winter ERA-40between 7 and 10 hPa slightly overestimates the ozoneconcentration over the midlatitudes by less than 5% incomparison with UARS (Figures 4d and 4h).[32] In the layers below 10 hPa the UARS–ERA-40
differences show a strong seasonal signal and they alsodepend on the UARS retrieval against which the reanalysisis validated. More precisely, between 30 hPa and 70 hPaover the midlatitudes ERA-40 tends to underestimate ozoneby up to 10% during winter (Figures 4d and 4h) butoverestimates it by up to 20% during summer (Figures 4band 4f) and autumn (Figures 4c and 4g) in each hemisphere.Particularly at 68 hPa (the lowest vertical level consideredhere for the MLS ozone), ERA-40 compares very well withthe MLS measurements over the midlatitudes where ERA-40 underestimates the ozone concentration by up to 0.05ppmv (�5%, Figures 4e–4h); but over the midlatitudesERA-40 overestimates the concentration in comparison
Figure 5. Monthly mean differences of UARS–ERA-40at the ozone tropical maximum in ppmv for HALOEcombined sunrise and sunset measurements (solid line)during the period 11 October 1991 to 31 December 1999and for MLS version 5 data (dashed line) and version 4 data(dash-dotted line) during the period 19 September 1991 to27 July 1999.
D14109 OIKONOMOU AND O’NEILL: EVALUATION OF OZONE AND WATER VAPOR FIELDS
10 of 27
D14109
with HALOE by 0.15 ppmv (10–20% depending onseason, see Figures 4a–4d).
5.3. High-Latitude Stratospheric Ozone
[33] The tendency of ERA-40 to overestimate the ozoneconcentration in the upper parts of the model is morepronounced over the high latitudes where in comparisonwith UARS ERA-40 in general overestimates ozone bytypically 5–10% (see for example the overall validationresults round the 2 hPa level in Tables 1 and 2). We also findthat ERA-40 ozone in the upper stratosphere comparesbetter with UARS over the northern than over the southernhigh latitudes. At levels between 7 and 10 hPa, in compar-ison with UARS, ERA-40 underestimates the ozone con-centration over the high latitudes by 5% during summer(Figure 4b and 4f) but overestimates it by up to 35% duringpolar autumn (Figures 4c and 4g) and especially duringsouthern polar winter (Figure 4h). In addition, when com-pared with UARS, the ERA-40 ozone over the high
latitudes appears to be highly dependent on altitude, seasonand satellite sensor. For example, during polar spring(Figures 4a and 4e) and autumn months, when both UARSinstruments provide similar coverage over the high lati-tudes, in the upper stratosphere and down to 10 hPa ERA-40 ozone compares better with HALOE (Figures 4a and 4c)than with MLS (Figures 4e and 4g).[34] During the Antarctic ozone hole from September to
October, ERA-40 reproduces realistic low ozone in the layer50–70 hPa where the core of the Antarctic ozone hole canbe found. In comparison with UARS at 70 hPa the reanal-ysis in general underestimates the ozone concentration byup to 20%, but at 50 hPa ERA-40 overestimates it by 10%(Figure 2c). Nevertheless, at the 50–70 hPa levels thereseem to be significant differences when comparing ERA-40with the two MLS data versions: ERA-40 ozone differs by<10% compared to MLS V5 and by �30% compared toMLS V4 (not shown here). In the Antarctic middle strato-
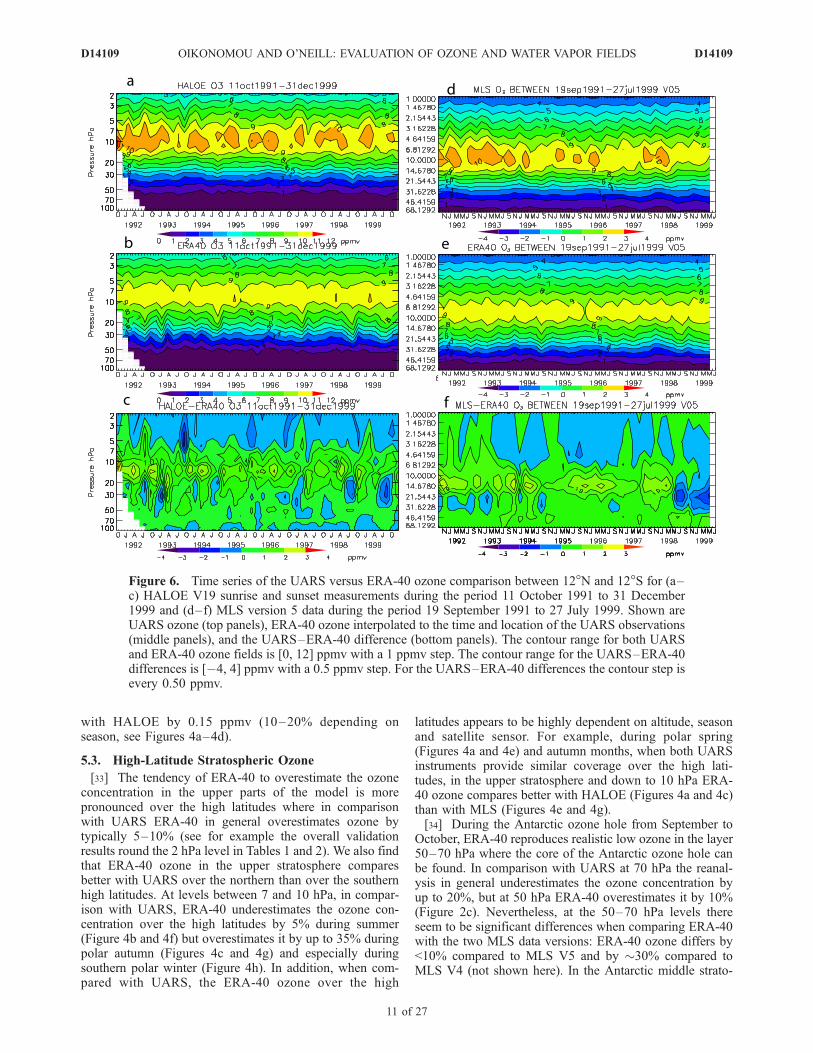
Figure 6. Time series of the UARS versus ERA-40 ozone comparison between 12�N and 12�S for (a–c) HALOE V19 sunrise and sunset measurements during the period 11 October 1991 to 31 December1999 and (d–f) MLS version 5 data during the period 19 September 1991 to 27 July 1999. Shown areUARS ozone (top panels), ERA-40 ozone interpolated to the time and location of the UARS observations(middle panels), and the UARS–ERA-40 difference (bottom panels). The contour range for both UARSand ERA-40 ozone fields is [0, 12] ppmv with a 1 ppmv step. The contour range for the UARS–ERA-40differences is [�4, 4] ppmv with a 0.5 ppmv step. For the UARS–ERA-40 differences the contour step isevery 0.50 ppmv.
D14109 OIKONOMOU AND O’NEILL: EVALUATION OF OZONE AND WATER VAPOR FIELDS
11 of 27
D14109

sphere (typically 20–50 hPa) in September, in comparisonwith HALOE and both MLS versions, ERA-40 consistentlyoverestimates ozone by 10–15%. Finally, at the levelsbelow the Antarctic ozone hole (near 100 hPa), during polarspring ERA-40 seriously overestimates the ozone amountsby 60% (and >100% particularly over Antarctica) in com-parison with HALOE (Figure 4a).[35] There are differences in the way the ERA-40 ozone
field compares with the satellite observations between theNH and the SH high latitudes. For example, above 10 hPaERA-40 ozone is overall about 10% closer to the UARSmeasurements over the northern than over the southern highlatitudes (see Tables 1 and 2). In comparison with MLSERA-40 over the northern high latitudes consistently over-estimates ozone by typically 10–15% throughout the yearand at all vertical levels, except during northern summer andnear the 7–14 hPa layer, where ERA-40 underestimatesozone by 5–10% (Figure 2b). As also seen for the southern
high latitudes, over the northern high latitudes ERA-40significantly overestimates ozone in the middle and upperstratosphere, with maximum deviations of ERA-40 from theUARS measurements reaching 20% during northern winterat 4 hPa (Figure 4h). In addition, we find that over thenorthern high latitudes and at all vertical levels ERA-40ozone seems to compare considerably better with MLS V5than with V4 data (not shown here).
5.4. UTLS Ozone
[36] By examining the ERA-40 PV field interpolated ontothe MOZAIC measurements, we find that, during most ofthe validation period, the MOZAIC aircraft cross into theLS over northern middle and high latitudes (typically northof 30�N at 11.8 km and north of 40�N at 10.0 km cruiselevels), while over the tropics and subtropics (typicallybetween 30�S and 30�N), the aircraft fly constantly in theUT (Figure 3). During northern summer and early autumnthe ‘‘tropospheric’’ part in the MOZAIC aircraft routesextends further north up to 40�–42�N (Figures 3b and 3c).
Figure 7. Time series of the MLS V5 versus ERA-40ozone comparison between 1990s and 70�S during theperiod 19 September 1991 to 27 July 1999. (a) MLS ozone,(b) ERA-40 ozone interpolated to the time and location ofthe MLS observations, and (c) MLS–ERA-40 difference.The contour range for both MLS and ERA-40 ozone fieldsis [0, 12] ppmv with a 1 ppmv step. The contour rangefor the MLS–ERA-40 differences is [�4, 4] ppmv with a0.5 ppmv step.
Figure 8. Time series of the vertical variation of theMOZAIC–ERA-40 ozone differences for the period1 August 1994 to 31 December 1999 at (a) 20�N,(b) 40�N, and (c) 55�N. The contour range is [�400,400] ppmv with a 50 ppmv step. PV = 2 pvu (thick whiteline). White areas represent data gaps. The top cruise level of11.8 km at 20�N is not considered here because at this levelover 20�N the MOZAIC measurements are discontinuous.
D14109 OIKONOMOU AND O’NEILL: EVALUATION OF OZONE AND WATER VAPOR FIELDS
12 of 27
D14109
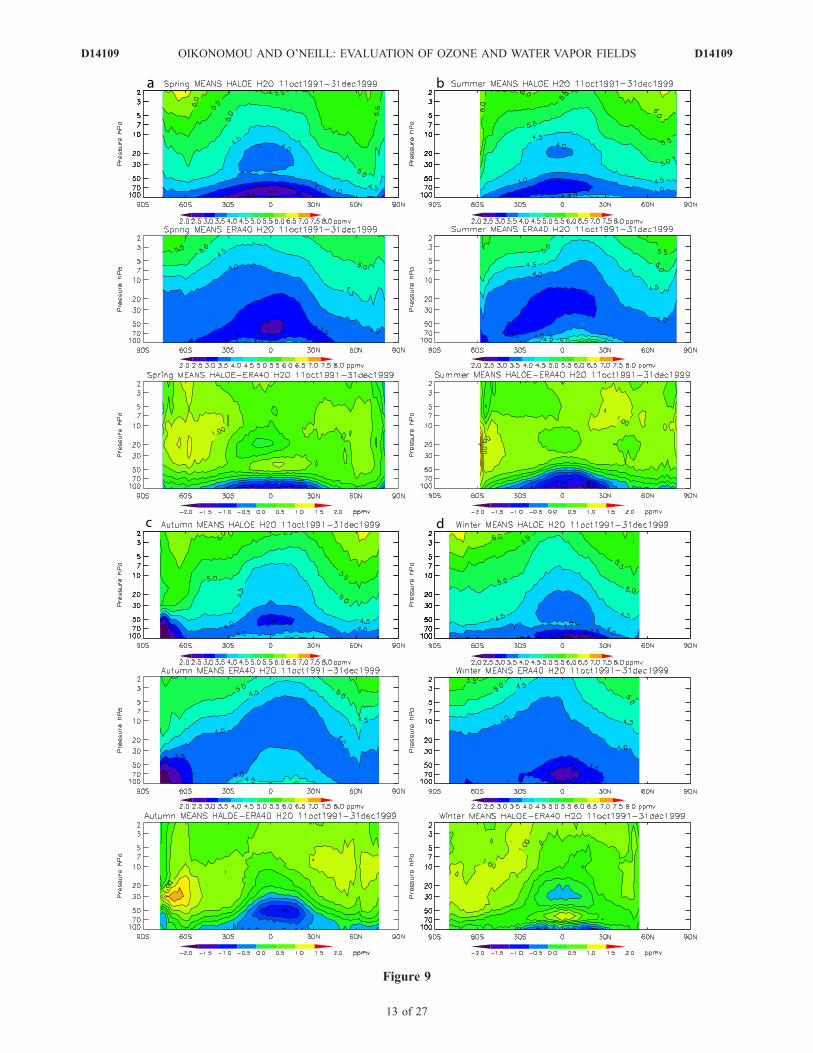
Figure 9
D14109 OIKONOMOU AND O’NEILL: EVALUATION OF OZONE AND WATER VAPOR FIELDS
13 of 27
D14109

[37] Throughout the entire validation period and at allcruise altitudes of MOZAIC aircraft, ERA-40 reproducesthe UTLS ozone field with a typical deviation fromMOZAIC of 20–60% depending on cruise level, latitudeand season (Table 3).[38] A clearer picture of the UTLS ERA-40 ozone field is
obtained when using the PV = 2 pvu criterion to define thetropopause (Figure 3). ERA-40 consistently overestimatesozone in the tropical UT by typically 20 ppbv (�60%,Table 3). This tendency applies throughout all seasons,and appears to be especially pronounced during northernwinter and spring, when ERA-40 around 20�N tends tooverestimate ozone by >100% in comparison with theMOZAIC observations. In the LS throughout the yearERA-40 tends to underestimate ozone over the northernmidlatitudes by typically 10% and over the northern highlatitudes by typically 25–30% (Figure 3 and Table 3).Since in the LS the ERA-40 ozone field is �30% closerto the MOZAIC measurements than in the tropical UT,throughout the year ERA-40 shows a much strongerozone gradient across the tropopause than the one cap-tured by the MOZAIC observations.
5.5. ERA-40 Ozone Biases Compared WithIndependent Data and Their Temporal Variation
[39] In recent years, several investigators have combinedmeasurements from ground-based stations, numerous satel-lite instruments and, in some cases, data assimilationsystems in order to estimate ozone variations and trends.The overall conclusion is that global ozone was fairlyconstant during the 1990s [SPARC, 1998]. After the majorvolcanic eruption of Mount Pinatubo in 1991, however, arecord low in stratospheric ozone was observed, especiallyover the northern middle and high latitudes [Gleason et al.,1993]. In this study, we examine the presence of possiblebiases and their variation with time for both the ozone andwater vapor (section 6) ERA-40 fields.[40] When examining time series of the ERA-40 ozone
comparison with the independent observations we findthat there is a gradual improvement in the way ERA-40reproduces the tropical ozone maximum throughout the1990s. In particular, when considering time series ofthe equatorial stratospheric ozone between 12�N and 12�Sat the level of the tropical ozone maximum (10 hPa), we findthat ERA-40 consistently underestimates ozone in compar-ison with HALOE by 2 ppmv (20%) in the early 1990s(Figures 6a–6c). These differences become �1.5 ppmv(15%) after January 1994, and they reduce to <1.0 ppmv(<10%) toward the end of 1996. At the levels below thetropical ozone maximum and in comparison with HALOE,ERA-40 throughout the 1990s underestimates the ozoneconcentration by 10–20% between 10 and 40 hPa and by30–50% between 40 and 70 hPa but ERA-40 overestimatesozone by 40–60% round the tropical tropopause (70–100 hPa).
[41] Results are significantly different when ERA-40 iscompared with MLS. For the levels above the tropicalozone maximum, and for the period September 1991 tothe end of 1992, ERA-40 tends to underestimate ozone incomparison with MLS by typically 0.5–1.0 ppmv (5–10%)(Figures 6d–6f). This situation is reversed at the beginningof 1993, after which date ERA-40 seems to consistentlyoverestimate the tropical ozone field in the upper strato-sphere. Nevertheless, one should be cautious when exam-ining the temporal evolution of ERA-40 in comparison withMLS, since there were several problems encountered in theperformance of the MLS instrument during the selectedperiod, and data collection became more problematic andless frequent especially after June 1995 [Livesey et al.,2003].[42] In agreement with previous observational studies
[e.g., SPARC, 1998], ERA-40 does not show any significantdecadal trend in the ozone values during the 1990s. Overthe tropics in ERA-40, between 10 hPa and 20 hPa theisopleths of ozone mixing ratio appear to descend furtherdown into the middle stratosphere (i.e., down to 30–40 hPa;Figures 6b and 6e) typically in August/September. As aresult, in the layer 20–40 hPa from August till DecemberERA-40 has about 20% more ozone than UARS. Thisfeature is especially pronounced in ERA-40 in 1994 and1998, but it is not found in the UARS observations. Theabove ERA-40 tendency in the ozone field over the tropicsand between the 10 and 40 hPa levels is not, however,encountered over the middle and high latitudes (Figure 7).[43] The way that ERA-40 reproduces the Antarctic
ozone holes, as described in section 5.3, remains consistentthroughout the 1990s when comparing the reanalysis withthe MLS observations (Figure 7). Especially for the South-ern Hemisphere ozone holes of 1995 and 1996, ERA-40overestimates the ozone concentration within the core of theAntarctic ozone hole in comparison with MLS (Figure 7c).For the 1998 case, however, ERA-40 underestimates theozone concentration in the entire stratosphere comparedwith MLS by >1.5 ppmv (40%) at the edge of the Antarcticozone hole (i.e., at 46 hPa). Similar results are found for thesame years when ERA-40 is compared with the HALOEobservations during the Antarctic ozone hole (not shownhere).[44] In the UTLS region during the 1990s, the differences
in ozone between ERA-40 and MOZAIC have a seasonaldependence and substantial variations. The time series ofthe MOZAIC–ERA-40 ozone differences are calculated atthree different latitudes where there exist continuous aircraftobservations: 20�N, 40�N and 55�N (Figure 8). (At 20�Nthe highest cruise level of 11.8 km is not considered heresince, at this altitude, the MOZAIC data over the tropics arediscontinuous.)[45] There was a change in the ERA-40 UTLS ozone
field after autumn 1996 when modifications in the ERA-40ozone system took place [Dethof and Holm, 2004]. In
Figure 9. Three-monthly HALOE, ERA-40, and HALOE–ERA-40 water vapor zonal means for HALOE version 19combined sunrise and sunset measurements during the period 11 October 1991 to 31 December 1999 for (a) MAM, (b) JJA,(c) SON, and (d) DJF. The contour range for both HALOE and ERA-40 water vapor fields is [2, 8] ppmv with a 1 ppmvstep. The contour range for the HALOE–ERA-40 differences is [�2, 2] ppmv with a 0.25 ppmv step.
D14109 OIKONOMOU AND O’NEILL: EVALUATION OF OZONE AND WATER VAPOR FIELDS
14 of 27
D14109

Figure 10
D14109 OIKONOMOU AND O’NEILL: EVALUATION OF OZONE AND WATER VAPOR FIELDS
15 of 27
D14109

general, ERA-40 in the tropical UT (near 20�N) tends tooverestimate ozone by 20–40 ppbv (30–60%) comparedwith MOZAIC data (Figure 8a). At 20�N the effect of themodifications in the reanalysis system can be seen only atthe MOZAIC cruise level of 11.2 where prior to October1996 there are cases for which ERA-40 underestimates theozone concentration, whereas post-October 1996 ERA-40consistently overestimates it. In the UTLS over the northernmiddle and high latitudes, however, the change in the ERA-40 performance is significant after October 1996. Forexample, at 40�N, ERA-40 tends to underestimate ozonebefore October 1996 but tends to overestimate it afterOctober 1996 (Figure 8b). In addition, post-October 1996over the northern middle and high latitudes, the size of theMOZAIC–ERA-40 differences are substantially reduced atall cruise levels from a typical maximum of 400 ppbv(100%) to 100–150 ppbv (25–30%), with most of theimprovement encountered in the LS over the northern highlatitudes.
6. ERA-40 Water Vapor Validation
[46] According to the upper troposphere water vaporclimatologies obtained from satellite sensors [Chiou et al.,1997; SPARC, 2000], maximum water vapor concentrationsare encountered in three prominent regions: (1) the maritimecontinent near 90�E; (2) the region over South Americaaround 60�W; and (3) the tropical west and central Africa.The MOZAIC flight paths (especially at 10.0 and 10.6 km)can provide information about the water vapor field in thelast two of these three tropical monsoon systems.[47] In the stratosphere, HALOE and MLS have provided
information regarding the water vapor cycle. In addition toestablishing features such as the occurrence of a strato-spheric water vapor minimum over the tropics, SouthernHemisphere springtime dehydration was observed byHALOE, with the horizontal extent of the dehydrated areaat 465 K (i.e., where the polar ozone decrease becomesmaximum) comprising up to 35% of the total vortex areanorth of 80�S, which is the limit of the HALOE observa-tions [Pierce et al., 1994; Rosenlof et al., 1997]. Otherrelevant findings include the indication that water vapor has,broadly speaking, increased in the LS over the last 45 years[Rosenlof et al., 2001], and the significant discovery of the
so-called tape recorder in water vapor mixing ratios in thetropical stratosphere [Mote et al., 1996].[48] Here we show the seasonal variation of the zonal
means of the ERA-40 water vapor comparison withHALOE V19 (Figure 9) and MOZAIC (Figure 10). Inaddition, we present both the actual and percentage differ-ences at selected pressure levels and geographical areas ofthe ERA-40 water vapor comparison with HALOE(Table 4), MLS V7 (Table 5), and MOZAIC (Table 6)throughout the entire period considered for each of thesesets of independent observations. In addition, Figure 11presents the seasonal variation of the UARS–ERA-40 watervapor percentage differences arranged in three geographicalareas (i.e., tropics, middle and high latitudes).[49] The most striking feature in the ERA-40 water vapor
seasonal cycle is the inability of the reanalysis to reproducea realistic water vapor tropical minimum (Figure 9). Over-all, ERA-40 is consistently drier in the upper and middlestratosphere by 10–20% down to 30 hPa at all latitudes andseasons. At the levels between 30 hPa and 70 hPa ERA-40remains consistently drier than UARS by 10–20% overmiddle and high latitudes but at these levels the ERA-40water vapor performance has a strong seasonal dependenceover the tropics and extratropics (Tables 4 and 5). In theUTLS, ERA-40 is consistently wetter than MOZAIC bytypically 20% over the tropics and northern midlatitudesand by over 60% in the LS over the northern high latitudes(Figure 10 and Table 6). ERA-40 is in agreement withHALOE measurements indicating that, in the time mean,the NH is wetter than the SH, though the reanalysis has adrier SH than does HALOE, particularly in the southernpolar vortex.
6.1. Tropical Stratospheric Water Vapor
[50] According to the HALOE observations, the watervapor minimum over the tropics occurs in the LS. It islocated between 70 and 100 hPa from January to May(northern winter and spring, Figures 9a and 9d) and between50 and 70 hPa from June to September (northern summerand autumn, Figures 9b and 9c). In contrast, ERA-40produces a weaker water vapor minimum than HALOE,which extends significantly higher into the tropical middlestratosphere rather than being confined within the tropicalLS. As a result, in the tropical LS ERA-40 between 70 and
Table 4. HALOE–ERA-40 Water Vapor Differencesa
Pressure, hPa
HALOE–ERA-40 Water Vapor Differences
Global, ppmv Tropics, ppmv Midlatitudes, ppmv NH High Latitudes, ppmv SH High Latitudes, ppmv
2 0.75 (12.6%) 0.79 (14.0%) 0.72 (11.9%) 0.63 (9.8%) 0.76 (11.7%)4 0.77 (13.9%) 0.73 (14.3%) 0.81 (14.1%) 0.73 (11.9%) 0.74 (12.2%)10 0.87 (17.1%) 0.75 (16.2%) 0.95 (18.0%) 0.98 (17.4%) 0.94 (17.1%)20 0.75 (15.9%) 0.52 (12.1%) 0.91 (18.5%) 0.83 (16.2%) 1.09 (21.2%)50 0.54 (12.1%) 0.28 (6.5%) 0.70 (15.7%) 0.71 (15.2%) 0.82 (18.4%)70 0.21 (4.8%) �0.07 (�2.5%) 0.39 (9.4%) 0.46 (10.6%) 0.44 (11.0%)100 �0.30 (�8.4%) �0.72 (�20.0%) �0.006 (�0.5%) �0.05 (�1.6%) 0.10 (3.1%)
aTotal period, number of HALOE measurements used, and definition of latitudinal zones as in Table 1.
Figure 10. Three-monthly MOZAIC, ERA-40, and MOZAIC–ERA-40 water vapor zonal means during the period1 August 1994 to 31 December 1999 for (a) MAM, (b) JJA, (c) SON, and (d) DJF. The contour range for both MOZAICand ERA-40 ozone fields is [0, 600] ppmv with a 50 ppmv step. The contour range for the MOZAIC–ERA-40 differencesis [�300, 100] ppmv with a 0.25 ppmv step. PV = 2 pvu (thick white line). White areas represent data gaps.
D14109 OIKONOMOU AND O’NEILL: EVALUATION OF OZONE AND WATER VAPOR FIELDS
16 of 27
D14109

100 hPa is constantly wetter than HALOE by typically 10–20%, whereas between 50 and 70 hPa ERA-40 is drier thanHALOE by up to 20% during northern winter and spring,but becomes moister than HALOE by up to 15% duringnorthern summer and autumn (Table 4 and Figure 11).Above 40 hPa over the tropics ERA-40 is constantly drierby 10–15% in comparison with HALOE, and this dry biasin the tropical middle and upper stratosphere extends alsoover middle and high latitudes throughout the entire year(Figure 9).[51] The HALOE observations over the tropical LS also
revealed that in January, dehydrated air passing through thetropical tropopause gradually spreads poleward, so that byApril it covers much of the LS between 60�N and 60�S[SPARC, 2000]. Although ERA-40 captures this phenome-non, in January ERA-40 seems to bring up to the tropicaltropopause (100 hPa) wetter air than UARS (by 20% thanHALOE and by 5% than MLS V7) and then spreads it byApril within the LS over the tropics and subtropics but notover the midlatitudes (Figures 9 and 11). As a result, overthe midlatitudes and throughout the entire stratosphere,ERA-40 remains consistently drier than HALOE by typi-cally 10–20% (Figure 9).[52] Around the tropical tropopause (100 hPa), the MLS
V7 data from the 183GHz instrument provide more infor-mation than HALOE, as shown in Table 5 and Figure 11. Atlevels above the tropical tropopause between 56 and 82 hPathe comparisons of the ERA-40 water vapor field with MLSV7 and HALOE agree very well with each other, bothqualitatively and quantitatively. In the tropical UT (100 hPato 150 hPa), however, the ERA-40 water vapor fieldcompares much better with the MLS V7 than with theHALOE observations, particularly at the tropical tropopauseand at 146 hPa. In general, in the tropical UT ERA-40 tendsto be wetter than MLS V7 by only a few percent, except at121 hPa where ERA-40 seems significantly wetter thanMLS V7 by 20–30%. This wet bias in ERA-40 over thetropical UT agrees well with the results from the comparisonwith the MOZAIC data (Figure 10). Taking into account thefact that the MLS V7 measurements at 147 hPa and 100 hPaare increased by 30% and 20%, respectively, by the dataproviders in order to minimize the biases in the tropics[Read et al., 2004a], it is possible that the above discrep-ancies found in the water vapor field between MLS V7 andERA-40 at the 121 hPa level over the tropics may be due toa bias of the MLS V7 data at this level.
6.2. Midlatitude Stratospheric Water Vapor
[53] Over midlatitudes, the comparison of the water vaporfield between ERA-40 and both the UARS and MOZAIC
observations remains fairly consistent with season andheight. More precisely, throughout all seasons ERA-40 isconstantly drier than UARS by 10–20% in the upper andmiddle stratosphere down to 50 hPa. In the layer 50–80 hPaERA-40, remains drier than UARS, but only by a fewpercent (Figures 11a–11d). In the layer 80–100 hPa, ERA-40 becomes wetter than the UARS measurements, but it isin this layer and over midlatitudes where the reanalysiswater vapor field seems to compare overall at its best withthe MLS V7 data (Figures 11e–11h). Below 100 hPa, in theLS ERA-40 becomes drier than MLS V7 by 10–20%(Table 5), whereas in the UT over midlatitudes ERA-40 iswetter than MOZAIC by 20% (Table 6).
6.3. High-Latitude Stratospheric Water Vapor
[54] HALOE has no coverage poleward of 80 degreeslatitude, and especially during winter for both hemispheresHALOE has no coverage poleward of approximately60 degrees. At high latitudes, HALOE data show that,during the year, the middle stratosphere is wettest duringlate spring and early summer for the SH (i.e., September toFebruary, Figures 9c and 9d), and during summer to earlyautumn for the NH (i.e., June to September, Figures 9band 9c). Although ERA-40 reproduces the above seasonalcycle in water vapor over the high latitudes, however, in thepolar middle stratosphere, as well as in the polar upperstratosphere, ERA-40 is consistently drier than HALOE bytypically 1.0–1.5 ppmv (�10–20%, Figures 9c and 11).During Southern Hemisphere winter and spring, low watervapor values are observed by ground-based measurementsin polar regions of the Southern Hemisphere, associatedwith dehydration in the Antarctic polar vortex [SPARC,2000]. This dehydration process usually begins in the midsouthern winter (July) and continues until the vortex breaksdown in December. The effect of dehydration extends overthe LS up to �60�S, with a sharp gradient in water vaporvalues near the vortex edge. Figure 9c shows that ERA-40clearly captures the low water vapor mixing ratios of
Table 5. MLS–ERA-40 Water Vapor Differences for MLS 183 GHz Version 7.02 During the Period 19 September 1991 to 15 April
1993a
Pressure, HPa
MLSV7.02–ERA-40 Water Vapor Differences
Global, ppmv Tropics, ppmv Midlatitudes, ppmv NH High Latitudes, ppmv SH High Latitudes, ppmv
56.23 0.63 (14.2%) 0.27 (6.5%) 0.81 (17.9%) 0.97 (20.0%) 0.94 (22.3%)68.13 0.46 (10.8%) 0.17 (4.3%) 0.60 (14.0%) 0.73 (16.1%) 0.69 (17.2%)82.54 �0.20 (�5.6%) �0.44 (�12.4%) �0.12 (�3.4%) 0.001 (0.01%) 0.13 (4.2%)100.00 �0.09 (�2.2%) �0.20 (�5.2%) �0.11 (�3.2%) 0.001 (�0.001%) 0.27 (8.5%)121.15 �0.17 (2.4%) �2.0 (�26.2%) 0.77 (15.9%) 1.21 (24.0%) 1.56 (33.2%)146.78 0.20 (5.8%) �0.31 (�1.2%) 0.59 (10.5%) 0.41 (8.4%) 0.50 (12.0%)
aIn total, 517 days of valid measurements have been used for the validation. The latitudinal zones are defined as in Table 1.
Table 6. MOZAIC–ERA-40 Water Vapor Differencesa
Altitude, km
MOZAIC–ERA-40 Water Vapor Differences
Tropics,ppmv
NH Midlatitudes,ppmv
NH High Latitudes,ppmv
11.8 �14.1 (�14.6%) �4.0 (�6.6%) �0.5 (�0.05%)11.2 �36.9 (�20.0%) �13.9 (�17.0%) �10.3 (�63.5%)10.6 �40.9 (�16.9%) �19.4 (�18.7%) �12.8 (�17.2%)10.0 �57.8 (�14.1%) �30.3 (�21.5%) �22.8 (�94.1%)
aMOZAIC flights for the period 1 August 1994 to 31 December 1999.Total number of flights is 12,227. The latitudinal zones are defined as inTable 3.
D14109 OIKONOMOU AND O’NEILL: EVALUATION OF OZONE AND WATER VAPOR FIELDS
17 of 27
D14109

southern polar vortex in spring, with the same latitudinalextent as indicated by HALOE. Nevertheless, ERA-40water vapor values are �1.0 ppmv (25%) too high inthe core of the polar vortex between 70 and 100 hPa fromSeptember to November (when HALOE provides coverageto nearly 80�S). Above 50 hPa, however, at southern highlatitudes during spring the sign of the difference withHALOE changes and ERA-40 becomes considerably drierthan HALOE by up to 1.5 ppmv (15–20%, Figures 9cand 11a).
6.4. UTLS Water Vapor
[55] In the tropical UT and throughout the entire valida-tion period ERA-40 is consistently wetter than MOZAIC by100–150 ppmv (20–30%) around the equator where theaircraft fly predominantly over the Atlantic Ocean(Figure 10). Over middle and high latitudes, ERA-40 inthe UTLS remains predominantly wetter than MOZAIC bytypically 15–20 ppmv (Table 6), though with a strongdependence on season and altitude. For example, ERA-40over the midlatitudes is moister than the aircraft observa-tions by 20–30% during northern spring and by 30–35%during northern summer.
[56] In northern summer, there is a strong signal of locallymoist air over the Indian continent during its monsoon, aswell as over Central America/Caribbean and also over WestAfrica. Over these three areas of the UT during northernsummer, ERA-40 is consistently wetter than MOZAIC by10–15%, 20% and 30–35%, respectively. In sharp contrast,in the vicinity of coastal areas ERA-40 in the tropical UTLSmay underestimate water vapor amounts by 10–20% par-ticularly during northern winter over the coasts of South andCentral America, as well as those of western and southernAfrica (e.g., Figure 10d at 35�S).[57] The very dry regions of the subtropics and their
strong seasonal cycle are successfully captured by ERA-40in the subtropical UT (Figure 10). Both MOZAIC and ERA-40 water vapor data at 11.2 km (223–215 hPa) comparewell with the MLS observations at 215 hPa from Stone et al.[2000], who report a dry region around the subtropicalNorth Atlantic (i.e., around 20�N) during northern winter.The same feature can be seen in ERA-40 (Figure 10d),though again the reanalysis in the subtropical UT remainswetter than the MOZAIC measurements by 20–30 ppmv(�20%). There is also good agreement in the way the UTwater vapor maxima are associated, as noted in previous
Figure 11. UARS–ERA-40 water vapor seasonal zonal mean differences expressed as percentage ofthe original UARS observations for (a–d) HALOE V19 sunrise and sunset measurements for the period11 October 1991 to 31 December 1999 and (e–h) MLS 183 GHz V7.02 for the period 19 September1991 to 15 April 1993. The definition of seasons and geographical areas is the same as in Figure 4.
D14109 OIKONOMOU AND O’NEILL: EVALUATION OF OZONE AND WATER VAPOR FIELDS
18 of 27
D14109

studies [Stone et al., 2000], with areas of strong upwardmotion.[58] Over northern high latitudes, ERA-40 between the
cruise levels of 10–11.2 km is typically wetter thanMOZAIC; but at the highest cruise level of 11.8 km,ERA-40 is predominantly drier than MOZAIC by 5–10%(Figures 10a, 10c, and 10d). For example, at the 11.8 kmcruise level over Canada and the southern tip of Greenlandduring northern autumn and winter, ERA-40 is drier by 10–15% than MOZAIC. These results for the cruise level of11.8 km over high latitudes agree very well with thefindings derived from the comparison of ERA-40 withMLS V7, showing that the LS over high latitudes inERA-40 is typically drier than MLS by 10–20% (Figures
11e–11h). Below the 11.8 km cruise level over highlatitudes, ERA-40 is typically moister than the aircraftmeasurements by 10–30% during northern spring and by>100% during northern summer. These results suggest that,especially in the LS over high latitudes, ERA-40 reproducesthe water vapor seasonal cycle with a strong wet bias belowthe cruise level of 11.8 km.
6.5. ERA-40 Water Vapor Biases Compared WithIndependent Data and Their Temporal Variation
[59] A comprehensive study of the seasonal and long-term variations of water vapor is given by SPARC [2000].The tendency of ERA-40 to be drier than HALOE in themiddle and upper tropical stratosphere seems to increasewith time (Figure 12). Between 1992 and 1997 progres-
Figure 12. Time series of the UARS versus ERA-40 water vapor comparison between 12�N and 12�Sfor (a–c) HALOE V19 sunrise and sunset measurements during the period 11 October 1991 to31 December 1999 and (d–f) MLS 183 GHz version 7.02 data during the period 19 September 1991 to15 April 1993. Shown are UARS ozone (top panels), ERA-40 ozone interpolated to the time and locationof the UARS observations (middle panels), and the UARS–ERA-40 difference (bottom panels). For theUARS–ERA-40 differences the contour step is every 0.25 ppmv. The vertical range is [2, 100] hPa forthe HALOE versus ERA-40 validation and [56.23, 146.78] hPa for the MLS V7.02 versus ERA-40validation following the UARS team recommendations. In order to compare the ERA-40 water vaporvalidation against both UARS sensors, the same color plates are used in the figures. The contour rangesas in Figure 10. Also plotted are, in Figures 12d and 12e, the MLS V7.02 and ERA-40 water vapor fieldsfor values over 8.0 ppmv using a 2 ppmv interval and, in Figure 12f, the MLS-ERA-40 values less than�3.5 ppmv using a 0.25 ppmv interval.
D14109 OIKONOMOU AND O’NEILL: EVALUATION OF OZONE AND WATER VAPOR FIELDS
19 of 27
D14109

sively drier air reaches the tropical middle stratosphere inERA-40. For example, at 40 hPa and during March ERA-40is drier than HALOE by 15% in 1992 and by 30% in 1997.In ERA-40 as the 1990s evolves, the ascending dry airmasses appear to have longer residence times in the tropicalstratosphere before they eventually degrade. For example,over the equatorial stratosphere in 1992 dry air of 3.5 ppmvis encountered at 10 hPa up to July, whereas in 1997 dry airat the same level and of similar water vapor content can befound even in October (Figure 12b). Although ERA-40 isdrier than HALOE in the upper and middle stratosphere, inthe equatorial LS at levels 70–100 hPa ERA-40 is moisterby 30–40% in comparison with HALOE. During 1993 andespecially during 1998, ERA-40 reproduces a considerablymoister (by 60%) LS compared with HALOE. Moreover,this wet bias in ERA-40 over the tropical LS spreads intothe tropical middle stratosphere in 1993, and even into the
upper stratosphere in 1998 that results in an exceptionallymoist tropical stratosphere for ERA-40 during 1998.[60] Time series in the UTLS showing seasonal variabil-
ity of water vapor related to the meridional movement oftropical convective upwelling is well represented by ERA-40. An example is given in Figure 13 where time series ofthe MOZAIC–ERA-40 water vapor differences are plottedat 20�N, 40�N and 55�N (at 20�N, the highest cruise level of11.8 km is not considered here since at this altitude theMOZAIC data over the tropics are discontinuous in time).In the tropical UT near 20�N (Figure 13a), ERA-40 tends tobe drier than MOZAIC during northern late spring and earlysummer, but it becomes wetter in late summer and earlyautumn. The above pattern persists till the end of 1997,when ERA-40 becomes generally moister than MOZAIC,and this wet bias in the reanalysis becomes more pro-nounced in 1998 and 1999, as can also be seen for theseyears in the ERA-40 water vapor comparison with HALOEover the tropics (Figure 12c). During northern summer andautumn at 40�N, the MOZAIC aircraft fly mainly in the UT(Figures 10b, 10c, and 13b). During these months at 40�N,ERA-40 tends to be moister by 100 ppmv (30–35%) thanMOZAIC throughout the 1990s (Figure 13b). Finally, at55�N and at the cruise levels between 10.0 and 11.2 km thegeneral wet bias of ERA-40 compared with MOZAICseems to be most pronounced during northern summerand it is roughly constant in time through the 1990s(Figure 13c). In addition, the dry bias found at the 11.8 kmcruise level over high latitudes during the northernwinters of 1994, 1995 and 1997 spreads down to 10.6 km(Figure 13c).
7. Discussion
[61] In this section we discuss some aspects of particularinterest concerning how well the reanalysis reproduces theozone and water vapor fields, as indicated by the compar-ison with independent data.
7.1. Effect of Changes in the ERA-40 DataAssimilation System
[62] ERA-40 over the tropics consistently underestimatesthe ozone maximum. Although the time series of the ERA-40 ozone evaluation exhibits no trend in the stratosphere, inthe UTLS the reanalysis shows a considerable change afterOctober 1996; this period coincides with changes in theERA-40 system, when revised background error covarian-ces were introduced in the data assimilation algorithm inorder to improve the vertical distribution of ozone incre-ments [Dethof and Holm, 2004]. This new analysis incre-ment was found to be more confined in the vertical, with nocorrelations between the stratosphere and the troposphere,or between levels at and above the stratospheric ozonemaximum [Dethof and Holm, 2002]. The effect of thesechanges is shown in Figure 8. Post-October 1996, the ERA-40 ozone field in the UTLS has a regular seasonal cycleover middle and high latitudes (not shown), which was lessprominent in the 1990s before that date. In addition, post-October 1996 in the UTLS, ERA-40 has more ozone thanearlier in the decade over middle and high latitudes, and isin better agreement with MOZAIC observations (notshown). This result implies that trends in actual UTLS
Figure 13. Time series of the vertical variation of theMOZAIC–ERA-40 water vapor differences for the period1 August 1994 to 31 December 1999 at (a) 20�N, (b) 40�N,and (c) 55�N. The contour range is [�400, 400] ppmv with a50 ppmv step. PV = 2 pvu (thick white line). White areasrepresent data gaps. The top cruise level of 11.8 km at 20�N isnot considered here because at this level over 20�N theMOZAIC measurements are discontinuous.
D14109 OIKONOMOU AND O’NEILL: EVALUATION OF OZONE AND WATER VAPOR FIELDS
20 of 27
D14109

ozone concentrations derived from the ERA-40 should betreated with caution, at least during the 1990s. Despite thefact that the changes in the reanalysis system have improvedthe ERA-40 ozone in the UTLS, they seem to have noparticular effect in the way ERA-40 consistently under-estimates the tropical ozone maximum in the middle strato-sphere throughout the 1990s. Dethof [2003] also found thatthe modified covariances used in ERA-40 from December1978 to 1989 and then post-October 1996 although theyimprove the reanalysis ozone profiles in the UTLS, asindicated in the present study, however, the ERA-40 ozonemaximum can be reduced too much in situations where theanalysis increment is large and negative.[63] No particular trend in the ozone biases between
ERA-40 and UARS is detected during the 1990s in thestratosphere, nor is there an obvious trend in the biases intotal column ozone when comparing ERA-40 with groundbased observations [Dethof and Holm, 2004].
7.2. ERA-40 Ozone Parametrization Scheme
[64] The ERA-40 ozone evaluation shows that the highlatitudes are the second most problematic region in need of
further attention (the tropical UTLS being the other region).ERA-40 appears to produce an Antarctic ozone hole that isnot deep enough and also extends less into the middlestratosphere near the pole in comparison with the satelliteobservations (Figures 1c, 2c, and 7). In addition, there existsa strong altitude dependence in the way ERA-40 ozonecompares with UARS ozone (Figure 4), as explained insection 5.5. These results suggest that the ERA-40 ozoneparameterization scheme may need to be revised, forinstance, the temperature threshold of 195 K, implementedto activate parameterized heterogeneous chemistry, is not atpresent altitude dependent and probably should be. Inaddition, the parameterization should represent the transportof chlorine-activated air to regions with temperatures abovethis threshold value.
7.3. Arctic Polar Ozone
[65] There are considerable discrepancies between ERA-40 and UARS when examining the less severe Arctic ozonehole found during northern winter, primarily in January. Asan example, Figure 14 shows the ERA-40 ozone compar-ison with MLS for January 1992, which was one of the four
Figure 14. MLS (top panels), ERA-40 (middle panels), and MLS–ERA-40 (bottom panels) ozonezonal means for MLS version 5 measurements during the period 1–31 January 1992 at (a) 10 hPa and(b) 14.678 hPa. The contour range for both MLS and ERA-40 ozone fields is [0, 12] ppmv with a 1 ppmvstep. The contour range for the MLS–ERA-40 differences is [�4, 4] ppmv with a 0.5 ppmv step.
D14109 OIKONOMOU AND O’NEILL: EVALUATION OF OZONE AND WATER VAPOR FIELDS
21 of 27
D14109

coldest winters in the NH during the 1990s [Manney et al.,1997, 2003]. MLS captures low ozone centered over Green-land, though ERA-40 significantly overestimates the ozoneconcentration over the Arctic by 2–3 ppmv (40–50%) inthe middle stratosphere near 10 hPa, which is one of thehighest MLS–ERA-40 ozone differences. This tendency ofERA-40 to have higher ozone values over the northern highlatitudes in the middle stratosphere during winter has alsobeen pointed out by other studies [Dethof and Holm, 2002],and it is believed to be due to a too strong Brewer-Dobsoncirculation in ERA-40, possibly resulting from differencesin temperature biases between the model and the observa-tions. The overall indication that the Brewer-Dobson circu-lation in ERA-40 is considerably too strong is alsosuggested by Noije et al. [2004]. In order to tackle these
drawbacks encountered in the ERA-40 ozone field,ECMWF is currently working to improve the backgrounderror covariances in the assimilation scheme, as well asassimilating ENVISAT satellite ozone data into theECMWF system. ECMWF is also seeking to reducethe excessive Brewer-Dobson circulation through workon model/observation biases in temperature/radiances.Figure 14b also indicates a high MLS–ERA-40 ozonepositive anomaly, the highest values of this anomaly beingconfined between the equator and 30�N, for reasons that arenot understood. As explained in section 5.1, ERA-40 haslower values of ozone than UARS around the tropical ozonemaximum in the middle stratosphere (i.e., around 10 hPa).At these levels, maximum deviations of the ERA-40 ozonefrom the UARS data are found to the north of the equator
Figure 15. (a–d) HALOE–ERA-40 temperature seasonal zonal mean differences expressed aspercentage of the original HALOE observations for HALOE V19 sunrise and sunset measurements forthe period 11 October 1991 to 31 December 99. The definition of seasons and geographical areas is thesame as in Figure 4.
D14109 OIKONOMOU AND O’NEILL: EVALUATION OF OZONE AND WATER VAPOR FIELDS
22 of 27
D14109

during DJF (as seen for January 1992 in Figure 14b) and tothe south of the equator for JJA.[66] ERA-40 fails to capture accurately the ozone con-
centration inside the core of both the Arctic and Antarcticozone holes. This finding raises the question of whetherERA-40 over the high latitudes has errors because ofshortcomings in the temperature analysis, or because of apoor representation of heterogeneous chemistry on polarstratospheric clouds. Although it is beyond the scope of thepresent work to analyze the ERA-40 temperature fields,Figure 15 shows the seasonal variation of the HALOE–ERA-40 temperature percentage differences. ERA-40 repro-duces the temperature field with a less than ±0.5% deviationfrom the HALOE measurements throughout all seasons andlatitudes at the levels of 7 hPa and below. The greatestdiscrepancies occur in the upper stratosphere, where ERA-40 is consistently cooler than HALOE, particularly over thehigh latitudes where the ERA-40 temperature field deviates
its most from the HALOE observations by 2–3% duringsummer and autumn in both hemispheres (Figures 15b and15c).Randel et al. [2004] have also found a cold bias of�5Kin the ERA-40 temperature field in the upper stratosphere.
7.4. UTLS Ozone
[67] Despite the problems mentioned above, the reanaly-sis shows an ability to reproduce the ozone climatology andatmospheric processes in the UTLS where data are farscarcer than in the stratosphere. ERA-40 performs particu-larly well in the UTLS over midlatitudes, but it is in thetropical UTLS where the largest discrepancies are found.ERA-40 in the UTLS also successfully indicates someozone variation between coastal zone areas and the oceans(e.g., Figure 10d, south of 35�S). Such ozone variationshave already been reported by the MOZAIC team [Thouretet al., 1998]. They are believed to result from zonalvariations of the polar front and the position of ridge and
Figure 16. Time series of the HALOE versus ERA-40 water vapor comparison between for HALOEV19 sunrise and sunset measurements during the period 11 October 1991 to 31 December 1999 and (a–c) between 10� and 14�N and (d–f) between 10� and 14�S. HALOE water vapor (top panels), ERA-40water vapor interpolated to the time and location of the HALOE observations (middle panels), and theHALOE–ERA-40 difference (bottom panels). The contour range for both HALOE and ERA-40 watervapor fields is [2, 8] ppmv with a 1 ppmv step. The contour range for the HALOE–ERA-40 differences is[�2, 2] ppmv with a 0.25 ppmv step.
D14109 OIKONOMOU AND O’NEILL: EVALUATION OF OZONE AND WATER VAPOR FIELDS
23 of 27
D14109

trough systems, as well as from possible differences in theproduction of ozone between the oceans and the industrialcontinental areas. Moreover, ERA-40 is capable of repro-ducing relatively high average ozone values over midlati-tudes in the Northern Hemisphere, which are particularlypronounced over the Eastern Mediterranean [Oikonomou etal., 2004]. These high concentrations have been consideredso far as an indication of cutoff systems and small-scalefilaments, not necessarily associated with potential vorticityfilaments, which may erode faster than features in the ozonefield [Morgenstern and Marenco, 2000].
7.5. Tape Recorder Signal in Water Vapor
[68] The annual variations in the water vapor concentra-tions in the tropical lower and middle stratosphere, exhibit-ing large-scale upward advection, was originally reportedby Mote et al. [1996], a phenomenon referred to as the taperecorder. ERA-40 is able to reproduce the tape recordersignal (Figure 12), as was also found when analyzingoperational data from the ECMWF model [Simmons etal., 1999], though with some considerable differences.[69] In qualitative agreement with HALOE, the amplitude
of the tape recorder signal in water vapor in ERA-40 isgreater to the north of the equator than it is to the south(Figure 16), though this difference is more pronounced forERA-40 than for HALOE. During the dry period of thesignal, from October to April, low values of water vapor inERA-40 reach the middle stratosphere apparently faster tothe north of the equator than to the south, a feature which isagain more pronounced for ERA-40 than for HALOE.ERA-40 mean ascent rates over the tropics are estimatedfrom the water vapor concentrations to be typically of 0.5 �10�3 m/s, with no significant difference between northernwinter and the rest of the year, though these ascent ratesmay vary with height. This result is in contrast with theHALOE data for which the mean ascent rates were calcu-lated to be slower (0.2–0.4 � 10�3 m/s) and with a seasonalvariability [Mote et al., 1996]. Similar results apply for allERA-40 reanalysis periods (not shown here), includingsample runs for the years 1958–1960 and for 1973–1975.The above results suggest once more that the Brewer-Dobson circulation produced by the ECMWF assimilationsystem is too strong [Noije et al., 2004]. When examiningthe entire ERA-40 water vapor archive, considerable varia-tions in time are seen in the tape recorder signal over thetropics: the mid stratosphere is less dry in the 1960s, the mid1970s, and the early 1980s; and the introduction of com-paratively dry air into the stratosphere in northern winterreaches 10 hPa later in the season in the 1960s than it doesin the 1990s (A. Simmons, personal communication, 2003).
7.6. UTLS Water Vapor
[70] MOZAIC flights provide good coverage over two ofthe tropical monsoon systems, namely the African monsoonover central Africa and the South American monsoon overthe Amazon. The ERA-40 water vapor comparison withindependent data in the UTLS indicates overall the ability ofthe reanalysis to represent these monsoon systems. Sincethere are no MOZAIC flights over the Indian and PacificOceans, the Austral-Asian monsoon system over the mari-time continent (including the Intertropical ConvergenceZone) and their representation by ERA-40 could not be
examined here. Evaluation of the previous ECMWF reanal-ysis data, ERA-15, also found that the reanalysis in theITCZ over the Atlantic and eastern Pacific at 215 hPa(equivalent to the 11.2 km MOZAIC cruise altitude) ismoister by typically 20–30 ppmv than satellite data, and itwas concluded that the ECMWF reanalysis underestimatesthe dryness of the descending branch in the Hadley circu-lation [Clark and Harwood, 2003]. This finding agrees withthe present ERA-40 comparison over the tropics, though ourresults imply that, in the UT over the tropical oceanic areas,ERA-40 may be even moister than ERA-15.[71] There is evidence of dehydration processes occurring
in the tropical tropopause layer (TTL) and of a strongseasonal cycle in water vapor in the air rising out of theTTL into the stratosphere, with minimum water vaporvalues in January to April and maximum values duringAugust–November [SPARC, 2000]. Furthermore, it is alsogenerally agreed that both stratospheric and troposphericeffects, such as deep convection, radiation, the Brewer-Dobson circulation and the tropospheric effect on thetemperature around the tropopause, can play a role in theprocesses by which air is dehydrated in the TTL. Despitethe proposal of potential hypotheses, these processes bywhich air is dehydrated in the TTL are still inadequatelyunderstood [Read et al., 2004b]. The aforementioned sea-sonal cycle is shown by both HALOE and ERA-40 data(Figure 9) where the HALOE measurements indicate aminimum in the water vapor concentration of 2.5–3.0 ppmvfrom March to May (Figure 9a) and a maximum of 4.0–4.5 ppmv from September to November (Figure 9c).Since only in the tropics are tropopause temperatureslow enough to dehydrate air to these low water vapormixing ratios observed in the stratosphere, the aboveseasonal cycle is believed to be temperature sensitive;we find that throughout the validation period ERA-40remains consistently colder by 0.5% than the HALOEobservations in the tropical LS (Figure 15). This cold(warm) bias in ERA-40 over the tropical LS (middlestratosphere) may be connected to the consistent andsignificant wet (dry) bias found in ERA-40 water vaporover the tropical LS (middle to upper stratosphere). Thisresult is consistent with the previously mentioned evidencefor a too strong Brewer-Dobson circulation in ERA-40 if theassimilated observations do not fully compensate for theexcess cooling caused by too strong ascent.
7.7. Effect of Validating Against Different Versionsof Data
[72] The results of the present study raise two additionalpoints of interest: the variations in differences that can beobtained when comparing with different sensors (e.g.,between MLS and HALOE), as well as the discrepanciesfound for different data versions of the same sensors (e.g.,for MLS V4 and V5). Even though, broadly speaking, theERA-40 ozone comparisons with both UARS instrumentsagree with each other throughout most of the stratosphere,there are cases where they differ significantly, especiallyover the tropics. For example, at the tropical 70 hPa levelERA-40 underestimates the ozone content in comparison toMLS V5 by 40%, but only by 20% in comparison toHALOE (Tables 1 and 2). Within the core and the upperlevels of the Antarctic ozone hole (i.e., 50–70 hPa) in the
D14109 OIKONOMOU AND O’NEILL: EVALUATION OF OZONE AND WATER VAPOR FIELDS
24 of 27
D14109

annual-mean, ERA-40 underestimates the ozone content bytypically 9% when compared to MLS, and overestimates itby 8% in comparison with HALOE (Tables 1 and 2),recalling though that MLS provides a more continuouscoverage over the high latitudes than does HALOE. Differ-ences are also encountered in the evaluation of the watervapor field, particularly at and above the tropical tropopauselevels (50–100 hPa), where ERA-40 compares considerablybetter with MLS V7 than with HALOE (Figure 11).[73] We have also found that the ozone field in the
reanalysis compares better with MLS V5 than with V4:(1) at and below the 46 hPa level at all latitudes; (2) belowthe tropical ozone maximum and throughout the entire year,especially during northern winter; and (3) at the time andlocation of the Antarctic ozone hole. Little difference (1 to2%) is found elsewhere in the comparison of ERA-40 withMLS V4 or V5. Over the tropics and at the level of thetropical ozone maximum, ERA-40 compares better withMLS V5 than V4: throughout the year the MLS–ERA-40differences for V5 are consistently 0.3 ppmv lower than forV4 (Figure 5). This value compares very well with theoverall difference between MLS V5 and V4 at the tropical10 hPa, as found by the MLS science team (see Table 9 ofLivesey et al. [2003]).
8. Conclusions
[74] Broadly speaking, ERA-40 reproduces realisticozone and water vapor fields in comparison with UARSand MOZAIC measurements with the greatest discrepanciesoccurring primarily over the tropics and the high latitudes.For water vapor, ERA-40 is drier than HALOE in the upperand middle stratosphere by 10–15%. This discrepancy isnow well understood by ECMWF to be due to inadequaciesin the methane oxidation scheme used in the reanalysis andECMWF have changed this scheme in their operationalsystem. Phenomena such as the Antarctic (Figure 7) andArtic (Figure 14) ozone holes, the tropical stratosphericozone maximum (Figures 1 and 2), the tropical LS watervapor minimum (Figure 9), and the tape recorder signal(Figures 12 and 16) are reproduced by the reanalysis.Nevertheless, there are some quantitative problems in eachof these phenomena, such as the lower than UARS altitudeof the tropical ozone maximum from May to August and thewet bias found in the tropical UTLS in comparison withMOZAIC.[75] In the upper stratosphere ERA-40 overestimates the
ozone concentrations by typically up to 10% over thetropics and the midlatitudes, and by 10–20% over the highlatitudes, with a strong seasonal dependence in the wayERA-40 captures the actual value of the tropical ozonemaximum at around 10 hPa. In the middle and lowerstratosphere, ERA-40 seems to underestimate ozone bytypically 5%, a tendency that persists over the tropicsthroughout the year, but is highly variable with season,and may even change sign over the middle and highlatitudes (Figure 4). In general, ERA-40 underestimatesthe ozone concentration within the core of the Antarcticozone hole by 10–20%, though this situation may be theopposite for same years during the 1990s, but ERA-40consistently overestimates ozone values by 10% at levelsabove the Antarctic ozone hole. By contrast, ERA-40 seems
to significantly overestimate ozone during Arctic ozonehole events (primarily in January), and especially duringthe coldest winters throughout the 1990s. In the UTLSERA-40 tends to consistently underestimate ozone in the LSover the high latitudes, and overestimate it in the tropicalUT. In the UTLS over the midlatitudes, the ERA-40 ozoneperformance has a strong seasonal variation (Figure 4).Because of an improvement in the data assimilation systemintroduced in October 1996, after this date ERA-40 ozone issubsequently closer to MOZAIC data in the UTLS over themiddle and high latitudes (though not much difference wasseen in the tropics). In view of these results, care should betaken when calculating ERA-40 ozone trends in the UTLSduring the 1990s over the middle and high latitudes.[76] The water vapor cycle in ERA-40 appears to be
problematic, and issues are being addressed as part ofECMWF’s continuing program of research and develop-ment. The water vapor evaluation presented here indicatesthat the reanalysis is not necessarily in balance with themodel’s own water vapor climate. More specifically, ERA-40 is too dry by about 10–20% above about 70 hPa(Figure 11). Although within the core of the Antarcticvortex, ERA-40 is wetter than HALOE in the LS by a fewpercent, above about 50 hPa ERA-40 is significantly drierwithin the vortex (Figure 9c). This ERA-40 dry bias in theupper and middle stratosphere is not confined to the regionof the Antarctic polar vortex but is essentially global. Thisdry bias seems to increase with time during the 1990s(Figure 12). In the upper stratosphere, ERA-40 does notcapture realistically the seasonal cycle in water vapor asobserved by HALOE. At tropopause levels and into theUT, ERA-40 values are wetter than those of MOZAIC,typically by about 20% (Figure 10 and Table 6). Finally,the largest discrepancies from the MOZAIC observationsoccur in the LS over the high latitudes, where the ERA-40water vapor performance has a strong seasonal and altitudevariation, and the reanalysis is >60% wetter than MOZAICat and below cruise altitudes of 11.2 km (223–215 hPa).[77] At the time of writing, MLS temperature, ozone and
water vapor data are being prepared for assimilation into theECMWF system by groups at the Universities of Edinburghand Reading (UK), initially for the period 1992 to 1994.This enhancement of the data assimilation should correct, atleast for some years, some of the errors with the currentversion of the ERA-40 reanalysis noted here.
[78] Acknowledgments. We thank the ECMWF and the MOZAICteams for providing access to the ERA-40 and in situ measurements andboth the British Atmospheric Data Centre (BADC) and the UARS scienceteam for giving us useful information, in particular W. G. Read forsupplying us with the latest MLS version 7.02 for the water vapor data.Discussions with A. Dethof, E. Holm, and A. Simmons from ECMWF andS. Pascal from Meteo-France in Toulouse are also highly appreciated. Thiswork was supported in part by a NERC UK postdoctoral fellowship.
ReferencesAndersson, E., et al. (1998), The ECMWF implementation of threedimensional variational assimilation 3D-Var. Part III: Experimental re-sults, Q. J. R. Meteorol. Soc., 124, 1831–1860.
Barath, F. T., et al. (1993), The Upper Atmosphere Research SatelliteMicrowave Limb Sounder instrument, J. Geophys. Res., 98, 10,751–10,762.
Bhartia, P. K., R. D. McPeters, C. L. Mateer, L. E. Flynn, and C. Wellemeyer(1996), Algorithm for the estimation of vertical ozone profile from thebackscattered ultraviolet (BUV) technique, J. Geophys. Res., 101,18,793–18,806.
D14109 OIKONOMOU AND O’NEILL: EVALUATION OF OZONE AND WATER VAPOR FIELDS
25 of 27
D14109

Bruhl, C., et al. (1996), HALOE ozone channel validation, J. Geophys.Res., 101, 10,217–10,240.
Cariolle, D., and M. Deque (1986), Southern Hemisphere medium-scalewaves and total ozone disturbances in a spectral general circulation mod-el, J. Geophys. Res., 91, 10,825–10,846.
Chiou, E. W., M. P. McCormick, and W. P. Chu (1997), Global watervapor distribution in the stratosphere and upper troposphere derivedfrom 5.5 years of SAGE II observations (1986–1991), J. Geophys.Res., 102, 19,105–19,118.
Clark, H. L., and R. S. Harwood (2003), Upper-tropospheric humidity fromMLS and ECMWF reanalysis, Mon. Weather Rev., 131(3), 542–555.
Cunnold, D. M., H. Wang, W. Chu, and L. Froidevaux (1996a), Compar-isons between SAGE II and MLS ozone measurements and aliasing ofSAGE II ozone trends in the lower stratosphere, J. Geophys. Res., 101,10,061–10,075.
Cunnold, D. M., L. Froidevaux, J. Russell, and A. Roche (1996b), Anoverview of UARS ozone validation based primarily on intercomparisonsamong UARS and SAGE II measurements, J. Geophys. Res., 101,10,335–10,350.
Dethof, A. (2003), Aspects of modelling and assimilation for the strato-sphere at ECMWF, SPARC Newsl. 21, Stratospheric Processes and theirRole in Clim., Geneva.
Dethof, A., and E. Holm (2002), Ozone in ERA40: 1991–1996, ECMWFTech. Memo. 377, Eur. Cent. for Medium-Range Weather Forecasts,Reading, UK.
Dethof, A., and E. Holm (2004), Ozone assimilation in the ERA-40 reana-lysis project, Q. J. R. Meteorol. Soc., 130, 2851–2872.
Fisher, M., and E. Anderson (2001), Developments in 4D-Var and Kalmanfiltering, ECMWF Tech. Memo. 347, 36 pp., Eur. Cent. for Medium-Range Weather Forecasts, Reading, UK.
Flaud, J. M., C. Camy-Peyret, C. P. Rinsland, M. A. H. Smith, andV. Malathy Devi (Eds.) (1990), Atlas of Ozone Spectral Parameters FromMicrowave to Medium Infrared, Elsevier, New York.
Fortuin, J. P. F., and U. Langematz (1994), An update on the global ozoneclimatology and on concurrent ozone and temperature trends, Proc. SPIEInt. Soc. Opt. Eng., 2311, 207–216.
Froidevaux, L., et al. (1996), Validation of UARS Microwave Limb Soun-der ozone measurement, J. Geophys. Res., 101, 10,017–10,060.
Gibson, J. K., P. Kallberg, S. Uppala, A. Nomura, A. Hernandez, andE. Serrano (1997), ERA description, ECMWF Re-anal. Final Rep. Ser.,vol. 1, 71 pp., Eur. Cent. for Medium-Range Weather Forecasts, Reading,UK.
Gleason, J. F., et al. (1993), Record low global ozone in 1992, Science,260(5107), 523–526.
Helten, M., H. G. J. Smit, W. Strater, D. Kley, P. Nedelec, M. Zoger, andR. Busen (1998), Calibration and performance of automatic compactinstrumentation for the measurement of relative humidity from passengeraircraft, J. Geophys. Res., 103, 25,643–25,652.
Hervig, M. E., J. M. Russell III, L. L. Gordley, J. H. Park, S. R. Drayson,and T. Deshler (1996), Validation of aerosol measurements from theHalogen Occultation Experiment, J. Geophys. Res., 101, 10,267–10,275.
Hollinger, J. P. (1990), Special issue on the Defense Meteorological Satel-lite Program (DMSP): Calibration and validation of the Special SensorMicrowave Imager (SSM/I), IEEE Trans. Geosci. Remote Sens., 28,779–780.
Hollinger, J. P., J. L. Pierce, and G. A. Poe (1990), SSM/I instrumentevaluation, IEEE Trans. Geosci. Remote Sens., 28, 781–790.
Jarnot, R. F., R. E. Cofield, J. W. Waters, and D. A. Flower (1996), Cali-bration of the Microwave Limb Sounder on the Upper Atmosphere Re-search Satellite, J. Geophys. Res., 101, 9957–9982.
Kalnay, E., et al. (1996), The NMC/NCAR 40-Year Reanalysis Project,Bull. Am. Meteorol. Soc., 77, 437–471.
Kistler, R., et al. (2001), The NCEP-NCAR 50-Year Reanalysis: Monthlymeans CD-ROM and documentation, Bull. Am. Meteorol. Soc., 82, 247–268.
Livesey, N. J., W. G. Read, L. Froidevaux, J. W. Waters, H. C. Pumphrey,D. L. Wu, M. L. Santee, Z. Shippony, and R. F. Jarnot (2003), The UARSMicrowave Limb Sounder version 5 data set: Theory, characterizationand validation, J. Geophys. Res., 108(D13), 4378, doi:10.1029/2002JD002273.
Manney, G. L., L. Froidevaux, M. L. Santee, R. W. Zurek, and J. W. Waters(1997), MLS observations of Arctic ozone loss in 1996–97, Geophys.Res. Lett., 24(22), 2697–2700.
Manney, G. L., L. Froidevaux, M. L. Santee, N. J. Livesey, J. L. Sabutis,and J. W. Waters (2003), Variability of ozone loss during Arctic winter(1991–2000) estimated from UARS Microwave Limb Sounder measure-ments, J. Geophys. Res., 108(D4), 4149, doi:10.1029/2002JD002634.
Marenco, A., et al. (1998), Measurement of ozone and water vapor byAirbus in-service aircraft: The MOZAIC airborne program: An overview,J. Geophys. Res., 103, 25,631–25,642.
Marshall, B. T., L. L. Gordley, and D. A. Chu (1994), BANDPAK: Algo-rithms for modeling broadband transmission and radiance, J. Quant.Spectrosc. Radiat. Transfer, 52, 581–599.
McMillin, L. M., et al. (1973), Satellite infrared soundings from NOAAspacecraft, NOAA Tech. Rep. NESS 65, 112 pp., Natl. Oceanic and At-mos. Admin., U.S. Dep. of Commer., Washington, D. C.
McNally, A. P., E. Andersson, G. Kelly, and R. W. Saunders (1999), Theuse of raw TOVS/ATOVS radiances in the ECMWF 4D-Var assimilationsystem, ECMWF Newsl. 83, pp. 2–7, Eur. Cent. for Medium-RangeWeather Forecasts, Reading, UK.
McPeters, R. D., et al. (1996), Nimbus-7 Total Ozone Mapping Spectro-meter (TOMS) data products user’s guide, NASA Ref. Publ., 1384, 73 pp.
Morgenstern, O., and A. Marenco (2000), Wintertime climatology ofMOZAIC ozone based on the potential vorticity and ozone analogy,J. Geophys. Res., 105, 15,481–15,493.
Mote, P. W., K. H. Rosenlof, M. E. McIntyre, E. S. Carr, J. C. Gille, J. R.Holton, J. S. Kinnersley, H. C. Pumphrey, J. M. Russell III, and J. W.Waters (1996), An atmospheric tape recorder: The imprint of tropicaltropopause temperatures on stratospheric water vapor, J. Geophys. Res.,101, 3989–4006.
Noije, T. P. C., H. J. van Eskes, M. van Weele, and P. F. J. van Velthoven(2004), Implications of the enhanced Brewer-Dobson circulation in ERA-40 for the stratosphere-troposphere exchange of ozone in global chem-istry-transport models, J. Geophys. Res., 109, D19308, doi:10.1029/2004JD004586.
Oikonomou, E., A. O’Neill, and B. Hoskins (2004), Ozone intrusion eventsand their effect on climate over the eastern Mediterranean, paper pre-sented at 3rd SPARC General Assembly, Stratospheric Processes andtheir Role in Clim., Victoria, B. C., Canada, 1–6 Aug.
Pierce, R. B., W. L. Grose, J. M. Russell III, A. F. Tuck, R. Swinbank, andA. O’Neill (1994), Spring dehydration in the Antarctic vortex observedby HALOE, J. Atmos. Sci., 51, 2931–2941.
Rabier, F., A. McNally, E. Andersson, P. Courtier, P. Unden, J. Eyre, A.Hollingsworth, and F. Bouttier (1998), The ECMWF implementation ofthree-dimensional variational assimilation (3D-Var). II: Structure func-tion, Q. J. R. Meteorol. Soc., 124, 1809–1829.
Randel, W., et al. (2004), The SPARC intercomparison of middle atmo-sphere climatologies, J. Clim., 17, 986–1003.
Read, W. G., et al. (2001), UARS Microwave Limb Sounder upper tropo-spheric humidity measurement: Method and validation, J. Geophys. Res.,106, 32,207–32,258.
Read, W. G., D. L. Wu, J. W. Waters, and H. C. Pumphrey (2004a), A new147–56 hPa water vapor product from the UARS Microwave LimbSounder, J. Geophys. Res., 109, D06111, doi:10.1029/2003JD004366.
Read, W. G., D. L. Wu, J. W. Waters, and H. C. Pumphrey (2004b),Dehydration in the tropical tropopause layer: Implications from UARSMLS, J. Geophys. Res., 109, D06110, doi:10.1029/2003JD004056.
Reber, C. A. (1993), The Upper Atmosphere Research Satellite (UARS),Geophys. Res. Lett., 20, 1215–1218.
Rodgers, C. D. (1976), Retrieval of atmospheric temperature and composi-tion from remote measurements of thermal radiation, Rev. Geophys., 14,609–624.
Rosenlof, K. H., A. F. Tuck, K. K. Kelly, J. M. Russell, andM. P.McCormick(1997), Hemispheric asymmetries in water vapor and inferences abouttransport in the lower stratosphere, J. Geophys. Res., 102, 13,213–13,234.
Rosenlof, K. H., et al. (2001), Stratospheric water vapor increases over thepast half-century, Geophys. Res. Lett., 28, 1195–1198.
Russell, J. M., L. L. Gordley, J. H. Park, S. R. Drayson, W. D. Hesketh,R. J. Cicerone, A. F. Tuck, J. E. Frederick, J. Harries, and P. J. Crutzen(1993), The Halogen Occultation Experiment, J. Geophys. Res., 98,10,777–10,797.
Russell, J. M., M. Z. Luo, R. J. Cicerone, and L. E. Deaver (1996), Satelliteconfirmation of the dominance of chlorofluorocarbons in the global stra-tospheric chlorine budget, Nature, 379(6565), 526–529.
Simmons, A. J., A. Untch, C. Jacob, P. Kallberg, and P. Under (1999),Stratospheric water vapour and tropical tropopause temperatures inECMWF analyses and multi-year simulations, Q. J. R. Meteorol. Soc.,125, 353–386.
Steele, H. M., and R. P. Turco (1997), Separation of aerosol and gascomponents in the Halogen Occultation Experiment and the StratosphericAerosol and Gas Experiment (SAGE) II extinction measurements: Im-plications for SAGE II ozone concentrations and trends, J. Gephys. Res.,102, 19,665–19,681.
Stone, E. M., L. Pan, B. J. Sandor, W. G. Read, and J. W. Waters (2000),Spatial distribution of upper tropospheric water vapor measurementsfrom the UARS Microwave Limb Sounder, J. Geophys. Res., 105,12,149–12,162.
Stratospheric Processes and their Role in Climate (SPARC) (1998), As-sessment of trends in the vertical distribution of ozone, WMO Global
D14109 OIKONOMOU AND O’NEILL: EVALUATION OF OZONE AND WATER VAPOR FIELDS
26 of 27
D14109

Ozone Res. Monit. Proj. Rep. 43, WCRP-SPARC Rep. 1, 289 pp.,Geneva.
Stratospheric Processes and their Role in Climate (SPARC) (2000), Assess-ment of upper tropospheric and stratospheric water vapour, WMO WorldClim. Res. Proj. Rep. 113, WCRP-SPARC Rep. 2, 312 pp., Geneva.
Thouret, V., A. Marenco, P. Nedelec, and C. Grouhel (1998), Ozone cli-matologies at 9–12 km altitude as seen by the MOZAIC airborne pro-gram between September 1994 and August 1996, J. Geophys. Res., 103,25,653–25,679.
Uppala, S. (2001), ECMWF Reanalysis 1957–2001, paper presented atWorkshop on Reanalysis, Eur. Cent. for Medium-Range Weather Fore-casts, Reading, UK, 5–9 Nov.
Wang, H. J., D. M. Cunnold, L. Froidevaux, and J. M. Russell III (1999), Areference model for middle atmosphere ozone in 1992–1993, J. Geo-phys. Res., 104, 21,629–21,643.
Waters, J. W. (1993), Microwave limb sounding, in Atmospheric RemoteSensing by Microwave Radiometry, edited by M. A. Janssen, chap. 8, pp.383–496, John Wiley, Hoboken, N. J.
Waters, J. W., et al. (1999), The UARS and EOS Microwave Limb Sounderexperiments, J. Atmos. Sci., 56, 194–218.
Wu, J., and A. E. Dessler (2001), Comparisons between measurements andmodels of Antarctic ozone loss, J. Geophys. Res., 106, 3195–3201.
�����������������������E. K. Oikonomou, Service d’Aeronomie, CNRS, BP3, F-91371 Verrieres
Le Buisson, France. ([email protected])A. O’Neill, Department of Meteorology, University of Reading, Earley
Gate, P. O. Box 243, Reading RG6 6BB, UK.
D14109 OIKONOMOU AND O’NEILL: EVALUATION OF OZONE AND WATER VAPOR FIELDS
27 of 27
D14109