Embed Size (px)
Citation preview

Evaluation of Pathogenic and Indicator Microorganisms Removal by Membrane
Bioreactor
1Yamashita, N., 1Sugita, D., 1Hata, A., 1Tanaka, H., 2Mori, N., 2Okuma, N. 1Research Center for Environmental Quality Control, Kyoto University
2Water Reuse Promotion Center

Background
2
Bacteria: E. coli O-157, Cholera, Shigella
Protozoa: Cryptosporidium, Diardia
Virus: Norovirus, Rotavirus, Adenovirus Small size Disinfection tolerance
Reuse of sewage treatment water
Microorganisms in sewage water become problem
Is MBR effective to remove microorganisms?

Background
3
Contact facility Excess sludge reduction Water quality improvement Water Reuse
Knowledge of microorganisms removal by MBR is not enough.
Especially, virus removal data is important.
Breaking of membrane module in MBR would be observed occasionally.
What is appropriate indicator microorganism?
Advantages of MBR

4
→Evaluation of microorganisms removal by MBR
→Relashinship between microorganisms removal and membrane condition
2.Evaluation of indicator microorganisms
Purpose
1.Removal of microorganisms by MBR
Selection of appropriate indicator microorganism
Comparison between MBR and CAS

Materials and methods
5

6
Membrane Bioreactor (MBR)
Anaerobic tank Anoxic tank
Screen
Aerobic tank
Return sludge
Return sludge
Effluent
1
2
Influent
Membrane module replacement Since breaking of a few hallow fiber membrane was observed, membrane modules were replaced in January 2015.
Comparison microorganisms data between before and after replacement of membrane modules
1 2 Sampling point
Sampling period: Aug 2014 - March 2015, twice a month
hollow fiber type membrane
module
MLSS concentration: 6000-8000 mg/L
7
Conventional Activated Sludge (CAS) system
Disinfection
Chlorination 1
3
2
Returned sludge
Excess sludge
Sedimentation tank
Sedimentation tank
Conventional treatment
Deep shaft aeration treatment
Sedimentation tank
Influent
1 2 3 Sampling point
Sampling period: September 2014 - March 2015 Once a month
MLSS concentration: 1200-1500 mg/L
Effluent 2
Effluent 1

8
Sampling

9
Target Microorganisms
Norovirus (GI,GII-NoV)
Rotavirus(RV)
F-phages (GI~GIV-FPH)
Aichi virus (AiV) Pepper Mild
Mottle Virus (PMMoV)
Pathogenic virus Indicator virus
Indicator bacteria
E. Coli Coliforms
10
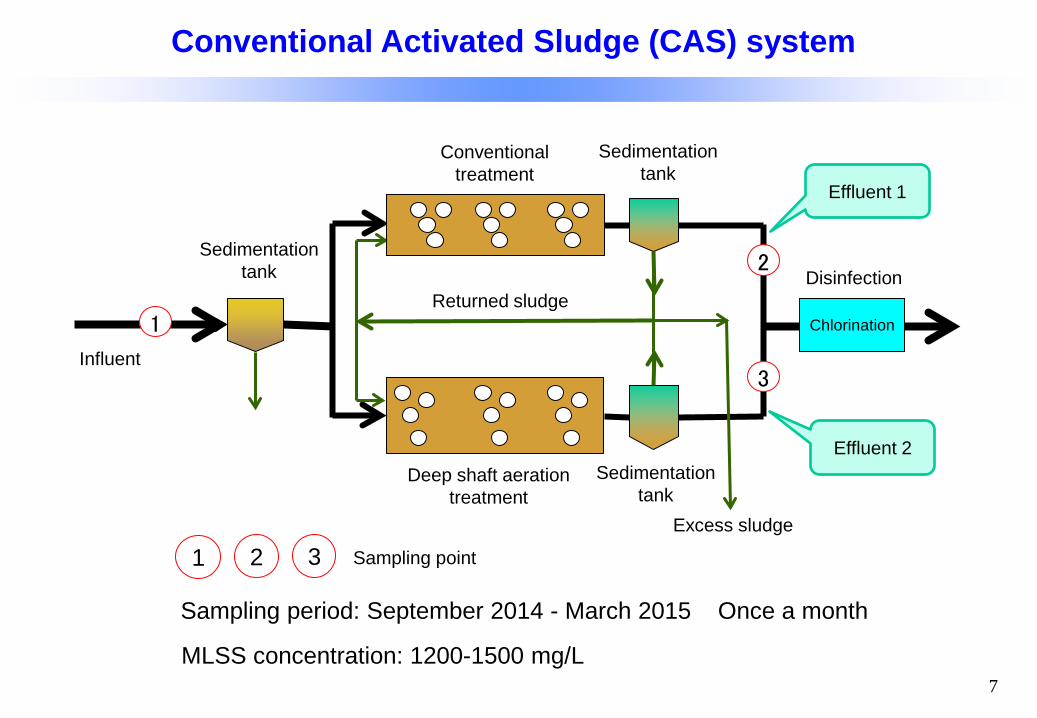
Bacteria
Culture method Plaque assay Concentration with electro-negative filter
Virus F-phage
genotype
Detection
Water samples
RT-qPCR TaqMan®
probe

Results and discussion
11

12
Effluent concentration from MBR was 101-102.
Bacteria removal by MBR was 5-6 logs.
E. coli was detected in effluent from MBR.
Bacteria concentration in MBR
1.0E+00
1.0E+01
1.0E+02
1.0E+03
1.0E+04
1.0E+05
1.0E+06
1.0E+07
1.0E+08
Con
cent
ratio
n (C
FU/1
00m
L)
Influent
effluent
E. coli was detected.
E. coli concentration in influent and effluent in MBR (Before membrane module replacement)
Aug. Sep. Oct. Nov. Dec.

13
Bacteria concentration in CAS
1.0E+00
1.0E+01
1.0E+02
1.0E+03
1.0E+04
1.0E+05
1.0E+06
1.0E+07
1.0E+08
Con
cent
ratio
n (C
FU/1
00m
L)
Influent
effluent 1
effluent 2
High concentration
Effluent concentration from CAS was about 104.
Bacteria removal by CAS was 2-3 logs.
Concentration of E. coli in effluent from CAS was relatively high.
E. coli concentration in influent and effluent in CAS
Sep. Oct. Nov. Dec. Jan. Feb.

0
1
2
3
4
5
6
7
8
Log
Rem
oval
14
Bacteria removal by MBR
E.coli Total coliforms
Bacteria removal by MBR was much higher than that by CAS.
E. coli and total coliforms removal by MBR was 5-6 logs.
E. coli and total coliforms removal by CAS was 2-3 logs.
Removal by CAS

0
1
2
3
4
5
6
7
8
Log
Rem
oval
15
Virus removal by MBR
AiV: Aichi virus, PMMoV: Pepper Mild Mottle Virus, GI, GII GIII-FRNAPH: GI, GII GIII F-RNA phage, GI-NoV: GI Norovirus, GII-NoV: GII Norovirus
AiV
PM
MoV
GI-F
RN
AP
H
GII-
FRN
AP
H
GIII
-FR
NA
PH
GI-N
oV
GII-
NoV
Virus removal by MBR was 3-4.2 logs. Virus removal fluctuated depending on samples and viruses.
(Before membrane module replacement)

0.00
1.00
2.00
3.00
4.00
5.00
6.00
7.00
0.00 1.00 2.00 3.00 4.00 5.00 6.00 7.00
AiVPMMoVGI-FRNAPHGII-FRNAPHGIII-FRNAPHF-PHGI-NoVGII-NoVRV
16
Comparison between MBR and CAS removal
CA
S s
yste
m L
og R
emov
al
MBR Log Removal
Virus removal by MBR was 3-4.2 logs as average.
Virus removal by CAS was 1-3 logs as average.
MBR will be effective to remove viruses in water.

17
Membrane replacement
Since breaking of a few hallow fiber membrane was observed, membrane modules were replaced in January 2015.
Lifting up membrane modules Setting new membrane modules
Compare microorganisms removal between before and after

18
Bacteria removal by MBR – Membrane replacement
0
1
2
3
4
5
6
7
8
Log
Rem
oval
E.coli Total coliforms
Bacteria removal by MBR was 6-7 logs.
Bacteria removal was improved after replacement.
Before replacement
After replacement
Rejection by membrane will be the important role.

19
1.0E+00
1.0E+01
1.0E+02
1.0E+03
1.0E+04
1.0E+05
1.0E+06
1.0E+07
1.0E+08
Con
cent
ratio
n (C
FU/1
00m
L)
Influent
effluent
Bacteria removal by MBR was improved after replacement.
E. coli was not detected in effluent from MBR.
E. coli was not detected.
E. coli concentration in influent and effluent in MBR
Bacteria concentration in MBR – Membrane replacement
N.D. N.D. N.D. N.D. N.D.
E. coli would be used as a indicator to evaluate membrane condition.
Jan. Feb. Mar.

0
1
2
3
4
5
6
7
8
Log
Rem
oval
Virus removal by MBR – Membrane replacement
Before replacement
After replacement
AiV
PM
MoV
GI-F
RN
AP
H
GII-
FRN
AP
H
GIII
-FR
NA
PH
GI-N
oV
GII-
NoV
Virus removal fluctuated depending on samples and viruses.
Virus removal by MBR was not improved after replacement.
Rejection by membrane will not be important for virus removal. 20

21
Conclusions
Removal of microorganisms by MBR
Evaluation of indicator microorganisms
Bacteria removal by MBR was 5-6 logs and virus removal was 3-4.2 logs.
MBR will be effective to remove microorganisms in water.
Microoranisms removal by MBR was higher than that by CAS.
Bacteria removal was improved after membrane replacement.
E. coli would be used as a indicator to evaluate membrane condition.
Virus removal was not improved after replacement. E. coli was not detected in effluent from MBR.

Thank you for your kind attention