Embed Size (px)
Citation preview

An- Najah National University Faculty of Graduate Studies
Evaluation Of Solid Waste Management In Qalqilia District
By
Jafar Abd-Alqader Abd-Alrazzaq Eid
Supervisor Dr. Hassan A. Arafat
Dr. Issam A.Al-Khatib
Submitted in Partial Fulfillment of the Requirements for the Degree of Master of Science in Environmental Sciences, Faculty of Graduate Studies, at An-Najah National University, Nablus, Palestine.
2007

ii
Evaluation Of Solid Waste Management In Qalqilia District
By Jafar Abd-Alqader Abd-Alrazzaq Eid
This thesis was successfully defended on 6/2/2007 and approved by: Committee members Signature
Dr. Hassan A. Arafat Supervisor ………………….
Dr. Issam A.Al-Khatib Co-Supervisor ………….……....
Dr. Nidal Mahmoud External Examiner ……………..…...
Dr. Hafez Shaheen Internal Examiner ………..………...

iii
Dedication
To My Parents, Wife, Children, Brothers and Sisters and Friends
To All Who Supported Me in This Study
iv
Acknowledgments
After thanking Allah, I wish to express my gratitude to everyone who
contributed to the success of this study. I must single out the Director
(supervisor), Dr. Issam A. Al-Khatib, from Beir-zeit University, who gave
his approval to this project and supported it during the months it took to
bring it to fruition.
I also want to thank Dr. Hassan Arafat, from Al-Najah University for
his insightful comments, helpful advice, encouragement, and support.
I am also grateful to my parents, wife, children, and friends for their
patience, support and encouragement.
My thanks go to all people that helped me in finishing this study.
I sincerely hope that this study will be beneficial to the policy makers,
planners, and health providers in the sanitary field in all municipalities, and
villages in Palestine.
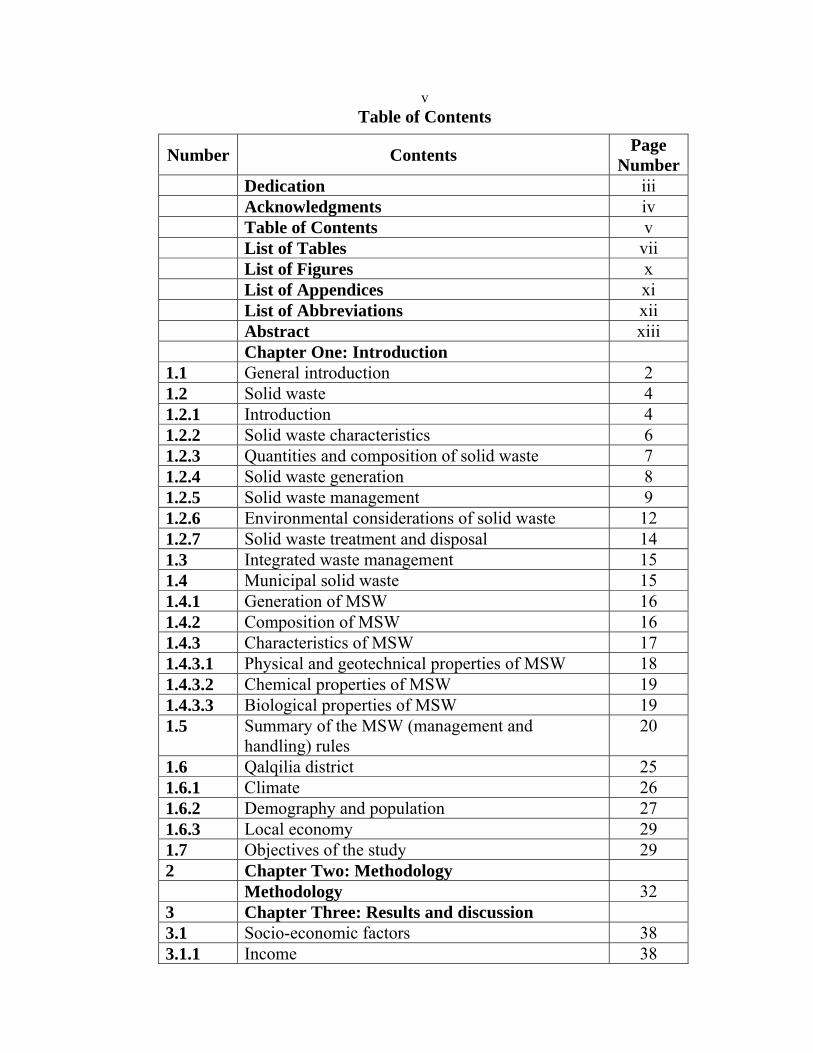
vTable of Contents
Page NumberContents Number
iii Dedication ivAcknowledgments v Table of Contents
vii List of Tables x List of Figures xi List of Appendices xii List of Abbreviations xiii Abstract
Chapter One: Introduction 2 General introduction1.1 4 Solid waste 1.2 4 Introduction 1.2.1 6 Solid waste characteristics 1.2.2 7 Quantities and composition of solid waste 1.2.3 8 Solid waste generation 1.2.4 9 Solid waste management 1.2.5
12 Environmental considerations of solid waste 1.2.6 14Solid waste treatment and disposal1.2.7 15 Integrated waste management 1.3 15 Municipal solid waste 1.4 16Generation of MSW1.4.1 16 Composition of MSW 1.4.2 17 Characteristics of MSW 1.4.3 18 Physical and geotechnical properties of MSW 1.4.3.1 19 Chemical properties of MSW 1.4.3.2 19 Biological properties of MSW 1.4.3.3 20 Summary of the MSW (management and
handling) rules 1.5
25 Qalqilia district 1.6 26 Climate 1.6.1 27 Demography and population 1.6.2 29 Local economy 1.6.3 29 Objectives of the study 1.7
Chapter Two: Methodology 2 32 Methodology
Chapter Three: Results and discussion 3 38 Socio-economic factors 3.1 38 Income 3.1.1
viPage
NumberContents Number
39 Respondents 3.1.2 39 Household occupants 3.1.3 40 Education level 3.1.4 41 Respondents knowledge about the meaning of
solid waste 3.2
42 Practices and attitudes 3.3 50 Solid waste reduction opportunities 3.4 54MSW Collection and transportation3.5 58 MSW Generation rates 3.6 60 Methods of final waste disposal 3.7 63MSW Management budgets3.8 64 MSW Collection workers and collection
equipments 3.9
74 Other findings and lessons from the study. 3.10 76MSW Composition3.11
Chapter Four: Conclusions and Recommendations
4
90 Conclusions 4.1 92 Recommendations 4.2 92 Collection of MSW 4.2.1 93 Segregation of MSW 4.2.2 93 Transportation of MSW 4.2.3 93 Storage of MSW 4.2.4 94 Processing of MSW 4.2.5 94 Disposal of MSW 4.2.6 95 Public participation 4.2.7 95Education and safety of MSW employees4.2.8 96 References
103 Appendices Arabic Abstract ب
viiList of Tables
Table Number Contents Page
NumberTable 1.1 Solid waste statistics of the Palestinian Territory 9 Table 1.2 Projected Mid -Year Population for Qalqilia
Governorate by Locality 2004- 2006 28
Table 2.1 Type of respondent to questionnaire 33 Table 2.2 Distribution of questionnaires between the city
and the villages 33
Table 3.1 Distribution of average family income in new Israel Shekel (NIS)
38
Table 3.2 Distribution of survey respondents 39 Table 3.3 Distribution of the number of occupants in the
households 40
Table 3.4 Distribution of surveyed households according to the number of rooms in the house
40
Table 3.5 Distribution of surveyed respondents according to duration of residence in localities of Qalqilia district
40
Table 3.6 Distribution of respondents according to educational level
41
Table 3.7 Response of respondents answer about the meaning of the term solid waste
41
Table 3.8 Distribution of surveyed respondents about if there is a solid waste problem in their locality
42
Table 3.9 Distribution of surveyed residents committed by paying fees for MSW collection services
43
Table 3.10 Availability of MSW workers in Qalqilia district 43 Table 3.11 Reasons that prevent people to work in MSW
management. 43
Table 3.12 MSW collection workers use of special uniform, during collection process.
44
Table 3.13 Waste burning practices 45 Table 3.14 Resident practices when disposing waste 47 Table 3.15 Household member that disposes their waste into
waste container 48
Table 3.16 Peoples attitudes toward the site of waste container
48
Table 3.17 Reasons that explain peoples concern about putting the waste container close to their houses
48

viiiTable
Number Contents Page Number
Table 3.18 Monthly money (in shekel) that residents are willing to pay more for better service?
49
Table 3.19 Suitability of the distance between the container and the house
49
Table 3.20 Distance in meters that people are willing to walk to reach the waste container
50
Table 3.21 Willingness to separate waste into five components
50
Table 3.22 Willingness to separate MSW into organic and inorganic
51
Table 3.23 Disposal methods of food wastes 52 Table 3.24 Willingness of citizens to transform organic
waste to natural fertilizer if they have been trained
52
Table 3.25 Satisfaction with the existing MSW services 53 Table 3.26 Reasons of un satisfaction with the existing
MSW services 54
Table 3.27 MSW collection in surveyed residential areas 57 Table 3.28 MSW generation rates in surveyed residential
areas 59
Table 3.29 MSW disposal methods of surveyed residential area
62
Table 3.30 Disposal methods of medical waste that come from health centers
62
Table 3.31 Ownership of the land of the dumpsite 63 Table 3.32 Percentage of total budget allocated for MSW
management 64
Table 3.33 Number of street litter collectors in localities of Qalqilia district
65
Table 3.34 Average number of vehicles and localities shared vehicles
66
Table 3.35 Road condition that reach the household 67 Table 3.36 Distance of the closest container to the
household 68
Table 3.37 Mechanical situation of the container 69Table 3.38 Littering near the container 71 Table 3.39 Probability of finding the container full of waste 72 Table 3.40 Percentage distribution of streets that don't
receive scavenge72
ixTable
Number Contents Page Number
Table 3.41
Percentage distribution of containers that don't receive splash with insecticides
73
Table 3.42 Hygienic situation of the nearest container 74 Table 3.43 Average percentage weight and range of 8
municipal solid waste components from different samples and dumpsites.
86
Table 3.44 Average percentage volume and range of 8municipal solid waste components from different samples and dumpsites
87
Table 3.45 Average density and range of 8 municipal solid waste components from different samples and dumpsites.
88
xList of Figures
Figure Number Contents Page
NumberFigure 1.1 Qalqilia built up area 26 Figure 2.1 Steps of segregation of waste in Qalqilia
dumpsite 35
Figure 2.2 View of Qalqilia dumpsite. 36 Figure 3.1 Collection workers without uniform 45 Figure 3.2 Scattered waste around waste container 46 Figure 3.3 Cats scattering waste searching for food 47 Figure 3.4 Three tons solid waste compactor 56 Figure 3.5 Waste dump for Qalqilia city 60 Figure 3.6 Jayyus solid waste dumpsite 60 Figure 3.7 Waste compactor funded by international donors 66 Figure 3.8 Hauled container system that hauled to a
disposal facility 69
Figure 3.9 Waste container without a cover full of waste 71 Figure 3.10 Average composition of MSW by weight in
Qalqilia district 78
Figure 3.11 Average composition of MSW by volume in Qalqilia district
78
Figure 3.12 Average composition of MSW by weight in Qalqilia dumpsite
78
Figure 3.13 Average composition of MSW by volume in Qalqilia dumpsite
79
Figure 3.14 Average composition of MSW by volume in Sanniriya dumpsite
80
Figure 3.15 Average composition of MSW by weight in Sanniriya dumpsite
80
Figure 3.16 Average composition of MSW by weight in Kafr Laqif dumpsite
81
Figure 3.17 Average composition of MSW by volume in Kafr Laqif dumpsite
81
Figure 3.18 Average composition of MSW by weight in Jinsafut
82
Figure 3.19 Average composition of MSW by volume in Jinsafut
83
Figure 3.20 Average composition of MSW by weight in Far'ata dumpsite
84
Figure 3.21 Average composition of MSW by volume in Far'ata dumpsite
84

xiList of Appendices
Page Number
Appendix
104 Appendix A 111Appendix B112 Appendix C 113 Appendix D 117 Appendix E:
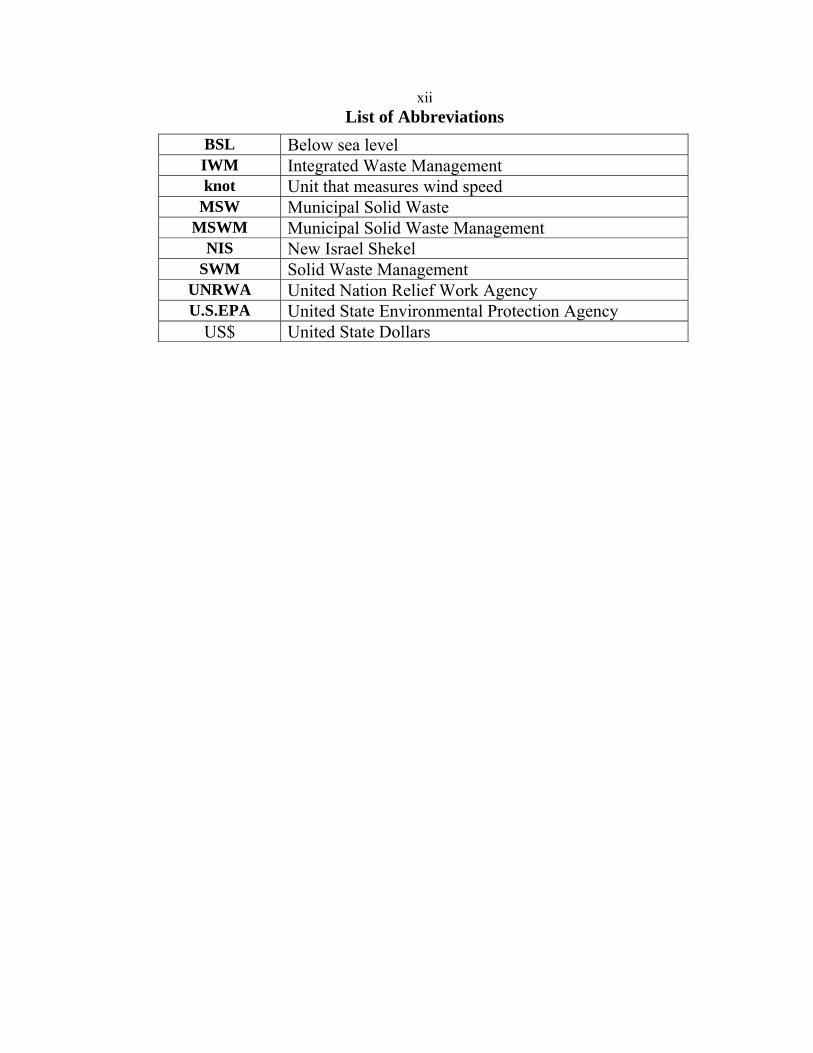
xiiList of Abbreviations
BSL Below sea level IWM Integrated Waste Management knot Unit that measures wind speed
MSW Municipal Solid Waste MSWM Municipal Solid Waste Management
NIS New Israel Shekel SWM Solid Waste Management
UNRWA United Nation Relief Work AgencyU.S.EPA United State Environmental Protection Agency
US$ United State Dollars

xiiiEvaluation Of Solid Waste Management In
Qalqilia District By
Jafar Abd-Alqader Abd-Alrazzaq Eid Supervisor
Dr. Hassan A. Arafat Dr. Issam A.Al-Khatib
Abstract
This study describes the problems, issues and challenges of MSWM faced
by local authorities in Qalqilia district. Approaches of possible solutions
that can be undertaken to improve MSW services are discussed. The study
consists of a public survey, survey and discussions with local authorities
staff involved in waste management, determination of waste composition
by segregation of 30 samples from 5 sites, review of documents and field
observation. The study provides information on MSW collection services
availability and waste disposal practices in Qalqilia district.
It was found that little or no consideration of environmental impacts was
paid in the selection of dumpsites. Inspection and monitoring of the
dumpsites was not consistent, 46.2% of local authorities dispose waste in
open random dumps without any further treatment and 15.4% of local
authorities disposes waste in open random dumps and then burn it. 100% of
local authorities employ workers in the MSW services without any training
and they do not train them later to do their work but they obtain the
experience from experiment and from their companion, so they are usually
exposed to danger. The collection workers and the vehicle are divided
between small localities. Little numbers of waste containers is available in
most localities. MSW collection frequency in several villages is around or
xiv
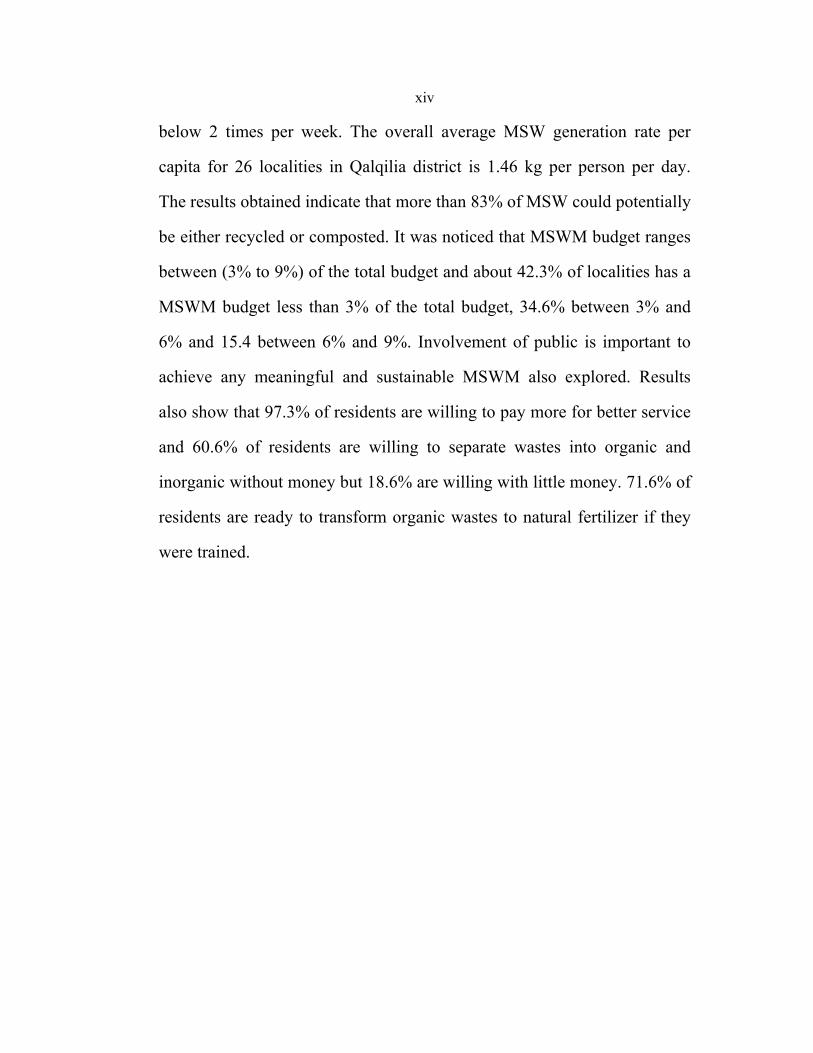
below 2 times per week. The overall average MSW generation rate per
capita for 26 localities in Qalqilia district is 1.46 kg per person per day.
The results obtained indicate that more than 83% of MSW could potentially
be either recycled or composted. It was noticed that MSWM budget ranges
between (3% to 9%) of the total budget and about 42.3% of localities has a
MSWM budget less than 3% of the total budget, 34.6% between 3% and
6% and 15.4 between 6% and 9%. Involvement of public is important to
achieve any meaningful and sustainable MSWM also explored. Results
also show that 97.3% of residents are willing to pay more for better service
and 60.6% of residents are willing to separate wastes into organic and
inorganic without money but 18.6% are willing with little money. 71.6% of
residents are ready to transform organic wastes to natural fertilizer if they
were trained.
1
Chapter One

2
Chapter One
1.1 General Introduction
Solid waste is defined as a material that is cheaper to throw away than to
store or use. It is no longer considered as wanted material to be dumped out
of site. Solid wastes are simply 'material of wrong place', which can be
segregated, transformed, recycled and reused with great financial and
environmental benefits (Iqbal and Ahsan, 2003).
Solid waste management (SWM) is an important environmental health
service, and is an integral part of basic urban services. From the earliest
primitive human society there have been attempts to safely dispose of solid
waste. In the early days, disposal did not pose difficulty as habitations were
sparse and land was plentiful. Disposal became problematic with the rise of
towns and cities where large numbers of people started to congregate in
relatively small areas in pursuit of livelihoods. On one hand, the density of
population increased in these centers of congregation and therefore wastes
generated per unit area also increased. On the other hand, available land for
disposal of waste decreased in proportion. SWM thus emerged as an
essential, specialized sector for keeping cities healthy and livable (Ahmed
and Ali, 2004).
It is clear that SWM in future will expand in scope and complexity. It
will also consume a considerable proportion of city budgets. The SWM
sector, therefore, deserves careful attention for striking a balance between
3
quality of service and cost effectiveness. This challenge is particularly
significant for developing countries, where resources are limited but
urbanization is occurring rapidly (Ahmed and Ali, 2004).
Management of solid waste is a major challenge these days for the
administrators, engineers and planners. Huge volumes of solid wastes are
generated and need to be collected, transported and finally disposed of.
These operations have to be carried out speedily and efficiently without
incurring excessive cost or damage to environment. Unfortunately in many
developing countries, the system for managing wastes is primitive and
cannot cope with the huge volumes of wastes being generated (Al-Yousfi
2004, Ahmed and Ali, 2004).
In developing countries, it is common to find large heaps of garbage
festering all over the city. The problem gets further complicated due to
large population and the obsolete techniques employed for waste
management (Mbuligwe et. al., 2002). The solid waste is considered to be
one of the dangerous causes of pollution; therefore this problem has to be
treated in a wise manner to protect our environment (Al-Yaqout et. al.,
2002, Vidanaarachchi et. al., 2005).
Today, Palestine faces the problem of solid waste material which is
becoming more and more difficult. This is due to (1) lack of effective
national authority of Environmental Protection, (2) ever-increasing
population and the industrial development, (3) low environmental
awareness of the citizens, (4) low level of services presented by local

4
municipalities, (5) poor mechanical equipment (6) lack of funds,
(Srivastrava et. Al., 2005, Mbuligwe et. al., 2002), and (7) Israeli
occupation that restricted the mobility of Palestinians within limited
territories and prevented solid waste from being delivered to disposal sites,
(Al-Khatib and Abu Safieh, 2003), (8) Israeli pilfering of land, land
confiscation and Annexation Wall that pinches the land. All these have
resulted in poor management practices regarding solid waste material and
higher potential of pollution.
1.2 Solid Waste
1.2.1 Introduction
Solid waste can be defined as any unwanted material that is not
discharged to the atmosphere or via pipe, and cannot flow directly into
streams or rise immediately into the air (Qusus 1988). They are non-liquid,
non-gaseous residues of our manufacturing. Solid wastes are all arising
from human and animal activities that are normally solid and that are
discarded as useless or unwanted. Solid wastes are generally divided into
the following categories: -
a) Domestic solid waste
These wastes are the consequence of house keeping activities such as
food preparation, sweeping and vacuum cleaning and they mainly contain
food waste, packing, paper, dust and worn out; broken or worn household
effects and items of clothing. They may also contain a fuel residue, empty

5
containers, waste from repair and redecorating, reading matter, etc.
(Qusus1988; Palestinian National Information Centre, 1999).
b) Commercial solid waste
This is mainly the waste produced by offices and shops which may consist
of wood crates, paper, packing material, and carbon paper. Food waste
from restaurants and cafeterias may be included in this waste. Waste from
hotel, schools, barracks, nurse’s homes and hospital are special waste also
included in this category (Buenrostro et. al., 2001).
C) Street-cleaning waste
This waste varies in nature and quantity according to the habits of people
and the effectiveness of refuse collection system. It contains mainly litter,
girt, paper, small containers and food waste (Qusus 1988).
d) Agricultural and animal solid waste
These kinds are made up of residues, poultry and other animal manure,
certain waste arising from slaughter and from the preparation of carcasses
and waste products from canning and processing of food (Buenrostro et.
al., 2001; Palestinian National Information Centre, 1999).
e) Mining waste
The mining industry produces such large amounts of solid waste that
special emphasis should be given to this material. Unplanned spoil heaps

6
impair the landscape, threaten landslides and pollute ground water (Qusus
1988, Palestinian National Information Centre, 1999).
f) Industrial solid waste
Solid waste generated from various processes in small and large scale
industries are classified as industrial wastes. These are highly
heterogeneous in nature and are industry specific. Both hazardous and non
hazardous components are found in industrial wastes (Buenrostro et. al.,
2001).
It consists of all factories unassailable solid waste, i.e. packing materials,
plastic, etc. some industrial solid waste is highly toxic, so special treatment
must be performed before disposing it (Qusus 1988; Palestinian National
Information Centre, 1999).
Of the six types mentioned above, the first three are combined into what is
known as "municipal solid waste" (MSW).
1.2.2 Solid waste characteristics
The most significant characteristics of solid waste are: -
1- Density of solid waste :- Density is usually expressed as kg/m3
2- Moisture content: - the moisture content is usually expressed as the
weight of moisture per unit weight of wet or dry material. In the wet weight
method of measurement, the moisture in a sample is expressed as a
percentage of the total weight of the sample.
7
3- Chemical Composition: - Information on chemical composition of
solid waste is important in evaluating processing and recovery options (i.e.
Energy recovery, composting process, waste derived fuel, etc.)
4- Physical composition: - Information on physical composition is also
necessary in evaluating processing and recovery options.
These characteristics vary widely for the major solid waste
components, such as garbage, rubbish, street sweeping, etc.
These characteristics are affected by (1) Type of collection systems, (2)
Standard of living, (3) Seasonal and local variables, (4) Extent and type of
commerce and industry, (5) Prevailing climate, and (6) other considerations
(Srivastrava et. al., 2005).
1.2.3 Quantities and composition of solid wastes
Because solid waste is generated from many different sources, it
naturally contains an almost infinite variety of materials. These range in
size from specks of dust to discarded automobiles. The major constituents
of domestic and commercial wastes are fermentable organic matters; glass,
wood, metals and plastic with relative proportion depending upon many
local factors (Palestinian National Information Centre, 1999).
Quantities of solid waste discarded each day vary through the week
according to whether it is the weekend, shopping days or holidays. They
also vary through the season depending on the availability of fresh fruit and
8
vegetables. Solid waste composition and quantities also vary over the year
with changes in diet, packaging, etc. Residents of large towns also seem to
throw away more than the people in small towns. In short, the general rule
is that as one goes from a small poor traditional, illiterate community to a
large, rich, modern, and literate one, the refuse weight becomes more, the
food preparation waste becomes less, the paper and packaging fraction
increases and the average particle size increases (Qusus 1988; Srivastrava
et. al., 2005, Idris et. al., 2004).
1.2.4 Solid waste generation
The quantities of solid waste produced by the developed nations of the
world are large and are increasing along with a growing affluence and
improved standard of living (Idris et. al., 2004, Mcbean et. al., 1995,
Kaviraj 2003).
The generation of refuse in a community also varies throughout the year.
The cold months of winter result in low generation rate. In addition to
seasonal variations, refuse generation varies with the day of the week.
Collection frequency also affects the production of refuse. Generally, the
more frequent the collection, the more MSW is produced. An increase in
urbanization also affects the overall rate of solid waste generation in many
countries. (Idris et. al., 2004, Pokhrel and Viraraghavan, 2005).The
conclusion is therefore that waste generation is governed by these factors
(Vesilind et. al., 1987). Refuse quantities, in conjunction with the fact that
many landfills are reaching capacity, indicate very severe impending
9
problems. So we need to manage the generation of solid waste
(Vidanaarachchi et. al., 2005).
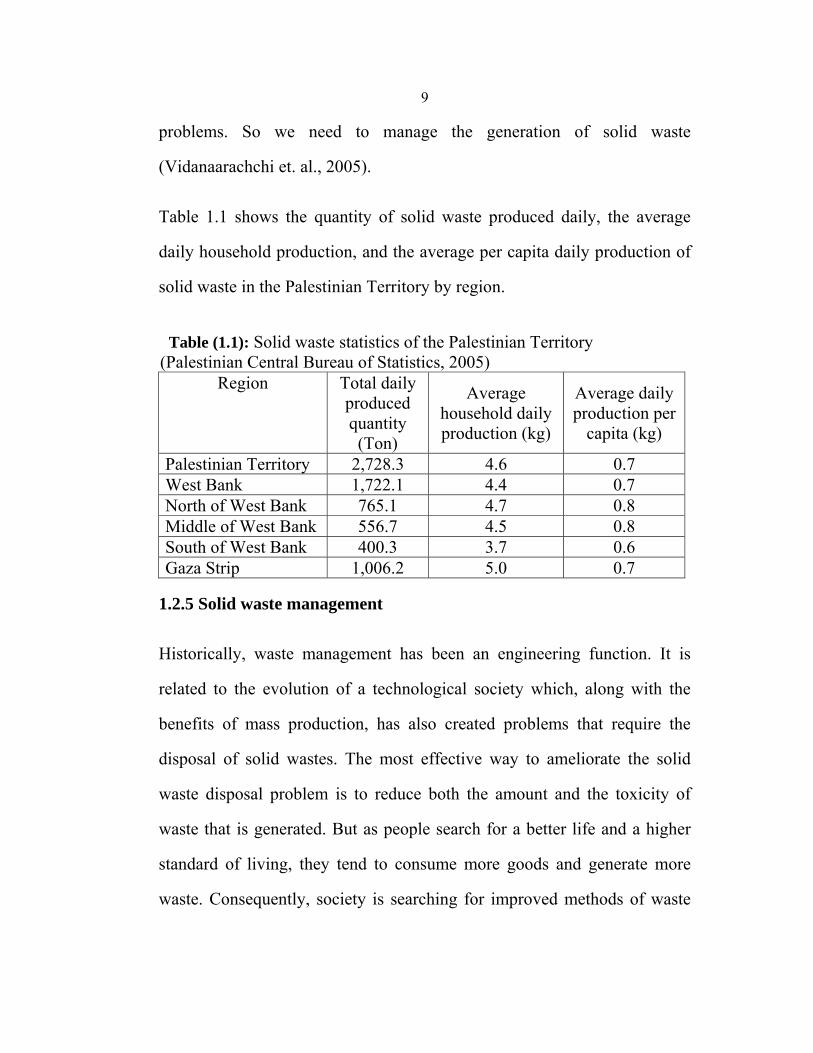
Table 1.1 shows the quantity of solid waste produced daily, the average
daily household production, and the average per capita daily production of
solid waste in the Palestinian Territory by region.
1.2.5 Solid waste management
Historically, waste management has been an engineering function. It is
related to the evolution of a technological society which, along with the
benefits of mass production, has also created problems that require the
disposal of solid wastes. The most effective way to ameliorate the solid
waste disposal problem is to reduce both the amount and the toxicity of
waste that is generated. But as people search for a better life and a higher
standard of living, they tend to consume more goods and generate more
waste. Consequently, society is searching for improved methods of waste
Table (1.1): Solid waste statistics of the Palestinian Territory (Palestinian Central Bureau of Statistics, 2005)
Region Total daily produced quantity
(Ton)
Average household daily production (kg)
Average daily production per
capita (kg)
Palestinian Territory 2,728.3 4.6 0.7 West Bank 1,722.1 4.4 0.7 North of West Bank 765.1 4.7 0.8 Middle of West Bank 556.7 4.5 0.8 South of West Bank 400.3 3.7 0.6 Gaza Strip 1,006.2 5.0 0.7
10
management and ways to reduce the amount of waste that needs to be
landfilled (Huang et. al., 2005).
Solid waste management in developing countries is plagued by a number of
problems, solutions for which are mainly constrained by financial and
technological deficiencies. As a result, there is dependence on donor
funding, with the consequent non-sustainability of solid waste management
service upon termination of donor funding (Mbuligwe et. al., 2002). The
most problematic functional element of solid waste management in
developing countries has been identified as disposal. A manifestation of
this problem is pollution of ground and surface water sources by leachate
from poorly managed and illegal solid waste dumps. Minimizing waste
generation by focusing on management practices at the source can save
disposal sites space, reduce illegal dumping, and therefore, cut down on
pollution potential from solid waste (Mbuligwe et. al., 2002).
Solid waste management is a complex process because it involves many
technologies and disciplines. These include technologies associated with
the control of generation, handling, storage, collection, transfer,
transportation, processing, and disposal of solid wastes. All of these
processes have to be carried out within existing legal and social guidelines
that protect the public health and the environment and are aesthetically and
economically acceptable. For the disposal process to be responsive to
public attitudes, the disciplines that must be considered include
administrative, financial, legal, architectural, planning, and engineering

11
functions. All these disciplines must communicate and interact with each
other in a positive interdisciplinary relationship for an integrated solid
waste management plan to be successful (Tchobanoglous and Kreith,
2002). The management of solid waste at all stages of collection, transport
and disposal has been less than effective in the most of Palestinian
localities, with its responsibility is divided between municipalities, village
councils, and village committees or UNRWA in the refugee camps.
Collection and transportation of solid waste in some cities is
relatively acceptable, but disposal is not adequate at all location since the
most common method of the disposal are dumping and burning in open
areas (Al-Khatib and Abu Safieh 2003). The inadequate number and
distribution of collection containers and irregular collection schedule have
encouraged the accumulation of solid waste in streets. As a rapid method of
disposal, burning takes place in densely populated areas where clouds of
smoke dominate.
Modern machinery for collection and transportation of solid waste have
been employed in most of the major municipalities, compositing vehicles
and some hydrau-lie lift containers are in service in the cities, however the
number of vehicles and trucks is not adequate to provide service to all
people and to empty containers as needed ( Augenstein et. al., 1996). In
some villages, the village council owns a truck for the collection of solid
waste, usually an agricultural tractor. In other villages, and due to lack of
fund village councils rent agriculture tractors for the purpose of collection.

12
Village's councils rarely provide collection containers, and the village
households store waste in plastic bags close to their houses or in the street
until the collection truck passes by.
Dumping sites in the West Bank are not designed as sanitary landfills.
These sites lack ground lining or leachate collection system to protect
ground water. These sites are open and management is restricted to
frequent burning of waste piles (Al-Khatib and Abu Safieh, 2003; Al-
Khatib et. al., 2006).
Although there have been improvement in collection procedure in some
areas, the problem of waste disposal has not been solved, solid waste
disposal in unsuitable dumping sites is creating environmental and human
health problem (Al-Khatib and Abu Safieh, 2003).
1.2.6 Environmental considerations of solid waste
Unless properly managed, solid wastes have potential of serious impacts on
environment. It can lead to surface and ground water contamination, land
population and air quality deterioration (Palestinian National Information
Centre, 1999).
Water infiltrating through the waste generates leachate, which can
ultimately mix with the ground water. Dust and litter scattered by wind are
responsible for deterioration of air quality in the vicinity of disposal sites.
Non-sanitary method of disposal of wastes also produces odor and affects
the aesthetics of the area. Moreover, decomposition of waste releases

13
noxious gases posing high risk to human health. It is now well known that a
large number of disease vectors and water borne disease spread due to poor
collection and disposal practices of solid waste (Kasseva, and Mbuligwe,
2000; Palestinian National Information Centre. 1999).
With the existing management system of solid waste, Palestine faces
an increasing solid waste management problem. Over the past 30 years,
management of solid waste at all stages of collection, transportation and
disposal has not been given enough attention from the Israeli occupier. The
pressure on the Palestinian environment from solid waste management
practices is further intensified by the considerable amount generated by
Israel settlers. Solid waste from Israelis is dumped without restriction on
Palestinian lands, fields, and side roads. Palestinians have no access to
information about neither the composition nor the disposal of solid waste
generated by settlers; however, evidence shows that much of this waste is
being disposed of on the many illegal dumped sites within the Palestinian
Territories. Israel illegally transfers hazardous and toxic wastes generated
inside Israel into the West Bank. The Palestinian Authority has discovered
several cases. In 1998, Israel has illegally transferred 2-3 trucks filled with toxic
and hazardous waste to two locations in the northern area of the West Bank.
The first location is near the eastern border of the Tulkarm municipality. The
second dumping site is located in close proximity to the residential area of
Azzun municipality and 50 meters from their groundwater well used for
drinking purpose.
14
In the Palestinian Territories and particularly in the West Bank, MSW
disposal is considered as a problem due to several reasons, including
groundwater aquifer location, the small area of the West Bank, the lack of
sanitary landfills, and the lack of any serious recycling programs
(Talahmeh, 2005).
1.2.7 Solid waste treatment and disposal
A method for disposing of refuse on land without creating nuisances or
hazards to public health or safety, by using correct ways for disposing of
refuse to reduce it to the smallest practical volume and to cover it with a
layer of earth at the end of each day operation, or at such more frequent
interval as may be necessary. Although sanitary land filling is an
acceptable method of solid waste disposal, it has not received wide public
acceptance, principally because so many communities have called their
open dump a sanitary landfill, the public's misconception of sanitary results
from the fact that the vast majority of land disposal sites are not sanitary
but open and burning dumps (Palestinian National Information Centre,
1999). Composting is a method of converting organic material into a drier
of no odor from through bacterial action, primarily to supply soil with
fertility, it is unlikely that this treatment method will become common in
the near future in developing countries( Augenstein et. al., 1996).

15
1.3 Integrated waste management
Integrated waste management (IWM) can be defined as a set of
management alternatives that includes reuse, source reduction, recycling,
composting, landfilling, and incineration ( Botkin and Keller, 2003). It can
be also defined as the selection and application of suitable techniques and
management programs to achieve specific waste management objectives
and goals. Because numerous state and federal laws have been adopted,
IWM is also evolving in response to the regulations developed to
implement the various laws. The U.S. Environmental Protection Agency
(EPA) has identified four basic management options (strategies) for IWM:
(1) source reduction, 2) Recycling and composting, (3) combustion (waste-
to-energy facilities), (4) landfills. As proposed by the U.S.EPA, these
strategies are meant to be interactive (US EPA, 1995; Srivastrava et. al.,
2005).
1.4 Municipal solid waste (MSW)
Municipal solid waste definition states that MSW includes wastes
from residential, commercial, institutional, and some industrial sources.
But this definition does not include a wide variety of other non-hazardous
wastes that often are landfilled along with MSW. Examples of these other
wastes are municipal sludge, combustion ash, non- hazardous industrial
process wastes, construction and demolition wastes, and automobile bodies
(Tchobanoglous and Kreith, 2002; Palestinian National Information Centre,
1999).

16
1.4.1 Generation of MSW
MSW generation is essential due to discarding of unwanted materials
away for disposal. Huge quantities of municipal solid wastes are generated
in all the megacities of the world. The volume of municipal solid waste
generated varies with the lifestyle of the people. It has been estimated that
each American generates wastes about 4000 times his body weight every
year in his life; each West European 1000 times; and each citizen of the
developing countries like India about 150 times. The United States alone
generates more than 200 million tons of wastes a year-an amount "enough
to fill a convoy of garbage-trucks stretching eight times around the globe
(Khan and Ahsan, 2003).
In our region, the generation of solid wastes has become an
increasingly important environmental issue over the last decade, due to the
escalating growth in populations and the changing life style, leading to new
trends of unsustainable consumption patterns concomitant with inflation in
waste production. Such increase in solid wastes generation concurrent with
shifting characteristics pose numerous questions concerning the adequacy
of conventional waste management systems, and their associated
environmental, economical and social implications (Al-Yousfi, 2004;
Srivastrava et. al., 2005; Rathi, 2005).
1.4.2 Composition of MSW
The composition of municipal solid wastes is the term that describes
the distribution of each component of wastes by its percent weight of the
total. The information is required for the selection of suitable treatment and
17
disposal methods. The precise composition of MSW depends upon locality,
season of the year, standard of living, and land use (Khan and Ahsan, 2003;
Srivastrava et. al., 2005).
Good measures of the waste stream composition are hard to obtain,
in part because the opening of bags to determine the wastes percent is an
onerous task. Also, people are reluctant to have their garbage sorted.
Additionally, seasonal trends relating to yard wastes, spring cleanup, ashes,
and the like, as well as the need to collect data over a large number of
households to ensure a representative sample, complicate the problem of
determining refuse composition (Mcbean et. al., 1995).
1.4.3 Characteristics of MSW
As long as the MSW is to be disposed of by landfill, there is little need to
analyze the waste much further than to establish the tons of waste
generated and perhaps consider the problems of special (hazardous)
materials. If, however, the intent is to collect gas from a landfill and put it
to some beneficial use, the amount of organic material is important. When
recycling is planned, or if materials or energy recovery by combustion is
the objective, it becomes necessary to have a better picture of the solid
waste. Some of the characteristics of interest are: Composition by
identifiable items, moisture content, particle size, chemical composition,
heat value, density, mechanical properties, biodegradability (Vesilind et.
al., 1987; Huang et. al., 2005).
18
So physical, chemical and biological properties of municipal solid wastes
are important for the design of an integrated wastes management system.
1.4.3.1 Physical properties of MSW
Physical properties of municipal solid wastes include:
(i) Specific Weight:
Specific weights of municipal solid waste is defined as the weight of
wastes per unit volume e.g. tons/m3. It is usually specified as loose,
incompact, or compacted. Specific weights are required to assess the total
volume of wastes that must be managed (Khan and Ahsan, 2003).
(ii) Moisture content
The moisture content of solid wastes is the weight of water in it expressed
as a percentage of its wet or dry weight. Usually it is the weight which is
commonly used to determine the moisture content (Mbuligwe et. al., 2002;
Ma.Teresa Orta de Velasquez et. al., 2003)
(iii) Particle Size and Size Distribution
Particle size distribution of municipal solid wastes is an important
parameter to be considered for material recovery, composting, incineration,
landfilling etc. (Huang et. al., 2005; Khan and Ahsan, 2003)
(iv) Field Capacity
Field capacity of solid wastes is defined as the total amount of moisture
that can be held in wastes sample under the gravitational force. It is an
19
important parameter, which affects the quantity of leachate generation in
landfills. Moisture available in solid wastes in excess of its field capacity is
released later as leachate. Field capacity of solid wastes varies with the
degree of compacting (Khan and Ahsan, 2003; Ma.Teresa Orta de
Velasquez et. al., 2003).
(v) Permeability
The permeability or hydraulic conductivity of wastes is defined as the ease
with which a fluid can flow through the waste. It is an important parameter
that governs the movement of liquids and gases in the landfill. Permeability
of municipal solid wastes is affected by the shape and size of wastes
components, porosity, and the amount of compaction applied to the wastes.
Compacted wastes have lower permeability (Khan and Ahsan, 2003;
Powrie et. al., 2005)
1.4.3.2 Chemical properties of MSW
Chemical properties of municipal solid wastes are required in the
design of various processes such as energy recovery or composting. The
choice of combustion processes depends upon the chemical position of
solid wastes. For energy recovery consideration, some important analyses
must be carried out (Khan and Ahsan, 2003).
1.4.3.3 Biological properties of MSW
Biological properties of municipal solid wastes include water soluble
constituents( such as sugars, starches, amino acids, and many other organic
20
acids); proteins (composed of chain of amino acids); fats oil and waxes;
hemicelluloses (a condensation product of sugars); cellulose (a
condensation product of glucose); lignin content ( a polymeric material);
and lignocelluloses (a combination of lignin and cellulose). Out of these,
lignin content is an important characteristic as it gives an idea of the
biodegradability of the waste and helps in the selection of appropriate
processing technique (Khan and Ahsan, 2003).
1.5 Summary of the MSW (management and handling) rules
The rules of management and handling shall apply to every Municipal
authority responsible for collection, segregation, transportation, processing
and disposal of municipal solid wastes (Huang et. al., 2005)
Every municipal authority shall, within the territorial area of the
municipality, be responsible for the implementation of the provision of
these rules, and for any infrastructure development for collection, storage,
segregation, transportation, processing and disposal of municipal solid
wastes. So any municipal solid waste generated in a city or a town, shall be
managed in accordance with the following compliance criteria
(Vidanaarachchi et. al., 2005).
Collection of municipal solid waste: littering of MSW shall be prohibited
in cities, towns, and urban areas notified by the Government. To prohibit
littering, following steps shall be taken:
21
(i) Organizing house to house collection of garbage through any of the
methods.
(ii) Wastes from slaughterhouses, fruits and vegetables markets, which are
biodegradable in nature, shall be managed to make use of such wastes.
(iii) Collection of waste from slums and squatter areas/localities including
hotels/restaurants/office complexes and commercial areas shall be devised
in consultation with municipal authority (Khan and Ahsan, 2003).
(iv) Bio-medical wastes and industrial wastes shall not be mixed with
municipal solid wastes as per rules specified separately for the purpose
(Khan and Ahsan, 2003).
(v) Collected waste from residential and other areas shall be transferred to
community bins or halos by hand driven containerized Carts (Khan and
Ahsan, 2003).
(vi) Horticultural and construction /debris shall be separately collected and
disposed off following proper norms. Similarly, activities related to diaries
(milking of cows/buffaloes) shall be regulated in accordance with State
laws (Khan and Ahsan, 2003).
(vii) Waste (garbage, dry leaves) shall not be burnt.
(viii) Stray animals shall not be allowed to move around waste storage
facilities or at any other place in city and town, and shall be managed as per
State laws.

22
Municipal authority shall notify waste collection schedule and the
likely method to be adopted for public benefit in city/town (Khan and
Ahsan, 2003).
Segregation of Municipal Solid Wastes: Municipal authority shall organize
awareness programs for segregation of wastes and shall encourage
recycling / reuse of segregated materials. Municipal authority shall
undertake phased programs to ensure that the community is fully involved
in waste segregation (Mbuligwe et. al., 2002)
Storage of Municipal Solid Wastes: Municipal authorities shall establish
and maintain storage facilities in such a manner as not to create
unhygienic/unsanitary conditions around it. Following criteria shall be
taken into account while establishing and maintaining storage facilities:
(i) Storage facilities shall be created /established by taking into account
quantities of wastes generation in a given area and the population density.
A storage facility shall be so sited such that the user finds it easy to
approach (Huang et. al., 2005)
(ii) Storage facility to be set up by Municipal authorities or by any other
agency shall be so designed that the waste stored is not exposed to open
atmosphere and shall be aesthetically acceptable and user-friendly (Huang
et. al., 2005).
(iii) Storage facilities or bins shall have 'easy to operate' design for
handling, transfer and transportation of waste (Huang et. al., 2005).

23
(iv) Manual handling of waste shall be prohibited. If unavoidable due to
constrains, manual handling shall be carried out under proper precaution
with due care for safety of workers (Milhem, 2004).
Transportation of Municipal Solid Wastes: Vehicles used for transportation
of wastes shall be covered. Wastes should not be visible to public, nor
exposed to open environment. The following criteria shall be met:
(i) The storage facilities set up Municipal authorities shall be daily attended
for clearing of wastes.
(ii) Collection and transportation vehicles shall be so designed that multiple
handling of wastes, prior to final disposal, is avoided (Huang et. al., 2005).
Processing of Municipal Solid Wastes: Municipal authorities shall adopt
suitable technology (or combination of such technologies) to make use of
wastes so to minimize burden on landfill. Following criteria shall be
adopted:
(i) The biodegradable wastes not containing any toxic containments, shall
be processed by composting, vermicomposting, anaerobic digestion or any
other appropriate biological processing for stabilization. It shall be ensured
that compost shall be free from contamination due to heavy metals,
pesticides or any other contaminants (Pokhrel andViraraghavan, 2005).
(ii) Waste containing recoverable material shall follow the route of
recycling.

24
Disposal of Municipal Solid Wastes: landfilling shall be restricted to non-
biodegrable, inert waste and other waste that are not suitable either for
recycling or for biological processing. Landfilling shall also be carried out
for residues of waste processing facilities as well as for pre-processing
rejects from waste processing facilities. Landfilling of mixed waste shall be
avoided unless it is found unsuitable for waste processing. Under
unavoidable circumstances or till installation of alternate facilities,
landfilling shall be done following proper norms (Augenstein et. al., 1996).
Landfilling shall meet the following criteria (Augenstein et. al., 1999).
(i) Landfill sitting and construction shall be done after proper care.
However, in respect of cities having population over five laces, proper
environmental impact assessment shall be conducted by Municipal
authority before selecting a site.
(ii) Provision for future landfill sites shall be included in the land use plan
of city/town.
(iii) Landfill site shall comply with the norms for control of air and water
(ground and surface water) pollution and other environmental norms as laid
down in the specifications/standards.
(iv) Waste at disposal site shall not be burnt. Sites where waste is to be
burnt shall be monitored for compliance (Palestinian National Information
Centre, 1999; Tanaka. 1999).
25
1.6 Qalqilia District
The name "Qalqilia" goes back to Roman times, and European
Mediaeval sources refer to it as "Kalkelie" used today by its contemporary
residents. Qalqilia District is located in the northern part of the West Bank
with the green line as its western border situated about 12 km from the
Mediterranean coast (Qalqilia.org.ps, 2004)
Qalqilia is a small district and therefore in many ways connected to
the neighboring district of Nablus from east. It is bounded to Tulkarm
district from the north and to Salfeet district from the south.
The Qalqilia district, with a total area of (151.3 km2) including the Israeli
settlements (Palestinian National Information Centre, 2003), the district
includes within its boundaries 5 municipalities and 30 villages. It also
includes 7 Israeli settlements, there are (2 formal settlements located inside
the completed Annexation wall). Qalqilia district is, as the rest of the West
Bank, divided into Areas A, B and C, which is an important element in the
closure policy. Roadblocks are placed between and around the different
areas. Qalqilia city has Area a status while most of the villages are area B
and some are area C. All areas next to the green line, the settlements and
the bypass roads are Area C (The Alternative Information Center, 2001),
and figure 1.1 shows the distribution of municipalities and villages among
the district and the location of Qalqilia district.
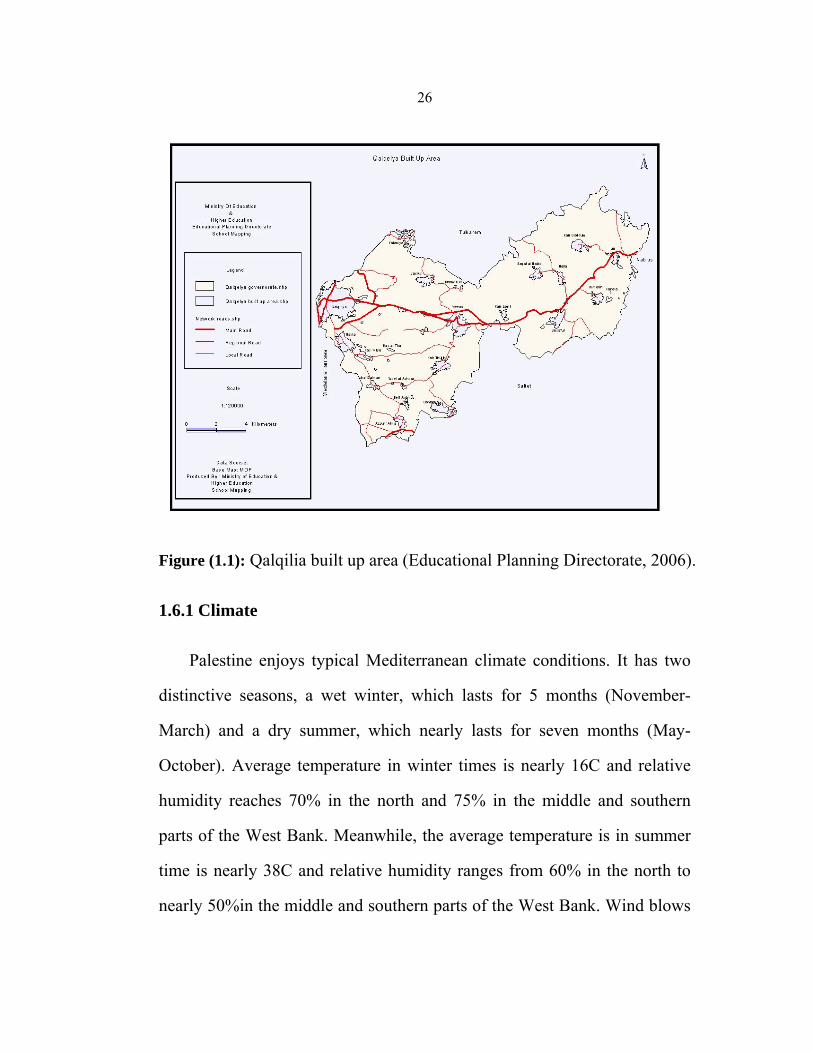
26
Figure (1.1): Qalqilia built up area (Educational Planning Directorate, 2006).
1.6.1 Climate
Palestine enjoys typical Mediterranean climate conditions. It has two
distinctive seasons, a wet winter, which lasts for 5 months (November-
March) and a dry summer, which nearly lasts for seven months (May-
October). Average temperature in winter times is nearly 16C and relative
humidity reaches 70% in the north and 75% in the middle and southern
parts of the West Bank. Meanwhile, the average temperature is in summer
time is nearly 38C and relative humidity ranges from 60% in the north to
nearly 50%in the middle and southern parts of the West Bank. Wind blows

27
predominantly from West and North West to East and South East, at an
average speed of 11 knots (Rabi, 2003).
The West Bank is a hilly area, with elevations varying from 400m
(bsl) in the Jordan Valley to 1000m above sea levels in the hills. The
surface geology in the West Bank is compromised of well-fractured and
karstified carbonate rocks, both limestone and dolomite. The presence of
hills in the central part of the West Bank affects the behavior of the low-
pressure area of the Mediterranean and causing precipitation on the hill
ridges (Rabi, 2003).
Qalqilia has a warm Mediterranean climate, rainy and warm in winter
and hot in summer with humidity levels reaching 70%during July and
August. Annual average rainfall is 550 mm (Qalqilia.org.ps, 2004).
1.6.2 Demography and population
The total population of the Qalqilia District is estimated at 97,472 at the
end of 2006 (PCBS, 2004), with annual growth rate of 3.8%
(Qalqilia.org.ps, 2004).
44,709 people are living in Qalqilia city and the rest in around 35
surrounding villages and bedewing groups. Table 1.2 shows the distribution
of people in the district by locality.
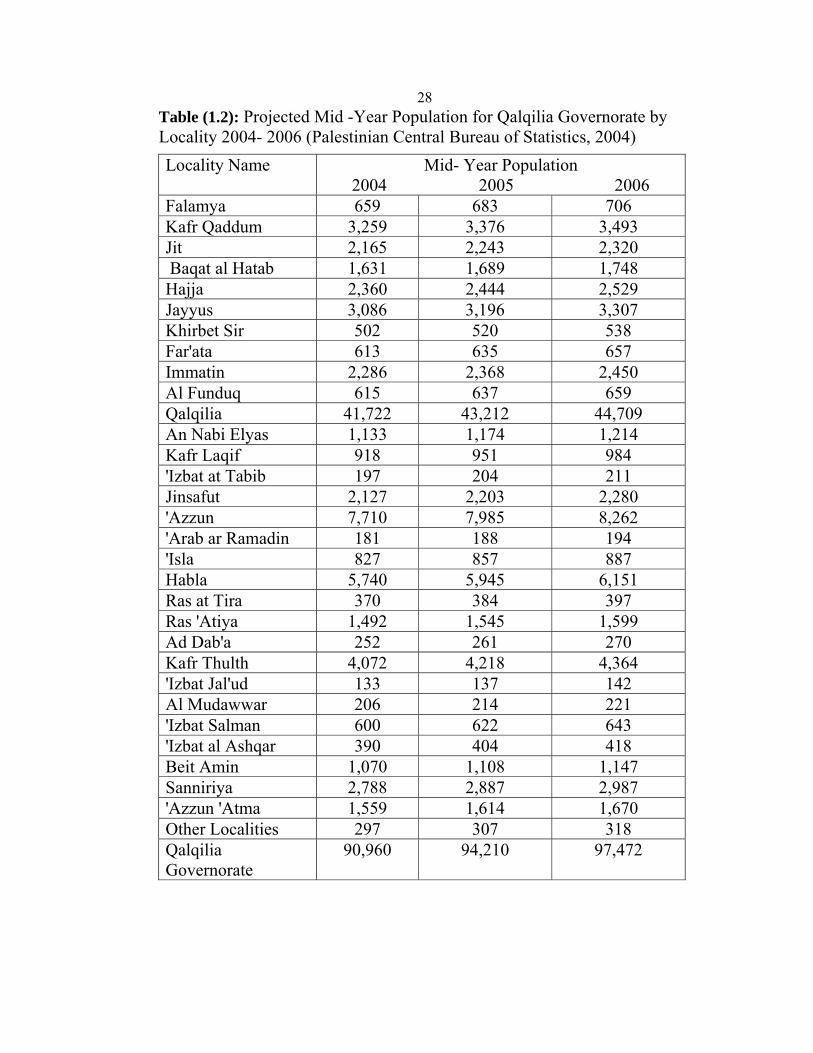
28Table (1.2): Projected Mid -Year Population for Qalqilia Governorate by Locality 2004- 2006 (Palestinian Central Bureau of Statistics, 2004) Locality Name Mid- Year Population
2004 2005 2006 Falamya 659 683 706 Kafr Qaddum 3,259 3,376 3,493 Jit 2,165 2,243 2,320 Baqat al Hatab 1,631 1,689 1,748 Hajja 2,360 2,444 2,529 Jayyus 3,086 3,196 3,307 Khirbet Sir 502 520 538 Far'ata 613 635 657 Immatin 2,286 2,368 2,450 Al Funduq 615 637 659 Qalqilia 41,722 43,212 44,709 An Nabi Elyas 1,133 1,174 1,214 Kafr Laqif 918 951 984 'Izbat at Tabib 197 204 211 Jinsafut 2,127 2,203 2,280 'Azzun 7,710 7,985 8,262 'Arab ar Ramadin 181 188 194 'Isla 827 857 887 Habla 5,740 5,945 6,151 Ras at Tira 370 384 397 Ras 'Atiya 1,492 1,545 1,599 Ad Dab'a 252 261 270 Kafr Thulth 4,072 4,218 4,364 'Izbat Jal'ud 133 137 142 Al Mudawwar 206 214 221 'Izbat Salman 600 622 643 'Izbat al Ashqar 390 404 418 Beit Amin 1,070 1,108 1,147 Sanniriya 2,788 2,887 2,987 'Azzun 'Atma 1,559 1,614 1,670 Other Localities 297 307 318 Qalqilia Governorate
90,960 94,210 97,472
29
1.6.3 Local Economy
Qalqilia district is dependent on the Israeli market. Most of Qalqilia
labor force (skilled and unskilled) works in the construction, agriculture
and other sectors within Israel. Additionally, 20% of Qalqilia population is
engaged in trade and commerce. Jewish and Arab citizens of Israel in the
villages across the border are an important source of income for this sector.
The recurrent Israeli closures of the West Bank, during which the
movement of goods and persons between Israel and the West Bank (and at
times within the West Bank as well) is prohibited, has had a devastating
impact on Qalqilia economy. Workers are prevented from reaching their
jobs and the agricultural produce cannot be marketed. As a consequence,
the local commercial sector was negatively affected as well. On several
occasions the Israeli military has sealed off Qalqilia from outside world for
prolonged periods, preventing any movement into or out of the City
(Qalqilia.org.ps, 2004).
1.7 Objectives of the study
During the last years, the quantities of domestic waste have been increased.
Currently heaps of wastes are common along the streets and along the
alleys. Despite the fact that residents pay a service fee (service charge) and
have continually complained to the city council, the city council has done
very little to provide them with storage bins or to collect the waste
regularly. As a result of this growing problem, this study was initiated to
30
find out what factors were contributing to the improper management of
solid waste. The five specific objectives addressed by this study are:
(1) To determine the quantities of solid waste at Qalqilia district.
(2) To determine the socio –demographic characteristics of the study
population;
(3) To assess knowledge and attitudes regarding management of refuse
(solid waste).
(4) To assess people’s knowledge about factors that contributes to the
improper management of solid waste.
(5) To find out what solutions residents offer to alleviate the problem;
(6) To gather information regarding the management of solid waste or
refuse from the Head of the Cleansing Section of city council.
(7) To introduce, in the context of environmental control and public
health, the subject of management of post-collection municipal solid
waste, the present and projected disposal processes, legislation and
future trends.
(8) To determine those areas of the environment on which MSW
disposal impinges and outline the steps taken to minimize any
adverse effects.
(9) To determine the potential for MSW recycling and the factors which
influence the decisions to do so?

31
Chapter Tow
Methodology

32
Chapter Tow
Methodology
This study was both descriptive and experimental carried out in
Qalqilia district, during 2005 and 2006. The population of the study
consisted of two targeted groups. The first targeted group was all people
residing in the district, and included all residents more than 15 years old in
the randomly selected study estates. A random sample of 5% of the
households of each locality was taken.
The second targeted group consists of the key persons in municipalities and
village councils in Qalqilia District.
Two semi-structured, yet simple, questionnaires were designed, pre-
tested, and modified to collect data. The first one was for households in
order to get the public opinion on the problems of municipal solid waste
management in Qalqilia district. The questionnaire covered socio-
demographic variables as well as variables related to knowledge, attitudes,
and practices on management of solid wastes among people living in the
city or villages of Qalqilia district. The interviews were conducted from
door to door and questions were targeted to either the head of the
household or the spouse. In situations where none of them was present,
either the oldest child or a relative (provided he\she will be above 15 years)
was interviewed as shown in table 2.1.

33Table (2.1): Type of respondent to questionnaire
Type of respondent Frequency Percent Valid Percent
Cumulative Percent
Valid Head of the house 530 77.6 79.5 79.5
Adult sons 112 16.4 16.8 96.3 Others 1 .1 .1 96.4 Children
above 15 years
24 3.5 3.6 100.0
Total 667 97.7 100.0 Missing .00 16 2.3
Total 683 100.0
Table 2.2 shows the distribution of questionnaires between the city
and the villages; total of (683) persons were interviewed from all over the
district.
Table (2.2): Distribution of questionnaires between the city and the villages
Type of locality Frequency Percent Valid Percent
Cumulative Percent
City 328 48.0 48.0 48.0 village 355 52.0 52.0 100.0 Total 683 100.0 100.0
The second questionnaire targeted the key persons in municipalities and
village councils in order to get information about the present situation of
MSW quantities, composition, generation, handling, environmental
impacts, treatment and disposal, in the district. A total of (26) key person
were interviewed, one from each municipality or village. (i.e. total of 26
municipalities and village councils were surveyed).
Analysis of data was performed by the use of Statistical Package for
Social Science (SPSS) computer program. Descriptive statistics such as
34
means and ranges were computed. Appropriate tests of significance were
performed to determine the relationship between socio-demographic
variables and variables related to knowledge, and practice regarding
management of solid waste.
The third part used in data collection was experimental, in which
segregation and separation of solid waste components at different dumping
sites into paper, plastic, glass, metals, organic waste, cardboard,
inert( material with radius less than 1cm and passes through the screen),
and others was conducted. The method used for separation was picking
(hand sorting) using a screen. This is a process of separation by type. A
series of uniform-sized (1x1cm) apertures allows smaller particles to pass
while rejecting the larger fraction. The procedures followed in the
measurement of solid waste samples was as follows (see Fig 2-1):
1. Determination of weight of empty raw waste container (0.5 m3,
1x1x0.5m) using the weighing balance, before separation.
2. Filling of the raw waste container with sample waste while shaking
the bin constantly to avoid undue void spaces;
3. Determination of gross weight of the container and waste using the
weighing balance;
4. Determination of volume of the waste in the container and
calculating the density.

35
5. Emptying the waste in the container on the screen table.
6. Picking the waste on the screen table for sorting operation, the
pickers stand on either side of the screen table and remove the
selected materials and empty them in a plastic bin for each
type,( paper, plastic, glass, metals, organic waste, cardboard, inert,
others) until the sample is over.
7. Determination of the weight of each type and the volume.
8. Determination of the percentage of each type in the sample.
9. Repeating this procedure for 30 samples then analyzing the results.
10. The above procedure was followed for the measurement of samples
of wastes on different sampling days and at different waste sources
during the whole study period as shown in appendix A.
Figure (2.1): Steps of segregation of MSW at Qalqilia dumpsite
36
The equipment used for the measurement of wastes were a weighing
balance of capacity up to 220 kg, and a raw waste container(0.5m3,
1x1x0.5m) with an empty weight of 58 kg and volume of 500 liters for
collecting and weighing the waste. The container was custom made from
steel for this purpose. Other tools include shovels and forks for loading and
sorting the waste; and gloves, gum boots and facemasks for personal
protection. For waste volume measurements at the landfill, ten waste bins,
each with a capacity of 90 liters and empty weight of 2.8 kg were used. A
table covered with screen of 1cm x 1cm holes and 1.5m width, 2m length
used for manual separation of MSW.
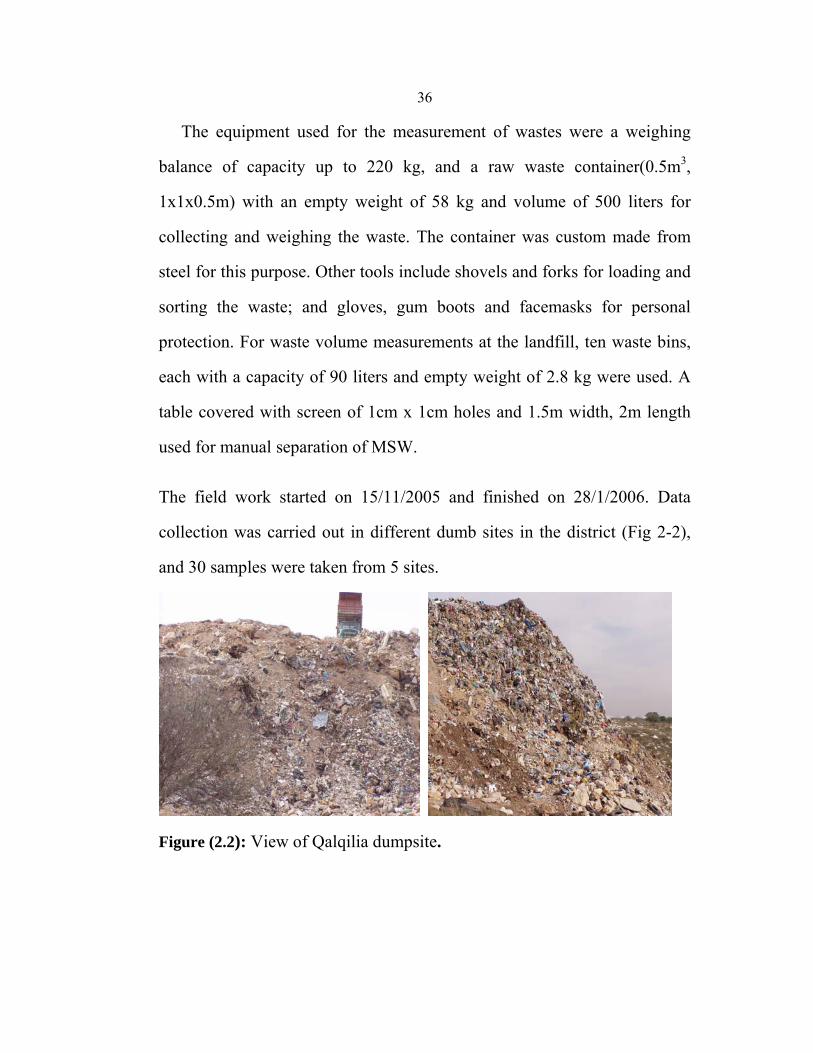
The field work started on 15/11/2005 and finished on 28/1/2006. Data
collection was carried out in different dumb sites in the district (Fig 2-2),
and 30 samples were taken from 5 sites.
Figure (2.2): View of Qalqilia dumpsite.
37
Chapter Three
Results and Discussion

38
Chapter Three
Results and Discussion
3.1 Socio-economic factors
3.1.1 Income
Table 3.1 shows that approximately 88.3% of the respondents were from
low and middle-lower social economic status estates (SES), while 7% and
4.7% were from the upper and high SES respectively.
Table (3.1): Distribution of average family income in new Israel Shekel (NIS)*
Family income Frequency Valid Percent
Cumulative Percent
1000 NIS< 208 31.5 31.5 1000 - 2000 NIS 271 41.1 72.6 From 2000 to 3000 NIS 104 15.8 88.3 3000 - 4000 NIS 46 7.0 95.3
4000 NIS > 31 4.7 100.0 Total 660 100.0
* 1US$= 4.32 NIS
The study showed that average family income is statistically significant at a
chi-square (17.050), with degree of freedom (8), and a p-value (0.03), with
willingness of citizens to separate waste into organic and inorganic wastes.
It also showed that it is statistically significant at a chi-square (15.464),
with degree of freedom (4), and a p-value (0.004), that citizens are willing
to transform organic waste to natural fertilizer if they have been trained

39
3.1.2 Respondents
Exactly 79.5% of respondents were heads or spouses of the households,
while children between 15 and 18 years represented 3.6% and adult sons
above 18 years represented 16.8% as shown in table 3.2.
Table (3.2): Distribution of survey respondents
Type of respondents Frequency Valid Percent Cumulative Percent
Head of the house 530 79.5 79.5 Adult sons over 18 years 112 16.8 96.3 Others 1 .1 96.4 Children between 15 and18 years 24 3.6 100.0
Total 667 100.0
3.1.3 Household occupants
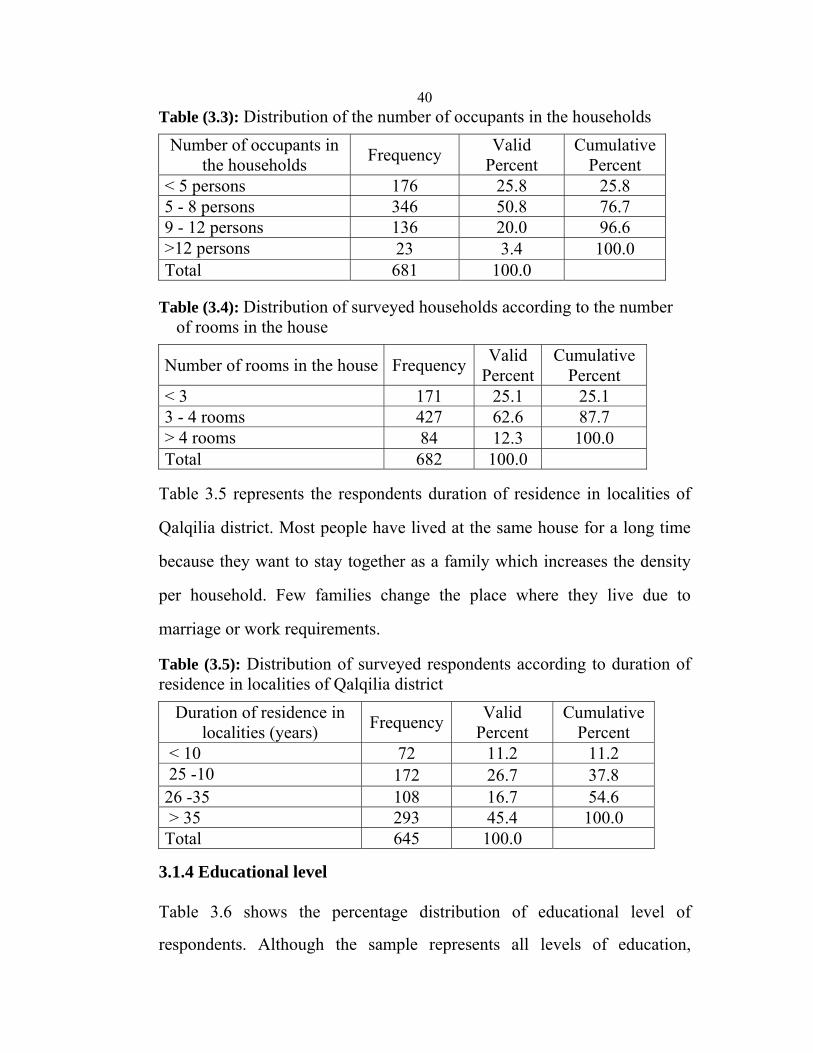
The distribution of occupants in a household is shown in table 3.3, A bout
25.8% of households have less than 5 persons per household, 50.8% have
between 5 to 8 persons, 20% have between 9 to 12 persons and 3.4% of
households have more than 12 persons per household. These numbers
indicate that the majority of families in the district have between 5 to 12
members. (PCBS, 2004) indicates that the average household size in the
West Bank is 6.3 persons. Table 3.4 shows the number of rooms in the
house. 87.7% of families have less than 4 rooms, so because the population
density is high with the low income for most families. This will affect
negatively the behavior and practices of the families towards SWM, which
is in the fact increases littering and careless behavior toward disposal of
solid waste.
40Table (3.3): Distribution of the number of occupants in the households
Number of occupants in the households Frequency Valid
Percent Cumulative
Percent 5 persons < 176 25.8 25.8
5 - 8 persons 346 50.8 76.7 9 - 12 persons 136 20.0 96.6
12 persons> 23 3.4 100.0 Total 681 100.0
Table (3.4): Distribution of surveyed households according to the number
of rooms in the house
Number of rooms in the house Frequency Valid Percent
Cumulative Percent
3 < 171 25.1 25.1 3 - 4 rooms 427 62.6 87.7
4 rooms > 84 12.3 100.0 Total 682 100.0
Table 3.5 represents the respondents duration of residence in localities of
Qalqilia district. Most people have lived at the same house for a long time
because they want to stay together as a family which increases the density
per household. Few families change the place where they live due to
marriage or work requirements.
Table (3.5): Distribution of surveyed respondents according to duration of residence in localities of Qalqilia district
Duration of residence in localities (years) Frequency Valid
Percent Cumulative
Percent 10 < 72 11.2 11.2
10 - 25 172 26.7 37.8 26 -35 108 16.7 54.6
35 > 293 45.4 100.0 Total 645 100.0
3.1.4 Educational level
Table 3.6 shows the percentage distribution of educational level of
respondents. Although the sample represents all levels of education,
41
unfortunately most respondents do not know the exact meaning of the term
''solid waste'' as will be shown next.
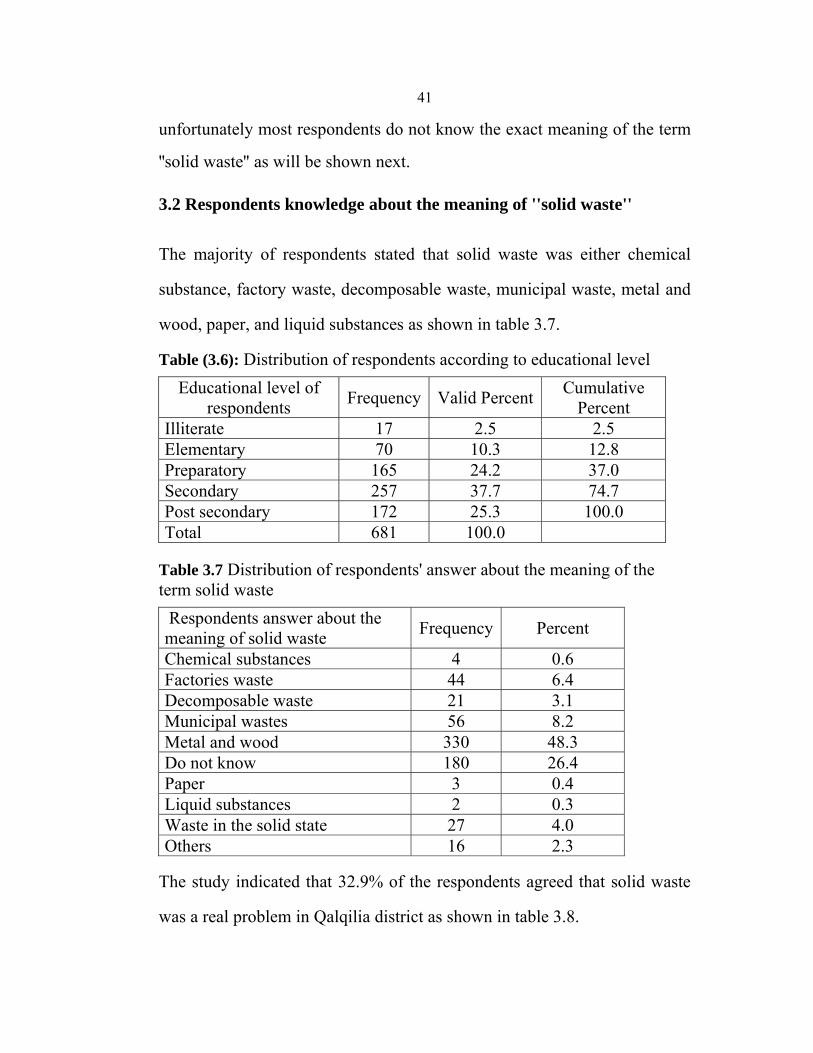
3.2 Respondents knowledge about the meaning of ''solid waste''
The majority of respondents stated that solid waste was either chemical
substance, factory waste, decomposable waste, municipal waste, metal and
wood, paper, and liquid substances as shown in table 3.7.
Table (3.6): Distribution of respondents according to educational level Educational level of
respondents Frequency Valid Percent Cumulative Percent
Illiterate 17 2.5 2.5 Elementary 70 10.3 12.8 Preparatory 165 24.2 37.0 Secondary 257 37.7 74.7 Post secondary 172 25.3 100.0 Total 681 100.0
Table 3.7 Distribution of respondents' answer about the meaning of the term solid waste Respondents answer about the meaning of solid waste Frequency Percent
Chemical substances 4 0.6 Factories waste 44 6.4Decomposable waste 21 3.1 Municipal wastes 56 8.2 Metal and wood 330 48.3Do not know 180 26.4 Paper 3 .40 Liquid substances 2 0.3 Waste in the solid state 27 4.0 Others 16 2.3
The study indicated that 32.9% of the respondents agreed that solid waste
was a real problem in Qalqilia district as shown in table 3.8.
42
The study showed that the educational level is statistically significant at a
chi-square (5.259), with a degree of freedom (1), and a p-value (0.022), in
relation of the meaning of the term solid waste.
Also the study indicates that existing of problems related to solid waste is
statistically significant at a chi-square (11.197), with a degree of freedom
(3), and a p-value (0.011), with the duration of residents. It is also
statistically significant at a chi-square (9.511), with a degree of freedom
(3),
and a p-value (0.023), with number of occupants in the house. It is also
statistically significant at a chi-square (6.107), with a degree of freedom
(2), and a p-value (0.047), with number of rooms in the household.
Table (3.8): Response of surveyed respondents about if there is a solid waste problem in their localities
Is there a solid waste problem in your locality Frequency Valid Percent
Yes 220 32.9 No 449 67.1 Total 669 100.0
3.3 Practices and attitudes
Table 3.9 shows the Percentage distribution of surveyed residents
committed to paying fees for MSW collection services. According to table
3.9, we can see that some of the residents are not committed to paying the
fees dedicated for MSW collection services. This is due to the absence of
executive power or the bad economical situation of residents due to Israeli
occupation and unstable political situation. As a result, the quality of MSW

43
management is not appropriate and the citizens complained about
uncollected garbage along the streets.
Table (3.9): Percentage distributions of surveyed residents committed to paying fees for MSW collection services
Cumulative Percent
Valid Percent
FrequencyResidents committed by paying fees for MSW collection services (%)
11.5 11.5 3 < 50 90ــ50 5 19.2 30.8
100.0 69.2 18 > 90 100.0 26 Total
Table 3.10 indicates that 46.2% of localities can easily find MSW workers
when they need because of the economical situation that results from the
Israeli closure that prevent Palestinian workers to work behind the green
line or in the colonies which oblige some of poor workers to agree working
in MSW collection services. It was difficult for 53.8% of localities to find
MSW workers when they need because of several reasons shown in table
3.11.
Table (3.10): Availability of MSW workers in Qalqilia district
Percent Frequency Can you easily find MSW workers when you need
46.2 12 Yes 53.8 14 No
100.0 26 Total
Table (3.11): Reasons that prevent people to work in MSW management.
Valid Percent
Frequency Reasons that prevent people for working in MSW management
50.0 5 Shamed of the career 10.0 1 Scared of diseases 40.0 4 Social status and low salary
100.0 10 Total
44
Table 3.12 indicates that 42.3% of solid waste collection workers wear
special uniform provided to them during the collection process. That
uniform is important for the safety of workers which includes a hat, special
shoes, gloves and a plastic coat. 57.7% of collection workers do not wear
that uniform because the localities do not provide that uniform to its
workers due to financial problems or because they do not care about the
safety of collection workers or do not know the hazards of MSW. It was
found that none of the localities provide training to its solid waste
collection workers to do their work, and they obtain their experience from
practice and error which expose their life to danger (see figure 3.1). A
study was made by Milhem about the investigation of occupational health
and safety hazards among domestic waste collectors in Bethlehem and
Hebron districts showed that 44.7% of surveyed waste collectors have
suffered from sore throat, cough, and high temperature. It also shows that
27.9% have suffered from diarrhea or bloody stool, 25% have suffered
from shortness of breath, and 20.2% have suffered from skin diseases
(Milhem, 2003).
Table (3.12): MSW collection workers use of special uniform, during collection process.
Percent Frequency Do the workers wear special uniform during collection process
42.3 11 Yes 57.7 15 No
100.0 26 Total
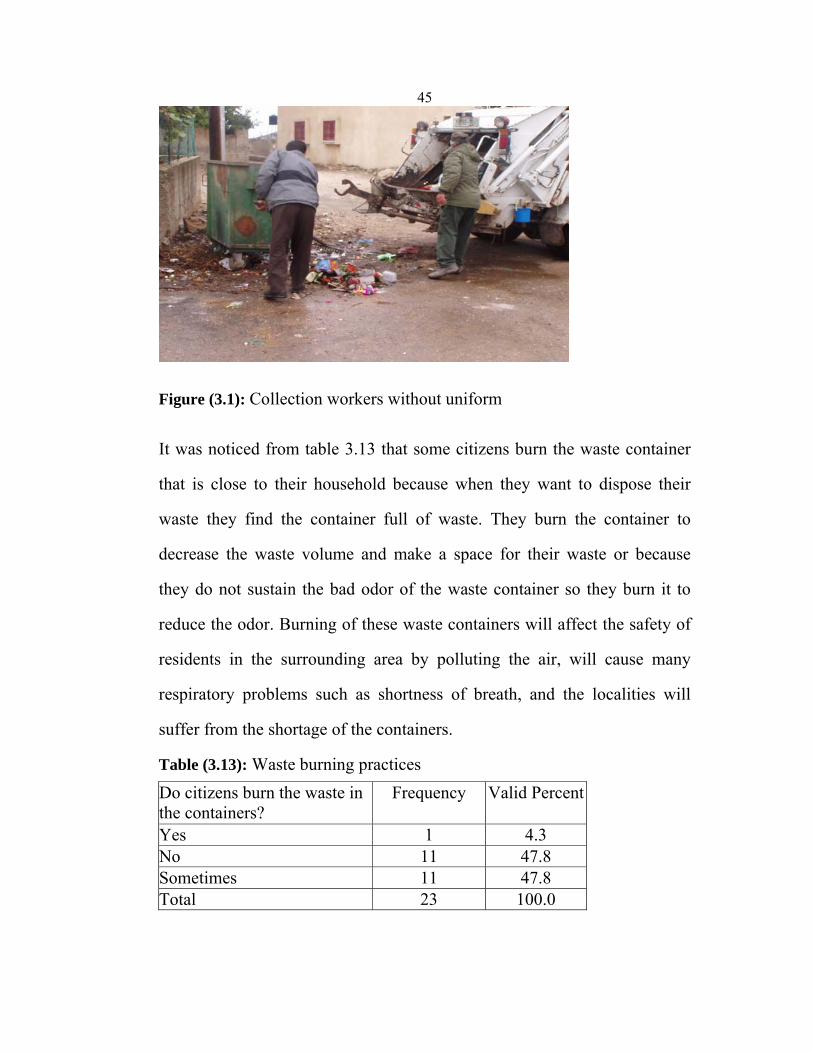
45
Figure (3.1): Collection workers without uniform
It was noticed from table 3.13 that some citizens burn the waste container
that is close to their household because when they want to dispose their
waste they find the container full of waste. They burn the container to
decrease the waste volume and make a space for their waste or because
they do not sustain the bad odor of the waste container so they burn it to
reduce the odor. Burning of these waste containers will affect the safety of
residents in the surrounding area by polluting the air, will cause many
respiratory problems such as shortness of breath, and the localities will
suffer from the shortage of the containers.
Table (3.13): Waste burning practices Valid Percent Frequency Do citizens burn the waste in
the containers? 4.3 1 Yes 47.8 11 No 47.8 11 Sometimes
100.0 23 Total

46
It is common to see waste scattered around containers especially full ones.
Table 3.14 shows that 36.4% of the key persons in the surveyed localities
said that they always find scattered waste around the waste container. This
is due to low collection frequency, long distance between the waste
containers due to the insufficiency of waste containers. 13.6% mentioned
that they do not find waste around the waste container because they empty
the containers every day or they have sufficient number of waste containers
spread all over the locality to tolerate collection frequency. 50% said that
they some times find waste around the waste container when they delay the
collection time or because of disposal practices of some citizens that leaves
the waste sacks near the waste container or due to wind that blows and
scatters the waste from the container that do not contain a cover as shown
in figure 3.2.
Figure (3.2): Scattered waste around waste container
47Table (3.14): Resident practices when disposing waste
Valid PercentFrequency Do you find scattered waste around container?
36.4 8 Yes 13.63No 50.0 11 Sometimes
100.0 22 Total
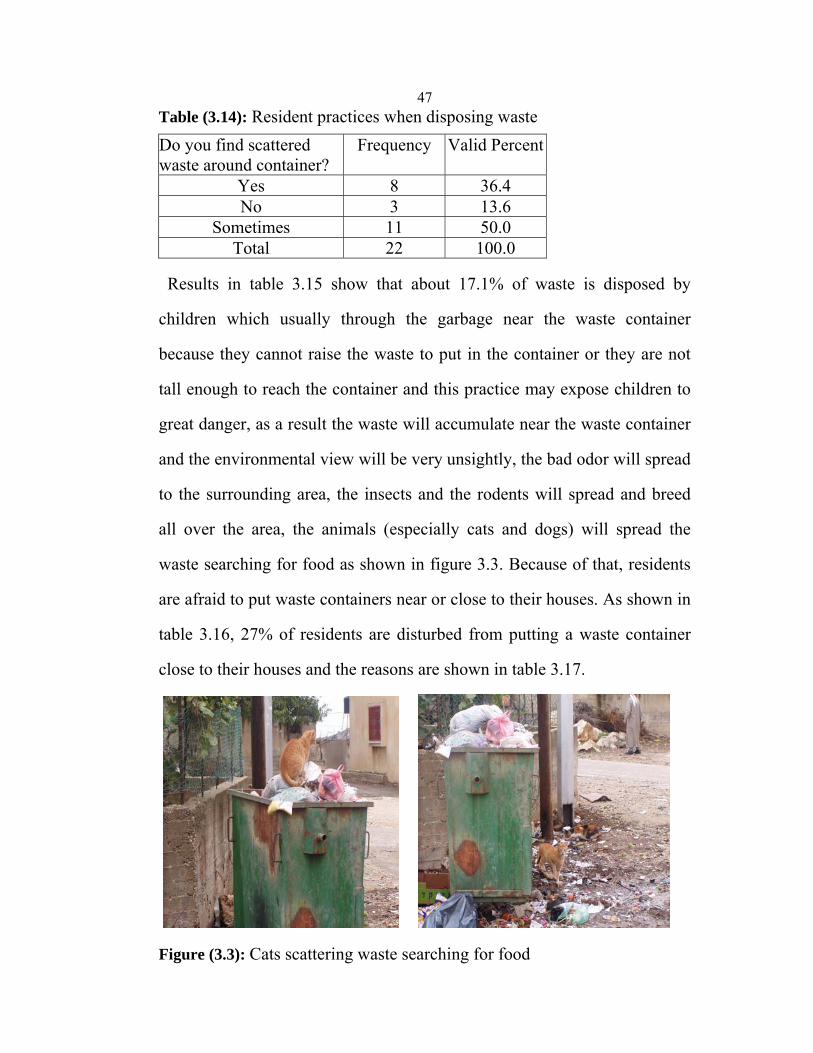
Results in table 3.15 show that about 17.1% of waste is disposed by
children which usually through the garbage near the waste container
because they cannot raise the waste to put in the container or they are not
tall enough to reach the container and this practice may expose children to
great danger, as a result the waste will accumulate near the waste container
and the environmental view will be very unsightly, the bad odor will spread
to the surrounding area, the insects and the rodents will spread and breed
all over the area, the animals (especially cats and dogs) will spread the
waste searching for food as shown in figure 3.3. Because of that, residents
are afraid to put waste containers near or close to their houses. As shown in
table 3.16, 27% of residents are disturbed from putting a waste container
close to their houses and the reasons are shown in table 3.17.
Figure (3.3): Cats scattering waste searching for food
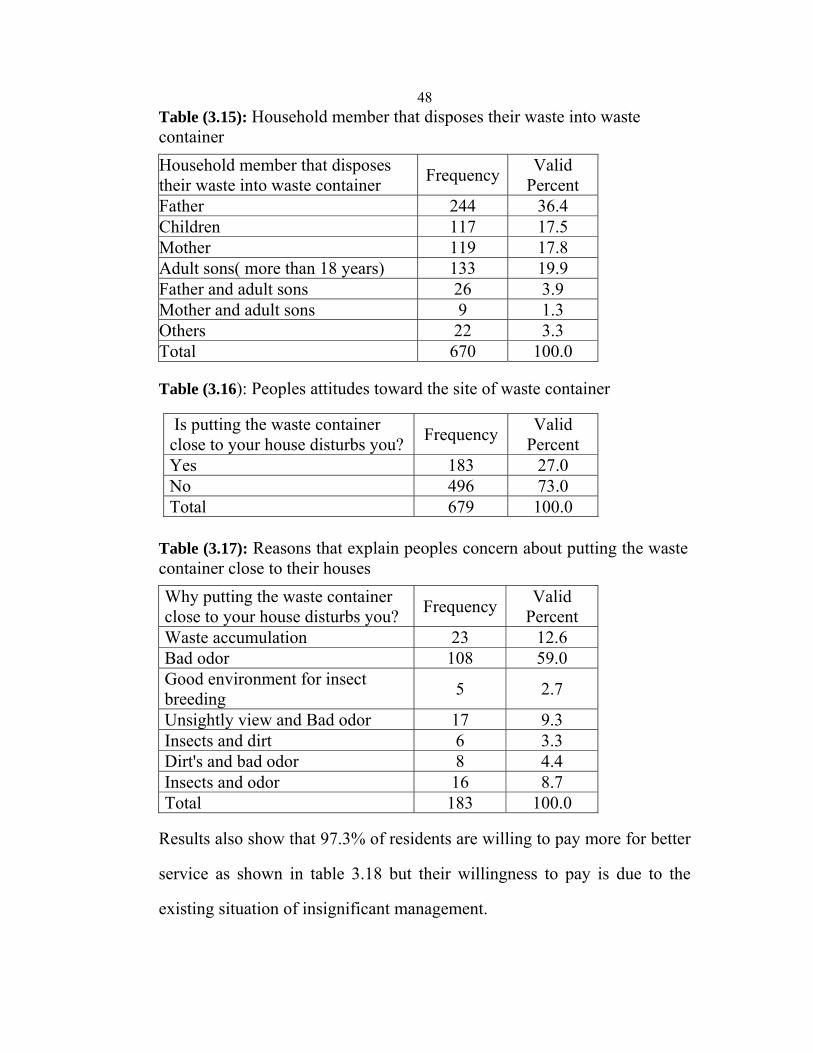
48Table (3.15): Household member that disposes their waste into waste container
Valid Percent FrequencyHousehold member that disposes
their waste into waste container 36.4 244 Father 17.5 117 Children 17.8 119 Mother 19.9 133 Adult sons( more than 18 years) 3.926Father and adult sons 1.3 9 Mother and adult sons 3.3 22 Others
100.0 670 Total
Table (3.16): Peoples attitudes toward the site of waste container
Is putting the waste container close to your house disturbs you? Frequency Valid
Percent Yes 183 27.0 No 496 73.0 Total 679 100.0
Table (3.17): Reasons that explain peoples concern about putting the waste container close to their houses Why putting the waste container close to your house disturbs you? Frequency Valid
Percent Waste accumulation 23 12.6 Bad odor 108 59.0 Good environment for insect breeding 5 2.7
Unsightly view and Bad odor 17 9.3 Insects and dirt 6 3.3 Dirt's and bad odor 8 4.4 Insects and odor 16 8.7 Total 183 100.0
Results also show that 97.3% of residents are willing to pay more for better
service as shown in table 3.18 but their willingness to pay is due to the
existing situation of insignificant management.
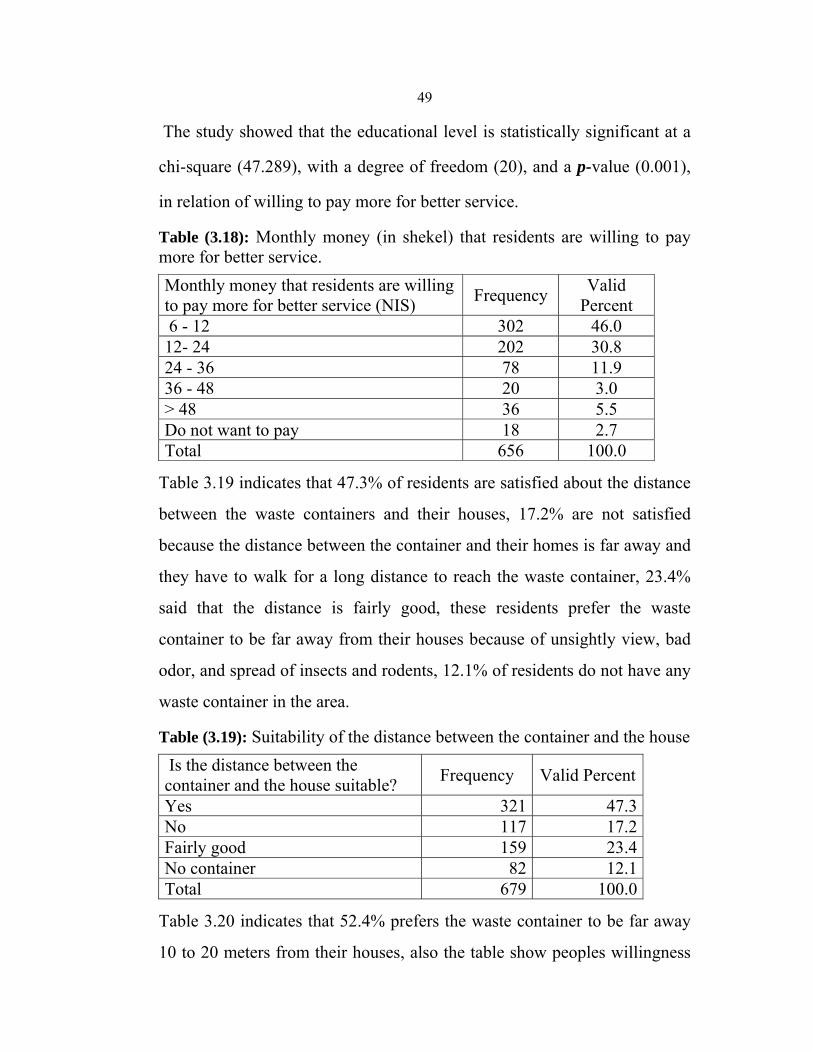
49
The study showed that the educational level is statistically significant at a
chi-square (47.289), with a degree of freedom (20), and a p-value (0.001),
in relation of willing to pay more for better service.
Table (3.18): Monthly money (in shekel) that residents are willing to pay more for better service. Monthly money that residents are willing to pay more for better service (NIS) Frequency Valid
Percent 6 - 12 302 46.0 12- 24 202 30.8 24 - 36 78 11.9 36 - 48 20 3.0
> 48 36 5.5 Do not want to pay 18 2.7 Total 656 100.0
Table 3.19 indicates that 47.3% of residents are satisfied about the distance
between the waste containers and their houses, 17.2% are not satisfied
because the distance between the container and their homes is far away and
they have to walk for a long distance to reach the waste container, 23.4%
said that the distance is fairly good, these residents prefer the waste
container to be far away from their houses because of unsightly view, bad
odor, and spread of insects and rodents, 12.1% of residents do not have any
waste container in the area.
Table (3.19): Suitability of the distance between the container and the house Is the distance between the container and the house suitable? Frequency Valid Percent
Yes 321 47.3 No 117 17.2 Fairly good 159 23.4 No container 82 12.1 Total 679 100.0
Table 3.20 indicates that 52.4% prefers the waste container to be far away
10 to 20 meters from their houses, also the table show peoples willingness
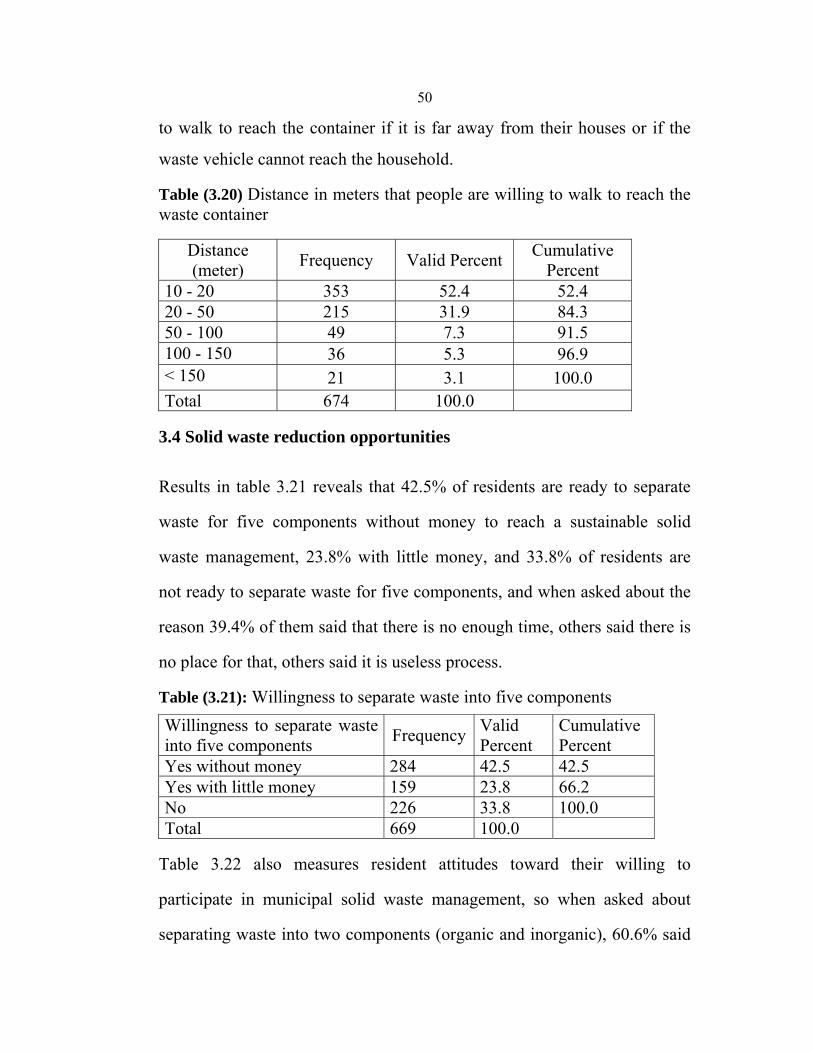
50
to walk to reach the container if it is far away from their houses or if the
waste vehicle cannot reach the household.
Table (3.20) Distance in meters that people are willing to walk to reach the waste container
Distance (meter) Frequency Valid Percent Cumulative
Percent 10 - 20 353 52.4 52.4 20 - 50 215 31.9 84.3 50 - 100 49 7.3 91.5 100 - 150 36 5.3 96.9 < 150 21 3.1 100.0 Total 674 100.0
3.4 Solid waste reduction opportunities
Results in table 3.21 reveals that 42.5% of residents are ready to separate
waste for five components without money to reach a sustainable solid
waste management, 23.8% with little money, and 33.8% of residents are
not ready to separate waste for five components, and when asked about the
reason 39.4% of them said that there is no enough time, others said there is
no place for that, others said it is useless process.
Table (3.21): Willingness to separate waste into five components Willingness to separate waste into five components Frequency Valid
Percent Cumulative Percent
Yes without money 284 42.5 42.5 Yes with little money 159 23.8 66.2 No 226 33.8 100.0 Total 669 100.0
Table 3.22 also measures resident attitudes toward their willing to
participate in municipal solid waste management, so when asked about
separating waste into two components (organic and inorganic), 60.6% said

51
yes without money, 18.6% said yes with little money and 20.8% refuses to
participate and said no, and when asked about the reason, some of them did
not know the meaning of organic and inorganic, others afraid of waste and
said this is dangerous process.
It is statistically significant at a chi-square (21.448), with a degree of
freedom (8), and a p-value (0.006) that higher education citizens are willing
to separate waste into five components. So education factor plays a positive
parameter.
Table (3.22): Willingness to separate MSW into organic and inorganic Willingness to separate waste into 2 components Frequency Valid
Percent Cumulative Percent
Yes without money 410 60.6 60.6 Yes with little money 126 18.6 79.2 No 141 20.8 100.0 Total 677 100.0
Results in table 3.23 shows that 56.5% of residents get rid of their food
waste with other waste, 1.5% as organic fertilizer but without any treatment
and just mix it with soil, 30.7% of residents use the food residues as animal
food, this practice is familiar in villages. Local authorities should explore
the possibility of the potentially high willingness of people towards home
composting as revealed in this study. If implemented properly, home
composting would be a sustainable solution for small local authorities with
waste generation less than 2 tons/day.
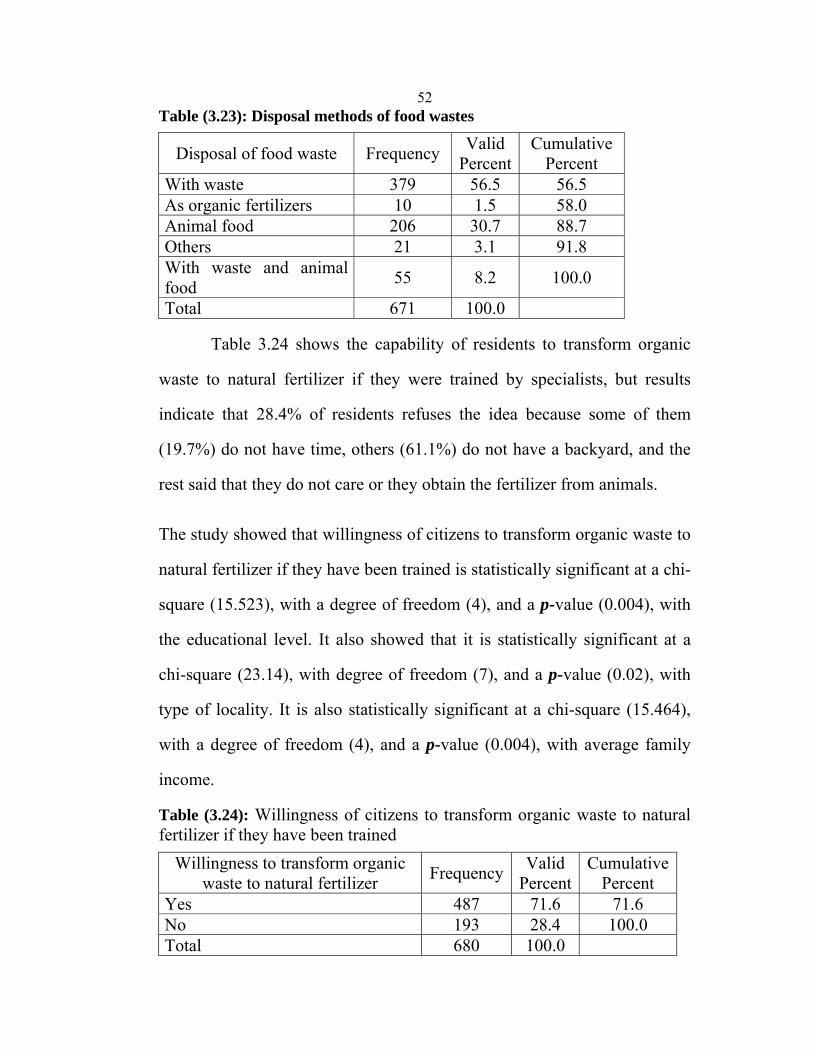
52Table (3.23): Disposal methods of food wastes
Disposal of food waste Frequency Valid Percent
Cumulative Percent
With waste 379 56.5 56.5 As organic fertilizers 10 1.5 58.0 Animal food 206 30.7 88.7 Others 21 3.1 91.8 With waste and animal food 55 8.2 100.0
Total 671 100.0
Table 3.24 shows the capability of residents to transform organic
waste to natural fertilizer if they were trained by specialists, but results
indicate that 28.4% of residents refuses the idea because some of them
(19.7%) do not have time, others (61.1%) do not have a backyard, and the
rest said that they do not care or they obtain the fertilizer from animals.
The study showed that willingness of citizens to transform organic waste to
natural fertilizer if they have been trained is statistically significant at a chi-
square (15.523), with a degree of freedom (4), and a p-value (0.004), with
the educational level. It also showed that it is statistically significant at a
chi-square (23.14), with degree of freedom (7), and a p-value (0.02), with
type of locality. It is also statistically significant at a chi-square (15.464),
with a degree of freedom (4), and a p-value (0.004), with average family
income.
Table (3.24): Willingness of citizens to transform organic waste to natural fertilizer if they have been trained
Willingness to transform organic waste to natural fertilizer Frequency Valid
Percent Cumulative
Percent Yes 487 71.6 71.6 No 193 28.4 100.0 Total 680 100.0
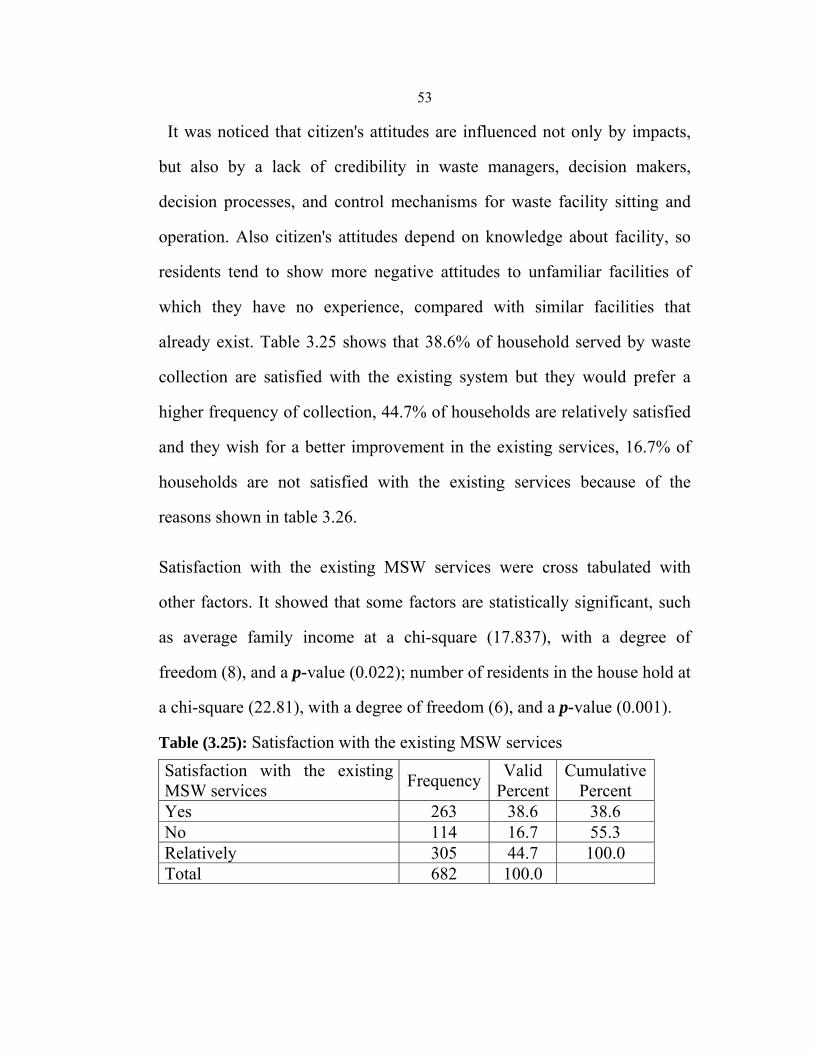
53
It was noticed that citizen's attitudes are influenced not only by impacts,
but also by a lack of credibility in waste managers, decision makers,
decision processes, and control mechanisms for waste facility sitting and
operation. Also citizen's attitudes depend on knowledge about facility, so
residents tend to show more negative attitudes to unfamiliar facilities of
which they have no experience, compared with similar facilities that
already exist. Table 3.25 shows that 38.6% of household served by waste
collection are satisfied with the existing system but they would prefer a
higher frequency of collection, 44.7% of households are relatively satisfied
and they wish for a better improvement in the existing services, 16.7% of
households are not satisfied with the existing services because of the
reasons shown in table 3.26.
Satisfaction with the existing MSW services were cross tabulated with
other factors. It showed that some factors are statistically significant, such
as average family income at a chi-square (17.837), with a degree of
freedom (8), and a p-value (0.022); number of residents in the house hold at
a chi-square (22.81), with a degree of freedom (6), and a p-value (0.001).
Table (3.25): Satisfaction with the existing MSW services Satisfaction with the existing MSW services Frequency Valid
PercentCumulative
Percent Yes 263 38.6 38.6 No 114 16.7 55.3 Relatively 305 44.7 100.0 Total 682 100.0
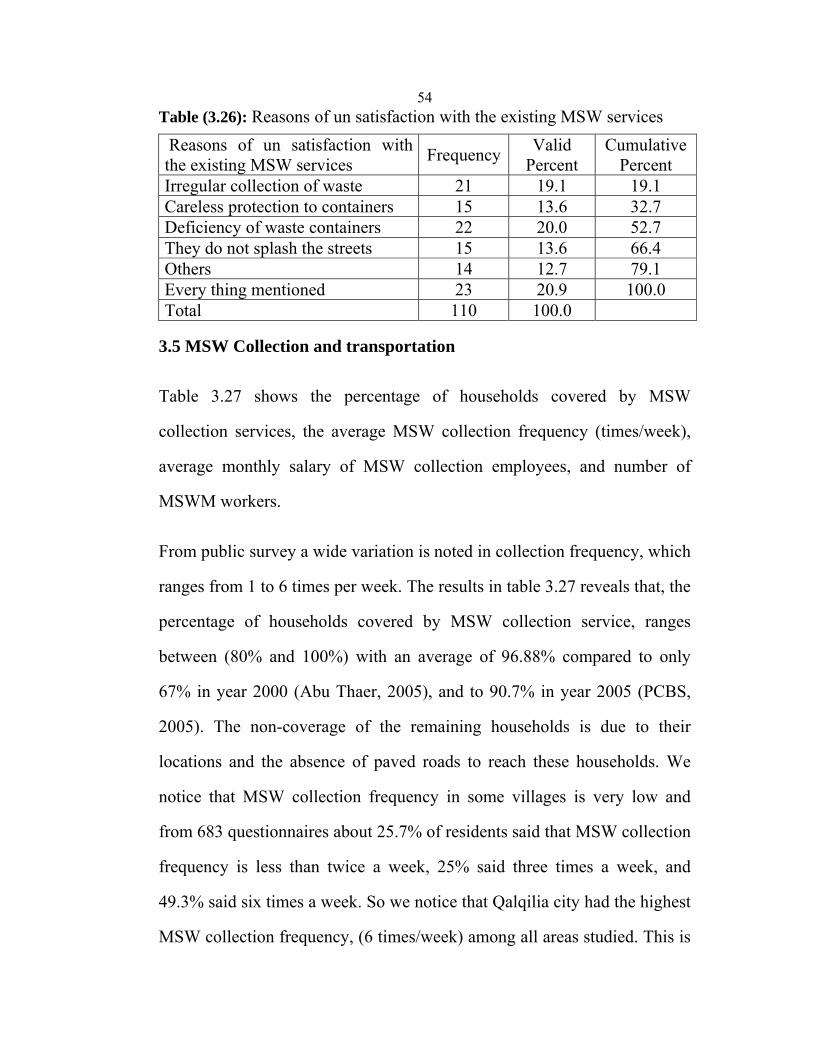
54Table (3.26): Reasons of un satisfaction with the existing MSW services Reasons of un satisfaction with the existing MSW services Frequency Valid
Percent Cumulative
Percent Irregular collection of waste 21 19.1 19.1 Careless protection to containers 15 13.6 32.7Deficiency of waste containers 22 20.0 52.7 They do not splash the streets 15 13.6 66.4 Others 14 12.7 79.1 Every thing mentioned 23 20.9 100.0 Total 110 100.0
3.5 MSW Collection and transportation
Table 3.27 shows the percentage of households covered by MSW
collection services, the average MSW collection frequency (times/week),
average monthly salary of MSW collection employees, and number of
MSWM workers.
From public survey a wide variation is noted in collection frequency, which
ranges from 1 to 6 times per week. The results in table 3.27 reveals that, the
percentage of households covered by MSW collection service, ranges
between (80% and 100%) with an average of 96.88% compared to only
67% in year 2000 (Abu Thaer, 2005), and to 90.7% in year 2005 (PCBS,
2005). The non-coverage of the remaining households is due to their
locations and the absence of paved roads to reach these households. We
notice that MSW collection frequency in some villages is very low and
from 683 questionnaires about 25.7% of residents said that MSW collection
frequency is less than twice a week, 25% said three times a week, and
49.3% said six times a week. So we notice that Qalqilia city had the highest
MSW collection frequency, (6 times/week) among all areas studied. This is
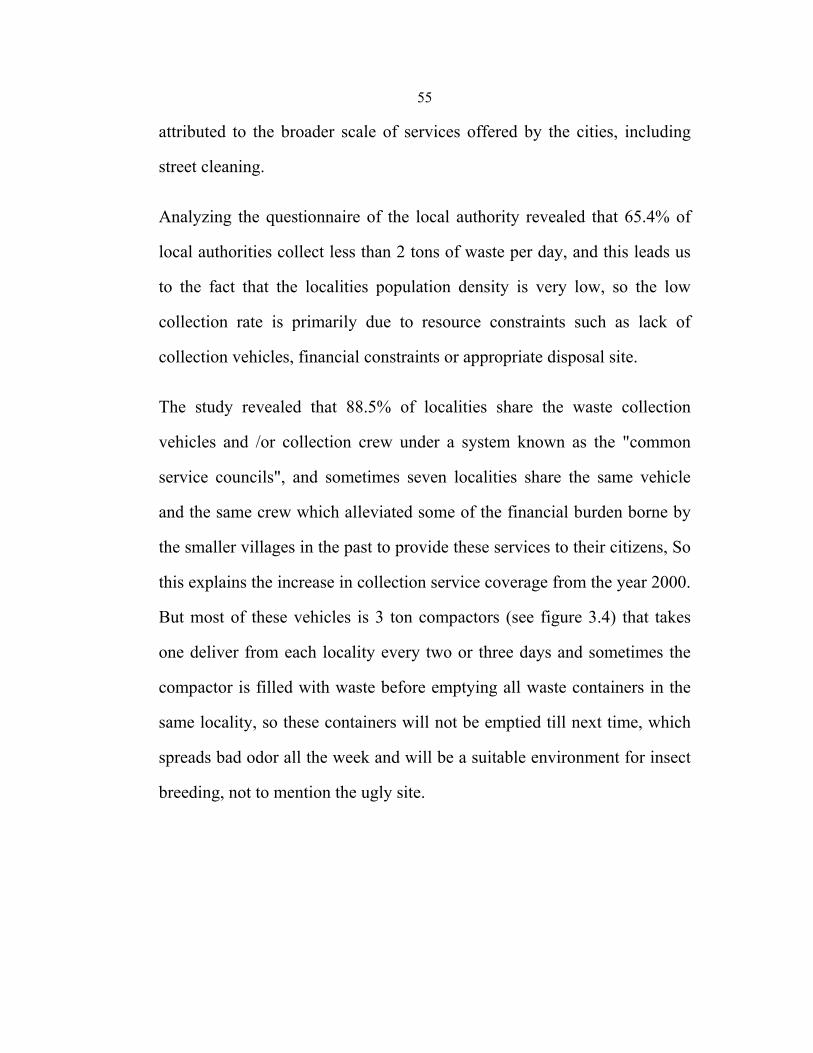
55
attributed to the broader scale of services offered by the cities, including
street cleaning.
Analyzing the questionnaire of the local authority revealed that 65.4% of
local authorities collect less than 2 tons of waste per day, and this leads us
to the fact that the localities population density is very low, so the low
collection rate is primarily due to resource constraints such as lack of
collection vehicles, financial constraints or appropriate disposal site.
The study revealed that 88.5% of localities share the waste collection
vehicles and /or collection crew under a system known as the "common
service councils", and sometimes seven localities share the same vehicle
and the same crew which alleviated some of the financial burden borne by
the smaller villages in the past to provide these services to their citizens, So
this explains the increase in collection service coverage from the year 2000.
But most of these vehicles is 3 ton compactors (see figure 3.4) that takes
one deliver from each locality every two or three days and sometimes the
compactor is filled with waste before emptying all waste containers in the
same locality, so these containers will not be emptied till next time, which
spreads bad odor all the week and will be a suitable environment for insect
breeding, not to mention the ugly site.

56
Figure (3.4): Three tons solid waste compactor
It can be noticed from table 3.28 that the average salary of solid waste
collection worker ranges between 1000 to 1750 NIS per month, and this
salary is low, so many persons refuses to work in such a job due to its low
salary and because most Palestinians consider this job a low status job.
Discussion with local authority's staff responsible of MSWM revealed
difficulties in finding workers who accept to work in waste collection, so
we can find many employees with special needs working in solid waste
collection.

57Table (3.27): MSW collection in surveyed residential areas
Number of MSW management workers
Average salary of MSW collection workers NIS/month
Average MSW collection frequency times/week
Average percentage of households covered by MSW collection services (%)
Locality Name
No
80 1350 6 95 Qalqilia 1 2/3 1750 3 98 Kafr
Qaddum 2
3/6 1200 2 100 Jit 3 3/6 1200 2 99 Baqat al
Hatab 4
3/6 12002100Hajja 5 3/4 1000 3 90 Jayyus 6 3/4 10002100Khirbet Sir 7 3/6 1200195Far'ata 8 3/6 1200295Immatin 9 2/3 1750290Al Funduq 10 2/7 1700 2 100 'Azzun
'Atma 11
3/4 1000 3 100 An Nabi Elyas
12
3/6 1200 2 95 Kafr Laqif
13
2/7 1700 1 90 'Izbat at Tabib
14
2/3 1750280Jinsafut 15 7 11503100'Azzun 16 3/3 1500 2 100 Sanniriya 17 3/4 10001100'Isla 18 3 1200395Habla 19 3/3 15002100Beit Amin 20 2/7 17002100Ras 'Atiya 21 2/7 17001100Ad Dab'a 22 3/3 15003100Kafr Thulth 23 2/7 1700198'Izbat Jal'ud 24 2/7 1700 2 100 'Izbat al
Ashqar 25
2/7 1700 2 99 'Izbat Salman
26
103 1336 2.2 96.88 Average

58
3.6 MSW Generation Rates
Table 3.28 shows the average per capita MSW generation rates for 26
localities in Qalqilia district studied. For each locality, waste amount and
population number were shown, from which we calculate the per capita
generation rates.
It is observed in table 3.28 that MSW generation rate in the city of Qalqilia
is higher than the villages in the district. This is attributed to the higher
living standards, economical activities in the city, population density, and
average MSW collection frequency compared to the villages. Also, in the
villages, a fraction of the organic waste is fed to farm animals and is,
therefore, diverted from the MSW collection stream. It is also observed that
the MSW generation rate for the villages that occurs on the main road (Al
Funduq and An Nabi Elyas) is higher than villages far away from the main
road. This is due to the economical and commercial activities that the
Israelis made when they pass through the road seeking lower prices, so the
commercial activities resulted in higher income for residents as well as
larger amounts of MSW. The MSW generation rate per capita for the 26
localities ranges between (0.76 kg. person-1day-1 and 1.79 kg. person-1day-
1). The overall average MSW generation rate per capita for the 26 localities
is 1.46 kg. person-1day-1. The per capita solid waste generation rates in
seven Palestinian cities were estimated as Ramallah and Bireh (1.56 kg.
person-1.day-1), Nablus (1.38 kg. person-1day-1), Tulkarem (0.90 kg. person-
1day-1), Qalqilia and Salfit (2.00 kg. person-1day-1), Tubas and Jenin (1.71

59
kg. person-1day-1) (`Al-Khatib et. al., 2006).The best estimate of total MSW
generation in Qalqilia district is around 142.31 ton/day. These results are in
agreement with global trends for developing countries, (Idris et. al. 2004;
Pokhrel and Viraraghavan 2005).
Table (3.28): MSW generation rates in surveyed residential areas
MSW generation rate (kg. person-1.day-1)
Daily collected MSW (ton)
Population (2006) Locality Name No
1.79 80 44,709 Qalqilia 1 0.85 3 3,493 Kafr Qaddum 2 1.07 2.5 2,320 Jit 3
1.14 2 1,748 Baqat al Hatab 4 1.18 3 2,529 Hajja 5 1.20 4 3,307 Jayyus 6 0.92 0.5 538 Khirbet Sir 7 0.76 0.5 657 Far'ata 8 0.82 2 2,450 Immatin 9 1.51 1 659 Al Funduq 10 1.19 2 1,670 'Azzun 'Atma 11 1.65 2 1,214 An Nabi Elyas 12 1.52 1.5 984 Kafr Laqif 13 0.95 0.2 211 'Izbat at Tabib 14 0.88 2 2,280 Jinsafut 15 1.45 12 8,262 'Azzun 16 1.01 3 2,987 Sanniriya 17 1.12 1 887 'Isla 18 1.22 7.5 6,151 Habla 19 1.30 1.5 1,147 Beit Amin 20 1.25 21,599Ras 'Atiya 21 1.11 0.3 270 Ad Dab'a 22 0.91 4 4,364 Kafr Thulth 23 1.40 0.2 142 'Izbat Jal'ud 24 1.19 0.5 418 'Izbat al Ashqar 25 1.55 1 643 'Izbat Salman 26 1.46 139.7 95,639 Total
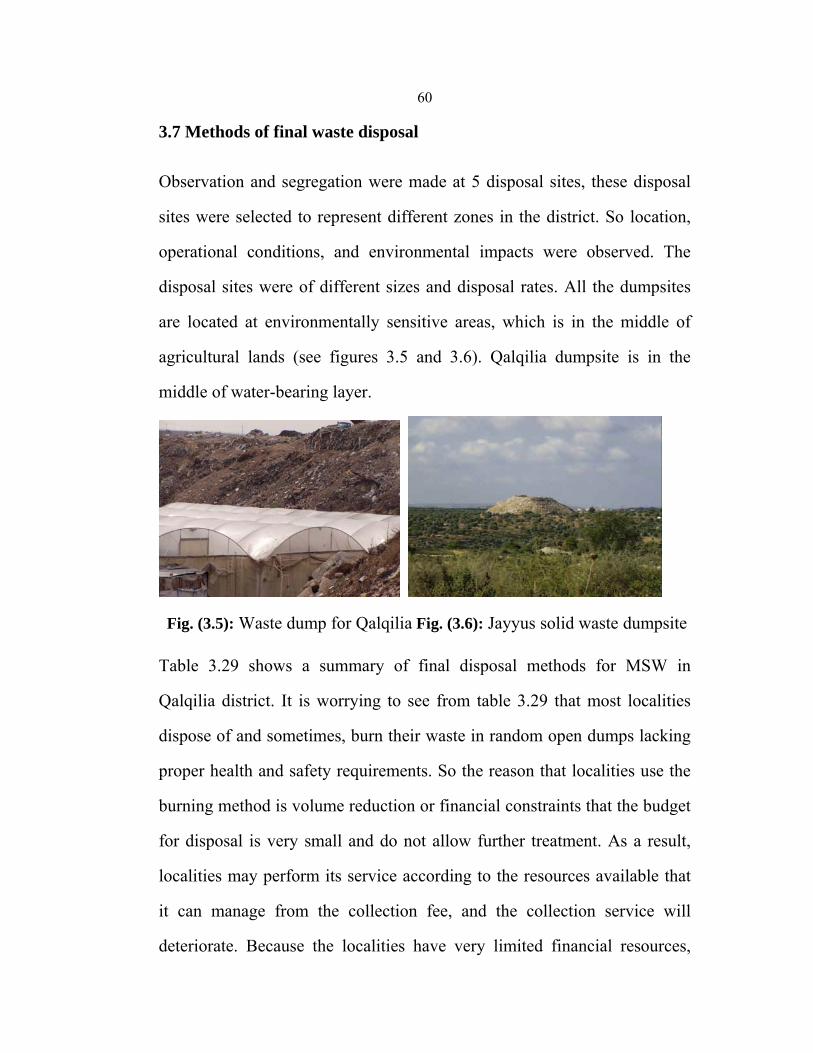
60
3.7 Methods of final waste disposal
Observation and segregation were made at 5 disposal sites, these disposal
sites were selected to represent different zones in the district. So location,
operational conditions, and environmental impacts were observed. The
disposal sites were of different sizes and disposal rates. All the dumpsites
are located at environmentally sensitive areas, which is in the middle of
agricultural lands (see figures 3.5 and 3.6). Qalqilia dumpsite is in the
middle of water-bearing layer.
Fig. (3.5): Waste dump for Qalqilia Fig. (3.6): Jayyus solid waste dumpsite
Table 3.29 shows a summary of final disposal methods for MSW in
Qalqilia district. It is worrying to see from table 3.29 that most localities
dispose of and sometimes, burn their waste in random open dumps lacking
proper health and safety requirements. So the reason that localities use the
burning method is volume reduction or financial constraints that the budget
for disposal is very small and do not allow further treatment. As a result,
localities may perform its service according to the resources available that
it can manage from the collection fee, and the collection service will
deteriorate. Because the localities have very limited financial resources,
61
uncontrolled dumping may be the only option available at the moment
because it is the cheapest type of land disposal. However, it should be
noted that such a practice puts the public and the environment at risk from
underground and surface water contamination, toxic smoke and waste
blown by the wind, vectors, etc. Such a practice should not continue
because it is not environmentally acceptable, and it makes the useful life of
a disposal site even shorter. The economic reason for taking care that
disposal sites have the longest possible life is that, once these sites are
filled new ones usually can be found only at a greater distance and this
increases transportation cost considerably, which accounts for the major
share of overall cost. Still, an effective strategy to make the disposal sites
have the longest possible life should focus not only on technical operation
at the site, but also on waste diversion that will include source reduction,
recycling, and waste transformation through composting. However,
burning of waste releases toxic gases such as dioxins, that pollutes the air
and contaminates the ground water (World Health Organization (WHO),
2000).
Moreover, during our visit to the dumpsites we notice that the dumpsites is
not protected from the entrance of people and animals, and this is a serious
problem, because animals eats polluted waste from the dumpsite, and
children searching the waste for metal, but we know that 46% of localities
dispose their medical waste with MSW without treatment, which puts the
animals and children under the risk of being infected with many diseases.
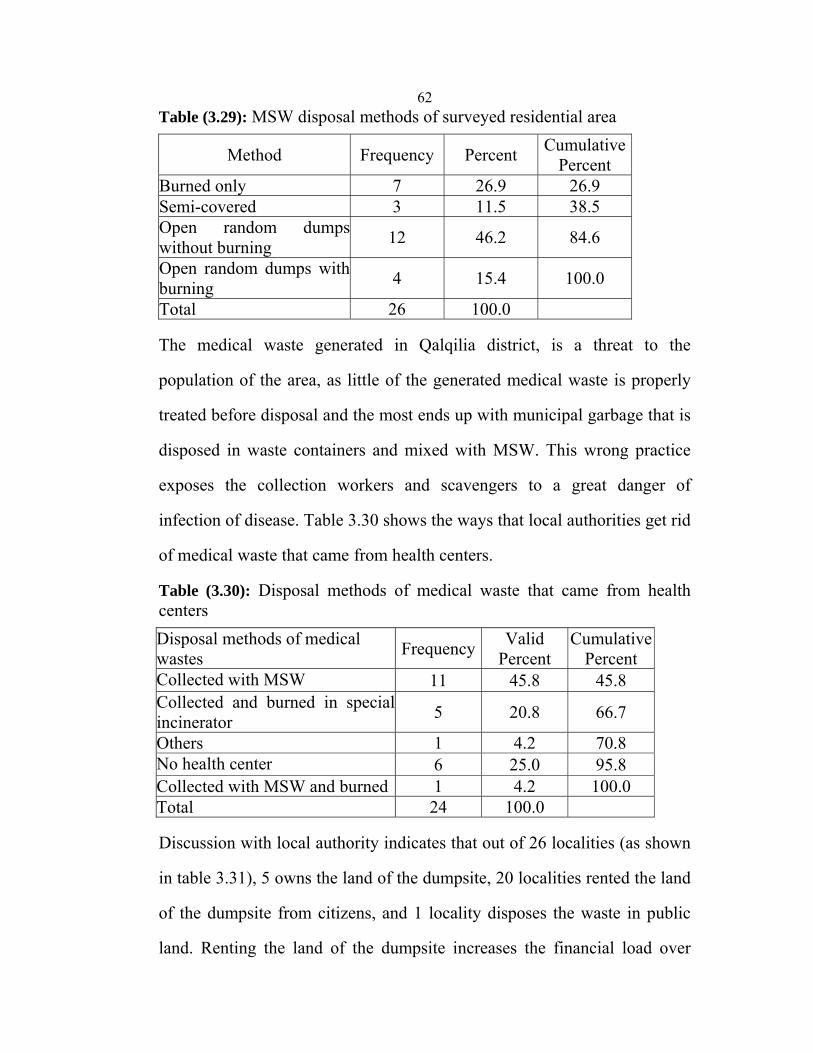
62Table (3.29): MSW disposal methods of surveyed residential area
Cumulative Percent Percent Frequency Method
26.9 26.9 7 Burned only 38.5 11.53Semi-covered
84.6 46.2 12 Open random dumpswithout burning
100.0 15.4 4 Open random dumps withburning
100.0 26 Total
The medical waste generated in Qalqilia district, is a threat to the
population of the area, as little of the generated medical waste is properly
treated before disposal and the most ends up with municipal garbage that is
disposed in waste containers and mixed with MSW. This wrong practice
exposes the collection workers and scavengers to a great danger of
infection of disease. Table 3.30 shows the ways that local authorities get rid
of medical waste that came from health centers.
Table (3.30): Disposal methods of medical waste that came from health centers
Cumulative Percent
Valid Percent FrequencyDisposal methods of medical
wastes 45.8 45.8 11 Collected with MSW
66.7 20.8 5 Collected and burned in specialincinerator
70.8 4.2 1 Others 95.8 25.0 6 No health center
100.0 4.21Collected with MSW and burned 100.0 24 Total
Discussion with local authority indicates that out of 26 localities (as shown
in table 3.31), 5 owns the land of the dumpsite, 20 localities rented the land
of the dumpsite from citizens, and 1 locality disposes the waste in public
land. Renting the land of the dumpsite increases the financial load over
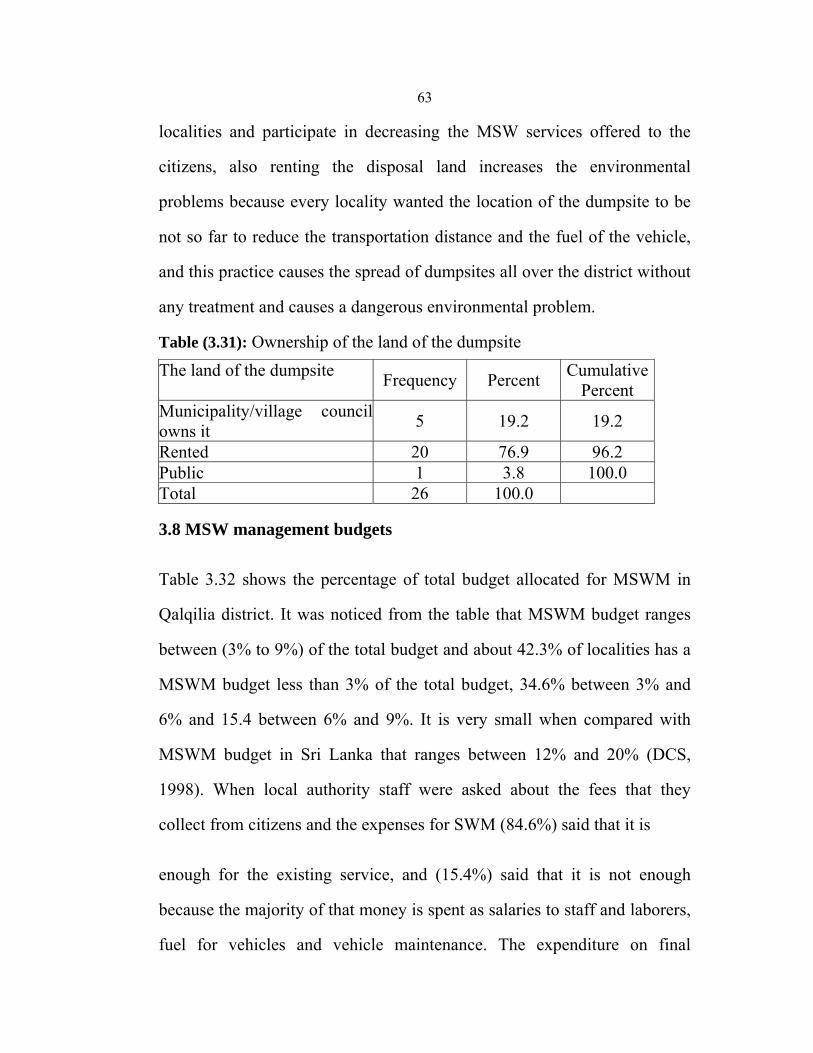
63
localities and participate in decreasing the MSW services offered to the
citizens, also renting the disposal land increases the environmental
problems because every locality wanted the location of the dumpsite to be
not so far to reduce the transportation distance and the fuel of the vehicle,
and this practice causes the spread of dumpsites all over the district without
any treatment and causes a dangerous environmental problem.
Table (3.31): Ownership of the land of the dumpsite Cumulative
Percent Percent Frequency The land of the dumpsite
19.2 19.2 5 Municipality/village councilowns it
96.2 76.9 20 Rented 100.0 3.8 1 Public
100.0 26 Total
3.8 MSW management budgets
Table 3.32 shows the percentage of total budget allocated for MSWM in
Qalqilia district. It was noticed from the table that MSWM budget ranges
between (3% to 9%) of the total budget and about 42.3% of localities has a
MSWM budget less than 3% of the total budget, 34.6% between 3% and
6% and 15.4 between 6% and 9%. It is very small when compared with
MSWM budget in Sri Lanka that ranges between 12% and 20% (DCS,
1998). When local authority staff were asked about the fees that they
collect from citizens and the expenses for SWM (84.6%) said that it is
enough for the existing service, and (15.4%) said that it is not enough
because the majority of that money is spent as salaries to staff and laborers,
fuel for vehicles and vehicle maintenance. The expenditure on final

64
disposal is low. This small MSWM budget causes bad SWM service to
citizens, less collection frequency, no street litter collectors and absence of
a suitable method for final waste disposal.
Because the localities have very limited financial resources, uncontrolled
dumping may be the only option available at the moment because it is the
cheapest type of disposal.
Table (3.32): Percentage of total budget allocated for MSW management Cumulative
Percent Percent Frequency MSW budget/Total budget
42.3 42.311Less than 3% 76.9 34.6 9 Between 3% and 6% 92.3 15.4 4 Between 6% and 9%
100.0 7.7 2 More than 9% 100.0 26 Total
The cost of waste management is covered by a direct fee on households
that is collected monthly with electricity bell (92.3% of localities), or
yearly with a special bell (7.7% of localities). The survey also exposed the
fact that 97.3% of households with waste collection service are willing to
pay for better service.
3.9 MSW collection workers and collection equipment
From table 3.27 the number of MSW workers in Qalqilia district is 103
divided between the city of Qalqilia and the rest of localities, 80 employee
for the city with 1 worker for every 559 citizen, and 23 for the rest of
villages and municipalities with 1 worker for every 2214 citizen. This is
due to the employment of street litter collectors by the city of Qalqilia, (35

65
collectors), to keep the city clean because the city of Qalqilia is the center
of the district that contains the vital establishments, whereas villages hire 2
to 3 workers, (the driver and one or two assistants), for household waste
collection only and these workers and the vehicle are divided between 3 to
7 villages. Village councils do not hire street litter collectors because of
financial problems, but the citizens habits of cleaning their streets reduces
the littering problem. Table 3.33 shows the Number of street litter
collectors in localities of Qalqilia district.
Table (3.33): Number of street litter collectors in localities of Qalqilia district
Cumulative Percent Valid PercentFrequency No of street litter
collectors 70.0 70.0 14 .00 75.0 5.0 1 1.00 90.0 15.0 3 2.00 95.0 5.014.00
100.0 5.0 1 35.00 100.0 20 Total
Table 3.34 shows the average number of MSW collection vehicles per
thousand citizens in the city and the villages of Qalqilia district. From the
table it is observed that the vehicle serves less people in the city than in the
villages, due to the higher collection frequency in the city, better life style,
high living standards and economical activities in the city. Moreover it was
noticed that in the city the municipality use larger collection vehicles
capable of serving more people than the smaller vehicles used by the
villages and this technique helps in better service and according to World
Health Organization (1988), in average the number of vehicles used for
collection of waste is one large collection vehicle for every 15000 person.
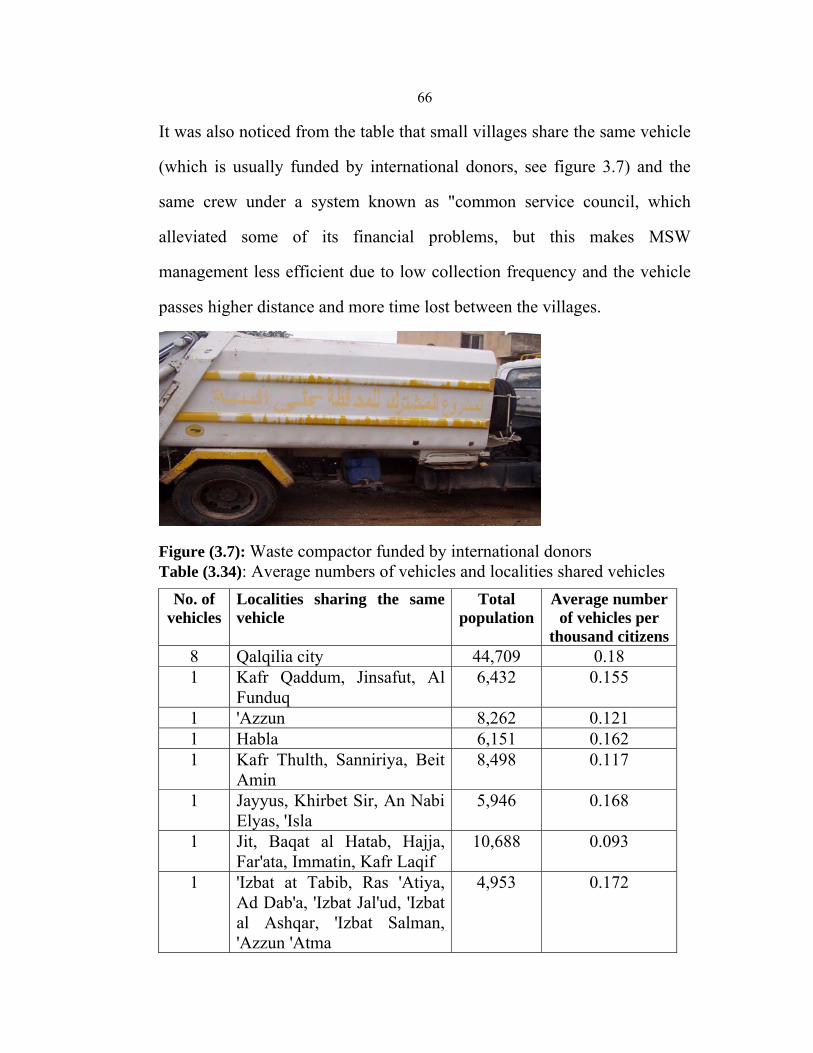
66
It was also noticed from the table that small villages share the same vehicle
(which is usually funded by international donors, see figure 3.7) and the
same crew under a system known as "common service council, which
alleviated some of its financial problems, but this makes MSW
management less efficient due to low collection frequency and the vehicle
passes higher distance and more time lost between the villages.
Figure (3.7): Waste compactor funded by international donors Table (3.34): Average numbers of vehicles and localities shared vehicles
No. of vehicles
Localities sharing the same vehicle
Total population
Average number of vehicles per
thousand citizens8 Qalqilia city 44,709 0.18 1 Kafr Qaddum, Jinsafut, Al
Funduq 6,432 0.155
1 'Azzun 8,262 0.121 1 Habla 6,151 0.162 1 Kafr Thulth, Sanniriya, Beit
Amin 8,498 0.117
1 Jayyus, Khirbet Sir, An Nabi Elyas, 'Isla
5,946 0.168
1 Jit, Baqat al Hatab, Hajja, Far'ata, Immatin, Kafr Laqif
10,688 0.093
1 'Izbat at Tabib, Ras 'Atiya, Ad Dab'a, 'Izbat Jal'ud, 'Izbat al Ashqar, 'Izbat Salman, 'Azzun 'Atma
4,953 0.172
67
From table 3.35 it was noticed that 11.9% of the roads are not paved and
this phenomenon is spread in the villages which make it difficult for the
waste vehicle to enter these roads and increase the maintenance fees and
pollutes the air and the surrounding houses with dust, but some of these
roads with a small width and prevent the vehicles to enter, so residents
must carry their waste out of these roads to the nearest container to the
household.
The study showed that the road condition is statistically significant at a chi-
square (14.86), with a degree of freedom (3), and a p-value (0.002), in
relation with the duration of residents. It is also statistically significant at a
chi-square (91.198), with a degree of freedom (3), and a p-value (0.001), in
relation to the type of localities (city or village).
Table (3.35): Road condition that reach the household
Road condition Frequency Valid Percent Cumulative Percent
Paved 598 88.1 88.1 Not paved 81 11.9 100.0 Total 679 100.0
From table 3.36 we can notice that 13.4% of households do not have
a container even far away from the household because some localities do
not use containers and collect the waste from door to door, and the citizen
puts the waste sacks out of the house without knowledge about the
collection time which may be more than once a week. This practice may be
the reason of wide spread of insects, rodents, wild animals and may cause
disease. We also notice from the table that some households are far away
68
(more than 150 meter) from the closest waste container which make it
difficult for the citizen to reach the waste to the container and cause
littering in that area.
Table (3.36): Distance of the closest container to the household
Distance from the house (meter) Frequency Valid Percent Cumulative
Percent 10 -20 278 40.8 40.8 21-50 153 22.5 63.3
51 -100 80 11.7 75.0 101 -150 40 5.9 80.9
<150 39 5.7 86.6 No container 91 13.4 100.0
Total 681 100.0
Transportation of MSW includes carrying wastes from transfer stations
for disposal to processing units, most containers in the district, especially in
the villages are hauled container system that hauled to a disposal facility
where these are emptied and returned back (see figure 3.8), this system is
ideal for the locations where waste generation rate is high, as large
containers are employed, but localities cannot sustain the financial load of
increasing the containers, moreover, most of these containers are from
donors and came to service recently, because of this table 3.37 indicates
that 67.2% of residents said that the mechanical situation is good, 18.1%
said they are not good because citizens steel there wheels or crush them to
avoid putting them near their houses.
It is statistically significant at a chi-square (9.841), with a degree of
freedom (4), and a p-value (0.043) that the mechanical situation of the

69
container is affected by increasing the number of rooms in the house. It
also affected at a chi-square (13.279), with a degree of freedom (6), and a
p-value (0.039) with the duration of resident in the house. Also it is
affected by the type of locality at a chi-square (44.358), with a degree of
freedom (2), and a p-value (0.000).
Figure (3.8): Hauled container system that hauled to a disposal facility
Table (3.37): Mechanical situation of the container Mechanical situation
of the container Frequency Valid Percent
Cumulative Percent
Good 456 67.2 67.2 Not good 123 18.1 85.3
No container 100 14.7 100.0 Total 679 100.0
A variety of waste management problems in the area under study were
identified. More specifically, our study brought to light that some of the
wastes are left outside the bins on the street because the number of bins is
insufficient. When residents were asked if they found waste near the waste
container table 3.38 indicates that 31.4% said that they found waste near

70
the container, because the collection frequency is once or twice a week, and
often they found the waste container full of waste as shown in table 3.39,
moreover the waste container without a cover which allow the waste to fly
away out of the waste container (see figure 3.9), 32.6% said that they do
not found waste near the waste container especially in the city of Qalqilia
because the collection frequency is six times a week and they have
employees for scattered waste, 35.9% said sometimes they found waste
near the waste container if the collection time delay from the usual time
and the containers were full of waste.
The study showed that Probability of finding the container full of waste is
statistically significant at a chi-square (6.434), with a degree of freedom
(2), and a p-value (0.04), with the type of locality. It also showed that it is
statistically significant at a chi-square (19.721), with degree of freedom (8),
and a p-value (0.011), with average family income. It is also statistically
significant at a chi-square (11.717), with degree of freedom (4), and a p-
value (0.02), with number of rooms in the house. . It is also statistically
significant at a chi-square (28.771), with degree of freedom (8), and a p-
value (0.00), with the educational level of respondent.
Finding waste near the container was cross tabulated with other factors. It
showed that some factors are statistically significant, such as age of
respondents at a chi-square (16.92), with a degree of freedom (6), and a p-
value (0.01); average family income at a chi-square (18.847), with a degree
of freedom (8), and a p-value (0.016); number of rooms in the house at a
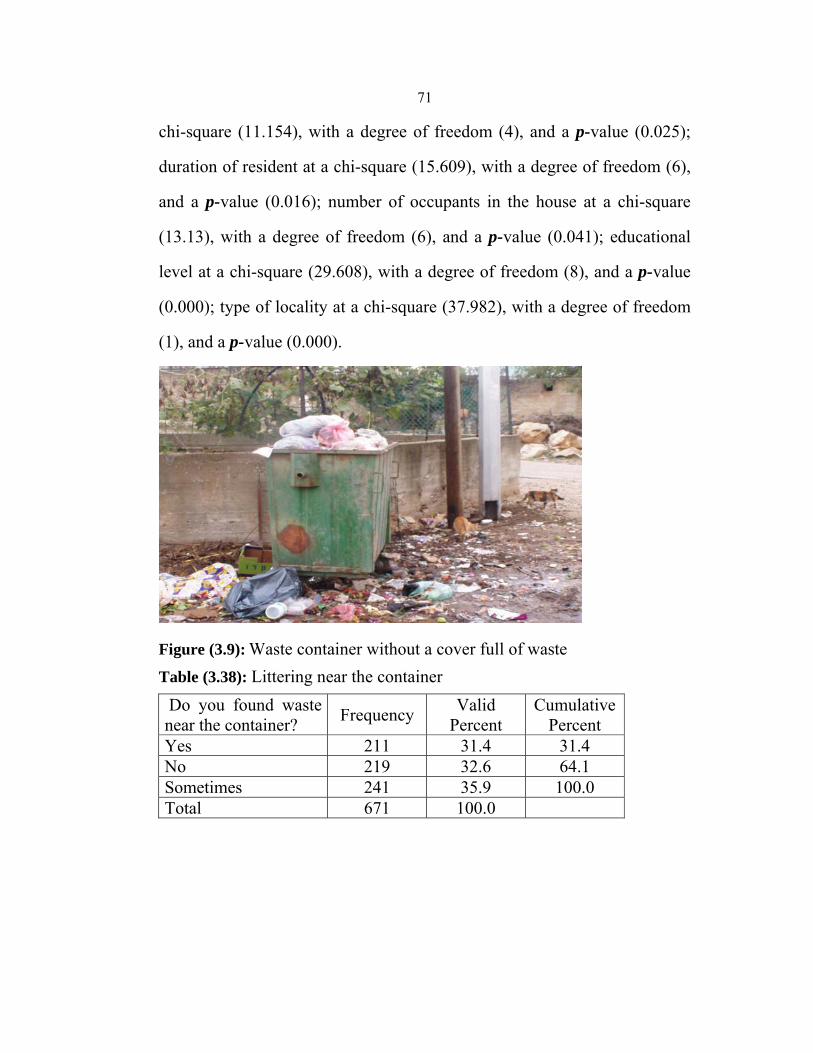
71
chi-square (11.154), with a degree of freedom (4), and a p-value (0.025);
duration of resident at a chi-square (15.609), with a degree of freedom (6),
and a p-value (0.016); number of occupants in the house at a chi-square
(13.13), with a degree of freedom (6), and a p-value (0.041); educational
level at a chi-square (29.608), with a degree of freedom (8), and a p-value
(0.000); type of locality at a chi-square (37.982), with a degree of freedom
(1), and a p-value (0.000).
Figure (3.9): Waste container without a cover full of waste Table (3.38): Littering near the container Do you found waste near the container? Frequency Valid
Percent Cumulative
Percent Yes 211 31.4 31.4 No 219 32.6 64.1 Sometimes 241 35.9 100.0 Total 671 100.0
72Table (3.39): Probability of finding the container full of waste Do you found the container full of waste? Frequency Valid
Percent Cumulative
Percent Yes 201 29.8 29.8 No 206 30.5 60.3 Sometimes 268 39.7 100.0 Total 675 100.0
The cost of removing waste which has been scattered in the street is much
higher than the cost of collecting similar waste which has been placed in
containers, so most municipalities or village councils do not employ
workers to scavenge the streets because the budget is not sufficient for the
existing situation, but as we see from table 3.40 that 57.4% of residents
said that the municipality scavenge the streets, the majority of these
residents are from Qalqilia city which employ about 35 worker for the
scavenge process and represent about 50% of residents, 41.9% of residents
do not have this service because of the financial problems.
It is statistically significant at a chi-square (322.511), with a degree of
freedom (2), and a p-value (0.006) that scavenges the streets depends on
locality type.
Table (3.40): Percentage distribution of streets that don't receive scavenge Do municipality scavenges your street? Frequency Valid
Percent Cumulative Percent
Yes 381 57.4 57.4 No 278 41.9 99.2 Sometimes 5 .8 100.0 Total 664 100.0
From table 3.41, 10.1% of residents said that the municipality splash
containers with insecticides and this process happens just in summer to
73
avoid the spread or the breeding of insects, 44.7% said that municipality do
not splash containers with insecticides because of financial constrains,
45.3% said that the sometimes the municipality splash containers with
insecticides if the environmental authority deliver insecticides to
municipalities without price.
Table (3.41): Percentage distribution of containers that don't receive splash with insecticides Does the municipality splash containers with insecticides? Frequency Valid
PercentCumulative Percent
Yes 68 10.1 10.1 No 302 44.7 54.7 Sometimes 306 45.3 100.0 Total 676 100.0
Table 3.42 shows the resident respondents about the hygienic situation of
the containers near their houses, 65% said fairly good, this high percentage
from localities with high collection frequency, especially the city or from
citizens unaware of hygienic situation, 21.9% said not fairly good because
of the low collection frequency and the spread of insects, rodents and odor
from the waste container.
Hygienic situation of the nearest container were cross tabulated with other
factors. It showed that some factors are statistically significant, such as
educational level of respondents at a chi-square (22.431), with a degree of
freedom (8), and a p-value (0.004); average family income at a chi-square
(20.054), with a degree of freedom (8), and a p-value (0.01); number of
rooms in the house at a chi-square (14.192), with a degree of freedom (4),
and a p-value (0.007).
74
Table (3.42): Hygienic situation of the nearest container
Hygienic situation of the nearest container Frequency Valid
PercentCumulative
Percent Fairly good 440 65.0 65.0 Not fairly good 148 21.9 86.9 No container 89 13.1 100.0 Total 677 100.0
3.10 Other findings and lessons from the study.
Some unpleasant experiences were encountered in addition to the odor.
Some householders were not co-operative during the execution of the
project. Negative attitudes were observed, especially regarding separation
of the wastes. Worse still, some households discharged water into the waste
storage bags. This made the final sorting exercise difficult. Some
households used the waste storage bags for storing other household items
instead of the intended waste. Such a situation clearly shows that,
continuous sensitization on needs and benefits of solid waste management
and general health education should be an integral part of solid waste
management efforts. Another problem arose from the lack of appropriate
places to store the waste storage bags in the households before collection.
As such, the waste storage bags were vandalized by domestic animals,
especially dogs and cats, which tore them in the process of looking for
food, hence spreading the waste around household premises. Therefore,
scavenging by animals requires attention for the success of the solid waste
management endeavor. Furthermore, the poor road condition along the
collection route necessitated undue delays, and may have influenced the
75
hiring cost for the waste collection vehicle. Demonstrating satisfaction with
the service rendered, majority of the respondents expressed willingness to
pay for the solid waste management service. Different respondents were
willing to pay different amounts so as to benefit from solid waste
management service.
For composting to make an impact on solid waste management in Qalqilia
district, a larger area of operation needs to be incorporated. Such a measure
will also improve economies of scale. Many people may not be aware of
composting, so for composting to take off successfully training of
composting plant operators and individual practitioners will need to be
done. General sensitization will also be needed for changing people’s waste
handling practices and perceptions as well as soliciting their cooperation. In
addition to demonstration projects, production of guidelines in form of
booklets and fliers that can be availed to the target group can greatly
enhance the training and sensitization objective.
This study has revealed that one of the most promising strategies for
improving solid waste management in Qalqilia district is waste
minimization coupled with maximization of resource recovery. The study
has reported on composting as an important potential resource recovery
technique.

76
3.11 MSW composition
The composition of MSW is the term that describes the distribution of
each component of wastes by its percent weight of the total. The
information is required for the selection of suitable treatment and disposal
methods.
Analysis for SW composition was carried out as outlined in the
methodology in order to know the constituents as well as the overall
composition of SW from different sources and dumpsites.
The composition of MSW has been studied extensively. The precise
composition depends upon the locality and standard of living. Important
constituents of MSW generated in 5 dumpsites of Qalqilia district are
organic wastes, plastic, paper, metal, glass, cardboard, inert, and others.
Composition of wastes also differs from dumpsite to dumpsite. People
in a particular locality often have similar background in terms of incomes,
tastes, and expenditure. Composition of wastes from commercial areas
depends upon the nature of activities. Around offices and institutions
usually paper and packaging are the major components while close to
vegetable and fruits markets, food wastes are predominant.
Results of waste composition analysis from 5 dumpsites in Qalqilia district
are presented in figure 3.10.

77
MSW in Qalqilia district has a high content of organic matter (54%),
because the nature of the district is agricultural, moderate content of plastic
and cardboard (14%,8%), and low content of metal and glass (3%, 3%).
The typical MSW composition by weight in Qalqilia district as shown in
Fig.3.10 is comparable with typical developing country values (Rushbrook
and Pugh, 1999). Also it is comparable to waste composition in Sri Lanka
(DCS, 1998).
It can be observed from figure 3.10 that there is a great potential of
recovery of organic waste if the waste is sorted at the source. The waste is
suitable for feeding animals (as it is done now to some extent), and it can
also be used as feed material in composting and biogas production.
Recovery of organic waste and recycling of waste paper can potentially
reduce the solid waste quantity. This presents a corresponding potential
saving in landfill space as well as in collection and transportation costs.
Also Fig. 3.11. shows the average MSW composition by volume in
Qalqilia district. From the figure we can observe that plastic represents
35% of the total volume, organics 28%, paper 8%, cardboard 14%, metal
3% and glass 3%. It can be observed that there is a great potential of
recovery of organic wastes by using it in composting and biogas
production. Recycling of waste paper, cardboard and metals can potentially
reduce solid waste quantity saving in landfill space.
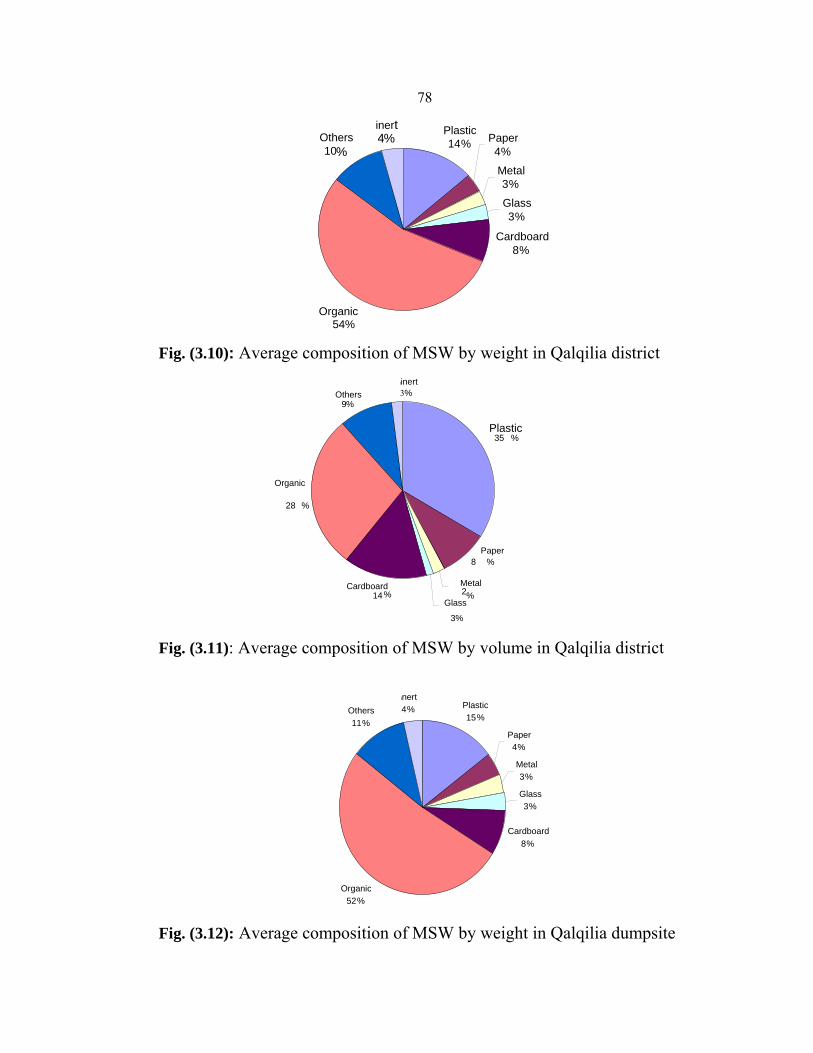
78
Fig. (3.10): Average composition of MSW by weight in Qalqilia district
Fig. (3.11): Average composition of MSW by volume in Qalqilia district
Fig. (3.12): Average composition of MSW by weight in Qalqilia dumpsite
Plastic14% Paper
4%
Metal3%
Glass3%
Cardboard8%
Organic54%
Others10%
inert4%
Plastic35 %
Paper 8 %
Metal2 %
Glass
3%
Cardboard14 %
Organic
28 %
Others 9 %
Iinert %3
Plastic15%
Paper4%
Metal3%
Glass3%
Cardboard8%
Organic52%
Others11%
inert4%
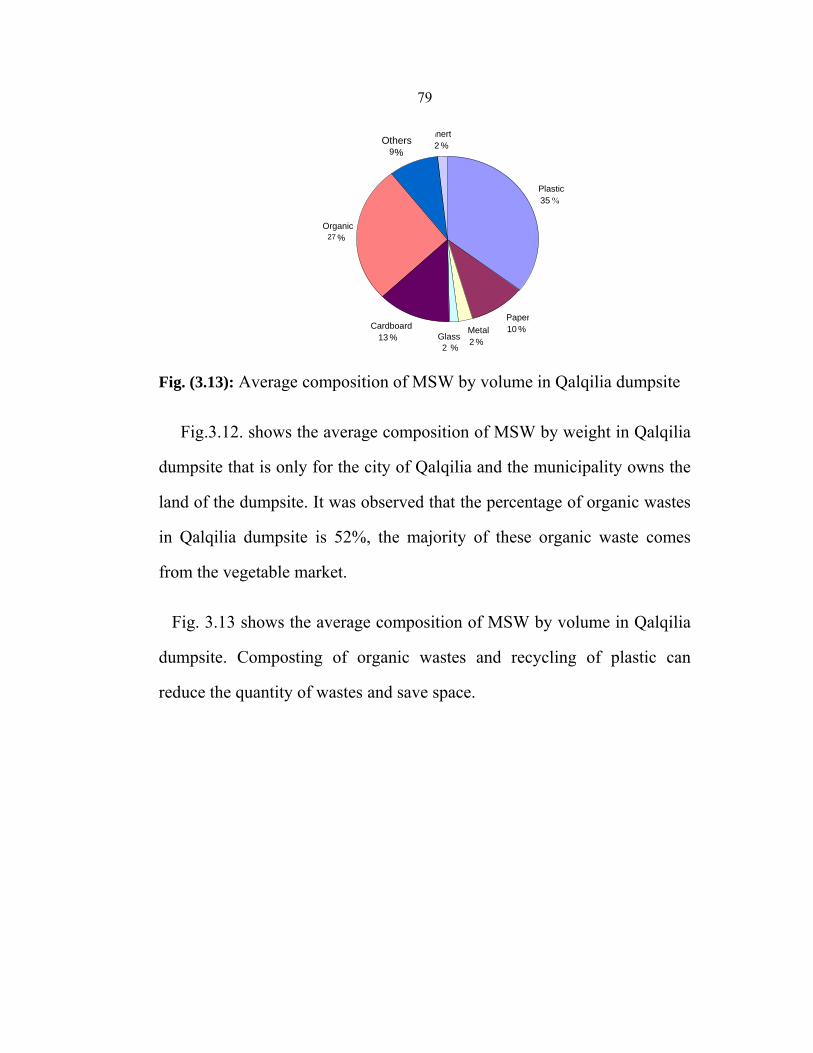
79
Fig. (3.13): Average composition of MSW by volume in Qalqilia dumpsite
Fig.3.12. shows the average composition of MSW by weight in Qalqilia
dumpsite that is only for the city of Qalqilia and the municipality owns the
land of the dumpsite. It was observed that the percentage of organic wastes
in Qalqilia dumpsite is 52%, the majority of these organic waste comes
from the vegetable market.
Fig. 3.13 shows the average composition of MSW by volume in Qalqilia
dumpsite. Composting of organic wastes and recycling of plastic can
reduce the quantity of wastes and save space.
Plastic 35 %
Paper 10 %Metal
2 %Glass2 %
Cardboard 13 %
Organic 27 %
Others9%
inert 2 %
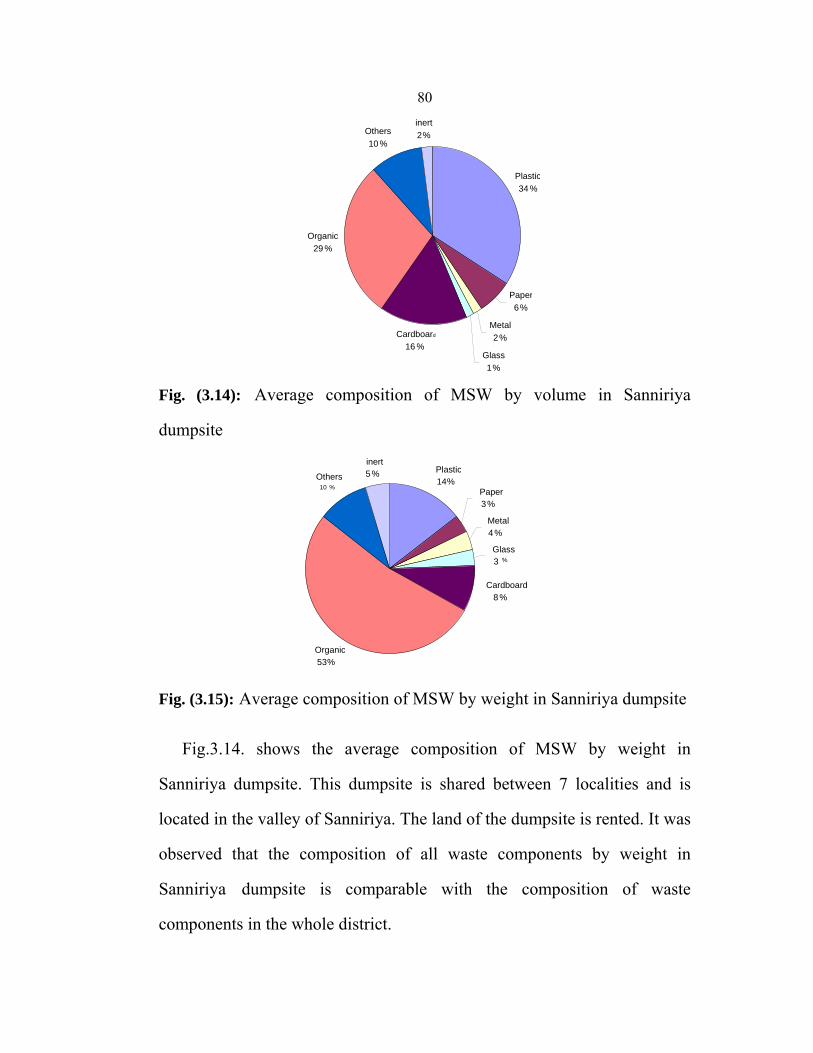
80
Fig. (3.14): Average composition of MSW by volume in Sanniriya
dumpsite
Fig. (3.15): Average composition of MSW by weight in Sanniriya dumpsite
Fig.3.14. shows the average composition of MSW by weight in
Sanniriya dumpsite. This dumpsite is shared between 7 localities and is
located in the valley of Sanniriya. The land of the dumpsite is rented. It was
observed that the composition of all waste components by weight in
Sanniriya dumpsite is comparable with the composition of waste
components in the whole district.
Plastic 14%
Paper 3%
Metal 4%
Glass 3 %
Cardboard 8%
Organic 53%
Others 10 %
inert 5%
Plastic34 %
Paper6%
Metal2%
Glass1%
Cardboard
16 %
Organic29 %
Others10 %
inert2%

81
Fig.3.15. shows the average composition of MSW by volume in Sanniriya
dumpsite. It was observed that the composition of all waste components by
volume in Sanniriya dumpsite is comparable with the composition of waste
components in the whole district.
Fig.(3.16): Average composition of MSW by weight in Kafr Laqif dumpsite
Fig.(3.17): Average composition of MSW by volume in Kafr Laqif dumpsite
Fig.3.16 shows the average composition of MSW by weight in Kafr
Laqif dumpsite, this dumpsite is only for Kafr Laqif and the village council
Plastic11 %
Paperr
11%
Metal3 2%
Glass2 %
Cardboard
6 %
Organic65 %
Others 7 %
inert 5 %
Plastic32%
Paper5%
Metal2%
Glass1%
Cardboard16%
Organic32%
Others8%
inert4%
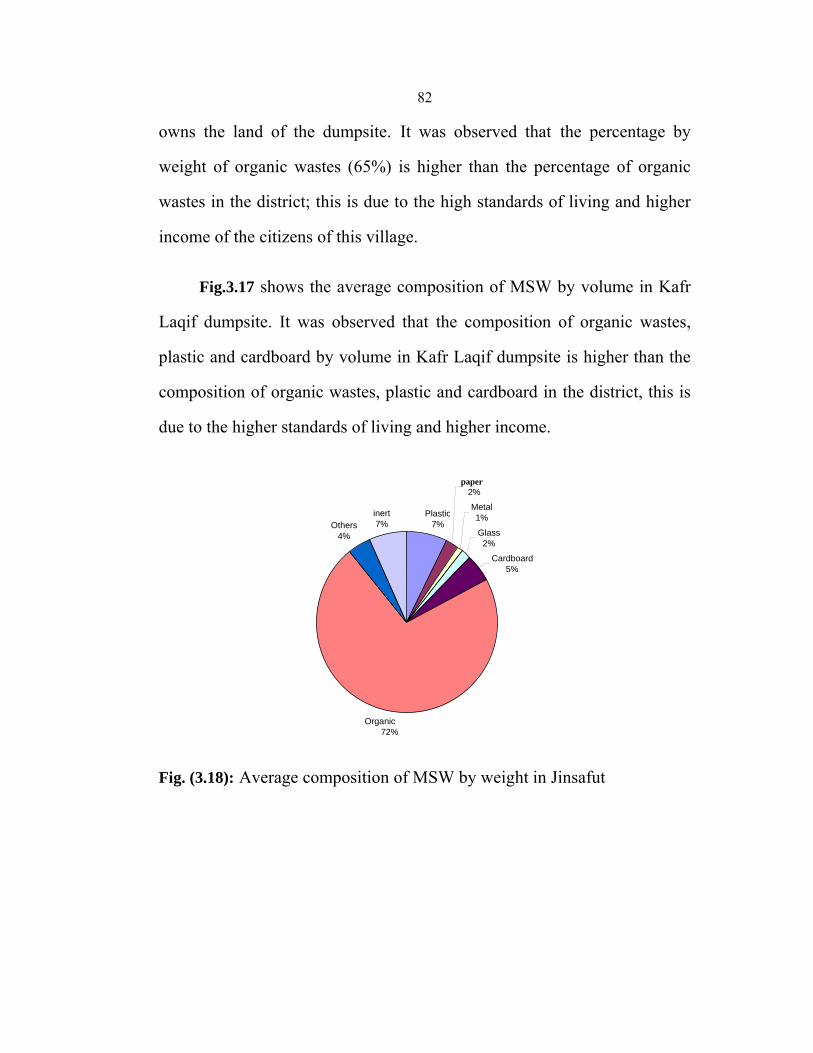
82
owns the land of the dumpsite. It was observed that the percentage by
weight of organic wastes (65%) is higher than the percentage of organic
wastes in the district; this is due to the high standards of living and higher
income of the citizens of this village.
Fig.3.17 shows the average composition of MSW by volume in Kafr
Laqif dumpsite. It was observed that the composition of organic wastes,
plastic and cardboard by volume in Kafr Laqif dumpsite is higher than the
composition of organic wastes, plastic and cardboard in the district, this is
due to the higher standards of living and higher income.
paper
Fig. (3.18): Average composition of MSW by weight in Jinsafut
Plastic7%
2%
Metal1%
Glass2%
Cardboard5%
Organic72%
Others4%
inert7%
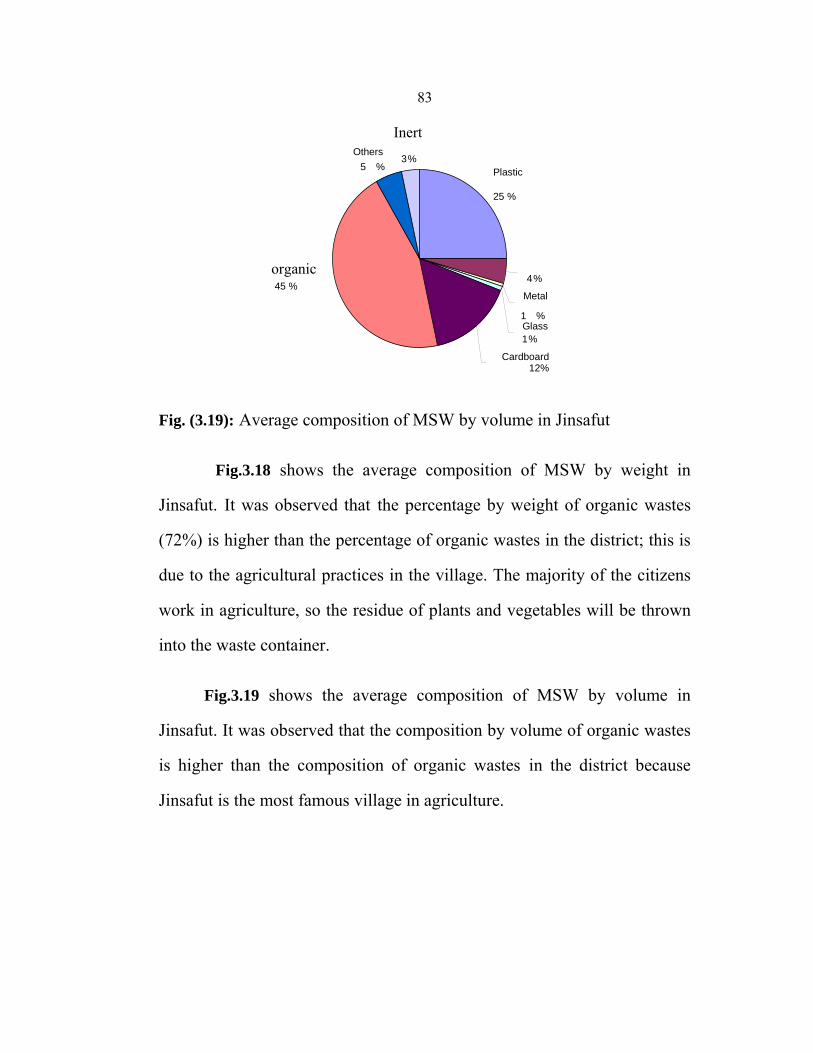
83
Inert
organic
Fig. (3.19): Average composition of MSW by volume in Jinsafut
Fig.3.18 shows the average composition of MSW by weight in
Jinsafut. It was observed that the percentage by weight of organic wastes
(72%) is higher than the percentage of organic wastes in the district; this is
due to the agricultural practices in the village. The majority of the citizens
work in agriculture, so the residue of plants and vegetables will be thrown
into the waste container.
Fig.3.19 shows the average composition of MSW by volume in
Jinsafut. It was observed that the composition by volume of organic wastes
is higher than the composition of organic wastes in the district because
Jinsafut is the most famous village in agriculture.
Plastic
25 %
4%
Metal
1 %Glass1%
Cardboard 12%
45 %
Others5 %
3%

84
Fig. (3.20): Average composition of MSW by weight at Far'ata dumpsite
Fig. (3.21): Average composition of MSW by volume in Far'ata dumpsite
Fig.3. 20 shows the average composition of MSW by weight in Far'ata
dumpsite which is shared between 6 localities, that rented the land of the
dumpsite from a citizen in the village of Far'ata. These localities are Baqat
al Hatab, Kafr Qaddum, Far'ata, Al Funduq, Immatin, and Hajja. It was
observed that the percentage by weight of organic wastes is the least all
over the district. This is due to the weak agricultural practices in these
42
Plastic14% Paper
4%
Metal2%
Glass5%
Cardboard11%
Organic %
Others17%
inert5%
Plastic32%
Paper10%
Metal1%
Glass3%
Cardboard16%
Organic22%
Others14%
inert2%
85
localities and low lifestyle. The agricultural practices of these localities are
limited on olive oil trees.
Fig.3.21 shows the average composition of MSW by volume in Far'ata
dumpsite. It was observed that the composition by volume of organic
wastes in Far'ata dumpsite is the least in the district because of the absence
of some agricultural practices and their standards of living.

86Table (3.43): Average percentage weight and range of 8 municipal solid waste components from different samples and dumpsites.
Average percentage weight and range of waste components (%)
Dumpsite N0. of Samples Plastic Paper Metal Glass Cardboard Organic Others inert
Qalqilia 15 14.67 4.1 3.34 3.34 8.44 51.63 10.79 3.65
10-17.78 1.9-6.67 0.95-4.44 2.22-6.84 5-13.64 51.43-54.05 6.67-19.61 1.82-4.73
Sanniriya 8 14.49 3.3 3.72 3 8.38 52.45 9.83 4.74
6.92-20.8 1.89-6.19 1.54-5.4 0.8-5.31 5-9.76 46.15-75.38 1.54-13.3 3.77-6.9
Far'ata 3 13.73 3.79 1.85 4.6 11.06 43.37 16.72 4.84
14.61-14.72 2-6.74 1.31-2.25 2.32-5.88 9.8-12.36 41.18-46.51 11.24-20.92 4.49-5.23
Jinsafut 2 7.19 2.15 1.07 1.79 5.03 71.94 4.13 6.65
6.76-7.69 1.54-2.7 0.77-1.35 1.35-2.31 4.05-6.155 69.23-74.32 2.7-5.77 6.54-6.76
Kafr Laqif 2 10.36 1.35 2.7 2.25 6.3 64.41 7.2 5.4
5.08-16.35 0.85-1.92 0.85-4.81 1.92-2.54 5.77-6.78 50-77.12 1.69-13.46 5.08-5.77
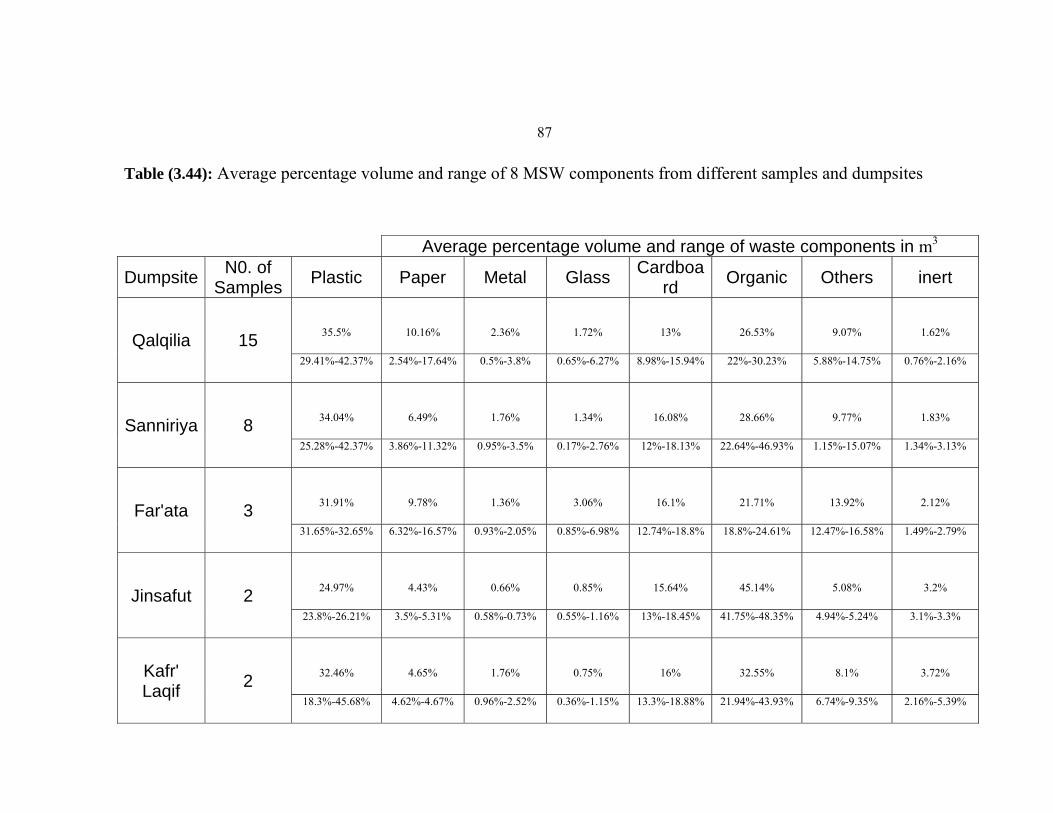
87
Table (3.44): Average percentage volume and range of 8 MSW components from different samples and dumpsites
Average percentage volume and range of waste components in m3
Dumpsite N0. of Samples Plastic Paper Metal Glass Cardboa
rd Organic Others inert
Qalqilia 15
35.5% 10.16% 2.36% 1.72% 13% 26.53% 9.07% 1.62%
29.41%-42.37% 2.54%-17.64% 0.5%-3.8% 0.65%-6.27% 8.98%-15.94% 22%-30.23% 5.88%-14.75% 0.76%-2.16%
Sanniriya 8
34.04% 6.49% 1.76% 1.34% 16.08% 28.66% 9.77% 1.83%
25.28%-42.37% 3.86%-11.32% 0.95%-3.5% 0.17%-2.76% 12%-18.13% 22.64%-46.93% 1.15%-15.07% 1.34%-3.13%
Far'ata 3
31.91% 9.78% 1.36% 3.06% 16.1% 21.71% 13.92% 2.12%
31.65%-32.65% 6.32%-16.57% 0.93%-2.05% 0.85%-6.98% 12.74%-18.8% 18.8%-24.61% 12.47%-16.58% 1.49%-2.79%
Jinsafut 2
24.97% 4.43% 0.66% 0.85% 15.64% 45.14% 5.08% 3.2%
23.8%-26.21% 3.5%-5.31% 0.58%-0.73% 0.55%-1.16% 13%-18.45% 41.75%-48.35% 4.94%-5.24% 3.1%-3.3%
Kafr' Laqif 2
32.46% 4.65% 1.76% 0.75% 16% 32.55% 8.1% 3.72%
18.3%-45.68% 4.62%-4.67% 0.96%-2.52% 0.36%-1.15% 13.3%-18.88% 21.94%-43.93% 6.74%-9.35% 2.16%-5.39%
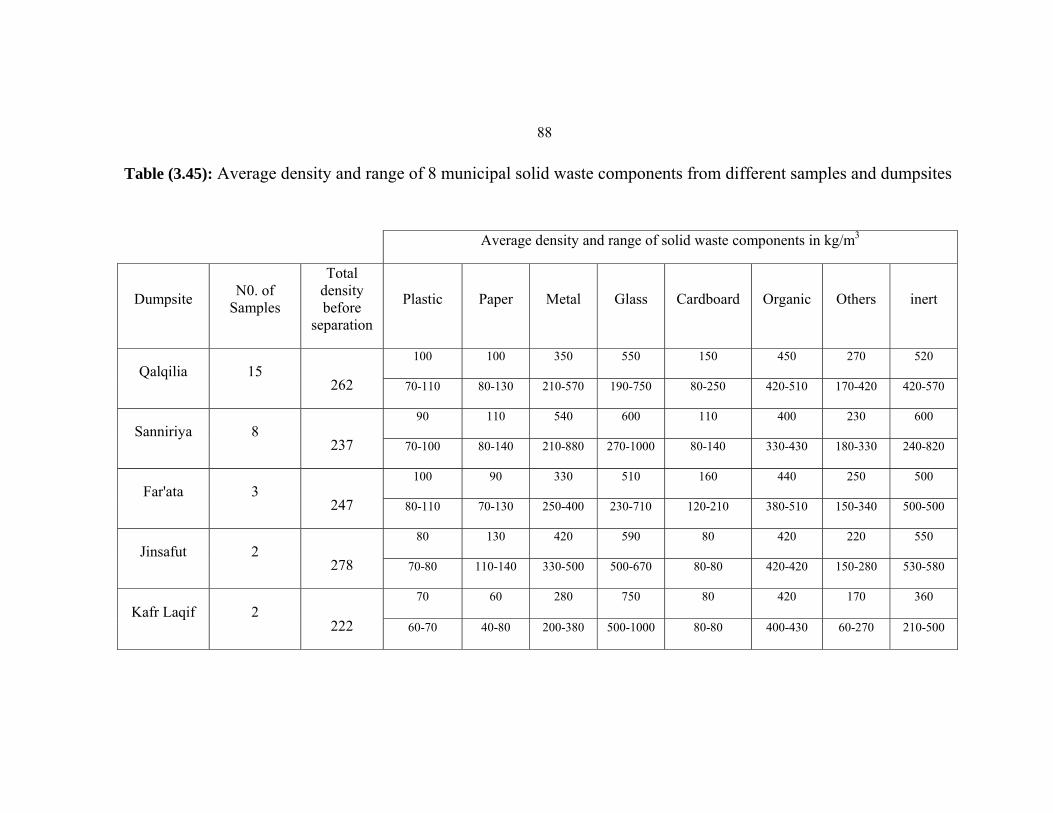
88
Table (3.45): Average density and range of 8 municipal solid waste components from different samples and dumpsites
Average density and range of solid waste components in kg/m3
Dumpsite N0. of Samples
Total density before
separation
Plastic Paper Metal Glass Cardboard Organic Others inert
Qalqilia 15 262
100 100 350 550 150 450 270 520
70-110 80-130 210-570 190-750 80-250 420-510 170-420 420-570
Sanniriya 8 237
90 110 540 600 110 400 230 600
70-100 80-140 210-880 270-1000 80-140 330-430 180-330 240-820
Far'ata 3 247
100 90 330 510 160 440 250 500
80-110 70-130 250-400 230-710 120-210 380-510 150-340 500-500
Jinsafut 2 278
80 130 420 590 80 420 220 550
70-80 110-140 330-500 500-670 80-80 420-420 150-280 530-580
Kafr Laqif 2 222
70 60 280 750 80 420 170 360
60-70 40-80 200-380 500-1000 80-80 400-430 60-270 210-500
89
Chapter Four
Conclusions and Recommendations

90
Chapter Four
Conclusions and Recommendations
4.1 Conclusions
In all local authorities studied, it was found that little or no consideration of
environmental impacts was paid in the selection of dumpsites, including
those currently in use. Convenience or availability of land took priority in
the sitting of dumpsites. Inspection and monitoring of the dumpsites was
not consistent, 46.2% of local authorities dispose waste in open random
dumps without any further treatment and 15.4% of local authorities
disposes waste in open random dumps and then burn it, no sanitary
practices such as application of daily soil cover or fencing were practiced
in any of the location studied except for Qalqilia dumpsite the municipality
covers the waste with a thin layer of soil. None of the dumpsites meet the
basic requirements in protecting ground water from pollution by leachate as
they have no liners.
Local authorities employ workers in the MSW services without any
training and they do not train them later to do their work but they obtain the
experience from experiment and from their companion, so they are usually
exposed to a great danger. The local authorities often are faced with
financial difficulties in meeting the large payment of wages, fuel and
maintenance of vehicles, etc. Most local authorities have become
economically constrained in offering efficient management of MSW. The
91
rapid population growth has overstretched the capacity of local authorities
to adequately provide services often provided. In spite of the high coverage
rate of waste services to all citizens, MSW collection frequency in some
villages is around or below 2 times per week.
The improvement of MSW collection and disposal capacity needs a
broader approach to address the improvement of local infrastructure;
including the need to upgrade roads leading to dumpsites to all weather
roads. Many local authorities blame breakdowns of their MSW collection
trucks and the aggregation of waste in and near containers especially in
winter to the poor condition of the roads.
Local authorities, though poor, should develop area-specific solutions to
their problems in the management of municipal solid waste. Consideration
of the composition of MSW can help make the correct choices in importing
MSW handling equipment. For example, there is no need to import
compactor trucks which are suitable to less dense MSW; dense MSW
which needs no compaction but just needs hauling trucks which might be
cheaper. Community involvement through neighborhood groups of people
from middle and higher income groups and business individuals can
provide the needed solution in mobilization of community-based efforts.
Clean neighborhood groups can mobilize financial resources and engage
private groups or hire private trucks to occasionally collect and dispose
MSW from their neighborhoods. Other measures include cultivation of a
sense of clean environment through clean community awareness
92
programming. These can go a long way in sensitizing people to keep the
environment clean. Regular activities such as clean up of the
neighborhoods, schools, parks and roadsides can be effective in changing
the citizen's attitudes even among the poor communities. In general, the
proper management of municipal solid waste is determined by the attitudes
of people towards waste, such as the ability to refrain from indiscriminate
dumping. Socio-economic characteristics may determine attitudes such as
the ability/willingness to recycle MSW. These attitudes, however, may be
positively influenced by awareness-building campaigns and educational
measures. In a word, it is the desire of the people that can keep the locality
clean.
One of the objectives of the project was to provide information on the
arisings of potentially recyclable or compostable materials contained in
MSW in Qalqilia district. The results obtained indicate that more than 83%
of MSW could potentially be either recycled or composted.
4.2 Recommendations
For a better sustainable MSWM, this study recommends the following:
4.2.1 Collection of MSW: Littering of MSW shall be prohibited by
Government. To prohibit littering, following steps shall be taken:
1. Organizing house to house collection of garbage through any of the
methods, like containerized collection, central bin collection, house to
house collection, collection at regular pre-informed timings and scheduling.

93
2. Wastes from slaughterhouses, fruits and vegetable markets, which are
biodegradable in nature, shall be managed to make use of such wastes.
3. Bio-medical wastes shall not be mixed with MSW but collected alone
and managed in a suitable way.
4. Wastes shall not be burnt any where.
5. Collection frequency must be increased for some localities.
4.2.2 Segregation of MSW: Local authorities shall organize awareness
programs for segregation of wastes to ensure full community involvement
of waste segregation and shall encourage recycling/reuse of segregated
materials.
4.2.3 Transportation of MSW: Vehicles used for transportation of wastes
shall be covered to prevent flying of wastes out of the vehicle. The vehicles
shall meet the following criteria:
1. The storage facilities shall be daily attended for clearing of wastes.
2. Collection and transportation vehicles shall be so designed that the
multiple handling of wastes is avoided.
4.2.4 Storage of MSW: Local authorities shall establish and maintain
storage facilities in such a manner as not to create unhygienic conditions
around it. The following must be done while establishing and maintaining
storage facilities:
94
1. Storage facilities shall take into account quantities of waste generation in
a given area, population density and a suitable site to be approach easily.
2. Storage facilities shall be designed that waste stored is not exposed to
open atmosphere and being covered to prevent flying of waste out of the
waste container and to keep animals far from waste.
3. Storage facilities shall be designed to be easy to handle for the collection
vehicle.
4. If manual handling is unavoidable due to constraints, it should be carried
out under proper precaution for safety of workers.
4.2.5 Processing of MSW: Authorities shall adopt suitable technology to
make use of wastes so as to minimize burden on landfill. Following criteria
shall be adopted:
1. The biodegradable wastes free of contaminants shall be processed by
composting.
2. Waste containing recoverable materials shall follow the route of
recycling.
4.2.6 Disposal of MSW: For the whole district their must be one landfill
that shall meet the following criteria:
1. Landfill siting and construction shall be done after proper environmental
impact assessment, enabling 100% collection coverage.
95
2. Landfill site shall comply with the norms for control of air and water
pollution.
3. Waste disposal site shall not be burnt.
4. Closure of existing random dumping sites and sealing off those with a
high potential of leachate leakage into groundwater aquifers.
5. Setting up regulation and an enforcement system for generation,
treatment, storage, transport and disposal of hazardous wastes.
4.2.7 Public participation: Involvement of public and private sector in
waste management is required in order to develop public understanding to
reduce the treatment cost, and increasing the MSW fees because most
citizens are willing to pay more for better services
4.2.8 Education and safety of MSW employees: Localities should
provide to their employees an education about personal hygiene and
protective measures and learn them about hazards and their reduction and
prevention to raise awareness about health and safety so to decrease the
risk in their job.

96
References
Abu Thaher A., (2005). Solid Wastes Collection, Disposal, and Financial
Aspects in the West Bank. Report, Environmental Quality Authority,
Ramallah, Palestine.
Ahmed S.A. and Ali M. (2004). Partnership for solid waste management
in developing countries: linking theories to realities, Habitat
International, 28, 467-479.
Al-Khatib, I.., and Abu Safieh. R. (2003). Solid waste management in
emergency: A case study from Ram Allah and Al-Bireh
Municipalities. Institute of Community and Public Health, Birzeit
University, Palestine.
Al-Khatib I.A., Arafat H.A., Basheer T., Shawahneh H., Salahat A., Eid J.,
Ali W. (2006). Trends and Problems of Solid Waste Management
in Developing Countries: A Case Study in Seven Palestinian
District. Waste Management. U.S.A. (Accepted for publication).
Al-Yaqout A.E, Kouski P.A, Hamoda M.F.(2002). Public opinion and
siting solid waste landfills in Kuwait. Resources Conservation and
Recycling 35:215-227.
Al-Yousfi A. B. (2004). Sound environmental management of solid
waste-the landfill bioreactor, United Nations Environmental
Programmed-Regional Office for West Asia.
97
Augenstein D., Wise D.L., Dat N.X., Khien N.D. (1996). Composting of
municipal solid waste and sewage sludge: Potential for fuel gas
production in developing country, Resources, Conservation and
Recycling, 16: 265-279.
Botkin D. B., and Edward A.K. (2003). Environmental science Earth as a
living Planet, John Wiley and Sons, USA.
Buenrostro O., Bocco G., Cram S. (2001). Classification of sources of
municipal solid wastes in developing countries, Resources.
Conservation and Recycling, 32, 29-41.
DCS, (1998). Municipal Solid Waste Statistics. Department of Census
and Statistics, Colombo, Sri Lanka.
Educational Planning Directorate School Mapping, (2006) Ministry Of
Education and Higher Education, Ram Allah, Palestine.
Fowler J. Jr. (1984). Survey Research Methods, Vol. 1. Beverly Hills,
CA: Sage.
Hajek J. (1981). Sampling from a Finite Population. New York: Marcel
Dekker.
Huang G.H., Linton J.D., Yeomans J.S., Yoogalingam R., (2005). Policy
planning under uncertainty: efficient starting populations for
simulation-optimization methods applied to municipal solid waste
management, Journal of Environmental Management,77:22-34.
98
Idris A., Inanc B., Hassan M. N. (2004). Overview of waste disposal and
landfills/dumps in Asian countries. J Mater Cycles Waste
Management, 6:104-110.
Kasseva M. E., Mbuligwe S. E. (2000). Ramifications of solid waste
disposal site relocation in urban areas of developing countries: a
case study in Tanzania. Resources, Conservation and Recycling
28:147-161.
Kaviraj S.S., (2003). Municipal solid waste management through
vermicomposting employing exotic and local species of
earthworms. Bioresource Technology, 90:169-173.
Khan I. H., Ahsan N., (2003). Textbook of Solid Waste Management.
Satish Kumar Jain for CBS Publisher and Distributors, New Delhi.
Kish, L. (1965). Survey Sampling. New York: Wiley.
Ma.Teresa Orta de Velasquez, Rivera R.C., Valencia N.R., Ramirez I.M.,
Gomez J.S., (2003). Determination of field capacity of municipal
solid waste with surcharge simulation, Waste Management and
Research, Vol.21, No.2, 137-144. International Solid Waste
Association. World Web Page: http://wmr.sagepub.com/cgi/content
Mbuligwe S. E., (2002). Institutional solid waste management practices
in developing countries: a case study of three academic institutions
in Tanzania. Resources, Conservation and Recycling 35:131-146.
99
Mbuligwe S.E., Kassenga G.R., Kaseva M.E., and Chaggu E.J., (2002).
Potential and constraints of composting domestic solid waste in
developing countries: findings from a pilot study in Dar es
Salaam, Tanzania. Resources Conservation and Recycling, 36, 45-
59.
Mcbean E.A., Rovers F. A., Farquhar G.J. (1995). Solid waste landfill
engineering and design, Prentice Hall PTR, Englewood Cliffs, New
Jersey.
Milhem A.K., (2004). Investigation of occupational health and safety
hazards among domestic waste collectors in Bethlehem and
Hebron districts. MSc. Thesis, Faculty of Graduate Studies, An-
Najah National Univercity, Nablus, Palestine.
Palestinian Central Bureau of Statistics, (2005). Household
Environmental Survey, 2005: Main Results. Ramallah-Palestine.
Palestinian Central Bureau of Statistics (PCBS), Projected Mid -Year
Population for Qalqilia Governorate by Locality 2004- 2006,
World Web Page: http://www.pcbs.gov.ps/Portals/_pcbs/populati/pop04.
aspx.
Palestinian Central Bureau of Statistics (PCBS) (2005). Quantity of Solid
Waste Produced Daily, the Average Daily Household Production
and the Average Per Capita Daily Production of Solid Waste in
the Palestinian Territory by Region, 2005. Ramallah, Palestine.
100
Palestinian Central Bureau of Statistics (PCBS) (2004). Levels of living in
the Palestinian territory. Ramallah, Palestine.
Palestinian National Information Centre (2003). Human and economic
losses in Qalqilia district during Al-Aqsa Intifada between
29/9/200-30/6/2003.World Web Page :http://www.pnic.gov.ps
/arabic/quds/arabic/losses/quds_hasaer85.html.Accesseddate:
26/7/2005.
Palestinian National Information Centre. (1999). Sources of pollution
World Web Page:http://www.pnic.gov.ps/english.html. Accessed date:
12/7/2006
Pokhrel D., Viraraghavan T., (2005). Municipal solid waste management
in Nepal: practices and challenges. Waste Management, 25:555-562.
Powrie W., Beaven R.P., Hudson A.P.,(2005). Factors affecting the
hydraulic conductivity of waste. International Workshop"Hydro-
Physico-Mechanics of landfills" LIRIGM,Grenoble 1 University,
France,21-22 March.
Qalqilia (2004). Welcome to Qalqilia. World Web Page:
http://www.qalqilia.org.ps. Accessed date: 22/7/2005.
Qusus S. K. (1988). Composition and Generation rate of the solid waste
of hospitals and medical laboratories in Amman. MSc. Thesis,
Faculty of Graduate studies, Jordan University, Amman, Jordan.
101
Rabi A. (2003). Investigation of the suitability of adopting passive
humidity harvest as an alternative water resource in Palestine.
World Web Page: http://www.up.ac.za/academic/geog/meteo
/EVENTS /fogdew2003/PAPERS/C61 Accessed date: 20/6/2006.
Rathi S.(2005). Alternative approaches for better municipal solid waste
management in Mumbai, India,Waste Management. World Web
Page: http://www.sciencedirect.com. Accessed date: 17/4/2006.
Rushbrook P., Pugh M. (1999). Solid waste landfills in middle and
lower-income countries: a technical guide to planning, design, and
operation. World Bank, Washington DC.
Scheaffer R.L., Mendenhall W.A. and Off L. (1990). Elementary Survey
Sampling. Boston: PWSKent.
Srivastrava P.K., Kulshreshtha K., Mohanty C.S., Pushpangada P. (2005).
Stakeholder-based SWOT analysis for successful municipal solid
waste management in Lucknow,India. Waste Management, 25:531-
537.
Talahmeh I. (2005). Good planning for sanitary landfill: Hebron
District as a case study. Master Thesis, Faculty of Graduate Studies,
Birzeit University, West Bank, Palestine.
Tanaka M. (1999). Recent trends in recycling activities and waste
management in Japan, Mater Cycle Waste Management, 1:10-16

102
Tchobanoglous G., Kreith F. (2002). Handbook of solid waste
management. McGraw-Hill. New York.
The Alternative Information Center (2001). A city under siege: the effect
of the closure on Qalqilia city as a case study. World Web Page:
http://www4.alternativenews.org/factsheet/qalqilia-6-01. Accessed
date: 22/7/2005.
United States Environmental Protection Agency (USEPA) (1995).
Decision-maker’s guide to solid waste management. 2nd ed.USA:
[EPA530-R-95-023].
Vesilind P. A., Worrell W. A., Reinhart D. R. (1987). Solid waste
engineering. Newsday, Dan Sheehan.
Vidanaarachchi C.K., Yuen S.T.S., Pilapitiya S., (2005). Municipal solid
waste management in Southern Province of Srilanka: Problems,
issues and challenges,Waste Management.
World Health Organization (WHO), Regional Office for Europe (2000).
Methods of assessing risk to health from exposure to hazards
released from waste landfills. European Centre for Environment and
Health, Lodz, Poland.

103
Appendices

104
Appendix A
No Sample net weight
Sample density Dumpsite Date Results Plastic Paper Metal Glass Cardboard Organic Others inert
1 105
0.21 Qalqilia 27/01/2
006
weight 17 2 1 7 8 54 13 3
volume 250 15 3 37 90 130 58 7
density 0.07 0.13 0.33 0.19 0.09 0.42 0.22 0.43
percentage by weight % 16.19 1.90 0.95 6.67 7.62 51.43 12.38 2.86
2 120 0.24 Qalqilia 27/01/2006
weight 12 4 5 6 6 71 11 5
volume 170 30 12 20 80 140 65 9
density 0.07 0.13 0.42 0.30 0.08 0.51 0.17 0.56
percentage by weight % 10.00 3.33 4.17 5.00 5.00 59.17 9.17 4.17
3 148 0.296 Qalqilia 27/01/2006
weight 23 5 5 4 10 80 14 7
volume 221 51 11 9 75 182 40 13
density 0.10 0.10 0.45 0.44 0.13 0.44 0.35 0.54
percentage by weight % 15.54 3.38 3.38 2.70 6.76 54.05 9.46 4.73
4 135 0.27 Qalqilia 27/01/2006
weight 18 9 6 3 14 72 9 4
volume 185 105 19 6 85 153 35 7
density 0.10 0.09 0.32 0.50 0.16 0.47 0.26 0.57

105percentage by weight % 13.33 6.67 4.44 2.22 10.37 53.33 6.67 2.96
5 143 0.286 Qalqilia 27/01/2006
weight 22 6 4 3 12 78 13 5
volume 226 67 18 5 81 160 42 9
density 0.10 0.09 0.22 0.60 0.15 0.49 0.31 0.56
percentage by weight % 15.38 4.20 2.80 2.10 8.39 54.55 9.09 3.50
6 153 0.288 Qalqilia 20/01/2006
weight 23 3 6 5 10 80 21 5
volume 214 25 12 9 75 177 50 9
density 0.11 0.12 0.50 0.56 0.13 0.45 0.42 0.56
percentage by weight % 15.03 1.96 3.92 3.27 6.54 52.29 13.73 3.27
7 128 0.256 Qalqilia 20/01/2006
weight 21 7 5 4 11 61 14 5
volume 219 72 9 6 72 133 56 10
density 0.10 0.10 0.56 0.67 0.15 0.46 0.25 0.50
percentage by weight % 16.41 5.47 3.91 3.13 8.59 47.66 10.94 3.91
8 135 0.27 Qalqilia 20/01/2006
weight 24 4 5 4 14 66 13 5
volume 221 40 15 5 92 138 55 11
density 0.11 0.10 0.33 0.80 0.15 0.48 0.24 0.45
percentage by weight % 17.78 2.96 3.70 2.96 10.37 48.89 9.63 3.70
9 125 0.25 Qalqilia 20/01/2 weight 19 6 4 3 9 64 15 5

106006 volume 180 55 11 5 72 152 62 12
density 0.11 0.11 0.36 0.60 0.13 0.42 0.24 0.42
percentage by weight % 15.20 4.80 3.20 2.40 7.20 51.20 12.00 4.00
10 117 0.234 Qalqilia 20/01/2006
weight 13 8 4 8 11 55 12 6
volume 160 90 7 12 83 132 48 12
density 0.08 0.09 0.57 0.67 0.13 0.42 0.25 0.50
percentage by weight % 11.11 6.84 3.42 6.84 9.40 47.01 10.26 5.13
11 153 0.306 Qalqilia 06/12/2005
weight 23 3 4 3 6 78 30 6
volume 211 25 17 4 70 182 90 11
density 0.11 0.12 0.24 0.75 0.09 0.43 0.33 0.55
percentage by weight % 15.03 1.96 2.61 1.96 3.92 50.98 19.61 3.92
12 131 0.262 Qalqilia 06/12/2005
weight 23 6 4 3 13 66 12 4
volume 224 80 15 5 52 155 41 7
density 0.10 0.08 0.27 0.60 0.25 0.43 0.29 0.57
percentage by weight % 17.56 4.58 3.05 2.29 9.92 50.38 9.16 3.05
13 140 0.28 Qalqilia 06/12/2005
weight 21 5 5.5 4.5 13 70 15 6
volume 211 65 22 9 55 154 52 12
density 0.10 0.08 0.25 0.50 0.24 0.45 0.29 0.50
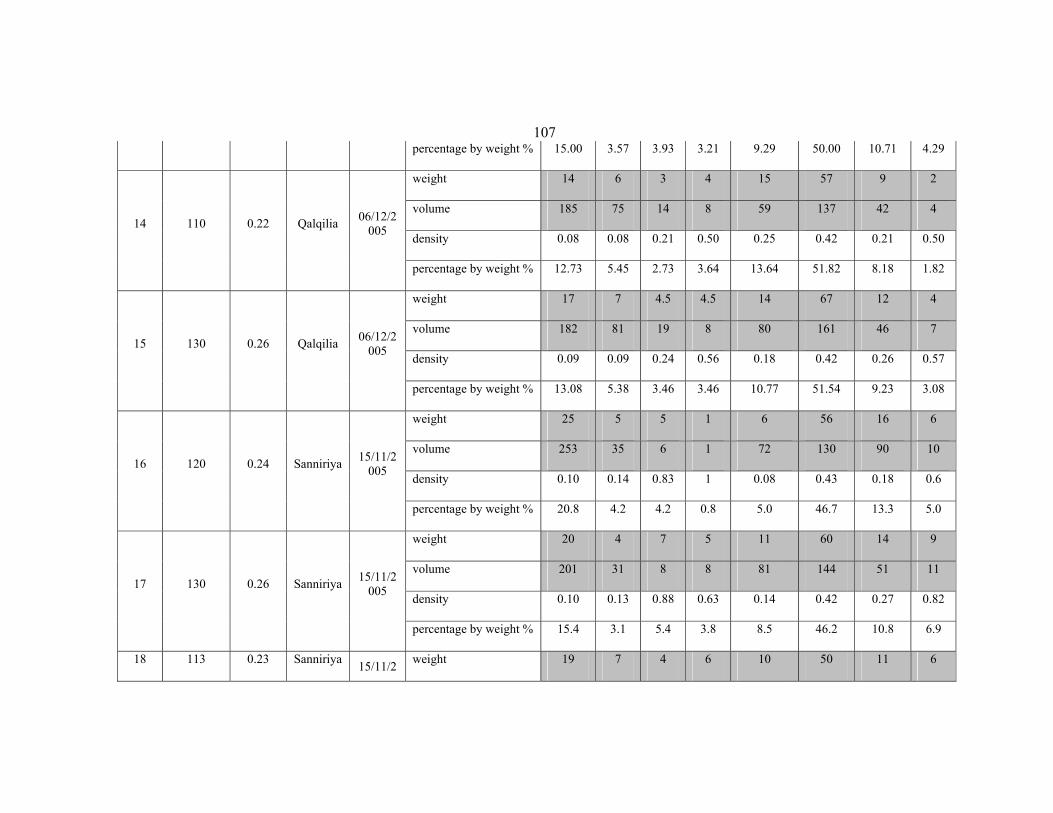
107percentage by weight % 15.00 3.57 3.93 3.21 9.29 50.00 10.71 4.29
14 110 0.22 Qalqilia 06/12/2005
weight 14 6 3 4 15 57 9 2
volume 185 75 14 8 59 137 42 4
density 0.08 0.08 0.21 0.50 0.25 0.42 0.21 0.50
percentage by weight % 12.73 5.45 2.73 3.64 13.64 51.82 8.18 1.82
15 130 0.26 Qalqilia 06/12/2005
weight 17 7 4.5 4.5 14 67 12 4
volume 182 81 19 8 80 161 46 7
density 0.09 0.09 0.24 0.56 0.18 0.42 0.26 0.57
percentage by weight % 13.08 5.38 3.46 3.46 10.77 51.54 9.23 3.08
16 120 0.24 Sanniriya 15/11/2005
weight 25 5 5 1 6 56 16 6
volume 253 35 6 1 72 130 90 10
density 0.10 0.14 0.83 1 0.08 0.43 0.18 0.6
percentage by weight % 20.8 4.2 4.2 0.8 5.0 46.7 13.3 5.0
17 130 0.26 Sanniriya 15/11/2005
weight 20 4 7 5 11 60 14 9
volume 201 31 8 8 81 144 51 11
density 0.10 0.13 0.88 0.63 0.14 0.42 0.27 0.82
percentage by weight % 15.4 3.1 5.4 3.8 8.5 46.2 10.8 6.9
18 113 0.23 Sanniriya 15/11/2 weight 19 7 4 6 10 50 11 6

108005 volume 195 60 14 11 75 120 46 9
density 0.10 0.12 0.29 0.55 0.13 0.42 0.24 0.67
percentage by weight % 16.81 6.19 3.54 5.31 8.85 44.25 9.73 5.31
19 123 0.246 Sanniriya 15/11/2005
weight 15 3 6 3 12 64 14 6
volume 175 37 7 5 95 153 53 8
density 0.09 0.08 0.86 0.60 0.13 0.42 0.26 0.75
percentage by weight % 12.20 2.44 4.88 2.44 9.76 52.03 11.38 4.88
20 106 0.212 Sanniriya 15/11/2005
weight 18 2 4 4 10 56 8 4
volume 192 21 19 15 91 144 44 17
density 0.09 0.10 0.21 0.27 0.11 0.39 0.18 0.24
percentage by weight % 16.98 1.89 3.77 3.77 9.43 52.83 7.55 3.77
21 130 0.26 Sanniriya 23/01/2006
weight 9 3 2 2 10 98 2 4
volume 132 32 5 3 92 245 6 7
density 0.07 0.09 0.40 0.67 0.11 0.40 0.33 0.57
percentage by weight % 6.92 2.31 1.54 1.54 7.69 75.38 1.54 3.08
22 118 0.236 Sanniriya 23/01/2006
weight 13 3 5 4 8 63 16 6
volume 147 25 12 6 97 165 72 11
density 0.09 0.12 0.42 0.67 0.08 0.38 0.22 0.55
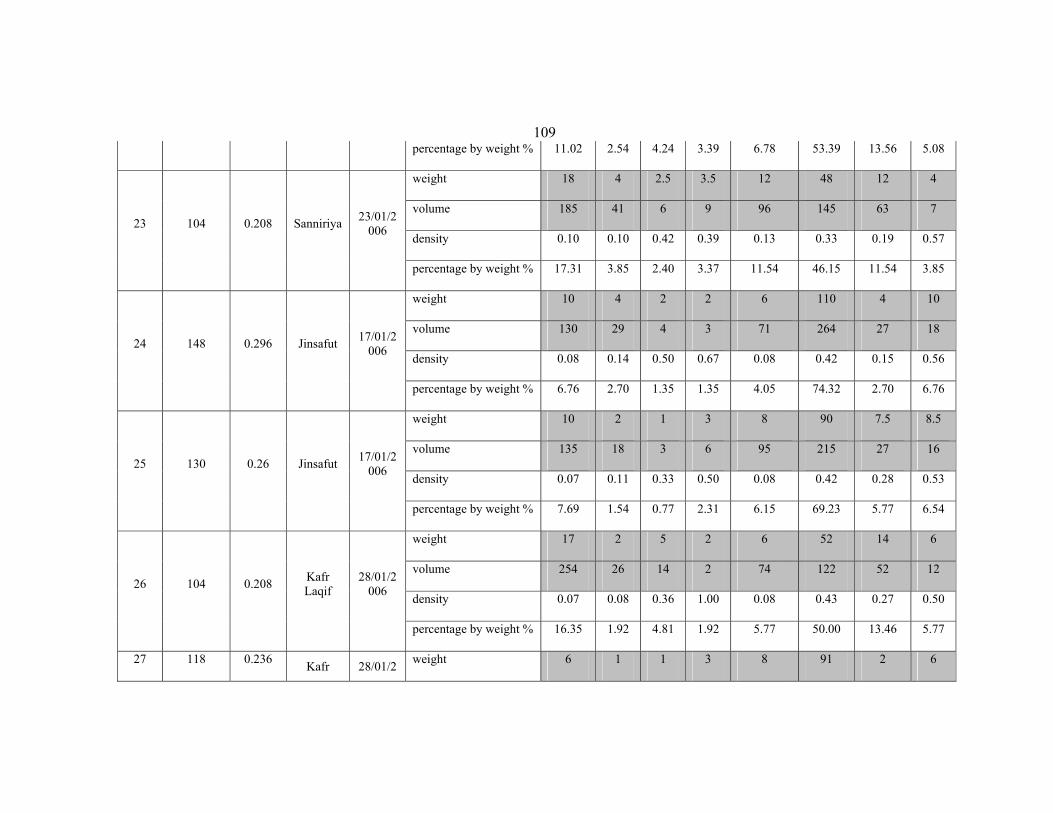
109percentage by weight % 11.02 2.54 4.24 3.39 6.78 53.39 13.56 5.08
23 104 0.208 Sanniriya 23/01/2006
weight 18 4 2.5 3.5 12 48 12 4
volume 185 41 6 9 96 145 63 7
density 0.10 0.10 0.42 0.39 0.13 0.33 0.19 0.57
percentage by weight % 17.31 3.85 2.40 3.37 11.54 46.15 11.54 3.85
24 148 0.296 Jinsafut 17/01/2006
weight 10 4 2 2 6 110 4 10
volume 130 29 4 3 71 264 27 18
density 0.08 0.14 0.50 0.67 0.08 0.42 0.15 0.56
percentage by weight % 6.76 2.70 1.35 1.35 4.05 74.32 2.70 6.76
25 130 0.26 Jinsafut 17/01/2006
weight 10 2 1 3 8 90 7.5 8.5
volume 135 18 3 6 95 215 27 16
density 0.07 0.11 0.33 0.50 0.08 0.42 0.28 0.53
percentage by weight % 7.69 1.54 0.77 2.31 6.15 69.23 5.77 6.54
26 104 0.208 Kafr Laqif
28/01/2006
weight 17 2 5 2 6 52 14 6
volume 254 26 14 2 74 122 52 12
density 0.07 0.08 0.36 1.00 0.08 0.43 0.27 0.50
percentage by weight % 16.35 1.92 4.81 1.92 5.77 50.00 13.46 5.77
27 118 0.236 Kafr 28/01/2 weight 6 1 1 3 8 91 2 6

110Laqif 006 volume 95 24 5 6 98 228 35 28
density 0.06 0.04 0.20 0.50 0.08 0.40 0.06 0.21
percentage by weight % 5.08 0.85 0.85 2.54 6.78 77.12 1.69 5.08
28 153 0.306 Far'ata 07/02/2006
weight 19 5 2 9 15 63 32 8
volume 180 40 6 40 73 123 95 16
density 0.11 0.13 0.33 0.23 0.21 0.51 0.34 0.50
percentage by weight % 12.42 3.27 1.31 5.88 9.80 41.18 20.92 5.23
29 89 0.178 Far'ata 07/02/2006
weight 13 6 2 5 11 38 10 4
volume 170 89 5 7 90 101 67 8
density 0.08 0.07 0.40 0.71 0.12 0.38 0.15 0.50
percentage by weight % 14.61 6.74 2.25 5.62 12.36 42.70 11.24 4.49
30 129 0.258 Far'ata 07/02/2006
weight 19 3 3 3 15 60 20 6
volume 191 37 12 5 110 144 74 12
density 0.10 0.08 0.25 0.60 0.14 0.42 0.27 0.50
percentage by weight % 14.72 2.3 2.3 2.3 11.62 46.51 15.5 4.65
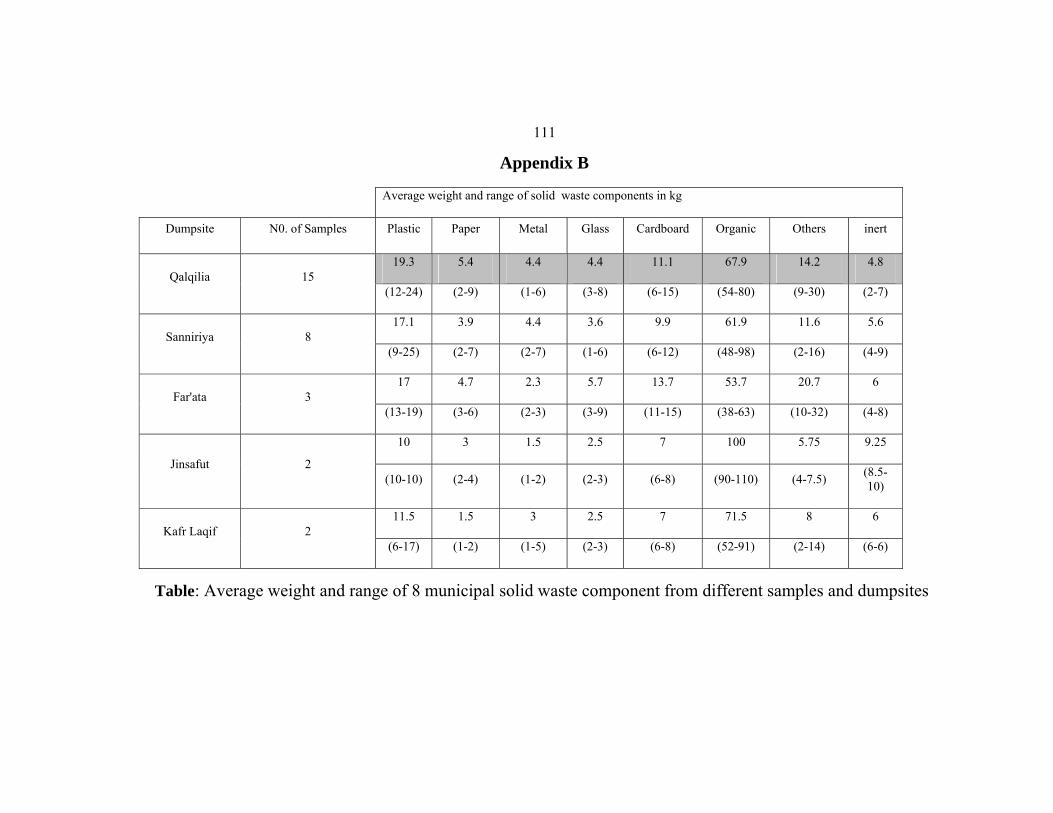
111
Appendix B
Average weight and range of solid waste components in kg
Dumpsite N0. of Samples Plastic Paper Metal Glass Cardboard Organic Others inert
Qalqilia 15 19.3 5.4 4.4 4.4 11.1 67.9 14.2 4.8
(12-24) (2-9) (1-6) (3-8) (6-15) (54-80) (9-30) (2-7)
Sanniriya 8 17.1 3.9 4.4 3.6 9.9 61.9 11.6 5.6
(9-25) (2-7) (2-7) (1-6) (6-12) (48-98) (2-16) (4-9)
Far'ata 3 17 4.7 2.3 5.7 13.7 53.7 20.7 6
(13-19) (3-6) (2-3) (3-9) (11-15) (38-63) (10-32) (4-8)
Jinsafut 2
10 3 1.5 2.5 7 100 5.75 9.25
(10-10) (2-4) (1-2) (2-3) (6-8) (90-110) (4-7.5) (8.5-10)
Kafr Laqif 2 11.5 1.5 3 2.5 7 71.5 8 6
(6-17) (1-2) (1-5) (2-3) (6-8) (52-91) (2-14) (6-6)
Table: Average weight and range of 8 municipal solid waste component from different samples and dumpsites
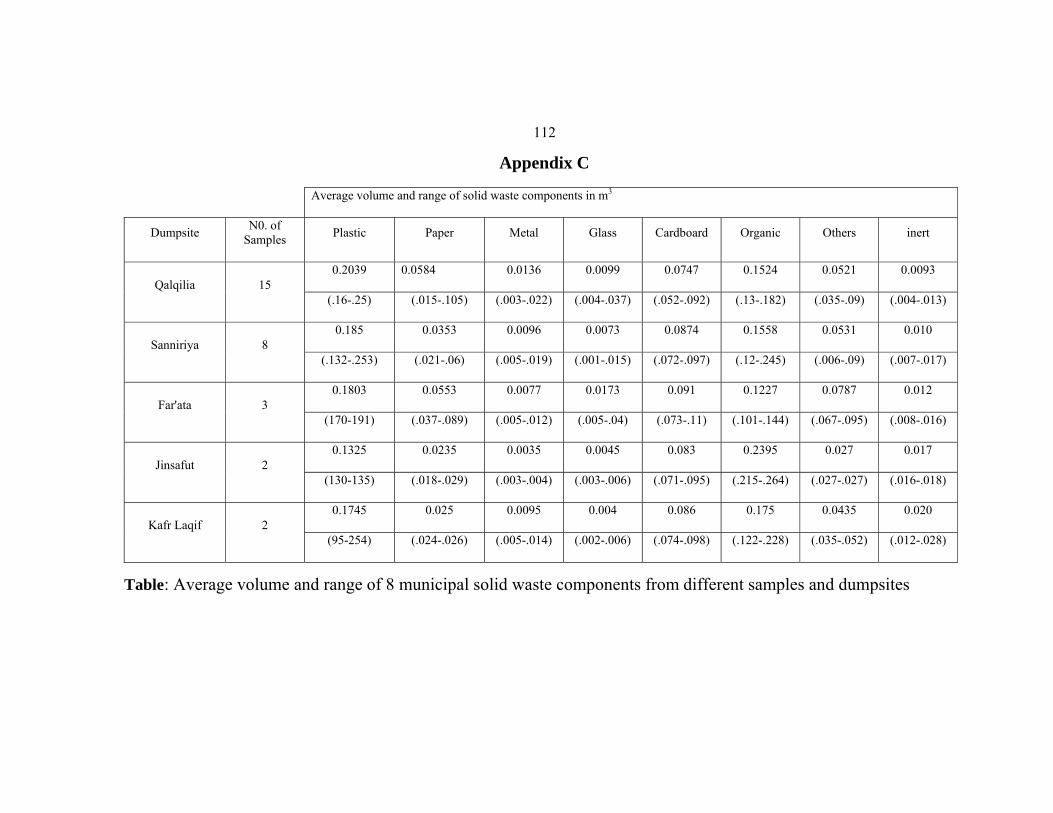
112
Appendix C
Average volume and range of solid waste components in m3
Dumpsite N0. of Samples Plastic Paper Metal Glass Cardboard Organic Others inert
Qalqilia 15 0.2039 0.0584 0.0136 0.0099 0.0747 0.1524 0.0521 0.0093
(.16-.25) (.015-.105) (.003-.022) (.004-.037) (.052-.092) (.13-.182) (.035-.09) (.004-.013)
Sanniriya 8 0.185 0.0353 0.0096 0.0073 0.0874 0.1558 0.0531 0.010
(.132-.253) (.021-.06) (.005-.019) (.001-.015) (.072-.097) (.12-.245) (.006-.09) (.007-.017)
Far'ata 3 0.1803 0.0553 0.0077 0.0173 0.091 0.1227 0.0787 0.012
(170-191) (.037-.089) (.005-.012) (.005-.04) (.073-.11) (.101-.144) (.067-.095) (.008-.016)
Jinsafut 2 0.1325 0.0235 0.0035 0.0045 0.083 0.2395 0.027 0.017
(130-135) (.018-.029) (.003-.004) (.003-.006) (.071-.095) (.215-.264) (.027-.027) (.016-.018)
Kafr Laqif 2 0.1745 0.025 0.0095 0.004 0.086 0.175 0.0435 0.020
(95-254) (.024-.026) (.005-.014) (.002-.006) (.074-.098) (.122-.228) (.035-.052) (.012-.028)
Table: Average volume and range of 8 municipal solid waste components from different samples and dumpsites
113
Appendix D
استبانة حول تطوير إدارة النفايات الصلبة في محافظة قلقيلية
استبانة القطاع المنزلي
أخي المواطن الكريم، أختي المواطنة الكريمة
أنا الطالب جعفر عيد، طالب ماجستير في العلوم البيئية، في السنة األخيرة في جامعـة النجـاح
ا تقوم على محاولة دراسة أمـور تتعلـق الوطنية وأطروحة الماجستير التي أعمل على دراسته
.بتطوير إدارة النفايات الصلبة في محافظة قلقيلية
إن استجابتك وموضوعيتك في اإلجابة عن هذه االستبانة سوف تساعد في جعـل هـذا البحـث
العلمي دقيقاً وتوصلنا إلى أفضل النتائج والطرق لجعل محافظـة قلقيليـة سـليمة بيئيـاً، فقـم
خبراتك بالمشاركة في
شكراً لمساعدتي في هذا البحث
مع االحترام
جعفر عيد

114
: اسم التجمع السكاني V001 مخيم -3قرية -2مدينة -1: نوع التجمع السكاني V002 أحد أفراد األسرة البالغين -2 رب األسرة -1: لى االستبانة هوالمجيب ع
سنة 15أحد األطفال الذين يزيد عمره عن -4 ان أحد األصدقاء أو الجير -3V003 ما هو معدل دخل األسرة الشهري بالشيكل..................... V004 عدد الساكنين في المنزل................ V005 عدد غرف المنزل..........................: V006 منذ متى تسكنون في هذا التجمع السكاني..........:............... V007 ابتــدائي -2أمــي -1: المســتوى التعليمــي للمجيــب علــى األســئلة
أكثر من ثانوي -5ثانوي -4أعدادي -3V008 ما المقصود بالنفايات الصلبة؟
---------------- V009 ت الصلبة في التجمع السـكاني هل تعتقد بوجود مشاكل محددة ذات عالقة بالنفايا
ال -2نعم -1عندكم؟ V010 إذا كان الجواب نعم فما هي هذه المشاكل؟ أذكرها
1------- 2----------
3- 4-
5- 6- V011 غير معبد - 2معبد - 1: هل الطريق المؤدي إلى المنزل V012 بالمتر(ما هو عرض الطريق إلى المنزل :(
3الى 2من - 2 2أقل من -1
4أكثر من -4 4الى 3من -3V013 بة من المنزلعدد الحاويات القري:
حاويتان - 2حاوية واحدة -1
ال يوجد - 4أكثر من ذلك -3V014 بالمتر( مسافة أقرب حاوية إلى المنزل:(
100إلى 50من -3 50إلى 20من -2 20إلى 10من -1
ال يوجد حاوية - 6 150أكثر من -5 150إلى 100من -4
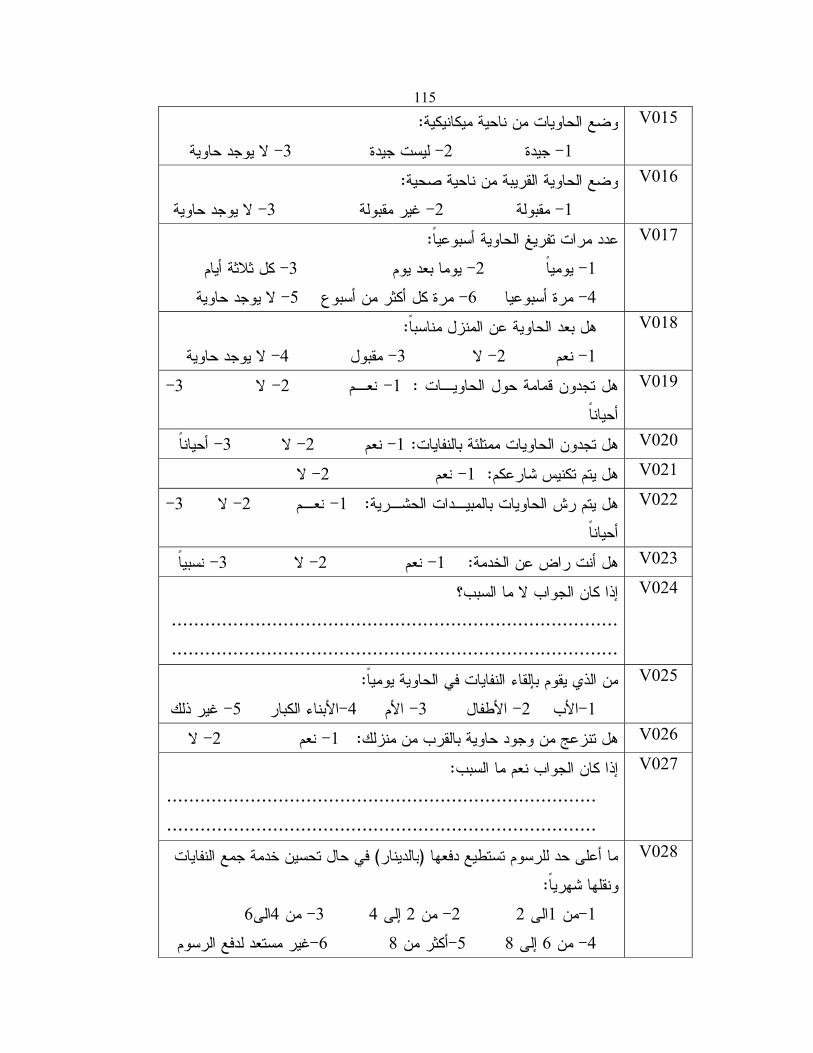
115V015 وضع الحاويات من ناحية ميكانيكية:
ال يوجد حاوية -3 ليست جيدة -2جيدة -1V016 وضع الحاوية القريبة من ناحية صحية:
ال يوجد حاوية -3 غير مقبولة -2مقبولة -1V017 ًعدد مرات تفريغ الحاوية أسبوعيا :
كل ثالثة أيام -3 يوما بعد يوم - 2يومياً -1
ال يوجد حاوية -5 مرة كل أكثر من أسبوع - 6مرة أسبوعيا -4V018 ًهل بعد الحاوية عن المنزل مناسبا:
ال يوجد حاوية -4مقبول - 3 ال - 2م نع -1V019 3 ال -2 نعـم -1: حول الحاويـات هل تجدون قمامة-
أحياناًV020 أحياناً -3 ال -2نعم -1: ممتلئة بالنفايات هل تجدون الحاويات V021 ال -2نعم -1: هل يتم تكنيس شارعكم V022 3ال -2 نعـم -1: بيـدات الحشـرية هل يتم رش الحاويات بالم-
أحياناًV023 نسبياً -3 ال -2نعم -1 : هل أنت راض عن الخدمة V024 إذا كان الجواب ال ما السبب؟
................................................................................
................................................................................ V025 ًمن الذي يقوم بإلقاء النفايات في الحاوية يوميا:
غير ذلك -5األبناء الكبار - 4األم - 3األطفال - 2األب -1V026 ال -2 نعم -1: لقرب من منزلكهل تنزعج من وجود حاوية با V027 إذا كان الجواب نعم ما السبب:
.............................................................................
............................................................................. V028 في حال تحسين خدمة جمع النفايات ) بالدينار(ما أعلى حد للرسوم تستطيع دفعها
:ونقلها شهرياً
6الى4من -3 4إلى 2من - 2 2ى ال1من -1
غير مستعد لدفع الرسوم- 6 8أكثر من - 5 8إلى 6من -4
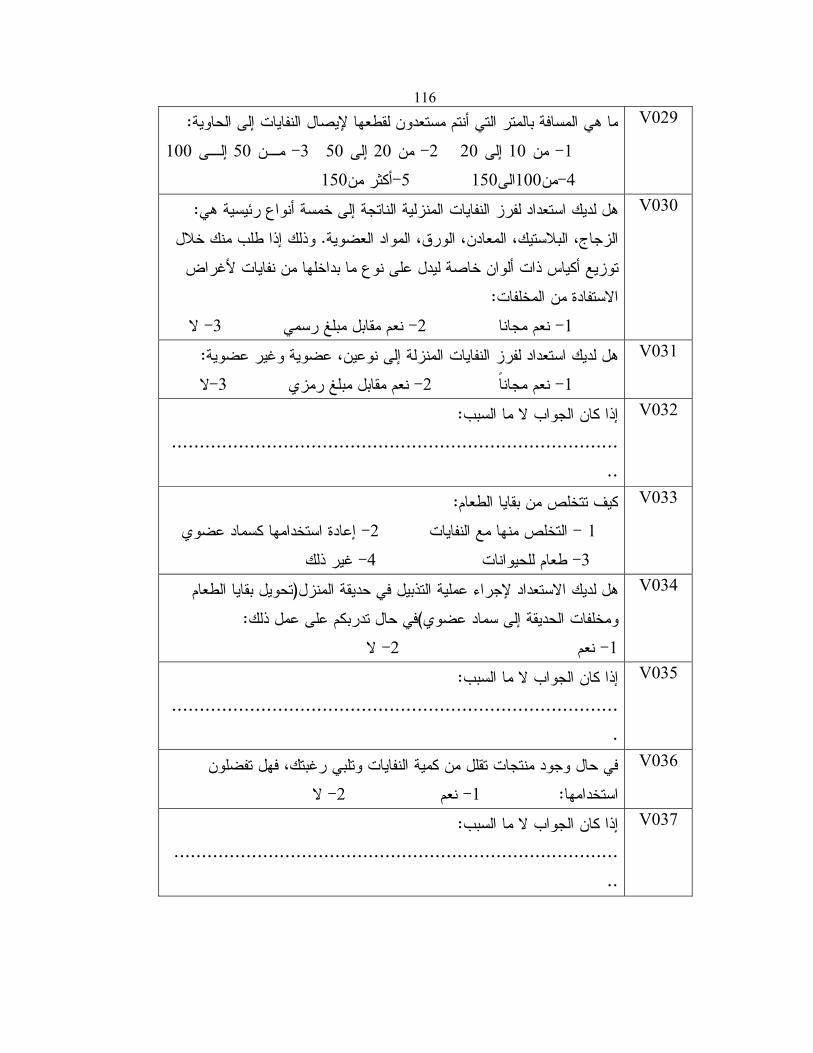
116V029 سافة بالمتر التي أنتم مستعدون لقطعها إليصال النفايات إلى الحاويةما هي الم:
100إلـى 50مـن -3 50إلى 20من -2 20إلى 10من -1
150أكثر من-5 150الى100من-4V030 هل لديك استعداد لفرز النفايات المنزلية الناتجة إلى خمسة أنواع رئيسية هي:
وذلك إذا طلب منك خالل . ج، البالستيك، المعادن، الورق، المواد العضويةالزجا
توزيع أكياس ذات ألوان خاصة ليدل على نوع ما بداخلها من نفايات ألغراض
:االستفادة من المخلفات
ال -3 نعم مقابل مبلغ رسمي -2 نعم مجانا -1V031 ات المنزلة إلى نوعين، عضوية وغير عضويةهل لديك استعداد لفرز النفاي:
ال-3 نعم مقابل مبلغ رمزي -2 نعم مجاناً -1V032 إذا كان الجواب ال ما السبب:
................................................................................
.. V033 كيف تتخلص من بقايا الطعام:
إعادة استخدامها كسماد عضوي -2 خلص منها مع النفايات الت - 1
غير ذلك -4 طعام للحيوانات -3 V034 تحويل بقايا الطعام (هل لديك االستعداد إلجراء عملية التذبيل في حديقة المنزل
: ذلكفي حال تدربكم على عمل )ومخلفات الحديقة إلى سماد عضوي
ال -2نعم -1V035 إذا كان الجواب ال ما السبب:
................................................................................
. V036 ون في حال وجود منتجات تقلل من كمية النفايات وتلبي رغبتك، فهل تفضل
ال - 2 نعم - 1 :استخدامهاV037 إذا كان الجواب ال ما السبب:
................................................................................
..
117
Appendix E
جامعة النجاح الوطنية
كلية الدراسات العليا
طالب جعفر عيد أقوم بعمل أطروحة بعنوان تطوير إدارة النفايات المنزلية فـي محافظـة أنا ال
قلقيلية آمل من حضرتكم التكرم باإلجابة بدقة وموضوعية عن فقرات االسـتبانة ألن اإلجابـات
الدقيقة لها أهمية كبيرة في عملية تطوير إدارة النفايات المنزلية في محافظة قلقيلية حيث ستعتمد
. ائج هذه الدراسة على رأيكم السديدنت
ولكم جزيل الشكر

118
: اسم التجمع السكاني
V001 قرية -2مدينة -1: نوع التجمع السكاني
V002 :..........................منصب المجيب على االستبانة هو
V003 ----------- جارية في التجمع السكاني هوعدد المحال الت
V004 ....................عدد المراكز الصحية في التجمع السكاني هو
ما هو معدل كمية النفايات الصلبة المجموعة في بلدتكم
طن....................................يوميا
V005
ــن ــات م ــة بالنفاي ــة الخاص ــبة الموازن ــغ نس ــم تبل ــة ك الموازن
................................. العامة؟
V006
س مقابـــل خدمـــة جمـــع النفايـــات كـــم يـــدفع النـــا
.............................................. ؟سنويا
V007
كيف يتم جمع هذه الرسوم؟
سنوياً - 2شهرياً مع رسوم الماء والكهرباء -1
غير ذلك -4بالنفايات فاتورة خاصة -3
V008
V009 ----------------- ما هي نسبة السكان الملتزمين بدفع التعرفة؟
هل تجدون عاملين بسهولة للعمل في قسم النفايات عند الحاجة
ال- 2نعم -1
V010
السبب؟ ال ما هو إذا كانت اإلجابة
..........................................................................
V011
هل يوجد محفزات للمواطنين الذين يدفعون رسوم النفايات في الموعد المحدد؟
ال -2نعم -1
V012
لنفايات؟هل رسوم الخدمة تغطي تكاليف قسم ا
ال -2 نعم -1
V013
V014 شهر\ شيقل......................كم يبلغ متوسط أجور عمال النفايات في بلدتكم
V015 -------------ما هو عدد اإلداريين المسئولين عن إدارة النفايات الصلبة؟
النفايات الصلبة الذي ترون أنه مناسب ما هو عدد اإلداريين المسئولين عن إدارة
---------------للقيام بالمهمات المطلوبة منهم على أتم وجه؟
V016
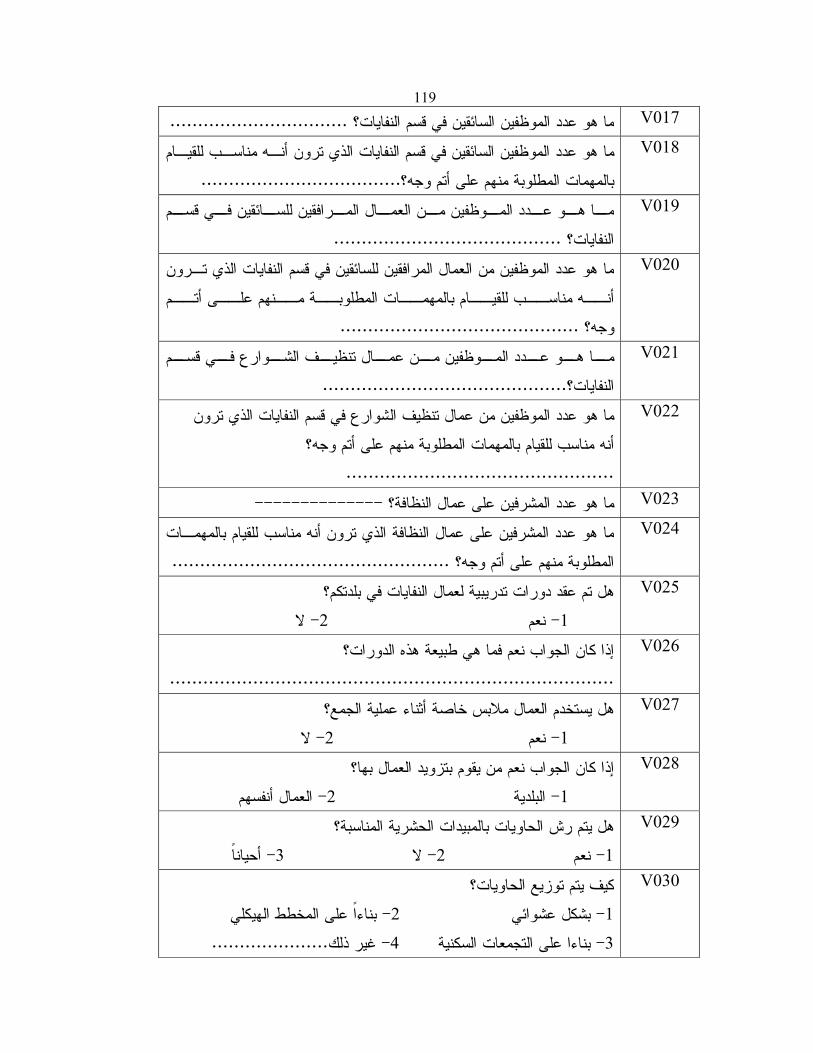
119
V017 ................................ ما هو عدد الموظفين السائقين في قسم النفايات؟
ما هو عدد الموظفين السائقين في قسم النفايات الذي ترون أنـه مناسـب للقيـام
....................................بالمهمات المطلوبة منهم على أتم وجه؟
V018
ســائقين فــي قســم مــا هــو عــدد المــوظفين مــن العمــال المــرافقين لل
......................................... النفايات؟
V019
الذي تـرون ما هو عدد الموظفين من العمال المرافقين للسائقين في قسم النفايات
مــنهم علــى أتــم أنــه مناســب للقيــام بالمهمــات المطلوبــة
........................................... وجه؟
V020
ــو ــف الش ــال تنظي ــن عم ــوظفين م ــدد الم ــو ع ــا ه ــم م ــي قس ارع ف
............................................النفايات؟
V021
شوارع في قسم النفايات الذي ترونما هو عدد الموظفين من عمال تنظيف ال
نهم على أتم وجه؟أنه مناسب للقيام بالمهمات المطلوبة م
................................................
V022
V023 --------------ما هو عدد المشرفين على عمال النظافة؟
أنه مناسب للقيام بالمهمـات ما هو عدد المشرفين على عمال النظافة الذي ترون
.................................................. المطلوبة منهم على أتم وجه؟
V024
هل تم عقد دورات تدريبية لعمال النفايات في بلدتكم؟
ال -2نعم -1
V025
رات؟إذا كان الجواب نعم فما هي طبيعة هذه الدو
................................................................................
V026
هل يستخدم العمال مالبس خاصة أثناء عملية الجمع؟
ال -2نعم -1
V027
إذا كان الجواب نعم من يقوم بتزويد العمال بها؟
العمال أنفسهم -2 البلدية -1
V028
هل يتم رش الحاويات بالمبيدات الحشرية المناسبة؟
أحياناً - 3 ال - 2 نعم -1
V029
كيف يتم توزيع الحاويات؟
بناءاً على المخطط الهيكلي -2 بشكل عشوائي -1
.....................غير ذلك -4بناءا على التجمعات السكنية -3
V030
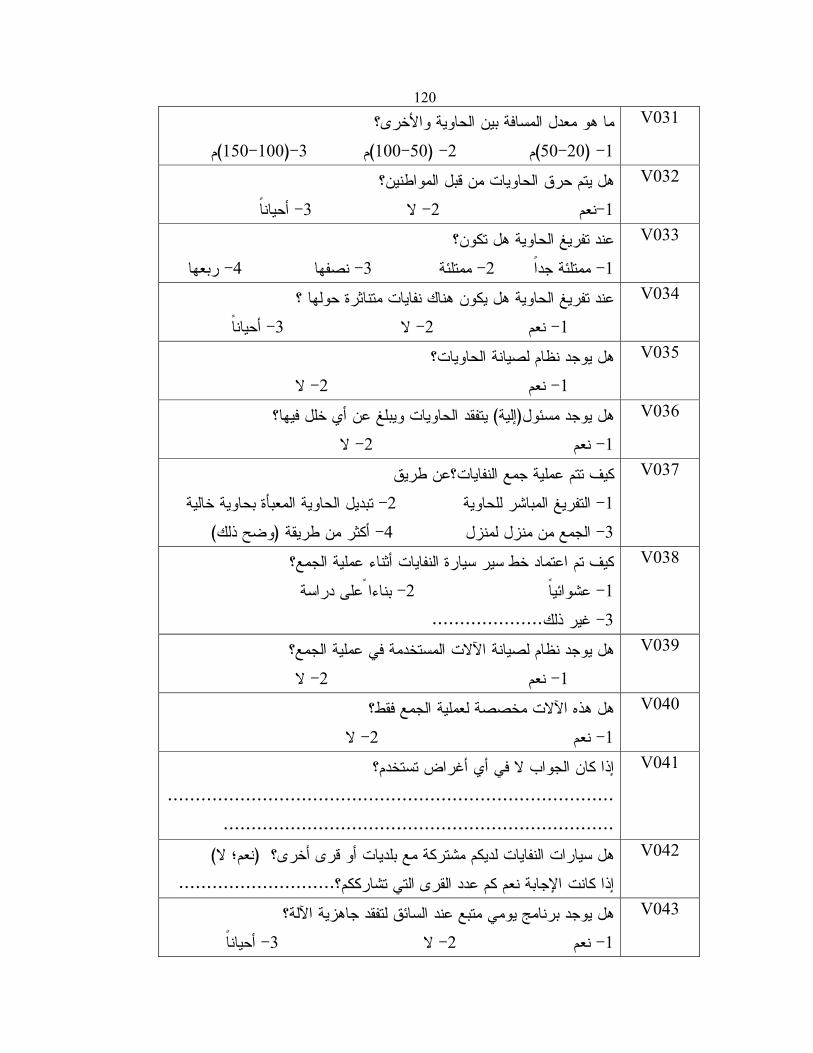
120
ما هو معدل المسافة بين الحاوية واألخرى؟
م)150-100(-3 م )100-50( -2م )20-50( -1
V031
هل يتم حرق الحاويات من قبل المواطنين؟
أحياناً -3 ال - 2نعم -1
V032
عند تفريغ الحاوية هل تكون؟
ربعها -4 نصفها -3 ممتلئة -2ئة جداً ممتل -1
V033
عند تفريغ الحاوية هل يكون هناك نفايات متناثرة حولها ؟
أحياناً -3ال -2نعم -1
V034
يوجد نظام لصيانة الحاويات؟ هل
ال -2نعم -1
V035
يتفقد الحاويات ويبلغ عن أي خلل فيها؟) إلية(هل يوجد مسئول
ال - 2نعم -1
V036
كيف تتم عملية جمع النفايات؟عن طريق
تبديل الحاوية المعبأة بحاوية خالية -2 التفريغ المباشر للحاوية -1
)وضح ذلك(أكثر من طريقة -4الجمع من منزل لمنزل -3
V037
كيف تم اعتماد خط سير سيارة النفايات أثناء عملية الجمع؟
بناءاً على دراسة -2 ئياً عشوا -1
....................غير ذلك -3
V038
هل يوجد نظام لصيانة اآلالت المستخدمة في عملية الجمع؟
ال -2نعم -1
V039
هل هذه اآلالت مخصصة لعملية الجمع فقط؟
ال - 2نعم -1
V040
إذا كان الجواب ال في أي أغراض تستخدم؟
................................................................................
......................................................................
V041
)نعم؛ ال(هل سيارات النفايات لديكم مشتركة مع بلديات أو قرى أخرى؟
............................ي تشارككم؟إذا كانت اإلجابة نعم كم عدد القرى الت
V042
هل يوجد برنامج يومي متبع عند السائق لتفقد جاهزية اآللة؟
أحياناً - 3ال -2 نعم -1
V043
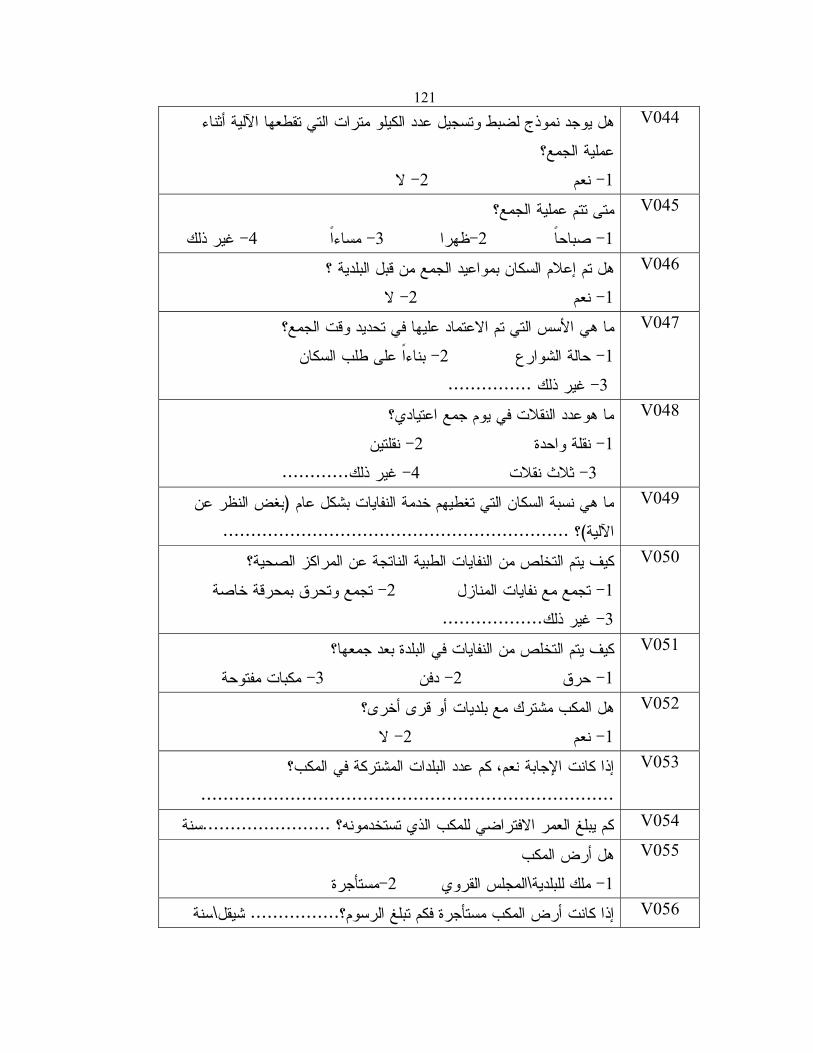
121
هل يوجد نموذج لضبط وتسجيل عدد الكيلو مترات التي تقطعها اآللية أثناء
عملية الجمع؟
ال - 2نعم -1
V044
متى تتم عملية الجمع؟
غير ذلك - 4مساءاً -3ظهرا - 2صباحاً -1
V045
هل تم إعالم السكان بمواعيد الجمع من قبل البلدية ؟
ال - 2نعم -1
V046
م االعتماد عليها في تحديد وقت الجمع؟ما هي األسس التي ت
بناءاً على طلب السكان - 2حالة الشوارع -1
............... غير ذلك -3
V047
ما هوعدد النقالت في يوم جمع اعتيادي؟
نقلتين - 2 نقلة واحدة -1
............غير ذلك - 4 ثالث نقالت - 3
V048
بغض النظر عن (ما هي نسبة السكان التي تغطيهم خدمة النفايات بشكل عام
.............................................................. ؟)اآللية
V049
كيف يتم التخلص من النفايات الطبية الناتجة عن المراكز الصحية؟
تجمع وتحرق بمحرقة خاصة -2زل تجمع مع نفايات المنا -1
..................غير ذلك -3
V050
كيف يتم التخلص من النفايات في البلدة بعد جمعها؟
مكبات مفتوحة - 3دفن -2حرق -1
V051
هل المكب مشترك مع بلديات أو قرى أخرى؟
ال - 2 نعم -1
V052
المكب؟ نعم، كم عدد البلدات المشتركة فيإذا كانت اإلجابة
..........................................................................
V053
V054 سنة....................... كم يبلغ العمر االفتراضي للمكب الذي تستخدمونه؟
هل أرض المكب
مستأجرة-2المجلس القروي \ملك للبلدية -1
V055
V056 سنة\شيقل ................إذا كانت أرض المكب مستأجرة فكم تبلغ الرسوم؟

122 المعدات
الحاويات
العدد الموجود حجم الحاويات
الياح
العدد المطلوب
الستكمال النقص
متر مكعب 1
متر مكعب 3
متر مكعب -----
متر مكعب -------
سيارات الجمع
حجم السيارة نوع السيارات
بالمتر المكعب
العدد الموجود
حاليا
العدد المطلوب
الستكمال النقص
شاحنة مفتوحة
شاحنة ضاغطةcompactor
تراكتور مع تروله
عربات يدوية
جامعة النجاح الوطنية
كلية الدراسات العليا
تقييم إدارة النفايات الصلبة في محافظة قلقيلية
إعداد
جعفر عبد القادر عبد الرزاق عيد
إشراف
حسان عرفات. د
عصام الخطيب. د
تطلبات درجة الماجستير فـي العلـوم البيئيـة بكليـة قدمت هذه األطروحة استكماال لم
.فلسطين, الدراسات العليا في جامعة النجاح الوطنية في نابلس2007
ب تقييم إدارة النفايات الصلبة في محافظة قلقيلية
إعداد
عيدعبد الرزاق جعفر عبد القادر
إشراف
حسان عرفات. د
عصام الخطيب. د
الملخص
التي تواجه السلطات المحليـة فـي والمواضيع والتحديات لتصف هذه الدراسة المشاك
تم بحث السبل الممكنة والحلول التي يمكن اتخاذهـا . محافظة قلقيلية في معالجة النفايات الصلبة
تـم ةتتكون هذه الدراسة من ثالثـة محـاور، اسـتبان . لتطوير خدمات معالجة النفايات الصلبة
استبيان ونقاش مع هيئات السـلطات المحليـة التـي شخص في المحافظة، 683توزيعها على
تشارك في معالجة النفايات، كما تم تحديد مكونات النفايات من خالل فصل ثالثين عينة أخـذت
توفر هـذه الدراسـة أيضـا . كذلك تم مراجعة الوثائق والمالحظات الميدانية. من خمسة مواقع
وسبل التخلص من النفايات في محافظـة معلومات حول خدمات جمع النفايات الصلبة المتوفرة
.قلقيلية
من الدراسة وجد بأن التأثيرات البيئية عند اختيار مواقع مكبات النفايـات لـم تعـر إال
إضافة إلى ذلك فـان . االهتمام القليل وفي بعض األحيان لم يتم إعارة هذا الموضوع أي اهتمام
مـن % 46.2من الدراسـة وجـد أن . مستمر مكبات النفايات ال يتم تفتيشها أو مراقبتها بشكل
السلطات المحلية تتخلص من النفايات في مكبات عشوائية ومفتوحة دون أي معالجة إضافية وأن
من السلطات المحلية تتخلص من النفايات في مناطق عشوائية ومفتوحة ومن ثـم يـتم % 15.4
النفايـات دون أي من السلطات المحلية توظف عماال في خـدمات جمـع % 100حرقها، وأن
تدريب وال يتم تدريبهم الحقا على كيفية القيام بعملهم وإنما يكتسبون الخبرة من خالل التجربـة
إن عمال الجمع . لذلك فإنهم عادة ما يتعرضون لمخاطر كبيرة. أو من خالل شركائهم في العمل
إضافة إلى ذلـك فـان بما في ذلك السيارة التي تجمع النفايات هي مشتركة بين أكثر من تجمع،
كذلك يتراوح عدد مرات جمع النفايات . عدد الحاويات المتوفرة في التجمعات السكانية قليلة جدا

ج
موقـع مـن 26إن معدل إنتاج الفرد يوميـا فـي . في بعض التجمعات مرتين أو أقل أسبوعيا
من % 83أكثر من إن النتائج التي تم الحصول عليها تشير إلى أن . كغم1.46محافظة قلقيلية هو
النفايات الصلبة يمكن أن يعاد تصنيعها أو استخدامها في عمل األسمدة، ولقد لوحظ بأن الميزانية
من السلطات المحلية % 42.3من الميزانية الكلية وأن % 9و % 3المخصصة للنفايات هي بين
و %3من السلطات تخصص ما بـين % 34.6من الميزانية الكلية وأن % 3تخصص أقل من
مـن % 9و % 6من هذه السلطات تخصص مـا بـين % 15.4من الميزانية العامة وأن % 6
.الميزانية الكلية للنفايات الصلبة
في هذه الدراسة تم استكشاف أهمية المشاركة المجتمعية في الوصول إلى نتـائج قيمـة
ن هـم علـى من السكا% 97. 3أظهرت النتائج أيضا بأن . ودائمة في معالجة النفايات الصلبة
مـن % 60.6استعداد ألن يدفعوا المزيد من النقود من أجل الحصول على خدمات أفضل وأن
السكان هم مستعدون ألن يفصلوا النفايات إلى نفايات عضوية وغير عضوية بدون مقابل فيمـا
% 71.6كما أظهرت هذه الدراسة بـأن . منهم استعداده للفصل مع قليل من المال% 18.6أبدى
. سكان هم على استعداد لتحويل النفايات العضوية إلى سماد طبيعي إذا ما تم تدريبهممن ال

113


![ABD [Autoguardado]](https://img.pdfslide.net/doc/110x75/577c81e41a28abe054ae9210/abd-autoguardado.jpg)