Embed Size (px)
Citation preview
Transportation Research Record 778
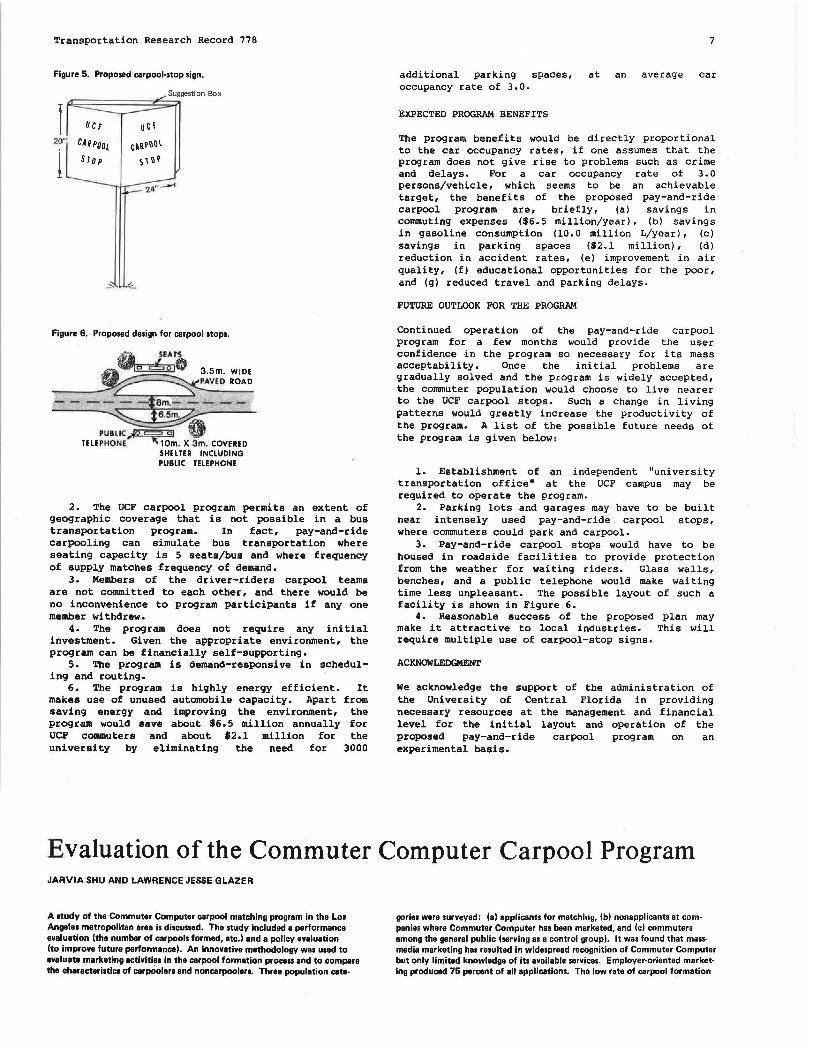
Figure 5. Proposed carpool-stop sign.
I ll CF uc!
20"' CARPOOL c~R~OOl
1 s, 0 ~
Figure 6. Proposed design for carpool stops.
~io 3.5m. WIDf 0
~PAVED ROAD
-------- - Sm.I- - - - -6.5m.
PUBLIC~ 0 TELEPHONE.~m. x 3m. COVERED
SHELTER INCLUDING PUBLIC TELEPHONE
2. The UCF carpool program permits an extent of geographic coverage that is not possible in a bus transportation program. In fact, pay-and-ride carpooling can simulate bus transportation where seating capacity is 5 seats/bus and where frequency of supply matches frequency of demand.
3. Members of the driver-riders carpool teams are not committed to each other, and there would be no inconvenience to program participants if any one member withdrew.
4. The program does not require any initial investment. Given the appropriate environment, the program can be financially self-supporting.
5. The program is demand-responsive in scheduling and routing.
6. The program is highly energy efficient. It makes use of unused automobile capacity. Apart from saving energy and improving the environment, the program would save about $6.5 million annually for UCF commuters and about $2.l million for the university by eliminating the need for 3000
additional parking spaces, occupancy rate of 3.0.
EXPECTED PROGRAM BENEFITS
7
at an average car
The program benefits would be directly proportional to the car occupancy rates, if one assumes that the program does not give rise to problems such as crime and delays. For a car occupancy rate of 3.0 persons/vehicle, which seems to be an achievable target, the benefits of the proposed pay-and-ride carpool program are, briefly, (a) savings in conunuting expenses ($6. 5 million/year), (bl savings in gasoline consumption (10.0 million L/year), (c) savings in parking spaces ($2. l million), (d) reduction in accident rates, (e) improvement in air quality, (f) educational opportunities for the poor, and (g) reduced travel and parking delays.
FUTURE OUTLOOK FOR THE PROGRAM
Continued operation of the pay-and-ride carpool program for a few months would provide the user confidence in the program so necessary for its mass acceptability. Once the initial problems are gradually solved and the program is widely accepted, the commuter population would choose to live nearer to the UCF carpool stops. Such a change in living patterns would greatly increase the productivity of the program. A list of the possible future needs of the program is given below:
l. Establishment of an independent "university transportation officew at the UCF campus may be required to operate the program.
2. Parking lots and garages may have to be built near intensely used pay-and-ride carpool stops, where commuters could park and carpool.
3. Pay-and-ride carpool stops would have to be housed in roadside facilities to provide protection from the weather for waiting riders. Glass walls, benches, and a public telephone would make waiting time less unpleasant. The possible layout of such a facility is shown in Figure 6.
4. Reasonable success of the proposed plan may make it attractive to local industries. This will require multiple use of carpool-stop signs.
ACKNOWLEDGMENT
We acknowledge the support of the administration of the University of Central Florida in providing necessary resources at the management and financial level for the initial layout and operation of the proposed pay-and-ride carpool program on an experimental basis.
Evaluation of the Commuter Computer Carpool Program JARVIA SHU AND LAWRENCE JESSE GLAZER
A study of the Commuter Computer carpool matching program in the Los Angeles metropolitan area is discussed. The study included a performance evaluation (the number of carpools formed, etc.) and a pollcy evaluation (to improve future performance). An innovative methodology was used to evaluate marketing activities in the carpool formation process and to compare the characteristics of carpoolers and noncarpoolen. Three population cata-
gories were surveyed: (a) applicants for matching, (bl nonapplicants at companies where Commuter Computer has been marketed, and (c) commuters among the general public (serving as a control group). It was found that massrnedia marketing has resulted in widespread recognition of Commuter Computer but only limited knowledge of its available services. Employer-oriented market· ing produced 75 percent of all applications. The low rate of carpool formation
8
(9 percent of all applicants) was found to be caused primarily by two factors: One-third of all applicants get empty match lists, end 60 percent of those who get lists with names never attempt to call anyone. There appears to be substan· tial "indirect" carpool formation among nonapplicants at companies that have been the target of successful marketing. The "average" Commuter Computer carpooler is a middle-aged, upper-middle-class, male professional from a house· hold in which automobile availability is almost 1 car/driver. The new technique of cost-effectiveness evaluation indicates that the program is much more cost· effective than most transportation programs.
This paper deals with the most comprehensive evaluation of carpooling done to date. The study had two purposes: an historical or performance evaluation (e.g., how many carpools were formed) and a policy evaluation (e.g., using survey data to identify changes in policies or procedures that might improve future performance). The full report (!) was written for three different audiences: (a) the management and staff of Commuter Transportation Services, Inc. (CTS); (b) transportation planning and funding agencies in the Los Angeles metropolitan area and in the state of California; and (c) the national audience, including federal and/or state transportation planning and ridesharing offices, other regional ridesharing organizations, and transportation researchers. This paper is organized to correspond to the chapters of that report.
DESCRIPTION OF SERVICE AREA
The greater Los Angeles metropolitan area, also known as the South Coast Air Basin, includes Los Angeles and Orange Counties and parts of Riverside, San Bernardino, and Ventura Counties. The area has a population of 10 million, spread over 9000 miles2 • Of these, almost 4.5 million are commuters, 90 percent of whom commute by automobile. About 96 percent of all employment is outside the Los Angeles central business district, which makes both origin and destination patterns of commuters quite diffuse. The nation's third-largest public transit operator is in Los Angeles, but the private automobile is still the dominant transportation mode, and 95 percent of all trips are made by private automobile.
DESCRIPTION OF COMMUTER COMPUTER
Computer Transportation Services, Inc.--also known as Commuter Computer (CC)--is a five-year-old nonprofit corporation that employs 62 people. In the past, Commuter Computer has concentrated on providing two ridesharing services: (a) carpool matching information and (b) marketing of third-party, multiple-employer vanpools. This paper focuses on the carpool matching program; the vanpool program is discussed in a paper by Valk elsewhere in this Record.
STUDY METHODOLOGY
Unlike previous carpool evaluation studies, the study described in this paper included surveys of three different population groups:
1. Applicants--all commuters who applied to Commuter Computer for regular carpool matching (as opposed to emergency-only matching, a separate service);
2. Nonapplicants--those commuters who work at companies where Commuter Computer has done marketing and promotion but who did not apply for regular carpool matching; and
3. The general public--all commuters in the Los Angeles area, excluding those who have applied for carpool matching.
Transportation Research Record 778
To eliminate the possibility of the nonresponse bias characteristic of mail-back surveys, all surveys were done by telephone interview. The sample sizes were 2516 for applicants, 55 for nonapplicants, and 56 for the general public.
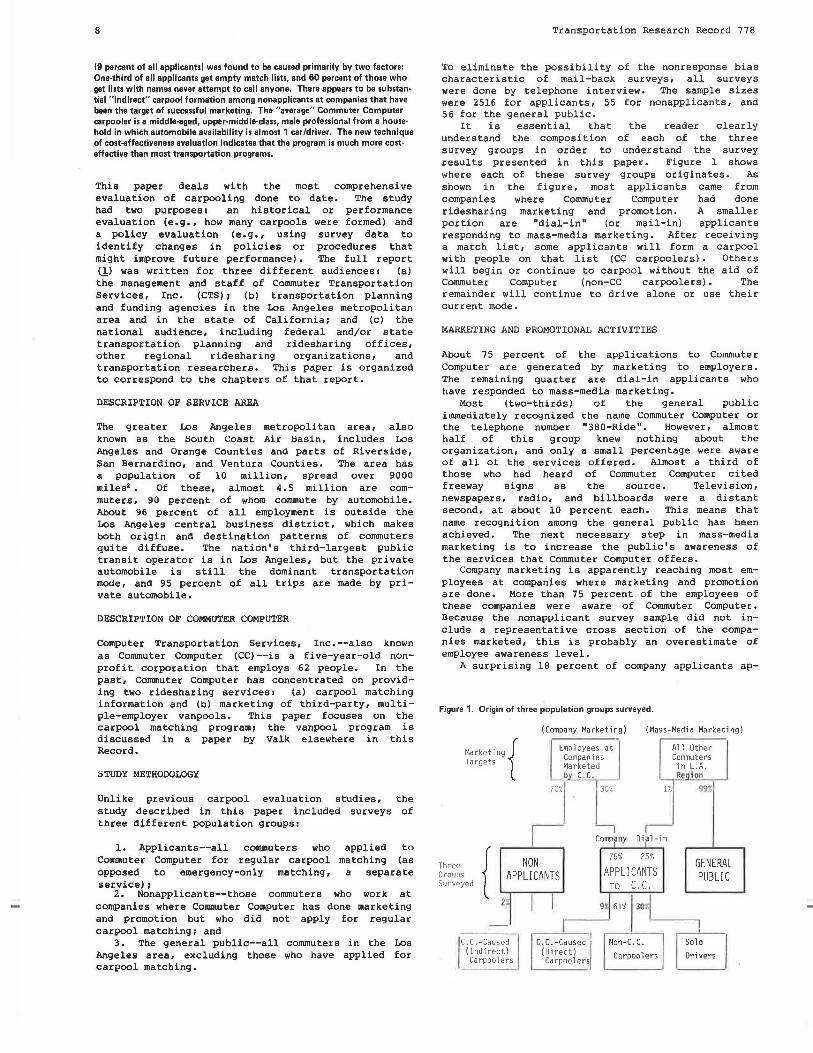
It is essential that the reader clearly understand the composition of each of the three survey groups in order to understand the survey results presented in this paper. Figure 1 shows where each of these survey groups originates. As shown in the figure, most applicants came from companies where Commuter Computer had done ridesharing marketing and promotion. A smaller portion are "dial-in" (or mail-in) applicants responding to mass-media marketing. After receiving a match list, some applicants will form a carpool with people on that list (CC carpoolers). Others will begin or continue to carpool without the aid of Commuter Computer (non-CC carpoolers). The remainder will continue to drive alone or use their current mode.
MARKETING AND PROMOTIONAL ACTIVITIES
About 75 percent of the applications to Commuter Computer are generated by marketing to employers. The remaining quarter are dial-in applicants who have responded to mass-media marketing.
Most (two-thirds) of the general public immediately recognized the name Commuter Computer or the telephone number "380-Ride". However, almost half of this group knew nothing about the organization, and only a small percentage were aware of all of the services offered. Almost a third of those who had heard of Commuter Computer cited freeway signs as the source. Television, newspapers, radio, and billboards were a distant second, at about 10 percent each. This means that name recognition among the general public has been achieved. The next necessary step in mass-media marketing is to increase the public's awareness of the services that Commuter Computer offers.
Company marketing is apparently reaching most employees at companies where marketing and promotion are done. More than 75 percent of the employees of these companies were aware of Commuter Computer. Because the nonapplicant survey sample did not include a representative cross section of the companies marketed, this is probably an overestimate of employee awareness level.
A surprising 18 percent of company applicants ap-
Figure 1. Origin of three population groups surveyed.
Marketing { Targets
(Company Marketing)
Emp 1 oyees at Companies Marketed b c. c.
70%
Comp ny
(Mass-Medi a Marketing)
A 11 Other I Commuters
in L.A.
JI Three Groups Surveyed {
NON-APPLICANTS
Dial-in j ,.....-----~...,
75% 25%
APPL! CANTS TO C,C,
GEMER.l\L PUBLIC
r----9-'% 61% )30~~
IC. C. -Caused
(Indirect) Carpool ers
~---- -~--C.C.-Caused (Di re ct) Carpoolers
Non-C. C.
Carpoolers
Solo
Ori vers
Transportation Research Record 778
plied for carpool matching because of employer pressure. This might be attributable to the former policy of using "number of applications" as a measure of effectiveness for the marketing staff (or to other possible reasons). Contact with these nonserious applicants is probably discouraging for applicants who call them looking for carpool partners. such applicants are thus counterproductive.
If one looks at dial-in and company applicants together, a substantial majority were satisfied with the service they received. Even though it took more than four weeks to receive their match lists, almost two-thirds of all applicants did not feel that it took too long, and only 18 percent felt that it did take too long.
CARPOOL FORMATION PROCESS
About 26 percent of company applicants, versus 44 percent of dial-in applicants, said that the match list they received had no names. Company applicants also got better lists: They reported an average of five names per list, whereas dial-in applicants reported three names per list. (The difference is attributable to the greater commonality of travel patterns that results when co-workers are simultaneously applying for matching.) According to Commuter Computer records, the actual number of names on match lists is almost double what these people reported.
More than 60 percent of the applicants who received lists with names did not attempt to call anyone on their match list. Dial-in applicants were more motivated than company applicantsi only half of the dial-ins did not use their list, whereas 65 percent of the company applicants did not use theirs. Seventy-five percent of those who did not use their match list said that they would not have used it even if they had received it more promptly. About 20 percent of the applicants who did not use their lists said that they would have used the list if Commuter Computer had provided some help in organizing the carpool, such as calling people or arranging meetings.
Of all applicants, about 9 percent used their match list to form or join a carpool (this is called the "di r ect" carpool formation rate) . Surprisingly, there was no sig nificant difference bet ween dial-in and company applicants in the direct carpool formation rate. It appears that the higher motivation of dial-ins is canceled out by the poorer-quality lists they get because of their more dispersed travel patterns. Thus, dial-in applicants do not produce any higher "ridesharing payoff" than company applicants.
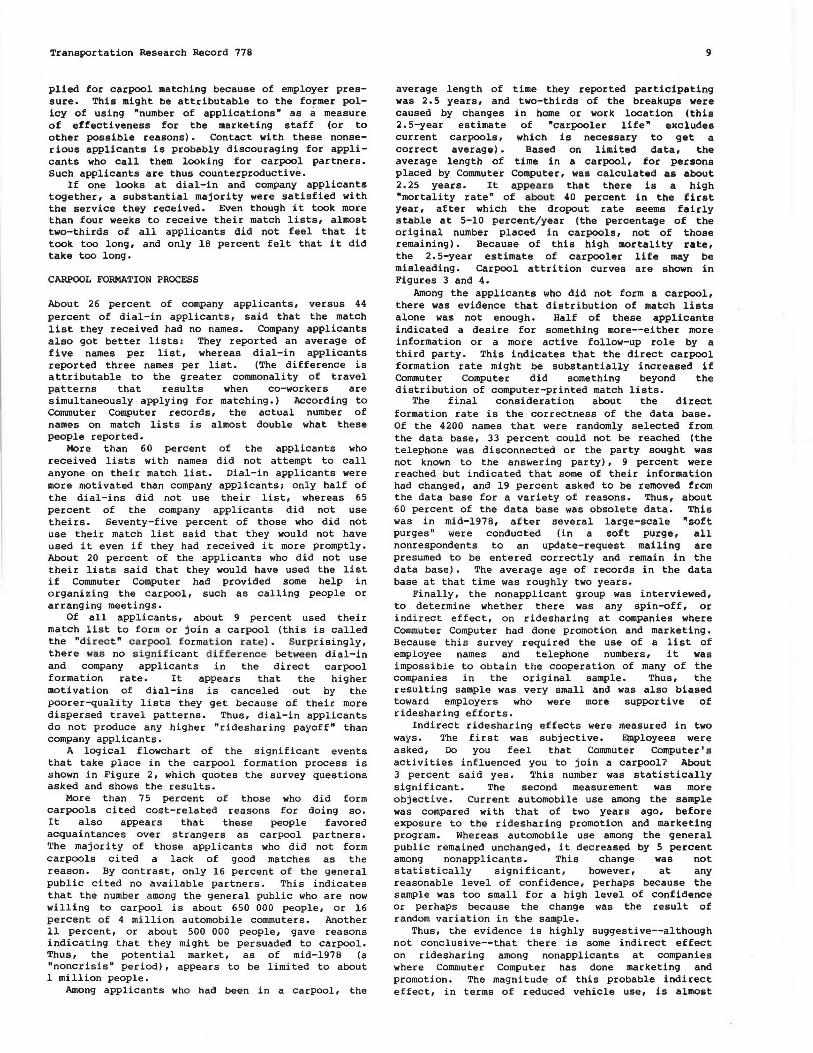
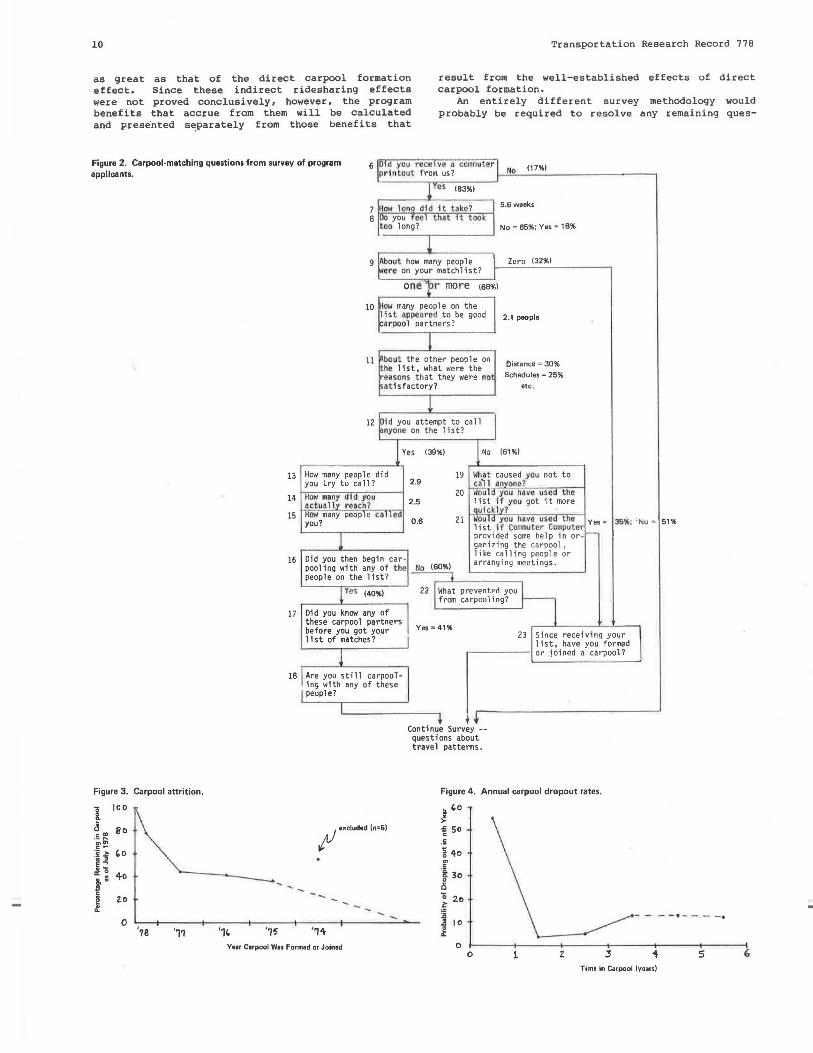
A logical flowchart of the significant events that take place in the carpool formation process is shown in Figure 2, which quotes the survey questions asked and shows the results.
More than 75 percent of those who did form carpools cited cost-related reasons for doing so. It also appears that these people favored acquaintances over strangers as carpool partners. The majority of those applicants who did not form carpools cited a lack of good matches as the reason. By contrast, only 16 percent of the general public cited no available partners . This indicates that the number among the general public who are now willing to carpool is about 650 000 people, or 16 percent of 4 million automobile commuters. Another 11 percent, or about 500 000 people, gave reasons indicating that they might be persuaded to carpool. Thus, the potential market, as of mid-1978 (a "noncrisis" period), appears to be limited to about 1 million people.
Among applicants who had been in a carpool, the
9
average length of time they reported participating was 2.5 years, and two-thirds of the breakups were caused by changes in home or work location (this 2. 5-year estimate of "carpooler life" excludes current carpools, which is necessary to get a correct average). Based on limited data, the average length of time in a carpool, for persons placed by Commuter Computer, was calculated as about 2.25 years. It appears that there is a high "mortality rate" of about 40 percent in the first year, after which the dropout rate seems fairly stable at 5-10 percent/year (the percentage of the original number placed in carpools, not of those remaining) • Because of this high mortality rate, the 2.5-year estimate of carpooler life may be misleading. Carpool attrition curves are shown in Figures 3 and 4.
Among the applicants who did not form a carpool, there was evidence that distribution of match lists alone was not enough. Half of these applicants indicated a desire for something more--ei ther more information or a more active follow-up role by a third party. This indicates that the direct carpool formation rate might be substantially increased if Commuter Computer did something beyond the distribution of computer-printed match lists.
The final consideration about the direct formation rate is the correctness of the data base. Of the 4200 names that were randomly selected from the data base, 33 percent could not be reached (the telephone was disconnected or the party sought was not known to the answering party), 9 percent were reached but indicated that some of their information had changed, and 19 percent asked to be removed from the data base for a variety of reasons. Thus, about 60 percent of the data base was obsolete data. This was in mid-1978, after several large-scale "soft purges" were conducted (in a soft purge, all nonrespondents to an update-request mailing are presumed to be entered correctly and remain in the data base) • The average age of records in the data base at that time was roughly two years.
Finally, the nooapplicant group was interviewed, to determine whether there was any spin-off, or indirect effect, on ridesharing at companies where Commuter Computer had done promotion and marketing. Because this survey required the use of a list of employee names and telephone numbers, it was impossible to obtain the cooperation of many of the companies in the orig i nal sample. Thus, the resulting sample was very small and was also biased toward employers who were more supportive of ridesharing efforts.
Indirect ridesharing effects were measured in two ways. The first was subjective. Employees were asked, Do you feel that Commuter Computer's activities influenced you to join a carpool? About 3 percent said yes. This number was statistically significant. The second measurement was more objective. Current automobile use among the sample was compared with that of two years ago, before exposure to the ridesharing promotion and marketing program. Whereas automobile use among the general public remained unchanged, it decreased by 5 percent among nonapplicants. This change was not statistically significant, however, at any reasonable level of confidence, perhaps because the sample was too small for a high level of confidence or perhaps because the change was the result of random variation in the sample.
Thus, the evidence is highly suggestive--although not conclusive--that there is some indirect effect on ridesharing among nonapplicants at companies where Commuter Computer has done marketing and promotion. The magnitude of this probable indirect effect, in terms of reduced vehicle use, is almost
10 Transportation Research Record 778
as great as that of the direct carpool formation effect. Since these indirect ridesharing effects were not proved conclusively, however, the program benefits that accrue from them will be calculated and presented s~parately from those benefits that
result from the well-established effects of direct carpool formation.
An entirely different survey methodology would probably be required to resolve any remaining ques-
Figure 2. Carpool-matching questions from survey of program applicants.
6 you rccc ve a comQuter 117%1 prin tou t from us? ._r,,,io"-------------~
Figure 3. Carpool attrition.
I IOD
a Bo c .. ·-" ~~ :i ~ .. 'D ~= a: ~ 40 s,•
" c ~ Zo ~
0 '1s .,,
13
14
15
9
r more 168%!
10
11 bout the other people on he list, what were the easons that they were no atisfactory?
12 i d you attempt t o ca 11 nyone on the l ist?
5.6 weeks
No= 65%; Yes • 18%
Zero (32%1
2.1 people
Distance = 30%
Schedules • 25%
etc.
Yes 139%1 No 161%1
2.9
2.5
19
20
0 .6 21
to
ou you ave use e Yes . list H C~ter Computer provided some help in or · ganizing the carpool,
16 Did you then begin car · pooling with any of t he people on the list?
tic (60%1
like calling peop l e or ar ranging meetings.
Yes (40%1 22 What prevented you from carpooling?
Yes~41%
35%; 'No= 51%
17 Did you know any of these carpool partners before you got your list of matches? 23 Since receiving your
list, have you formed or joined a carpool?
18 Are you still carpool· c i ng w1th any of these
I people?
I ,____________,~ __,
I excluded ln•51
Continue Survey •• questions about travel patterns.
Figure 4. Annual carpool dropout rates.
-,0 ; ~so .: ~ 4o .. c "ii: 30 ~ b 2o -~ ] .3 ID - - - -·-- - -·
'14 ''l'I- ~ 0 Year Carpool Was Formed or Joined
0 1. z 5 Time in Carpool (years)
Transportation Research Record 778
Table 1. Comparison of Applicants
commuter characteristics.
cc Characteristic Carpools
Travel Number in carpool 2.9 Relationship Co-worker Newly formed carpools(%) 66 Five days per week (%) 80 Alternative mode Drive alone Alternate driving(%) 75 Distance (miles)
Pickup I Drop-0ff 0.25 To work 23 Avg to meeting point 1
Picked up at home(%) 65 Use of vehicle left at home
(%) 15 Trips per day 1.3 Miles per day 12
Avg time in present carpool (months) 22
Prior mode single-0ccupant vehicle (%) 72
Demographics Ratio of automobile availability 0.92 Respondent characteristics
Avg age (years) 42 Male(%) 73 College graduate(%) 50 Executive-management-
professional (%) 50 Avg household income
($000/year) 25 Time at present job
location (years) Currently driving single-
occupant vehicle(%) Attitudes
No dislike of carpooling (%) 60
Strong satisfaction with carpool(%) 86
Reason for not carpooling (%)
No matches Irregular hours Live close to work Need car for work Need car for nonwork Reduced privacy Desire independence
Ever in carpool (%yes) How long in carpool (years) Reason for leaving carpool
Reason for carpooling(%) Monetary 58 Nonmonetary 36
8 From Valk (elsewhere in this Record) .
Table 2. Results of cost-effectiveness analysis of carpool program.
Assigned Cost
Program Objective Amount($) Percent
Reduce energy consumption 174 000 20
Reduce air, pollution 174 000 20
Reduce commuter 174 000 20 costs
Reduce traffic congestion 87 000 10
Reduce parking demand 87 000 10
Improve commuter mobility 87 000 10
Other 87 000 10 870 000
Measure of Effectiveness•
2 million gal
2.8 million lb $3.8 million saved
Unknown
3100 spaces
Unknown Unknown
CostEffectiveness
$0.087/gal
$0.062/lb $0.046/
dollar saved
Unknown
$28/space
Unknown Unkn own
8 Based on direct carpool formation only. If indirect ridesharing effects were also included , these measures would improve by about 70 percent , as would the cost-effectiveness f igures.
11
Non.{;C Solo Non- General cc Carpools Drivers applicants Publi c Vanpools3
2.8 Co-worker 75 78 Drive alone 75
1 0.25 22 4 .5 62
16 1.5 16
31
67
0 .94
42 66 47
47
25
61
87
61 35
19 14 12 36 -2.5 20
-15 I 19
37
0.94 0 .95 0 .97b
42 45 35 64 59 75 50 50 50
50 75
23 16b 33
IO
75 75
70
58 8 16 22 43 24 4 15 26 2 0 16 2 8 3 I 5 3 4 5 3 45 21< 30< 2 Changed home or
work hours (7 5 percent)
25 75
bFrom Davis (;!J . cPast two years.
tions about effects.
the magnitude of indirect ridesharing
!
COMMUTER CHARACTERISTICS
As described earlier, surveys were conducted of three commuter groups: applicants, nonapplicants, and the general public. The characteristics of applicants to Commuter Computer were studied in the greatest detail. About 75 percent of the registrations to Commuter Computer are generated by marketing among employers. The majority of these are large firms that often employ a substantial number of professional and technical people.
Travel Characteristics
Almost 75 percent of formerly drove alone. carpool consists of
Commuter Computer carpoolers The average ·Commuter Computer 2.9 persons, and about 80
12
percent of all carpool partners are co-workers. Two-thirds of these carpoolers formed a new carpool, and more than 40 percent knew some or all of their partners before forming the carpool. More than 75 percent of them carpool 5 days/week and alternate driving. The average distance to work is 23 miles, plus one mile for pickup and drop-off. By comparison, the average trip length of all Los Angeles area commuters is about 10 miles. Only 20 percent of the vehicles left at home are being used to make new trips during the day.
Demographic Character istics
The average automobile availability among households of Commuter Computer carpoolers is 0.92 vehicle/ licensed driver, compared with O. 97 vehicle/driver for the Los Angeles region. Three-fourths of all of these households had two or more vehicles available. This means that most Commuter Computer carpoolers choose to carpool, since they do have the drive-alone alternative. Although there was considerable diversity in personal characteristics, the average Commuter Computer carpooler can be portrayed as a 42-year-old male who has a college education, is employed in a "professional" capacity within a large organization, and has an an·nual household income around $25 000.
Attitudinal Characteristics
About 60 percent of all carpoolers cited no dislikes about carpooling, and 86 percent indicated strong satisfaction with their present carpool. Of the specific dislikes mentioned, most were related to the theme of "reduced personal independence". Only 2 percent cited lack of privacy. Thus, although most people say that they joined a carpool for cost-related reasons, they are finding this commuting mode quite satisfactory.
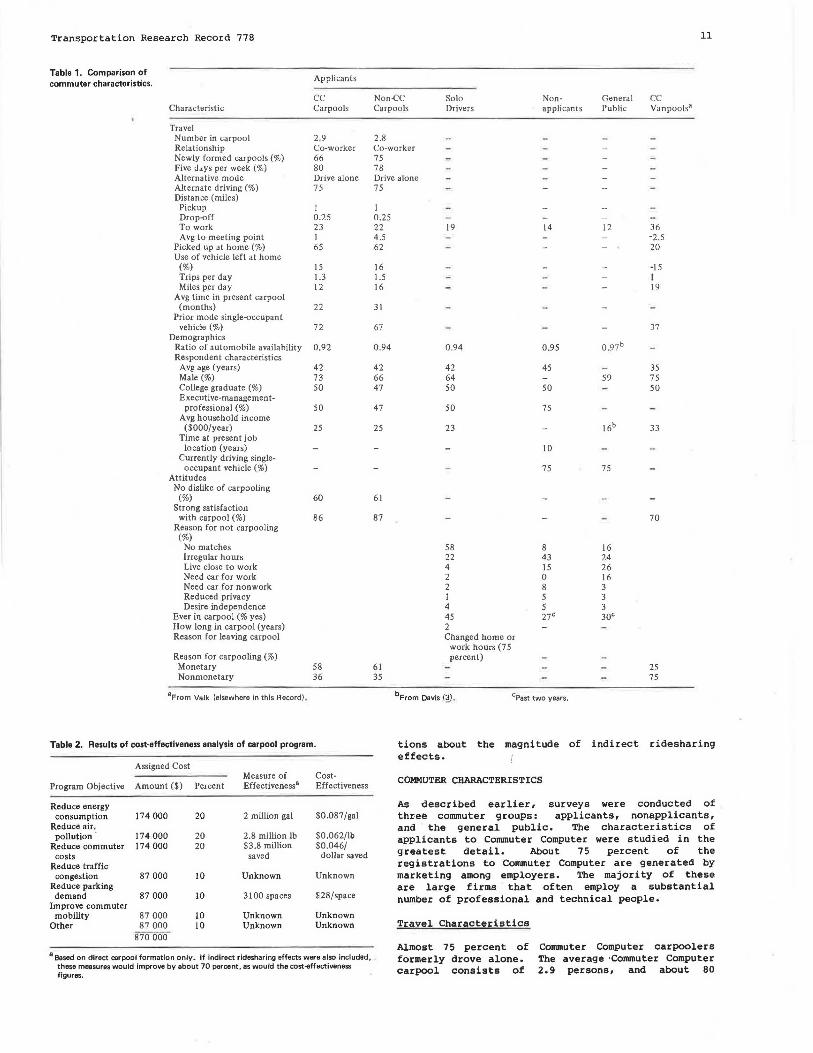
The evaluation study also examined the characteristics of other groups of commuters, including nonapplicants and the general public . Table l summarizes the more important findings about these survey groups.
PROGRAM COSTS AND BENEFITS
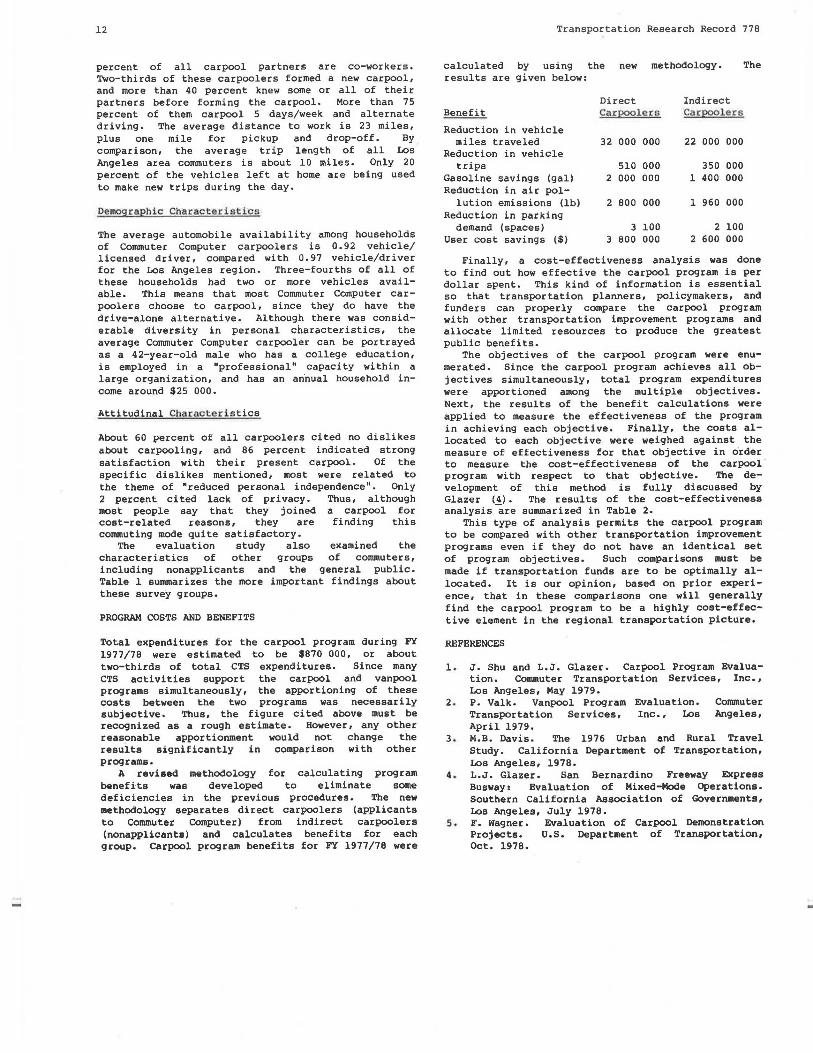
Total expenditures for the carpool program during FY 1977/78 were estimated to be $870 000, or about two-thirds of total CTS expenditures. Since many CTS activities support the carpool and vanpool programs simultaneously, the apportioning of these costs between the two programs was necessarily subjective. Thus, the figure cited above must be recognized as a rough estimate. However, any other reasonable apportionment would not change the results significantly in comparison with other programs.
A revised methodology for calculating program benefits was developed to eliminate some deficiencies in the previous procedures. The new methodology separates direct carpoolers (applicants to Commuter Computer) from indirect carpoolers (nonapplicants) and calculates benefits for each group. Carpool program benefits for FY 1977/78 were
Transportation Research Record 778
calculated by using the new methodology. The results are given below:
Direct Indirect Benefit CarEQolers CarEQ2lers
Reduction in vehicle miles traveled 32 000 000 22 000 000
Reduction in vehicle trips 510 000 350 000
Gasoline savings (gall 2 000 000 l 400 000 Reduction in air pol-
lution emissions (lb) 2 800 000 l 960 000 Reduction in parking
demand (spaces) 3 100 2 100 User cost savings ($) 3 800 000 2 600 000
Finally, a cost-effectiveness analysis was done to find out how effective the carpool program is per dollar spent. This kind of information is essential so that transportation planners, policymakers, and funders can properly compare the carpool program with other transportation improvement programs and allocate limited resources to produce the greatest public benefits.
The objectives of the carpool program were enumerated. Since the carpool program achieves all objectives simultaneously, total program expenditures were apportioned among the multiple objectives. Next, the results of the benefit calculations were applied to measure the effectiveness of the program in achieving each objective. Finally, the costs allocated to each objective were weighed against the measure of effectiveness for that objective in o·rder to measure the cost-effectiveness of the carpool program with respect to that objective. The development of this method is fully discussed by Glazer (4). The results of the cost-effectiveness analysis are summarized in Table 2.
This type of analysis permits the carpool program to be compared with other transportation improvement programs even if they do not have an identical set of program objectives. Such comparisons must be made if transportation funds are to be optimally allocated. It is our opinion, based on prior experience, that in these comparisons one will generally find the carpool program to be a highly cost-effective element in the regional transportation picture.
REFERENCES
l. J. Shu and L.J. Glazer. Carpool Program Evaluation. Commuter Transportation Services, Inc., Los Angeles, May 1979.
2. P. Valk. Vanpool Program Evaluation. Commuter Transportation Services, Inc., Los Angeles, April 1979.
3. M.B. Davis. The 1976 Urban and Rural Travel Study. California Department of Transportation, Los Angeles, 1978.
4. L.J. Glazer. San Bernardino Freeway Express Busway: Evaluation of Mixed-Mode Operations. Southern California Association of Governments, Los Angeles, July 1978.
5. F. Wagner. Evaluation of Carpool Demonstration Projects. U.S. Department of Transportation, Oct. 1978.