Embed Size (px)
Citation preview
Evaluation of the Effect of Road Condition on the Quality of Agricultural Produce
Phase 2 Report
A Bradbury, J Hine, P Njenga, A Otto, G Muhia, S Willilo
TRL Limited, IFRTD
RAF2109A
September 2017
Evaluation of the Effect of Road Condition on the Quality of Agricultural Produce – Phase 2 Report
Page 2
The views in this document are those of the authors and they do not necessarily reflect the views of the Research for Community Access Partnership (ReCAP), TRL Limited or Cardno Emerging Markets (UK) Ltd for whom the document was prepared.
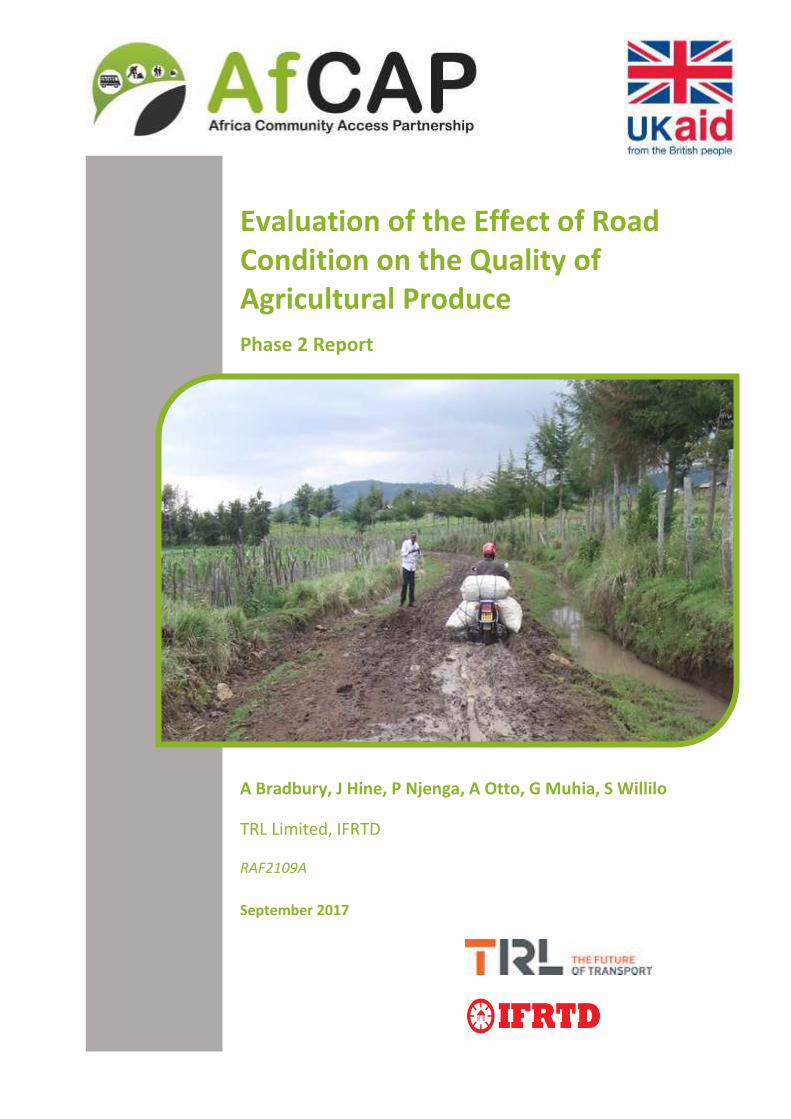
Cover Photo: Grace Muhia – Kenya 2016
Quality assurance and review table
Version Author(s) Reviewer(s) Date
1 A Bradbury, J Hine, P Njenga, A Otto
R Workman
J R Cook, L Sampson 25 August 2017
1.1 J Hine, P Njenga, A Otto, R Workman
G Morosiuk, R Workman 2/10/2017
ReCAP Project Management Unit Cardno Emerging Market (UK) Ltd Oxford House, Oxford Road Thame OX9 2AH United Kingdom
Evaluation of the Effect of Road Condition on the Quality of Agricultural Produce – Phase 2 Report
Page 3
AfCAP Inception Report Template
AfCAP Database Details: [Project Title]
Reference No: RAF2109A Location Kenya and Tanzania
Source of Proposal TRL Procurement
Method
Open Tender
Theme Transport Services Sub-Theme First Mile Access and Marketing
Lead
Implementation
Organisation
TRL Partner
Organisation
IFRTD
Total Approved
Budget
£389,975 Total Used
Budget
£97,493.75
Start Date 24th
April 2017 End Date 28th
February 2018
Report Due Date 31st
July 2017 Date Received
Abstract TRL Limited and the International Forum for Rural Transport and Development (IFRTD) have been commissioned by the DFID funded Research for Community Access Partnership (ReCAP) to deliver a project on the Evaluation of the Effect of Road Condition on the Quality of Agricultural Produce.
The project is concerned with the cost-beneficial improvement of ‘First Mile’ access and the transport services associated with transferring harvest produce on the initial stages of movement from the farm to established road access. The research project will conduct fieldwork in Tanzania and Kenya to explore transport service and engineering solutions for the provision of improved access to markets for small scale farmers. The Phase 2 Report provides a comprehensive literature review covering five key themes around First Mile access and the effect of road condition on agricultural marketing. It provides feedback from two stakeholder workshops conducted in Tanzania and Kenya in July 2017, and explains the rationale for selection of two research sites in each country, providing a detailed description of each site against selection criteria. The report sets out the next steps for data collection in Phase 3 and the mixed methods approach to fieldwork comprising questionnaire surveys, key informant interviews and focus group discussions.
Evaluation of the Effect of Road Condition on the Quality of Agricultural Produce – Phase 2 Report
Page 4
Key words Rural, Roads, Transport, Agriculture, Markets, Poverty, Food security, First Mile, Small-scale farming
AFRICA COMMUNITY ACCESS PARTNERSHIP (AsCAP)
Safe and sustainable transport for rural communities
AfCAP is a research programme, funded by UK Aid, with the aim of promoting safe and sustainable transport for rural communities in Africa. The AfCAP
partnership supports knowledge sharing between participating countries in order to enhance the uptake of low cost, proven solutions for rural access
that maximise the use of local resources. The programme follows on from the AFCAP1 programme that ran from 2008 to 2014. AfCAP is brought together
with the Asia Community Access Partnership (AsCAP) under the Research for Community Access Partnership (ReCAP), managed by Cardno Emerging
Markets (UK) Ltd. See www.research4cap.org
Evaluation of the Effect of Road Condition on the Quality of Agricultural Produce – Phase 2 Report
Page 5
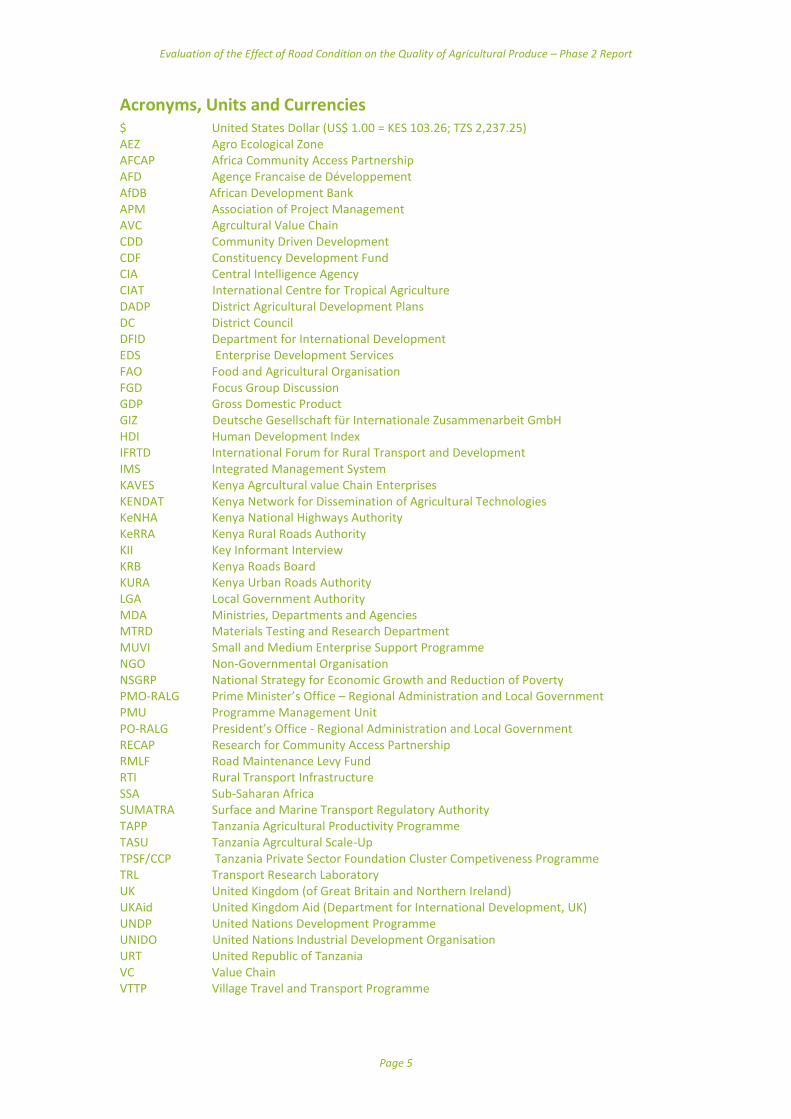
Acronyms, Units and Currencies $ United States Dollar (US$ 1.00 = KES 103.26; TZS 2,237.25) AEZ Agro Ecological Zone AFCAP Africa Community Access Partnership AFD Agençe Francaise de Développement AfDB African Development Bank APM Association of Project Management AVC Agrcultural Value Chain CDD Community Driven Development CDF Constituency Development Fund CIA Central Intelligence Agency CIAT International Centre for Tropical Agriculture DADP District Agricultural Development Plans DC District Council DFID Department for International Development EDS Enterprise Development Services FAO Food and Agricultural Organisation FGD Focus Group Discussion GDP Gross Domestic Product GIZ Deutsche Gesellschaft für Internationale Zusammenarbeit GmbH HDI Human Development Index IFRTD International Forum for Rural Transport and Development IMS Integrated Management System KAVES Kenya Agrcultural value Chain Enterprises KENDAT Kenya Network for Dissemination of Agricultural Technologies KeNHA Kenya National Highways Authority KeRRA Kenya Rural Roads Authority KII Key Informant Interview KRB Kenya Roads Board KURA Kenya Urban Roads Authority LGA Local Government Authority MDA Ministries, Departments and Agencies MTRD Materials Testing and Research Department MUVI Small and Medium Enterprise Support Programme NGO Non-Governmental Organisation NSGRP National Strategy for Economic Growth and Reduction of Poverty PMO-RALG Prime Minister’s Office – Regional Administration and Local Government PMU Programme Management Unit PO-RALG President’s Office - Regional Administration and Local Government RECAP Research for Community Access Partnership RMLF Road Maintenance Levy Fund RTI Rural Transport Infrastructure SSA Sub-Saharan Africa SUMATRA Surface and Marine Transport Regulatory Authority TAPP Tanzania Agricultural Productivity Programme TASU Tanzania Agrcultural Scale-Up TPSF/CCP Tanzania Private Sector Foundation Cluster Competiveness Programme TRL Transport Research Laboratory UK United Kingdom (of Great Britain and Northern Ireland) UKAid United Kingdom Aid (Department for International Development, UK) UNDP United Nations Development Programme UNIDO United Nations Industrial Development Organisation URT United Republic of Tanzania VC Value Chain VTTP Village Travel and Transport Programme
Evaluation of the Effect of Road Condition on the Quality of Agricultural Produce – Phase 2 Report
Page 6
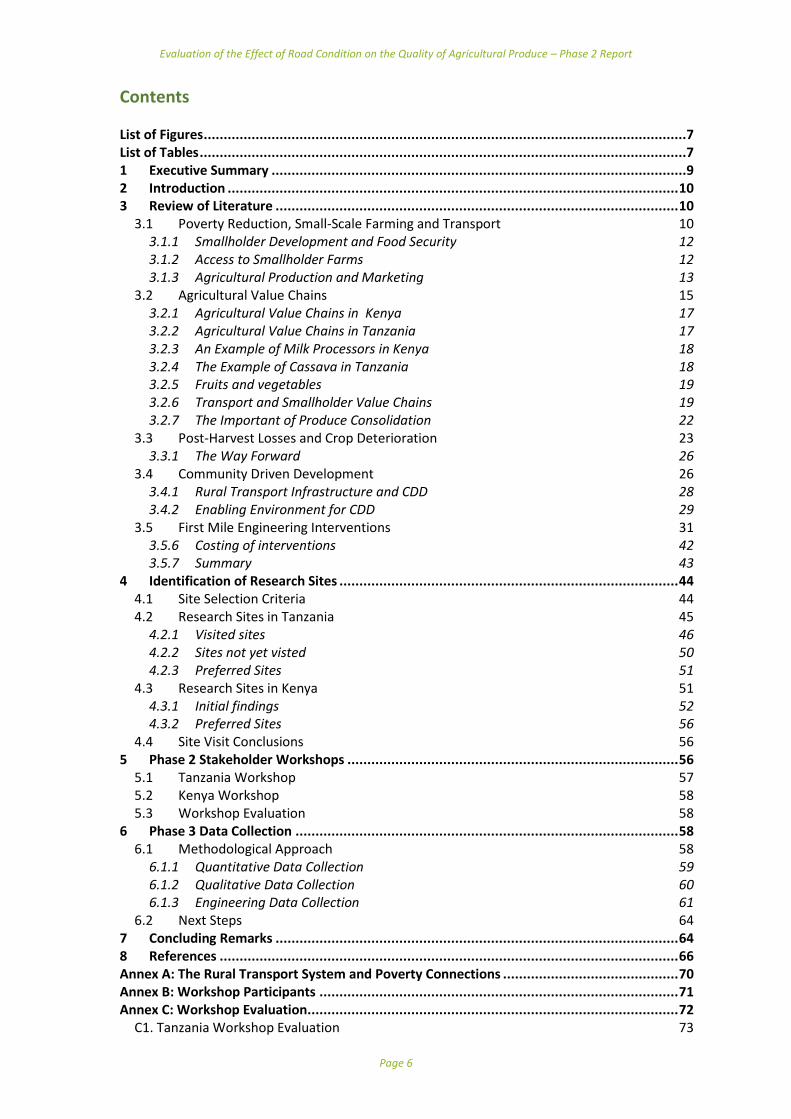
Contents List of Figures .........................................................................................................................7 List of Tables ..........................................................................................................................7 1 Executive Summary ........................................................................................................9 2 Introduction ................................................................................................................. 10 3 Review of Literature ..................................................................................................... 10
3.1 Poverty Reduction, Small-Scale Farming and Transport 10 3.1.1 Smallholder Development and Food Security 12 3.1.2 Access to Smallholder Farms 12 3.1.3 Agricultural Production and Marketing 13
3.2 Agricultural Value Chains 15 3.2.1 Agricultural Value Chains in Kenya 17 3.2.2 Agricultural Value Chains in Tanzania 17 3.2.3 An Example of Milk Processors in Kenya 18 3.2.4 The Example of Cassava in Tanzania 18 3.2.5 Fruits and vegetables 19 3.2.6 Transport and Smallholder Value Chains 19 3.2.7 The Important of Produce Consolidation 22
3.3 Post-Harvest Losses and Crop Deterioration 23 3.3.1 The Way Forward 26
3.4 Community Driven Development 26 3.4.1 Rural Transport Infrastructure and CDD 28 3.4.2 Enabling Environment for CDD 29
3.5 First Mile Engineering Interventions 31 3.5.6 Costing of interventions 42 3.5.7 Summary 43
4 Identification of Research Sites ..................................................................................... 44 4.1 Site Selection Criteria 44 4.2 Research Sites in Tanzania 45
4.2.1 Visited sites 46 4.2.2 Sites not yet visted 50 4.2.3 Preferred Sites 51
4.3 Research Sites in Kenya 51 4.3.1 Initial findings 52 4.3.2 Preferred Sites 56
4.4 Site Visit Conclusions 56 5 Phase 2 Stakeholder Workshops ................................................................................... 56
5.1 Tanzania Workshop 57 5.2 Kenya Workshop 58 5.3 Workshop Evaluation 58
6 Phase 3 Data Collection ................................................................................................ 58 6.1 Methodological Approach 58
6.1.1 Quantitative Data Collection 59 6.1.2 Qualitative Data Collection 60 6.1.3 Engineering Data Collection 61
6.2 Next Steps 64 7 Concluding Remarks ..................................................................................................... 64 8 References ................................................................................................................... 66 Annex A: The Rural Transport System and Poverty Connections ............................................ 70 Annex B: Workshop Participants .......................................................................................... 71 Annex C: Workshop Evaluation............................................................................................. 72
C1. Tanzania Workshop Evaluation 73

Evaluation of the Effect of Road Condition on the Quality of Agricultural Produce – Phase 2 Report
Page 7
C2. Kenya Workshop Evaluation 76 Annex D: Sampling and Study Implementation Process ......................................................... 81 Annex E: Engineering Assessment Form ................................................................................ 83 Annex F: Contribution to ReCAP Log Frame ........................................................................... 84
List of Figures Figure 1: Concept of Agricultural Value Chains ...................................................................... 16 Figure 2: Generic Structure of small holder agricultural value chains .................................... 21 Figure 3: Length of logistics chains in km ................................................................................ 21 Figure 4: Backloading and Animal Transport are common in Load Consolidation ................. 22 Figure 5: Labour Based Road Construction ............................................................................. 29 Figure 6: Figure 6: Roughness Values and Safe Operating Speeds ......................................... 33 Figure 7: Corrugated road ....................................................................................................... 34 Figure 8: Gravel Selection/Blending Chart .............................................................................. 34 Figure 9: Chart for Prediction of Gravel Performance ............................................................ 35 Figure 10: Road Cross-Section Profile and Impact on Drainage .............................................. 36 Figure 11: Correction of Entrenched Roadway ....................................................................... 37 Figure 12: Crown vs Outslope ................................................................................................. 37 Figure 13: Cross-Section Profile Options ................................................................................. 38 Figure 14: Scour Check Construction ...................................................................................... 40 Figure 15: The use of Do-nou technology ............................................................................... 42 Figure 16: Typical Maize Farms at Mfiriga Ward ..................................................................... 46 Figure 17: Typical Pineapples Farm at Madeke Village ........................................................... 47 Figure 18: Njombe - Ludewa Road Section ............................................................................. 47 Figure 19: Typical Potato Farm and Secondary Mile in Matola Village ................................... 47 Figure 20: Private First Mile Access Road in Matola Village .................................................... 48 Figure 21: First Mile Access Road in Mikumi (Doma Area) ..................................................... 48 Figure 22: Irrigation Dam Control Point at Mtula area ........................................................... 49 Figure 23: Typical Mafinga - Ndolezi - Isalavanu Feeder Road Section at Mafinga Town & Isalavanu - Ugute Track Section .............................................................................................. 49 Figure 24: Typical Ugute Agricultural Valley ........................................................................... 50 Figure 25: Areas of initial Site Selection in Kenya ................................................................... 52 Figure 26: Access Road Kinangop and Meru .......................................................................... 54 Figure 27: Access Road Ichagaki and Boiman .......................................................................... 54 Figure 28:Modes of Transport ................................................................................................. 54 Figure 29: Examples of consolidation points for Milk and French Beans Respectively .......... 56 Figure 30: An example of a completed engineering assessment form Source: (TRL Limited, 2006) ........................................................................................................................................ 63
List of Tables Table 1: Small Farns in Selceted Countries in Africa ............................................................... 12 Table 2: Agricultural Production and Marketing Impacts of Roads 2000 Project ................... 14 Table 3: Farm enterprises in a previous study on agricultural chain logistics in Kenya ......... 20 Table 4: Factors Causing Post-Harvest Losses in Horticultural Crops ..................................... 23 Table 5: Estimated Post Harvest Loss for Different Crops....................................................... 23 Table 6: Losses in Tomatoes and Peppers during Harvest and Transport .............................. 24 Table 7: Percentage of Damaged Fruit (Tangerines) ............................................................... 24 Table 8: Damage to Tomatoes after 4 hours of Vibration Stressing (Approx 2100 km Journey by Road) ................................................................................................................................... 25 Table 9: Authorities Responsible for Rural Transport Infrastructure ...................................... 28

Evaluation of the Effect of Road Condition on the Quality of Agricultural Produce – Phase 2 Report
Page 8
Table 10: Institutional Arrangements for Rural Transport Infrastructure .............................. 30 Table 11: : Alternative Solutions to Access Problems ............................................................. 30 Table 12: Water Bar Spacing ................................................................................................... 39 Table 13: Scour Check Spacing ................................................................................................ 40 Table 14: Mitre Drain Intervals ................................................................................................ 41 Table 15: A hypothetical example of the cost estimate for a drift.......................................... 43 Table 16: Criteria for Selection of Research Sites ................................................................... 44 Table 17: Sites visited in Kenya ............................................................................................... 51 Table 18: Trip distances and loads carried .............................................................................. 55 Table 19: Phase 2 Stakeholders Workshop Programme ......................................................... 57 Table 21: Focus Group Discussion Sampling ........................................................................... 60
Evaluation of the Effect of Road Condition on the Quality of Agricultural Produce – Phase 2 Report
Page 9
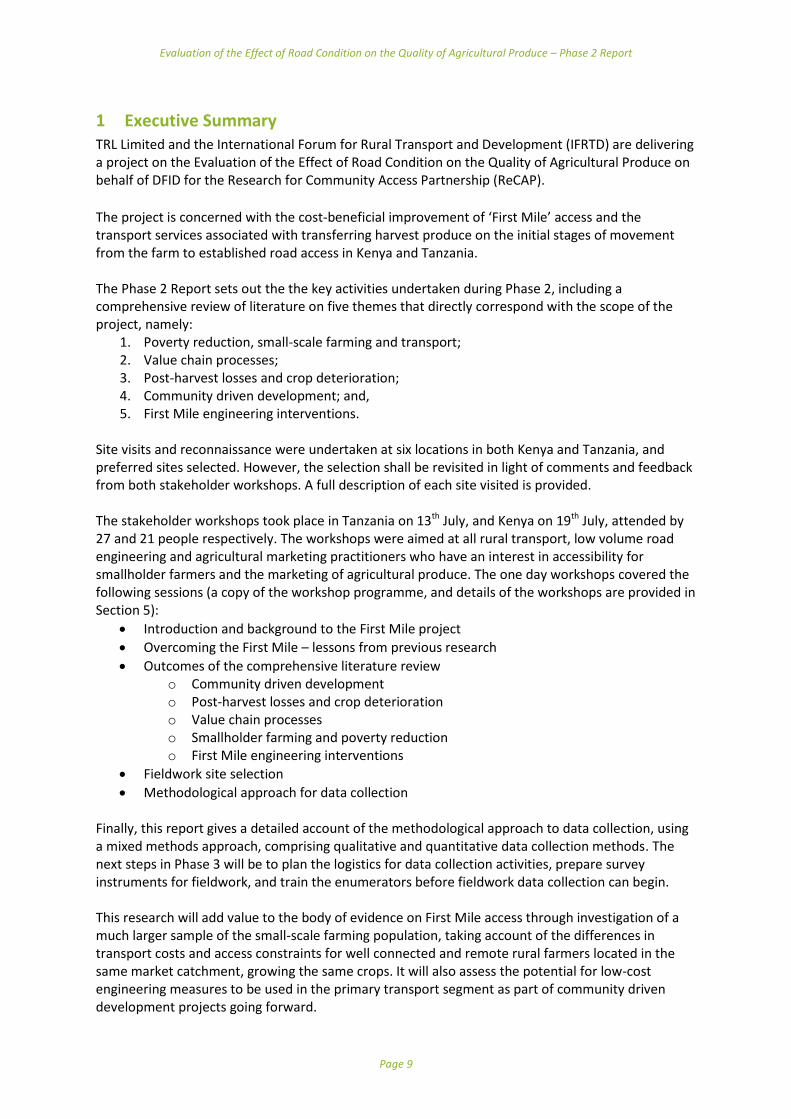
1 Executive Summary TRL Limited and the International Forum for Rural Transport and Development (IFRTD) are delivering a project on the Evaluation of the Effect of Road Condition on the Quality of Agricultural Produce on behalf of DFID for the Research for Community Access Partnership (ReCAP).
The project is concerned with the cost-beneficial improvement of ‘First Mile’ access and the transport services associated with transferring harvest produce on the initial stages of movement from the farm to established road access in Kenya and Tanzania. The Phase 2 Report sets out the the key activities undertaken during Phase 2, including a comprehensive review of literature on five themes that directly correspond with the scope of the project, namely:
1. Poverty reduction, small-scale farming and transport; 2. Value chain processes; 3. Post-harvest losses and crop deterioration; 4. Community driven development; and, 5. First Mile engineering interventions.
Site visits and reconnaissance were undertaken at six locations in both Kenya and Tanzania, and preferred sites selected. However, the selection shall be revisited in light of comments and feedback from both stakeholder workshops. A full description of each site visited is provided. The stakeholder workshops took place in Tanzania on 13th July, and Kenya on 19th July, attended by 27 and 21 people respectively. The workshops were aimed at all rural transport, low volume road engineering and agricultural marketing practitioners who have an interest in accessibility for smallholder farmers and the marketing of agricultural produce. The one day workshops covered the following sessions (a copy of the workshop programme, and details of the workshops are provided in Section 5):
Introduction and background to the First Mile project
Overcoming the First Mile – lessons from previous research
Outcomes of the comprehensive literature review o Community driven development o Post-harvest losses and crop deterioration o Value chain processes o Smallholder farming and poverty reduction o First Mile engineering interventions
Fieldwork site selection
Methodological approach for data collection Finally, this report gives a detailed account of the methodological approach to data collection, using a mixed methods approach, comprising qualitative and quantitative data collection methods. The next steps in Phase 3 will be to plan the logistics for data collection activities, prepare survey instruments for fieldwork, and train the enumerators before fieldwork data collection can begin. This research will add value to the body of evidence on First Mile access through investigation of a much larger sample of the small-scale farming population, taking account of the differences in transport costs and access constraints for well connected and remote rural farmers located in the same market catchment, growing the same crops. It will also assess the potential for low-cost engineering measures to be used in the primary transport segment as part of community driven development projects going forward.
Evaluation of the Effect of Road Condition on the Quality of Agricultural Produce – Phase 2 Report
Page 10
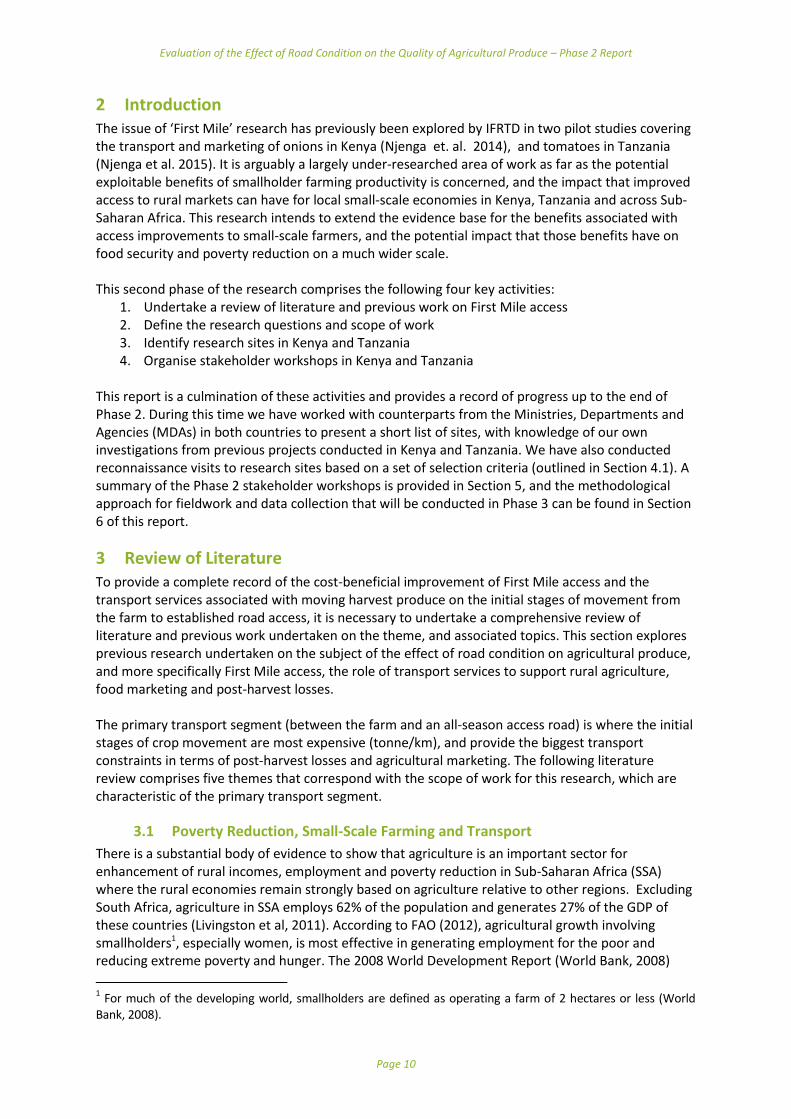
2 Introduction The issue of ‘First Mile’ research has previously been explored by IFRTD in two pilot studies covering the transport and marketing of onions in Kenya (Njenga et. al. 2014), and tomatoes in Tanzania (Njenga et al. 2015). It is arguably a largely under-researched area of work as far as the potential exploitable benefits of smallholder farming productivity is concerned, and the impact that improved access to rural markets can have for local small-scale economies in Kenya, Tanzania and across Sub-Saharan Africa. This research intends to extend the evidence base for the benefits associated with access improvements to small-scale farmers, and the potential impact that those benefits have on food security and poverty reduction on a much wider scale. This second phase of the research comprises the following four key activities:
1. Undertake a review of literature and previous work on First Mile access 2. Define the research questions and scope of work 3. Identify research sites in Kenya and Tanzania 4. Organise stakeholder workshops in Kenya and Tanzania
This report is a culmination of these activities and provides a record of progress up to the end of Phase 2. During this time we have worked with counterparts from the Ministries, Departments and Agencies (MDAs) in both countries to present a short list of sites, with knowledge of our own investigations from previous projects conducted in Kenya and Tanzania. We have also conducted reconnaissance visits to research sites based on a set of selection criteria (outlined in Section 4.1). A summary of the Phase 2 stakeholder workshops is provided in Section 5, and the methodological approach for fieldwork and data collection that will be conducted in Phase 3 can be found in Section 6 of this report.
3 Review of Literature To provide a complete record of the cost-beneficial improvement of First Mile access and the transport services associated with moving harvest produce on the initial stages of movement from the farm to established road access, it is necessary to undertake a comprehensive review of literature and previous work undertaken on the theme, and associated topics. This section explores previous research undertaken on the subject of the effect of road condition on agricultural produce, and more specifically First Mile access, the role of transport services to support rural agriculture, food marketing and post-harvest losses. The primary transport segment (between the farm and an all-season access road) is where the initial stages of crop movement are most expensive (tonne/km), and provide the biggest transport constraints in terms of post-harvest losses and agricultural marketing. The following literature review comprises five themes that correspond with the scope of work for this research, which are characteristic of the primary transport segment.
3.1 Poverty Reduction, Small-Scale Farming and Transport
There is a substantial body of evidence to show that agriculture is an important sector for enhancement of rural incomes, employment and poverty reduction in Sub-Saharan Africa (SSA) where the rural economies remain strongly based on agriculture relative to other regions. Excluding South Africa, agriculture in SSA employs 62% of the population and generates 27% of the GDP of these countries (Livingston et al, 2011). According to FAO (2012), agricultural growth involving smallholders1, especially women, is most effective in generating employment for the poor and reducing extreme poverty and hunger. The 2008 World Development Report (World Bank, 2008)
1 For much of the developing world, smallholders are defined as operating a farm of 2 hectares or less (World
Bank, 2008).

Evaluation of the Effect of Road Condition on the Quality of Agricultural Produce – Phase 2 Report
Page 11
was dedicated to agriculture and development. The report underscored the fact that in Sub-Saharan Africa, agriculture contributes significantly to economic growth, and, because the poor are concentrated in rural areas, it is an important tool in poverty reduction. Agriculture remains the chief occupation of rural communities, and for the poor, subsistence agriculture is often combined with labouring on other farms to stave off food insecurity. Accessibility to land, agricultural inputs, credit, equipment, information and markets are all determinants of rural wealth creation, and despite the apparent rise in non-farm activities, transport is clearly crucial in rural income generation (Bryceson et al, 2003). Rural transport is an important factor in reducing global poverty (thought to affect 1.3 billion people).2 It has a role in improving food security and agricultural productivity over the medium and long term, as population growth, environmental stress, and climate change converge to challenge food security, both globally and within the African continent (Banjo et al, 2012). The report quotes the work of Valdés et al (2009) who state that ‘rural infrastructure improves both farmer access to markets and expands employment opportunities in the non-farm sector. Investments in infrastructure - most notably rural roads - tend to have a large impact on poverty reduction, and there is evidence that they also enhance agricultural productivity.’ According to Banjo et al (2012), rural transport has a central role in agriculture, whereby transport systems affect farm growth through their influence on the physical access that farmers have to markets, as well as price fluctuations. Poor rural transport systems increase the costs of marketing to and from farm areas, inhibit product flows, limit the spread of information, and increase risk to farmers. They also state that agriculture has a reciprocal effect on the viability of transport investments, with the structure and performance of the farm sector and the volatility of agricultural production and weather having a significant influence on the rate of return from rural transport investments (Banjo et al, 2012). According to Salami et al (2010), the road system, which is the most important for market development in terms of distribution of inputs and output to and from farms, is the most serious infrastructural bottleneck facing agricultural development. A recent Systematic Review of over 50 world-wide studies has shown that rural road investment has had a wide range of positive effects on the welfare of rural populations. Strong positive effects have been shown in traffic volumes, reduced transport costs, increased agricultural production, increased agricultural marketing, increased employment, and better health and education outcomes. The negative effects were found to be minimal (Hine et al, 2016). There are often considerable trade-offs made in rural marketing. The cost of transporting produce to market can be prohibitive both in terms of the transport service fare and the time cost, a factor that is exacerbated by the poor road condition and inflated transport costs that are inherent in low density farming regions. For this reason, farmers often trade at the farm-gate to avoid the high costs of taking small loads to market, which can be a high-risk exercise, particularly for perishable goods. There are substantial economies of scale in transport and food marketing that, generally, can only be realised by the largest farmers, or by traders. Through collusion, and, by taking advantage of a captive market, traders often exploit rural farmers by paying less than the market rate for produce (Hine et al, 1983).
2 Half of the 1.3 billion people living in extreme poverty (less than $1.25 a day) are in Sub-Saharan Africa, while
over 3 billion people worldwide live on less than $2.5 a day (UNDP, 2014).
Evaluation of the Effect of Road Condition on the Quality of Agricultural Produce – Phase 2 Report
Page 12
However, physical infrastructure (including road networks, transport and storage) is only one factor affecting the efficacy of the marketing process. Market relations and access to market information is equally important because information on market price helps farmers maximise their income and negates the need for travel to the market. Yet, in reality physical access to markets, or lack thereof, has a critical impact on producer prices, causing farmers to revert to growing subsistence crops or to diversify altogether and pursue non-agricultural income generating activities.
3.1.1 Smallholder Development and Food Security
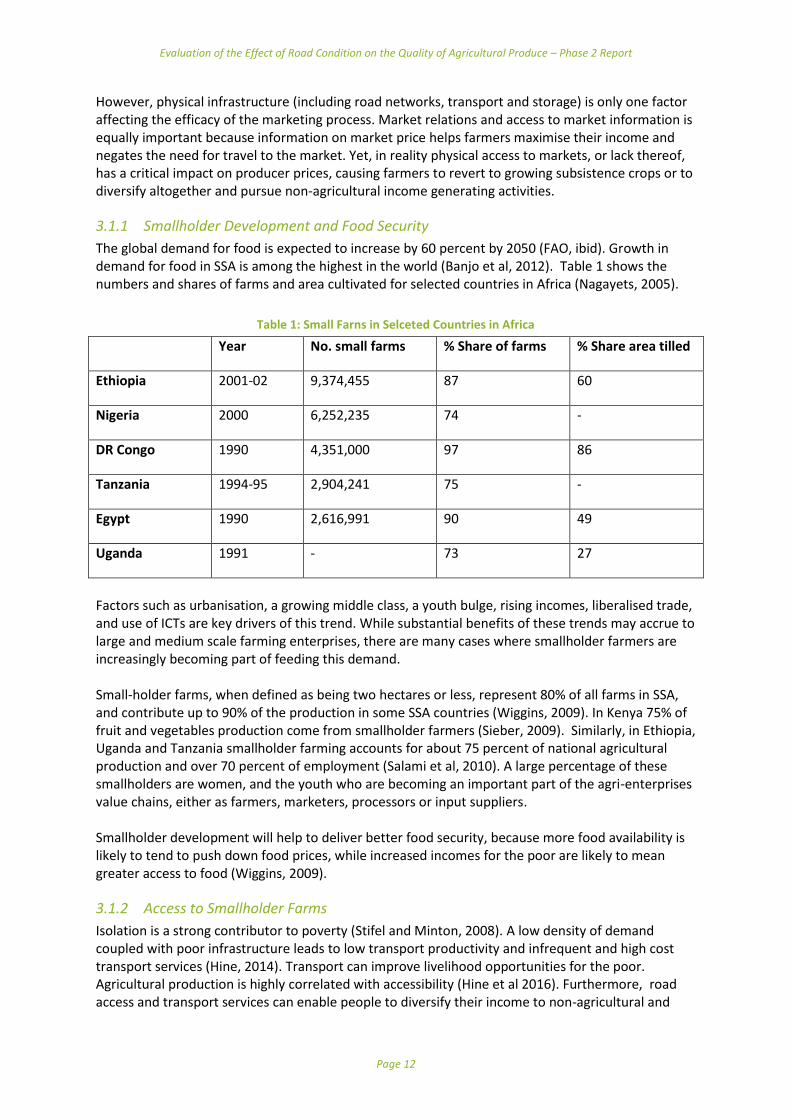
The global demand for food is expected to increase by 60 percent by 2050 (FAO, ibid). Growth in demand for food in SSA is among the highest in the world (Banjo et al, 2012). Table 1 shows the numbers and shares of farms and area cultivated for selected countries in Africa (Nagayets, 2005).
Table 1: Small Farns in Selceted Countries in Africa
Year No. small farms % Share of farms % Share area tilled
Ethiopia 2001-02 9,374,455 87 60
Nigeria 2000 6,252,235 74 -
DR Congo 1990 4,351,000 97 86
Tanzania 1994-95 2,904,241 75 -
Egypt 1990 2,616,991 90 49
Uganda 1991 - 73 27
Factors such as urbanisation, a growing middle class, a youth bulge, rising incomes, liberalised trade, and use of ICTs are key drivers of this trend. While substantial benefits of these trends may accrue to large and medium scale farming enterprises, there are many cases where smallholder farmers are increasingly becoming part of feeding this demand. Small-holder farms, when defined as being two hectares or less, represent 80% of all farms in SSA, and contribute up to 90% of the production in some SSA countries (Wiggins, 2009). In Kenya 75% of fruit and vegetables production come from smallholder farmers (Sieber, 2009). Similarly, in Ethiopia, Uganda and Tanzania smallholder farming accounts for about 75 percent of national agricultural production and over 70 percent of employment (Salami et al, 2010). A large percentage of these smallholders are women, and the youth who are becoming an important part of the agri-enterprises value chains, either as farmers, marketers, processors or input suppliers. Smallholder development will help to deliver better food security, because more food availability is likely to tend to push down food prices, while increased incomes for the poor are likely to mean greater access to food (Wiggins, 2009).
3.1.2 Access to Smallholder Farms
Isolation is a strong contributor to poverty (Stifel and Minton, 2008). A low density of demand coupled with poor infrastructure leads to low transport productivity and infrequent and high cost transport services (Hine, 2014). Transport can improve livelihood opportunities for the poor. Agricultural production is highly correlated with accessibility (Hine et al 2016). Furthermore, road access and transport services can enable people to diversify their income to non-agricultural and
Evaluation of the Effect of Road Condition on the Quality of Agricultural Produce – Phase 2 Report
Page 13
more profitable enterprise or employment. Annex A represents the vicious cycle of rural transport and poverty, of which low goods movement and inefficient markets are a key component, along with low rural road and population density (Hine, 2014). Stifel and Minton (2008) analysed the effect of isolation and transport infrastructure on agricultural productivity in Madagascar, and found a strong poverty-isolation relationship, with an inverse relationship between agricultural productivity and isolation. Transportation induced transaction costs and reduced agricultural productivity and yields are some of the factors explaining the negative productivity-isolation relationship. However, Stifel and Minton concentrate specifically on isolation and its effect on agricultural productivity, as opposed to the relationship between road access and poverty. The 2008 World Development Report (World Bank, 2008) supports the assertion that agricultural performance relates to access to markets and services: ‘Rural areas by definition are spatially dispersed, which affects the cost of transport, the quality of public services, and the reliance on subsistence production.’
3.1.3 Agricultural Production and Marketing
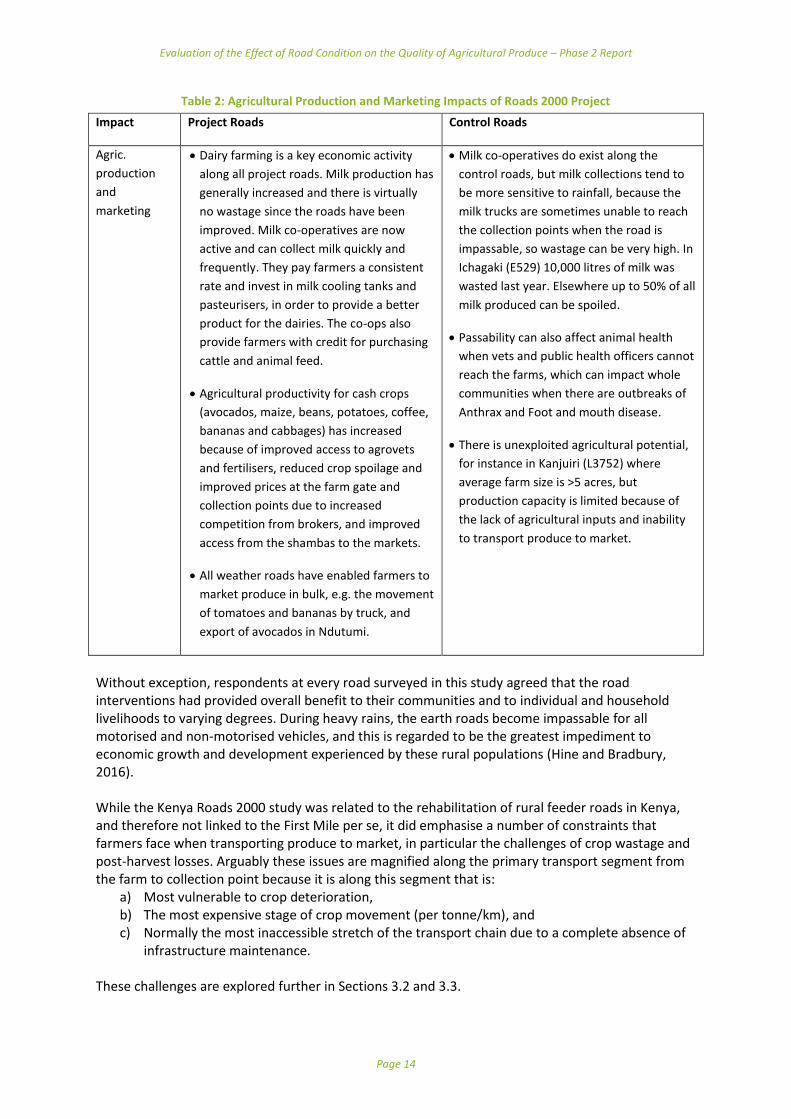
Earlier the apparent symbiotic relationship between rural transport and agriculture was mentioned, citing the influence between these two sectors as being an important consideration in the reduction of rural poverty. The returns on rural transport investments depend on the characteristics of farm structure, including the types and amounts of production and marketing undertaken in a given area, and the associated transport and processing requirements. Other factors are the degree of farm spatial concentration; the value of marketed farm production; the size and commercial orientation of farms; and the extent to which farmer marketing groups exist and can achieve economies of scale in local markets, allowing assembly of larger loads with lower unit transport costs (Banjo et al, 2012). This was found this to be true of milk production in Central Kenya, whereby organised networks of dairy co-operatives provided accessible collection points for small-scale farmers to sell their milk daily at market rates. These co-operatives facilitated the consolidation of produce, enabling economies of scale, and allowing for investment in cooling tanks and pasteurisers that increased the unit rate received by the suppliers. (Hine and Bradbury, 2016) In this study, the Agençe Francaise de Développement (AFD) commissioned TRL to undertake an Ex-Post Evaluation of the AFD/GOK Roads 2000 Phase 1 Project in Central Kenya). The evaluation comprised an assessment of the wider impact of the project on communities, employment and poverty reduction, and of project performance related to an analysis of engineering, economics and institutional aspects. As part of the evaluation, a socio-economic impact study was undertaken to identify whether the Roads 2000 Programme had a measurable impact on community development and the local economy. Fieldwork helped provide ground truthing to determine whether the project outcomes of the rehabilitation programme had been achieved, with respect to increased employment opportunities, improved agricultural output and easier access to markets, health, education and other services. During the field surveys, a large volume of qualitative and anecdotal data was collected from eleven communities living along a selection of rural roads in Murang’a and Nyandarua Regions using focus groups and key informant interviews. A key theme of the socio-economic impact survey was to identify the impact of improved access on agricultural production and marketing by comparing the Roads 2000 project roads with a selection of control roads. Table 2 summarises some of these impacts, which demonstrates how sensitive the smallholder farming sector is to changes in accessibility (Hine and Bradbury, 2016):
Evaluation of the Effect of Road Condition on the Quality of Agricultural Produce – Phase 2 Report
Page 14
Table 2: Agricultural Production and Marketing Impacts of Roads 2000 Project
Impact Project Roads Control Roads
Agric.
production
and
marketing
Dairy farming is a key economic activity
along all project roads. Milk production has
generally increased and there is virtually
no wastage since the roads have been
improved. Milk co-operatives are now
active and can collect milk quickly and
frequently. They pay farmers a consistent
rate and invest in milk cooling tanks and
pasteurisers, in order to provide a better
product for the dairies. The co-ops also
provide farmers with credit for purchasing
cattle and animal feed.
Agricultural productivity for cash crops
(avocados, maize, beans, potatoes, coffee,
bananas and cabbages) has increased
because of improved access to agrovets
and fertilisers, reduced crop spoilage and
improved prices at the farm gate and
collection points due to increased
competition from brokers, and improved
access from the shambas to the markets.
All weather roads have enabled farmers to
market produce in bulk, e.g. the movement
of tomatoes and bananas by truck, and
export of avocados in Ndutumi.
Milk co-operatives do exist along the
control roads, but milk collections tend to
be more sensitive to rainfall, because the
milk trucks are sometimes unable to reach
the collection points when the road is
impassable, so wastage can be very high. In
Ichagaki (E529) 10,000 litres of milk was
wasted last year. Elsewhere up to 50% of all
milk produced can be spoiled.
Passability can also affect animal health
when vets and public health officers cannot
reach the farms, which can impact whole
communities when there are outbreaks of
Anthrax and Foot and mouth disease.
There is unexploited agricultural potential,
for instance in Kanjuiri (L3752) where
average farm size is >5 acres, but
production capacity is limited because of
the lack of agricultural inputs and inability
to transport produce to market.
Without exception, respondents at every road surveyed in this study agreed that the road interventions had provided overall benefit to their communities and to individual and household livelihoods to varying degrees. During heavy rains, the earth roads become impassable for all motorised and non-motorised vehicles, and this is regarded to be the greatest impediment to economic growth and development experienced by these rural populations (Hine and Bradbury, 2016). While the Kenya Roads 2000 study was related to the rehabilitation of rural feeder roads in Kenya, and therefore not linked to the First Mile per se, it did emphasise a number of constraints that farmers face when transporting produce to market, in particular the challenges of crop wastage and post-harvest losses. Arguably these issues are magnified along the primary transport segment from the farm to collection point because it is along this segment that is:
a) Most vulnerable to crop deterioration, b) The most expensive stage of crop movement (per tonne/km), and c) Normally the most inaccessible stretch of the transport chain due to a complete absence of
infrastructure maintenance. These challenges are explored further in Sections 3.2 and 3.3.
Evaluation of the Effect of Road Condition on the Quality of Agricultural Produce – Phase 2 Report
Page 15
3.2 Agricultural Value Chains
According to Norton (2014), a Value Chain (VC) is a set of linked activities that work to add value to a product. It consists of actors and actions that improve a product while linking commodity producers to processors and markets. A value chain encompasses the flow of products, knowledge and information, finance, payments, and the social capital needed to organize producers and communities. The World Bank (Webber and Labaste, 2010) defines “value chain’’ as the full range of value adding activities required to bring a product or service through the different phases of production, including procurement of raw materials and other inputs”. UNIDO (Riisgaard and Ponte, 2011)) on the other hand defines value chain as “actors connected along a chain producing, transforming and bringing goods and services to end-consumers through a sequenced set of activities.” CIAT gives value chain a different focus defining it as “a strategic network among a number of business organizations” (Lundy et al, 2006).
The Agricultural Value Chains (AVC) concept has been used since the beginning of the millennium, primarily by those working in agricultural development in developing countries. Although there is no universally accepted definition of the term, it normally refers to the whole range of goods and services necessary for an agricultural product to move from the farm to the final customer or consumer. The term can be used to refer to among others the following:
An extended supply chain or marketing channel, which embraces all activities needed to produce the product, including information/extension, planning, input supply and finance. It is probably the most common usage of the value chain term
An international or regional commodity market. E.g. “The Global Cotton Value Chain”, “The Southern Africa Maize Value Chain” or “The Brazilian Coffee Value Chain”;
A national or local commodity market or marketing system such as “the Ghanaian Tomato Value Chain” or “The Accra Tomato Value Chain”.
A dedicated chain designed to meet the needs of one or a limited number of buyers. This usage stresses that a value chain is designed to capture value for all actors by carrying out activities to meet the demand of consumers or of a particular retailer, processor or food service company supplying those consumers. Emphasis is firmly placed on demand as the source of the value.
An agricultural value chain might include: input supply, farmer organization, farm production, post-harvest handling, processing, provision of technologies of production and handling, grading criteria and facilities, cooling and packing technologies, post-harvest local processing, industrial processing, storage, transport, finance, and feedback from markets.

Evaluation of the Effect of Road Condition on the Quality of Agricultural Produce – Phase 2 Report
Page 16
Figure 1: Concept of Agricultural Value Chains
Value Chains work best when their actors cooperate to produce higher quality products and generate more income for all participants along the chain, as opposed to the traditional markets in which producers and buyers only exchange price information often in an adversarial mode. Value Chains is a wider concept than Supply Chains, which refer to specific logistical components such as transport, storage and management processes of getting a product from its production site to the consumer.
Information is important to all value chain actors and flows in two directions. In one direction, markets inform producers of price, quantity and quality needs, product handling and technology options, while in the second direction, producers inform processors and markets on production quantities, locations, timing and production issues. In a value chain, processors and marketing agents may provide producers with finance, inputs and training in technologies of production (Norton, 2014).
According to AfDB (2015), when an AVC approach is adopted, it enables a comprehensive approach to identification of key constraints and the necessary linkages needed to strengthen the AVC. For example, transportation, markets, and other infrastructure need to be linked to production and market information to achieve better results.
Work to promote market linkages in developing countries is often based on the concept of “inclusive value chains”, which usually places emphasis on identifying possible ways in which small-scale farmers can be incorporated into existing or new value chains or can extract greater value from the chain, either by increasing efficiency or by also carrying out activities further along the chain (Haggblade, et al, 2012).
There is a positive correlation of agricultural growth with investment in irrigation, transport infrastructure and other technologies (Wiggins, 2013). Governments have a responsibility to provide essential goods and services, infrastructure, such as rural roads, and agricultural research and extension. Value Chain development is often constrained by corruption, both at a high level and at the ubiquitous road blocks found in many countries, particularly in Africa. Many measures to improve value chains require collaboration between a wide range of different ministries, and this can be difficult to achieve.
Evaluation of the Effect of Road Condition on the Quality of Agricultural Produce – Phase 2 Report
Page 17
In various African countries, value chain analysis has been undertaken for the mainstream staple and
major cash crops such as maize, rice, wheat, coffee, cotton, tea and sugarcane3. This is partly
because of the perceived importance of the crops and also because of the presence of specific institutions responsible for development and promotion of the particular crops or commodities. Most of the other crops/commodities however, have not received comprehensive value chain analysis that could contribute to identification of the weak components of their chains and associated relevant actions to facilitate targeted interventions. The discussion below highlights some of the selected crops/commodities that have potential to improve income and food security levels for small-scale farmers in Kenya and Tanzania but have not received sufficient attention.
3.2.1 Agricultural Value Chains in Kenya
There are several projects that promote the Agricultural Value Chain approach in Kenya. They include initiatives such as the Kenya Agricultural Value Chain Enterprises (KAVES), Feed the Future among many others. KAVES works with smallholder farmers, businesses, and national and county government partners to address constraints up and down the agricultural Value Chains. They focus on the Value Chain actors such as agro-processors, input suppliers, transporters, exporters, retailers, and financiers to develop fully-functioning and competitive Value Chains. Feed the Future on the other hand is focusing its efforts on improving several key Agricultural Value Chains in Kenya that include the horticulture, dairy, maize and other staples for the high rainfall areas; drought-tolerant staple crops (sorghum, millet and root crop systems), drought-tolerant maize, horticulture and pulses for the semi-arid areas; and livestock and dairy in arid and semi-arid lands of northern Kenya. Feed the Future addresses the whole Value Chain with a special focus on the weakest farm and market connection, from inputs like fertilizer, seeds, and livestock vaccines to credit, production methods, storage, transport, processing, farmers’ cooperatives, and markets in Kenya, East Africa and overseas. Typical Value Chains in Kenya include for example:
1. Banana supply value chain: It has the following components: (a)Harvesting (b) Bulking by wholesaler (c) Grading and Cleaning (d) Packaging (e) Transport with pick-ups or closed truck (f) Storage (g) Ripening (h) Retail.
2. Milk Value Chain: It has the following components: (a) Production (b) Transportation (c) Sale (d) Storage (e) Processing (f) Sales;
3. Fish Supply Chain: (a) Fishing (b)Transportation from fishing ground (c) Landing ground (d) weighing (f) Size grading (g) Packing (f) Transporting (g) Retail selling.
3.2.2 Agricultural Value Chains in Tanzania
According to Match Maker Associates Ltd (2012), the major recent Agricultural Value Chain initiatives in Tanzania include: cassava, fresh fruits and vegetables, citrus, mangoes, pineapples, tomatoes, onions, horticulture, organic cashew-nuts, dried fruits, cocoa, organic and FT coffee, cotton, maize, rice, sisal, sunflower, sesame, tea, sugarcane, pulses, edible nuts, indigenous poultry, red meat, dairy and goats. Other significant value chains include irish potatoes and dessert and cooking bananas. The following review covers cassava, sweet potatoes and fruits and vegetables.
3
Diakite S et al, Overview of the rice value chain in Burkina Faso, Ghana, Mali, Nigeria, Ethiopia, Tanzania and
Uganda (for the Bill & Melinda Gates Foundation), 2012.
Evaluation of the Effect of Road Condition on the Quality of Agricultural Produce – Phase 2 Report
Page 18
3.2.3 An Example of Milk Processors in Kenya
According to a review by GIZ (Coates et al, 2011), the dairy co-operatives are among the more successful examples of the co-operative movement in Kenya. They play a pivotal role in the off-take and marketing of dairy produce in the country. While many are very small and lack economies of scale, some have many thousands of members and are national brands. Typically, dairy co-operatives are focused on a particular geographic area, and set up a network of collection centres that are accessible to farmers. Farmers deliver their milk to these centres, have the volume signed off at a certain price, and have payments made in due course to their bank account. Co-operatives also facilitate access to a wide range of other services for farmers. Many have a farm shop attached to their collection centres where farmers can pick up supplies and equipment. Cooperatives use their networks to provide or enable a wide range of extension services including Enterprise Development Service (EDS), Artificial Insemination Services, adopting Zero Grazing Units, and biogas units, for example. The GIZ review (2011) however notes that despite their huge potential, most co-operatives remain under-capitalised, and lack the professional management and skills required to manage a growth strategy. They are keen to expand services, including financial services, to members but lack the financial and business wherewithal to be more successful. An approach to simultaneously provide both financial and management support to selected Cooperatives is needed. There are also a number of privately-owned processing operations which could show similar potential for development, and may be more attractive to commercial financiers if co-operatives prove particularly difficult to finance.
3.2.4 The Example of Cassava in Tanzania
In Tanzania, cassava is an important crop in the drier zones for both home consumption and income generation. More than 80% of Tanzania’s cassava production is domestically consumed as food. The remainder is used to feed livestock, industrial starch production, or exported. Both the roots and the leaves are important for food security in Tanzania. According to Van der Land, et al (2007), Tanzania produces 6.8 million tons of cassava per year, which contributes to about 5.5% of the total cassava production worldwide and 14% of production for Africa. Cassava is sold through several distribution channels. The first channel involves local producers selling raw cassava to village traders or to consumers in their villages or on their farms. Farmers the majority of their cassava which is purchased by village traders who sell to urban traders. Village traders’ storage capacity is limited, so most of them process cassava to ‘makopa’ (dried cassava). The second channel is food processors who buy cassava either directly from farmers’ groups or through village traders. Cassava is processed into flour, cassava snacks, biscuits and other food products, while a limited amount is processed into animal feed. The third channel involves textile and other industries that use cassava starch as a raw material. Cassava was studied in Eastern AEZ (Mkuranga and Mvomero Districts). Ongoing cassava value chain initiative in Tanzania include: VECO (2008 – 2013) active in Mkuranga district, FAO (2010 – 2012) working in southern (Mtwara and Lindi) and coastal (Pwani) zones, Plan Tanzania (2011 – 2015) through Tujikimu project active in Mwanza, Geita, Kisarawe, Kibaha & Ifakara, MUVI (2009 – 2013) working in Pwani , Mwanza and Ruvuma regions, Concern Worldwide Tanzania – working in nine districts in Mtwara, Kigoma and Iringa regions. The key objective of the cassava initiative is to enable smallholder farmers to increase productivity and incomes through commercial farming. The activities include organization of farmers into groups to allow for collective marketing and processing, training them in cassava processing skills and establishment of a cassava processing facility. The key gaps that have been identified include support for infrastructure development e.g. boreholes for water to serve the processing facilities, construction of feeder roads
Evaluation of the Effect of Road Condition on the Quality of Agricultural Produce – Phase 2 Report
Page 19
to and from the farms /processing centers, Business Development Services to the private sector to allow them to link up with farmers, microfinance products suitable for farmers and establishment of a fair weights and measurements system for cassava.
3.2.5 Fruits and vegetables
The value of world trade in the Fresh Fruits and Vegetables (FFV) sector has quadrupled in the last two decades, reaching $US 108 billion in 2004 (Huang S.W. 2014). Rising incomes, falling transportation costs, improved technology, and evolving international agreements have led to substantial growth in the volume and variety of fruits and vegetables traded globally. Fruit trade is heavily concentrated in bananas, citrus, grapes and apples. Vegetable trade is more fragmented, with tomatoes making up the largest percentage of about 20 percent. In Kenya 75% of fruit and vegetables production come from smallholder farmers (Sieber N, 2009). However, in Tanzania, getting FFV from the producer to the consumer is a difficult and complex task. Produce has to be sourced from various locations and transported to distant markets. Fresh fruit and vegetables in Tanzania are grown in various (specific) areas that are often remote from (major) consumer areas and there are infrastructural bottlenecks between production and marketing areas. A number of interventions are on-going to reduce the plight of producers and marketers of fresh fruits and vegetables. Among others they include efforts by MUVI, VECO Tanzania, Oxfam GB TASU, TAPP and TPSF/CCP. The specific geographical areas include: Muheza and Korogwe Districts Tanga (Citrus) Mkuranga District Pwani (Mangoes and Pineapples) and Kilolo District Iringa (Tomatoes).
3.2.6 Transport and Smallholder Value Chains
The organisation of the first stage of transport is critically important to the performance of the whole agricultural supply chain - from farmer to final consumer. This affects not only the immediate transport costs from farm to the primary roads, but also the profitability of various enterprises along the supply chain, starting with the farmers. Transport efficiency is also very important for improving financial and time costs in the delivery of inputs and produce and in reducing post-harvest losses. Many crops such as tomatoes, mangos, soft fruit, green vegetables, bananas and even crops like onions can be bruised and lose value as they are mishandled and transported over rough roads. Other crops will experience value decline through time delays in getting to the market. KENDAT, IFRTD, et al (2013), carried out an exploratory study of the logistical organisation of seven farming enterprises in Kenya, made up of two small scale, one medium size and one large scale producer of French Beans, and one small scale producer each for Bananas, Potatoes and onions. The length of the chains (farm to market) that were studied ranged from 65 kilometres for potatoes, and 380 kilometres for bananas.
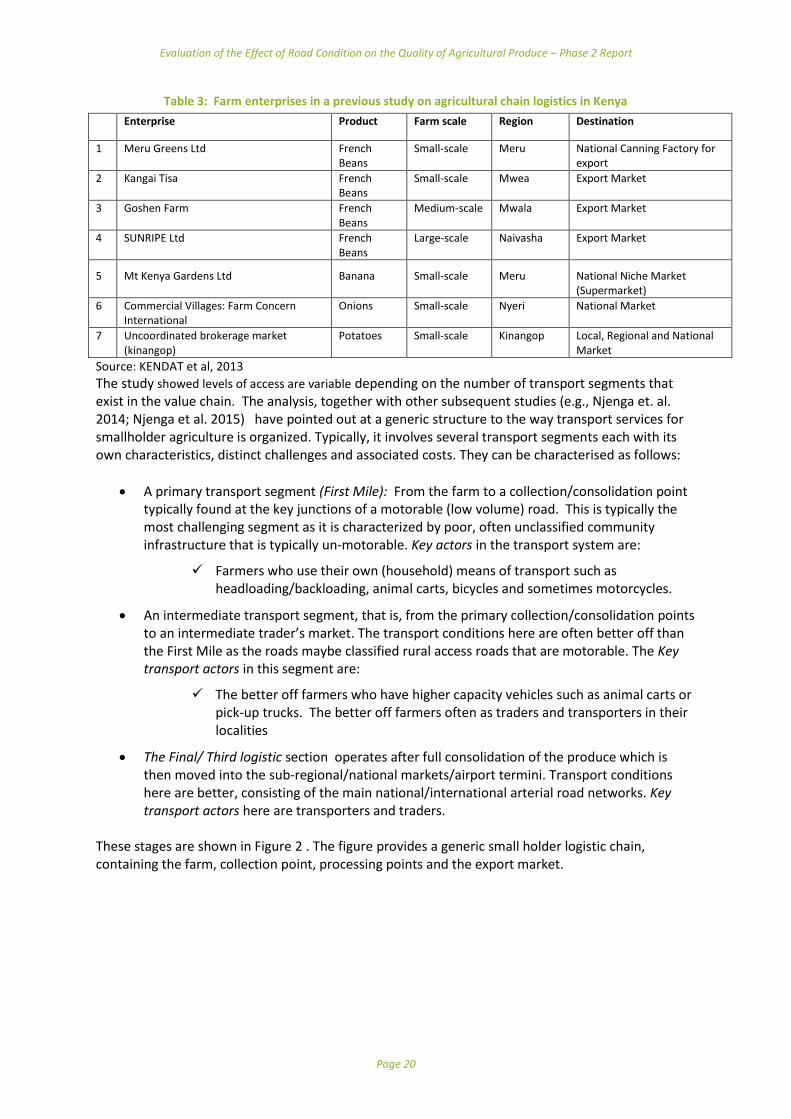
Evaluation of the Effect of Road Condition on the Quality of Agricultural Produce – Phase 2 Report
Page 20
Table 3: Farm enterprises in a previous study on agricultural chain logistics in Kenya
Enterprise Product Farm scale Region Destination
1 Meru Greens Ltd French Beans
Small-scale Meru National Canning Factory for export
2 Kangai Tisa French Beans
Small-scale Mwea Export Market
3 Goshen Farm French Beans
Medium-scale Mwala Export Market
4 SUNRIPE Ltd French Beans
Large-scale Naivasha Export Market
5 Mt Kenya Gardens Ltd Banana Small-scale Meru National Niche Market (Supermarket)
6 Commercial Villages: Farm Concern International
Onions Small-scale Nyeri National Market
7 Uncoordinated brokerage market (kinangop)
Potatoes Small-scale Kinangop Local, Regional and National Market
Source: KENDAT et al, 2013
The study showed levels of access are variable depending on the number of transport segments that exist in the value chain. The analysis, together with other subsequent studies (e.g., Njenga et. al. 2014; Njenga et al. 2015) have pointed out at a generic structure to the way transport services for smallholder agriculture is organized. Typically, it involves several transport segments each with its own characteristics, distinct challenges and associated costs. They can be characterised as follows:
A primary transport segment (First Mile): From the farm to a collection/consolidation point typically found at the key junctions of a motorable (low volume) road. This is typically the most challenging segment as it is characterized by poor, often unclassified community infrastructure that is typically un-motorable. Key actors in the transport system are:
Farmers who use their own (household) means of transport such as headloading/backloading, animal carts, bicycles and sometimes motorcycles.
An intermediate transport segment, that is, from the primary collection/consolidation points to an intermediate trader’s market. The transport conditions here are often better off than the First Mile as the roads maybe classified rural access roads that are motorable. The Key transport actors in this segment are:
The better off farmers who have higher capacity vehicles such as animal carts or pick-up trucks. The better off farmers often as traders and transporters in their localities
The Final/ Third logistic section operates after full consolidation of the produce which is then moved into the sub-regional/national markets/airport termini. Transport conditions here are better, consisting of the main national/international arterial road networks. Key transport actors here are transporters and traders.
These stages are shown in Figure 2 . The figure provides a generic small holder logistic chain, containing the farm, collection point, processing points and the export market.

Evaluation of the Effect of Road Condition on the Quality of Agricultural Produce – Phase 2 Report
Page 21
Figure 2: Generic Structure of small holder agricultural value chains
From the KENDAT et al study (2013), the length of the various transport segments for the products in the study can be seen in Figure 3. SUNRIPE, a large-scale producer has no First Mile segment at all. This is because the consolidation happens on the farm where produce is picked for direct transportation to the final depot at the airport. Only one company in the study, Mt Kenya Gardens has a second stage chain, which consists of transporting bananas from the first mile stage to its ripening depot in a regional hub before transport to the national markets in Nairobi. The chain covers the longest distance at approximately 300 kilometres. The Kinangop potato chain is short covering a distance of 90 kilometres to Nairobi.
Figure 3: Length of logistics chains in km
Source, KENDAT et al. 2013
3.2.6.1 The First Mile Segment
The First Mile is a term that is used analogously to the Last Mile segment of a goods or services distribution system that is meant to reach individual consumption units, and is therefore usually the most expensive part of the transport chain. In the case of agricultural transport this term means the very first segment of a journey – in the context of small holder farmers - consisting of individual fragmented volumes transported from the farm to a collection point or a primary market. Transport in this segment is conducted on local paths and tracks. Means of transport include head loading mainly among women, animal transport, bicycles and lately, motor cycles. Because of the low individual volumes transported and the poor condition of the road infrastructure, the First Mile is the most inefficient in terms of travel speeds and transport costs. For the farmers, their contribution to the logistics chain typically ends at the First Mile. From here the second stage of the chain is taken over by traders, wholesale marketing companies or transport service providers. The second stage of the logistic may be organised as a circuit on routes with several first mile termini. This allows for consolidation of the loads from several collection points before onward transport to regional, national and international markets. Most of the 2nd stage logistics operate along rural access roads. This second stage ends when the freight passes the regional centre from where the third stage inter-urban transport begins.
First Mile
Evaluation of the Effect of Road Condition on the Quality of Agricultural Produce – Phase 2 Report
Page 22
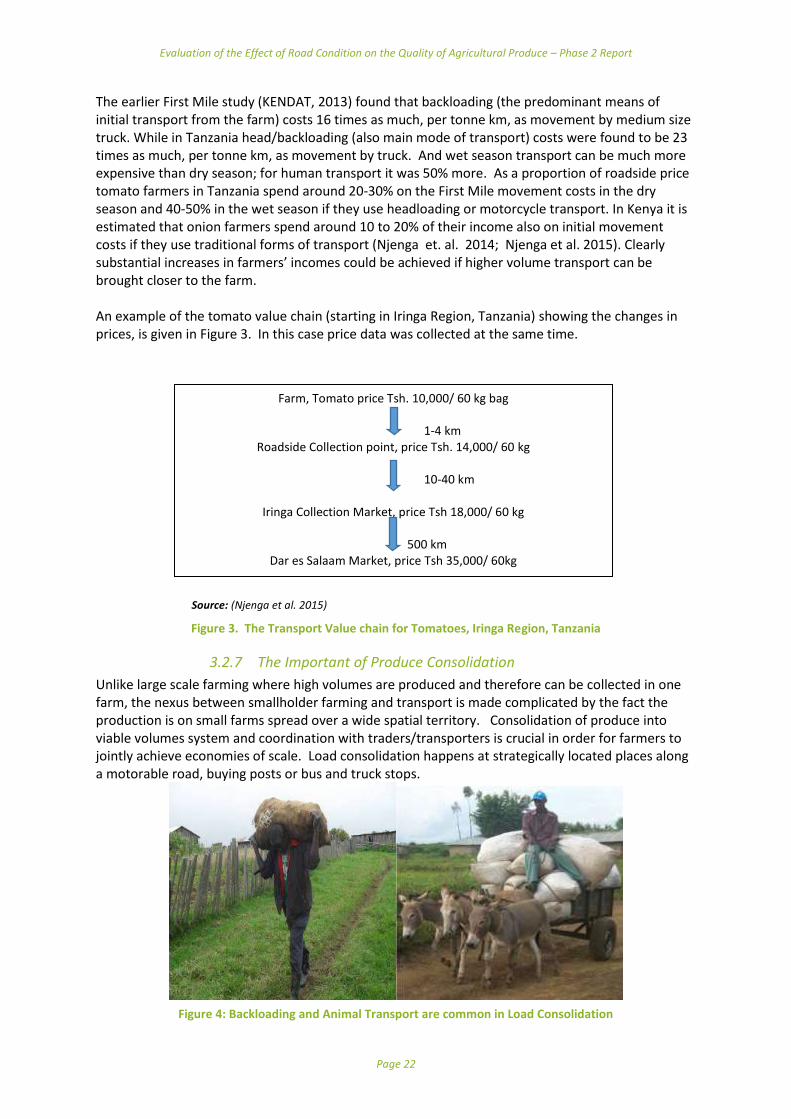
The earlier First Mile study (KENDAT, 2013) found that backloading (the predominant means of initial transport from the farm) costs 16 times as much, per tonne km, as movement by medium size truck. While in Tanzania head/backloading (also main mode of transport) costs were found to be 23 times as much, per tonne km, as movement by truck. And wet season transport can be much more expensive than dry season; for human transport it was 50% more. As a proportion of roadside price tomato farmers in Tanzania spend around 20-30% on the First Mile movement costs in the dry season and 40-50% in the wet season if they use headloading or motorcycle transport. In Kenya it is estimated that onion farmers spend around 10 to 20% of their income also on initial movement costs if they use traditional forms of transport (Njenga et. al. 2014; Njenga et al. 2015). Clearly substantial increases in farmers’ incomes could be achieved if higher volume transport can be brought closer to the farm. An example of the tomato value chain (starting in Iringa Region, Tanzania) showing the changes in prices, is given in Figure 3. In this case price data was collected at the same time.
Source: (Njenga et al. 2015)
Figure 3. The Transport Value chain for Tomatoes, Iringa Region, Tanzania
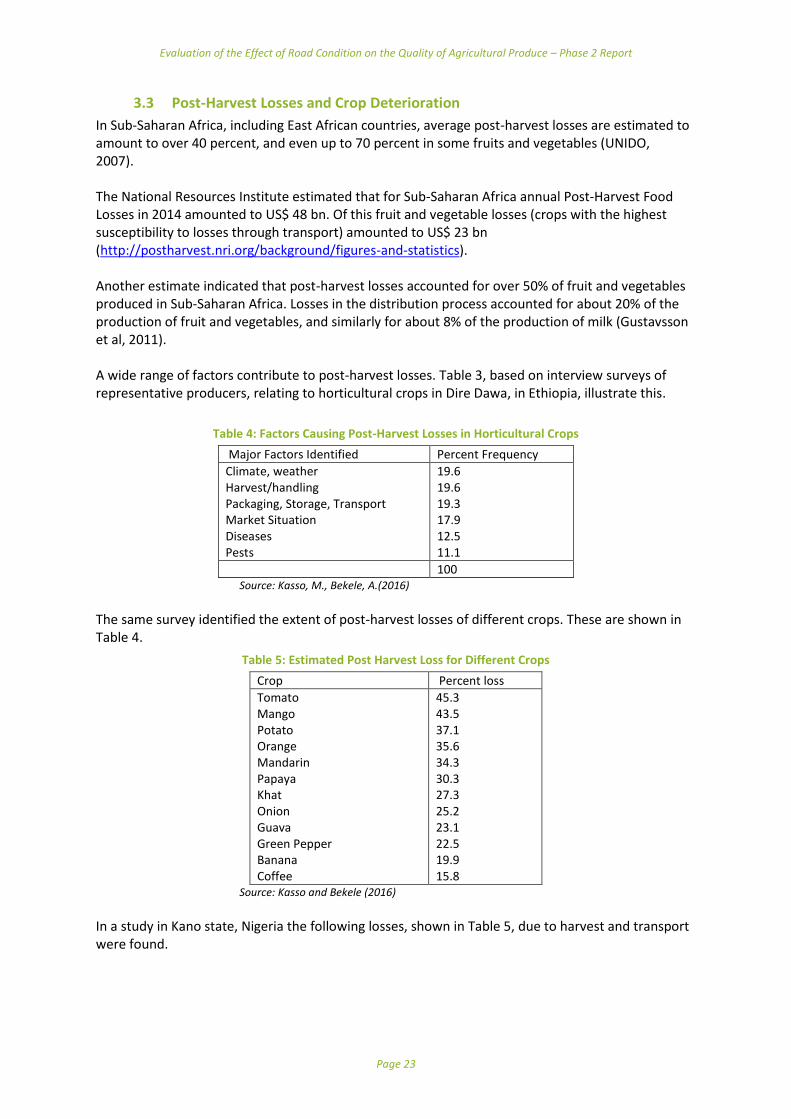
3.2.7 The Important of Produce Consolidation
Unlike large scale farming where high volumes are produced and therefore can be collected in one farm, the nexus between smallholder farming and transport is made complicated by the fact the production is on small farms spread over a wide spatial territory. Consolidation of produce into viable volumes system and coordination with traders/transporters is crucial in order for farmers to jointly achieve economies of scale. Load consolidation happens at strategically located places along a motorable road, buying posts or bus and truck stops.
Figure 4: Backloading and Animal Transport are common in Load Consolidation
Farm, Tomato price Tsh. 10,000/ 60 kg bag
1-4 km Roadside Collection point, price Tsh. 14,000/ 60 kg
10-40 km
Iringa Collection Market, price Tsh 18,000/ 60 kg
500 km
Dar es Salaam Market, price Tsh 35,000/ 60kg
Evaluation of the Effect of Road Condition on the Quality of Agricultural Produce – Phase 2 Report
Page 23
3.3 Post-Harvest Losses and Crop Deterioration
In Sub-Saharan Africa, including East African countries, average post-harvest losses are estimated to amount to over 40 percent, and even up to 70 percent in some fruits and vegetables (UNIDO, 2007). The National Resources Institute estimated that for Sub-Saharan Africa annual Post-Harvest Food Losses in 2014 amounted to US$ 48 bn. Of this fruit and vegetable losses (crops with the highest susceptibility to losses through transport) amounted to US$ 23 bn (http://postharvest.nri.org/background/figures-and-statistics). Another estimate indicated that post-harvest losses accounted for over 50% of fruit and vegetables produced in Sub-Saharan Africa. Losses in the distribution process accounted for about 20% of the production of fruit and vegetables, and similarly for about 8% of the production of milk (Gustavsson et al, 2011). A wide range of factors contribute to post-harvest losses. Table 3, based on interview surveys of representative producers, relating to horticultural crops in Dire Dawa, in Ethiopia, illustrate this.
Table 4: Factors Causing Post-Harvest Losses in Horticultural Crops
Major Factors Identified Percent Frequency
Climate, weather Harvest/handling Packaging, Storage, Transport Market Situation Diseases Pests
19.6 19.6 19.3 17.9 12.5 11.1
100 Source: Kasso, M., Bekele, A.(2016)
The same survey identified the extent of post-harvest losses of different crops. These are shown in Table 4.
Table 5: Estimated Post Harvest Loss for Different Crops
Crop Percent loss
Tomato Mango Potato Orange Mandarin Papaya Khat Onion Guava Green Pepper Banana Coffee
45.3 43.5 37.1 35.6 34.3 30.3 27.3 25.2 23.1 22.5 19.9 15.8
Source: Kasso and Bekele (2016)
In a study in Kano state, Nigeria the following losses, shown in Table 5, due to harvest and transport were found.
Evaluation of the Effect of Road Condition on the Quality of Agricultural Produce – Phase 2 Report
Page 24
Table 6: Losses in Tomatoes and Peppers during Harvest and Transport
Crop Loss during harvest Loss during transport
Tomato Bell Pepper Hot Pepper
20% 12% 8%
28% 15% 10%
Source: Olayemi et al (2010)
However many causes of losses were found including insects, pests, infection, heat, inadequate storage, picking when fully ripe, poor packaging, as well as vibration during transport. Improving the First Mile or, the initial stages crop movement from farm to the first collection point and market, could reduce crop losses in a variety of ways. These are:
By bringing a truck closer to the farm the need for extra loading/unloading onto motorcycles, donkeys and human transport might be reduced
Improved riding surfaces will reduce shocks and vibrations
A quicker and more reliable distribution system will help reduce the time taken for produce to get to market and thus reduce possible deterioration due to time and temperature
The earlier First Mile study undertaken for AFCAP in Kenya reported that manhandling of onions by head back loading as well as loading onto vehicles was a significant cause of damage. It was also found that farmers frequently complained that their crops spoilt when promised transport did not arrive close to the farm (Njenga et al, 2014). However there is a lack of research to quantify the benefits of reduced crop deterioration from improved First Mile transport. Nevertheless there have been a number of studies to show how vehicle vibrations will damage different crops. A pilot study was undertaken that measured the accelerations within trucks carrying tomatoes in California over a 25 km route. These were then matched against the road roughness of the route measured by the International Roughness Index (IRI). A laboratory test was then carried out to see how damage on tomatoes would change with changes in road roughness. For a 60 second test tomato damage was found to rise from 26.5% to 29.3% with a rise in IRI from 1 to 6. And failure (i.e. tomatoes could not be sold), was found to rise from 6.7% to 7.35% for the same change in IRI (Steyn et al, 2014). In a study of damage to tangerines on different road surfaces, in Thailand, it was found that asphalt roads had the least damage, while there was greater damage on laterite and concrete roads. However faster speeds also gave greater damage. The results, derived from 30 minute travel segments, are summarised in Table 6 (Bundit et al. 2005).
Table 7: Percentage of Damaged Fruit (Tangerines)
Vehicle Type Speed kph Laterite Asphalt Concrete
Pickup (2 Tons)
20 40 80
4% 8.6% -
1.7% 2% 3%
3.3% 4.7% 6%
Truck (6 tons)
20 40 80
7.3% 10% -
4.3% 5% 8.3%
6.7% 11% 12.7%
Source: Bundit et al (2005)
The fruit was packed in plastic containers, and as with other studies, the top baskets suffered greater damage than those lower down in the stack. As one might expect other studies have confirmed that load vibrations are a function of road surface condition (roughness) and vehicle speed, and the degree of loading. A study in China confirmed that

Evaluation of the Effect of Road Condition on the Quality of Agricultural Produce – Phase 2 Report
Page 25
high road roughness and higher speed give higher vibrations, and perhaps surprisingly, overloaded trucks have less vibrations than trucks with normal loads (Ran Zuo et al, 2015). In a study of fresh fig deterioration in Turkey it was found that different varieties of figs responded in different ways to road vibration damage. So Sarilop suffered more on “off-road” surfaces than Black Bursa or Yediveren. However the reverse was the case for transport on highways. It appears that the different frequencies of vibration encountered on “off-road” and highways had marked different effects on the different varieties. This study also analysed the effects of different packing materials. Extruded polystyrene boxes were better than expanded polystyrene or cardboard boxes, which preformed worse than all. In assessing deterioration of the figs a range of different factors were observed including cracking, mould formation, shrivelling, peeling, loss of mass, off colour etc (Çakmak et al, 2010). Similarly a number of laboratory experimental studies have investigated how crops deteriorate when subject to vibration with different loading arrangements and packaging materials. An analysis of the damage to strawberries packed in crates was carried out in Italy and it was found that the length of vibration time significantly increased the microbiological load and reduced quality. Variations in microbiological load were also found according to the location of the crates in the loading column. So bacteria increased in the bottom boxes faster than those placed higher up, while moulds and yeasts increased faster in the higher boxes than those lower down (La Scalia et al, 2015). A study simulated transport damage on tomatoes was carried out in Nigeria. Results are shown in Table 7.
Table 8: Damage to Tomatoes after 4 hours of Vibration Stressing (Approx 2100 km Journey by Road)
Position in loading column
Traditional Basket - after vibration
Plastic Basket -after vibration
Traditional Basket -after vibration and 24 hrs storage
Plastic Basket -after vibration and 24 hrs storage
Top Middle Bottom
40% 37.5% 45%
44.18 % 30.23 % 18.10 %
77.5% 82.5% 90%
67.4% 41.9% 25%
Source: Idah et al (2012)
The percentage weight loss, after a period of 24 hours storage, for tomatoes in the traditional basket was around five times that of tomatoes in the plastic basket. This was due to the greater evaporation of moisture in the damaged fruits. Although fruit and vegetables have been the main focus of crop deterioration due to transport other produce has also been studied. For example milk deterioration is of major concern when temperature control for storage and collection transport, prior to processing, is inadequate. A study in Zimbabwe found that 94% of producers have had milk rejected at least once per month. 83% of rejections were due to sour milk resulting from long delivery times (for 40% of farms it takes over 4 hours to transport from farm to processor). Vehicle breakdowns are a particular problem when the vehicles do not have effective cooling systems (Gwezuva, 2011). Other studies have drawn attention to the adverse effects of moving livestock by vehicle (Grandin, 2000). Overall the studies indicate that firstly transport may be a major factor in crop in crop deterioration and that secondly the topic is very complex with a wide range of issues to take into account.
Evaluation of the Effect of Road Condition on the Quality of Agricultural Produce – Phase 2 Report
Page 26
Overall the studies show that crop deterioration during transport is the result of a complex interaction of:
The shocks received by the crop as it is packed and loaded and unloaded onto and off different transport modes and vehicles
The ripeness and age of the produce
The way the crop is packed and packing materials used
The position of the crop in the loading column within the vehicle
Vibrations encountered during transport from road roughness and vehicle speed
Temperature and humidity
Cleanliness, the microbiological load and presence of pests and diseases
The time spent in storage and in transport
It is also clear that there are clearly big differences in the sensitivity of crops to deterioration. Hence factors that are very important for one crop will be less important for another.
3.3.1 The Way Forward
What are the lessons from previous research for this study? The project team clearly needs to be aware of the key factors that might affect deterioration of particular crops, however there is insufficient time and resources to undertake the type of detailed experiments outlined in the literature. In terms of benefits to farmers and to the wider society the goal should not be to minimise crop deterioration at all costs. Expensive packaging, or carrying goods in light trucks may minimise crop losses. However the associated extra packaging and transport costs may be greater than the value of reduced crop losses compared with the alternative using less expensive packaging and heavier trucks. The optimum costs and benefits of different solutions should be explored.
3.4 Community Driven Development
The Inception Report indicated that the objectives of this First Mile research project could in part be met through a Community-driven development (CDD) approach, which has been successfully applied to the rural transport sector, and was adopted by the Village Travel and Transport Programme (VTTP) in Tanzania. CDD is a development initiative that provides control of the development process, resources and decision making authority directly to groups in the community.
The underlying assumption of CDD projects is that communities are the best judges of how their lives and livelihoods can be improved and, if provided with adequate resources and information, they can organise themselves to provide for their immediate needs. CDD projects work by providing poor communities with direct funding for development with the communities then deciding how to spend the money. Lastly, the community plans and builds the project and takes responsibility for monitoring its progress.
The primary principle underlying CDD is viewing poor people as assets and partners in the development process. Well-designed CDD programmes give a voice to those often excluded from community decision-making: women, elderly, youth, religious and ethnic minorities etc. ‘The power of the poor to negotiate will be increased when all groups of the poor are included in a dialogue with the government, private sector and civil society’ (World Bank, 2005).
The World Bank recognises that CDD approaches and actions are important element of an effective poverty reduction and sustainable development strategy, and since 2000, 115 countries have undertaken projects that apply a CDD approach worth $28 billion (World Bank, 2017). The Bank has supported CDD across a range of low to middle income, and conflict-affected countries (including Nigeria, Liberia, South Sudan and Myanmar) to respond to a variety of urgent needs, including water
Evaluation of the Effect of Road Condition on the Quality of Agricultural Produce – Phase 2 Report
Page 27
supply and sanitation, school and health post construction, nutrition programs for mothers and infants, rural access roads, and support for micro-enterprises (World Bank, 2017).
The World Bank (2017) denotes five key characteristics of CDD projects:
1. A CDD operation primarily targets a community-based organisation or a representative local council of a community. This community focus means that the essential defining characteristic of a CDD project is that the beneficiaries are agents of the community. Since the focus on small communities is so large the CDD normally targets small scale sub-projects in the community.
2. In CDD operations, community or locally based representation is responsible for designing and planning the sub-projects in a participatory manner. Since the concentration on participatory planning is considerable in CDD operations, often the possible types of sub-project investment options are very broad, with only a small list of sub-projects that cannot be supported.
3. The defining characteristic of CDD projects is that a transfer of resources to the community occurs and control of the resources is delegated to the community. The amount of transfer and control of resources will depend on the CDD implementation approach.
4. The community is directly involved in the implementation of the sub-project. Often the participation of the community comes directly in the form of labour or funds. However, the community may also contribute to the sub-project indirectly in the form of management and supervision of contractors or the operation and maintenance of the infrastructure when complete.
5. An element of community-based monitoring and evaluation has become a characteristic of CDD sub-projects. Most often it is social accountability tools such as participatory monitoring, community scorecards and grievance redress systems which allow for the community to ensure accountability of the CDD implementation.
In addition, in 2008 TRL was commissioned by the World Bank to prepare Guidelines for the Planning and Design of Rural Access Infrastructure to support Community Driven Development initiatives, in order to meet the needs of small scale infrastructure interventions at the community level. In the context of rural access, Done (2008) cites Winklemann (1999), emphasising some preconditions for CDD rural access projects:
The need for access is felt throughout the community,
There is support from all groups within the community for the details of the agreed project,
Communities have a sense of cohesion, supportive leaders and a tradition of self-help, commitment and contribution of various resources, including labour, to community programmes,
Communities are able to lead the project,
Access projects are technically and socially feasible in terms of long term funding, required technical knowledge and resources for maintenance,
The access projects are compatible with the external road network and the vehicles travelling on it,
The access works are mainly used by the community and for the benefit of the community
Local and central government and, where relevant, NGOs, have a supportive attitude and policies towards community projects,
Even if external parties become involved in the project, the long term ownership will remain with the communities,

Evaluation of the Effect of Road Condition on the Quality of Agricultural Produce – Phase 2 Report
Page 28
The project is not seen solely as a source of income as this can reduce feelings of ownership and self-help,
External parties support the process but do not lead or dominate.
3.4.1 Rural Transport Infrastructure and CDD
The World Bank recognises at least two important categories relevant to rural transport infrastructure (RTI) and CDD (World Bank, 2003), this is shown in Table 8.
Table 9: Authorities Responsible for Rural Transport Infrastructure
Responsible Authority Type
District Local authority (“Government”) Roads connecting villages with the
district headquarters minor waterways
and associated ferries.
Community Village Council / Community Based
Organisation (“Communal or Private”)
Roads,4 tracks, paths within the village
and those providing access from the
village to farms and other socio-
economic activities.
District level RTI is the lowest level managed by government. Government has tax authority and relies on the budget to cover required expenditures. Community level RTI directly serves the community and is owned by the community, or association of villages or users. There are various design factors for rural access infrastructure. For the First Mile, between the farm and nearest established road, access need is of greatest concern to users, with a particular emphasis on reliability and safety. Basic Access is provided by improving only those sites where access is impossible, at risk or unsafe and leaving passable sites unimproved; these are referred to as spot improvements. An important distinction is made between different types of access duration (Done, 2008):
All weather access: the road can be used all year and during heavy rain,
All season access: the road can be used all year but may be temporarily impassable during heavy rain when streams are full and soils may be slippery,
Dry season access: the road is impassable for long periods during the wet season. Unclassified roads usually constitute the largest part of the overall road network (in Zambia for example, 65% of the road network is estimated to be ‘ungazetted’), with the exact length and location of such roads rarely well documented. Often, due to a lack of clear ownership arrangements and lack of local government capacity, communities are given the task of managing roads that belong to and should be taken care of by government (World Bank, 2003). Given the low volumes of motorised traffic typically experienced over the First Mile and the extent of such unclassified networks across countries in Sub-Saharan Africa, all season access is normally appropriate for small-hold farmers, given that these initial movements generally take place on local paths and tracks, either on foot or using intermediate means of transport (IMT). However, Done (2008) notes that the required access duration also depends on seasonal activities, and especially the harvesting and marketing of crops.
4 For roads, also read rivers, waterways, canals and associated jetties and wharves in certain situations.

Evaluation of the Effect of Road Condition on the Quality of Agricultural Produce – Phase 2 Report
Page 29
An important consideration for First Mile road condition, is that rural access infrastructure must be maintainable. This is a vital consideration for avoiding investment failure, and Done (2008) asserts that ‘a rural access project should not go ahead if the work will not and cannot be maintained.’ The World Bank (2003) go further to say ‘Do not improve infrastructure beyond the limit of what can be maintained in the future.’ Different construction and maintenance technologies that are available for CDD are equipment based, labour based supported by powered machinery, labour based supported by draught animal power and labour intensive where minimal machinery is used. Labour based operations normally maximise the benefit to the local economy and the sense of community ownership and are less dependent on fuel, imported spare parts and external suppliers but require good supervision, prompt payment and available local labour when the work is scheduled.
Figure 5: Labour Based Road Construction
The guiding principle is that the engineering standard of a road, track, path, waterway, footbridge or wharf should be determined by the type and volume of traffic that uses the infrastructure. Infrastructure that is over-designed is more expensive to build, but can also be more expensive to maintain (World Bank, 2003). Engineering interventions for First Mile infrastructure are explored further in the next section.
3.4.2 Enabling Environment for CDD
The factor that has the greatest influence on the success of a rural access project is the community itself, and Done (2008) identifies the following ways in which a community can influence a project:
The sense of ownership of the project,
The commitment to the construction and long term maintenance,
The contributions that can be made (labour, land, money, materials, etc),
The groups that can be formed to manage and construct the works (often by separate groups from within the community),
The cooperation that is possible with neighbouring communities which can work on and benefit from each other’s projects,
The knowledge of local conditions that can improve the planning and design process
The technical capacity that can be used,
The way in which all sectors in the community can be involved in the project, without being exploited in any way.
Local and central government can also influence the success of a CDD project. If government is supportive of self-help projects, rural development, rural location of services and facilities, labour based methods, the small contracting sector and the development of designs and standards appropriate to access roads,5 and has a competent and decentralised structure, community led rural
5 including the closure of such roads during heavy rain and the blocking of access to trucks.

Evaluation of the Effect of Road Condition on the Quality of Agricultural Produce – Phase 2 Report
Page 30
travel initiatives of all kinds are likely to be successful; if not, these projects are unlikely to succeed. Rural access infrastructure must be designed with available funding in mind (Done, 2008). Table 9 shows a summary of institutional arrangements, including roles and responsibilities for RTI (World Bank, 2003).
Table 10: Institutional Arrangements for Rural Transport Infrastructure
Identification Planning Implementation and
maintenance
Labour
District roads District Engineer
or local people
Local authority
leads, community
consulted
By contractors or
force account
Paid
Community
roads, paths and
tracks
Local people Community leads,
local authority
supports
Often by community
effort with limited
outside support
Often
unpaid
Adequate long term funding must also be available if rural access infrastructure is to be well constructed and maintained. There are many possible sources of funding, including community contributions, local income generation such as tolls and market taxes, NGOs, local government, regional and central government allocations (some of which may be based upon poverty or population levels) and external donors (Done, 2008). Alternatively, First Mile access may benefit more from improvements in transport service provision and non-transport interventions, particularly where there is no rural transport infrastructure to speak of, as outlined in the following Table (World Bank, 2003). Different interventions are outlined in Table 10.
Table 11: : Alternative Solutions to Access Problems
Improvement to physical
infrastructure
Improvement in
transport services Non-transport interventions
Construction /
upgrading /
rehabilitation
Spot
improvements/spot
repairs
Road maintenance
Improved footpaths –
safer / made
accessible to bicycles
and carts
Improved waterways
– better
wharves/jetties.
Community owned or
managed
bus/motorcycle
services
Ferries
Bicycles/motorcycles
Motorcycle
ambulances
Animal carts
Improved collective
transport
arrangements out of
community i.e.
collection points for
crops/people.
Relocation of improvement/upgrading of services
into community e.g. health posts, informal
education, resident agri-extension workers, water
provision, fire wood cultivation
More fuel efficient stoves
Improve telecommunications
Crop diversification – less perishable/subject to
damage, low volume/weight but high value crops
Improved services/facilities at collection
points/service points outside community, e.g.
proper storage, waiting
area/accommodation/sanitation facilities, secure
parking for trucks/bicycles, boarding
accommodation for students
Agro-processing in situ – reduces
perishability/volume and allows transportation in
Evaluation of the Effect of Road Condition on the Quality of Agricultural Produce – Phase 2 Report
Page 31
season when access easiest and value higher.
The next section explores some of these rural access infrastructure themes further, and in particular the potential engineering interventions that could be utilised to improve First Mile accessibility.
3.5 First Mile Engineering Interventions
Many minor rural roads and tracks in SSA are in poor condition. Low traffic levels can make it difficult to justify (using conventional cost-benefit procedures) the use of scarce funds to repair and then maintain them. Vehicles break down and bus operators avoid the bad roads, particularly in the wet season, or charge high fares. As a result, vehicle travel can become impossible, difficult, time consuming or expensive (Ellis and Hine, 1997; Ahmed, 2010). If travel becomes difficult this will obviously have knock-on effects on the frequency of travel and on accessing key facilities such as health centres, markets, sites of learning and employment, as well as affecting social support networks and visting family and friends (Hine and Rutter, 2000; Porter, 2013) There are strong reasons for considering partial or spot improvement in the context of community driven development and rural transport infrastructure, including the following (World Bank, 2003):
Communities are often more concerned with improved access than with smoother or faster routes. Access can be achieved cheaply and easily by focusing on the improvement of the main bottlenecks in the system (for example, where traffic is interrupted in the rainy season),
Traffic levels on the lower end of the transport infrastructure network are often so low that full rehabilitation is not economically justifiable,
Spot improvement allows a fixed amount of investment to be spread over a wider geographical area giving greater impact,
The highest economic return per unit of investment is usually gained by carrying out the minimum works necessary to open up access on a route to more efficient forms of transport,
The scale of work required for spot improvement is more achievable through voluntary community efforts than full rehabilitation.
Unsurprisingly, investment in roads and the associated water crossing structures are expensive. Given the fact that most farm roads are rural and may carry few vehicles per day may not warrant the use of expensive pavements such as those on roads carrying high volume of traffic. Nevertheless, it is important that the access from the farms to the markets or first collection points should have adequate strength and serviceability required for the purpose. In order to be cost effective in the provision of year-round access, it is important to keep in mind the philosophy of using construction materials “fit for purpose”. This means making the best use of materials that are locally available, as opposed to hauling for long distances, materials whose properties far surpass the requirements. It is important to use materials in such a way that they are neither sub-standard nor wasteful above the standards demanded by their engineering task. Therefore the philosophy for dealing with such roads should be to make them with earth; apply spot improvements in sections likely to encounter seasonal problems; use simple tools and equipment; and use methods that can be easily implemented and maintained by the community. Hindson (1983) defines two main classifications of earth road, village roads and market roads. A village road is the smallest, cheapest road or track, which may run from one small village to another or to a farm, a small settlement, a school or a dispensary. A market road on the other hand would run to a market, a food-buying depot, a rural development scheme or other important rural centre where traffic might amount to ten or twenty vehicles a day. Hindson (1983) acknowledges that at this level, it may be expensive to gravel the whole road, and thus proposes using earth for such
Evaluation of the Effect of Road Condition on the Quality of Agricultural Produce – Phase 2 Report
Page 32
roads and only spot gravelling areas where water may pond and turn the soil into mud. The author discusses, to a great length, approaches of keeping water off the road. An important point raised by the author is the need to elevate the carriageway at least 30 cm above the ground or the side drain. This ensures that the road is mostly dry all season and thus facilitating all-season truck access. The author points out the need to remember that as the country develops, village roads may turn into market roads. The village roads should therefore not be located on steep gradients (gradients more than 1 in 12) where loaded trucks going to the market may not be able to climb in wet and slippery conditions. IT Transport (2002) address the provision of foot paths and tracks in four major sections, planning and organisation, design and construction, footbridges, and maintenance. Under the topic of organisation and planning, they stress the need to foster a sense of community ownership. Strategies for working with the community are discussed in a step-by-step process. Key steps include the need to investigate community willingness to contribute resources and mobilisation of the community to discuss organisation of the work. Labour-based approaches of construction are detailed. Donnges (2003) discusses the planning necessary to improve rural accessibility. At the core of this is the need to involve the community in the phases of planning, design, implementation and maintenance of any infrastructure project. This will optimise the use of local resources.
3.5.1 Roughness, corrugations and vibrations
Road roughness is usually measured in terms of the international roughness index (IRI). IRI is a standardised roughness measurement related to those obtained by response-type road roughness measurement systems, with recommended units: metres per kilometre (m/km). It is a ratio of accumulated suspension motion of a vehicle (in, mm, etc) divided by the distance travelled by the vehicle during the test (mi, km, etc) (Sayers, Gillespie, & Paterson, 1986). It therefore follows that roads with high IRI will have a high detrimental effect on vehicle suspensions and the goods they carry. The scale in Figure 6 is a good indication of the effect of different roughness values on the safe operating speeds.
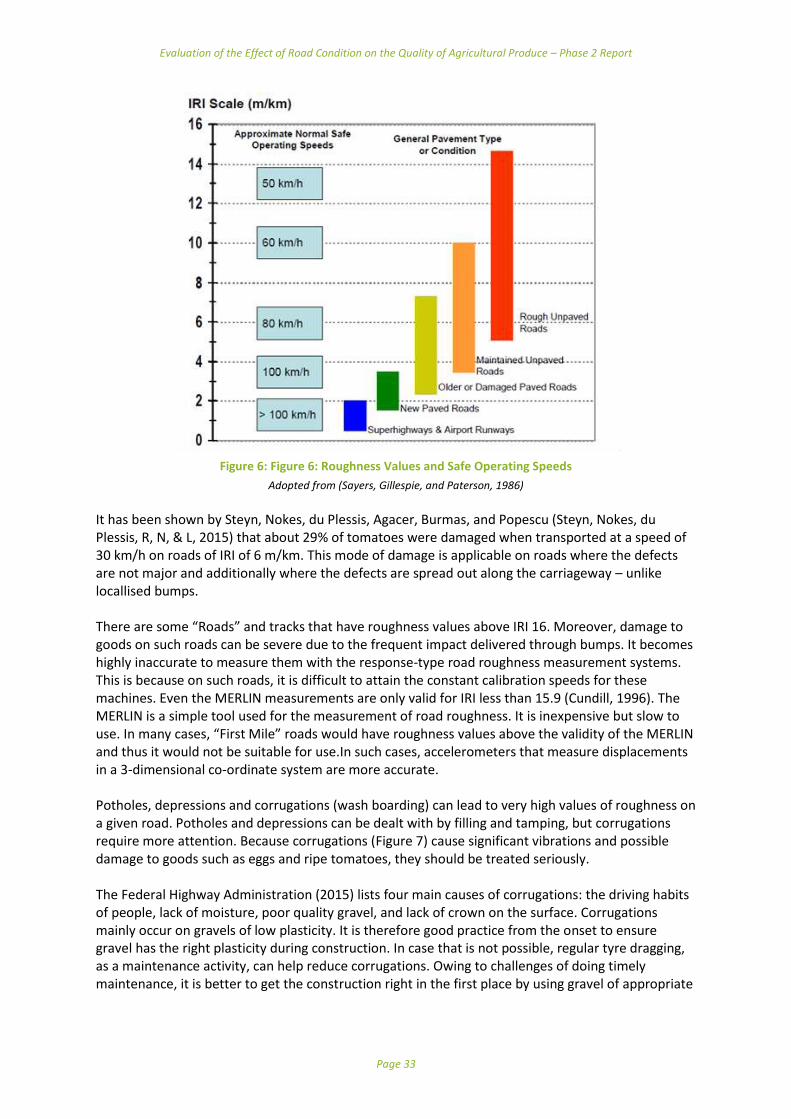
Evaluation of the Effect of Road Condition on the Quality of Agricultural Produce – Phase 2 Report
Page 33
Figure 6: Figure 6: Roughness Values and Safe Operating Speeds
Adopted from (Sayers, Gillespie, and Paterson, 1986)
It has been shown by Steyn, Nokes, du Plessis, Agacer, Burmas, and Popescu (Steyn, Nokes, du Plessis, R, N, & L, 2015) that about 29% of tomatoes were damaged when transported at a speed of 30 km/h on roads of IRI of 6 m/km. This mode of damage is applicable on roads where the defects are not major and additionally where the defects are spread out along the carriageway – unlike locallised bumps. There are some “Roads” and tracks that have roughness values above IRI 16. Moreover, damage to goods on such roads can be severe due to the frequent impact delivered through bumps. It becomes highly inaccurate to measure them with the response-type road roughness measurement systems. This is because on such roads, it is difficult to attain the constant calibration speeds for these machines. Even the MERLIN measurements are only valid for IRI less than 15.9 (Cundill, 1996). The MERLIN is a simple tool used for the measurement of road roughness. It is inexpensive but slow to use. In many cases, “First Mile” roads would have roughness values above the validity of the MERLIN and thus it would not be suitable for use.In such cases, accelerometers that measure displacements in a 3-dimensional co-ordinate system are more accurate. Potholes, depressions and corrugations (wash boarding) can lead to very high values of roughness on a given road. Potholes and depressions can be dealt with by filling and tamping, but corrugations require more attention. Because corrugations (Figure 7) cause significant vibrations and possible damage to goods such as eggs and ripe tomatoes, they should be treated seriously. The Federal Highway Administration (2015) lists four main causes of corrugations: the driving habits of people, lack of moisture, poor quality gravel, and lack of crown on the surface. Corrugations mainly occur on gravels of low plasticity. It is therefore good practice from the onset to ensure gravel has the right plasticity during construction. In case that is not possible, regular tyre dragging, as a maintenance activity, can help reduce corrugations. Owing to challenges of doing timely maintenance, it is better to get the construction right in the first place by using gravel of appropriate

Evaluation of the Effect of Road Condition on the Quality of Agricultural Produce – Phase 2 Report
Page 34
plasticity or earth. Sometimes blending non-plastic gravel with soil (subgrade material) can dramatically improve its quality, and this should always be explored.
Figure 7: Corrugated road
Source: (Federal Highway Administration, 2015)
Figure 8 presents a chart for the selection or blending of appropriate gravels for surfacing.
Figure 8: Gravel Selection/Blending Chart
Source: (Mukura, 2008)
Where
a) Ip0.075 = the Plasticity Index of the material passing the 0.075mm sieve b) Plasticity Product (PP) = Ip0.075x P0.075
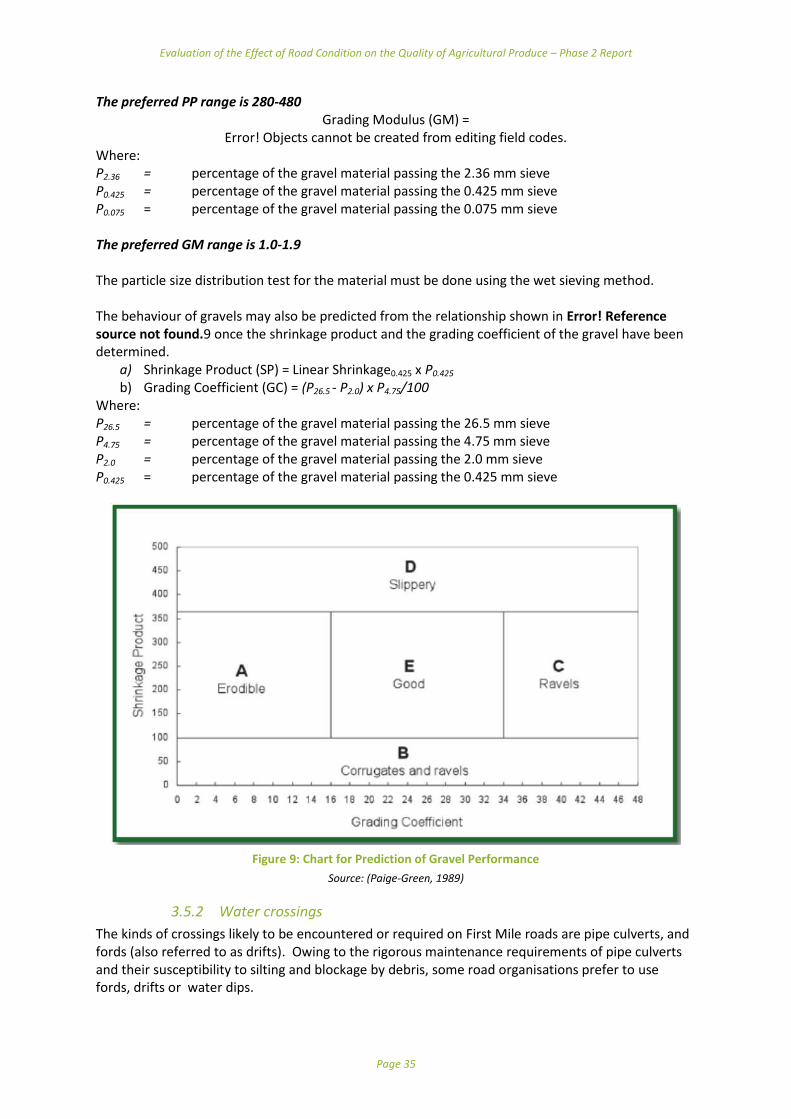
Evaluation of the Effect of Road Condition on the Quality of Agricultural Produce – Phase 2 Report
Page 35
The preferred PP range is 280-480 Grading Modulus (GM) =
Error! Objects cannot be created from editing field codes. Where: P2.36 = percentage of the gravel material passing the 2.36 mm sieve P0.425 = percentage of the gravel material passing the 0.425 mm sieve P0.075 = percentage of the gravel material passing the 0.075 mm sieve The preferred GM range is 1.0-1.9 The particle size distribution test for the material must be done using the wet sieving method. The behaviour of gravels may also be predicted from the relationship shown in Error! Reference source not found.9 once the shrinkage product and the grading coefficient of the gravel have been determined.
a) Shrinkage Product (SP) = Linear Shrinkage0.425 x P0.425 b) Grading Coefficient (GC) = (P26.5 - P2.0) x P4.75/100
Where: P26.5 = percentage of the gravel material passing the 26.5 mm sieve P4.75 = percentage of the gravel material passing the 4.75 mm sieve P2.0 = percentage of the gravel material passing the 2.0 mm sieve P0.425 = percentage of the gravel material passing the 0.425 mm sieve
Figure 9: Chart for Prediction of Gravel Performance
Source: (Paige-Green, 1989)
3.5.2 Water crossings
The kinds of crossings likely to be encountered or required on First Mile roads are pipe culverts, and fords (also referred to as drifts). Owing to the rigorous maintenance requirements of pipe culverts and their susceptibility to silting and blockage by debris, some road organisations prefer to use fords, drifts or water dips.
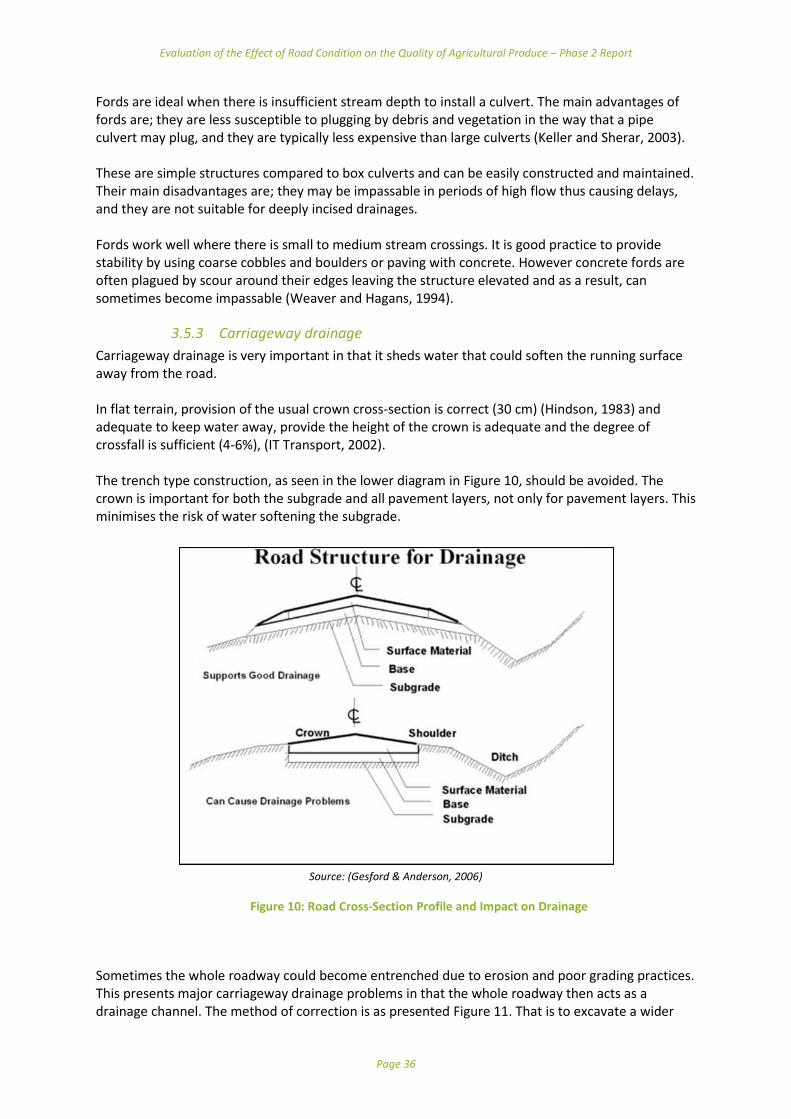
Evaluation of the Effect of Road Condition on the Quality of Agricultural Produce – Phase 2 Report
Page 36
Fords are ideal when there is insufficient stream depth to install a culvert. The main advantages of fords are; they are less susceptible to plugging by debris and vegetation in the way that a pipe culvert may plug, and they are typically less expensive than large culverts (Keller and Sherar, 2003). These are simple structures compared to box culverts and can be easily constructed and maintained. Their main disadvantages are; they may be impassable in periods of high flow thus causing delays, and they are not suitable for deeply incised drainages. Fords work well where there is small to medium stream crossings. It is good practice to provide stability by using coarse cobbles and boulders or paving with concrete. However concrete fords are often plagued by scour around their edges leaving the structure elevated and as a result, can sometimes become impassable (Weaver and Hagans, 1994).
3.5.3 Carriageway drainage
Carriageway drainage is very important in that it sheds water that could soften the running surface away from the road. In flat terrain, provision of the usual crown cross-section is correct (30 cm) (Hindson, 1983) and adequate to keep water away, provide the height of the crown is adequate and the degree of crossfall is sufficient (4-6%), (IT Transport, 2002). The trench type construction, as seen in the lower diagram in Figure 10, should be avoided. The crown is important for both the subgrade and all pavement layers, not only for pavement layers. This minimises the risk of water softening the subgrade.
Source: (Gesford & Anderson, 2006)
Sometimes the whole roadway could become entrenched due to erosion and poor grading practices. This presents major carriageway drainage problems in that the whole roadway then acts as a drainage channel. The method of correction is as presented Figure 11. That is to excavate a wider
Figure 10: Road Cross-Section Profile and Impact on Drainage
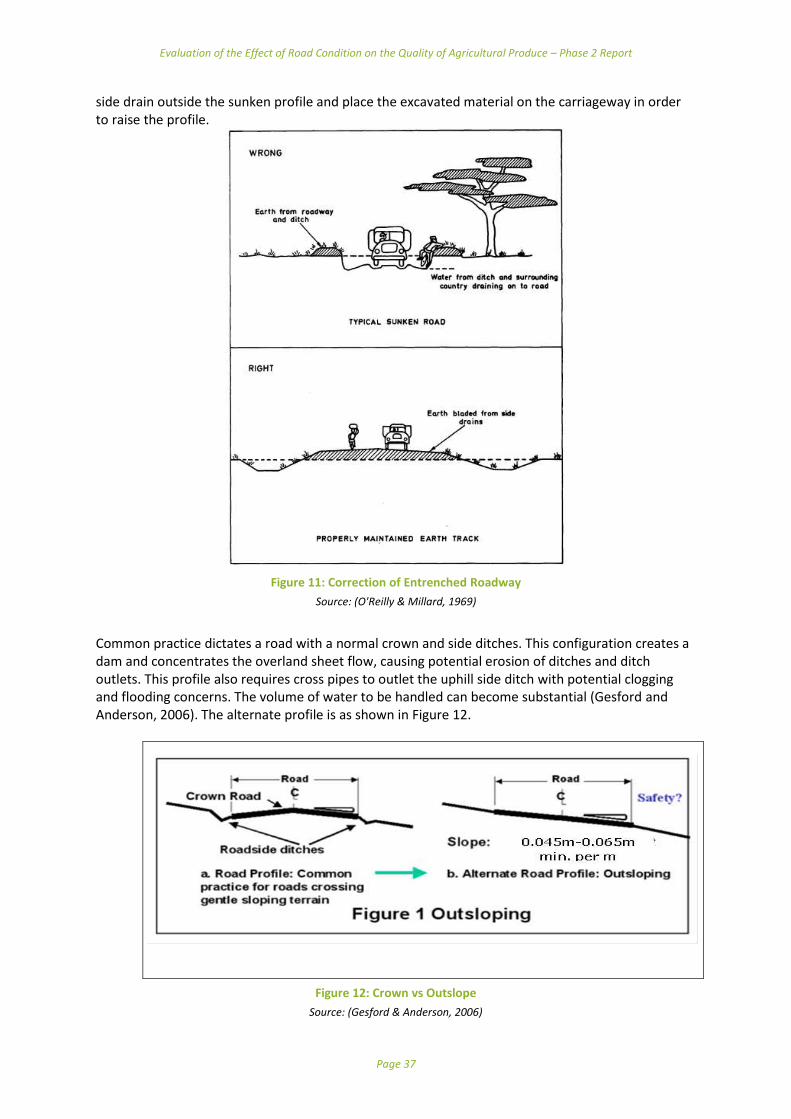
Evaluation of the Effect of Road Condition on the Quality of Agricultural Produce – Phase 2 Report
Page 37
side drain outside the sunken profile and place the excavated material on the carriageway in order to raise the profile.
Figure 11: Correction of Entrenched Roadway
Source: (O'Reilly & Millard, 1969)
Common practice dictates a road with a normal crown and side ditches. This configuration creates a dam and concentrates the overland sheet flow, causing potential erosion of ditches and ditch outlets. This profile also requires cross pipes to outlet the uphill side ditch with potential clogging and flooding concerns. The volume of water to be handled can become substantial (Gesford and Anderson, 2006). The alternate profile is as shown in Figure 12.
Figure 12: Crown vs Outslope
Source: (Gesford & Anderson, 2006)
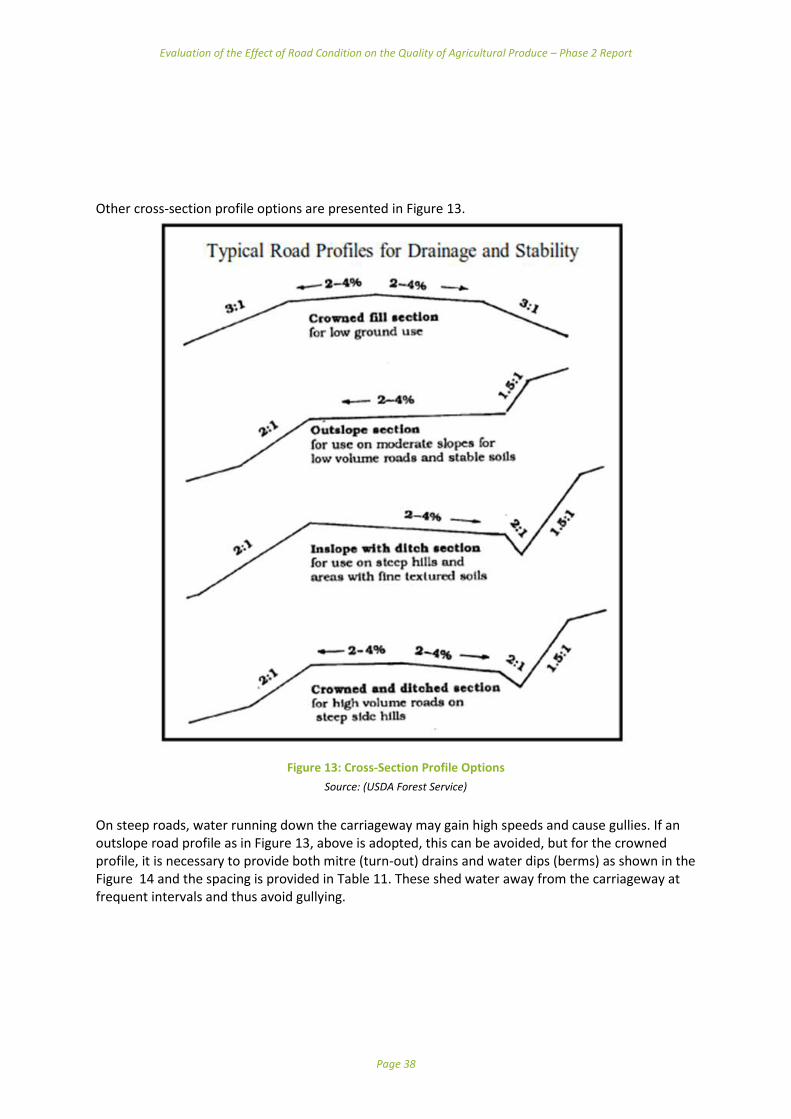
Evaluation of the Effect of Road Condition on the Quality of Agricultural Produce – Phase 2 Report
Page 38
Other cross-section profile options are presented in Figure 13.
Figure 13: Cross-Section Profile Options
Source: (USDA Forest Service)
On steep roads, water running down the carriageway may gain high speeds and cause gullies. If an outslope road profile as in Figure 13, above is adopted, this can be avoided, but for the crowned profile, it is necessary to provide both mitre (turn-out) drains and water dips (berms) as shown in the Figure 14 and the spacing is provided in Table 11. These shed water away from the carriageway at frequent intervals and thus avoid gullying.

Evaluation of the Effect of Road Condition on the Quality of Agricultural Produce – Phase 2 Report
Page 39
Source: (USDA Forest Service)
Figure 14: Water Bars for Carriageway Drainage
Table 12: Water Bar Spacing
Water Bar Spacing
Grade Spacing between dips or upland culverts
2% 76.20 m
5% 39.62 m
10% 24.38 m
15% 15.24 m
25%+ 12.19 m
Source: (USDA Forest Service)
Linked to carriageway drainage is the need to have adequate side drains and mitre drains – although with land constraints it becomes increasing difficult to find space to construct mitre drains at regular intervals. Appropriately spaced scour checks and mitre drains reduce the likelihood of gullying of drains and undermining of the carriageway. Wooden stakes and stones provide cheap materials for use in the construction and maintenance of scour checks as shown in Figure 15. Table 12 shows the recommended maximum spacing of the scour checks in relation to the road gradient, whereas Table 13 shows the recommended maximum mitre drain interval.
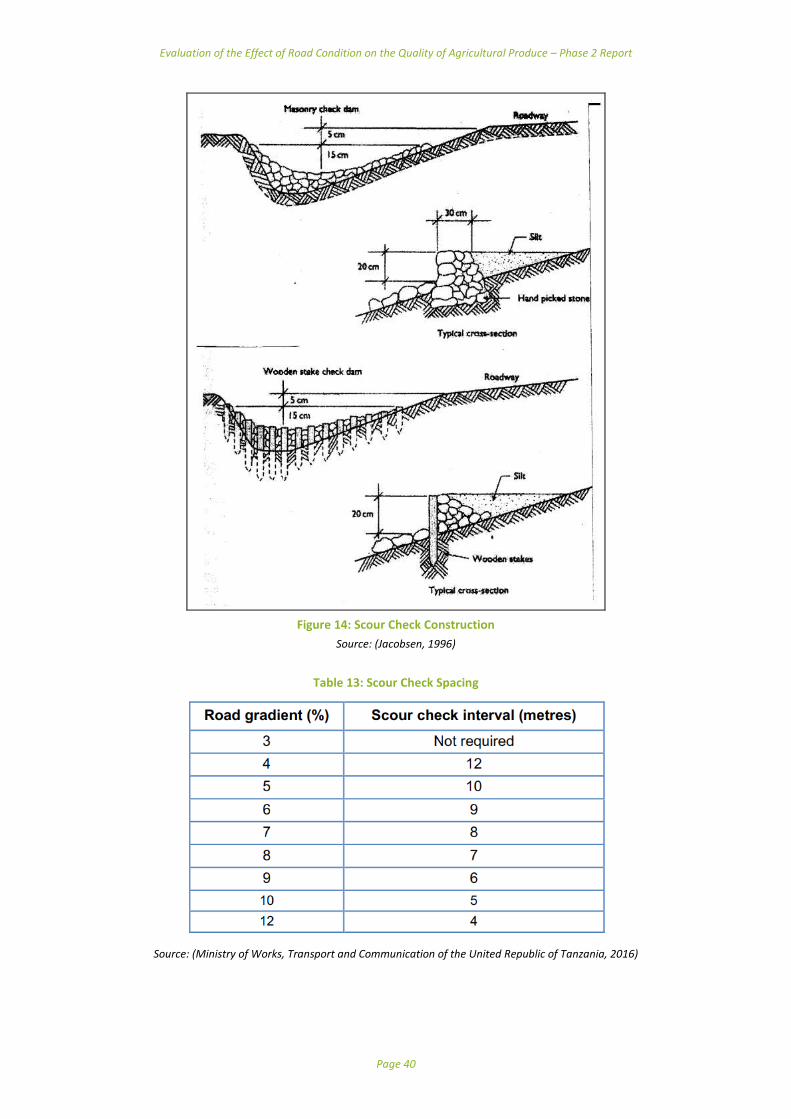
Evaluation of the Effect of Road Condition on the Quality of Agricultural Produce – Phase 2 Report
Page 40
Figure 14: Scour Check Construction
Source: (Jacobsen, 1996)
Table 13: Scour Check Spacing
Source: (Ministry of Works, Transport and Communication of the United Republic of Tanzania, 2016)

Evaluation of the Effect of Road Condition on the Quality of Agricultural Produce – Phase 2 Report
Page 41
Table 14: Mitre Drain Intervals
Source: (Jacobsen, 1996)
Notes: 1. A maximum of 100 m is preferred but not essential 2. At low gradients silting becomes a problem
Finally Stone-filled drains (French drains) at regular intervals across the road is quite a good option to ensure good drainage along the road (IT Transport, 2002). Constructing these at low points (sags) along the road is highly beneficial in removing muddy spots. This may be useful in areas where stones are abundant and a tractor or animal carts are available to transport them during construction or maintenance, otherwise this could prove expensive.
3.5.4 Dealing with weak subgrades
Most First Mile roads have an earth surface or poor quality gravel material with generally poor drainage, that has not been graded. In rainy seasons if drainage is poor on such roads, the subgrade will become soaked and therefore becomes weak. The result can be that vehicles carrying farm produce may be delayed for hours on muddy and damaged sections. The consequence of this is that farm produce may deteriorate. It is therefore important that weak subgrades be dealt with appropriately, which could include additional drainage and strengthening measures. The Federal Highway Administration (2015) recommends two ways of dealing with subgrades of poor drainage. It acknowledges that although it is extremely important that surface and sub-surface water flows off of and away from roadways, there are situations where water simply cannot be kept away. An example is a section of road that passes through swampland or wetlands which naturally cannot be drained. It proposes that the weak soils be excavated to spoil and replaced with drainable material or that geotextiles or geosynthetics be used in such circumstances. Given the high cost of geotextiles and geosynthetics, for First Mile roads, the former option is preferred to the latter. A much cheaper alternative to the use of geotextile is the Do-nou Technology, which according to The International Labour Organisation (2012) is a Japanese word that means wrapping soil in a gunny bag (Size: Do-nou bag- 45cm x 60cm). This technology applied to road maintenance involves use of these gunny bags to repair and maintain damaged sections of the road. The bags are filled appropriately with either sand or farm soil or gravel (murram), thereafter properly securing the bag opening with an appropriate string. The bags are laid in a systematic way, compacted and covered with a wearing course of gravelly material (murram). The bags have a high bearing capacity of up to 250 kN (Can carry an axle load of up to 25 tonnes), although the effectiveness of this technology is yet to be fully proven under all conditions. Proper community-based training is required for the use of this technique. The technique uses local materials, simple hand tools and labour as can be seen in Figure 16.
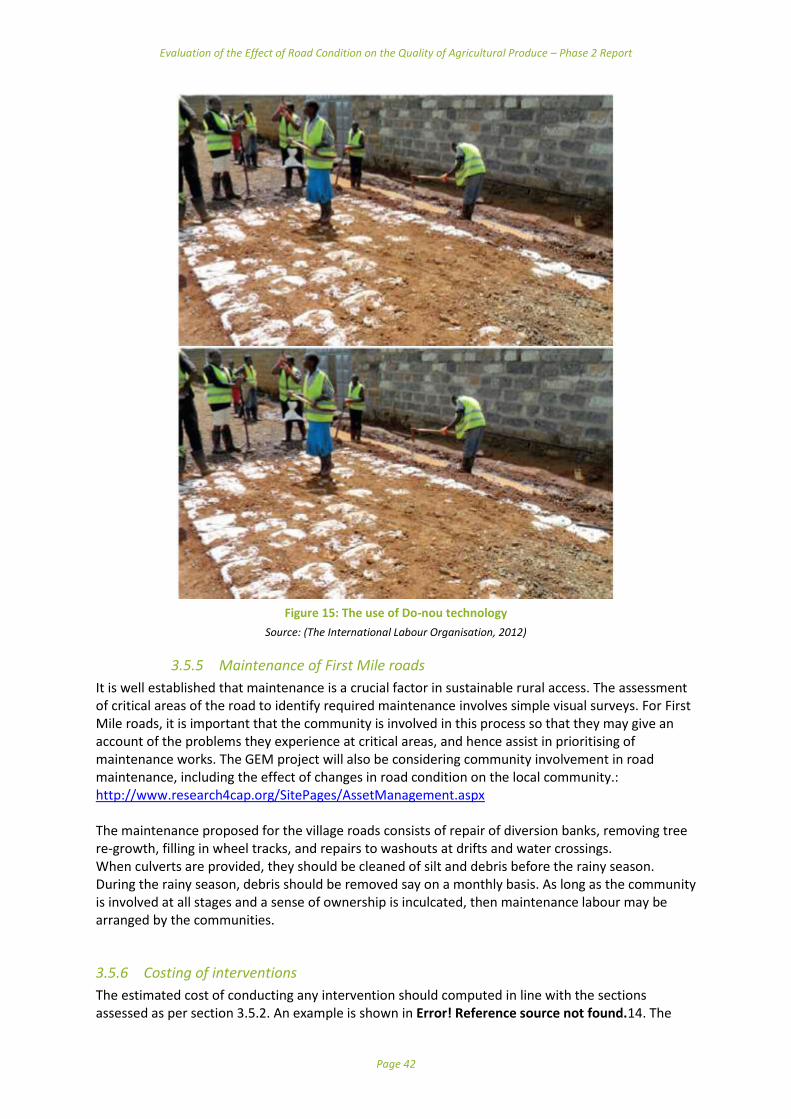
Evaluation of the Effect of Road Condition on the Quality of Agricultural Produce – Phase 2 Report
Page 42
Figure 15: The use of Do-nou technology
Source: (The International Labour Organisation, 2012)
3.5.5 Maintenance of First Mile roads
It is well established that maintenance is a crucial factor in sustainable rural access. The assessment of critical areas of the road to identify required maintenance involves simple visual surveys. For First Mile roads, it is important that the community is involved in this process so that they may give an account of the problems they experience at critical areas, and hence assist in prioritising of maintenance works. The GEM project will also be considering community involvement in road maintenance, including the effect of changes in road condition on the local community.: http://www.research4cap.org/SitePages/AssetManagement.aspx The maintenance proposed for the village roads consists of repair of diversion banks, removing tree re-growth, filling in wheel tracks, and repairs to washouts at drifts and water crossings. When culverts are provided, they should be cleaned of silt and debris before the rainy season. During the rainy season, debris should be removed say on a monthly basis. As long as the community is involved at all stages and a sense of ownership is inculcated, then maintenance labour may be arranged by the communities.
3.5.6 Costing of interventions
The estimated cost of conducting any intervention should computed in line with the sections assessed as per section 3.5.2. An example is shown in Error! Reference source not found.14. The
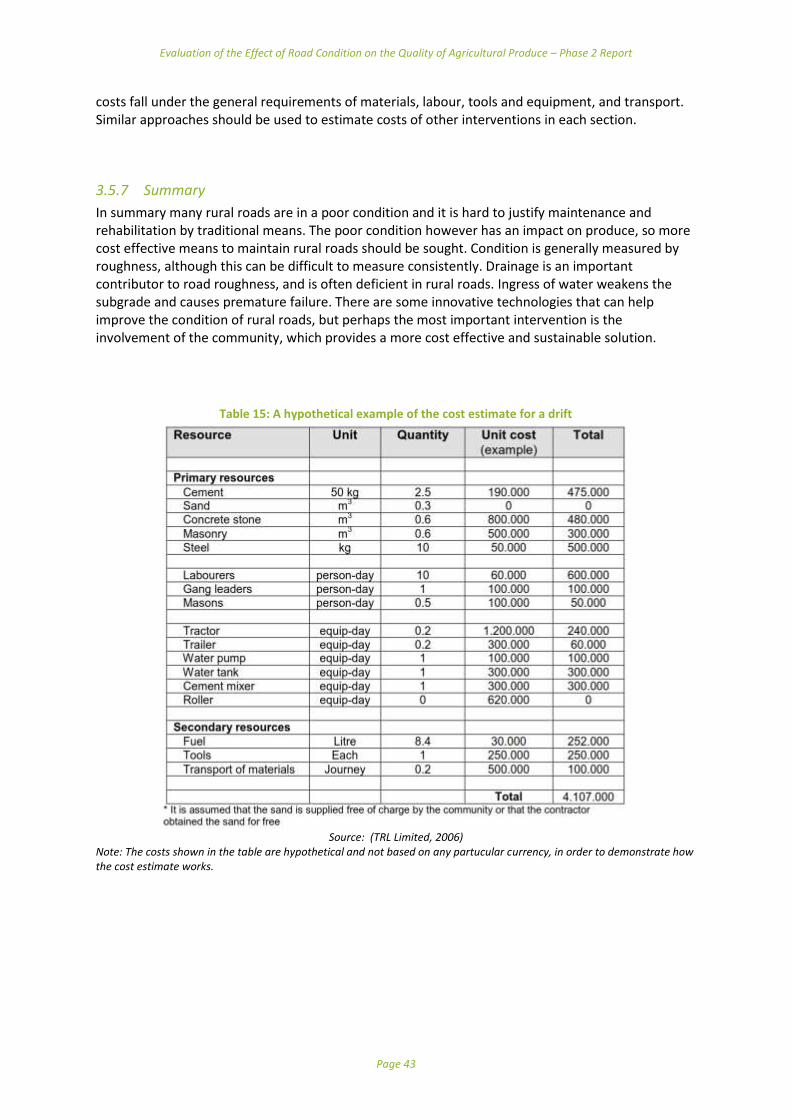
Evaluation of the Effect of Road Condition on the Quality of Agricultural Produce – Phase 2 Report
Page 43
costs fall under the general requirements of materials, labour, tools and equipment, and transport. Similar approaches should be used to estimate costs of other interventions in each section.
3.5.7 Summary
In summary many rural roads are in a poor condition and it is hard to justify maintenance and rehabilitation by traditional means. The poor condition however has an impact on produce, so more cost effective means to maintain rural roads should be sought. Condition is generally measured by roughness, although this can be difficult to measure consistently. Drainage is an important contributor to road roughness, and is often deficient in rural roads. Ingress of water weakens the subgrade and causes premature failure. There are some innovative technologies that can help improve the condition of rural roads, but perhaps the most important intervention is the involvement of the community, which provides a more cost effective and sustainable solution.
Table 15: A hypothetical example of the cost estimate for a drift
Source: (TRL Limited, 2006)
Note: The costs shown in the table are hypothetical and not based on any partucular currency, in order to demonstrate how the cost estimate works.
Evaluation of the Effect of Road Condition on the Quality of Agricultural Produce – Phase 2 Report
Page 44
4 Identification of Research Sites
4.1 Site Selection Criteria
Pilot studies on First Mile transport challenges were previously undertaken by the International Forum for Rural Transport and Development (IFRTD) in the onion smallholder sector, Nyeri County, Kenya; and among tomato farmers in Kilolo District, Tanzania. These First Mile studies were designed as exploratory pilot projects to collect a wide range of data on the transport of harvest produce including consignment size, mode of transport, transport costs, losses, and load consolidation. The research locations were selected based on a range of characteristics including terrain, altitude, rainfall, road density, population density, and type of commodity:
“Onions are one of the high value but perishable commodities being grown by small holders in the highland areas of Kenya. Fuelled by growing urbanisation in the country, demand for commodities such as onions, French beans, and Irish potatoes are helping farmers transition from traditional staples to market oriented production, which is helping lift many rural farmers out of poverty.”
“Tomatoes are a particularly high value commodity and are in high demand in the Iringa region of Tanzania, as well as markets in Dar es Salaam, Dodoma and Morogoro. Tomatoes are a time sensitive crop, especially from harvest to final market owing to their perishability. In addition to the value deterioration that may occur due to marketing delays, their fragility also means the manner in which they are transported could result in squashing and bruising which also affects their price. “
In contrast to the above pilot studies on First Mile transport challenges in the onion and tomato smallholder sectors, this current research into the primary transport segment will select a geographical region with a range of different produce that fulfil the following criteria:
High value produce
Highly perishable produce
Grown in close proximity to rural or peri-urban markets
Potential for high productivity
Experiencing difficulties with transporting harvest to market. Table 15 presents the selection criteria identified to shortlist the geographical locations where fieldwork will be undertaken and the commodity types that will be examined in Kenya and Tanzania.
Table 16: Criteria for Selection of Research Sites
CRITERIA RATIONALE
Determining Geographical Locations
Region with a predominance of commercially oriented smallholder farms
A critical mass of smallholders who are participating in markets will enable efficient collection of data in one area.
Poor First Mile infrastructure but connected good road networks linking farming areas to major markets
This will enable the study to focus on the First Mile sections as the weakest link of the transport value chain. Areas that are too remote from linking networks are unlikely to have commercial agriculture.
Discernible marketing system There should be a describable marketing system - that is a clear value chain structure that shows a products’ source, the transport system and the various market destinations.
Farmers organisation Where farmers are organised into groups (production and
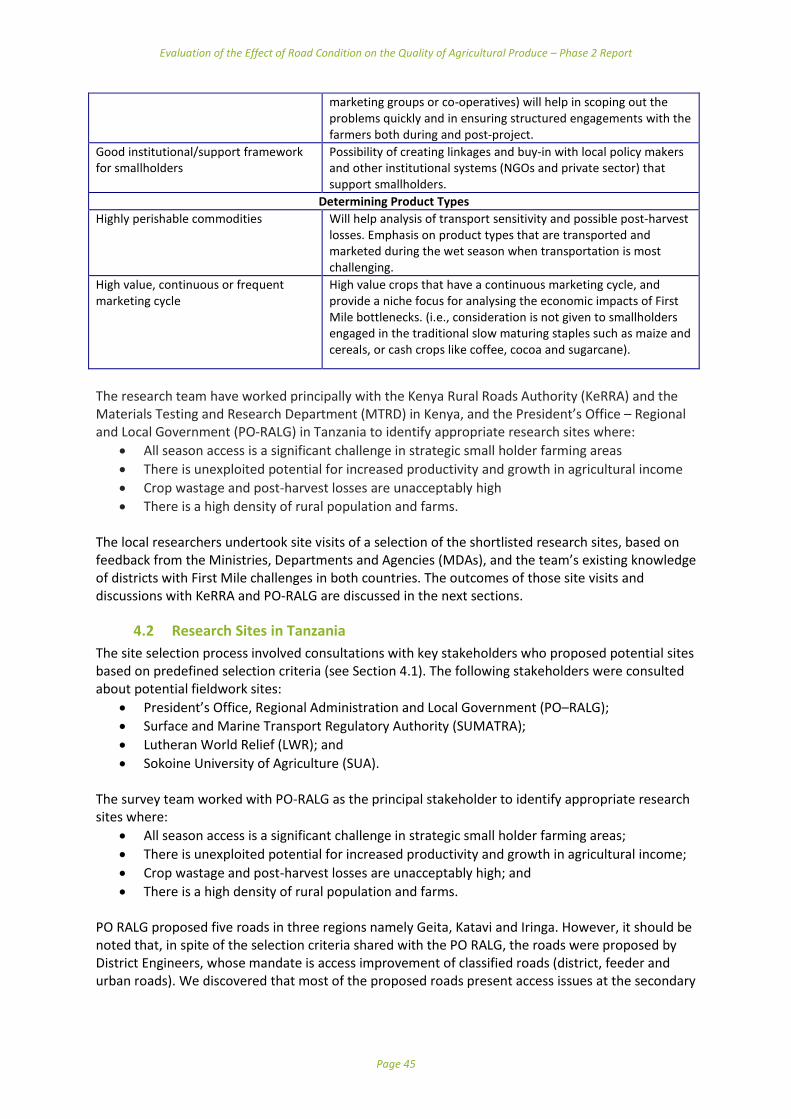
Evaluation of the Effect of Road Condition on the Quality of Agricultural Produce – Phase 2 Report
Page 45
marketing groups or co-operatives) will help in scoping out the problems quickly and in ensuring structured engagements with the farmers both during and post-project.
Good institutional/support framework for smallholders
Possibility of creating linkages and buy-in with local policy makers and other institutional systems (NGOs and private sector) that support smallholders.
Determining Product Types
Highly perishable commodities Will help analysis of transport sensitivity and possible post-harvest losses. Emphasis on product types that are transported and marketed during the wet season when transportation is most challenging.
High value, continuous or frequent marketing cycle
High value crops that have a continuous marketing cycle, and provide a niche focus for analysing the economic impacts of First Mile bottlenecks. (i.e., consideration is not given to smallholders engaged in the traditional slow maturing staples such as maize and cereals, or cash crops like coffee, cocoa and sugarcane).
The research team have worked principally with the Kenya Rural Roads Authority (KeRRA) and the Materials Testing and Research Department (MTRD) in Kenya, and the President’s Office – Regional and Local Government (PO-RALG) in Tanzania to identify appropriate research sites where:
All season access is a significant challenge in strategic small holder farming areas
There is unexploited potential for increased productivity and growth in agricultural income
Crop wastage and post-harvest losses are unacceptably high
There is a high density of rural population and farms. The local researchers undertook site visits of a selection of the shortlisted research sites, based on feedback from the Ministries, Departments and Agencies (MDAs), and the team’s existing knowledge of districts with First Mile challenges in both countries. The outcomes of those site visits and discussions with KeRRA and PO-RALG are discussed in the next sections.
4.2 Research Sites in Tanzania
The site selection process involved consultations with key stakeholders who proposed potential sites based on predefined selection criteria (see Section 4.1). The following stakeholders were consulted about potential fieldwork sites:
President’s Office, Regional Administration and Local Government (PO–RALG);
Surface and Marine Transport Regulatory Authority (SUMATRA);
Lutheran World Relief (LWR); and
Sokoine University of Agriculture (SUA). The survey team worked with PO-RALG as the principal stakeholder to identify appropriate research sites where:
All season access is a significant challenge in strategic small holder farming areas;
There is unexploited potential for increased productivity and growth in agricultural income;
Crop wastage and post-harvest losses are unacceptably high; and
There is a high density of rural population and farms. PO RALG proposed five roads in three regions namely Geita, Katavi and Iringa. However, it should be noted that, in spite of the selection criteria shared with the PO RALG, the roads were proposed by District Engineers, whose mandate is access improvement of classified roads (district, feeder and urban roads). We discovered that most of the proposed roads present access issues at the secondary
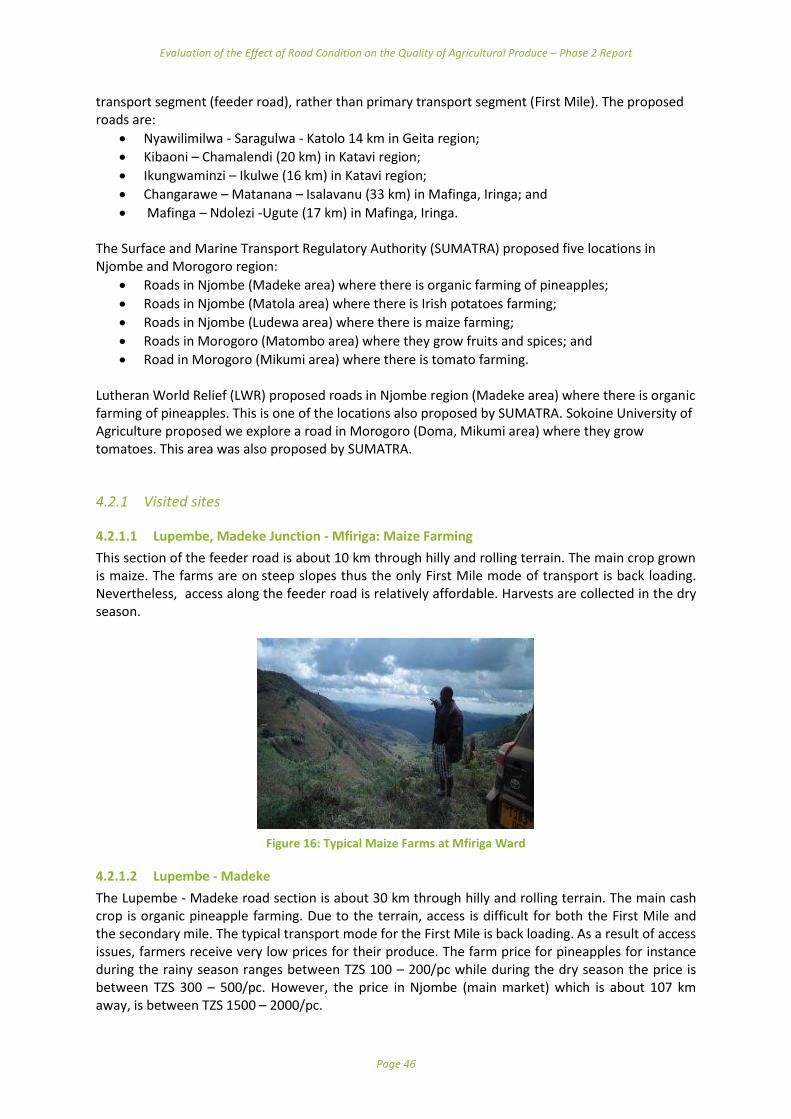
Evaluation of the Effect of Road Condition on the Quality of Agricultural Produce – Phase 2 Report
Page 46
transport segment (feeder road), rather than primary transport segment (First Mile). The proposed roads are:
Nyawilimilwa - Saragulwa - Katolo 14 km in Geita region;
Kibaoni – Chamalendi (20 km) in Katavi region;
Ikungwaminzi – Ikulwe (16 km) in Katavi region;
Changarawe – Matanana – Isalavanu (33 km) in Mafinga, Iringa; and
Mafinga – Ndolezi -Ugute (17 km) in Mafinga, Iringa. The Surface and Marine Transport Regulatory Authority (SUMATRA) proposed five locations in Njombe and Morogoro region:
Roads in Njombe (Madeke area) where there is organic farming of pineapples;
Roads in Njombe (Matola area) where there is Irish potatoes farming;
Roads in Njombe (Ludewa area) where there is maize farming;
Roads in Morogoro (Matombo area) where they grow fruits and spices; and
Road in Morogoro (Mikumi area) where there is tomato farming. Lutheran World Relief (LWR) proposed roads in Njombe region (Madeke area) where there is organic farming of pineapples. This is one of the locations also proposed by SUMATRA. Sokoine University of Agriculture proposed we explore a road in Morogoro (Doma, Mikumi area) where they grow tomatoes. This area was also proposed by SUMATRA.
4.2.1 Visited sites
4.2.1.1 Lupembe, Madeke Junction - Mfiriga: Maize Farming
This section of the feeder road is about 10 km through hilly and rolling terrain. The main crop grown is maize. The farms are on steep slopes thus the only First Mile mode of transport is back loading. Nevertheless, access along the feeder road is relatively affordable. Harvests are collected in the dry season.
Figure 16: Typical Maize Farms at Mfiriga Ward
4.2.1.2 Lupembe - Madeke
The Lupembe - Madeke road section is about 30 km through hilly and rolling terrain. The main cash crop is organic pineapple farming. Due to the terrain, access is difficult for both the First Mile and the secondary mile. The typical transport mode for the First Mile is back loading. As a result of access issues, farmers receive very low prices for their produce. The farm price for pineapples for instance during the rainy season ranges between TZS 100 – 200/pc while during the dry season the price is between TZS 300 – 500/pc. However, the price in Njombe (main market) which is about 107 km away, is between TZS 1500 – 2000/pc.
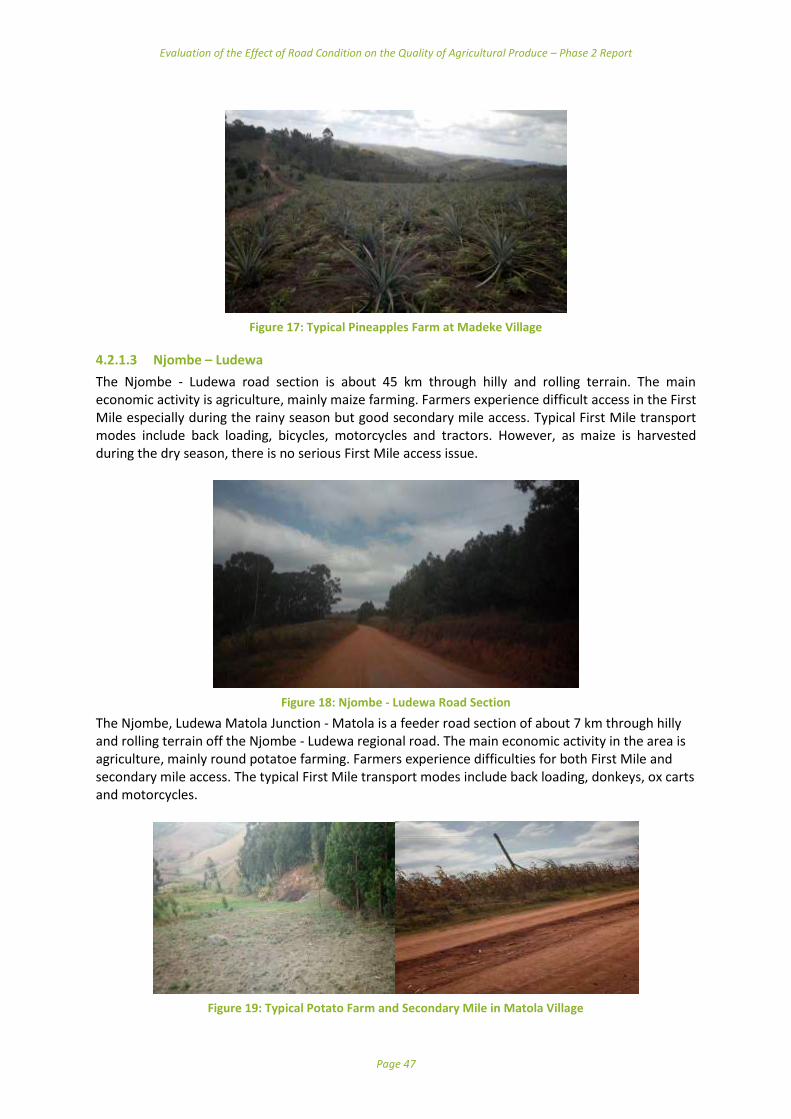
Evaluation of the Effect of Road Condition on the Quality of Agricultural Produce – Phase 2 Report
Page 47
Figure 17: Typical Pineapples Farm at Madeke Village
4.2.1.3 Njombe – Ludewa
The Njombe - Ludewa road section is about 45 km through hilly and rolling terrain. The main economic activity is agriculture, mainly maize farming. Farmers experience difficult access in the First Mile especially during the rainy season but good secondary mile access. Typical First Mile transport modes include back loading, bicycles, motorcycles and tractors. However, as maize is harvested during the dry season, there is no serious First Mile access issue.
Figure 18: Njombe - Ludewa Road Section
The Njombe, Ludewa Matola Junction - Matola is a feeder road section of about 7 km through hilly and rolling terrain off the Njombe - Ludewa regional road. The main economic activity in the area is agriculture, mainly round potatoe farming. Farmers experience difficulties for both First Mile and secondary mile access. The typical First Mile transport modes include back loading, donkeys, ox carts and motorcycles.
Figure 19: Typical Potato Farm and Secondary Mile in Matola Village

Evaluation of the Effect of Road Condition on the Quality of Agricultural Produce – Phase 2 Report
Page 48
During site verification, it was found that one farmer constructed his First Mile access road to the farm and charges other farmer to transport their produce through it, Access is free for normal commuting.
Figure 20: Private First Mile Access Road in Matola Village
4.2.1.4 Road in Morogoro (Mikumi area)
The road section in Mikumi (Doma area) is about 15 km through flat and rolling terrain off the Mikumi Iringa road. The main produce in the area is tomato farming. The main offtakers for the tomatoes in this area include the (small-scale) women traders along the Mikumi/TANZAM highway in the Doma area and larger-scale traders who transport to the Dar es Salaam market. Generally, the farms are accessible throughout the year. The Dar es Salaam traders get their vehicles/trucks to the farm and then return straight to Dar es Salaam. However, the women traders at the Mikumi/ TANZAM highway use motorcycles to ferry tomatoes from the farms to the selling point. During site verification, it was discovered that women traders are unable to hire trucks to transport tomatoes due to their low volume requirements rather than to access issues.
Figure 21: First Mile Access Road in Mikumi (Doma Area)
4.2.1.5 Nyamilimilwa – Saragulwa – Katolo (14 km)
This road section (14 km) is along the lake shore in the Geita region, in flat terrain. The main crops grown in the area include paddy, cane, pineapples and cassava. Target markets for the produce are in Geita and Katolo town. Unfortunately, between the production sites and the market there is Geita Gold Mine (GGM). The proposed road therefore is the shortest route to the market, with the alternative route around the mine being 60 km long. Nevertheless, this road section is not
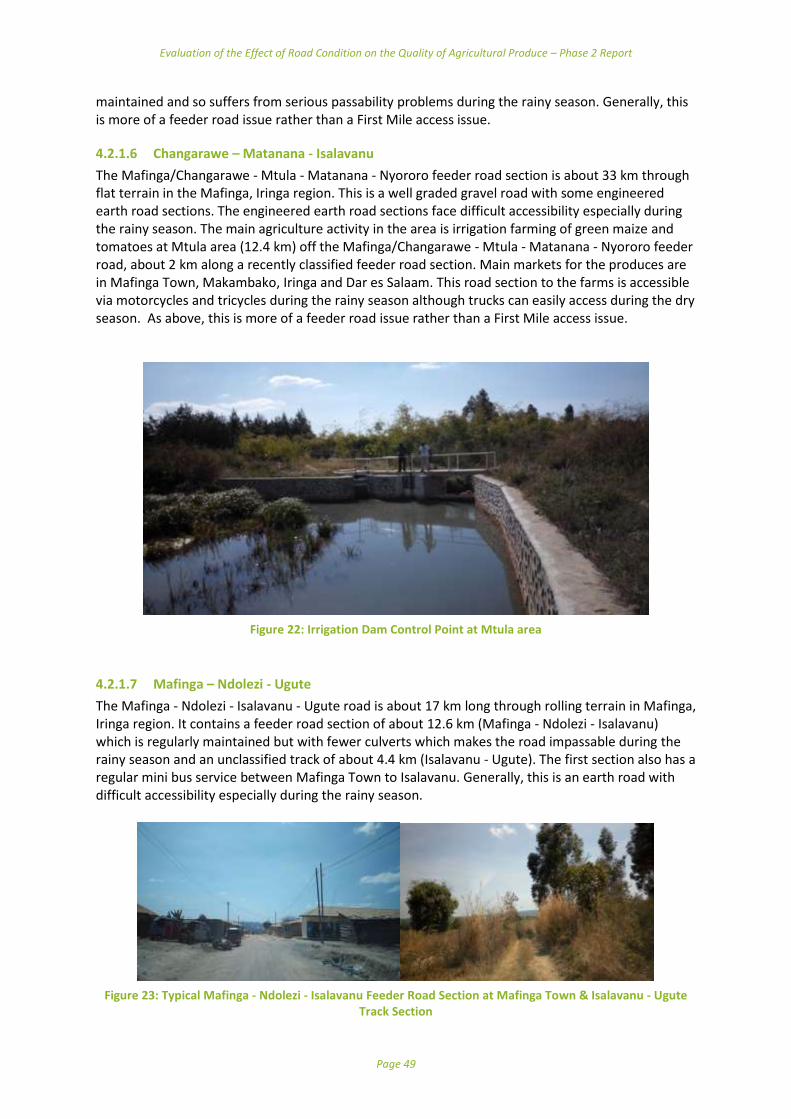
Evaluation of the Effect of Road Condition on the Quality of Agricultural Produce – Phase 2 Report
Page 49
maintained and so suffers from serious passability problems during the rainy season. Generally, this is more of a feeder road issue rather than a First Mile access issue.
4.2.1.6 Changarawe – Matanana - Isalavanu
The Mafinga/Changarawe - Mtula - Matanana - Nyororo feeder road section is about 33 km through flat terrain in the Mafinga, Iringa region. This is a well graded gravel road with some engineered earth road sections. The engineered earth road sections face difficult accessibility especially during the rainy season. The main agriculture activity in the area is irrigation farming of green maize and tomatoes at Mtula area (12.4 km) off the Mafinga/Changarawe - Mtula - Matanana - Nyororo feeder road, about 2 km along a recently classified feeder road section. Main markets for the produces are in Mafinga Town, Makambako, Iringa and Dar es Salaam. This road section to the farms is accessible via motorcycles and tricycles during the rainy season although trucks can easily access during the dry season. As above, this is more of a feeder road issue rather than a First Mile access issue.
Figure 22: Irrigation Dam Control Point at Mtula area
4.2.1.7 Mafinga – Ndolezi - Ugute
The Mafinga - Ndolezi - Isalavanu - Ugute road is about 17 km long through rolling terrain in Mafinga, Iringa region. It contains a feeder road section of about 12.6 km (Mafinga - Ndolezi - Isalavanu) which is regularly maintained but with fewer culverts which makes the road impassable during the rainy season and an unclassified track of about 4.4 km (Isalavanu - Ugute). The first section also has a regular mini bus service between Mafinga Town to Isalavanu. Generally, this is an earth road with difficult accessibility especially during the rainy season.
Figure 23: Typical Mafinga - Ndolezi - Isalavanu Feeder Road Section at Mafinga Town & Isalavanu - Ugute
Track Section
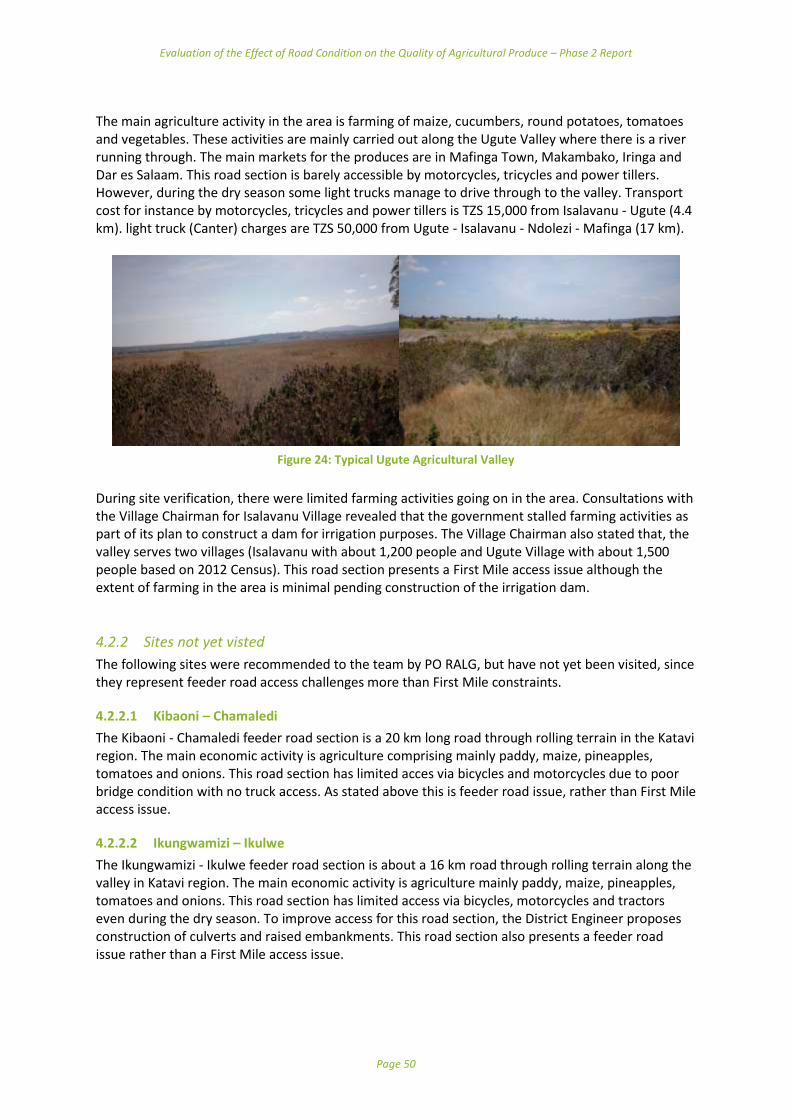
Evaluation of the Effect of Road Condition on the Quality of Agricultural Produce – Phase 2 Report
Page 50
The main agriculture activity in the area is farming of maize, cucumbers, round potatoes, tomatoes and vegetables. These activities are mainly carried out along the Ugute Valley where there is a river running through. The main markets for the produces are in Mafinga Town, Makambako, Iringa and Dar es Salaam. This road section is barely accessible by motorcycles, tricycles and power tillers. However, during the dry season some light trucks manage to drive through to the valley. Transport cost for instance by motorcycles, tricycles and power tillers is TZS 15,000 from Isalavanu - Ugute (4.4 km). light truck (Canter) charges are TZS 50,000 from Ugute - Isalavanu - Ndolezi - Mafinga (17 km).
Figure 24: Typical Ugute Agricultural Valley
During site verification, there were limited farming activities going on in the area. Consultations with the Village Chairman for Isalavanu Village revealed that the government stalled farming activities as part of its plan to construct a dam for irrigation purposes. The Village Chairman also stated that, the valley serves two villages (Isalavanu with about 1,200 people and Ugute Village with about 1,500 people based on 2012 Census). This road section presents a First Mile access issue although the extent of farming in the area is minimal pending construction of the irrigation dam.
4.2.2 Sites not yet visted
The following sites were recommended to the team by PO RALG, but have not yet been visited, since they represent feeder road access challenges more than First Mile constraints.
4.2.2.1 Kibaoni – Chamaledi
The Kibaoni - Chamaledi feeder road section is a 20 km long road through rolling terrain in the Katavi region. The main economic activity is agriculture comprising mainly paddy, maize, pineapples, tomatoes and onions. This road section has limited acces via bicycles and motorcycles due to poor bridge condition with no truck access. As stated above this is feeder road issue, rather than First Mile access issue.
4.2.2.2 Ikungwamizi – Ikulwe
The Ikungwamizi - Ikulwe feeder road section is about a 16 km road through rolling terrain along the valley in Katavi region. The main economic activity is agriculture mainly paddy, maize, pineapples, tomatoes and onions. This road section has limited access via bicycles, motorcycles and tractors even during the dry season. To improve access for this road section, the District Engineer proposes construction of culverts and raised embankments. This road section also presents a feeder road issue rather than a First Mile access issue.
Evaluation of the Effect of Road Condition on the Quality of Agricultural Produce – Phase 2 Report
Page 51
4.2.3 Preferred Sites
The Lupembe - Madeke road (30 km) and associated First Mile roads in Madeke village where there is organic farming of pineapples is one of the preferred sites. The key reasons for this choice are:
Serious First Mile and secondary access challenges;
Very low farm gate price vs market price in nearby market;
Very fertile land (organic farming); and
Highly perishable and easily damaged produce.
The Njombe, Ludewa Matola Junction - Matola road (7 km) and associated First Mile roads in Matola village where there is round potato farming is another preferred site. The key reasons for this choice are:
High productivity;
Main economic drive for the rural poor;
Active role of the community to try to address the First Mile access challenges; and
Perishable nature of the produce.
Following further discussions with the PO RALG and feedback from the stakeholder workshop, finalisation of the sites to be selected will be made.
4.3 Research Sites in Kenya
The choice of locations for the field studies was guided by:
Objectives of the study;
Advice from the Materials Testing and Research Department (MTRD), Ministry of Transport Infrastructure, Housing and Urban Development;
Insights from previous First Mile studies in Kenya. Site visits were conducted between 29thJune and 4th July 2017. The sites are all located in agriculturally rich rural areas, with a diverse range of produce such as vegetables, milk, onions and potatoes. The preliminary visits sought to understand the dynamics of the First Mile transport for the produce and the socio-economic environment of the areas. Six sites were visited in five counties as can be seen in Table 16 and Figure 25.
Table 17: Sites visited in Kenya
Site County Specific area Crop Type
Nyeri County – Kieni Kimunyuru Onions
Muranga County Ichagaki Bananas
Machakos County Kathimani Vegetables
Nyandarua County Kiahuko Milk and vegetables
Nyandarua County Boiman Potatoes
Meru County - Tigania East Miatheni Vegetables

Evaluation of the Effect of Road Condition on the Quality of Agricultural Produce – Phase 2 Report
Page 52
Figure 25: Areas of initial Site Selection in Kenya
4.3.1 Initial findings
4.3.1.1 Crops
The sites were characterised by the dominance of organised small-scale farming. Crop types are given in Table 17.
Table 17: Crop Types per Site Visited
Area Main cash crop
Dry season Wet season Images
Boiman- Nyahururu
Potatoes January and February
April, July, October and November
Kieni- Nyeri Onions January and February
April-June (Long rains) October-December (Short rains)
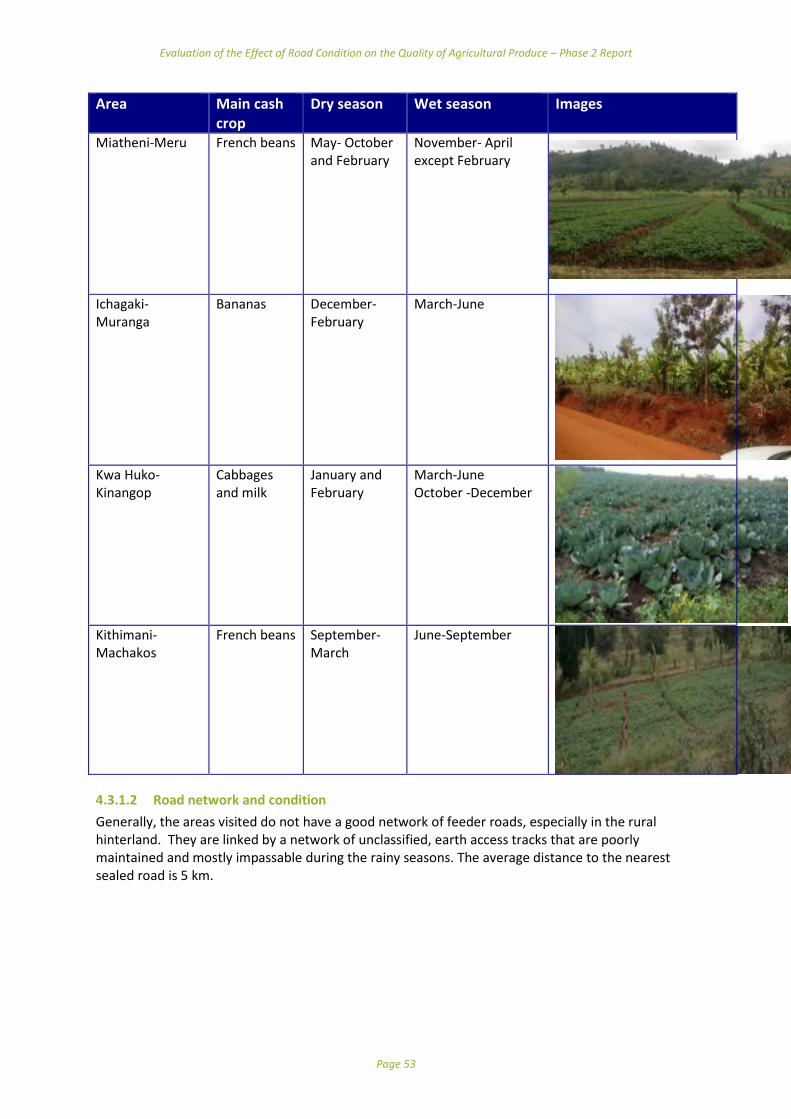
Evaluation of the Effect of Road Condition on the Quality of Agricultural Produce – Phase 2 Report
Page 53
Area Main cash crop
Dry season Wet season Images
Miatheni-Meru French beans May- October and February
November- April except February
Ichagaki- Muranga
Bananas December- February
March-June
Kwa Huko-Kinangop
Cabbages and milk
January and February
March-June October -December
Kithimani- Machakos
French beans September-March
June-September
4.3.1.2 Road network and condition
Generally, the areas visited do not have a good network of feeder roads, especially in the rural hinterland. They are linked by a network of unclassified, earth access tracks that are poorly maintained and mostly impassable during the rainy seasons. The average distance to the nearest sealed road is 5 km.

Evaluation of the Effect of Road Condition on the Quality of Agricultural Produce – Phase 2 Report
Page 54
Figure 26: Access Road Kinangop and Meru
Figure 27: Access Road Ichagaki and Boiman
4.3.1.3 Transport modes
Modes of transport used in these areas include back/head loading, animal-drawn carts, motorcycles, pickups and lorries. There are some factors which influence the use of a particular mode e.g. road condition, distance, availability, efficiency and flexibility, capacity and the cost of transport. The main mode of transport used from the farm to the collection point is back loading, animal drawn cart and motorcycles while from collection point to the market is by pickups and lorries.
Figure 28:Modes of Transport
Evaluation of the Effect of Road Condition on the Quality of Agricultural Produce – Phase 2 Report
Page 55
4.3.1.4 Distance and loads carried by various modes
A rapid assessment of the distances, payloads and products for the different modes is given below. It should be noted that this information was collected very rapidly in the research site identification phase and more detailed information will be made available from the actual research.
Table 18: Trip distances and loads carried
Area Crop Mode Average trip distance
in km Average load carried on a
trip in kg
Boiman- Nyahururu
Potatoes
Donkey 3 120
Motorcycle 8 150
Tractor 8 2000
Lorry Unknown 5000
Kieni-Nyeri Onions
Donkey 5 90
Motorcycle 10 150
Pickup 10 1500
Tigania East- Meru
French beans
Backloading 4 50
Animal Drawn cart
4 800
Motorcycle 4 200
Kithimani-Machakos
French beans
Backloading 2 2 crates /34 kg
Ox- Drawn cart 6 20 crates/350 kg
Motorcycle 6 7 crates/120 kg
Ichagaki-Murang’a
Bananas Motorcycle 4 1 bunch/50 kg
Kinangop Milk and Cabages
Donkey 7 300 heads of cabbage
Lorry Kinangop-Nairobi 2700 kg
4.3.1.5 Gender division of labour
The site reconnaissance recorded very distinct gender roles across all the areas visited. From farm to market, women tend to take on the tasks that need precision and great patience, particularly planting, weeding, harvesting, sorting, packing and grading. Whereas men take on the tasks needing strength or those that tend to be mechanised, such as ploughing, spraying, transport loading and driving.
4.3.1.6 Collection points
In many of the places visited, there are roadside sheds where farmers can assemble and consolidate their produce for collection. Some farm produce (e.g. French beans) is collected on the appointed days from the designated collection points by the buyers/agents. It was however noted that in some areas the farmers do not have common collection points, but each take their produce to the nearest point on the accessible road, e.g. bananas to Murang’a and onions to Kieni.
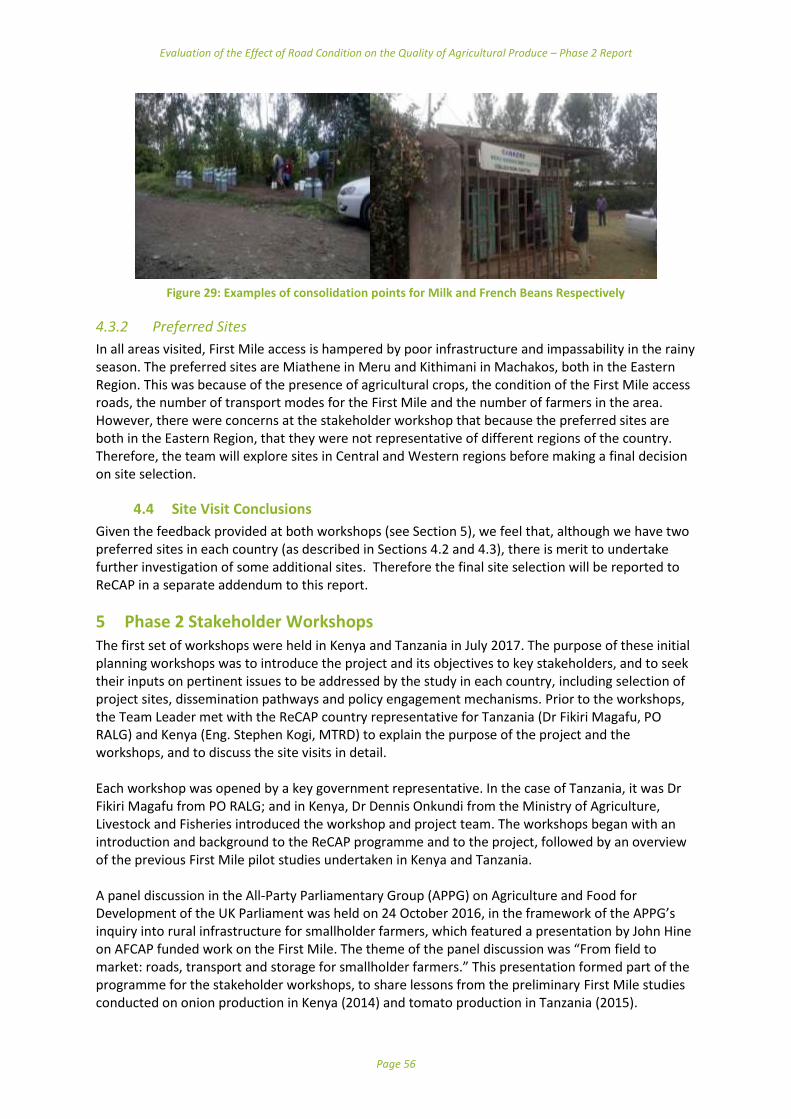
Evaluation of the Effect of Road Condition on the Quality of Agricultural Produce – Phase 2 Report
Page 56
Figure 29: Examples of consolidation points for Milk and French Beans Respectively
4.3.2 Preferred Sites
In all areas visited, First Mile access is hampered by poor infrastructure and impassability in the rainy season. The preferred sites are Miathene in Meru and Kithimani in Machakos, both in the Eastern Region. This was because of the presence of agricultural crops, the condition of the First Mile access roads, the number of transport modes for the First Mile and the number of farmers in the area. However, there were concerns at the stakeholder workshop that because the preferred sites are both in the Eastern Region, that they were not representative of different regions of the country. Therefore, the team will explore sites in Central and Western regions before making a final decision on site selection.
4.4 Site Visit Conclusions
Given the feedback provided at both workshops (see Section 5), we feel that, although we have two preferred sites in each country (as described in Sections 4.2 and 4.3), there is merit to undertake further investigation of some additional sites. Therefore the final site selection will be reported to ReCAP in a separate addendum to this report.
5 Phase 2 Stakeholder Workshops The first set of workshops were held in Kenya and Tanzania in July 2017. The purpose of these initial planning workshops was to introduce the project and its objectives to key stakeholders, and to seek their inputs on pertinent issues to be addressed by the study in each country, including selection of project sites, dissemination pathways and policy engagement mechanisms. Prior to the workshops, the Team Leader met with the ReCAP country representative for Tanzania (Dr Fikiri Magafu, PO RALG) and Kenya (Eng. Stephen Kogi, MTRD) to explain the purpose of the project and the workshops, and to discuss the site visits in detail. Each workshop was opened by a key government representative. In the case of Tanzania, it was Dr Fikiri Magafu from PO RALG; and in Kenya, Dr Dennis Onkundi from the Ministry of Agriculture, Livestock and Fisheries introduced the workshop and project team. The workshops began with an introduction and background to the ReCAP programme and to the project, followed by an overview of the previous First Mile pilot studies undertaken in Kenya and Tanzania. A panel discussion in the All-Party Parliamentary Group (APPG) on Agriculture and Food for Development of the UK Parliament was held on 24 October 2016, in the framework of the APPG’s inquiry into rural infrastructure for smallholder farmers, which featured a presentation by John Hine on AFCAP funded work on the First Mile. The theme of the panel discussion was “From field to market: roads, transport and storage for smallholder farmers.” This presentation formed part of the programme for the stakeholder workshops, to share lessons from the preliminary First Mile studies conducted on onion production in Kenya (2014) and tomato production in Tanzania (2015).
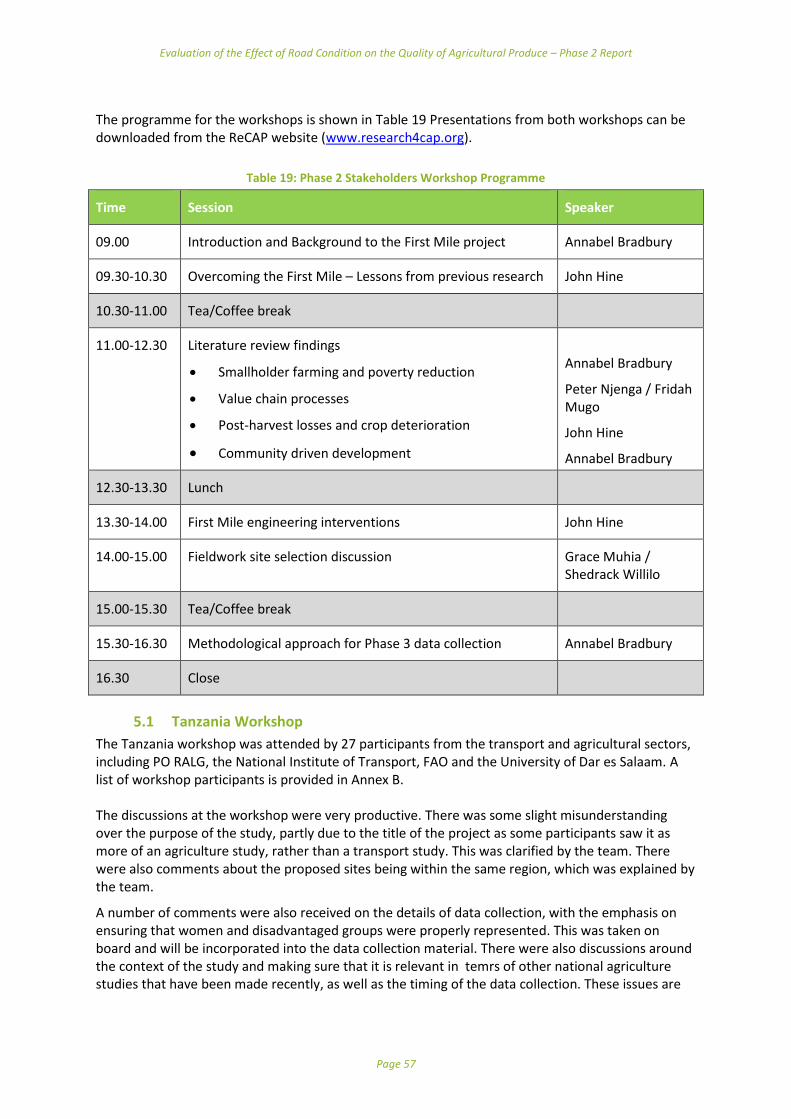
Evaluation of the Effect of Road Condition on the Quality of Agricultural Produce – Phase 2 Report
Page 57
The programme for the workshops is shown in Table 19 Presentations from both workshops can be downloaded from the ReCAP website (www.research4cap.org).
Table 19: Phase 2 Stakeholders Workshop Programme
Time Session Speaker
09.00 Introduction and Background to the First Mile project Annabel Bradbury
09.30-10.30 Overcoming the First Mile – Lessons from previous research John Hine
10.30-11.00 Tea/Coffee break
11.00-12.30 Literature review findings
Smallholder farming and poverty reduction
Value chain processes
Post-harvest losses and crop deterioration
Community driven development
Annabel Bradbury
Peter Njenga / Fridah Mugo
John Hine
Annabel Bradbury
12.30-13.30 Lunch
13.30-14.00 First Mile engineering interventions John Hine
14.00-15.00 Fieldwork site selection discussion Grace Muhia / Shedrack Willilo
15.00-15.30 Tea/Coffee break
15.30-16.30 Methodological approach for Phase 3 data collection Annabel Bradbury
16.30 Close
5.1 Tanzania Workshop
The Tanzania workshop was attended by 27 participants from the transport and agricultural sectors, including PO RALG, the National Institute of Transport, FAO and the University of Dar es Salaam. A list of workshop participants is provided in Annex B. The discussions at the workshop were very productive. There was some slight misunderstanding over the purpose of the study, partly due to the title of the project as some participants saw it as more of an agriculture study, rather than a transport study. This was clarified by the team. There were also comments about the proposed sites being within the same region, which was explained by the team.
A number of comments were also received on the details of data collection, with the emphasis on ensuring that women and disadvantaged groups were properly represented. This was taken on board and will be incorporated into the data collection material. There were also discussions around the context of the study and making sure that it is relevant in temrs of other national agriculture studies that have been made recently, as well as the timing of the data collection. These issues are

Evaluation of the Effect of Road Condition on the Quality of Agricultural Produce – Phase 2 Report
Page 58
all relevant to the successful implementation of the work and will be incorporated into the project methodology.
5.2 Kenya Workshop
The Kenya workshop was attended by 21 participants from the transport and agricultural sectors, including the Kenya Roads Board, Materials Testing and Research Department, Ministry of Agriculture, Livestock and Fisheries, and the University of Nairobi. A list of workshop participants is provided in Annex B. As with the Tanzanian workshop there was recognition that the current title does not easily match with the main themes of the study, which were noted and will be addressed separately. There were a number of issues and concerns around the collection of roads data, so the consensus was that the various roads bodies in Kenya would nneed ot be consulted. The status of farmers and their links to extension officers also needs some investigation. PPP is a potential tool for community maintenance of roads.
It was also noted that the Ministry are preparing linkage policy documents looking at linkage of roads and agriculture. A number of suggestions were made around this theme, but it is necessary to se ethe details of the policy before any concrete actions can be taken. Comments were also made on the location of the proposed trials. It was noted that the sites couild be too cloe together, with some suggestions for alternative sites. The team explained the rationale for the selection and noted that the trials were not meant to be representative of the whole of Kenya, which woiuld be impossible with just two sites. the sites will be motivated in a separate communication.
5.3 Workshop Evaluation
Workshop participants were provided with an evaluation form and invited to score aspects of the workshop proceedings. A detailed summary of the workshop evaluation and scores can be found in Annex C.
6 Phase 3 Data Collection
6.1 Methodological Approach
The fieldwork will adopt a mixed methods approach comprising qualitative data collection, using participatory techniques to engage with communities and stakeholders, and quantitative data collection, using detailed questionnaires across a large sample of the rural farming population. The field research will be conducted at two site locations in each country. These will be characteristically similar with regards to the challenges that small-scale farmers experience in getting agricultural inputs from the market to the farms, and produce from the farms to the market, or to the nearest consolidation point along the closest available feeder road. The main crop grown and marketed at each site will, however, differ, to establish if there is a link between the road condition of the primary transport segment (First Mile), and its effect on the condition and quality of the agricultural produce.
Evaluation of the Effect of Road Condition on the Quality of Agricultural Produce – Phase 2 Report
Page 59
Within those two locations, the intention is to identify a mixture of farmers that have ‘well connected’ First Mile access and those that have ‘remote’ First Mile access, but that produce and market the same principal crop for the same market catchment. This will allow us to assess comparisons between farms in the same location and to identify characteristics of First Mile access that affect the economic returns for farmers as well as degrees of impact on crop losses and productive capacity. The two geographically separate areas of field study will represent a variety of agricultural crops with varying degrees of perishability. This approach will give us a smaller sample size in each location, but will enable us to compare and contrast between different types of agricultural produce in geographically different areas of each country, within well connected and remote rural communities. All sites will be restricted to smallholder farming and not large-scale cash crops or plantations, and at each location we shall also obtain detailed information on commodity/farm produce prices, and cost of passenger transport and goods transport. If it is appropriate to do so, and there is sufficient non-motorised and motorised traffic over the First Mile access route, then it may be beneficial to conduct a one day, 12 hour traffic count along this segment to assess vehicular, IMT, NMT and pedestrian movements. The fieldwork and data collection will take approximately 12 weeks to complete, although this may not be undertaken continuously, and will involve the local researcher and 3 additional enumerators in each country, with intermittent contributions from the key specialists. Data collection will take place between September 2017 and January 2018, starting with a period of survey design, followed by enumerator training and piloting before field surveys begin in earnest.
6.1.1 Quantitative Data Collection
Interest in the analytically robust evaluation of the impact of projects, programme and policies has increased among policymakers since the mid-2000s. With growing recognition of the links between high transport costs and poverty, this trend also encompasses an increasing interest in undertaking detailed evaluations of the impact of public investment in rural roads. DFID is increasingly focusing on evidence-informed decision making, with the recognition that better informed decisions increase impact and value for money. It is generally accepted that larger, statistically representative, repeated surveys with controls will provide a more robust evidence base with which to inform policy and decision making. There are two main concepts to consider when deciding on an appropriate sample size for a survey. The first is how big does the total number need to be in order to get statistically robust results. The second is how diverse does the sampling need to be to be representative of the population; for instance, how close is the sample result to a hypothetical population result, had we surveyed the whole population? Factors likely to influence responses to the survey should be identified before the survey and controlled for when selecting the sample to survey. These factors might include farm size, crop production and household income. Where possible these factors should be included in the selection of villages chosen to survey, so that a mix of different factors (similar to that seen in the population) is surveyed. In addition, we are seeking to meet the 30% ‘gender rule’ adopted by the Constitution of the Government of Kenya (2010), and its affirmative action for gender equality. It is therefore proposed that farmers at each site location be selected through stratified random sampling, in other words, the sample population is selected because of certain characteristics, but from that population, the survey sample is randomly selected. Characteristics might include the following:
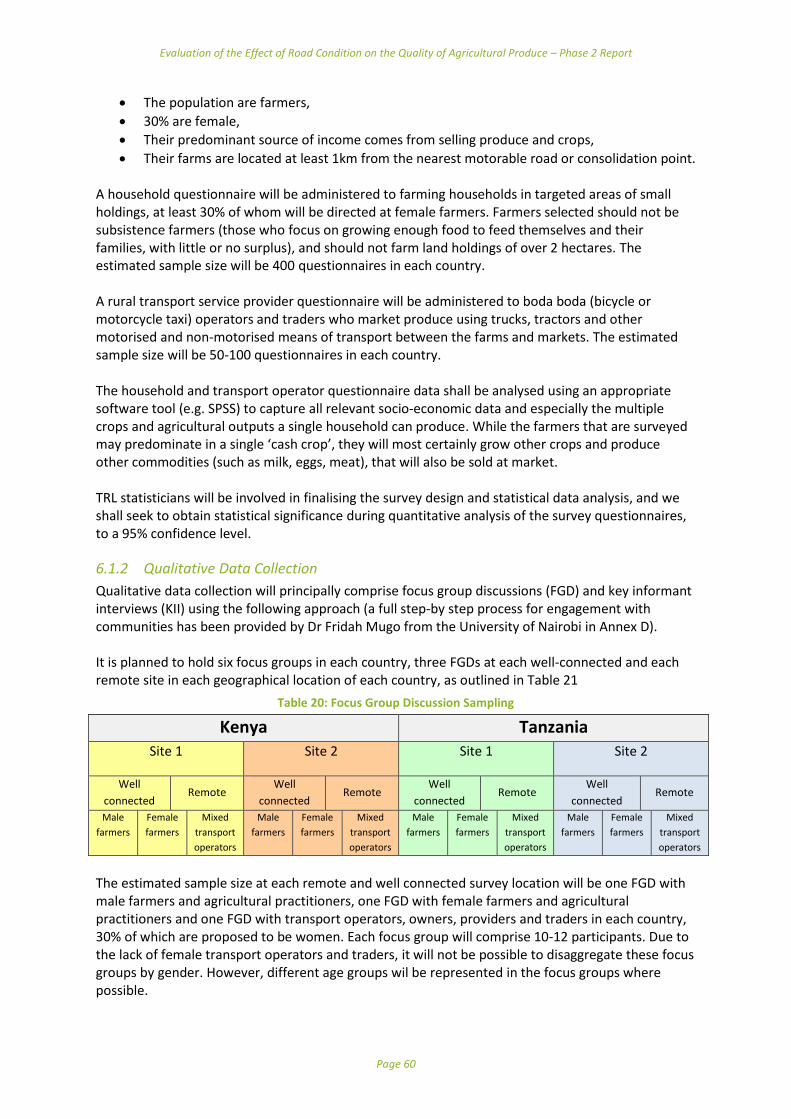
Evaluation of the Effect of Road Condition on the Quality of Agricultural Produce – Phase 2 Report
Page 60
The population are farmers,
30% are female,
Their predominant source of income comes from selling produce and crops,
Their farms are located at least 1km from the nearest motorable road or consolidation point. A household questionnaire will be administered to farming households in targeted areas of small holdings, at least 30% of whom will be directed at female farmers. Farmers selected should not be subsistence farmers (those who focus on growing enough food to feed themselves and their families, with little or no surplus), and should not farm land holdings of over 2 hectares. The estimated sample size will be 400 questionnaires in each country. A rural transport service provider questionnaire will be administered to boda boda (bicycle or motorcycle taxi) operators and traders who market produce using trucks, tractors and other motorised and non-motorised means of transport between the farms and markets. The estimated sample size will be 50-100 questionnaires in each country. The household and transport operator questionnaire data shall be analysed using an appropriate software tool (e.g. SPSS) to capture all relevant socio-economic data and especially the multiple crops and agricultural outputs a single household can produce. While the farmers that are surveyed may predominate in a single ‘cash crop’, they will most certainly grow other crops and produce other commodities (such as milk, eggs, meat), that will also be sold at market. TRL statisticians will be involved in finalising the survey design and statistical data analysis, and we shall seek to obtain statistical significance during quantitative analysis of the survey questionnaires, to a 95% confidence level.
6.1.2 Qualitative Data Collection
Qualitative data collection will principally comprise focus group discussions (FGD) and key informant interviews (KII) using the following approach (a full step-by step process for engagement with communities has been provided by Dr Fridah Mugo from the University of Nairobi in Annex D). It is planned to hold six focus groups in each country, three FGDs at each well-connected and each remote site in each geographical location of each country, as outlined in Table 21
Table 20: Focus Group Discussion Sampling
Kenya Tanzania Site 1 Site 2 Site 1 Site 2
Well
connected Remote
Well
connected Remote
Well
connected Remote
Well
connected Remote
Male
farmers
Female
farmers
Mixed
transport
operators
Male
farmers
Female
farmers
Mixed
transport
operators
Male
farmers
Female
farmers
Mixed
transport
operators
Male
farmers
Female
farmers
Mixed
transport
operators
The estimated sample size at each remote and well connected survey location will be one FGD with male farmers and agricultural practitioners, one FGD with female farmers and agricultural practitioners and one FGD with transport operators, owners, providers and traders in each country, 30% of which are proposed to be women. Each focus group will comprise 10-12 participants. Due to the lack of female transport operators and traders, it will not be possible to disaggregate these focus groups by gender. However, different age groups wil be represented in the focus groups where possible.
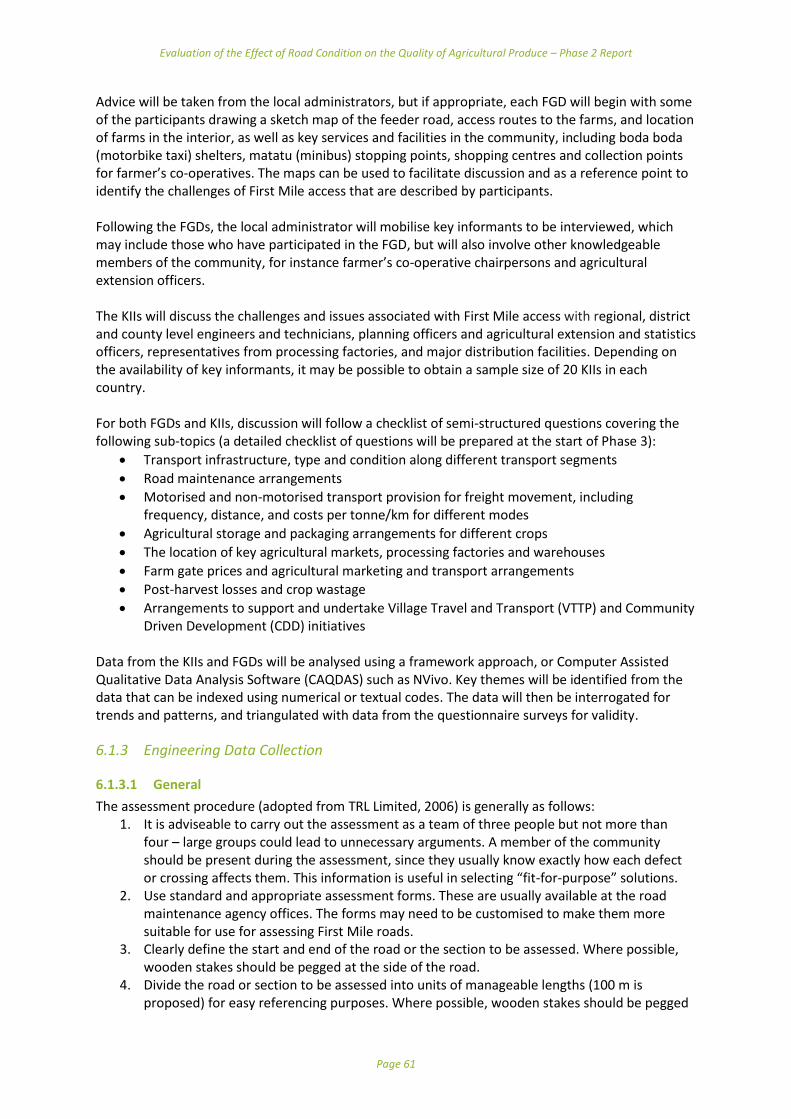
Evaluation of the Effect of Road Condition on the Quality of Agricultural Produce – Phase 2 Report
Page 61
Advice will be taken from the local administrators, but if appropriate, each FGD will begin with some of the participants drawing a sketch map of the feeder road, access routes to the farms, and location of farms in the interior, as well as key services and facilities in the community, including boda boda (motorbike taxi) shelters, matatu (minibus) stopping points, shopping centres and collection points for farmer’s co-operatives. The maps can be used to facilitate discussion and as a reference point to identify the challenges of First Mile access that are described by participants. Following the FGDs, the local administrator will mobilise key informants to be interviewed, which may include those who have participated in the FGD, but will also involve other knowledgeable members of the community, for instance farmer’s co-operative chairpersons and agricultural extension officers. The KIIs will discuss the challenges and issues associated with First Mile access with regional, district and county level engineers and technicians, planning officers and agricultural extension and statistics officers, representatives from processing factories, and major distribution facilities. Depending on the availability of key informants, it may be possible to obtain a sample size of 20 KIIs in each country. For both FGDs and KIIs, discussion will follow a checklist of semi-structured questions covering the following sub-topics (a detailed checklist of questions will be prepared at the start of Phase 3):
Transport infrastructure, type and condition along different transport segments
Road maintenance arrangements
Motorised and non-motorised transport provision for freight movement, including frequency, distance, and costs per tonne/km for different modes
Agricultural storage and packaging arrangements for different crops
The location of key agricultural markets, processing factories and warehouses
Farm gate prices and agricultural marketing and transport arrangements
Post-harvest losses and crop wastage
Arrangements to support and undertake Village Travel and Transport (VTTP) and Community Driven Development (CDD) initiatives
Data from the KIIs and FGDs will be analysed using a framework approach, or Computer Assisted Qualitative Data Analysis Software (CAQDAS) such as NVivo. Key themes will be identified from the data that can be indexed using numerical or textual codes. The data will then be interrogated for trends and patterns, and triangulated with data from the questionnaire surveys for validity.
6.1.3 Engineering Data Collection
6.1.3.1 General
The assessment procedure (adopted from TRL Limited, 2006) is generally as follows: 1. It is adviseable to carry out the assessment as a team of three people but not more than
four – large groups could lead to unnecessary arguments. A member of the community should be present during the assessment, since they usually know exactly how each defect or crossing affects them. This information is useful in selecting “fit-for-purpose” solutions.
2. Use standard and appropriate assessment forms. These are usually available at the road maintenance agency offices. The forms may need to be customised to make them more suitable for use for assessing First Mile roads.
3. Clearly define the start and end of the road or the section to be assessed. Where possible, wooden stakes should be pegged at the side of the road.
4. Divide the road or section to be assessed into units of manageable lengths (100 m is proposed) for easy referencing purposes. Where possible, wooden stakes should be pegged
Evaluation of the Effect of Road Condition on the Quality of Agricultural Produce – Phase 2 Report
Page 62
at the side of the road. These could be at lesser intervals (e.g. every kilometre) for long roads.
5. During the survey three general aspects should be recorded as part of the assessment.
The location of a reference point such as a junction, a clearly visible building or a large water course at least every 3 km so that at a later date the start point and the critical sites can be identified after the distance posts have been removed.
Alternatives that can save costs, such as local sources of materials or route realignments.
Any useful additional information that may arise in conversations with local people. This can also be obtained before or after the survey.
6. From the start point, walk through each section/sub-section observing and discussing with other members of the team the condition of the section and any critical sites. Record the reference chainage of such critical sites.
7. Record the type of the section respectively for Track, Earth Road, or Gravel Road. 8. Record the approximate width of the surface used by traffic. Record areas of erosion/gullies occurring on the on the carriageway or in the side drains. Figure 30 is an example of a completed assessment form. A blank form is included in the Appendix for future use.
Evaluation of the Effect of Road Condition on the Quality of Agricultural Produce – Phase 2 Report
Page 63
Figure 30: An example of a completed engineering assessment form Source: (TRL Limited, 2006)
Evaluation of the Effect of Road Condition on the Quality of Agricultural Produce – Phase 2 Report
Page 64
6.1.3.2 Measurement of roughness
For purposes of broad level comparison between the roads under this project, a quantitaive indication of the road roughness will be measured using two approaches; accelerometers and the maximum comfortable vehicle speed achievable. Accelerometers measure displacement in a three dimensional axis and are widely available commercially. Accelerometers of suitable sensitivity and range will be selected for the study. They will be placed in both goods vehicles and passenger vehicles. For goods vehicles, they will be placed in both the unloaded and loaded state in between the produce being transported. Using a spreadsheet, the data from the accelerometers will be analysed and expressed in units similar to that of roughness.
Tanzania currently uses a system of condition rating based on the assessment of maximum comfortable vehicle speed achievable. This method will also be used on the study roads. The vehicle to be used for the study will be a suitable station wagon.
We emphasise that for the kinds of roads in focus, the values to be obtained from this exercise are for indicative purposes only and will not be treated as absolute - moreso due to the difficulty in standardising the study vehicles. The limitations of the common roughness measurement devices have been discussed in the Inception Report and in section 3.5.1 of this report.
Finally, visual condition assement will also be undertaken along the road. This will capture the type, location, extent, and severity of defects. Water crossings and the condition of drainage structues will also be captured. Locations where these structures are required but are currently absent will also be recorded.
6.2 Next Steps
Phase 3 will commence following a one month review break required by the ReCAP Programme Management Unit as an assessment period for progress on the project to date. Data collection activities will begin in September 2017 with a period of logistical planning for fieldwork. This will comprise preparation of survey instruments, training of survey enumerators, piloting of survey forms and checklists, and meetings with local authorities to explain the purpose of the project and our requirements for sampling of the farming population in the selected communities. The field surveys and data collection will fully begin in October 2017.
7 Concluding Remarks This is a challenging project involving a range of disciplines. The literature review has shown that post-harvest crop deterioration is very complex involving a wide range of factors including the age and ripeness of produce, shocks encountered during harvesting, loading and unloading, shocks and vibrations during transport, packaging materials, position in the loading column, cleanliness and the microbiological load, humidity and temperature and storage time. Although it is important to be aware of these issues, detailed experimental studies on crop deterioration are not planned to be undertaken during the next phases of the research. In order to meet the objectives, specified in the Terms of Reference, of examining “the cost-beneficial improvement of “First Mile” access and the transport services associated with moving harvest produce on the initial stages of movement from the farm to established road access”, the focus of the planned work will inevitably relate to understanding how the current patterms of the initial transport and marketing stages and the associated crop deterioration affect the incomes of farmers. Better farm gate prices (and higher incomes) for produce available for sale, are likely to arise from both lower farm-to-market transport costs, as well as lower crop losses. To identify how farmers will benefit from better accessibility a value chain analysis will be carried out and farm gate prices, transport costs, famer incomes and crop losses will be recorded and comparisons made

Evaluation of the Effect of Road Condition on the Quality of Agricultural Produce – Phase 2 Report
Page 65
between farmers who have relatively good and poor accessibility. This will then be coupled with an analysis of possible engineering interventions, and transport service and marketing improvements, to see how accessibility may be improved, resulting in lower transport and marketing costs and lower crop losses. The costs of additional engineering and other measures will then be compared with the likely improvement in farmers incomes. Data will be collected by observing and interviewing farmers, transporters and market traders that are specifically involved in the first stages of the collection and transport of produce. Data will be collected from officials, community representatives and farmers, as well as by direct observation, on the physical state of paths, tracks and roads involved in the initial stages of transport. The physical state of the transport network, combined with available means of transport, will be analysed to identify the effect on the crop value chain. The crop value chain (expressed per unit weight) will be a joint function of transport and marketing costs as well as crop deterioration at each stage of marketing and transport. And through comparative analysis it is hoped that an understanding of which practices in harvesting, transporting, and marketing, together with which engineering interventions, are likely to achieve the best results.

Evaluation of the Effect of Road Condition on the Quality of Agricultural Produce – Phase 2 Report
Page 66
8 References African Development Bank (2015). Support for Agricultural Value Chain Development. ADB.
Ahmed, F., (2010). Socio-economic monitoring studies final report. Roads 2000 Nyanza Programme in Kenya. Nairobi: ITT and Kenya Rural Roads Authority, Ministry of Roads, Republic Of Kenya.
Banjo, G. Gordon, H. and Riverson, J. (2012). Rural Transport: Improving its Contribution to Growth and Poverty Reduction in Sub-Saharan Africa. SSATP Working Paper No. 93. Washington D. C.: World Bank
Bryceson, D. (1999). Sub-Saharan Africa betwixt and between: rural livelihood practices and policies. ASC Working Paper 43. Leiden: Afrika-Studiecentrum
Bundit Jarimopas, S. Paul Singh, Wasan Saengnil (2005) Measurement and Analysis of Truck Transport Vibration Levels and Damage to Packaged Tangerines during Transit. Packaging Technology and Science 2005, 18, p179-188
Çakmak, B., Alayunt F. N., Akdenđz, R.C, Aksoy, U. and H. Z. Can (2010) Assessment of the Quality Losses of Fresh Fig Fruits During Transportation Journal of Agricultural Sciences 16 (2010) 180 -193
Coates, M., Kitchen, R. Kebbell, G., Vignon, C., Guillemain, C., and R. Hofmeister,.(2011) Financing Agricultural Value Chains in Africa: Focus on Dairy and Mangos in Kenya. GIZ, Bonn and Eschborn, Germany
Cundill, M. A. (1996). The MERLIN road roughness machine: User Guide. Crowthorne, United Kingdom: Transport Research Laboratory
Done, S. (2008) Guideline to the planning and design of rural infrastructure. Draft TRL Report prepared for the World Bank. Crowthorne: TRL Limited
Donnges, C. (2003). Guidelines for Integrated Rural Accessibility Planning. Bangkok: International Labour Organization
Ellis S and J Hine 1997, ‘Rapid Appraisal Techniques for Identifying Maintenance on Low Volume Roads’ Project Report PR/OSC/122/97 Transport Research Laboratory, Crowthorne
Ellis, S. and Hine, J. (1998). The provision of rural transport services. SSATP Working Paper No.37. Washington D. C.: World Bank
Ethiopian Roads Authority (2011). Design Standards for Low Volume Roads: Part B. London: AFCAP-DFID
FAO (2012): The State of Food Security in the World. Rome: Food and Agricultural Organisation
Federal Highway Administration (2015). Gravel Roads Construction and Maintenance Guide. Washington, D.C.: FHWA
Gesford, A. L., & Anderson, J. A. (2006). Environmentally Sensitive Maintenance for Dirt and Gravel Roads. Harrisburg, PA. USA: The Pennsylvania Department of Transport
Grandin, T. (2000) Perspectives on transportation issues: The importance of having physically fit cattle and pigs Presented at the Transportation Symposium at the American Association of Animal Science, July 2000, Journal of Animal Science 79 (E Suppl.)
Gustavsson, J., C. Cederberg and U. Sonesson. 2011 Global food losses and food waste – Extent, causes and prevention. FAO Rome
Gwezuva, K. (2011) An analysis of raw milk transportation and possible strategies to maintain milk quality in Matabeleland region, Zimbabwe. Master’s Degree Thesis, Larenstein University of Applied Sciences
Haggblade, S.; Theriault, V.; Staatz,J.; Dembele, N.; Diallo, B. (2012) "A conceptual framework for promoting inclusive agricultural value chains" (PDF). Michigan State University and IFAD. Retrieved on June 1, 2017.
Hindson, J. (1983). Earth Roads: Their Construction and Maintenance. London: Intermediate Technology Development Group (ITDG)
Hine, J. and Bradbury, A. (2016). Ex-Post Evaluation of AFD/GOK Roads 2000: Final Report. TRL Report CPR 2314. Crowthorne: TRL Limited
Hine, J. (2014). Good Policies and Practices on Rural Transport in Africa: Planning Infrastructure and Services. Working Paper No. 100 (SSATP). Washington D. C.: World Bank
Evaluation of the Effect of Road Condition on the Quality of Agricultural Produce – Phase 2 Report
Page 67
Hine, J. Abedin, M. Stevens, R.J. Airey, T. and Anderson, T. (2016). Does the extension of the rural road network have a positive impact on poverty reduction and resilience for the rural areas served? If so how, and if not why not? A systematic review. London: EPPI-Centre, Social Science Research Unit, UCL Institute of Education, University College London
Hine, J. Riverson, J. and Kwakye, E. (1983). Accessibility, transport costs and food marketing in the Ashanti region of Ghana. TRRL Supplementary Report SR809. Crowthorne: TRL Limited
Hine, J., and J. Rutter. (2000). “Roads, Personal Mobility and Poverty: The Challenge.” Paper presented at a workshop on transport and poverty alleviation, 13 June, World Bank, Washington, D.C
Idah, P. A., M. G. Yisa, O. Chukwu and O. O. Morenikeji. 2012. Simulated transport damage study on fresh tomato (Lycopersicon esculentum) fruits. Agric Eng Int: CIGR Journal, 14 (2): Manuscript No. 2035
International Labour Organisation. (2012). Road Maintenance Using Do-nou Technology. Eldoret, Kenya: CORE
IT Transport (2002). Footpaths and Tracks - A Field Manual for their Construction and Improvement. Oxford, UK: IT Transport
Jacobsen, A. (1996). Hydraulic Design. In B. Thagesen, Highway and Traffic Engineering in Developing Countries (pp. 167-202). London, UK: E&FN Spon
Kasso, M., Bekele, A.(2016) Post-harvest loss and quality deterioration of horticultural crops in Dire Dawa Region, Ethiopia, Journal of the Saudi Society of Agricultural Sciences (2016), doi: http://dx.doi.org/10.1016/j.jssas.2016.01.005
Keller, G., and Sherar, J. (2003). Low-Volume Roads Engineering. Best Management Practices Field Guide. Washington, D.C. USA: United States Agency for International Development
KENDAT, IFRTD and TCP International,(2013). Rural logistics for smallholder farmers to meet new agricultural market demands: a planning framework for improving the efficiency of transport services in the high value agricultural sub-sector, replicable in other values chains. Final Report Project AFCAP/GEN/060.
La Scalia, G. et al. (2015) Damage to Strawberries Caused by Simulated Transport. International Journal of Biological, Biomolecular, Agricultural, Food and Biotechnological Engineering Vol:9, No:5, 2015
Livingston G, Schonberger S, Delaney S (2011) Sub-Saharan Africa: The State of Smallholders in Agriculture. Conference on New Direction for Smallholder Agriculture. 24-25 January 2011, IFAD, Rome.
Lundy, M.; M. V. Gottret; C. Ostertag; R. Best; S. Ferris. (2006) "Participatory market chain analysis for smallholder producers". CIAT. Retrieved from https://en.wikipedia.org/wiki/Agricultural_value_chain#cite_note-Lundy.2C_M..2C_M._V._Gottret.2C_C._Ostertag.2C_R._Best.2C_and_S._Ferris-8 on June 2, 2017.
Match Maker Associates Limited (2012). Scoping study on value chain initiatives in Tanzania. Irish Aid and Danida.
Ministry of Works, Transport and Communication of the United Republic of Tanzania. (2016). Low Volume Roads Manual. Dar Es Salaam, Tanzania: Ministry of Works, Transport and Communication of the United Republic of Tanzania
Mukura, K. (2008). Performance Criteria and Life-Cycle Costing for Unpaved Roads. Crowthorne, United Kingdom: Transport Research Laboratory (unpublished). Available on request from TRL.
Nagayets, O. (2005) Small farms: current status and key trends. Information Brief, Research Workshop on the Future of Small Farms. IFPRI, Imperial College and ODI
National Resources Institute, Postharvest Loss Reduction Centre (2014) (http://postharvest.nri.org/background/figures-and-statistics). University of Greenwich.
Njenga,P. G. Wahome and J. Hine (2014) Pilot Study on First Mile Transport Challenges In The Onion Small Holder Sector. AFCAP Report No. AFCAP/GEN/147
Njenga P, Wililo S and J. Hine (2015) First Mile Transport Challenges for smallholder Tomato Farmers along Ihimbo-itimbo Road, Kilolo District Tanzania. AFCAP/ASCAP Report SC14061/TAN2015C
Norton, R. (2014). Agricultural value chains: A game changer for small holders. Available at https://www.google.com/url?q=https%3A%2F%2Fwww.devex.com%2Fen%2Forganizations%2F49447&sa=D&sntz=1&usg=AFQjCNGAtzzCLTrzW1-7Lu9XWaKcKMQETQ.
Olayemi F. F., Adegbola J. A., Bamishaiye E. I. and Daura A. M. (2010) Assessment of Post- Harvest Challenges of Small Scale Farm Holders of Tomatoes, Bell and Hot Pepper in Some Local Government Areas of Kano State, Nigeria. Bayero Journal of Pure and Applied Sciences, 3(2): 39 – 42
Evaluation of the Effect of Road Condition on the Quality of Agricultural Produce – Phase 2 Report
Page 68
O'Reilly, M. P., & Millard, R. S. (1969). Roadmaking Materials and Pavement Design in Tropical and Sub-Tropical Countries. Crowthorne, Berkshire: Road Research Laboratory
Paige-Green, P. (1989). The influence of geotechnical properties on the performance of gravel wearing course materials. PhD thesis, University of Pretoria, Pretoria RSA.
Porter, G. (2013) Transport Services and their Impact on Poverty and Growth in Rural Sub-Saharan Africa. Africa Community Access Programme, University of Durham.
Ran Zhou and Jing Xie, (2015) Measurement of Truck Transport Vibrations Levels in China as a China as a Function of Road Conditions, Truck Speed and Load Level Packaging Technology and Science Packag. Technol. Sci. 2015; 28: 949–957
Riisgaard, L and S. Ponte (2011). "Pro-poor value chain development: 25 guiding questions for designing and implementing agro-industry projects." (PDF). UNIDO. https://en.wikipedia.org/wiki/Agricultural_value_chain#cite_note-Riisgaard.2C_L_and_S._Ponte-7 Retrieved June 2, 2017.
Salami, A. Kamara, A and Brixiova, Z. (2010) Smallholder Agriculture in East Africa: Trends Constraints and Opportunities. Working Paper No. 105 April 2010. Tunis: African Development Bank
Sayers, M. W., Gillespie, T. D., & Paterson, W. D. (1986). Guidelines for Conducting and Calibrating Road Roughness Measurements. Washington, D.C. USA: The World Bank
Sieber, N. (2009) Freight Transport for Development Toolkit: Rural Freight. Leapfrogging from Rural Hubs to New Markets, Transport Research Support, World Bank, Washington DC
Steyn, W. J., Nokes, L., du Plessis, L., R, A., N, B., & L, P. (2015). Evaluation of the Effect of Rural Road Condition on Agricultural Produce Transportation. Journal of the Transportation Research Board, No. 2473, 33-41
Stifel, D. and Minten, B. (2008). Isolation and agricultural productivity. Agricultural Economics, 39: 1
TRL Limited (2006). Spot improvement Manual for Basic Access. Crowthorne, UK: Transport Research Laboratory
UNDP (2014). Sustaining Human Progress: Reducing Vulnerabilities and Building Resilience. Human Development Report 2014. New York: United Nations Development Programme
UNIDO (2007), Food Processing Pilot Centres: An approach to productive capacity-building for trade and poverty alleviation in Africa. Vienna: United Nations Industrial Development Organization (UNIDO)
USDA Forest Service. (n.d.). Forest Road Construction and Maintenance . Washington, D.C. USA: USDA Forest Service
Van der Land and Uliwa. (2007). Cassava Sub Sector Value Chain Analysis, Match Maker World Bank (2000) Agriculture in Tanzania since 1986: Follower or Leader in Growth. World Bank/IFPRI, Washington DC
Valdés, A. Foster, W. Anríquez, G. Azzarri, C. Covarrubias, K. Davis, B. DiGiuseppe, S. Essam, T. Hertz, T. Paula de la O, A. Quiñones, E. Stamoulis, K. Winters, P. and Zezza, A. (2009). A Profile of the Rural Poor. IFAD Rural Poverty Report 2009. Rome: International Fund for Agricultural Development
Weaver, W. E., & Hagans, D. K. (1994). A Handbook for Forest and Ranch Roads: A guide for planning, designing, constructing, reconstructing, maintaining and closing wildland roads. California, USA: USDA Soil Conservation Service
Webber, C. M.; P. Labaste. 2010. "Building competitiveness in Africa’s agriculture: A guide to value chain concepts and applications." (PDF). https://en.wikipedia.org/wiki/World_BankRetrieved June 2, 2017.
Wiggins, S. (2013). "African agriculture in a changing global context: lessons learned" (PDF). CTA. https://brusselsbriefings.files.wordpress.com/2013/10/br33_steve_wiggins.pdf.
Wiggins, S. (2009). Can the smallholder model deliver poverty reduction and food security for a rapidly growing population in Africa? Food and Agriculture Organisation of the United Nations (FAO)
Winklemann, P. (1999) Self-Help for Road Construction: when it applies – how can it be encouraged and supported. Geneva: Swiss Organization for Development and Co-operation
World Bank (2017). Community Driven Development Overview. http://www.worldbank.org/en/topic/communitydrivendevelopment/overview [29 March 2017]. Accessed 13 June 2017. Washington D. C.: World Bank
World Bank (2008). Agriculture for Development. World Development Report 2008. Washington D. C.: World Bank
Evaluation of the Effect of Road Condition on the Quality of Agricultural Produce – Phase 2 Report
Page 69
World Bank (2005). Community Driven Development: Looking at Social Inclusion through a Gendered Lens. June 2005. Washington D. C.: World Bank
World Bank (2003). Technical Note on Rural Transport in Multi-Sectoral and Community Driven Projects. March 2003. Washington D. C.: World Bank
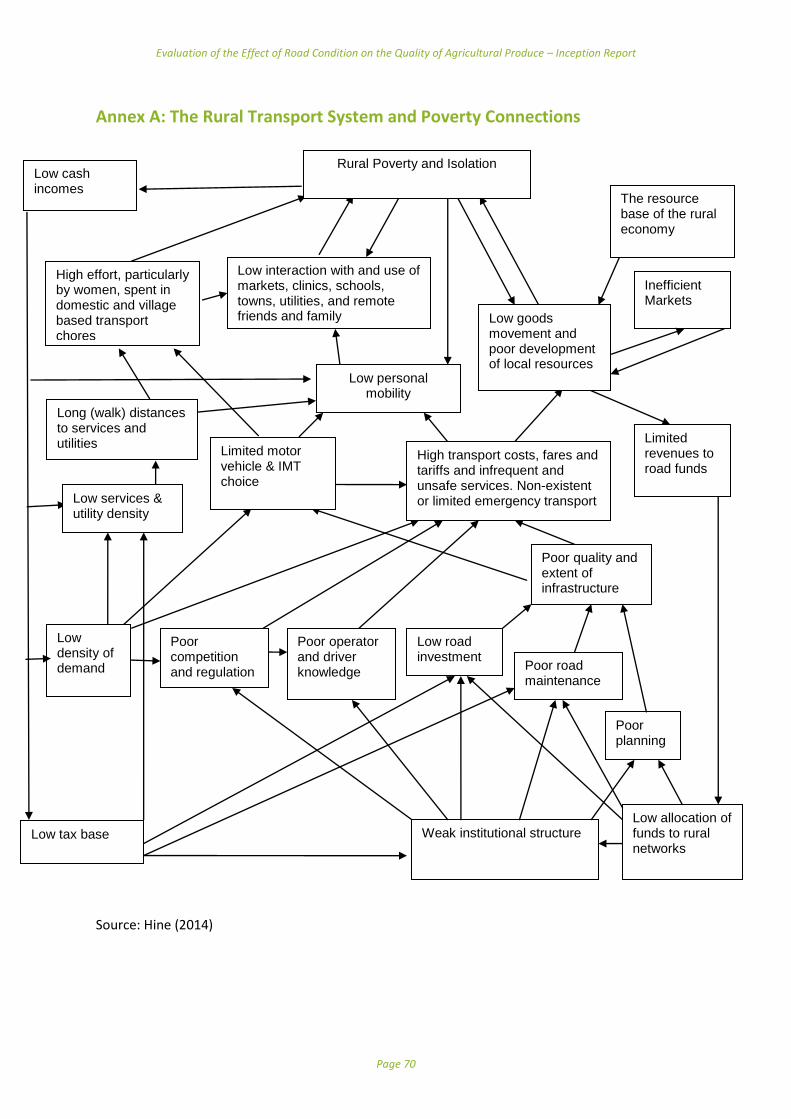
Evaluation of the Effect of Road Condition on the Quality of Agricultural Produce – Inception Report
Page 70
Annex A: The Rural Transport System and Poverty Connections
Source: Hine (2014)
Poor planning
Weak institutional structure Low allocation of funds to rural networks
Low personal mobility
High transport costs, fares and tariffs and infrequent and unsafe services. Non-existent or limited emergency transport
Poor quality and extent of infrastructure
Poor road maintenance
Low road investment
Poor competition and regulation
Poor operator and driver knowledge
Low goods movement and poor development of local resources
Low interaction with and use of markets, clinics, schools, towns, utilities, and remote friends and family
Limited motor vehicle & IMT choice
Inefficient Markets
The resource base of the rural economy
Limited revenues to road funds
Low cash incomes
Low tax base
Low density of demand
Rural Poverty and Isolation
High effort, particularly by women, spent in domestic and village based transport chores
Long (walk) distances to services and utilities
Low services & utility density

Evaluation of the Effect of Road Condition on the Quality of Agricultural Produce – Inception Report
Page 71
Annex B: Workshop Participants
No Mr/Mrs Family Name First Name Organization Position Email Telephone/Mob
1 Eng. Joseline Kagombola PO-RALG Engineer [email protected] +255655356136
2 Eng. Moses Nyoni DART Engineer [email protected] +2557122334707
3 Mushule Nurdin UDSM Professor [email protected] +255222410128
4 Kalimbaga R Roads Fund Board Roads Fund Board rkalimbaga +255784403612
5 Mwankusye Josephine Dar es salaam Consultant [email protected] +255 754 266 147
6 Mrs Kinasha E TASAF Project Engineer [email protected] +255784478207
7 Kagoma Elikana Mbogwe District Council, GeitaDistrict Cooperative
Officer (DCO)[email protected] +255 757033 233
8 Lema Camilla SELF Trans Economist [email protected] 2557860770181
9 Mgonja Eli Transaid Reprosentative [email protected] +255788667033
10 Mshana Zainabu NIT Lecture [email protected] +255754775222
11 Lushakuzi Simon NIT Director of Reaserch [email protected] +255754373518
12 Awadh Abdul TFGTransport Forum
[email protected] +255 (0)767820015
13 Smart Daniel Helpage international Country Director [email protected] +255784727325
14 Swai Neema Amend Programme Officer [email protected] +255713265870
15 Kinyaga Bruno International Road Assessment
Programme
Surveyor and
[email protected] +255718937070
16 Kabogo Moses LWR Programme Manager [email protected] +255 718 576 045
17 Sigalla Ajuaye FAOProgramme Officer -
Value Chain [email protected] +255 763 820 029
18 Dr Magafu Fikiri PO RALG Assistant Director [email protected] +255 756 494 079
19 Soiti Stanley IRAT [email protected]+255653019005/715279
219
20 Masungwa Lucas IRAT Admn [email protected] +255759250135
21 Bradbury Annabel TRL Team Leader [email protected] +441344770284
22 Hine John TRL Economist [email protected] +441344772860
23 Njenga Peter IFRTD [email protected] +254722360860
24 Wahome Grace IFRTD [email protected] +254723639496
25 Willilo Shedrack IFRTD [email protected] +255767470915
26 Kilindo Sophia STET International [email protected] +255764886239
27 Mkude Tabitha STET International [email protected] +255688224222
Participant List
First Mile Stakeholders workshop
13th July 2017 Landmark Resort, Mbezi Beach, Dar es Salaam
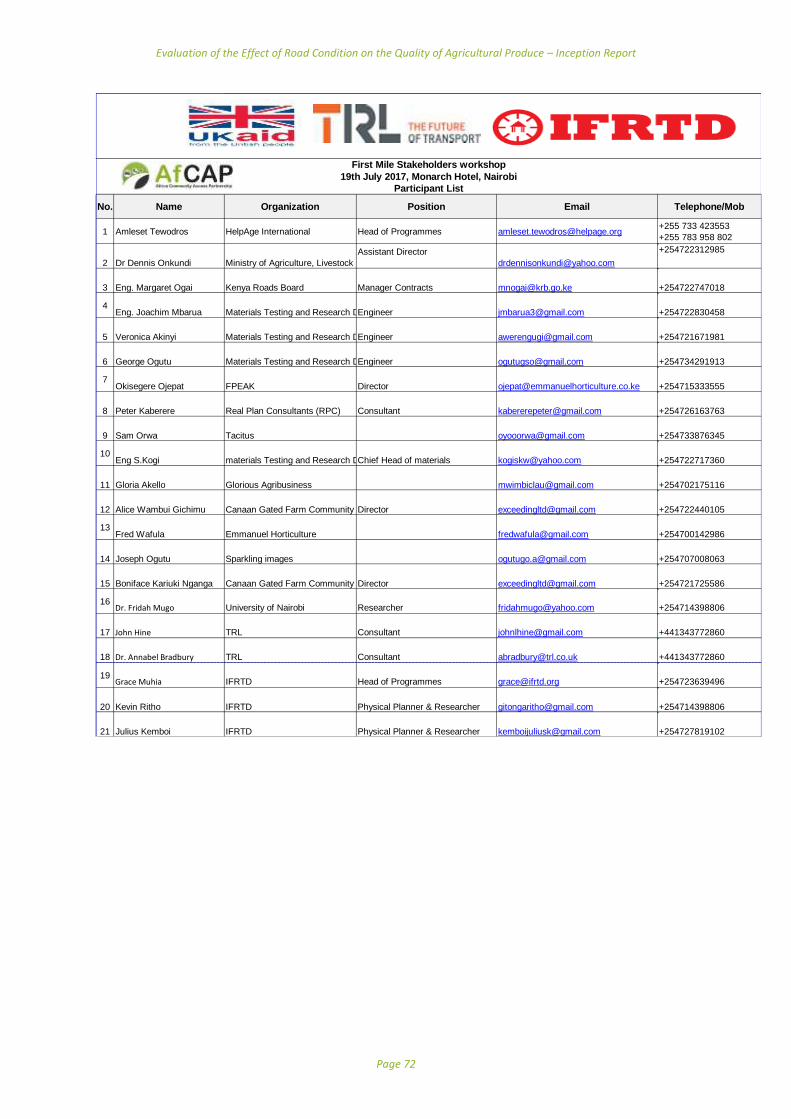
Evaluation of the Effect of Road Condition on the Quality of Agricultural Produce – Inception Report
Page 72
No. Name Organization Position Email Telephone/Mob
1 Amleset Tewodros HelpAge International Head of Programmes [email protected]+255 733 423553
+255 783 958 802
2 Dr Dennis Onkundi Ministry of Agriculture, Livestock and Fisheries
Assistant Director
+254722312985
3 Eng. Margaret Ogai Kenya Roads Board Manager Contracts [email protected] +254722747018
4Eng. Joachim Mbarua Materials Testing and Research DepartmentEngineer [email protected] +254722830458
5 Veronica Akinyi Materials Testing and Research DepartmentEngineer [email protected] +254721671981
6 George Ogutu Materials Testing and Research DepartmentEngineer [email protected] +254734291913
7Okisegere Ojepat FPEAK Director [email protected] +254715333555
8 Peter Kaberere Real Plan Consultants (RPC) Consultant [email protected] +254726163763
9 Sam Orwa Tacitus [email protected] +254733876345
10Eng S.Kogi materials Testing and Research DepartmentChief Head of materials [email protected] +254722717360
11 Gloria Akello Glorious Agribusiness [email protected] +254702175116
12 Alice Wambui Gichimu Canaan Gated Farm Community Director [email protected] +254722440105
13Fred Wafula Emmanuel Horticulture [email protected] +254700142986
14 Joseph Ogutu Sparkling images [email protected] +254707008063
15 Boniface Kariuki Nganga Canaan Gated Farm Community Director [email protected] +254721725586
16Dr. Fridah Mugo University of Nairobi Researcher [email protected] +254714398806
17 John Hine TRL Consultant [email protected] +441343772860
18 Dr. Annabel Bradbury TRL Consultant [email protected] +441343772860
19Grace Muhia IFRTD Head of Programmes [email protected] +254723639496
20 Kevin Ritho IFRTD Physical Planner & Researcher [email protected] +254714398806
21 Julius Kemboi IFRTD Physical Planner & Researcher [email protected] +254727819102
First Mile Stakeholders workshop
19th July 2017, Monarch Hotel, Nairobi
Participant List
Evaluation of the Effect of Road Condition on the Quality of Agricultural Produce – Inception Report
Page 73
Annex C: Workshop Evaluation
C1. Tanzania Workshop Evaluation
The Tanzania workshop was attended by 27 participants from the transport and agricultural sectors, including PO RALG, the National Institute of Transport, FAO and the University of Dar es Salaam. A list of workshop participants is provided in Annex B. Dr Fikiri Magafu, Assistant Director at PO RALG provided the opening speech at the workshop, and Abdul Awadh from the Tanzania Transport Forum Group chaired the proceedings for the day. Discussion points raised during the workshop can be summarised as follows:
Title of the study does not easily match with the main themes of the study
Literature review does not support the study variables. John Hine’s response: we are not doing a comprehensive agricultural study but transport issues in agriculture
Explore if farmers organisations could be used to improve access
Define precisely what do we mean by small scale farmers
Support with literature review who are the small-scale farmers i.e. youth, women, older people, etc
How does access affect farmers at the borders where access on a nearby country is good and prices are good as opposed to own country?
There is a need for an integrated approach system to ensure small scale farmers are not neglected
Explore more recent data on crop deterioration Vs infrastructure development
Explore (literature review) relationship between retirement Vs age profile in agriculture
Why are all the two preferred sites both located in the same region? Get other site outside Njombe but within the Southern Agricultural Growth Corridor of Tanzania (SAGCOT) zone.
To minimise bias and reliability of data we need to carefully select the KII
Triangulate information gathered from regional and district officials with those from grassroots experts
Increase sample size for women
Separate women from men during interview so that women can comfortably air their views
Define “Quality” in the Title of the study
Explore how the current national programs in agriculture link with our study
What were the criteria for choice of data collection months? September is hardly a harvest season. Are you going to have repeat surveys? When? Where?
Sample size looks small, why? Any basis?
Availability of statisticians and statistical packages?
Enumerators must be those who are qualified and able to understand well the research theme.
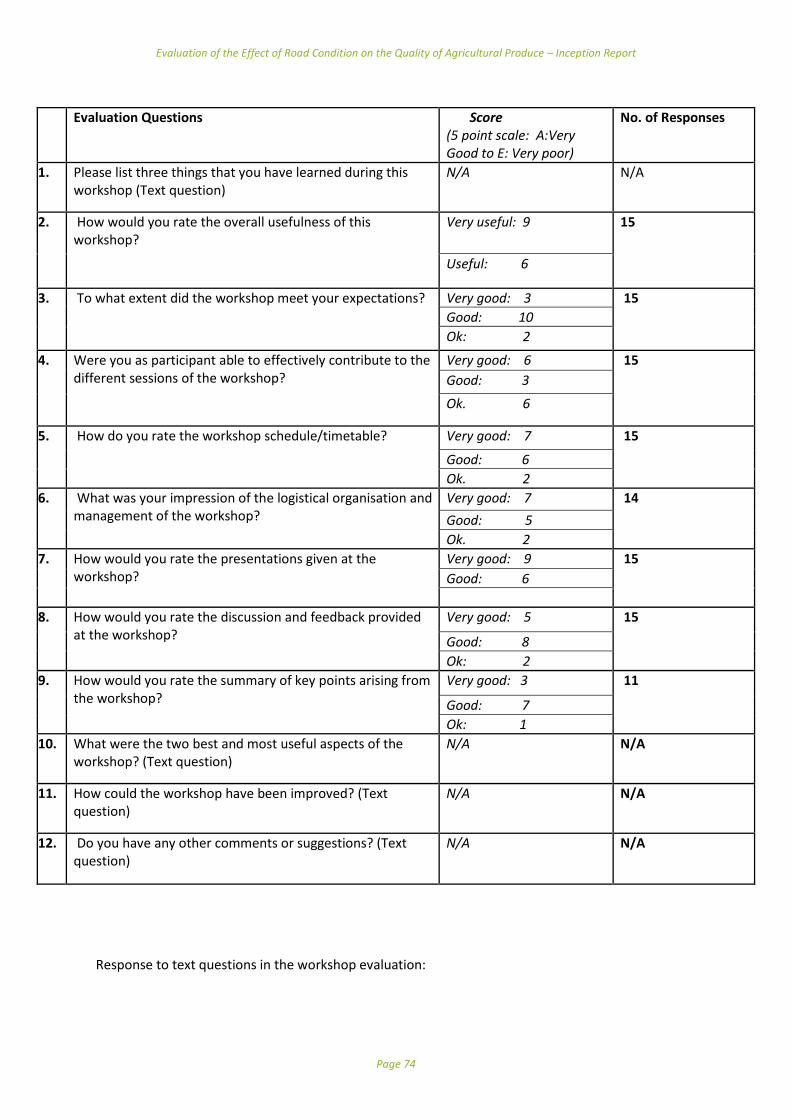
Evaluation of the Effect of Road Condition on the Quality of Agricultural Produce – Inception Report
Page 74
Response to text questions in the workshop evaluation:
Evaluation Questions Score (5 point scale: A:Very Good to E: Very poor)
No. of Responses
1. Please list three things that you have learned during this workshop (Text question)
N/A N/A
2. How would you rate the overall usefulness of this workshop?
Very useful: 9 15
Useful: 6
3. To what extent did the workshop meet your expectations? Very good: 3 15
Good: 10
Ok: 2
4. Were you as participant able to effectively contribute to the different sessions of the workshop?
Very good: 6 15
Good: 3
Ok. 6
5. How do you rate the workshop schedule/timetable? Very good: 7 15
Good: 6
Ok. 2
6. What was your impression of the logistical organisation and management of the workshop?
Very good: 7 14
Good: 5
Ok. 2
7. How would you rate the presentations given at the workshop?
Very good: 9 15
Good: 6
8. How would you rate the discussion and feedback provided at the workshop?
Very good: 5 15
Good: 8
Ok: 2
9. How would you rate the summary of key points arising from the workshop?
Very good: 3 11
Good: 7
Ok: 1
10. What were the two best and most useful aspects of the workshop? (Text question)
N/A N/A
11. How could the workshop have been improved? (Text question)
N/A N/A
12. Do you have any other comments or suggestions? (Text question)
N/A N/A
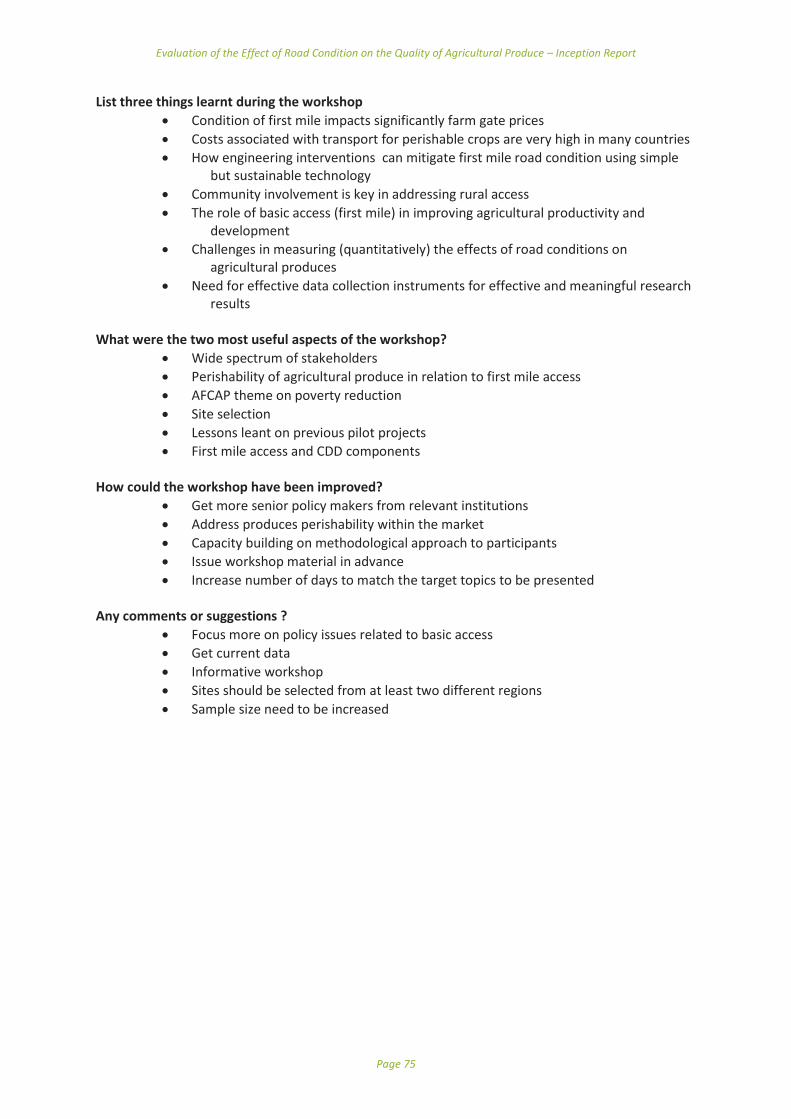
Evaluation of the Effect of Road Condition on the Quality of Agricultural Produce – Inception Report
Page 75
List three things learnt during the workshop
Condition of first mile impacts significantly farm gate prices
Costs associated with transport for perishable crops are very high in many countries
How engineering interventions can mitigate first mile road condition using simple but sustainable technology
Community involvement is key in addressing rural access
The role of basic access (first mile) in improving agricultural productivity and development
Challenges in measuring (quantitatively) the effects of road conditions on agricultural produces
Need for effective data collection instruments for effective and meaningful research results
What were the two most useful aspects of the workshop?
Wide spectrum of stakeholders
Perishability of agricultural produce in relation to first mile access
AFCAP theme on poverty reduction
Site selection
Lessons leant on previous pilot projects
First mile access and CDD components How could the workshop have been improved?
Get more senior policy makers from relevant institutions
Address produces perishability within the market
Capacity building on methodological approach to participants
Issue workshop material in advance
Increase number of days to match the target topics to be presented
Any comments or suggestions ?
Focus more on policy issues related to basic access
Get current data
Informative workshop
Sites should be selected from at least two different regions
Sample size need to be increased
Evaluation of the Effect of Road Condition on the Quality of Agricultural Produce – Inception Report
Page 76
C2. Kenya Workshop Evaluation
The Kenya workshop was attended by 21 participants from the transport and agricultural sectors, including the Kenya Roads Board, Materials Testing and Research Department, Ministry of Agriculture, Livestock and Fisheries, and the University of Nairobi. A list of workshop participants is provided in Annex B. Dr Dennis Onkundi, Assistant Director at the Ministry of Agriculture, Livestock and Fisheries opened the workshop with a presentation about the work of the Ministry in relation to First Mile challenges for small-scale farmers. Ojepat Okisegere, Director of Fresh Produce Exporters Association of Kenya (FPEAK) chaired the proceedings for the day. As with the Tanzanian workshop there was recognition that the current title does not easily match with the main themes of the study. Discussion points raised during the workshop can be summarised as follows:
What is the status of skills used by the farmers and are they having access to technical advice from extension officers?
o Currently there is a shortage of extension officers in the country. However, the private officers are available and assisting farmers in organised farming groups.
o PPP could be explored where the farmers get the services from the private officers at a fee- requires formation of farmer groups for ease in service delivery.
Can an individual donate/facilitate the road construction or maintenance?
o The government policy has classified roads in Kenya into various categories and given the management to agencies such as: KeNHA, KURA, KeRRA and KWS.
o Other roads have further been given to the management of the County Governments
o Individuals wishing to chip in the maintenance of roads can use the framework of the Public Private Partnership Act to cooperate on the matter with the government.
Where can data on roads in Kenya be obtained?
o Data is available at the Kenya Roads Board and the road Agencies. Data on roads to be availed through Grace
Is it possible to share the data on road classification?
o It is possible to share, some at KeRRA portal others to be shared in a week via Grace.
Will the roads bill be out soon and how will it affect roads?
o Due to the politics around at the moment the bill is not to be considered until the next parliament.
Ministry preparing linkage policy documents looking at linkage of roads and agriculture
We could start/ touch on the existing national policies on the sectors of road transport and agriculture- what is the government thinking and actions in these areas?
Is it possible to get a copy of the agricultural policy for the country?
o Crops policy and agriculture policy drafts available and to be shared.
Consideration for food safety?
o Accreditation for residue analysis, KeFFIS testing molecules, use of antibiotics rampant-needs to be addressed, KeBS setting standards for agricultural products
Reduction of postharvest loss for fruits require organizations to set up standards for the products including provisions for mode of transport.
Evaluation of the Effect of Road Condition on the Quality of Agricultural Produce – Inception Report
Page 77
Declination for agricultural production?
o Quality of inputs questionable- fertiliser, seeds
o Agricultural extension services inadequate- soil testing, agricultural methods
100 Bn Dollars earned from horticulture in Kenya in 2016 from export- 5% is for export, 95% is sold locally.
Who is responsible for the footpath?
How can the access to insurance and financing for agricultural production be improved?
o Formation of farmer groups/ cooperatives make it easier to access financing
Study area Selection:
Location of the sites, all the considered sites are in Eastern part of Kenya, this could lead to bias. Could they be considered in other areas?
The site in Meru will soon be improved, it could provide a good case study for studying the condition before and after the improvement.
Looking for a poor and a well-connected area for comparison.
Could Nyandarua be included due to its productivity and its poor road connectivity?
o Two sites to be selected for detailed study
What effort is the government taking to simplify issues for the stakeholders? Simplify policy and bureaucracy on the repair of roads by the private stakeholders
o Government is trying to become more responsive through community development initiatives in areas of PPP
Consideration for inclusion in the methodology to incorporate inclusive approach for gender, age groups etc
Must the project be done in isolation? Can other actors in the area cooperate with the research team?
Site selection:
o Both Kithimani and Miathene, they both have the same crop
o Does the produce have to be the same for the two sites?
o The two sites will each have two sub-areas in each each with a good and a bad connection area
o The selection of other areas outside of the already 6 suggested sites will result to time and cost implications
o The study is not meant to be representative of all rural Kenya.
o There could be need for spread of sites to create a better understanding- an area in the Mt. Kenya and one in the Mt. Elgon region
o Creation of a whatsapp group for members to liaise and share information?
o Share our contacts and emails for ease in communication and sharing information?
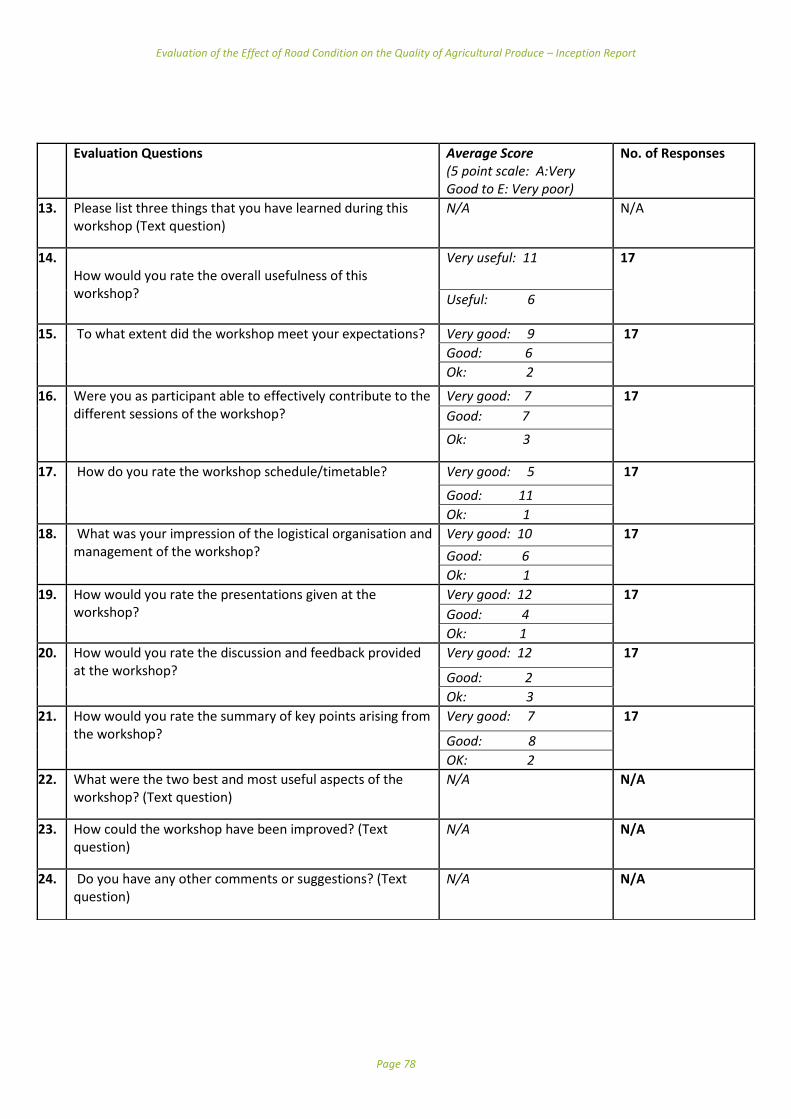
Evaluation of the Effect of Road Condition on the Quality of Agricultural Produce – Inception Report
Page 78
Evaluation Questions Average Score (5 point scale: A:Very Good to E: Very poor)
No. of Responses
13. Please list three things that you have learned during this workshop (Text question)
N/A N/A
14. How would you rate the overall usefulness of this workshop?
Very useful: 11 17
Useful: 6
15. To what extent did the workshop meet your expectations? Very good: 9 17
Good: 6
Ok: 2
16. Were you as participant able to effectively contribute to the different sessions of the workshop?
Very good: 7 17
Good: 7
Ok: 3
17. How do you rate the workshop schedule/timetable? Very good: 5 17
Good: 11
Ok: 1
18. What was your impression of the logistical organisation and management of the workshop?
Very good: 10 17
Good: 6
Ok: 1
19. How would you rate the presentations given at the workshop?
Very good: 12 17
Good: 4
Ok: 1
20. How would you rate the discussion and feedback provided at the workshop?
Very good: 12 17
Good: 2
Ok: 3
21. How would you rate the summary of key points arising from the workshop?
Very good: 7 17
Good: 8
OK: 2
22. What were the two best and most useful aspects of the workshop? (Text question)
N/A N/A
23. How could the workshop have been improved? (Text question)
N/A N/A
24. Do you have any other comments or suggestions? (Text question)
N/A N/A
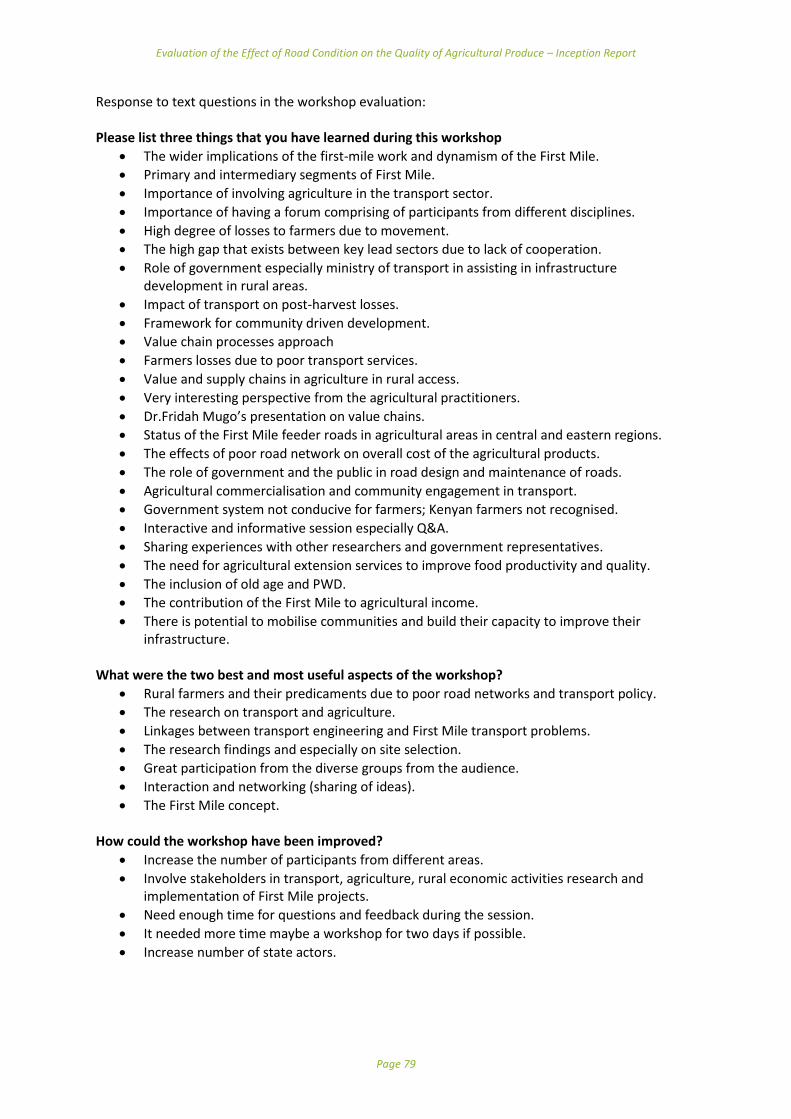
Evaluation of the Effect of Road Condition on the Quality of Agricultural Produce – Inception Report
Page 79
Response to text questions in the workshop evaluation: Please list three things that you have learned during this workshop
The wider implications of the first-mile work and dynamism of the First Mile.
Primary and intermediary segments of First Mile.
Importance of involving agriculture in the transport sector.
Importance of having a forum comprising of participants from different disciplines.
High degree of losses to farmers due to movement.
The high gap that exists between key lead sectors due to lack of cooperation.
Role of government especially ministry of transport in assisting in infrastructure development in rural areas.
Impact of transport on post-harvest losses.
Framework for community driven development.
Value chain processes approach
Farmers losses due to poor transport services.
Value and supply chains in agriculture in rural access.
Very interesting perspective from the agricultural practitioners.
Dr.Fridah Mugo’s presentation on value chains.
Status of the First Mile feeder roads in agricultural areas in central and eastern regions.
The effects of poor road network on overall cost of the agricultural products.
The role of government and the public in road design and maintenance of roads.
Agricultural commercialisation and community engagement in transport.
Government system not conducive for farmers; Kenyan farmers not recognised.
Interactive and informative session especially Q&A.
Sharing experiences with other researchers and government representatives.
The need for agricultural extension services to improve food productivity and quality.
The inclusion of old age and PWD.
The contribution of the First Mile to agricultural income.
There is potential to mobilise communities and build their capacity to improve their infrastructure.
What were the two best and most useful aspects of the workshop?
Rural farmers and their predicaments due to poor road networks and transport policy.
The research on transport and agriculture.
Linkages between transport engineering and First Mile transport problems.
The research findings and especially on site selection.
Great participation from the diverse groups from the audience.
Interaction and networking (sharing of ideas).
The First Mile concept. How could the workshop have been improved?
Increase the number of participants from different areas.
Involve stakeholders in transport, agriculture, rural economic activities research and implementation of First Mile projects.
Need enough time for questions and feedback during the session.
It needed more time maybe a workshop for two days if possible.
Increase number of state actors.
Evaluation of the Effect of Road Condition on the Quality of Agricultural Produce – Inception Report
Page 80
Do you have any other comments or suggestions?
Need to take this discussion from the perspective of social policy sector and therefore invite such providers.
Spread the research roads/sites to get a representative.
The workshop was very insightful.
As small-scale farmer I urge the team to cover other regions in Kenya the get variety of situations and experiences.
Sample location should represent like 80% of the country.
Give more time for feedback and discussions.
Conduct more of these workshops. Summary of Workshop Evaluation Questionnaire
Evaluation Questions Average Score No. of Responses
1. Please list three things that you have learned during this workshop (Text question - see Annex ??)
N/A N/A
2. How would you rate the overall usefulness of this workshop?
3. To what extent did the workshop meet your expectations?
4. Were you as participant able to effectively contribute to the different sessions of the workshop?
5. How do you rate the workshop schedule/timetable?
6. What was your impression of the logistical organisation and management of the workshop?
7. How would you rate the presentations given at the workshop?
8. How would you rate the discussion and feedback provided at the workshop?
9. How would you rate the summary of key points arising from the workshop?
10. What were the two best and most useful aspects of the workshop? (Text question - see Annex ??)
N/A N/A
11. How could the workshop have been improved? (Text question - see Annex ??)
N/A N/A
12. Do you have any other comments or suggestions? (Text question - see Annex ??)
N/A N/A
Evaluation of the Effect of Road Condition on the Quality of Agricultural Produce – Inception Report
Page 81
Annex D: Sampling and Study Implementation Process
1. If the selected site is at the location level, the team will visit the Chiefs office. If at the sub-location level, the team will visit the Assistant Chief.
2. Assuming that it is the Location, the Chief will provide the number and names of the sub-locations.
3. If the sub-locations are fairly homogeneous, simple random selection method will be conducted to sample two sub-locations for the study.
4. If the sub-locations are not homogeneous, two sub-locations will be sampled purposively using the characteristic of interest as the criteria e.g. the sub-location grows a desired crop.
5. Once the sub-locations are sampled, the assistant Chiefs of the two sub-locations will be requested to assist in providing a list of all the farmers in their sub-location. This, they will do through their head men.
6. Each headman will bring a list of all the farmers in their village organized by gender and whether they grow the crop of interest for commercial purposes or subsistence.
7. Farmers will also be grouped by their distance from the main road. i.e. those near the road and those far from the road.
8. The lists will be used as sampling frame for selecting the study respondents. 9. Depending on the desired sample size – proportionate sampling will be done, so that the
villages that have more farmers have proportionately more respondents. 10. Simple random sampling or systematic random sampling will be used to pick the
respondents. 11. To conduct the interviews, each research assistant will be accompanied by the headman or
will be given a guide from the village who knows all the farmers in the village. This will speed up the process of identifying the sampled farmers and also give the respondents confidence to talk to the research assistants.
12. The respondents to be interviewed on a particular day will be informed by the village guide one day in advance and the approximate time so that they can wait for the interview. In case a given respondent is not available, it can be decided by the whole team that the next farmer to the right side of the respondent’s farm will be interviewed.
13. All the village guides, the Assistant Chiefs and the Chiefs have to be compensated for their time. The Chiefs and Assistant Chiefs could also be facilitated with airtime for mobilizing their Assist Chiefs, Headmen and Village Guides.
FOCUS GROUP DISCUSSIONS
1. For focus group discussions, it will be necessary to separate men and women farmers. Women tend to let the men do the talking when they are put together. In addition, youth when put together with older people, they tend to let the older people to do the talking. First Mile transporters are likely to feel inferior before large transporters if they are put together. However, this can be done so that they provide information for the whole value chain, what will be required is a facilitator who ensures that information is obtained from all the participants in the FGD.
2. A checklist of the issues to be covered by the different focus group discussions will be used
to ensure that no required information is left out. Each FGD will have a facilitator (Chair) and a recorder. All similar FGDs should use same Focus Group Discussion Guide to allow for comparisons.

Evaluation of the Effect of Road Condition on the Quality of Agricultural Produce – Inception Report
Page 82
3. FGDs should not be held in individual farmers homes – instead it should be in neutral grounds like schools, church compounds, community grounds, conference rooms etc.
4. Transport refund and some drinks/lunch should be provided for FGD participants depending
on the time of the meeting to appreciate their contribution. KEY INFORMANTS
1. Similar key informants interview schedule should be used for the interviews again to allow for comparisons.
2. Key informants should be interviewed by the research scientists and not research assistants. This is to allow for in-depth probing and serious engagement.
OBSERVATION
1. Each research assistant should have an observation list and a camera/phone – to record the features observed that are relevant to the study such as impassable roads, no bridges, steep slopes, head loads, wheel barrow transporters, motorcycle transport, truck transporters, floods, road width etc.

Evaluation of the Effect of Road Condition on the Quality of Agricultural Produce – Inception Report
Page 83
Annex E: Engineering Assessment Form
Evaluation of the Effect of Road Condition on the Quality of Agricultural Produce – Inception Report
Page 84
Annex F: Contribution to ReCAP Log Frame Service Providers should forecast the contributions the project will make to the ReCAP logframe over the period of the project. Details of basis for calculation and recording are contained below. Number of columns should be adjusted to suit the length of project.
Intervention Logic Indicator Source of
Verification Baseline
(Date) Milestone 1 31
Milestone 2 31 July
2017
Milestone 3
31 July
2018
End of
Project
Target
(Date)
Assumptions
Outcome:
Sustained increase in evidence base for more cost effective and reliable low volume rural road and transport services, promoted and influencing policy and practice in Africa and Asia
1. SUSTAINABILITY: Partner Government and other financiers co-funding research with ReCAP.
Contributions in kind (K) and Core Contributions (C)
2. Concrete examples of change (applied or formally adopted), influenced by ReCAP research that will be allied to #km of road in focus countries.
3. Number of citations in academic articles of ReCAP peer reviewed articles and/or working papers, conference papers etc.
Output 1:
RESEARCH and UPTAKE: Generation, validation and
1.1 LVRR: Number of peer reviewed papers generated from ReCAP supported or related LVRR research projects made available in open access format.
Title of paper, date
and name of writers
and publishers of a
peer reviewed
paper;
May 2017 April 2018?
Evaluation of the Effect of Road Condition on the Quality of Agricultural Produce – Inception Report
Page 85
Intervention Logic Indicator Source of
Verification Baseline
(Date) Milestone 1 31
Milestone 2 31 July
2017
Milestone 3
31 July
2018
End of
Project
Target
(Date)
Assumptions
updating of evidence for effective policies and practices to achieve safe, all-season, climate-resilient, equitable and affordable LVRR and transport services in African and Asian countries.
(Low Volume Rural Roads : LVRR / TS – Transport Services)
2 Country Case
Studies.
A Final Synthesis
Report.
1.2. TS: Number of peer reviewed papers generated from ReCAP supported or related LVRR research projects made available in open access format.
Title, authors of the
research report;
Name of peer
reviewed journal,
title and date paper
published
One peer
reviewed
paper in an
international
journal
1.3 Engineering Research: National policies, manuals, guidelines and/or research outputs that have been fully incorporated into Government/Ministerial requirements, specifications and recommended good practice as a result of ReCAP engineering research (including climate change adaptation and AfCAP and SEACAP adaptations).
To include introduction of new policies and modification to existing policies.

Evaluation of the Effect of Road Condition on the Quality of Agricultural Produce – Inception Report
Page 86
Intervention Logic Indicator Source of
Verification Baseline
(Date) Milestone 1 31
Milestone 2 31 July
2017
Milestone 3
31 July
2018
End of
Project
Target
(Date)
Assumptions
1.4 TRANSPORT SERVICES Research: National policies, regulations and/or practices for rural transport services modified or introduced as a result of ReCAP research (including road safety and gender and AFCAP and SEACAP research )
To include introduction of new policies and modification to existing policies.
1.6. LVRR and TS information generated for dissemination, and disseminated, that is not peer reviewed. Total to include research papers, final research reports, workshop reports, manuals and guidelines.
CHECK IF THIS IS TO BE PART OF Service Provider Reporting
Output 2:
CAPACITY BUILDING: The building of sustainable capacity to carry out research on low volume rural roads, and rural transport services in African and Asian
2.1. African / Asian experts or institutions taking lead roles in ReCAP Research Projects.
Contract documents
between IFRTD and
TRL
IFRTD as a collaborating
partner is made up of
African experts
2.3. Research projects with female researcher inputs at senior technical level.
Gender composition
of the team as
presented in the
proposal
3 members out
7 members of
core team are
female

Evaluation of the Effect of Road Condition on the Quality of Agricultural Produce – Inception Report
Page 87
Intervention Logic Indicator Source of
Verification Baseline
(Date) Milestone 1 31
Milestone 2 31 July
2017
Milestone 3
31 July
2018
End of
Project
Target
(Date)
Assumptions
countries.
Output 3:
KNOWLEDGE: Generated evidence base of LVRR and transport services knowledge is widely disseminated and easily accessible by policy makers and practitioners (including education and training institutions).
3.2. ReCAP generated knowledge presented and discussed at high level international development debates and conferences
Name and Date of
the workshop
Title of paper
presented
Title of a peer
reviewed paper
T
Continuous policy
engagement using
research outputs
3.3.ReCAP generated knowledge disseminated through significant workshops and dedicated training, virtually or physically, that are rated by participants as effective..
Names, dates and
attendance register
for workshops
2 country workshops in
Kenya
2 country workshops in
Tanzania
One regional workshop