Embed Size (px)
Citation preview
EVALUATION OF THE FATE AND TRANSPORT OF METHANOL IN THE ENVIRONMENT Prepared For: American Methanol Institute 800 Connecticut Avenue, NW, Suite 620 Washington, DC 20006 Prepared By: Malcolm Pirnie, Inc. 180 Grand Avenue, Suite 1000 Oakland, California 94612 JANUARY 1999
3522-002
Technical Memorandum i MALCOLM PIRNIE, INC.
TABLE OF CONTENTS Page EXECUTIVE SUMMARY .............................................................................................ES-1
1.0 BACKGROUND .................................................................................................... 1 1.1 Purpose and Scope of Report........................................................................ 1 1.2 Introduction and History of Use ................................................................... 1 1.3 Methanol Production..................................................................................... 3 1.4 Chemical and Physical Properties................................................................. 4 1.5 Release Scenarios ......................................................................................... 5 1.6 Fate in the Environment ............................................................................... 7 2.0 PARTITIONING OF METHANOL IN THE ENVIRONMENT........................... 9 2.1 Methanol Partitioning Between Environmental Compartments .................. 9 2.2 Air/Water Partitioning.................................................................................. 9 2.3 Soil/Water Partitioning................................................................................. 10 2.4 LNAPL Dissolution...................................................................................... 10 2.5 Comingling/Cosolvency Effects................................................................... 12 3.0 FATE AND TRANSPORT OF METHANOL IN THE ENVIRONMENT........... 14 3.1 Soil and Groundwater Release ..................................................................... 14 3.1.1 Sources of Methanol in Soil and Groundwater.................................. 14 3.1.2 Losses of Methanol in Soil and Groundwater ................................... 15
3.1.2.1 Biodegradation...................................................................... 15 3.1.2.1.1 Presence of Indigenous Methanol-Degrading Microbes ................................................................. 15
3.1.2.1.2 Availability of Electron Acceptors ......................... 17 3.1.2.1.3 Availability of Nutrients ......................................... 18 3.1.2.1.4 Adequate pH and Temperature Levels ................... 18 3.1.2.1.5 Reports of Methanol Biodegradation Under
Various Redox Conditions...................................... 19 3.1.2.2 Adsorption ............................................................................ 22 3.1.2.3 Volatilization from Groundwater ......................................... 22 3.2 Surface Water ............................................................................................... 23 3.2.1 Sources of Methanol in Surface Water .............................................. 23 3.2.2 Losses of Methanol in Surface Water................................................ 23 3.2.2.1 Biodegradation...................................................................... 24
3.2.2.2 Abiotic Degradation.............................................................. 24 3.2.2.3 Bioaccumulation ................................................................... 25 3.2.2.4 Volatilization ........................................................................ 25
3.3 Methanol / BTEX Comingled Plumes .......................................................... 26 3.4 Conclusions................................................................................................... 27
4.0 METHANOL ADDITIVES .................................................................................... 28
4.1 Purpose and Background of Additives ......................................................... 28 4.2 Fate and Transport of Three Known Additives............................................ 28
Technical Memorandum ii MALCOLM PIRNIE, INC.
4.2.1 Luminosity........................................................................................... 28 4.2.2 Taste .................................................................................................... 29 4.2.3 Colorant ............................................................................................... 31
4.3 Conclusion .................................................................................................... 32 5.0 REMEDIATION AND TREATMENT................................................................. 33 5.1 Remediation for Methanol ........................................................................... 33 5.2 Impetus for Drinking Water Treatment........................................................ 33 5.3 Air Stripping................................................................................................. 34 5.4 Activated Carbon.......................................................................................... 34 5.5 Advanced Oxidation..................................................................................... 35 5.6 Membranes ................................................................................................... 36 5.7 Biological Treatment (Biologically Activated Filters)................................. 36 5.8 Conclusions .................................................................................................. 37 6.0 METHANOL TOXICOLOGY............................................................................... 38 6.1 Health Effects of Methanol ......................................................................... 38
6.1.1 Inhalation............................................................................................ 38 6.1.2 Ingestion ............................................................................................. 40 6.1.3 Dermal Exposure ................................................................................ 40
6.2 Aquatic Toxicity........................................................................................... 41 6.2.1 Toxicity of Methanol to Microbial Populations ................................ 42 7.0 FUTURE RESEARCH NEEDS ............................................................................. 43 8.0 CONCLUSIONS..................................................................................................... 45
8.1 Fate and Transport ......................................................................................... 45 8.2 Methanol Additives........................................................................................ 45 8.3 Remediation and Treatment.......................................................................... 46
8.4 Human and Aquatic Toxicity........................................................................ 46 9.0 ACKNOWLEDGEMENTS.................................................................................... 48 10.0 REFERENCES ........................................................................................................ 49
LIST OF TABLES Table No. Description Page
Technical Memorandum iii MALCOLM PIRNIE, INC.
1-1 Global Methanol Capacity and Demand............................................................ 3 1-2 A Summary of Physical and Chemical Properties of Methanol, Gasoline (BTEX), and Benzene......................................................................... 5 1-3 Estimated Releases of Methanol for the United States...................................... 6 1-4 Estimated Half-Lives of Methanol in the Environment..................................... 7 2-1 Effects of Methanol on Aqueous BTEX Solubility ........................................... 13 3-1 Selected Types of Aerobic and Anaerobic Respiration Involved In Microbial Metabolism of Organic Matter .......................................................................... 16 3-2 Comparative Rate Constants for Anaerobic and Aerobic Degradation............. 19 3-3 Comparative Values of Octanol-Water Coefficients and Bioconcentration Factors ................................................................................... 25 4-1 Select Chemical and Physical Properties of Potential Luminosity Additives ... 29 4-2 Select Chemical and Physical Properties of Bitterant Additives....................... 30 4-3 Select Chemical and Physical Properties of Colorant Additives....................... 31 6-1 Hazard Summary .............................................................................................. 38 6-2 Methanol Toxicity Exposure Limits. ................................................................. 39 6-3 Lethal Doses of Methanol in Rats and Rabbits.................................................. 40 6-4 Reported Median Lethal and Median Effective Concentrations for Methanol. 41 6-5 Biological Effects of Methanol on Various Microorganisms as Measured by the Toxicity Threshold from a cell Multiplication Inhibition Test............... 42
LIST OF FIGURES Figure No. Description Page 3-1 Methane Oxidation Pathway of Methanotrophic microorganisms. ................... 16
Technical Memorandum ES-1 MALCOLM PIRNIE, INC.
EXECUTIVE SUMMARY
The purpose of this report is to summarize the existing information regarding methanol—
its fate and transport in the environment and potential impacts, if any, on human health and the
environment. Pure methanol (M100) which is expected to be used in fuel cell vehicles is the
primary focus of this study, as opposed to the currently available gasoline-methanol fuel mixture
which consists of 15 percent gasoline and 85 percent methanol (M85). A thorough literature
review was conducted with over 100 documents reviewed as part of this study. Because neither
the Clean Air Act (CAA), Clean Water Act (CWA), nor the Safe Drinking Water Act (SDWA)
require methanol monitoring, a national database on occurrence of methanol in the environment
is not available for evaluation. Therefore, results from laboratory and field studies documented
in the literature and computer modeling were used to assess the fate and transport of methanol in
the environment. A more complete summary of the findings of this study is presented in the
following detailed report. This executive summary provides an overview of these findings.
BACKGROUND
Methanol has been a widely used industrial chemical since the 1800s. Methanol is
produced from steam reformed natural gas and carbon dioxide using a copper-based catalyst.
Current uses of methanol include use as a feed stock for a variety of widely used organic
chemicals, including formaldehyde, acetic acid, chloromethane, and methyl tert-butyl ether
(MTBE). It is also used as a solvent in paint strippers, paints, carburetor cleaners, plastics,
plywood, and automobile windshield washer solutions. Since 1965, methanol has been used in
the U.S. as a fuel in certain vehicles (e.g., race cars), either as M100 or M85. Flexible fuel
vehicles (FFVs)—vehicles capable of using either conventional gasoline, M85, or any
combination of the two fuels—were developed by Ford Motor Company in 1978. A program
funded by the California Energy Commission in conjunction with several oil companies
provided the initial refueling infrastructure. FFVs were produced primarily to reduce the U.S.
dependency on crude oil and for their ability to reduce carbon monoxide and ozone forming
emissions.
For a number of reasons, including an insufficient network of M85 fueling facilities,
methanol FFVs have not become widespread. Therefore, other clean burning vehicles will be
Technical Memorandum ES-2 MALCOLM PIRNIE, INC.
required to achieve even lower emission standards likely to be established in the future.
Recently, researchers have turned from alternatively-fueled internal combustion engines to fuel
cell technology. In 1994, Georgetown University introduced the first liquid-fueled fuel cell
vehicle which derived its energy by reacting hydrogen and oxygen in the fuel cell. In 1999, the
world’s largest automakers are all working to commercialize fuel cell vehicles. Due to the liquid
properties of methanol at room temperature, ambient pressure, the high hydrogen to carbon ratio,
and the relatively low combustion temperature, methanol is considered an ideal hydrogen carrier
for fuel cell vehicles. The continuing development of fuel cell vehicles is driven by the
projected low cost, environmental consumer benefits, and regulations in California, New York,
Massachusetts, and other areas which require 10 percent of the Model Year 2003 vehicles to be
Zero Emission Vehicles (ZEV) and by concerns over global warming. Consequently, there is a
significant economic incentive to develop and market fuel cell vehicles which are expected to
appear in large quantities worldwide by 2004.
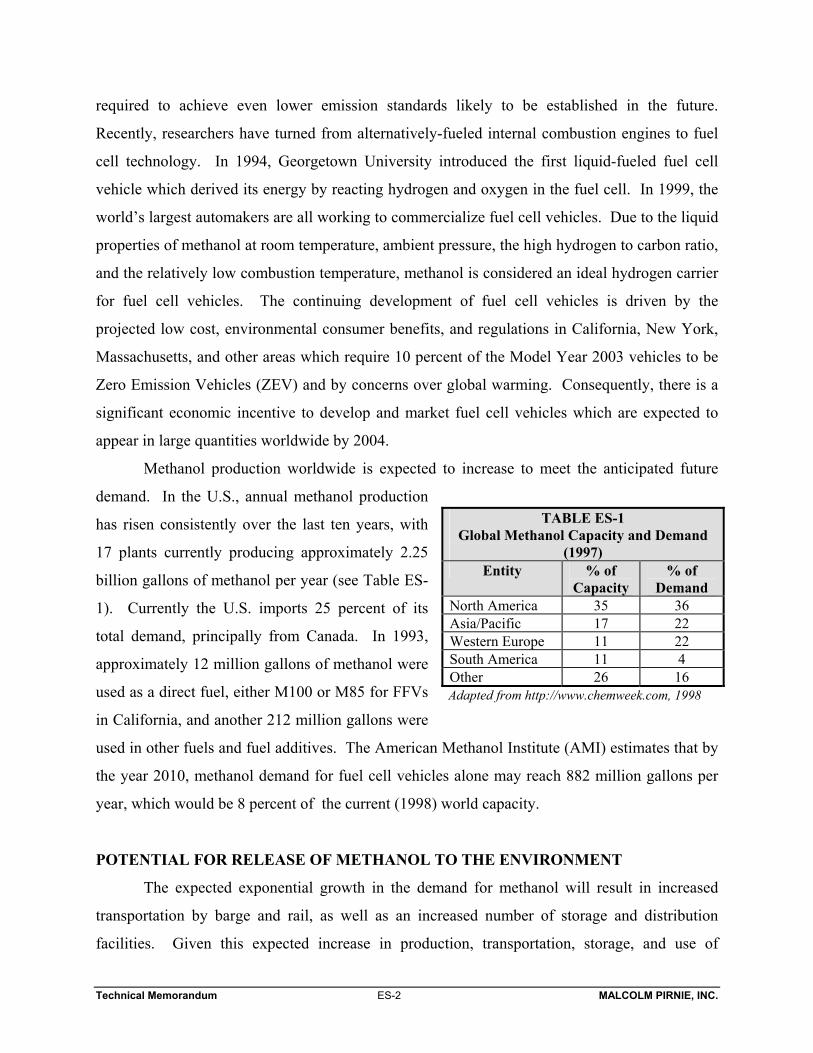
Methanol production worldwide is expected to increase to meet the anticipated future
demand. In the U.S., annual methanol production
has risen consistently over the last ten years, with
17 plants currently producing approximately 2.25
billion gallons of methanol per year (see Table ES-
1). Currently the U.S. imports 25 percent of its
total demand, principally from Canada. In 1993,
approximately 12 million gallons of methanol were
used as a direct fuel, either M100 or M85 for FFVs
in California, and another 212 million gallons were
used in other fuels and fuel additives. The American Methanol Institute (AMI) estimates that by
the year 2010, methanol demand for fuel cell vehicles alone may reach 882 million gallons per
year, which would be 8 percent of the current (1998) world capacity.
POTENTIAL FOR RELEASE OF METHANOL TO THE ENVIRONMENT
The expected exponential growth in the demand for methanol will result in increased
transportation by barge and rail, as well as an increased number of storage and distribution
facilities. Given this expected increase in production, transportation, storage, and use of
TABLE ES-1 Global Methanol Capacity and Demand
(1997) Entity % of
Capacity % of
Demand North America 35 36 Asia/Pacific 17 22 Western Europe 11 22 South America 11 4 Other 26 16 Adapted from http://www.chemweek.com, 1998
Technical Memorandum ES-3 MALCOLM PIRNIE, INC.
methanol, the potential for accidental releases to the environment will increase. In 1992,
methanol ranked third amongst all chemicals reportedly released by industry to the environment
as noted in annual Toxics Release Inventory (TRI) reports required by the U.S. Environmental
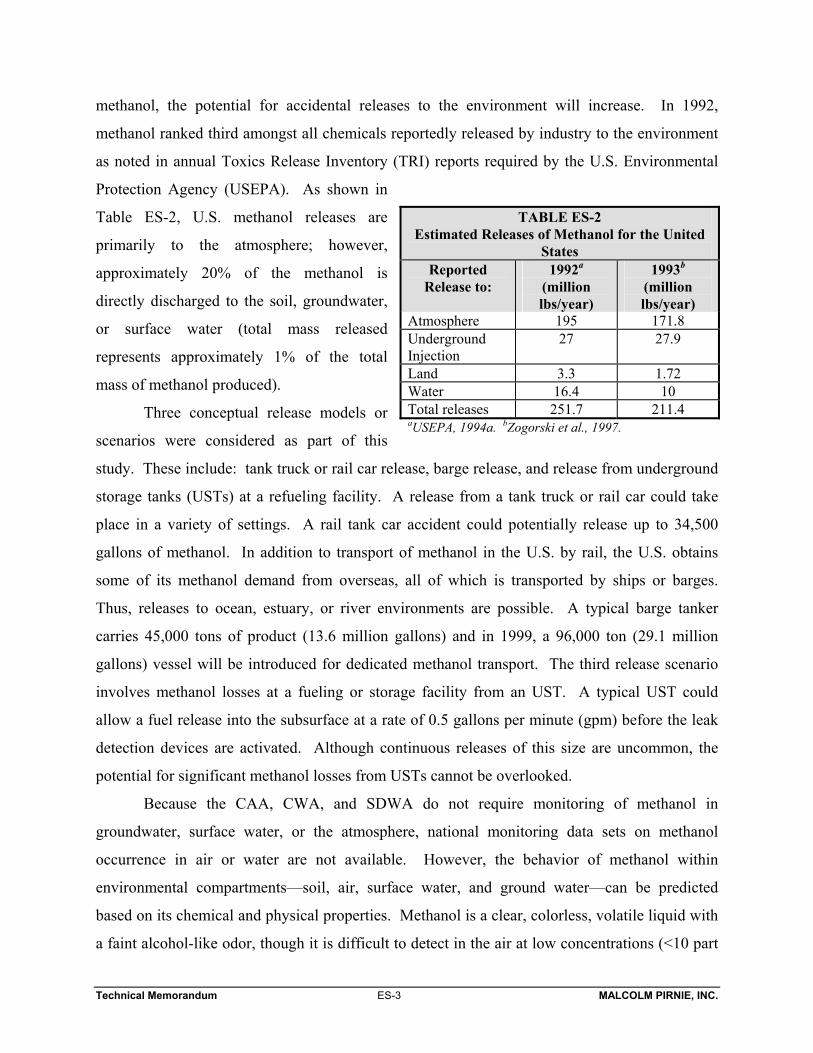
Protection Agency (USEPA). As shown in
Table ES-2, U.S. methanol releases are
primarily to the atmosphere; however,
approximately 20% of the methanol is
directly discharged to the soil, groundwater,
or surface water (total mass released
represents approximately 1% of the total
mass of methanol produced).
Three conceptual release models or
scenarios were considered as part of this
study. These include: tank truck or rail car release, barge release, and release from underground
storage tanks (USTs) at a refueling facility. A release from a tank truck or rail car could take
place in a variety of settings. A rail tank car accident could potentially release up to 34,500
gallons of methanol. In addition to transport of methanol in the U.S. by rail, the U.S. obtains
some of its methanol demand from overseas, all of which is transported by ships or barges.
Thus, releases to ocean, estuary, or river environments are possible. A typical barge tanker
carries 45,000 tons of product (13.6 million gallons) and in 1999, a 96,000 ton (29.1 million
gallons) vessel will be introduced for dedicated methanol transport. The third release scenario
involves methanol losses at a fueling or storage facility from an UST. A typical UST could
allow a fuel release into the subsurface at a rate of 0.5 gallons per minute (gpm) before the leak
detection devices are activated. Although continuous releases of this size are uncommon, the
potential for significant methanol losses from USTs cannot be overlooked.
Because the CAA, CWA, and SDWA do not require monitoring of methanol in
groundwater, surface water, or the atmosphere, national monitoring data sets on methanol
occurrence in air or water are not available. However, the behavior of methanol within
environmental compartments—soil, air, surface water, and ground water—can be predicted
based on its chemical and physical properties. Methanol is a clear, colorless, volatile liquid with
a faint alcohol-like odor, though it is difficult to detect in the air at low concentrations (<10 part
TABLE ES-2 Estimated Releases of Methanol for the United
States Reported
Release to: 1992a
(million lbs/year)
1993b (million lbs/year)
Atmosphere 195 171.8 Underground Injection
27 27.9
Land 3.3 1.72 Water 16.4 10 Total releases 251.7 211.4 aUSEPA, 1994a. bZogorski et al., 1997.
Technical Memorandum ES-4 MALCOLM PIRNIE, INC.
per million by volume (ppmv)). Methanol is the simplest alcohol, having only one carbon atom,
and is capable of being completely mixed in water. It easily dissolves in other alcohols and
chlorinated hydrocarbons, but has limited solubility in diesel fuel, vegetables oils, and aliphatic
hydrocarbons. The chemical and physical properties of methanol have been used to describe the
fate and transport of methanol in the environment in the event that an accidental release were to
occur.
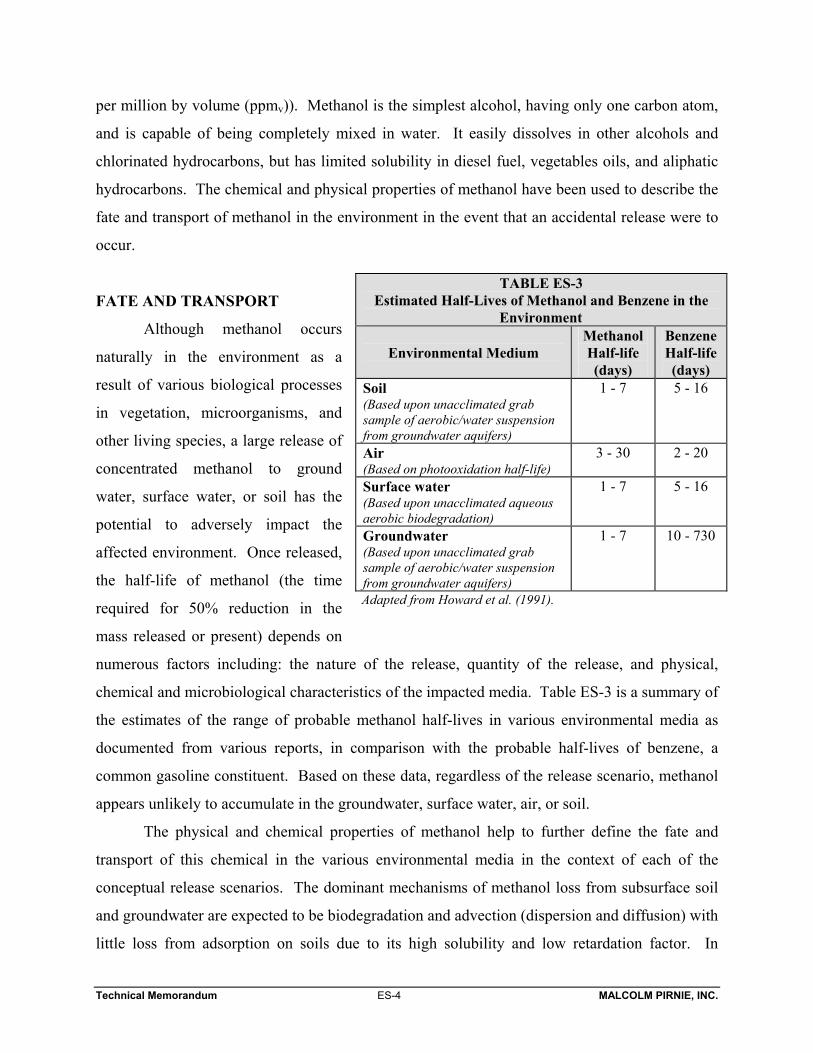
FATE AND TRANSPORT
Although methanol occurs
naturally in the environment as a
result of various biological processes
in vegetation, microorganisms, and
other living species, a large release of
concentrated methanol to ground
water, surface water, or soil has the
potential to adversely impact the
affected environment. Once released,
the half-life of methanol (the time
required for 50% reduction in the
mass released or present) depends on
numerous factors including: the nature of the release, quantity of the release, and physical,
chemical and microbiological characteristics of the impacted media. Table ES-3 is a summary of
the estimates of the range of probable methanol half-lives in various environmental media as
documented from various reports, in comparison with the probable half-lives of benzene, a
common gasoline constituent. Based on these data, regardless of the release scenario, methanol
appears unlikely to accumulate in the groundwater, surface water, air, or soil.
The physical and chemical properties of methanol help to further define the fate and
transport of this chemical in the various environmental media in the context of each of the
conceptual release scenarios. The dominant mechanisms of methanol loss from subsurface soil
and groundwater are expected to be biodegradation and advection (dispersion and diffusion) with
little loss from adsorption on soils due to its high solubility and low retardation factor. In
TABLE ES-3 Estimated Half-Lives of Methanol and Benzene in the
Environment
Environmental Medium Methanol Half-life (days)
Benzene Half-life (days)
Soil (Based upon unacclimated grab sample of aerobic/water suspension from groundwater aquifers)
1 - 7 5 - 16
Air (Based on photooxidation half-life)
3 - 30 2 - 20
Surface water (Based upon unacclimated aqueous aerobic biodegradation)
1 - 7 5 - 16
Groundwater (Based upon unacclimated grab sample of aerobic/water suspension from groundwater aquifers)
1 - 7 10 - 730
Adapted from Howard et al. (1991).
Technical Memorandum ES-5 MALCOLM PIRNIE, INC.
surface water, the infinite solubility of methanol will result in rapid wave-, wind-, and tide-
enhanced dilution to low concentrations (< 1%). Once concentrations have been diluted below
toxic levels the dominant mechanism of methanol loss is expected to be biodegradation.
Compared to other loss mechanisms identified, including volatilization and chemical
degradation, biodegradation is expected to be the dominant process controlling the fate of
methanol in the soil, groundwater, and surface water environments. In addition, the
biodegradation of methanol can occur under both aerobic (oxygen present) and anaerobic
(oxygen absent) conditions.
Therefore, following any of the three conceptual release scenarios presented, methanol is
not likely to persist in soil or water due to its rapid biodegradation. Methanol is miscible in
water and consequently will dissolve quickly and be diluted to low concentrations in the event of
a surface water spill. In groundwater, methanol concentrations are highly dependent on the
nature and the magnitude of the release, but will likely fall to low concentrations once complete
dissolution has occurred. In both surface and ground waters, methanol will likely be easily
biodegraded under a wide range of possible water quality conditions.
Relative to conventional gasoline and diesel fuel (and many of their constituent elements
such as benzene), methanol is a safer and more environmentally benign fuel. Thus, hazards
caused by gasoline releases will be more serious than those due to methanol releases, and these
hazards will persist longer in the environment.
TREATMENT
Following a release of methanol to the subsurface as a result of any of the three release
scenarios, remediation of soil and ground water may be required if natural biodegradation is not
sufficient to meet potential clean up standards in a reasonable time frame. Methanol will quickly
biodegrade and, therefore, natural attenuation is likely to be an effective and inexpensive
remediation strategy for both soil and water. If biodegradation is not sufficient to meet cleanup
objectives and an alternative remediation strategy is required, the high vapor pressure of
methanol suggests that soil vapor extraction will effectively remove any residual methanol from
the soil. Once extracted from the subsurface, the methanol vapors can be biodegraded using
appropriate technologies such as vapor phase biofilters.
It is unlikely that elevated levels of methanol will persist in either groundwater or surface
Technical Memorandum ES-6 MALCOLM PIRNIE, INC.
water due to the rapid rate of biodegradation. However, if drinking water sources experienced a
methanol release, treatment would likely be required before distribution to the public. Most
treatment technologies that remove gasoline components from water, including air stripping and
granular activated carbon, are not effective at removing methanol due to its low volatility and
high solubility. Reverse osmosis or nanofiltration are also ineffective at removing methanol
because of its small size and low molecular weight.
Advance oxidation processes such as ozonation with ultraviolet light are expected to be
effective, but the feasibility and cost of treatment is site specific. Biological treatment processes
are effective at removing methanol from drinking water, and are increasingly being accepted by
the drinking water community for drinking water applications. However, biological treatment in
drinking water applications is still not extensively used and, therefore, would require broader
regulatory acceptance. In conclusion, in the unlikely event that methanol contaminates source
waters, methanol can be removed in both a remediation and drinking water treatment context
using biological processes. However, the effectiveness, cost and public acceptance will be site
specific.
HUMAN AND AQUATIC TOXICITY
Methanol’s properties and toxicity are well understood. According to the extensive
literature reviewed for this study, methanol is neither mutagenic nor carcinogenic. Human
exposure to methanol can occur via the inhalation, ingestion, or dermal contact pathways.
Inhalation of methanol vapors can cause irritation of the mucus membranes, dizziness, nausea,
headaches, and blurred vision if exposure at high levels occurs. While inhalation is the most
common route of exposure to the body, ingestion represents the most serious acute health hazard
due to the much higher volume of methanol which can be ingested relative to the volume which
can be inhaled. The effects of ingestion follow the same pattern described for inhalation. With
respect to dermal contact, methanol readily absorbs into the dermal layer with repeated exposure
causing eczema, redness, and scaling. However, the current evidence shows that acute toxic
effects on humans and some animals from methanol only occur at high doses (> 10 mg/l). The
U.S. Department of Energy considers gasoline to be “overall” more hazardous to human health
than neat (i.e., pure) methanol.
Methanol is significantly less toxic to marine life than crude oil or gasoline, and many of
Technical Memorandum ES-7 MALCOLM PIRNIE, INC.
the effects of short term exposure are temporary and reversible. The Office of Pollution
Prevention and Toxics indicated that methanol is essentially non-toxic to the four aquatic fish
species that were tested. A large methanol spill into a surface water would have some immediate
impacts to the biota in the direct vicinity of the spill. However, because of its properties (i.e.,
methanol readily mixes with water and evaporates quickly in the atmosphere) methanol would
rapidly dissipate into the environment, and within fairly short distances from the spill would
reach levels where biodegradation would rapidly occur.
RECOMMENDED RESEARCH
The detailed report which follows this executive summary contains a comprehensive
evaluation of the fate and transport of methanol in the environment. As previously stated and
supported by this comprehensive evaluation, if methanol is released into the soil, groundwater or
surface water, it will rapidly biodegrade. However, there are several fate and transport issues
where available literature is incomplete and additional research is warranted to fill apparent data
and information gaps. Three areas of future research are recommended:
• Similar to other fuels, methanol may contain additives to address performance, pollution, or
health issues. If additives are required, a thorough evaluation of the fate and transport of
these additives is recommended.
• The literature reviewed for the comprehensive report suggests that methanol will rapidly
degrade once released into soil, groundwater, or surface water. However, if high
concentrations of methanol exist near the point of release, the concentration of methanol may
be toxic to microorganisms in the immediate area resulting in limited or no biodegradation.
An analysis of methanol releases that have occurred at methanol fueling areas, storage areas,
production locations, or during transport should be conducted to verify that methanol does
behave as predicted.
• The fate and transport of a methanol plume that becomes commingled with a gasoline plume
is briefly addressed in this report; however, there remain several uncertainties. The effect of
the presence of methanol on the fate and transport of conventional gasoline plumes needs to
Technical Memorandum ES-8 MALCOLM PIRNIE, INC.
be better understood, including an evaluation of methanol impacts on the solubility and
biodegradation rates of benzene and other gasoline constituents.
Technical Memorandum MALCOLM PIRNIE, INC. 1
1.0 BACKGROUND
1.1 Purpose and Scope of Report
One of the main industrial strategies for reducing carbon emissions to the atmosphere
from mobile sources is the development of near zero emissions vehicles, such as those powered
by fuel cells. Use of these vehicles is expected to increase dramatically over the next decade
and beyond. One promising technology for fuel cell powered vehicles is the use of methanol as
the fuel source.
As fuel cell powered vehicles proliferate, dramatic increases in worldwide use of
methanol are anticipated. Increased use of methanol as a fuel source will increase the potential
for releases of methanol to the environment during production, transport, storage, distribution
and consumption. As a consequence, questions regarding the potential impacts of unintentional
methanol releases to the environment, its subsequent transport and fate, and its possible impacts
on human health and the environment can be expected.
The purpose of this study, requested by the American Methanol Institute, is to summarize
existing knowledge on the fate and transport of methanol in the environment, and to identify
potential impacts, if any, on human health and the environment. This report will focus primarily
on fate and transport issues arising from the use of pure methanol as expected in fuel cell
vehicles, also known as M100, as opposed to the currently available gasoline-methanol fuel
mixture, which consists of 85 percent methanol and 15 percent gasoline (M85). Available
literature will be reviewed on: 1) fate and transport processes that can affect the distribution of
methanol in the environment; 2) fate and transport of methanol in the context of potential release
scenarios; 3) human and aquatic toxicity of methanol; and 4) treatment processes for removing
methanol from soil or water. In addition, available information will be reviewed on the
characteristics of additives that may be considered for use in methanol. Finally, data gaps will
be identified and research needs recommended as appropriate to reduce uncertainties regarding
the fate and transport of methanol.
1.2 Introduction and History of Use
Methanol is a widely used industrial chemical that has been in commercial use since the
1800’s. Methanol is produced from steam reformed natural gas and carbon dioxide using a
Technical Memorandum MALCOLM PIRNIE, INC. 2
copper-based catalyst. Current uses of methanol include a feed stock for formaldehyde, acetic
acid, chloromethane, and methyl tert-butyl ether (MTBE), and a solvent in paint strippers, paints,
carburetor cleaners, plastics, plywood, and car windshield washer fluids.
Since 1965, methanol has been used as a fuel in certain vehicles, either as a pure
compound (M100) or as a mixture of methanol and conventional gasoline, in an 85/15 mix,
(M85). For example, methanol has been used as a fuel source in Indy race cars for more than 30
years (CEC, 1998). In 1987, the first prototype flexible fuel vehicles (i.e., vehicles capable of
running on conventional gasoline, M85, or any combination of the two fuels) were developed by
Ford Motor Company (CEC, 1998). A program funded by the California Energy Commission in
conjunction with several oil companies provided the initial refueling infrastructure. Emerging
from this program, Ford built 2,500 Taurus FFVs (2,137 in California) in 1993 (CEC, 1998).
FFVs were primarily produced because they could decrease the nation’s dependency on crude
oil and because of their ability to reduce carbon monoxide and ozone forming emissions to levels
below those mandated by the Clean Air Act Amendments (CAAA) of 1990.
California currently leads the nation in the number of operating FFVs (light and heavy
duty): 10,000 light duty FFVs and 485 heavy duty FFVs as of 1994 (CEC, 1994) and
approximately 15,000 light duty FFVs in 1998. To facilitate these FFVs, California installed
over 110 public and private methanol fueling facilities; however, this network is not sufficient to
supply M85 conveniently to all individual consumers requiring fuel (http: www.energy.ca.gov/).
For this reason and others, methanol FFVs have not become widespread and are no longer being
produced; the advantages and disadvantages of FFVs have not been investigated in this report.
In recent years, researchers have turned from alternatively-fueled internal combustion
engines to fuel cell technology. Georgetown University introduced the first liquid-powered fuel
cell vehicle in 1994. A fuel cell combines hydrogen and oxygen electrochemically to form
water, electricity, and heat. The purpose of any fuel in a fuel cell vehicle is to serve as a source
of hydrogen. Due to the liquid properties of methanol at room temperature, and ambient
pressure, the high hydrogen to carbon ratio, and the relatively low combustion temperature,
methanol is considered an ideal hydrogen carrier for fuel cell vehicles (Nowell, 1998). The
continuing development of fuel cell vehicles by several auto manufacturers is driven by the
projected low cost of the vehicles and regulations in California, New York, Massachusetts, and
other states which require 10% of the Model Year 2003 vehicles to be Zero Emission Vehicles
Technical Memorandum MALCOLM PIRNIE, INC. 3
(ZEV). A ZEV is a vehicle which does not emit carbon monoxide, volatile organic compounds
(VOC), non-methane organic gases (NMOG), formaldehyde, nitrous oxides (NOx), or
particulate matter. Methanol-powered vehicles will only receive a partial emissions credit (i.e., a
0.7 credit where a ZEV credit of 1 implies no emissions) (CARB, 1998) because there are some
evaporative emissions associated with the use of methanol fuel falling in the category of NMOG;
however, running emissions of all chemicals except carbon dioxide and water vapor are
substantially reduced. Consequently, there is significant economic and environmental incentives
to develop and market fuel cell vehicles which are expected to appear in large quantities
worldwide by 2004 (Nowell, 1998).
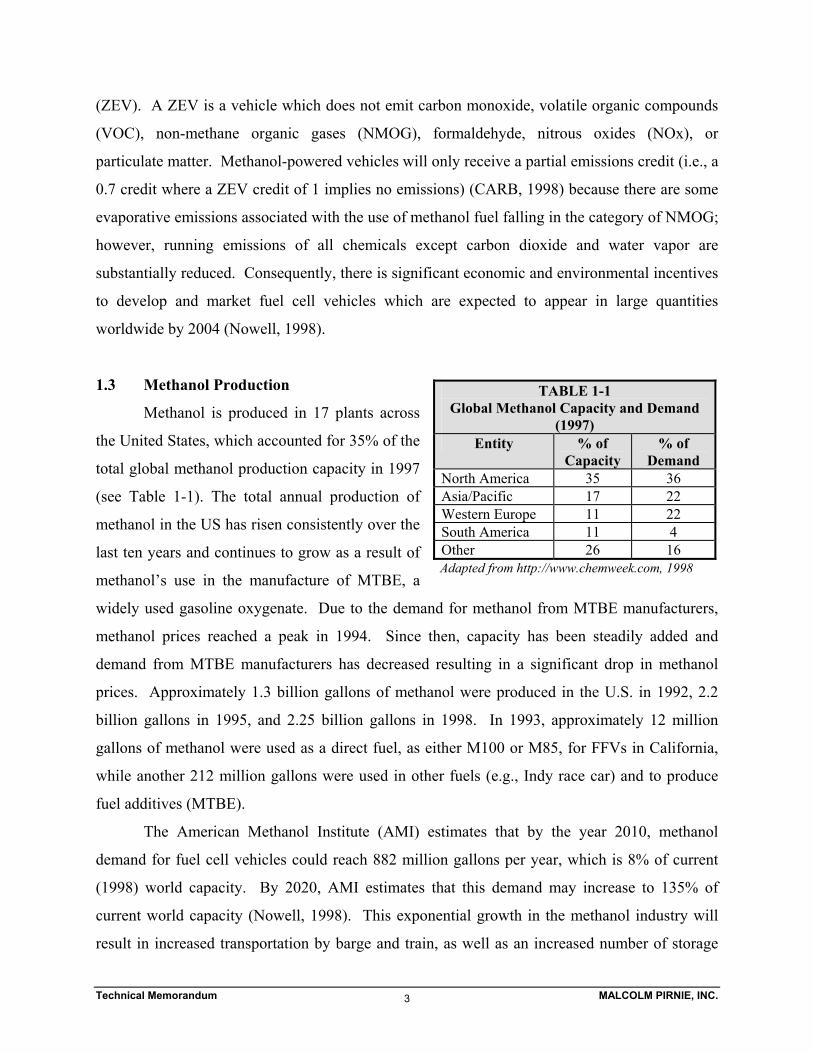
1.3 Methanol Production
Methanol is produced in 17 plants across
the United States, which accounted for 35% of the
total global methanol production capacity in 1997
(see Table 1-1). The total annual production of
methanol in the US has risen consistently over the
last ten years and continues to grow as a result of
methanol’s use in the manufacture of MTBE, a
widely used gasoline oxygenate. Due to the demand for methanol from MTBE manufacturers,
methanol prices reached a peak in 1994. Since then, capacity has been steadily added and
demand from MTBE manufacturers has decreased resulting in a significant drop in methanol
prices. Approximately 1.3 billion gallons of methanol were produced in the U.S. in 1992, 2.2
billion gallons in 1995, and 2.25 billion gallons in 1998. In 1993, approximately 12 million
gallons of methanol were used as a direct fuel, as either M100 or M85, for FFVs in California,
while another 212 million gallons were used in other fuels (e.g., Indy race car) and to produce
fuel additives (MTBE).
The American Methanol Institute (AMI) estimates that by the year 2010, methanol
demand for fuel cell vehicles could reach 882 million gallons per year, which is 8% of current
(1998) world capacity. By 2020, AMI estimates that this demand may increase to 135% of
current world capacity (Nowell, 1998). This exponential growth in the methanol industry will
result in increased transportation by barge and train, as well as an increased number of storage
TABLE 1-1 Global Methanol Capacity and Demand
(1997) Entity % of
Capacity % of
Demand North America 35 36 Asia/Pacific 17 22 Western Europe 11 22 South America 11 4 Other 26 16 Adapted from http://www.chemweek.com, 1998
Technical Memorandum MALCOLM PIRNIE, INC. 4
and distribution facilities.
1.4 Chemical and Physical Properties
The behavior of an organic chemical within environmental compartments—air,
groundwater, surface water, and soil—can be predicted by that compound’s chemical and
physical properties. Methanol is a clear, colorless, volatile liquid with a faint alcohol-like odor,
though it is difficult to detect at concentrations below 10 ppm. Methanol is the simplest of the
alcohols, having only one carbon atom, and is completely miscible in water. Methanol easily
dissolves in other alcohols and chlorinated hydrocarbons, but has limited solubility in diesel fuel,
vegetable oils, and aliphatic hydrocarbons (USDOE, 1991). The properties of methanol are
compared to the properties of conventional gasoline in Table 1-2. Benzene is included in the
Table as a representative gasoline constituent where the properties of gasoline are not available.
Many of these properties will be referred to throughout the text to describe the fate and transport
of methanol in the environment.
Technical Memorandum MALCOLM PIRNIE, INC. 5
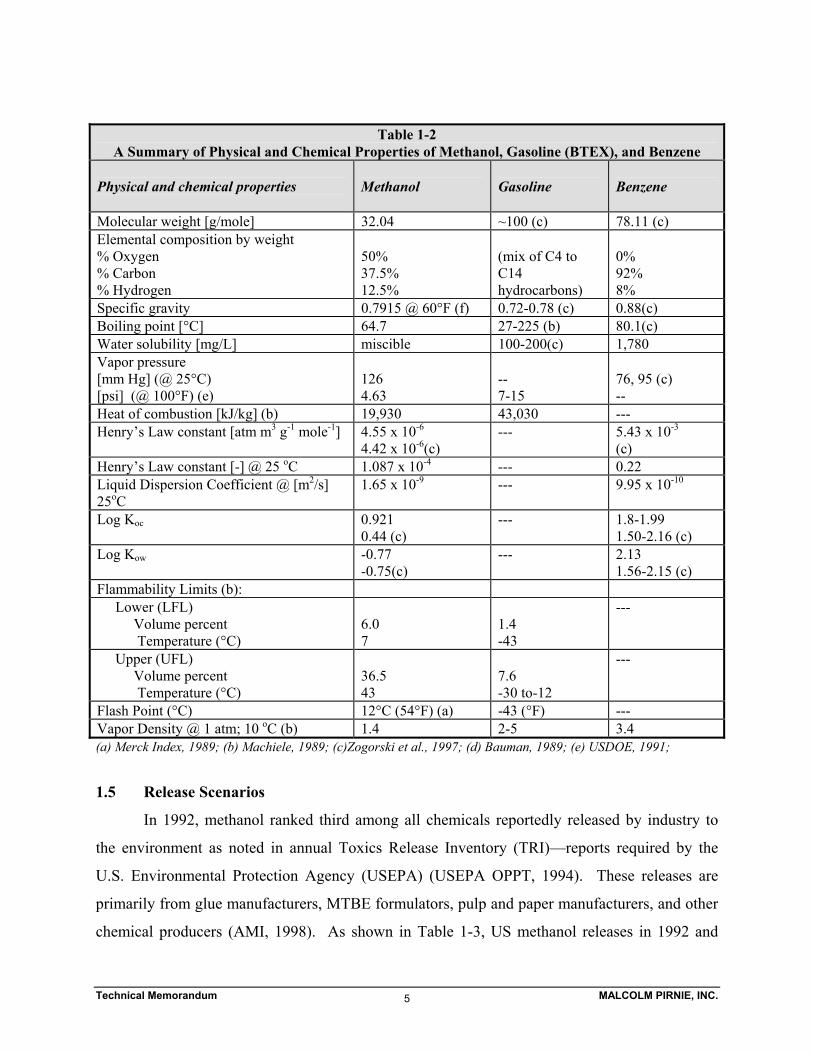
Table 1-2 A Summary of Physical and Chemical Properties of Methanol, Gasoline (BTEX), and Benzene
Physical and chemical properties
Methanol
Gasoline
Benzene
Molecular weight [g/mole] 32.04 ~100 (c) 78.11 (c) Elemental composition by weight % Oxygen % Carbon % Hydrogen
50% 37.5% 12.5%
(mix of C4 to C14 hydrocarbons)
0% 92% 8%
Specific gravity 0.7915 @ 60°F (f) 0.72-0.78 (c) 0.88(c) Boiling point [°C] 64.7 27-225 (b) 80.1(c) Water solubility [mg/L] miscible 100-200(c) 1,780 Vapor pressure [mm Hg] (@ 25°C) [psi] (@ 100°F) (e)
126 4.63
-- 7-15
76, 95 (c) --
Heat of combustion [kJ/kg] (b) 19,930 43,030 --- Henry’s Law constant [atm m3 g-1 mole-1] 4.55 x 10⁻⁶
4.42 x 10⁻⁶(c) --- 5.43 x 10⁻³
(c) Henry’s Law constant [-] @ 25 oC 1.087 x 10⁻⁴ --- 0.22 Liquid Dispersion Coefficient @ [m2/s] 25oC
1.65 x 10⁻⁹ --- 9.95 x 10⁻¹⁰
Log Koc 0.921 0.44 (c)
--- 1.8-1.99 1.50-2.16 (c)
Log Kow -0.77 -0.75(c)
--- 2.13 1.56-2.15 (c)
Flammability Limits (b): Lower (LFL) Volume percent Temperature (°C)
6.0 7
1.4 -43
---
Upper (UFL) Volume percent Temperature (°C)
36.5 43
7.6 -30 to-12
---
Flash Point (°C) 12°C (54°F) (a) -43 (°F) --- Vapor Density @ 1 atm; 10 oC (b) 1.4 2-5 3.4 (a) Merck Index, 1989; (b) Machiele, 1989; (c)Zogorski et al., 1997; (d) Bauman, 1989; (e) USDOE, 1991;
1.5 Release Scenarios
In 1992, methanol ranked third among all chemicals reportedly released by industry to
the environment as noted in annual Toxics Release Inventory (TRI)—reports required by the
U.S. Environmental Protection Agency (USEPA) (USEPA OPPT, 1994). These releases are
primarily from glue manufacturers, MTBE formulators, pulp and paper manufacturers, and other
chemical producers (AMI, 1998). As shown in Table 1-3, US methanol releases in 1992 and
Technical Memorandum MALCOLM PIRNIE, INC. 6
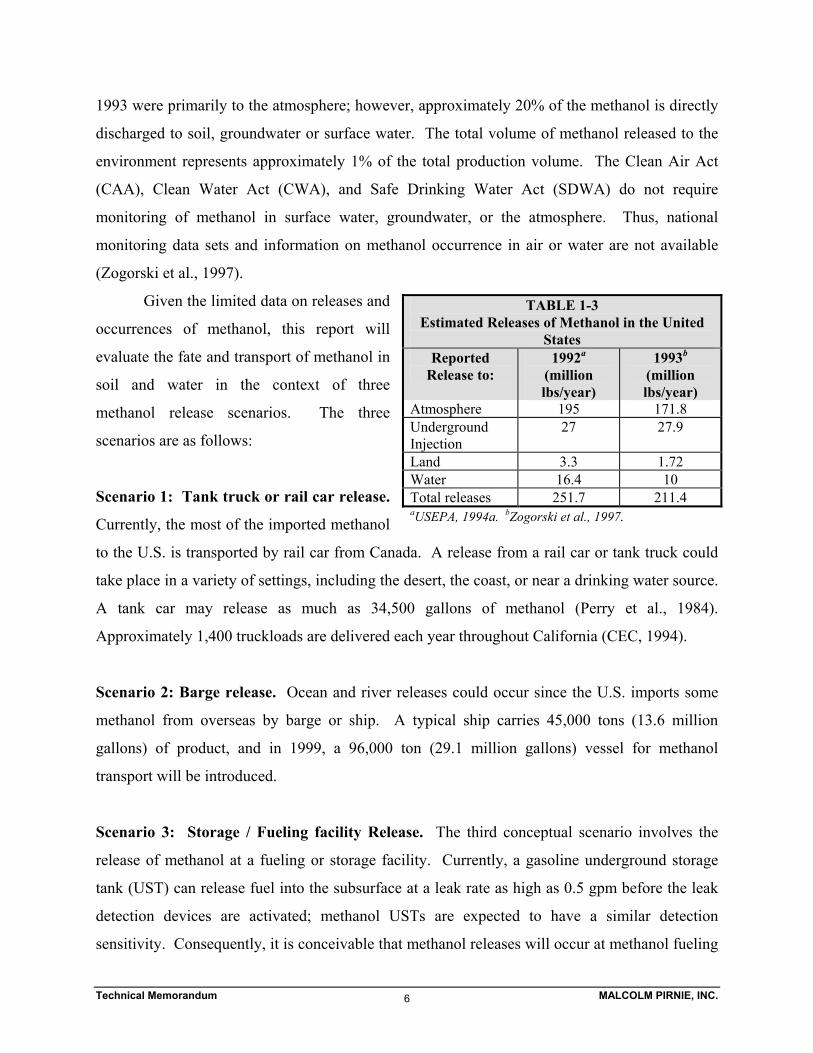
1993 were primarily to the atmosphere; however, approximately 20% of the methanol is directly
discharged to soil, groundwater or surface water. The total volume of methanol released to the
environment represents approximately 1% of the total production volume. The Clean Air Act
(CAA), Clean Water Act (CWA), and Safe Drinking Water Act (SDWA) do not require
monitoring of methanol in surface water, groundwater, or the atmosphere. Thus, national
monitoring data sets and information on methanol occurrence in air or water are not available
(Zogorski et al., 1997).
Given the limited data on releases and
occurrences of methanol, this report will
evaluate the fate and transport of methanol in
soil and water in the context of three
methanol release scenarios. The three
scenarios are as follows:
Scenario 1: Tank truck or rail car release.
Currently, the most of the imported methanol
to the U.S. is transported by rail car from Canada. A release from a rail car or tank truck could
take place in a variety of settings, including the desert, the coast, or near a drinking water source.
A tank car may release as much as 34,500 gallons of methanol (Perry et al., 1984).
Approximately 1,400 truckloads are delivered each year throughout California (CEC, 1994).
Scenario 2: Barge release. Ocean and river releases could occur since the U.S. imports some
methanol from overseas by barge or ship. A typical ship carries 45,000 tons (13.6 million
gallons) of product, and in 1999, a 96,000 ton (29.1 million gallons) vessel for methanol
transport will be introduced.
Scenario 3: Storage / Fueling facility Release. The third conceptual scenario involves the
release of methanol at a fueling or storage facility. Currently, a gasoline underground storage
tank (UST) can release fuel into the subsurface at a leak rate as high as 0.5 gpm before the leak
detection devices are activated; methanol USTs are expected to have a similar detection
sensitivity. Consequently, it is conceivable that methanol releases will occur at methanol fueling
TABLE 1-3 Estimated Releases of Methanol in the United
States Reported
Release to: 1992a
(million lbs/year)
1993b (million lbs/year)
Atmosphere 195 171.8 Underground Injection
27 27.9
Land 3.3 1.72 Water 16.4 10 Total releases 251.7 211.4 aUSEPA, 1994a. bZogorski et al., 1997.
Technical Memorandum MALCOLM PIRNIE, INC. 7
facilities at a rate similar to gasoline UST releases. If methanol USTs are located at a gasoline
dispensing location, subsurface methanol releases may encounter existing gasoline contaminant
plumes. The 1998 federal UST upgrade requirements will significantly reduce the number of
new releases; however, impacts of methanol releases on the fate of existing plumes needs to be
considered. This scenario represents an important potential route of methanol release to
groundwater.
1.6 Fate in the Environment
Methanol occurs naturally in the environment due to various biological processes in
vegetation, microorganisms, and other living species (ENVIRON, 1996). However, a large
release of methanol to the surface water, soil, or groundwater has the potential to adversely
impact the surrounding environment.
Once released into surface waters or the subsurface environment, the fate of methanol
depends on numerous environmental
factors including: the nature and
quantity of the release, and physical,
chemical and biological characteristics
of the impacted media. Various
reports summarize estimates of
possible methanol half-lives (the time
required for 50% reduction in
concentration) (see Table 1-4) in
various environmental media. In the
atmosphere, methanol will be photo-
oxidized relatively quickly; the half-
life ranges between 3 and 30 days. In
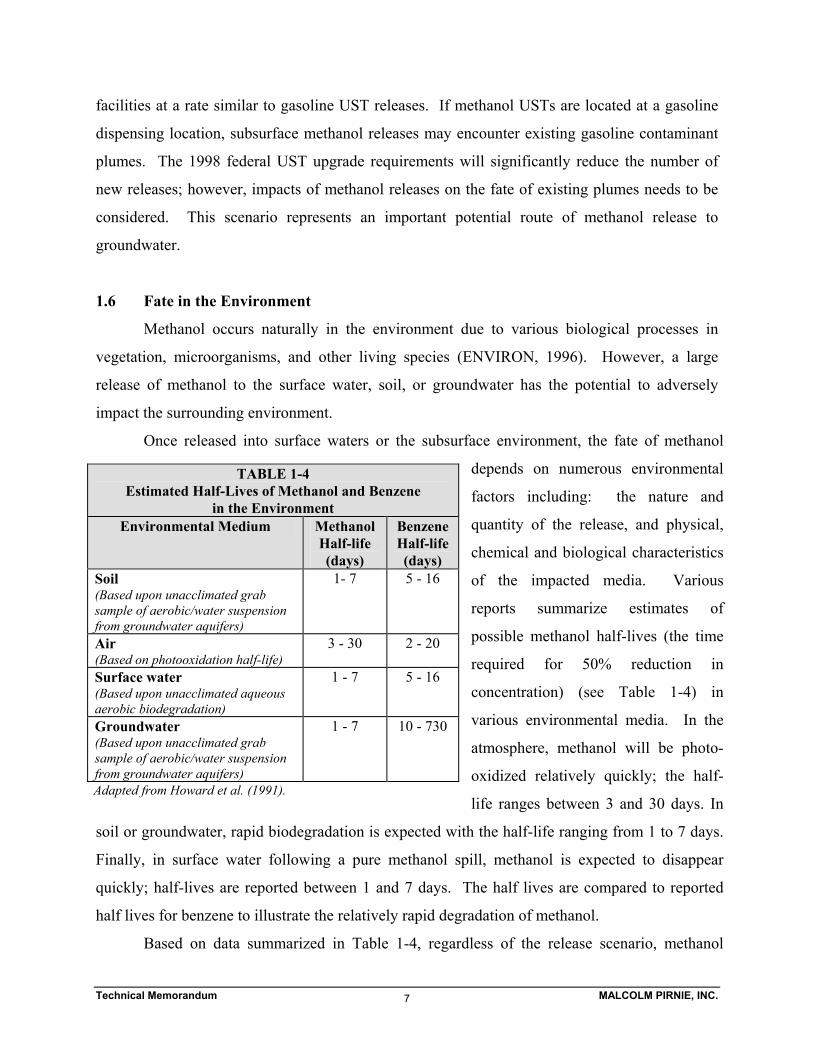
soil or groundwater, rapid biodegradation is expected with the half-life ranging from 1 to 7 days.
Finally, in surface water following a pure methanol spill, methanol is expected to disappear
quickly; half-lives are reported between 1 and 7 days. The half lives are compared to reported
half lives for benzene to illustrate the relatively rapid degradation of methanol.
Based on data summarized in Table 1-4, regardless of the release scenario, methanol
TABLE 1-4 Estimated Half-Lives of Methanol and Benzene
in the Environment Environmental Medium Methanol
Half-life (days)
BenzeneHalf-life (days)
Soil (Based upon unacclimated grab sample of aerobic/water suspension from groundwater aquifers)
1- 7 5 - 16
Air (Based on photooxidation half-life)
3 - 30 2 - 20
Surface water (Based upon unacclimated aqueous aerobic biodegradation)
1 - 7 5 - 16
Groundwater (Based upon unacclimated grab sample of aerobic/water suspension from groundwater aquifers)
1 - 7 10 - 730
Adapted from Howard et al. (1991).
Technical Memorandum MALCOLM PIRNIE, INC. 8
appears unlikely to accumulate in the soil, air, surface water, or groundwater. However, it is
unclear whether these reported rates were developed under realistic field conditions.
Consequently, these values represent generic order-of-magnitude half-lives and should be used
with caution for a site-specific assessment of the fate and transport of methanol. In Section 3,
these rates will be further evaluated as a function of specific hydrogeologic (subsurface), and
limnologic (lake) conditions.
Technical Memorandum MALCOLM PIRNIE, INC. 9
2.0 PARTITIONING OF METHANOL IN THE ENVIRONMENT
2.1 Methanol Partitioning Between Environmental Compartments
The purpose of this section is to describe the equilibrium partitioning of methanol
between air, water, and soil phases. Partitioning is directly related to the physiochemical
properties of methanol including solubility, vapor pressure and adsorptivity and the physical and
chemical characteristics of the environmental compartment.
When any chemical is released to an environment consisting of more than one medium
(e.g., air and water), the chemical will tend to distribute itself between these two phases, a process
that has been well described by the science of chemical thermodynamics (see e.g., Thibodeaux,
1996; Schwarzenbach et al., 1993). In an enclosed system, the concentrations of the chemical in
each phase can be predicted assuming that an equilibrium is achieved. In an open system, which
is undergoing dynamic changes, continual transfer between phases is likely. The rate of these
changes is important for predicting the fate and transport of the chemical of interest. For
purposes of this analysis, however, the simple equilibrium model provides a basis for assessing
the relative distribution of a compound such as methanol between environmental media.
2.2 Air/Water Partitioning
The air/water equilibrium partitioning behavior of methanol can be predicted using
Henry’s Law when methanol concentrations are less than 100,000 ppm (i.e., less than 10% by
weight). The Henry’s Law constant represents the ratio of a contaminant’s concentration in the
air to its concentration in the water at equilibrium. A compound with a dimensionless Henry’s
Law constant less than 0.05 will partition strongly from the gas phase into the water phase when
contaminated air is brought into contact with clean water (Zogorski et al., 1997). The value of
Henry’s Law constant for methanol given in Table 3-6 is 1.09 x 10⁻⁴ [-] at 25oC. Since this value
is quite low, atmospheric methanol will partition into water droplets. Conversely, methanol in
water bodies is likely to remain in the aqueous phase. Therefore, once in water, methanol will be
difficult to remove by volatilization.
Technical Memorandum MALCOLM PIRNIE, INC. 10
2.3 Soil/Water Partitioning
The soil/water partition coefficient, Kd, specifies the equilibrium ratio of a contaminant’s
concentration in/on the solid phase to that in the aqueous phase, thus, determining the
distribution of a chemical between soil and water. In addition, the Kd value can be used to
estimate the rate of movement of a chemical in groundwater compared to the rate of groundwater
flow. For non-ionic organic compounds such as methanol, Kd values are a function of the
organic carbon content of the soil (foc) and the organic carbon based partition coefficient (Koc
[L/kg]). It can be shown that Kd = Koc • foc (Schwarzenbach et al., 1993). Values of foc are site-
dependent and are typically low in most subsurface environments (on the order of 0.5% or foc =
0.005) (Zogorski et al., 1997). Koc values for methanol are low (~8) (Table 1-2) relative to
values of other gasoline oxygenates (~12 for MTBE) and aromatics (~100 for benzene).
Consequently, in a soil/water environment, methanol will be present primarily in the water
phase.
For the listed Koc values, it can be shown that retardation due to adsorption will be
negligible (Wood et al., 1990; Zogorski et al., 1997). The retardation factor for methanol and
other short-chain alcohols is usually one. Thus, dissolved methanol will migrate at the velocity
of groundwater except in soils with organic carbon fraction greater than 10 percent (i.e., for foc =
0.1 the Kd is approximately 0.8 signifying nearly equivalent concentrations of methanol adsorbed
on soil and dissolved in water). Consequently, methanol will generally travel through the
groundwater at rates significantly higher than constituents in gasoline, including benzene,
toluene, ethylbenzene, or xylenes (BTEX). However, due to rapid dissolution and
biodegradation, ultimate methanol plume lengths will likely be shorter than BTEX plumes.
2.4 Methanol Dissolution
The dissolution of methanol into groundwater involves dissolution from a pure methanol
pool (M100). Under this scenario, methanol is likely to leach quickly from the release area into
the groundwater. For gasoline releases, the aqueous concentrations of gasoline hydrocarbons
and ether oxygenates in contact with water can be estimated from the hydrocarbon’s solubility in
water multiplied by its mole fraction in the gasoline (maximum theoretical solubility of MTBE =
48,000 ppm x 11% by volume = 5,280 ppm) (Poulsen et al., 1992). However, because methanol
is completely miscible in water, this relation breaks down and the concentration must be
Technical Memorandum MALCOLM PIRNIE, INC. 11
estimated based on presumed mixing conditions using a fuel/groundwater mixing ratio and a
dilution factor.
Assuming that subsurface mixing ratios are between 10 and 100, the maximum range of
methanol concentrations would be 0.9% to 9.1% by volume (7,000 to 70,000 ppm by mass) for a
M100 release. However, these high concentrations will only occur in the immediate vicinity of
pure methanol releases. Much lower concentrations are anticipated further from the source due
to methanol plume dilution.
Alternatively, the concentration of methanol in the groundwater can be approximated by
taking the ratio of the release flow rate and the groundwater velocity and assuming a source area
width and vertical mixing ratio. For example, if methanol is released from an underground
storage tank at approximately 0.5 gpm, and groundwater is moving at 1 ft/day, the source area
width is 1 meter and the vertical mixing ratio is 10 to 100, the resulting methanol concentration
in the groundwater will be between 70 ppm and 700 ppm. These concentrations would be much
larger in the immediate vicinity of a catastrophic underground storage tank release (i.e., complete
tank failure) or barge release. However, in most cases, the infinite solubility of methanol will
cause methanol concentrations to rapidly decrease as a result of mixing, dispersion, and
diffusion.
Poulsen et al. (1992) evaluated the rate of dissolution of methanol from a M85 into water.
Poulsen et al. (1992) experimentally determined that approximately 99% of the methanol would
leach into the water phase in the time required for three volumes of water, each equal to the
initial gasoline volume, to move past the gasoline. They concluded that this would result in a
short discrete plume.
The rate of methanol dissolution into the subsurface following a release is similar to the
rate of ethanol dissolution because methanol and ethanol have similar properties. Heermann and
Powers (1997 & 1998) studied the partitioning behavior of ethanol and BTEX compounds from
an ethanol-blended gasoline. According to Heermann (1998), the aqueous concentration of
ethanol due to dissolution of ethanol-blended gasolines is dependent on the concentration of
ethanol in the gasoline and on mass transfer limitations in subsurface systems. Heermann
showed that when the concentration of ethanol was 10% (by volume) in a gasoline, greater than
99% of the ethanol partitioned into the water phase. Heermann did not quantify the time
required for dissolution but determined that it is limited by the rate of ethanol liquid molecular
Technical Memorandum MALCOLM PIRNIE, INC. 12
diffusion to the gasoline/groundwater boundary which may result in longer dissolution times (>
1 year).
In conclusion, pure methanol will quickly dissolve into the groundwater and disperse at a
rate directly proportional to the velocity of the local groundwater. All of the methanol present in
an M85 gasoline will likely be released into the groundwater, but the time for complete
dissolution is site specific. It is unlikely that either M85 or M100 will exhibit a slow dissolution
time (>1 year) because of the large quantities of methanol in contact with the water phase,
methanol’s infinite solubility in water, and methanol’s affinity for the water relative to soil, thus,
reducing the effects of diffusion-controlled dissolution. However, the time required for
dissolution is highly dependent on the source area shape and the types of soils in the subsurface.
Therefore, if methanol enters a low permeable soil horizon with minimal groundwater contact,
dissolution could proceed slowly.
2.5 Commingling/Cosolvency Effects
Cosolvency is a chemical-phenomenon whereby one chemical dissolved in water
increases the aqueous solubility of a second chemical. For example, BTEX compounds tend to
be more soluble in concentrated aqueous methanol solutions than in water alone. This
preferential solubility is referred to as the cosolubility effect. The possibility of enhanced
aqueous solubility of BTEX due to a neat or pure methanol plume that encounters existing
subsurface BTEX contamination is an issue for methanol releases from underground storage
tanks at existing gasoline stations (Scenario 3) (Donbaldson et al., 1993).
The majority of studies on the effects of methanol cosolvency have focused on increased
BTEX solubility within methanol/gasoline mixtures such as M85. Results show that M85
releases into the subsurface may produce high concentrations of aqueous methanol as well as
elevated aqueous BTEX concentrations near the front of the plume. However, the BTEX
distribution in the plume will change as a function of the aqueous/gasoline phase volume ratios
(Poulsen et al., 1992; Chen et al., 1997; Beck, 1991). In 1991, the American Petroleum Institute
published a study that evaluated the effect of methanol on the cosolubility of BTEX compounds
for M85 (Barker, et al., 1990). API concluded that for aqueous methanol concentrations below
8.5% (v/v) (i.e., about a 10-fold dilution factor), BTEX solubility was not increased. As the
concentration of methanol increased from 8% to 25%, the BTEX solubility increased linearly
Technical Memorandum MALCOLM PIRNIE, INC. 13
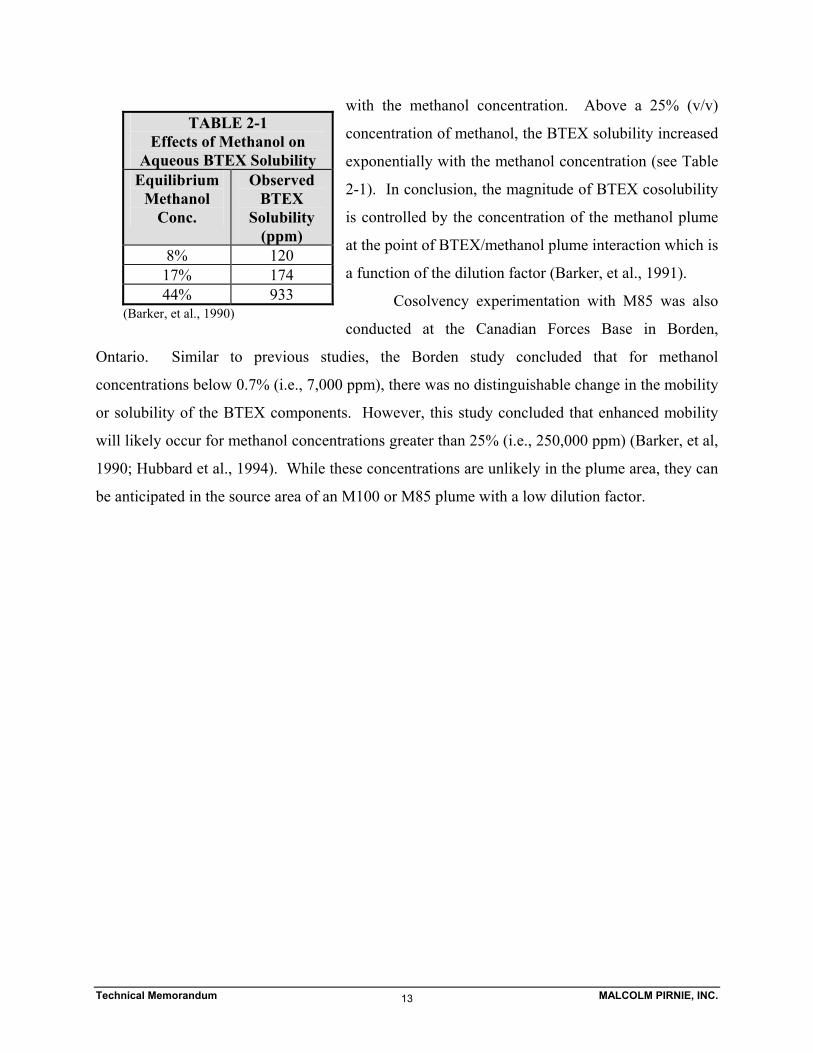
with the methanol concentration. Above a 25% (v/v)
concentration of methanol, the BTEX solubility increased
exponentially with the methanol concentration (see Table
2-1). In conclusion, the magnitude of BTEX cosolubility
is controlled by the concentration of the methanol plume
at the point of BTEX/methanol plume interaction which is
a function of the dilution factor (Barker, et al., 1991).
Cosolvency experimentation with M85 was also
conducted at the Canadian Forces Base in Borden,
Ontario. Similar to previous studies, the Borden study concluded that for methanol
concentrations below 0.7% (i.e., 7,000 ppm), there was no distinguishable change in the mobility
or solubility of the BTEX components. However, this study concluded that enhanced mobility
will likely occur for methanol concentrations greater than 25% (i.e., 250,000 ppm) (Barker, et al,
1990; Hubbard et al., 1994). While these concentrations are unlikely in the plume area, they can
be anticipated in the source area of an M100 or M85 plume with a low dilution factor.
TABLE 2-1 Effects of Methanol on
Aqueous BTEX Solubility Equilibrium
Methanol Conc.
Observed BTEX
Solubility (ppm)
8% 120 17% 174 44% 933
(Barker, et al., 1990)
Technical Memorandum MALCOLM PIRNIE, INC. 14
3.0 FATE AND TRANSPORT OF METHANOL IN THE ENVIRONMENT
The chemical and physical properties of methanol are described in Section 1 and Section 2
and summarized in Table 1-3. The following three subsections discuss the fate and transport of
methanol following a release, as presented in the three scenarios, namely: 1) tank truck or rail car
spill to soil and/or groundwater; 2) barge spill to surface water; and 3) underground storage tank
release to soil and groundwater. Each subsection further describes the sources of methanol into
the respective environmental compartment and the ensuing loss mechanisms from that
compartment.
3.1 Soil and/or Groundwater Release
Very few data sets are available on reported levels of methanol in aquatic systems and
subsurface environments in the United States. The apparent lack of monitoring for methanol,
particularly in aqueous systems, is likely a result of (1) the level of difficulty associated with
methanol analysis in the water phase, (2) its short half-life due to its high biodegradation
potential and (3) the lack of governmental monitoring requirements and control mandates for
groundwater, surface water and drinking water (Clean Water Act, Safe Drinking Water Act).
3.1.1 Sources of Methanol in Soil and Groundwater
There are several processes related to the use of methanol as a fuel which would be
directly responsible for methanol releases to soil and groundwater. The dominant sources are
those discussed in Scenarios 1 and 3—release from a tank truck or rail car and release from an
underground methanol storage tank. Precipitation may also serve as a transport mechanism
which introduces methanol into the subsurface by infiltration through the unsaturated zone.
Precipitation, however, has been shown to be a minor source of contaminant transport into the
soil and groundwater for other highly water-soluble chemicals, such as MTBE, (Zogorski et al.,
1997) and is therefore expected to be a minor contributing source of methanol into groundwater.
3.1.2 Losses of Methanol from Soil and Groundwater
Technical Memorandum MALCOLM PIRNIE, INC. 15
As a result of its high solubility, low retardation factor and ease of biodegradability, the
dominant mechanisms of methanol loss from subsurface soil and groundwater are expected to be
biodegradation and advection (i.e., transport from the source area by groundwater flow), with
little loss due to adsorption.
3.1.2.1 Biodegradation
In general, microorganisms have been shown to play a prominent role in
governing the fate of fuel hydrocarbons in subsurface aquatic and soil systems (NRC,
1993). When environmental conditions are amenable to microbial activity, aerobic
microbial populations oxidize organic contaminants and consume oxygen in the process.
Once the localized area has been depleted of the oxygen necessary for aerobic
respiration, anaerobic conditions develop and anaerobic biodegradation proceeds. While
it is well established in the scientific literature that methanol will biodegrade readily in
the subsurface under both aerobic and anaerobic conditions, three factors are required for
successful methanol biodegradation: the presence of indigenous methanol-degrading
microbial populations, the availability of electron acceptors and nutrients, and adequate
pH and temperature levels.
3.1.2.1.1 Presence of Indigenous Methanol-Degrading Microbes
Methanol is widely produced in nature by anaerobic microorganisms responsible
for complex aromatic hydrocarbon biodegradation (Heijthuijsen and Hansen, 1990;
Oremland et al., 1982). As a result, methanol molecules are ubiquitous in nature.
Furthermore, due to methanol’s high solubility in water, methanol molecules are
bioavailable to microorganisms which can utilize them as a source of carbon and energy.
A wide distribution of methanol-degraders in the environment can therefore be expected
(Brock and Madigan, 1991).
Systematics of methanol oxidation: Methylotrophs, organisms that can grow using only
one-carbon compounds such as methanol, are known to use both methane and methanol
as their sole carbon and energy source under both aerobic and microaerobic (low oxygen)
conditions (Brock and Madigan, 1991). Methylotrophs are of commercial interest in the
Technical Memorandum MALCOLM PIRNIE, INC. 16
bacterial metabolism of C1 compounds (Heijthuijsen and Hansen, 1990; Komagata,
1990). Consequently, a large number of methanol-utilizing bacteria have been isolated
from a wide variety of natural sources, and most of these isolates have been identified as
aerobic, Gram-negative bacteria (Komagata, 1990).
CH4 CH3OH HCHO HCOOH CO2
NADH + H+
NAD+
O2 H2O
MMO
PQQ PQQH2 NADH + H+
NAD+
H2O
NADH + H+
NAD+
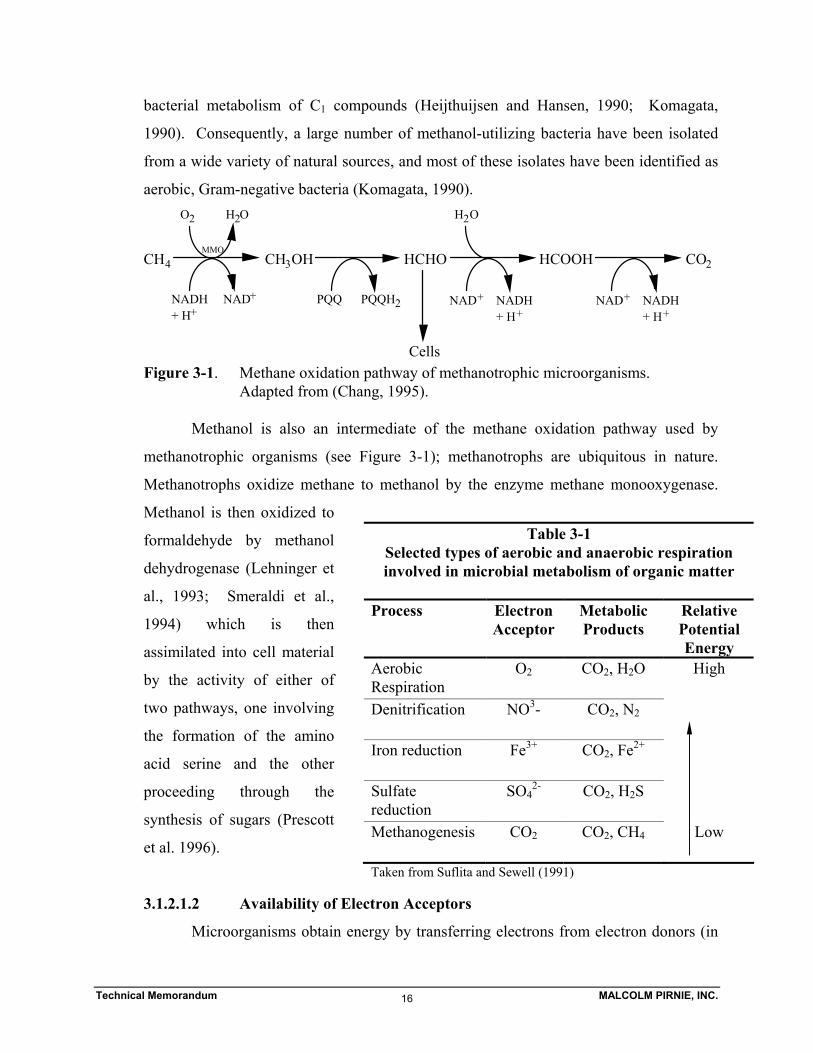
Cells Figure 3-1. Methane oxidation pathway of methanotrophic microorganisms. Adapted from (Chang, 1995). Methanol is also an intermediate of the methane oxidation pathway used by
methanotrophic organisms (see Figure 3-1); methanotrophs are ubiquitous in nature.
Methanotrophs oxidize methane to methanol by the enzyme methane monooxygenase.
Methanol is then oxidized to
formaldehyde by methanol
dehydrogenase (Lehninger et
al., 1993; Smeraldi et al.,
1994) which is then
assimilated into cell material
by the activity of either of
two pathways, one involving
the formation of the amino
acid serine and the other
proceeding through the
synthesis of sugars (Prescott
et al. 1996).
3.1.2.1.2 Availability of Electron Acceptors
Microorganisms obtain energy by transferring electrons from electron donors (in
Table 3-1 Selected types of aerobic and anaerobic respiration involved in microbial metabolism of organic matter
Process Electron
AcceptorMetabolic Products
Relative Potential Energy
Aerobic Respiration
O2 CO2, H2O High
Denitrification NO3- CO2, N2
Iron reduction Fe3+ CO2, Fe2+
Sulfate reduction
SO42- CO2, H2S
Methanogenesis CO2 CO2, CH4 Low
Taken from Suflita and Sewell (1991)
Technical Memorandum MALCOLM PIRNIE, INC. 17
this case, methanol) to electron acceptors. Electron acceptors are compounds that have a
lower oxidization state than electron donors and they include molecular oxygen, nitrate,
Fe(III), sulfate and carbon dioxide. The most energetically favored mechanism by which
microorganisms oxidize organic compounds is aerobic metabolism (i.e., the use of
oxygen as the electron acceptor) (see Table 3-1).
The presence of oxygen is a requirement for obligate aerobic microorganisms.
Facultative aerobic and anaerobic microorganisms are able to use other electron
acceptors when oxygen is not available. Oxygen is usually present in and around
groundwater recharge areas as a result of infiltrating rainwater. When oxygen is not
available, the following electron acceptors are preferentially utilized by microbes in the
order shown: nitrate > Fe(III) > sulfate > carbon dioxide (Brock and Madigan, 1991).
The redox potential (i.e., available electron acceptors) in subsurface environments is
highly site-dependent.
Methanol biodegradation has been shown to take place under both aerobic
(oxygen as the electron acceptor) and anaerobic (all electron acceptors besides oxygen)
conditions. The aerobic biodegradation of methanol is the most energetically favored
mechanism for methanol-degraders and leads to the mineralization of methanol.
Microbial growth on methanol with nitrate as the electron acceptor by
facultatively anaerobic nitrate-reducing bacteria is the second most energetically favored
mode of methanol metabolism (Metcalf and Eddy, Inc., 1979). There are over 100
wastewater treatment plants in the United States that currently use methanol as a carbon
source to remove nitrate (NO3-) from water by anaerobic denitrification. Other modes of
anaerobic biodegradation of methanol have been studied extensively, resulting in the
identification of at least 11 species of methanogenic bacteria that can grow on methanol
(Brock and Madigan, 1991).
Other types of anaerobic metabolism include acidogenesis (resulting in the
production of acetate or butyrate) (Florencio et al., 1995) and sulfidogenesis
(Heijthuijsen and Hansen, 1990). The ability of sulfate-reducing bacteria to oxidize
methanol was rarely reported in early studies (Esnault et al., 1988; Ward and Winfrey,
1985). However, in the past few years, evidence has accumulated which suggests that
sulfate-reducing bacteria are involved in anaerobic degradation of methanol in sediments,
Technical Memorandum MALCOLM PIRNIE, INC. 18
particularly in marine environments. Sulfidogenic methanol-utilizing microorganisms
have been shown to oxidize methanol by reducing sulfate to hydrogen sulfide
(Heijthuijsen and Hansen, 1990). Finally, some methanol-degrading strains have been
shown to utilize hydrogen (Heijthuijsen and Hansen, 1990).
3.1.2.1.3 Availability of Nutrients
Most microorganisms require life-sustaining growth factors such as nitrogen and
phosphorus for cell growth. In general, microbial growth in most sub-soils is not limited
by nitrogen and phosphorus as long as the contaminant concentrations are in the sub ppm
range (Tiedje, 1993). As stated previously, for M100 releases into the subsurface,
methanol concentrations will often exceed 1 ppm, resulting in potentially nutrient-limited
conditions. However, as methanol is advected away from the source area, concentrations
will decrease and microbial activity is not likely to be nutrient-limited.
3.1.2.1.4 Adequate pH and Temperature Levels
Most microorganisms grow best in a relatively narrow pH range around neutrality
(6 to 8) (LaGrega et al., 1994). The characteristic range of pH’s found in groundwater
systems (5 to 9) generally reflects the buffering capacity of the framework carbonate or
silicate minerals that make up groundwater aquifers (Chapelle, 1992; King et al., 1992).
This range of pH values in aquifers is unlikely to pose a significant problem for the
biodegradation of methanol by indigenous subsurface microorganisms since most of the
methanol-utilizing bacteria which have been isolated from natural sources have been
shown to grow in the neutral pH range (Komagata, 1990). Even if the pH of groundwater
were to deviate significantly from the neutral pH range, some strains of methanol-
utilizing microorganisms have been shown to prefer acidic pH values ranging from 2.0 to
5.5, while others have been shown to prefer alkaline pH values of 7.0 to 9.5 (Komagata,
1990).
The temperature of an environment is also an important factor for the growth and
activity of microorganisms. Metabolism of subsurface populations accelerates with
increased temperatures up to an optimum value at which growth is maximized. Most of
the bacteria present in subsurface environments operate most effectively between a
Technical Memorandum MALCOLM PIRNIE, INC. 19
temperature range of 20°C to 40°C. This is the range of many natural environments
(Chapelle, 1992) since subsurface temperatures within 100 meters of the surface are
typically within 2°C of the mean annual surface temperature. Temperature should
therefore not pose a significant problem for the biodegradation of methanol by
indigenous subsurface microorganisms even at temperatures as lows as 10oC.
3.1.2.1.5 Reports of Methanol Biodegradation Under Various Redox
Conditions
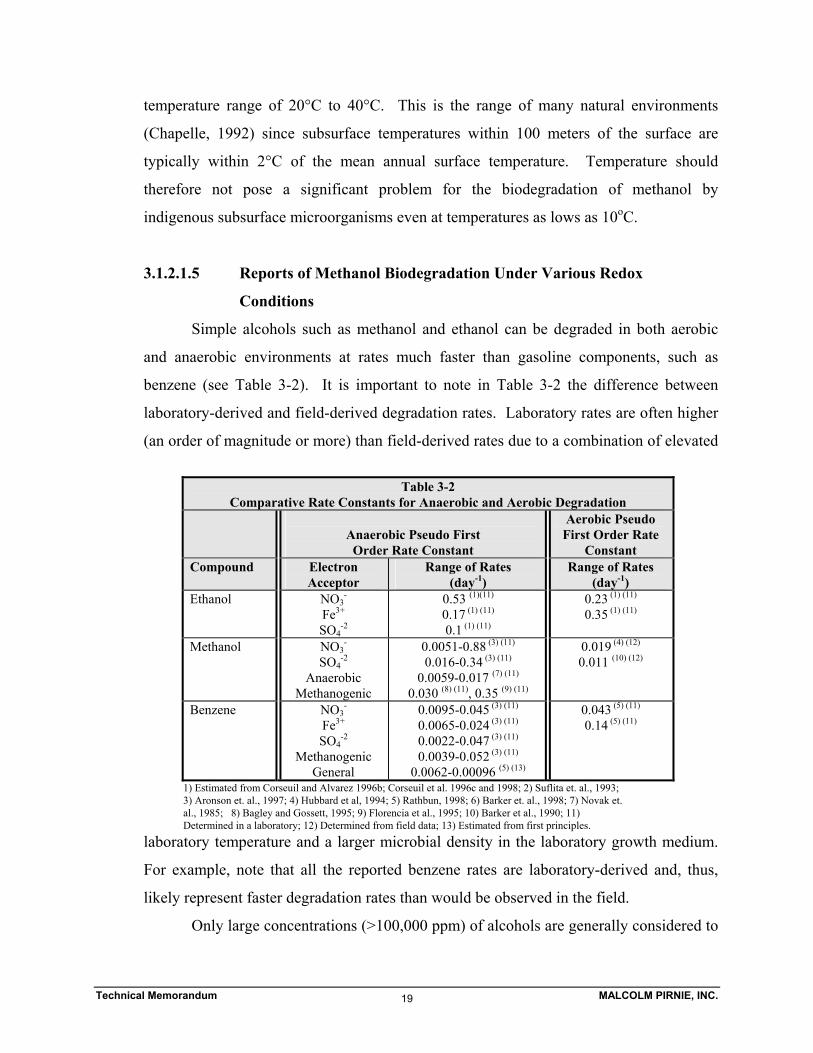
Simple alcohols such as methanol and ethanol can be degraded in both aerobic
and anaerobic environments at rates much faster than gasoline components, such as
benzene (see Table 3-2). It is important to note in Table 3-2 the difference between
laboratory-derived and field-derived degradation rates. Laboratory rates are often higher
(an order of magnitude or more) than field-derived rates due to a combination of elevated
laboratory temperature and a larger microbial density in the laboratory growth medium.
For example, note that all the reported benzene rates are laboratory-derived and, thus,
likely represent faster degradation rates than would be observed in the field.
Only large concentrations (>100,000 ppm) of alcohols are generally considered to
Table 3-2 Comparative Rate Constants for Anaerobic and Aerobic Degradation
Anaerobic Pseudo First Order Rate Constant
Aerobic Pseudo First Order Rate
Constant Compound Electron
Acceptor Range of Rates
(day-1) Range of Rates
(day-1) Ethanol NO3
- Fe3+ SO4
-2
0.53 (1)(11) 0.17 (1) (11) 0.1 (1) (11)
0.23 (1) (11) 0.35 (1) (11)
Methanol NO3-
SO4-2
Anaerobic Methanogenic
0.0051-0.88 (3) (11) 0.016-0.34 (3) (11)
0.0059-0.017 (7) (11)
0.030 (8) (11), 0.35 (9) (11)
0.019 (4) (12) 0.011 (10) (12)
Benzene NO3-
Fe3+ SO4
-2 Methanogenic
General
0.0095-0.045 (3) (11) 0.0065-0.024 (3) (11) 0.0022-0.047 (3) (11) 0.0039-0.052 (3) (11)
0.0062-0.00096 (5) (13)
0.043 (5) (11) 0.14 (5) (11)
1) Estimated from Corseuil and Alvarez 1996b; Corseuil et al. 1996c and 1998; 2) Suflita et. al., 1993; 3) Aronson et. al., 1997; 4) Hubbard et al, 1994; 5) Rathbun, 1998; 6) Barker et. al., 1998; 7) Novak et. al., 1985; 8) Bagley and Gossett, 1995; 9) Florencia et al., 1995; 10) Barker et al., 1990; 11) Determined in a laboratory; 12) Determined from field data; 13) Estimated from first principles.
Technical Memorandum MALCOLM PIRNIE, INC. 20
be toxic to most microorganisms and are therefore not biodegradable (Brusseau, 1993;
Hunt et al, 1997a,b). High concentrations of methanol may occur near pure methanol
spills and may inhibit microbial activity near the source; however, these concentrations
will become more dilute with time and with increasing distance from the source
(Katsumata and Kastenburg, 1996).
The biodegradation of methanol has been measured both in the field and in
laboratory studies. In an extensive field study at the CFB Borden site in Canada, the fate
and persistence of an M85 fuel was investigated in an aerobic shallow sandy aquifer
(Barker et al., 1990). The average concentration of methanol introduced into the aquifer
was 7030 ppm. By day 476 of the experiment, about 99% of the methanol was degraded
(see Table 3-2 for the effective first order degradation rate). Insufficient oxygen was
present in the plume to account for the removal of all the methanol; the researchers
therefore concluded that the methanol degraded first aerobically then anaerobically
(Hubbard et al., 1994).
In a laboratory study, methanol biodegradation was investigated in soils from
three different subsurface sites under various redox conditions (Novak et al., 1985). The
first site was aerobic and also had high nitrate levels; the second site was anoxic and had
low nitrate but high sulfate concentrations; and the third site was anoxic and had low
nitrate and sulfate levels. Rapid biodegradation took place in the microcosms at the first
site from both the saturated (4.19 to 4.55 ppm/day) and unsaturated zones (4.44 to 5.15
ppm/day) although the amount of methanol added was sufficient to create anaerobic
conditions. Rapid methanol biodegradation was also observed in the microcosms from
the saturated zone of the second site (1.33 to 3.18 ppm/day) and the third sites (1.0 to 2
ppm/day). This study concluded that methanol concentrations up to 1,000 ppm were
removed in less than a year at temperatures of 10 to 11°C and at pH range of 4.5 to 7.8.
Methanol was found to be readily biodegradable in all subsurface soils examined, with
biodegradation proceeding more rapidly in the saturated region. This research suggests
that methanol contamination in groundwater is unlikely to persist for lengthy periods of
time because of its susceptibility to biodegradation under both aerobic and anaerobic
conditions.
In another laboratory study, Suflita and Mormile (1993) measured acclimation
Technical Memorandum MALCOLM PIRNIE, INC. 21
periods (periods before degradation proceeded) and biodegradation rates of methanol and
various other alcohols and fuel oxygenates in anaerobic aquifer slurries at organic
concentrations of 50 ppm. These researchers reported a methanol acclimation period of 5
days, the shortest among the alcohols tested (the other alcohols being ethanol, 2-propanol
and tert-butanol), as well as an anaerobic methanol biodegradation rate of 7.4 ± 0.7
ppm/day. In a later study, these researchers investigated methanol biodegradation under
a range of redox conditions (Mormile et al., 1994). Under nitrate reducing conditions,
methanol was degraded with stoichiometric amounts of nitrate consumed. However,
under sulfate reducing conditions the researchers concluded that the sulfate reducing
bacteria were not utilizing the methanol. Generally speaking, high concentrations of
methanol are not used by sulfate-reducing bacteria to an ecologically significant extent.
However, sulfate reducers have been found to contribute to methanol depletion in other
studies, and at least four species of sulfate-reducing bacteria have been isolated that can
utilize methanol (Nanninga and Gottschal, 1986; Esnault et al., 1988).
Other laboratory studies have reported the biodegradation of methanol under
various redox conditions and by microorganisms from diverse environments. For
example, the methanogenic degradation of methanol was demonstrated for an enrichment
culture derived from an anaerobic digester as well as for a pure culture. The rates of
methanol degradation by the enrichment and pure cultures without acclimation periods
were reported to be 1.92 and 1.37 ppm/minute (extrapolated from Figures 2 and 6B,
respectively) (Bagley and Gossett, 1995). Fitch et al. (1996) also grew methanol-
utilizing cultures in a chemostat culture at methanol concentrations of 1500 to 2700 ppm
and found the cell yield of methanol-grown cells to be consistent with what has
previously been reported for methanotrophs. Florencio et al. (1993) investigated the
anaerobic biodegradation of methanol at a range of pH values by a culture derived from
an anaerobic granular sludge reactor used to treat alcohol distillery wastewater. Florencio
et al. (1995) monitored the anaerobic removal of methanol by methanogens and
acetogens in upflow anaerobic sludge blanket reactors. Results from these studies
showed that methylotrophic methanogens dominated in a broad pH range (4.2 to 7.2)
while significant acetogenesis occurred in the presence of high methanol concentrations.
Finally, Beeman and Suflita (1987) measured methanol biodegradation in microcosms
Technical Memorandum MALCOLM PIRNIE, INC. 22
from a shallow anoxic aquifer underlying a municipal landfill in Oklahoma. By
recovering 70 to 100% of the methane produced during methanogenesis, they were able
to demonstrate that methanogenesis of methanol was occurring.
3.1.2.2 Adsorption
Another methanol loss mechanism from the groundwater is adsorption to soil
materials. However, adsorption will not contribute significantly to the loss of methanol
from the environment due to the rapid rates of biodegradation in soil and groundwater
and vaporization from dry soils. Little adsorption is expected for compounds such as
methanol because of its polarity, low KD values, and miscibility as discussed previously.
3.1.2.3 Volatilization from Groundwater and Vaporization from Soil
Methanol’s high solubility and low Henry’s constant are expected to result in
minimal methanol losses from groundwater due to volatilization or off-gassing.
However, in the soil, methanol will vaporize from the residual phase or source area under
low soil moisture conditions (ENVIRON, 1996). Vaporization will occur much quicker
for M100 fuels than conventional gasoline due to the high vapor pressure of methanol.
This may result in migration of methanol away from the source area due to vapor phase,
diffusion driven transport. Despite the potential for lateral distribution of methanol in the
subsurface, analytical soil samples often do not contain detectable levels of methanol
near an M85 spill. This is likely due to the mass loss from vapor phase microbial
degradation of methanol (Beck, 1991).
3.2 Surface Water
3.2.1 Sources of Methanol in Surface Water
The potential dominant source of methanol in surface water is the direct release of neat
methanol into a surface water body following accidental release or catastrophic failure during
transport, such as is outlined in Scenario 2. Nonpoint sources of methanol include precipitation
from the atmosphere, which is not expected to be significant, as noted earlier.
Technical Memorandum MALCOLM PIRNIE, INC. 23
3.2.2 Losses of Methanol in Surface Water
The processes that contribute to methanol losses from surface water bodies include
biodegradation, abiotic degradation, volatilization and bioaccumulation. As with groundwater,
the dominant loss mechanism in surface waters is expected to be biodegradation. Methanol
concentrations in the vicinity of a surface water release will rapidly decrease due to advection,
dispersion, and diffusion. Due to methanol’s infinite solubility in water, an M100 release in
open water, as discussed in Scenario 2, will disperse to non-toxic levels (< 1%) at a rate much
faster than a parallel gasoline release. The rate of dispersion is directly proportional to the
amount of mixing in the aquatic environment. Tidal flows combined with wind-induced wave
action will cause a large methanol spill to rapidly disperse to levels below toxic thresholds. The
effect of wave action on the speed of contaminant mixing in surface waters has been measured
extensively for gasoline components following release from recreational vehicles (Malcolm
Pirnie, 1998). In all cases measured, gasoline components quickly mixed throughout the upper
layer of the surface water bodies; methanol is even more soluble in water than most gasoline
components and will, consequently, mix even more rapidly.
To verify these predictions, several computer simulations were done to model the
advective dispersion of methanol away from a source area (Machiele, 1989). The first
hypothetical simulation revealed that a 10,000 ton methanol release in the open sea would reach
a concentration of 0.36% within an hour of the spill. The second hypothetical simulation of a
spill at a rate of 10,000 liters/hr from a coastal pier exhibited a concentration of less than 1
percent at the spill site within 2 hours and to 0.13 percent within 3 hours after the spill ceased.
3.2.2.1 Biodegradation
The dominant process responsible for removal of methanol in surface water
bodies is biodegradation. The reported half-life of methanol in surface waters under
aerobic conditions is short and has been reported to be as low as 24 hours (see Table 3-2)
(Howard et al., 1991).
In flowing water bodies, wind- or current-enhanced mixing maintains dissolved
oxygen concentrations at a level sufficient to support aerobic microbial processes. Even
in oxygen-limited environments such as the bottom layers of stratified lakes, anaerobic
Technical Memorandum MALCOLM PIRNIE, INC. 24
biodegradation is expected to proceed at rapid rates; the reported half-life for methanol
biodegradation under anaerobic conditions ranges from 1 to 5 days (Howard et al., 1991).
Additionally, the nutrient supply in rivers and lakes is generally not expected to restrict
the rate of methanol metabolism because the required nutrient supplies are constantly
recharged by runoff (Alexander, 1994). However, high concentrations of methanol
resulting from a large spill in an enclosed area will deplete the surface water of oxygen
required to sustain aquatic life.
3.2.2.2 Abiotic Degradation
Abiotic degradation (i.e., non-biological or chemical) reactions are not likely to
contribute significantly to methanol removal from surface water bodies. Hydrolysis
reactions usually transform compounds into more polar products; methanol is a very
polar molecule and is stable in water. Photolysis involves the transformation of a
compound as a consequence of its direct absorption of light. Methanol does not adsorb
light in the visible spectrum and long wavelength UV. It does adsorb very short
wavelength UV, which is present in negligible amounts in solar radiation. In addition,
methanol can be naturally oxidized by hydroxyl radicals formed in the water by the
photolysis of nitrate, nitrite, and hydrogen peroxide resulting from reactions with excited
humic materials or from the reaction of H2O2 with Fe(II) (Schwarzenbach et al., 1993).
Thus, naturally occurring photooxidation of methanol via direct or indirect oxidation is
possible; however, these reactions are slow and, thus, not expected to be significant in
surface waters.
3.2.2.3 Bioaccumulation
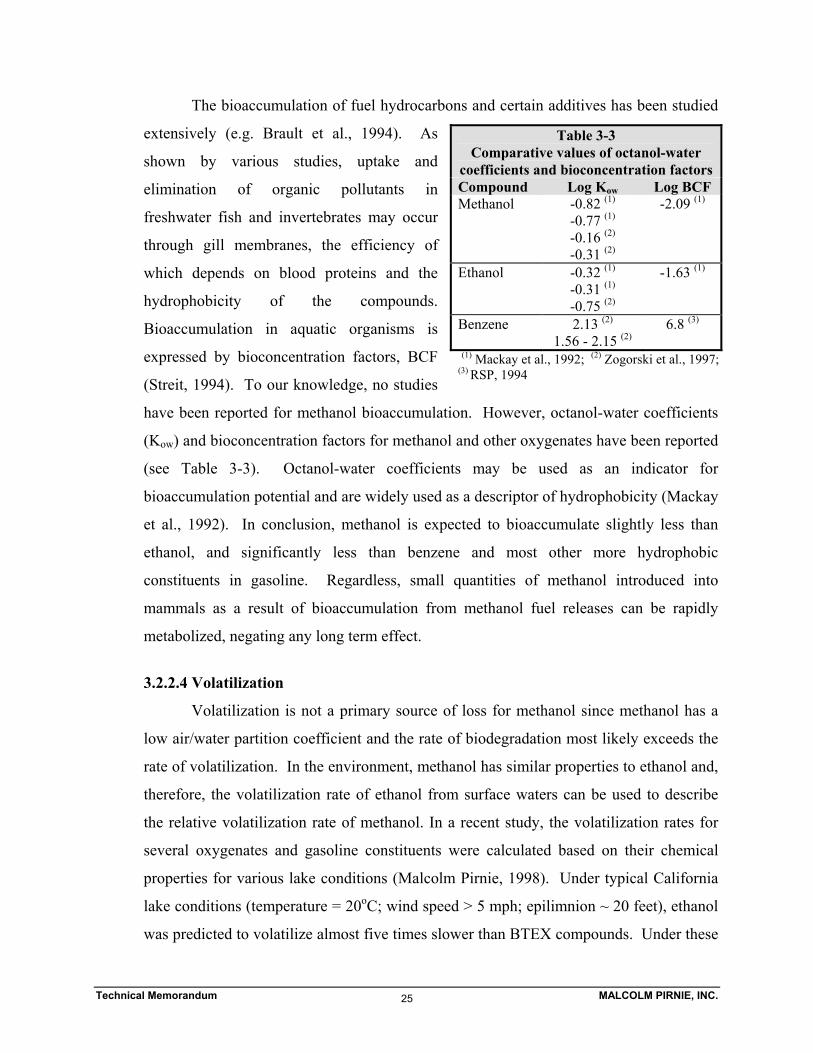
Technical Memorandum MALCOLM PIRNIE, INC. 25
The bioaccumulation of fuel hydrocarbons and certain additives has been studied
extensively (e.g. Brault et al., 1994). As
shown by various studies, uptake and
elimination of organic pollutants in
freshwater fish and invertebrates may occur
through gill membranes, the efficiency of
which depends on blood proteins and the
hydrophobicity of the compounds.
Bioaccumulation in aquatic organisms is
expressed by bioconcentration factors, BCF
(Streit, 1994). To our knowledge, no studies
have been reported for methanol bioaccumulation. However, octanol-water coefficients
(Kow) and bioconcentration factors for methanol and other oxygenates have been reported
(see Table 3-3). Octanol-water coefficients may be used as an indicator for
bioaccumulation potential and are widely used as a descriptor of hydrophobicity (Mackay
et al., 1992). In conclusion, methanol is expected to bioaccumulate slightly less than
ethanol, and significantly less than benzene and most other more hydrophobic
constituents in gasoline. Regardless, small quantities of methanol introduced into
mammals as a result of bioaccumulation from methanol fuel releases can be rapidly
metabolized, negating any long term effect.
3.2.2.4 Volatilization
Volatilization is not a primary source of loss for methanol since methanol has a
low air/water partition coefficient and the rate of biodegradation most likely exceeds the
rate of volatilization. In the environment, methanol has similar properties to ethanol and,
therefore, the volatilization rate of ethanol from surface waters can be used to describe
the relative volatilization rate of methanol. In a recent study, the volatilization rates for
several oxygenates and gasoline constituents were calculated based on their chemical
properties for various lake conditions (Malcolm Pirnie, 1998). Under typical California
lake conditions (temperature = 20oC; wind speed > 5 mph; epilimnion ~ 20 feet), ethanol
was predicted to volatilize almost five times slower than BTEX compounds. Under these
Table 3-3 Comparative values of octanol-water
coefficients and bioconcentration factors Compound Log Kow Log BCF Methanol -0.82 (1)
-0.77 (1)
-0.16 (2) -0.31 (2)
-2.09 (1)
Ethanol -0.32 (1) -0.31 (1)
-0.75 (2)
-1.63 (1)
Benzene 2.13 (2) 1.56 - 2.15 (2)
6.8 (3)
(1) Mackay et al., 1992; (2) Zogorski et al., 1997; (3) RSP, 1994
Technical Memorandum MALCOLM PIRNIE, INC. 26
conditions and ignoring biotic reactions, benzene has a half-life of approximately 9 days;
whereas, ethanol has a half-life of approximately 40 days. Using the model and the
conditions discussed above, methanol has a predicted half-life of approximately 60 days.
In another evaluation, the half-life of methanol in a river and a pond were modeled to be
approximately 4.8 days and 51.7 days, respectively; however, this model included other
transport mechanisms besides volatilization (USEPA OPPT, 1994). In conclusion,
despite the slow volatilization and minimal adsorption, methanol will not persist in
surface waters due to its intrinsic tendency to be degraded quickly.
3.3 Methanol / BTEX Commingled Plumes
BTEX compounds are the most toxic group of hydrocarbons in gasoline. Naturally
occurring biodegradation controls the persistence of these compounds in the subsurface
environment. High concentrations of alcohols and ether oxygenates can potentially impede the
biodegradation of BTEX (Salanitro, 1993). Alcohols will be biodegraded in preference to BTEX
and can therefore consume the oxygen required for BTEX biodegradation. Alcohols can also be
toxic or inhibitory to subsurface populations of BTEX-degraders at elevated concentrations
(Barker et al, 1990).
Information on the effect of methanol on the biodegradation of BTEX in the field is
available from the Borden site study in Canada. Three gasolines (M85, 15% MTBE, and base
gasoline) were allowed to migrate in an aquifer (Barker et al., 1990). By day 476 most of the
methanol was degraded, but BTEX compounds in the methanol plume were at higher relative
concentrations than in the MTBE and non-oxygenated plumes. These data suggest that methanol
may have slowed BTEX biodegradation rates compared to BTEX biodegradation in MTBE-
containing and oxygenate-free groundwater. Laboratory experiments found no significant
biodegradation of BTEX in the presence of 7000 ppm methanol but some BTEX biodegradation
was noted when the methanol concentration was only 1000 ppm. It was concluded that the
mechanism for greater BTEX persistence in the presence of methanol is the initial inhibition of
BTEX biodegradation by toxic methanol concentrations followed by inhibition due to the
removal of oxygen by preferred methanol biodegradation. Such results are particularly
important in assessing the fate of benzene, a known carcinogen (Dean, 1985) and the most
recalcitrant monoaromatic under anaerobic conditions.
Technical Memorandum MALCOLM PIRNIE, INC. 27
In another laboratory microcosm study, the biodegradation of BTEX was reportedly
impaired at 1.4% (14,000 ppm) methanol and was completely inhibited at higher methanol levels
(Novak et al., 1985). In conclusion, the biodegradation rate of BTEX compounds in a gasoline
plume that has become commingled with a methanol plume (Scenario 3) could be significantly
retarded in the presence of high methanol concentrations. This reduction in BTEX
biodegradation could effectively increase the length of BTEX plumes. A complete evaluation of
this effective plume elongation has not been completed for this evaluation, but is likely to be a
function of the distance between the methanol leaking UST (LUST) and the petroleum LUST
and the placement of the two USTs relative to groundwater movement.
3.4 Conclusions
Applying the hazard assessment guidelines from USEPA’s Office of Pollution Prevention
and Toxics, a recent study concluded that methanol is not persistent in the environment because
it readily degrades in air, soil and water, and has no persistent degradation intermediates
(ENVIRON, 1996). In the event of a catastrophic methanol spill, methanol will rapidly dilute to
low concentrations (< 1%) and subsequently quickly biodegrade. If clean-up measures are
implemented, they must be instituted at a much faster pace compared to petroleum spills in order
to capture the methanol plume prior to significant dilution. However, the relative speed of
methanol’s biodegradation is expected to result in natural cleanup times that are faster than the
active cleanup times for methanol or gasoline releases.
Technical Memorandum MALCOLM PIRNIE, INC. 28
4.0 METHANOL ADDITIVES
4.1 Purpose and Background of Additives
Methanol is a demonstrated alternative to gasoline and other fossil-based fuels; however,
most evaluations of potential environmental impacts due to releases of methanol have focused
primarily on fate of methanol and circumvented any potential ancillary impacts. Similar to other
fuels, methanol may require the use of additives to address performance, pollution, or health
issues.
Although it is currently unknown whether additives will be required for wide-spread use
of methanol fuel, several potential safety concerns regarding methanol use as a fuel source have
been identified based on its chemical and physical properties. Several investigations, conducted
in the eighties and early nineties, identified the known safety, health, and environmental issues
associated with methanol and developed a list of potential additives to address these concerns
(Machiele, 1989, 1990). Manufacturers are currently focusing their additive investigation and
testing efforts on luminosity (the ability to see a burning flame), taste (to prevent ingestion), and
color. Investigation efforts focus on evaluating the need for these additives, identifying the most
suitable compound, determining their impact on fuel cell efficiency, if any, and documenting
their effectiveness at addressing certain human health and safety issues. Therefore, it is useful to
evaluate the physical characteristics of the additives themselves and how these additives could
impact soil, air, or groundwater following a methanol fuel release.
4.2 Fate and Transport of Three Known Additives
This section provides a brief summary of the fate and transport of the leading candidate
compounds for additives and the potential environmental impacts of these compounds if released
into the environment.
4.2.1 Luminosity
Several types of compounds have been identified to increase the luminosity of methanol,
including: hydrocarbon mixtures, aromatics, aliphatics, olefins, other alcohols, ethers, metal
organic salts, and alcohol soluble organic dyes. In tests conducted by Southwest Research
Institute and California Air Resources Board (Fanick, 1990), toluene (>4% volume) and two
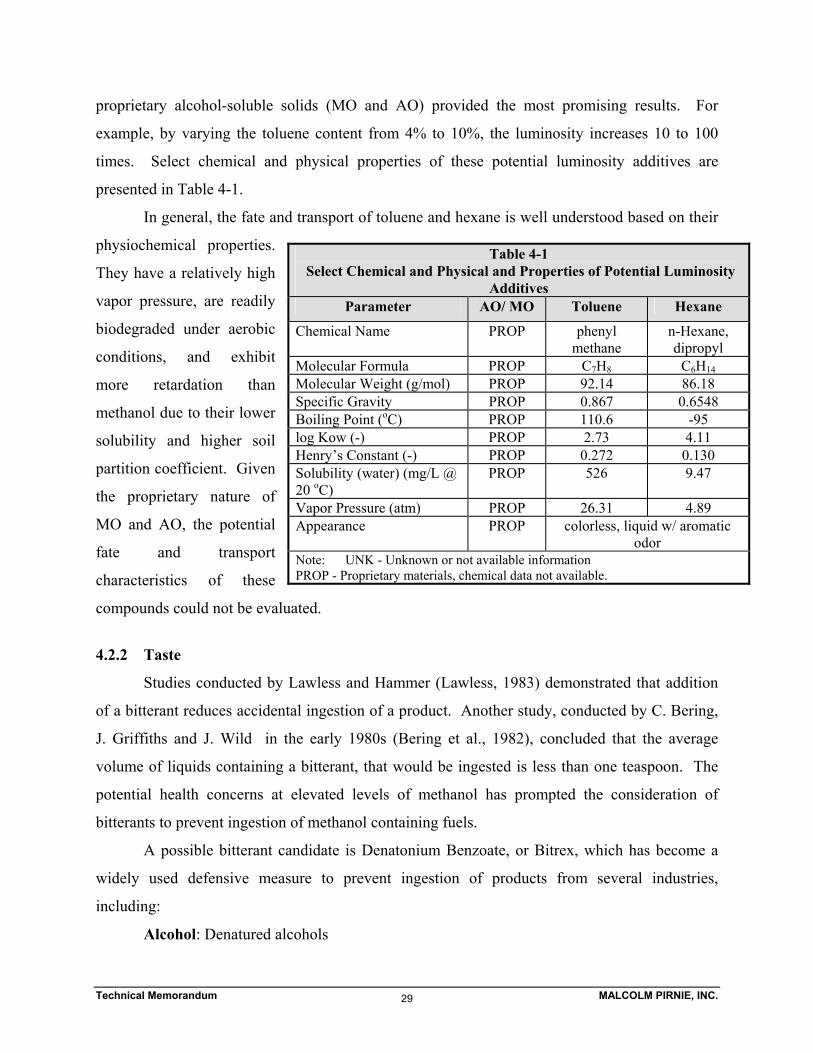
Technical Memorandum MALCOLM PIRNIE, INC. 29
proprietary alcohol-soluble solids (MO and AO) provided the most promising results. For
example, by varying the toluene content from 4% to 10%, the luminosity increases 10 to 100
times. Select chemical and physical properties of these potential luminosity additives are
presented in Table 4-1.
In general, the fate and transport of toluene and hexane is well understood based on their
physiochemical properties.
They have a relatively high
vapor pressure, are readily
biodegraded under aerobic
conditions, and exhibit
more retardation than
methanol due to their lower
solubility and higher soil
partition coefficient. Given
the proprietary nature of
MO and AO, the potential
fate and transport
characteristics of these
compounds could not be evaluated.
4.2.2 Taste
Studies conducted by Lawless and Hammer (Lawless, 1983) demonstrated that addition
of a bitterant reduces accidental ingestion of a product. Another study, conducted by C. Bering,
J. Griffiths and J. Wild in the early 1980s (Bering et al., 1982), concluded that the average
volume of liquids containing a bitterant, that would be ingested is less than one teaspoon. The
potential health concerns at elevated levels of methanol has prompted the consideration of
bitterants to prevent ingestion of methanol containing fuels.
A possible bitterant candidate is Denatonium Benzoate, or Bitrex, which has become a
widely used defensive measure to prevent ingestion of products from several industries,
including:
Alcohol: Denatured alcohols
Table 4-1 Select Chemical and Physical and Properties of Potential Luminosity
Additives Parameter AO/ MO Toluene Hexane
Chemical Name PROP phenyl methane
n-Hexane, dipropyl
Molecular Formula PROP C7H8 C6H14 Molecular Weight (g/mol) PROP 92.14 86.18 Specific Gravity PROP 0.867 0.6548 Boiling Point (oC) PROP 110.6 -95 log Kow (-) PROP 2.73 4.11 Henry’s Constant (-) PROP 0.272 0.130 Solubility (water) (mg/L @ 20 oC)
PROP 526 9.47
Vapor Pressure (atm) PROP 26.31 4.89 Appearance PROP colorless, liquid w/ aromatic
odor Note: UNK - Unknown or not available information PROP - Proprietary materials, chemical data not available.
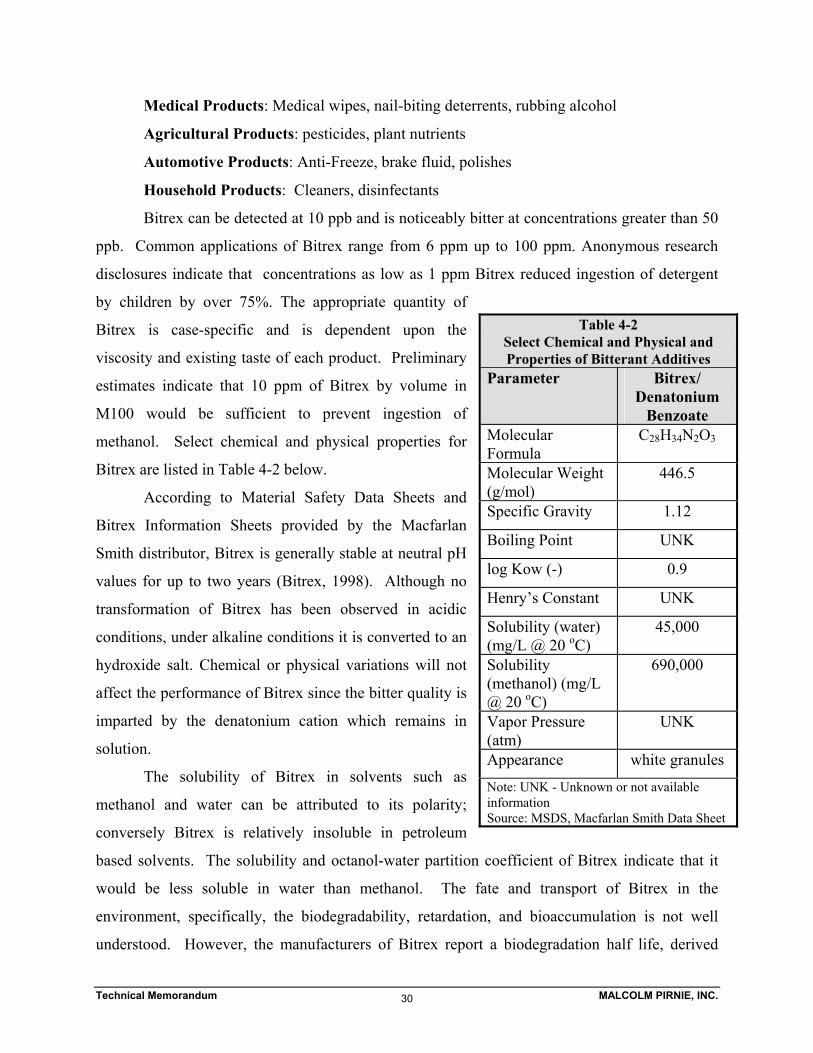
Technical Memorandum MALCOLM PIRNIE, INC. 30
Medical Products: Medical wipes, nail-biting deterrents, rubbing alcohol
Agricultural Products: pesticides, plant nutrients
Automotive Products: Anti-Freeze, brake fluid, polishes
Household Products: Cleaners, disinfectants
Bitrex can be detected at 10 ppb and is noticeably bitter at concentrations greater than 50
ppb. Common applications of Bitrex range from 6 ppm up to 100 ppm. Anonymous research
disclosures indicate that concentrations as low as 1 ppm Bitrex reduced ingestion of detergent
by children by over 75%. The appropriate quantity of
Bitrex is case-specific and is dependent upon the
viscosity and existing taste of each product. Preliminary
estimates indicate that 10 ppm of Bitrex by volume in
M100 would be sufficient to prevent ingestion of
methanol. Select chemical and physical properties for
Bitrex are listed in Table 4-2 below.
According to Material Safety Data Sheets and
Bitrex Information Sheets provided by the Macfarlan
Smith distributor, Bitrex is generally stable at neutral pH
values for up to two years (Bitrex, 1998). Although no
transformation of Bitrex has been observed in acidic
conditions, under alkaline conditions it is converted to an
hydroxide salt. Chemical or physical variations will not
affect the performance of Bitrex since the bitter quality is
imparted by the denatonium cation which remains in
solution.
The solubility of Bitrex in solvents such as
methanol and water can be attributed to its polarity;
conversely Bitrex is relatively insoluble in petroleum
based solvents. The solubility and octanol-water partition coefficient of Bitrex indicate that it
would be less soluble in water than methanol. The fate and transport of Bitrex in the
environment, specifically, the biodegradability, retardation, and bioaccumulation is not well
understood. However, the manufacturers of Bitrex report a biodegradation half life, derived
Table 4-2 Select Chemical and Physical and Properties of Bitterant Additives
Parameter Bitrex/ Denatonium
Benzoate Molecular Formula
C28H34N2O3
Molecular Weight (g/mol)
446.5
Specific Gravity 1.12
Boiling Point UNK
log Kow (-) 0.9
Henry’s Constant UNK
Solubility (water) (mg/L @ 20 oC)
45,000
Solubility (methanol) (mg/L @ 20 oC)
690,000
Vapor Pressure (atm)
UNK
Appearance white granules
Note: UNK - Unknown or not available information Source: MSDS, Macfarlan Smith Data Sheet
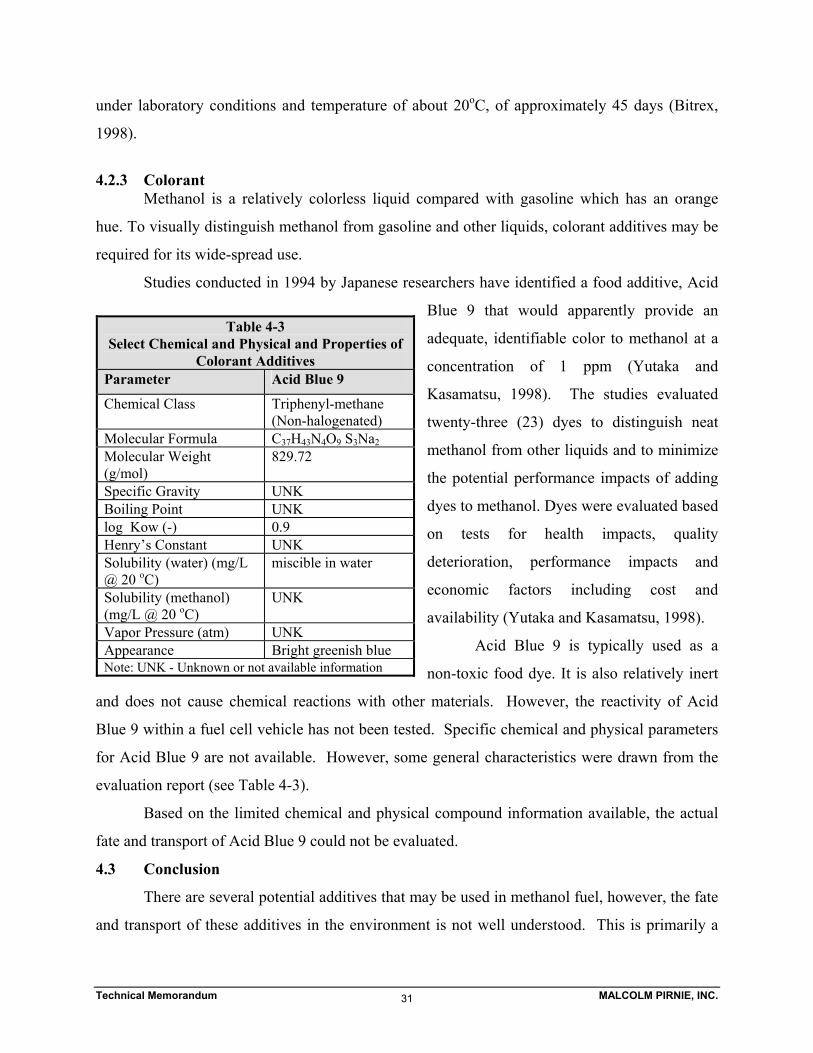
Technical Memorandum MALCOLM PIRNIE, INC. 31
under laboratory conditions and temperature of about 20oC, of approximately 45 days (Bitrex,
1998).
4.2.3 Colorant
Methanol is a relatively colorless liquid compared with gasoline which has an orange
hue. To visually distinguish methanol from gasoline and other liquids, colorant additives may be
required for its wide-spread use.
Studies conducted in 1994 by Japanese researchers have identified a food additive, Acid
Blue 9 that would apparently provide an
adequate, identifiable color to methanol at a
concentration of 1 ppm (Yutaka and
Kasamatsu, 1998). The studies evaluated
twenty-three (23) dyes to distinguish neat
methanol from other liquids and to minimize
the potential performance impacts of adding
dyes to methanol. Dyes were evaluated based
on tests for health impacts, quality
deterioration, performance impacts and
economic factors including cost and
availability (Yutaka and Kasamatsu, 1998).
Acid Blue 9 is typically used as a
non-toxic food dye. It is also relatively inert
and does not cause chemical reactions with other materials. However, the reactivity of Acid
Blue 9 within a fuel cell vehicle has not been tested. Specific chemical and physical parameters
for Acid Blue 9 are not available. However, some general characteristics were drawn from the
evaluation report (see Table 4-3).
Based on the limited chemical and physical compound information available, the actual
fate and transport of Acid Blue 9 could not be evaluated.
4.3 Conclusion
There are several potential additives that may be used in methanol fuel, however, the fate
and transport of these additives in the environment is not well understood. This is primarily a
Table 4-3 Select Chemical and Physical and Properties of
Colorant Additives Parameter Acid Blue 9
Chemical Class Triphenyl-methane (Non-halogenated)
Molecular Formula C37H43N4O9 S3Na2 Molecular Weight (g/mol)
829.72
Specific Gravity UNK Boiling Point UNK log Kow (-) 0.9 Henry’s Constant UNK Solubility (water) (mg/L @ 20 oC)
miscible in water
Solubility (methanol) (mg/L @ 20 oC)
UNK
Vapor Pressure (atm) UNK Appearance Bright greenish blue Note: UNK - Unknown or not available information
Technical Memorandum MALCOLM PIRNIE, INC. 32
result of the proprietary nature of these additives and their complex chemical structure. Based
on the projected widespread usage of methanol in the future and the possible widespread usage
of these or other additives, a detailed evaluation of the fate and transport of potential additives is
warranted.
Technical Memorandum MALCOLM PIRNIE, INC. 33
5.0 REMEDIATION AND TREATMENT 5.1 Remediation of Methanol
Following a release of methanol to the subsurface as a result of the release scenarios
discussed in Section 1, remediation may be required if the spill is in a high-risk area (i.e.,
potential receptors are nearby). Methanol will quickly biodegrade as discussed in Section 3 and,
therefore, natural attenuation is likely to be an effective and inexpensive remediation strategy in
most soil, groundwater, and surface water scenarios. However, if a methanol plume becomes
commingled with a gasoline plume, rapid biodegradation of methanol may deplete the
surrounding soil and groundwater of electron acceptors and nutrients required for the
biodegradation of gasoline. Therefore, a successful natural attenuation strategy for all
contaminating constituents may require that the natural environment be enhanced with the
addition of oxygen, nutrients, or other amendments to facilitate biodegradation of other gasoline
constituents.
If methanol is released to a subsurface environment with low microbial activity and/or
deep groundwater, there may not be sufficient microbial activity to completely degrade the
released methanol. Consequently, an alternative remediation strategy is required. Under such
circumstances, the high vapor pressure of methanol suggests that soil vapor extraction will
effectively remove residual methanol from the soil. Once extracted from the subsurface, the
methanol vapors can be biodegraded using vapor phase biofilters. In summary, the remediation
of methanol from soil and groundwater is not expected to pose insurmountable technical
challenges due to it tendency to quickly biodegrade.
5.2 Impetus for Drinking Water Treatment
While it is unlikely that elevated levels of methanol will persist in groundwater due to the
rapid rate of biodegradation, neat methanol releases near drinking water supply wells could
impact a water supply source. Unlike certain gasoline additives, the taste and odor threshold
concentration for methanol is high, ranging from 10 ppm to 20,000 ppm in air (USEPA, 1994a).
Alternatively, in order for any toxic symptoms to occur, drinking water concentrations would
have to exceed roughly 9,200 ppm (Machiele, 1989). Based on the groundwater measurements
that have been obtained, and an estimated ‘worst-case scenario’ model for methanol release into
Technical Memorandum MALCOLM PIRNIE, INC. 34
groundwater, it is highly unlikely that methanol concentrations will exceed the toxicity level in
drinking water supply wells, assuming the methanol source is a sufficient distance from the
supply well. Similarly, the U.S. Department of Energy released a report which refers to the
unlikely possibility of toxic contamination (defined as concentrations greater than 1,000 ppm) in
drinking water. (USDOE, 1991).
Regardless, it is likely that drinking water sources containing elevated levels of methanol
will require treatment before it is delivered to the public. There are several treatment options
including: air stripping, activated carbon, advanced oxidation, membrane filtration, or
biologically activated filters. Each of these treatment technologies is discussed briefly below.
5.3 Air Stripping
The effectiveness of air stripping for removing a contaminant from water is a direct
function of that contaminants Henry’s constant. As the Henry’s constant increases, the
contaminant is more readily removed from water. Typically, chemicals with a dimensionless
Henry’s constant below 0.005 (20oC) are not amenable to removal by air stripping (Roberts,
1995). Consequently, conventional air stripping can not be used to remove methanol (H[-]
<0.00011) from drinking water. However, increases in the water temperature will increase the
Henry’s constant, which will allow use of stripping for removing methanol. This process, known
as steam stripping has been used to remove alcohols from industrial waste waters, and could
conceivable be used to remove methanol from drinking water. However, high costs
(>$5.00/1,000 gallons) are required to raise the temperature of water from 10oC to 40oC which
will likely limit the acceptability and feasibility of this technology for removal of methanol from
drinking water.
5.4 Activated Carbon
The effectiveness of activated carbon for removing a contaminant from water is a direct
function of that contaminant’s soil/water partition coefficient (Kd). As discussed earlier,
methanol has a very low soil/water partition coefficient due to its high polarity and, hence,
solubility. Therefore, methanol will not adsorb strongly to granular activated carbon (GAC) or
other adsorbents when present in water. The ineffectiveness of adsorption is also demonstrated
by noting the magnitude of the Freundlich isotherm constants for methanol. While it was not
Technical Memorandum MALCOLM PIRNIE, INC. 35
possible to locate any isotherms for methanol, isotherms for ethanol and acetone are likely
surrogates for methanol’s adsorptivity. The Freundlich isotherm constants for ethanol and
acetone range from 0.0 to 14 [mg/g(L/mg)^1/n] (Crittenden et al., 1997). Compared to benzene
which adsorbs relatively well (isotherm constant range from ~20 to 117 [mg/g(L/mg)^1/n]),
ethanol and acetone have a very small equilibrium adsorption coefficient (Crittenden et al.,
1997). Thus, adsorption processes, such as GAC have limited application for methanol removal
from water.
5.5 Advanced Oxidation
The factors that control the effectiveness of advanced oxidation for removing
contaminants from water include type of oxidation process, the water quality, contact time, and
contaminant oxidation potential. Advanced oxidation treatment becomes most competitive for
chemicals, such as methanol, that neither readily volatilize from water (H < 0.005 [-]) nor are
easily adsorbed onto carbon. Calgon, a major vendor of advanced oxidation processes (AOP)
verified that methanol treatment in drinking water is achievable, but electrical energy
consumption per order of magnitude methanol reduction (EE/O) values and, thus, feasibility will
vary according to influent concentrations and water quality (Reko, 1998). This vendor stated
that if influent concentrations of methanol are 100 ppm, 1,000 ppm, and 10,000 ppm, the
corresponding EE/Os will be 20, 100, and 500, respectively. These EE/O values imply that 20
kilowatt hours are required to lower methanol from 100 ppm to 10 ppm for every 1000 gallons of
treated water, or an energy cost of approximately $2/1000 gallons. Actual costs are potentially
lower than this because methanol levels in water supply sources will likely not exceed 10 ppm.
Compared to MTBE treatment, methanol treatment will require twice as much electricity,
which results in higher treatment costs. Unit costs also rise with a decrease in system size. In a
recent study by Malcolm Pirnie on treatment costs associated with removal of MTBE from
drinking water, the cost to remove MTBE from drinking water may be as low as $0.50/1,000
gallons for a large scale treatment system (6,000 gpm) and as high as $1.50/1,000 gallon for a
smaller scale treatment system (60 gpm). It is also possible, and in some cases more feasible, to
combine UV/oxidation technology with other treatment technologies (particularly biological
treatment), as a finishing process to treat the last 5-10% of methanol contamination. Finally,
AOP technologies can cause oxidation by-product formation which must be considered on a site
Technical Memorandum MALCOLM PIRNIE, INC. 36
specific basis. Thus, the suitability of AOP for removal of methanol requires site specific pilot
studies to resolve treatment cost and by-product formation issues.
5.6 Membranes
Reverse osmosis or nanofiltration membranes can be used to remove some organic
compounds from water. These processes remove organic molecules by size exclusion.
However, because methanol is similar to water in its small size and low molecular weight,
membranes will not typically be effective. A major vendor of reverse osmosis membranes
reports that methanol removal using this technology will likely be less then 20%.
Comparatively, they stated that larger alcohols such as isopropyl alcohol (with five carbon
atoms) can be removed by membranes up to levels of 98%.
5.7 Biological Treatment (Biologically Activated Filters)
Methanol in drinking water supplies can be treated effectively through biological
treatment. The type of technology used depends on the anticipated influent concentrations. For
influent methanol levels of 1 ppm, a slow sand filter should provide the required microbial
activity for successful treatment for drinking water. Higher influent levels (on the order of 100 -
1000 ppm) would require treatment in a biologically activated filter (BAF) with counter air flow.
Design of a BAF for methanol treatment would require pilot studies to determine the optimum
design capacity and appropriate operating conditions for the desired methanol removal
efficiency.
In 1997, the University of Colorado at Boulder completed a pilot project for removal of
nitrate in a biological process that utilizes indigenous bacteria (Scott, 1997). The pilot plant
consists of towers containing layers of bacteria that reduce the nitrates to nitrogen. The simple,
low maintenance system produced an effluent which met the federal and state drinking water
standards for nitrate. Methanol could also be removed in a similar process.
Upton et al. (1993) evaluated a wastewater treatment process which combines a tertiary
solids removal sand filter with denitrification. Methanol was used as the carbon source required
for growth and cell metabolism of the heterotrophic bacteria. Theoretically, reduction of one
gram of nitrate (NO3−) to nitrogen gas requires 1.9 grams of methanol; however, pilot studies
with a 1,000 m3/d filter showed methanol consumption on the order of 4.4 g methanol / g nitrate.
Technical Memorandum MALCOLM PIRNIE, INC. 37
Drinking water purveyors are often reluctant to use BAFs due to the potential for
microbial activity in the treated effluent water. Federal law mandates the disinfection of all
groundwater used as drinking water, regardless of the groundwater quality. Disinfection with
chlorine or ozone following the BAF may reduce the purveyors’ concerns over microbial levels
in the treated water. Although this treatment option is conceptually feasible with moderate costs,
there will be resistance on the part of water utilities because of inherent limitations of biological
processes in drinking water treatment. Consequently, the use of BAFs to remove methanol from
drinking water will likely be limited.
5.8 Conclusion
In conclusion, conventional drinking water treatment technologies used for removal of
organic compounds (air stripping and activated carbon) are not effective for removal of
methanol. Advanced oxidation processes have been proven for methanol treatment, but may be
cost prohibitive, and must be analyzed on a site by site basis. Alternatively, biologically
activated filters represent a cost-effective proven technology to remove methanol from drinking
water, though this technology may be limited by treated water quality concerns of water
purveyors. Very little field site documentation is available due to the fact that methanol has not
been reported as a contaminant in drinking water sources. The most promising technologies for
methanol removal in drinking water applications are some form of biological treatment and
advanced oxidation either separately or in combination.
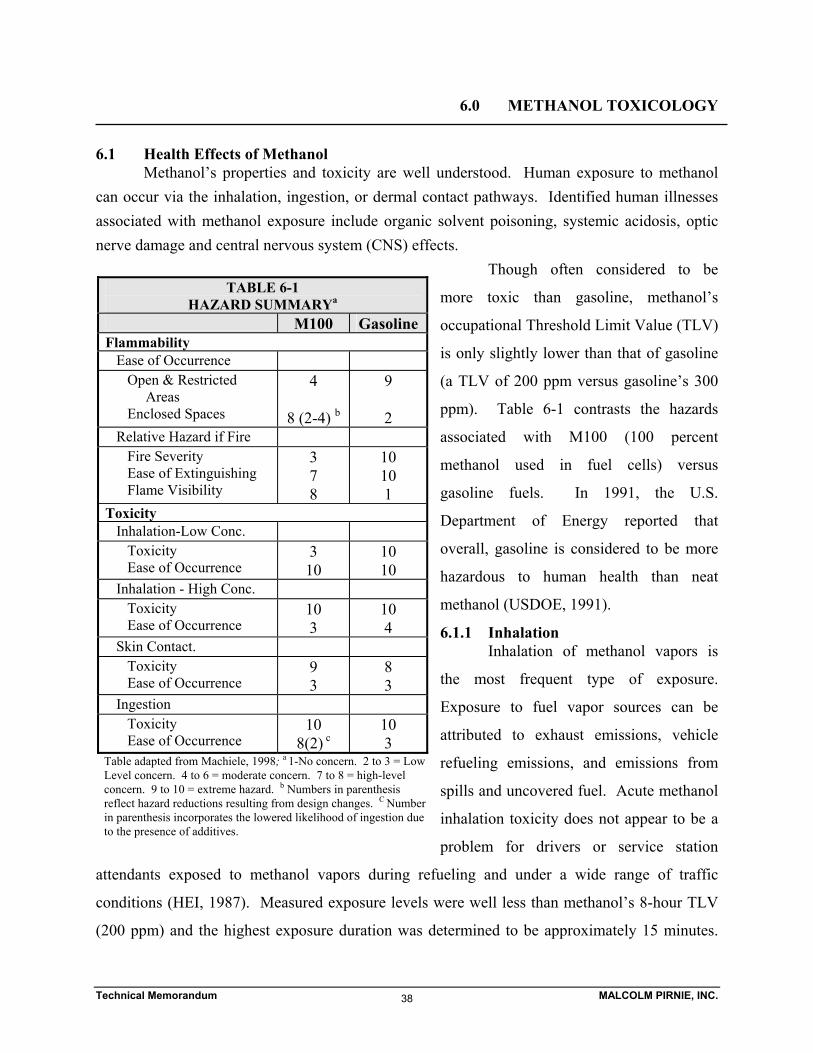
Technical Memorandum MALCOLM PIRNIE, INC. 38
6.0 METHANOL TOXICOLOGY 6.1 Health Effects of Methanol
Methanol’s properties and toxicity are well understood. Human exposure to methanol can occur via the inhalation, ingestion, or dermal contact pathways. Identified human illnesses associated with methanol exposure include organic solvent poisoning, systemic acidosis, optic nerve damage and central nervous system (CNS) effects.
Though often considered to be
more toxic than gasoline, methanol’s
occupational Threshold Limit Value (TLV)
is only slightly lower than that of gasoline
(a TLV of 200 ppm versus gasoline’s 300
ppm). Table 6-1 contrasts the hazards
associated with M100 (100 percent
methanol used in fuel cells) versus
gasoline fuels. In 1991, the U.S.
Department of Energy reported that
overall, gasoline is considered to be more
hazardous to human health than neat
methanol (USDOE, 1991).
6.1.1 Inhalation Inhalation of methanol vapors is
the most frequent type of exposure.
Exposure to fuel vapor sources can be
attributed to exhaust emissions, vehicle
refueling emissions, and emissions from
spills and uncovered fuel. Acute methanol
inhalation toxicity does not appear to be a
problem for drivers or service station
attendants exposed to methanol vapors during refueling and under a wide range of traffic
conditions (HEI, 1987). Measured exposure levels were well less than methanol’s 8-hour TLV
(200 ppm) and the highest exposure duration was determined to be approximately 15 minutes.
TABLE 6-1 HAZARD SUMMARYa
M100 Gasoline Flammability Ease of Occurrence Open & Restricted Areas Enclosed Spaces
4
8 (2-4) b
9 2
Relative Hazard if Fire Fire Severity Ease of Extinguishing Flame Visibility
3 7 8
10 10 1
Toxicity Inhalation-Low Conc. Toxicity Ease of Occurrence
3 10
10 10
Inhalation - High Conc. Toxicity Ease of Occurrence
10 3
10 4
Skin Contact. Toxicity Ease of Occurrence
9 3
8 3
Ingestion Toxicity Ease of Occurrence
10 8(2) c
10 3
Table adapted from Machiele, 1998; a 1-No concern. 2 to 3 = Low Level concern. 4 to 6 = moderate concern. 7 to 8 = high-level concern. 9 to 10 = extreme hazard. b Numbers in parenthesis reflect hazard reductions resulting from design changes. C Number in parenthesis incorporates the lowered likelihood of ingestion due to the presence of additives.
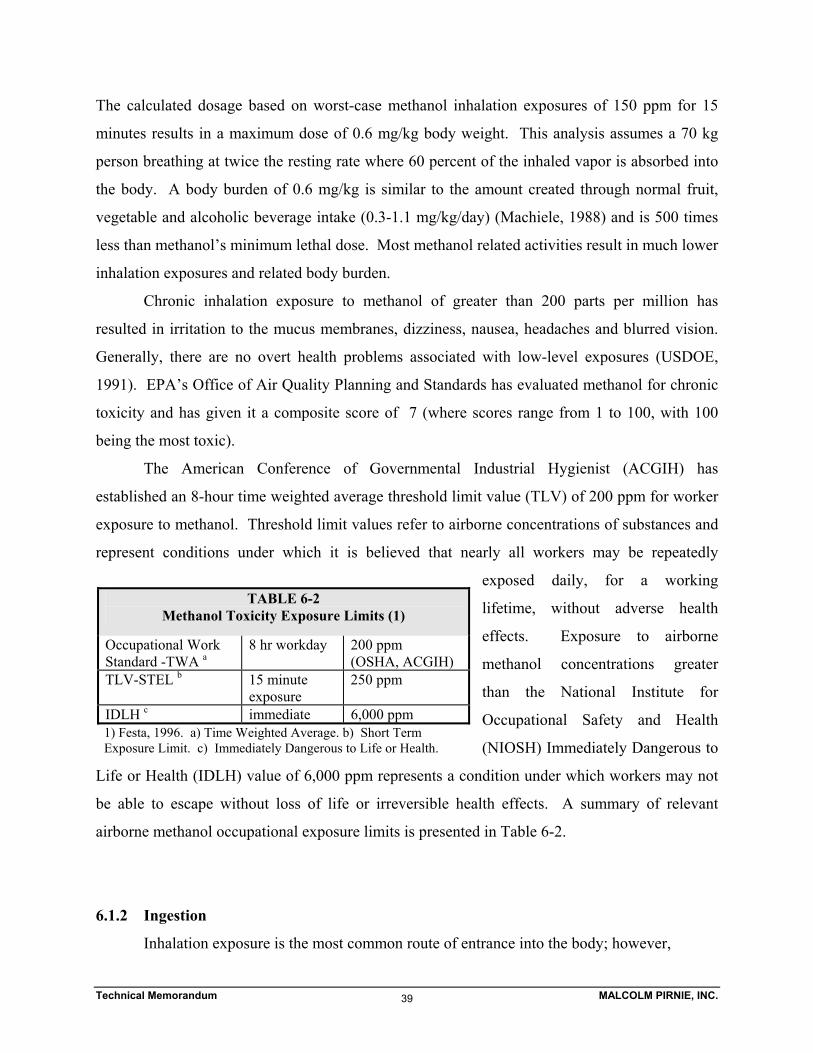
Technical Memorandum MALCOLM PIRNIE, INC. 39
The calculated dosage based on worst-case methanol inhalation exposures of 150 ppm for 15
minutes results in a maximum dose of 0.6 mg/kg body weight. This analysis assumes a 70 kg
person breathing at twice the resting rate where 60 percent of the inhaled vapor is absorbed into
the body. A body burden of 0.6 mg/kg is similar to the amount created through normal fruit,
vegetable and alcoholic beverage intake (0.3-1.1 mg/kg/day) (Machiele, 1988) and is 500 times
less than methanol’s minimum lethal dose. Most methanol related activities result in much lower
inhalation exposures and related body burden.
Chronic inhalation exposure to methanol of greater than 200 parts per million has
resulted in irritation to the mucus membranes, dizziness, nausea, headaches and blurred vision.
Generally, there are no overt health problems associated with low-level exposures (USDOE,
1991). EPA’s Office of Air Quality Planning and Standards has evaluated methanol for chronic
toxicity and has given it a composite score of 7 (where scores range from 1 to 100, with 100
being the most toxic).
The American Conference of Governmental Industrial Hygienist (ACGIH) has
established an 8-hour time weighted average threshold limit value (TLV) of 200 ppm for worker
exposure to methanol. Threshold limit values refer to airborne concentrations of substances and
represent conditions under which it is believed that nearly all workers may be repeatedly
exposed daily, for a working
lifetime, without adverse health
effects. Exposure to airborne
methanol concentrations greater
than the National Institute for
Occupational Safety and Health
(NIOSH) Immediately Dangerous to
Life or Health (IDLH) value of 6,000 ppm represents a condition under which workers may not
be able to escape without loss of life or irreversible health effects. A summary of relevant
airborne methanol occupational exposure limits is presented in Table 6-2.
6.1.2 Ingestion
Inhalation exposure is the most common route of entrance into the body; however,
TABLE 6-2 Methanol Toxicity Exposure Limits (1)
Occupational Work Standard -TWA a
8 hr workday 200 ppm (OSHA, ACGIH)
TLV-STEL b 15 minute exposure
250 ppm
IDLH c immediate 6,000 ppm 1) Festa, 1996. a) Time Weighted Average. b) Short Term Exposure Limit. c) Immediately Dangerous to Life or Health.
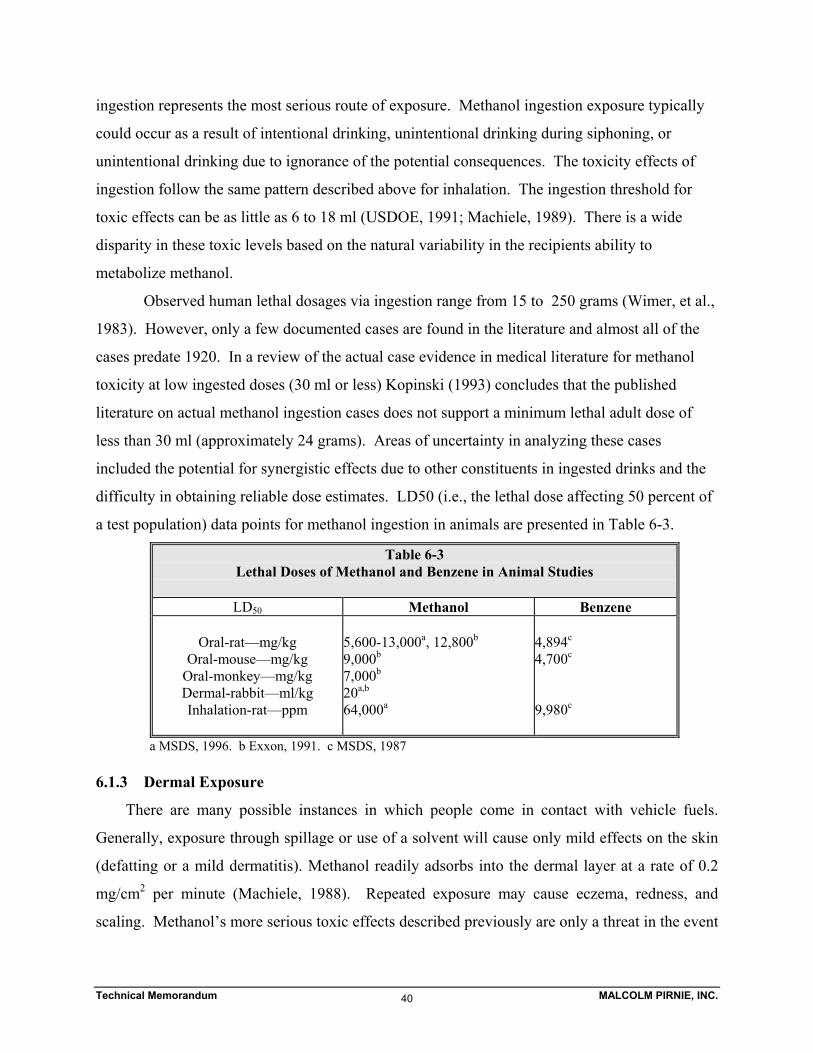
Technical Memorandum MALCOLM PIRNIE, INC. 40
ingestion represents the most serious route of exposure. Methanol ingestion exposure typically
could occur as a result of intentional drinking, unintentional drinking during siphoning, or
unintentional drinking due to ignorance of the potential consequences. The toxicity effects of
ingestion follow the same pattern described above for inhalation. The ingestion threshold for
toxic effects can be as little as 6 to 18 ml (USDOE, 1991; Machiele, 1989). There is a wide
disparity in these toxic levels based on the natural variability in the recipients ability to
metabolize methanol.
Observed human lethal dosages via ingestion range from 15 to 250 grams (Wimer, et al.,
1983). However, only a few documented cases are found in the literature and almost all of the
cases predate 1920. In a review of the actual case evidence in medical literature for methanol
toxicity at low ingested doses (30 ml or less) Kopinski (1993) concludes that the published
literature on actual methanol ingestion cases does not support a minimum lethal adult dose of
less than 30 ml (approximately 24 grams). Areas of uncertainty in analyzing these cases
included the potential for synergistic effects due to other constituents in ingested drinks and the
difficulty in obtaining reliable dose estimates. LD50 (i.e., the lethal dose affecting 50 percent of
a test population) data points for methanol ingestion in animals are presented in Table 6-3.
Table 6-3 Lethal Doses of Methanol and Benzene in Animal Studies
LD50 Methanol Benzene
Oral-rat—mg/kg
Oral-mouse—mg/kg Oral-monkey—mg/kg Dermal-rabbit—ml/kg Inhalation-rat—ppm
5,600-13,000a, 12,800b 9,000b 7,000b 20a,b 64,000a
4,894c 4,700c 9,980c
a MSDS, 1996. b Exxon, 1991. c MSDS, 1987 6.1.3 Dermal Exposure
There are many possible instances in which people come in contact with vehicle fuels.
Generally, exposure through spillage or use of a solvent will cause only mild effects on the skin
(defatting or a mild dermatitis). Methanol readily adsorbs into the dermal layer at a rate of 0.2
mg/cm2 per minute (Machiele, 1988). Repeated exposure may cause eczema, redness, and
scaling. Methanol’s more serious toxic effects described previously are only a threat in the event
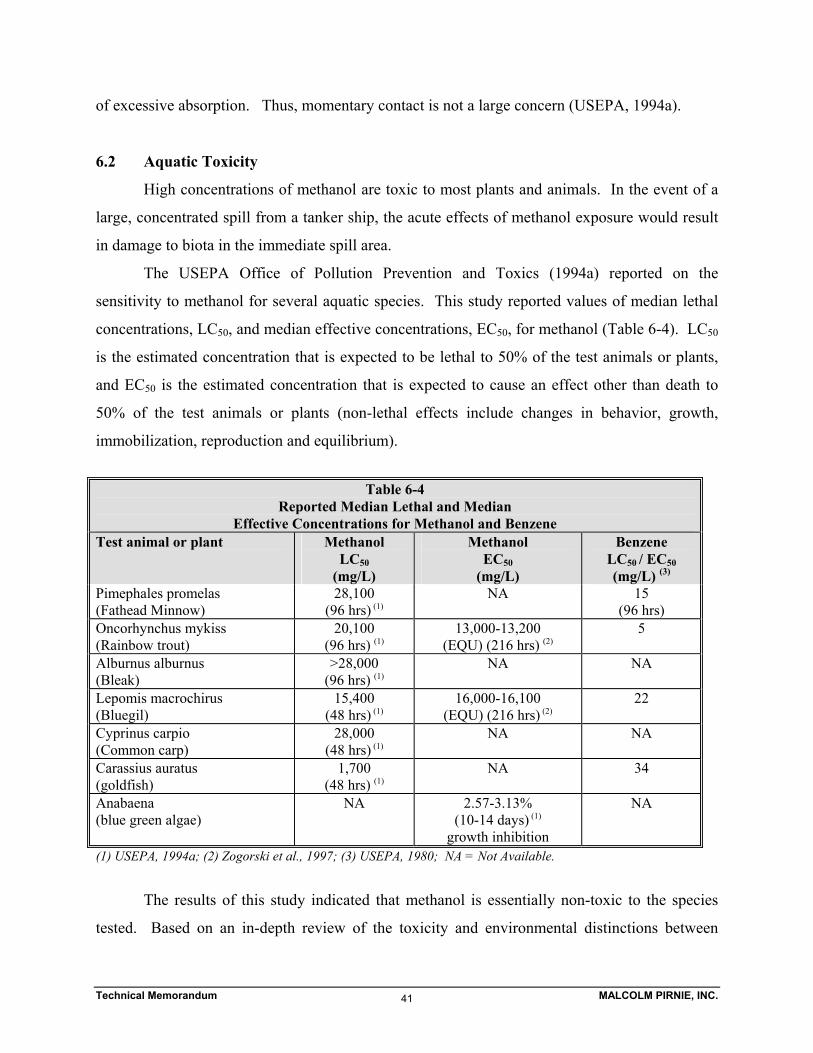
Technical Memorandum MALCOLM PIRNIE, INC. 41
of excessive absorption. Thus, momentary contact is not a large concern (USEPA, 1994a).
6.2 Aquatic Toxicity
High concentrations of methanol are toxic to most plants and animals. In the event of a
large, concentrated spill from a tanker ship, the acute effects of methanol exposure would result
in damage to biota in the immediate spill area.
The USEPA Office of Pollution Prevention and Toxics (1994a) reported on the
sensitivity to methanol for several aquatic species. This study reported values of median lethal
concentrations, LC50, and median effective concentrations, EC50, for methanol (Table 6-4). LC50
is the estimated concentration that is expected to be lethal to 50% of the test animals or plants,
and EC50 is the estimated concentration that is expected to cause an effect other than death to
50% of the test animals or plants (non-lethal effects include changes in behavior, growth,
immobilization, reproduction and equilibrium).
Table 6-4
Reported Median Lethal and Median Effective Concentrations for Methanol and Benzene
Test animal or plant Methanol LC50
(mg/L)
Methanol EC50
(mg/L)
Benzene LC50
/ EC50 (mg/L) (3)
Pimephales promelas (Fathead Minnow)
28,100 (96 hrs) (1)
NA 15 (96 hrs)
Oncorhynchus mykiss (Rainbow trout)
20,100 (96 hrs) (1)
13,000-13,200 (EQU) (216 hrs) (2)
5
Alburnus alburnus (Bleak)
>28,000 (96 hrs) (1)
NA NA
Lepomis macrochirus (Bluegil)
15,400 (48 hrs) (1)
16,000-16,100 (EQU) (216 hrs) (2)
22
Cyprinus carpio (Common carp)
28,000 (48 hrs) (1)
NA NA
Carassius auratus (goldfish)
1,700 (48 hrs) (1)
NA 34
Anabaena (blue green algae)
NA 2.57-3.13% (10-14 days) (1)
growth inhibition
NA
(1) USEPA, 1994a; (2) Zogorski et al., 1997; (3) USEPA, 1980; NA = Not Available.
The results of this study indicated that methanol is essentially non-toxic to the species
tested. Based on an in-depth review of the toxicity and environmental distinctions between
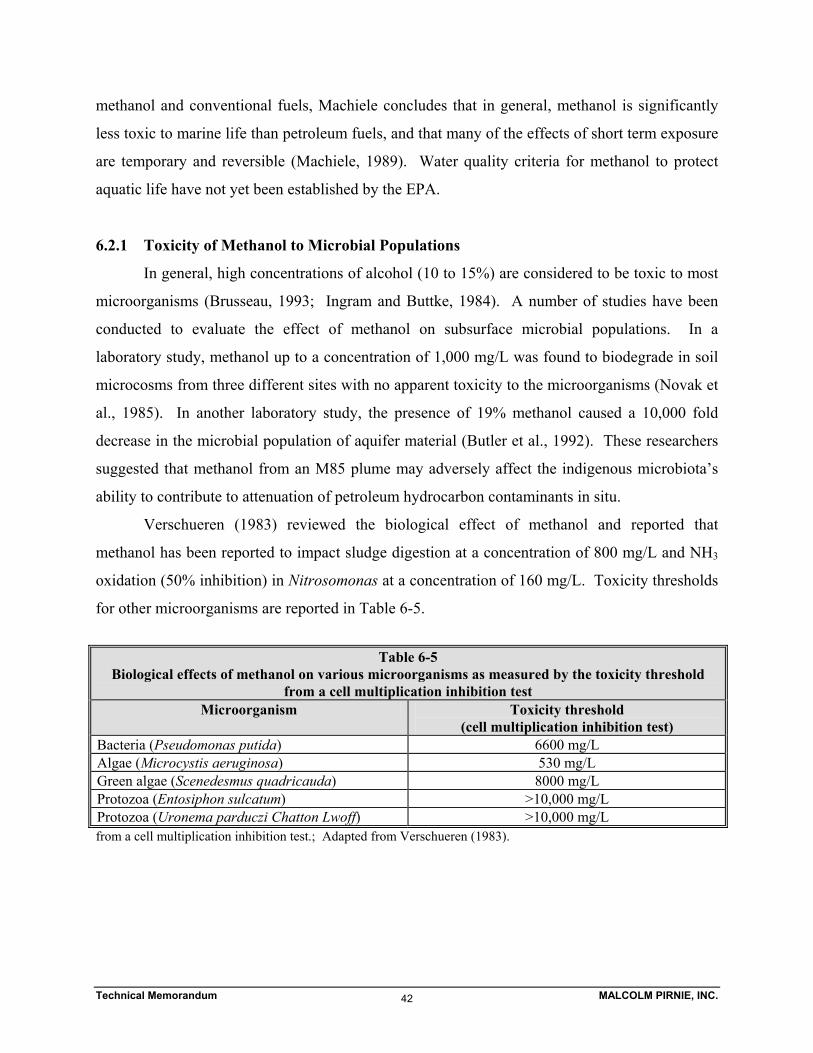
Technical Memorandum MALCOLM PIRNIE, INC. 42
methanol and conventional fuels, Machiele concludes that in general, methanol is significantly
less toxic to marine life than petroleum fuels, and that many of the effects of short term exposure
are temporary and reversible (Machiele, 1989). Water quality criteria for methanol to protect
aquatic life have not yet been established by the EPA.
6.2.1 Toxicity of Methanol to Microbial Populations
In general, high concentrations of alcohol (10 to 15%) are considered to be toxic to most
microorganisms (Brusseau, 1993; Ingram and Buttke, 1984). A number of studies have been
conducted to evaluate the effect of methanol on subsurface microbial populations. In a
laboratory study, methanol up to a concentration of 1,000 mg/L was found to biodegrade in soil
microcosms from three different sites with no apparent toxicity to the microorganisms (Novak et
al., 1985). In another laboratory study, the presence of 19% methanol caused a 10,000 fold
decrease in the microbial population of aquifer material (Butler et al., 1992). These researchers
suggested that methanol from an M85 plume may adversely affect the indigenous microbiota’s
ability to contribute to attenuation of petroleum hydrocarbon contaminants in situ.
Verschueren (1983) reviewed the biological effect of methanol and reported that
methanol has been reported to impact sludge digestion at a concentration of 800 mg/L and NH3
oxidation (50% inhibition) in Nitrosomonas at a concentration of 160 mg/L. Toxicity thresholds
for other microorganisms are reported in Table 6-5.
Table 6-5
Biological effects of methanol on various microorganisms as measured by the toxicity threshold from a cell multiplication inhibition test
Microorganism Toxicity threshold (cell multiplication inhibition test)
Bacteria (Pseudomonas putida) 6600 mg/L Algae (Microcystis aeruginosa) 530 mg/L Green algae (Scenedesmus quadricauda) 8000 mg/L Protozoa (Entosiphon sulcatum) >10,000 mg/L Protozoa (Uronema parduczi Chatton Lwoff) >10,000 mg/L from a cell multiplication inhibition test.; Adapted from Verschueren (1983).
Technical Memorandum MALCOLM PIRNIE, INC. 43
7.0 FUTURE RESEARCH NEEDS This report contains a comprehensive evaluation of the fate and transport of methanol in
the environment. As noted, there are several areas where the available literature is not sufficient
to address all fate and transport issues associated with unintentional releases of methanol to the
soil, groundwater, or surface water. Based on the review provided in this report, the following
research suggestions are recommended:
1) As discussed in Section 5, the selection of methanol additives, if needed, may significantly
alter the risk posed by methanol releases into the environment. As the need for additives and
their possible choices are evaluated, the fate and transport of the additives will need to be
addressed as part of the evaluation process.
2) The literature reviewed for this report suggests that methanol will rapidly degrade once
introduced to the subsurface. However, high concentrations of methanol near the source may
be toxic to microorganisms resulting in limited or no source area biodegradation.
Consequently, an analysis of methanol releases that have occurred at methanol fueling areas,
storage areas, production locations, or during transportation would serve to verify that
methanol does not significantly accumulate in the environment, nor does it pose a threat to
drinking water resources.
3) The fate and transport of a methanol plume that may become commingled with a gasoline
plume is briefly discussed in section 3 of this report; however, there remain several
uncertainties. The effect of methanol on the fate and transport of BTEX plumes needs to be
better understood. In addition, if the BTEX biodegradation rate is reduced, the effect of this
reduced rate on increases in BTEX plume lengths should be further evaluated.
4) If any of the above studies indicate that methanol or methanol additives may persist in the
subsurface, an evaluation should be completed to determine the best technology for
remediation and treatment of these compounds. The chosen technology should address
removal of these compounds in the source area, plume area, or at the drinking water source
Technical Memorandum MALCOLM PIRNIE, INC. 44
well. For drinking water applications, it should be determined whether the selected
technology, or a combination of technologies, meets the requirements posed by the drinking
water community with respect to process reliability and regulatory approval.
Technical Memorandum MALCOLM PIRNIE, INC. 45
8.0 CONCLUSIONS
8.1 Fate and Transport
The fate and transport of methanol released into the environment has been evaluated in
the context of three conceptual release scenarios: 1) a rail car or tank truck spill during transport;
2) an ocean or river spill during transport; and 3) an underground storage tank release at a
methanol dispensing location. In each of these scenarios, methanol is unlikely to persistent in
any of the environmental compartments due to its rapid biodegradation. Methanol is miscible in
water, and will consequently dissolve and dilute to very low concentrations in the event of a
surface water spill (Scenario 2). Similarly, groundwater methanol concentrations are highly
dependent on the nature and magnitude of the release, but will likely fall to low concentrations
once complete dissolution has occurred. In both of these scenarios, the low concentrations of
methanol will likely be easily biodegraded under a wide range of geochemical conditions.
Biodegradation is the primary process for methanol removal from the environment.
Relative to gasoline, methanol is safer and more environmentally benign. Hazards incurred by
gasoline releases are greater than those of methanol releases, and will persist much longer in the
environment (USDOE, 1991).
8.2 Methanol Additives
It is currently unknown whether additives will be required for wide-spread use in
methanol fuel. Because of several potential safety concerns over the use of methanol as a fuel
source the need for additives must be evaluated. Manufacturers are currently focusing their
additive investigation and testing efforts on three chemical or physical characteristics of
methanol: luminosity, taste, and color.
For each category, there may exist a set of candidate chemicals which addresses the
stated problem. However, often these chemicals are proprietary in nature, such that the chemical
properties are not published. Consequently, a detailed analysis of the fate and transport of these
additives was not possible.
8.3 Remediation and Treatment
Technical Memorandum MALCOLM PIRNIE, INC. 46
Most treatment technologies that are commonly used to remove gasoline components
from water (e.g., air stripping, granular activated carbon) are not effective for removing
methanol from water due to the high solubility and low Henry’s constant relative to other
gasoline components. In the majority of remediation cases, the inability of these technologies to
remove methanol from water is inconsequential because biodegradation of methanol in the soil,
groundwater, and surface water will readily occur. If methanol were to impact drinking water
sources, advanced oxidation processes have been proven, though the feasibility and costs of the
treatment are very site specific. Biological treatment processes are effective at removing
methanol from water, and are increasingly being used to polish the effluent from advanced
oxidation processes. However, biological treatment in drinking water applications is still not
extensively used and, therefore, would require regulatory acceptance. In conclusion, methanol
can be removed in both a remediation and drinking water treatment context using biological
degradation; however, the effectiveness, cost and public acceptability will be site specific.
8.4 Human and Aquatic Toxicity
Methanol’s properties and toxicity are well understood, and the ocular toxicity and
metabolic acidosis that are effects of acute high doses of methanol are well-known. Methanol is
neither mutagenic, nor carcinogenic. While methanol produces toxic effects on humans and
animals, the current evidence suggests that these effects only occur at high doses (Festa, 1996).
While methanol is often considered to be more toxic than gasoline, the threshold limit value
(TLV) for methanol vapor is only slightly lower than that for gasoline; and the U.S. Department
of Energy considers gasoline to be ‘overall’ more hazardous to health than neat methanol.
Methanol is significantly less toxic to marine life than petroleum fuels, and many of the
effects of short term exposure are temporary and reversible. Based on the reported values of
median lethal and effective concentrations for methanol, the Office of Pollution Prevention and
Toxics indicated that methanol is essentially non-toxic to the four aquatic fish species that were
tested. However, a surface water spill of methanol could result in the depletion of oxygen which
would prove to be toxic to local fish species. Methanol has a negligible bioaccumulation
potential and is relatively non-toxic to ecological receptors. While the aquatic toxicity of
methanol is high, toxic concentrations could be observed near a LUST source area or after a pure
product methanol spill; this concentrations will likely quickly dissipate. Thus, in most cases,
Technical Memorandum MALCOLM PIRNIE, INC. 47
methanol concentrations will be benign to surrounding organisms, but in extreme circumstances,
methanol could prove toxic to indigenous microbes or aquatic life.
In conclusion, the fate and transport of methanol in the environment is well understood.
Methanol spills to the soil, groundwater, and surface water will quickly biodegrade under both
aerobic and anaerobic conditions and, consequently, methanol is not expected to persist.
Methanol exhibits a lower toxicity to both humans and indigenous microbes then conventional
gasoline. Therefore, based on this analysis, methanol appears to be a more environmentally
benign fuel compared to conventional gasoline.
Technical Memorandum MALCOLM PIRNIE, INC. 48
9.0 ACKNOWLEDGEMENTS
This research was performed at the request of American Methanol Institute (AMI) under
the direction of Michael Kavanaugh, Ph.D., P.E., Vice-President of Malcolm Pirnie, Inc.
Andrew Stocking from Malcolm Pirnie, Inc. was the Project Manager, and Karen Pappas of
Malcolm Pirnie, Inc. was the Project Engineer. Literature review and analysis for
biodegradation were provided by Rula Deeb (Ph.D. Candidate, University of California,
Berkeley). Please address correspondence or questions to Dr. Michael Kavanaugh or Andrew
Stocking at:
MALCOLM PIRNIE, INC. 180 Grand Ave., Suite 1000 Oakland, California 94612
(510) 451-8900 Tel. (510) 451-8904 Fax
Technical Memorandum MALCOLM PIRNIE, INC. 49
10.0 REFERENCES Alexander, M. 1994. Biodegradation and Bioremediation. Academic Press, Inc., San Diego,
CA.
American Methanol Institute. 1998. Methanol: North America’s Clean Fuel and Chemical Building Block. Web address: http://www.methanol.org/methanol/fact/methanol.html
Anthony, C. 1990. The oxidation of methanol in gram-negative bacteria. FEMS Microbiology Reviews 87(3-4):209-214.
Arfman, N., Dijkhuizen, L., Kirchhof, G., Ludwig, W., Schleifer, K. -H., Bulygina, E. S., Chumakov, K. M., Govorukhina, Y. A., Trotsenko, Y. A., White, D. and Sharp, R. J. 1992. Bacillus methanolicus sp. nov., a new species of thermotolerant, methanol-utilizing, endospore-forming bacteria. International Journal of Systematic Bacteriology 42(3):439-445.
Aronson, D. and Howard, P. H. 1997. Anaerobic Biodegradation of Organic Chemicals in Groundwater: A Summary of Field and Laboratory Studies. Report prepared for the American Petroleum Institute, Chemical Manufacturer’s Association, National Council of the Paper Industry for Air and Stream Improvement, Edison Electric Institute, and American Forest and Paper Association.
Bagley, D. M. and Gossett, J. M. 1995. Chloroform degradation in methanogenic methanol enrichment cultures and by Methanosarcina barkeri 227. Applied and Environmental Microbiology 61(9):3195-3201.
Bardon, M.F., Nicks, G.W., Rao, V.K., Vaivads, V. 1987. A Vapour Pressure Model for Methanol/Gasoline M85 Blends. International Congress and Exposition. Detroit, Michigan.
Barker, J. F., Hubbard, C. E. and Lemon, L. A. 1990. The influence of methanol and MTBE on the fate and persistence of monoaromatic hydrocarbons in groundwater. In Proceedings of the Petroleum Hydrocarbons and Organic Chemicals in Ground Water: Prevention, Detection, and Restoration. pp. 113-127, National Water Well Association, Dublin, Ohio.
Barker, J. F., Hubbard, C. E., Lemon, L. A. and Vooro, K. A. 1992. The influence of methanol in gasoline fuels on the formation of dissolved plumes, and the fate and natural remediation of methanol and BTEX dissolved in groundwater. In: Calabrese, E. J. and Kostecki, P. T. (Eds.). Hydrocarbon Contaminated Soils and Groundwater, Lewis Publishers, NY, pp. 103-113.
Barker, J. F., Schirmer, M., Butler, B. J. 1998. Fate and Transport of MTBE in Groundwater - Results of a Controlled Field Experiment in Light of Other Experience. Presented at The Southwest Focused Ground Water Conference: Discussing the Issue of MTBE and Perchlorate in Ground Water, Anaheim, CA, June 3-4, 1998, pp. 11.
Technical Memorandum MALCOLM PIRNIE, INC. 50
Barker, J.F., Gillham, R.W., Lemon, L., Mayfield, C.I., Poulsen, M., and E.A. Sudicky. August, 1991. Chemical Fate and Impact of Oxygenates in Groundwater: Solubility of BTEX from Gasoline -Oxygenate Compounds. American Petroleum Institute, Publication No. 4531.
Bauman, Bruce. 1989. Groundwater Contamination By Methanol Fuels. American Petroleum Institute. Washington, D.C.
Beck, Brian A. 1991., Methanol Used as Alternative Fuel Comes With Hopes and Headaches. HazMat World. May:96-98.
Beeman, R. E. and Suflita, J. M. 1987. Microbial ecology of a shallow unconfined ground water aquifer polluted by municipal landfill leachate. Microbial Ecology 14:39-54
Berning, C.K., Griffiths, J.F., and Wild, J.E. 1982. Fundamentals and Applied Toxicology. 2,44.
Bitrex. 1998. Various Bitrex Product Information Sheets. Macfarlan Smith Limited, Wheatfield Road, Edinburgh EH11 2QA Scotland. Tel: 0131 337 2434
Brault, N., Loranger, S., Courchesne, F., Kennedy, G. and Zayed, J. 1994. Bioaccumulation of manganese by plants: Influence of MMT as a gasoline additive. Science of Total Environment 153:77-84.
Brock, T. D. and Madigan, M. T. 1991. Biology of Microorganisms. Prentice Hall, Englewood, NJ.
Brown, Stuart F. 1998. The Automakers’ Big-Time Bet on Fuel Cells. Fortune. March, 1998.
Brusseau, M. L. 1993. Complex mixtures and water quality. EPA/600/S-93/004, United States Environmental Protection Agency, Washington, D.C.
Butler, B. J., VanderGriendt, M. and Barker, J. F. 1992. Impact of methanol on the biodegradative activity of aquifer microorganisms. Paper presented at the 13th Annual Meeting of the Society of Environmental Toxicology and Chemistry, November 8 - 12, Cincinnati, OH.
California Air Resources Board (CARB). Lower Emission Vehicle II Hearing, November 5, 1998.
California Energy Commission (CEC). 1994. Calfuels Plan. Developing an Infrastructure Plan for Alternative Fuel Vehicles. California.
California Energy Commission (CEC). 1998. Methanol Powered – Flexible Fuel Vehicles and Vehicle History. http://www.energy.ca.gov/afvs/m85/methanolhistory.html
Chang, H. -L. 1995. Ph.D. Thesis, University of California at Berkeley
Chapelle, F. H. 1992. Groundwater Microbiology and Biochemistry. Wiley and Sons, NY, NY.
Technical Memorandum MALCOLM PIRNIE, INC. 51
Chen, C. S., Rao, S. C. and Delfino, J. J. 1997. Cosolvent effects on the dissolution of polynuclear aromatic hydrocarbons due to spills of oxygenated fuel in the subsurface environment. In Preprints of Extended Abstracts 37(1)387-389, Proceedings of the 213th ACS National Meeting, San Francisco, CA.
Corseuil, H. and Alvarez, P. 1996a. Natural bioremediation perspective for BTX-contaminated groundwater in Brazil: Effect of Methanol. Water Science and Technology 34 (7-8):311-318.
Corseuil, H. X. and Alvarez, P. J. 1996b. Natural bioremediation of aquifer material contaminated with gasoline-methanol mixtures. Revista De Microbiologia 27(1):19-26.
Corseuil, H., Aires, J. and Alvarez, P. 1996c. Implications of the presence of methanol on intrinsic bioremediation of BTX plumes in Brazil. Hazardous Waste & Hazardous Materials 13(2):213-221.
Corseuil, H., Hunt, C., dos Santos Ferreira, R. and Alvarez, P. 1998. The influence of the gasoline oxygenate methanol on aerobic and anaerobic BTX biodegradation . Water Research 32(7):2065-2072.
Crittenden, J., Hand, D.W., and D.R. Hokanson. 1997. Environmental Technologies Design Option Tools (ETDOT) for The Clean Process Advisory Systems (CPAs) Adsorption, Aeration and Physical Properties Software. National Center for Clean Industrial and Treatment Technologies.
Dean, B. J. 1985. Recent findings on the genetic toxicology of benzene, toluene, xylenes and phenols. Mutat. Res. 145:153-181.
Donbaldson, C.R., Barker,J.F., Chatzis, I. 1993. Subsurface Fate and Transport of a Methanol/Gasoline Blend (M85)- A Laboratory Investigation. American Petroleum Institute, Publication No. 4569.
El-Zoobi, M. A., Ruch, G. and Groves, F. 1990. Effects of cosolvents on hydrocarbon partition coefficients for hydrocarbon mixtures and water. Environmental Science and Technology 24(9):1332 -1338.
ENVIRON. 1996. Hazard Assessment for Human and Environmental Health: Methanol. Prepared for American Forest and Paper Association, Inc. Washington, D.C.
Esnault, G., Caumette, P. and Garcia, J. -L. 1988. Characterization of Desulfovibrio giganteus sp. nov., a sulfate-reducing bacterium isolated from a brackish coastal lagoon. Systematic and Applied Microbiology 10:147-151.
Exxon Biomedical Sciences, Inc., Toxicology Division. 1991. Methanol Emergency Response Planning Guideline. East Millstone, New Jersey. 91MR 2621.
Fanick, E. Robert, Smith, Lawrence R., Russell, John A., and Likos, William E. 1990. Society of
Technical Memorandum MALCOLM PIRNIE, INC. 52
Automotive Engineers. Paper #902156.
Festa, John L. 1996. Petition to De-list Methanol Under Section 112(b) of the Clean Air Act. American Forest and Paper Association, Washington, D.C.
Fishbein, L., Henry, C. 1990. Health Effects of Methanol: An Overview. Chapter 10 from Methanol as an Alternative Fuel Choice: An Assessment. The Johns Hopkins Foreign Policy Institute: Washington, D.C.
Fitch, M. W., Speitel, G. E. and Georgiou, G. 1996. Degradation of trichloroethylene by methanol-grown cultures of Methylosinus trichosporium OB3b PP358. Applied and Environmental Microbiology 62(3):1124-1128.
Florencio, L., Field, J. A. and Lettinga, G. 1995. Substrate competition between methanogens and acetogens during the degradation of methanol in USAB reactors. Water Research 29(3):915-922.
Florencio, L., Nozhevnikova, A., van Langerak, A., Stams, A. J. M. and Field, J. A. 1993. Acidophilic degradation of methanol by a methanogenic enrichment culture. FEMS Microbiology Letters 109(1):1-6.
Harmon, Thomas, Dela-Barre, Brian. 1998. Modeling Cosolvent -Water Displacement in Porous Media Using a Variable Density and Viscosity Flow and Transport Approach. UCLA Department of Civil and Environmental Engineering.
Health Effects Institute (HEI). 1987. Synopsis of Research Report Number 42: Does Inhalation of Methanol Vapor Affect Human Neurobehavior? HEI, Cambridge, MA.
Heermann, S. E. 1998. Personal communication.
Heermann, S. E. and Powers, S. E. 1997. Modeling cosolvency effects on BTEX partitioning from reformulated gasolines. In Preprints of Extended Abstracts 37(1)389-392, Proceedings of the 213th ACS National Meeting, San Francisco, CA.
Heermann, S. E. and Powers, S. E. 1998. Modeling the partitioning of BTEX in water-reformulated gasoline systems containing ethanol. Accepted for publication in Journal of Contaminant Hydrology.
Heijthuijsen, J. H. F. G. and Hansen, T. A. 1990. C1-metabolism in anaerobic non-methanogenic bacteria, p. 163-191. In Autotrophic Microbiology and One-carbon Metabolism, G. A. Codd, L. Dijkhuizen and F. R. Tabita (eds.), Kluwer Academic Publishers, Boston.
Howard, P. H., Boethling, R. S., Jarvis, W. F., Meylan, W. M. and Michalenko, E. M. 1991. Handbook of Environmental Degradation Rates. Lewis Publishers Inc., Chelsea, MI.
Hubbard, C. E., Barker, J. F., O’Hannesin, S. F., Vandergriendt, M. and Gillham, R. W. 1994. Transport and fate of dissolved methanol, methyl-tertiary-butyl-ether, and monoaromatic
Technical Memorandum MALCOLM PIRNIE, INC. 53
hydrocarbons in a shallow sand aquifer. American Petroleum Institute Publication no. 4601.
Hunt, C. S., Cronkhite, L. A., Corseuil, H. X. and Alvarez, P. J. 1997b. Effect of methanol on anaerobic toluene degradation in aquifer microcosms. In Preprints of Extended Abstracts 37(1)424-426, Proceedings of the 213th ACS National Meeting, San Francisco, CA.
Hunt, C., Alvarez, P., dos Santos Ferreira, R. and Corseuil, H. 1997a. Effect of methanol on aerobic BTX degradation . In B. C. Alleman and A. L. Leeson (eds.), In Situ and Onsite Bioremediation, Battelle Press, 4(1):49-54.
Ingram, L. O. and T. M. Buttke. 1984. Effects of alcohols on micro-organisms. In: Advances in Microbial Physiology, Academic Press, 25:253-303.
Kastenberg, W.E. , Dhir, V.K., Harmon, T., Okrent, D., Barfield, A., Katsumata, P., Wu, Z., Ivanov, M. 1998. Study of Fresh-Water Quality Impacts of Methanol Fuel Spills and Leaks. Center for Clean Technology, UCLA.
Katsumata, P. T. and Kastenberg, W. E. 1996. Fate and transport of methanol fuel from spills and leaks. Hazardous Waste and Hazardous Materials 13(4):485-498.
King, R. B., Long, G. M. and Sheldon, J. K. 1992. Practical Environmental Bioremediation. Lewis Publishers.
Komagata, K. 1990. Systematics of methanol-utilizing bacteria. FEMS Microbiology Reviews 87(3-4):291-295.
Kopinski, Don. 1993. The Evidence for Low Dose Methanol Toxicity. United States Environmental Protection Agency. Ann Arbor, MI.
LaGrega, M. D., Buckingham, P. L. and Evans, J. C. 1994. Hazardous Waste Management. McGraw-Hill, Inc.
Lawless, H.T., Hammer, L.D. and Cotina, M.D. 1993. Journal of Toxicol. Clin. Toxicol. 19, 951.
Lehninger, A. L., Neslon, D. L and Cox, M. M. 1993. Principles of Biochemistry, Second edition. Worth Publishers, New York, NY.
Machiele, Paul. 1988. Methanol Promise and Problems: Flammability and Toxicity Tradeoffs with Methanol Fuels. Society of Automotive Engineers. Warrendale, PA.
Machiele, Paul A. 1989. A Perspective on the Flammability, Toxicity, and Environmental Safety Distinctions Between Methanol and Conventional Fuels. Prepared for American Institute of Chemical Engineers. U.S. Environmental Protection Agency. Ann Arbor, MI.
Machiele, Paul. 1990. A Summary of the Fire Safety Impacts of Methanol as a Transportation Fuel. SAE Technical Paper Series, SAE International. Warrendale, PA.
Technical Memorandum MALCOLM PIRNIE, INC. 54
Mackay, D., Shiu, W. -Y. and Ma, K. -C. 1992. Illustrated Handbook of Chemical Properties and Environmental Fate for Organic Chemicals. Volume IV: Oxygen, Nitrogen and Sulfur Containing Compounds. Lewis Publishers, Boca Raton, FL.
Malcolm Pirnie, Inc. April 3, 1998. Modeling the Volatilization of Methyl Tertiary Butyl Ether (MTBE) from Surface Impoundments. Oakland, California.
Material Safety and Data Sheet for Benzene. January 1987. University of Utah.
Material Safety and Data Sheet for Methanol. Methanex. 1996.
Maxwell, Timothy and Jones, Jesse. 1994. Alternative Fuels: Emissions, Economics, and Performance. Society of Automotive Engineers, Inc. Warrendale, PA.
Metcalf and Eddy, Inc. 1979. Wastewater Engineering: Treatment, Disposal, Reuse. Second Edition. McGraw Hill Book Company, New York, NY.
Methanol Powered Vehicles. Web address: http://www.energy.ca.gov/afvs/m85/index.html
Methanol Price and Supply. 1995. Alternative Fuels Brief Newsletter. Vol.3, No. 3. Web address: http://www.energy.ca.gov/afvs/altfuelbriefs.
Methanol. 1998. Web Address: http://www.embs.com/cr/alc/alc6.html
Methanol. 1998. Prices, Outlook, Producers as of 1997. Chemical Week. Web address: http://www.chemweek.com. Viewed October, 1998.
Mormile, M. R., S. Liu and J. M. Suflita. 1994. Anaerobic biodegradation of gasoline oxygenates: Extrapolation of information to multiple sites and redox conditions. Environmental Science and Technology 28(9):1727-1732.
Nanninga, H. J. and Gottschal, J. C. 1986. Isolation of a sulfate-reducing bacterium grown with methanol. FEMS Microbiology Ecology 38:125-130.
National Research Council. 1993. In Situ Bioremediation: When Does it Work? National Academy Press, Washington, DC.
Novak, J. T., Goldsmith, C. D., Benoit, R. E. and O’Brien, J. H. 1985. Biodegradation of methanol and tertiary butyl alcohol in subsurface systems. Water Sci. Technol. 17:71-85.
Nowell, Gregory P. 1998. The Promise of Methanol Fuel Cell Vehicles. American Methanol Institute. Washington, D.C.
Oremland, R. S., Marsh, L. M. and Polcin, S. 1982. Methane production and simultaneous sulphate reduction in anoxic, salt marsh sediments. Nature 296:143-145
Pelczar Jr., M. J., Chan, E. C. S. and Krieg, N. R. 1986. Microbiology, Fifth Edition. McGraw-Hill Book Company, New York, NY.
Technical Memorandum MALCOLM PIRNIE, INC. 55
Perry, Robert H., Don W. Green, and James O. Maloney. Perry’s Chemical Engineer’s Handbook. McGraw-Hill Chemical Engineering Series, Six Edition. 1984.
Poulsen, M., L. Lemon, and J. F. Barker. 1992. Dissolution of monoaromatic hydrocarbons into groundwater from gasoline-oxygenate mixtures. Environmental Science and Technology 26(12):2483-2489.
Prescott, L. M., Harley, J. P. and Klein, D. A. 1996. Microbiology, 3rd edition. Wm. C. Brown Publishers, Dubuque, IA.
Puhakka, J. A., Ferguson, J. F., Benjamin, M. M., Salkinoja-Salonen, M. 1989. Systematic and Applied Microbiology 11:202-206.
Rathbun, R. E. 1998. Transport, Behavior, and Fate of Volatile Organic Compounds in Streams. U.S. Geological Survey Professional Paper 1589. pp. 49-58.
Reese, E; Kimbrough, RD. 1993. Acute Toxicity of Gasoline and Some Additives. Environmental Health Perspectives. Vol. 101, Supplement 6, pp. 115-131.
Reko, Pete. 1998. Calgon Carbon Corporation. Telephone and Fascimile communication regarding the feasibility of Advanced Oxidation technology for methanol removal in September, 1998.
Risk Science Program (RSP). December 1994. Draft Final Report: Intermedia Transfer Factors for Contaminants found at Hazardous Waste Sites Benzene. Office of Scientific Affairs at the California Environmental Protection Agency Department of Toxic Substances Control.
Roberts, P.V. 1995. Personal Communication.
Salanitro, J. P. 1993. The role of bioattenuation in the management of aromatic hydrocarbon plumes in aquifers. Ground Water Monitoring and Remediation 13:150-161.
Schwarzenbach, R. P., Gschwend, P. M. and Imboden, D. M. 1993. Environmental Organic Chemistry. John Wiley & Sons, Inc., New York, NY.
Scott, Jim. August, 1997. CU-Boulder, Colorado Town Wrapping Up Pilot Drinking Water Treatment Project. <http://www.eurekalert.org/releases/h2o-treatment.html> (October, 1998).
Short, Glyn D. 1991. Methanol in Gasoline and Diesel Engines-Environmental Considerations. ICI Americas, Inc.
Short, Glyn D. and Antonio, Laura C. 1989. Methanol in Gasoline and Deisel Engines-Environmental Considerations. ICI Americas, Inc. Wilmington, DE.
Smeraldi, C., Berardi, E. and Porro, D. 1994. Monitoring of peroxisome induction and degradation by flow cytometric analysis of Hansenula polymorpha cells grown in
Technical Memorandum MALCOLM PIRNIE, INC. 56
methanol and glucose media: Cell volume, refractive index and FITC retention. Microbiology 140:3161-3166.
Streit, B. 1994. Bioaccumulation processes of organic pollutants by animals of the River Rhine. Water Science and Technology 29(3):145-147.
Suflita, J. M. and M. R. Mormile. 1993. Anaerobic biodegradation of known and potential gasoline oxygenates in the terrestrial subsurface. Environmental Science and Technology 27(6): 976-978.
Suflita, J. M. and Sewell, G. W. 1991. Anaerobic biotransformation of contaminants in the subsurface. EPA/600/M-90/024.
The Merck Index, Eleventh Edition. 1989. Merck and Co., Inc., Rahway, NJ.
Thibodeaux, Louis J. 1996. Environmental Chemodynamics: Movement of Chemicals in Air, Water, and Soil. Environmental Chemodynamics, Second Edition. Wiley Interscience.
Tiedje, J. M. 1993. Bioremediation from an ecological perspective. In In Situ Bioremediation: When Does it Work? National Research Council, National Academy Press, Washington, DC.
United States Department of Energy. August, 1990. Assessment of Costs and Benefits of Flexible and Alternative Fuel Use in the US Transportation Sector. Technical Report No. 4 Vehicle and Fuel Distribution Requirements.
United States Department of Energy. December, 1990. Assessment of Costs and Benefits of Flexible and Alternative Fuel Use in the US Transportation Sector. Technical Report No. 7: Costs of Methanol Production from Biomass.
United States Department of Energy. October, 1991. Assessment of Costs and Benefits of Flexible and Alternative Fuel Use in the US Transportation Sector. Technical Report No. 7: Environmental, Health, and Safety Concerns.
United States Department of Transportation. 1985. The Transport of Methanol By Pipeline. Material Transportation Bureau - Research and Special Programs Administration. Washington, D.C.
United States Department of Transportation. 1990. Clean Air Program. Methanol Use Training Manual. Report No. UMTA-OH-06-0056-90-1.
United States Environmental Protection Agency. 1980. Ambient Water Quality Criteria for Benzene. EPA 440580018.
United States Environmental Protection Agency. Office of Pollution Prevention and Toxics (USEPA OPPT). 1994. Chemical Summary for Methanol. Report No. EPA 749-F-94-013a.
Technical Memorandum MALCOLM PIRNIE, INC. 57
United States Environmental Protection Agency. Office of Air and Radiation, Office of Mobile Sources. 1993. Regulatory Impact Analysis: Clean Fuel Fleet Program. Report No. 420-R-93-014.
United States Environmental Protection Agency. Office of Mobile Sources. 1994c. Methanol Fuels and Fire Safety. Report No. EPA 400-F-92-010.
Upton, J., Fergusson, A., and S.Savage. 1993. Denitrification of Wastewater: Operating Experiences in the US and Pilot-Plant Studies in the UK. J. IWEM, pp. 1 - 11.
Verschueren, K. 1983. Handbook of Environmental Data on Organic Chemicals. Van Nostrand Reinhold Company, New York, NY.
Ward, D. M. and Winfrey, M. R. 1985. Interactions between methanogenic and sulfate-reducing bacteria in sediments, vol. 3, p. 141-179. In Advances in Aquatic Microbiology, Academic Press Inc., London.
Wimer W., Russell J., and Kaplan H. 1983. Alcohols Toxicology, Noyes Data Corporation, New
Jersey
Wood, A., Bouchard, D., Brusseau, M. and Rao, P. 1990. Cosolvent effects on sorption and mobility of organic contaminants in soils. Chemosphere 21(4-5):575-587.
Yeh, C. K. 1992. Degradation of gasoline oxygenates in the subsurface. Thesis, Virginia Polytechnic Institute and State University.
Yutaka, Takada and Ichiro Kasamatsu. 1998. Study on Dyeing of Methanol for Automotive Fuel. Organization for The Commercialization of Low-Emission Vehicles (LEVO). YPC Building 3F, 2-14-8 Yotsuya, Shinjuku-ku, Tokyo 160-0004 Japan.
Zogorski, J. S., A. Morduchowitz, A. L. Baehr, B. J. Bauman. D. L. Conrad, R. T. Drew, N. I. Korte, W. W. Lapham, J. F. Pankow and E. R. Washington. 1997. Fuel Oxygenates and Water Quality. Report prepared for the Interagency Assessment of Oxygenated Fuel, National Science and Technology Council, Executive Office of the President, Washington, DC.