Embed Size (px)
Citation preview
February 2018
Evaluation of the Initiative to Reduce Avoidable Hospitalizations among Nursing
Facility Residents—Payment Reform First Annual Report
Prepared for Jean Gaines
Centers for Medicare & Medicaid Services Center for Medicare and Medicaid Innovation
Mail Stop WB-0605 7205 Windsor Blvd.
Baltimore, MD 21244
Prepared by
Melvin Ingber Zhanlian Feng
Galina Khatutsky Lawren Bercaw
Sarah Arnold Lanre Adisa
Nicole Coomer Emily Craven
Ira Dave Terry Eng
Abigail Ferrell Mildred Gapara
Caroline B. Husick Jessica Jones
Yevgeniya Kaganova
Molly Knowles Cleo Kordomenos
Qinghua Li Catherine Ormond
Kristie Porter Chris Saur
Micah Segelman Anushi Shah Denise Tyler
Alison Vadnais Emily Vreeland
Helen Walsh Joyce M. Wang
Nan Tracy Zheng Patti Zoromski
RTI International 3040 E. Cornwallis Road
Research Triangle Park, NC 27709
RTI Project Number 0214448.001.005.000
EVALUATION OF THE INITIATIVE TO REDUCE AVOIDABLE HOSPITALIZATIONS AMONG NURSING FACILITY RESIDENTS—PAYMENT REFORM
By Melvin Ingber, Zhanlian Feng, Galina Khatutsky, Lawren Bercaw, Sarah Arnold, Lanre Adisa, Nicole Coomer, Emily Craven, Ira Dave, Terry Eng, Abigail Ferrell, Mildred Gapara, Caroline B. Husick, Jessica Jones, Yevgeniya Kaganova, Molly Knowles, Cleo Kordomenos,
Qinghua Li, Catherine Ormond, Kristie Porter, Chris Saur, Micah Segelman, Anushi Shah, Denise Tyler, Alison Vadnais, Emily Vreeland, Helen Walsh, Joyce M. Wang, Nan Tracy
Zheng, Patti Zoromski
Contracting Officer Representative: Jean Gaines, PhD, RN
RTI International
CMS Contract No. HHSM-500-2014-00037I
February 2018
This project was funded by the Centers for Medicare & Medicaid Services under contract no. 500-2014-00037I. The statements contained in this report are solely those of the authors and do not necessarily reflect the views or policies of the Centers for Medicare & Medicaid Services. RTI assumes responsibility for the accuracy and completeness of the information contained in this report.
iii
ACKNOWLEDGMENTS
The authors gratefully acknowledge the support and contributions of consultants, David Grabowski, from Harvard Medical School, Mary D. Naylor, from the University of Pennsylvania, and Debra Saliba from the RAND Corporation—for their advice and contributions. We also gratefully acknowledge Susan Mitchell, Michelle Dougherty, and Roberta Constantine for assistance with updating the ICD-10 codes associated with potentially avoidable hospitalizations, Michelle Back and Kara O’Halloran for editing, and Terry Hall and Debbie Bond for document preparation.

iv
[This page intentionally left blank.]
v
CONTENTS
Executive Summary ...................................................................................................................ES-1
Section 1 Overview ..........................................................................................................................1 1.1 Introduction ....................................................................................................................1 1.2 Description of the Initiative to Reduce Avoidable Hospitalizations among
Nursing Facility Residents—Payment Reform ..............................................................3 1.2.1 Timeline .............................................................................................................3 1.2.2 Payment Reform Definitions and Procedures ....................................................3 1.2.3 Background on NFI 1.......................................................................................10
1.3 Overview of Evaluation Methods ................................................................................17
Section 2 Data Sources ..................................................................................................................19 2.1 Data for Quantitative Analyses ....................................................................................19
2.1.1 Resident Assessment Data—Minimum Data Set 3.0 ......................................19 2.1.2 Medicare Claims and Eligibility ......................................................................20 2.1.3 Nursing Facility Data .......................................................................................20 2.1.4 Medicaid Data ..................................................................................................21 2.1.5 Medicare Advantage Institutional Special Needs Plans Enrollee Data
and Encounter Data ..........................................................................................21 2.2 Challenges in Quantitative Data Analysis ...................................................................22
2.2.1 Medicaid Data ..................................................................................................22 2.2.2 MA Encounter/I-SNP Data ..............................................................................22 2.2.3 Confounding Factors ........................................................................................22
Section 3 Initiative Eligibility ........................................................................................................25 3.1 Resident Eligibility for NFI 2 ......................................................................................25 3.2 Identification of Initiative-Eligible Residents and Initiative-Related Exposure
Periods..........................................................................................................................25
Section 4 Comparison Group Selection .........................................................................................29 4.1 Introduction ..................................................................................................................30 4.2 Process of Comparison Group Selection and Statistical Modeling .............................30
4.2.1 Selection of Initial Candidate Comparison Facilities ......................................30 4.2.2 Propensity Score Models .................................................................................33
4.3 State-Specific Results ..................................................................................................35 4.3.1 Alabama ...........................................................................................................36 4.3.2 Indiana..............................................................................................................44 4.3.3 Missouri ...........................................................................................................52 4.3.4 Nevada and Colorado .......................................................................................60
vi
4.3.5 New York .........................................................................................................73 4.3.6 Pennsylvania ....................................................................................................81
4.4 Baseline Hospitalization Rate Trending Analysis .......................................................88 4.5 Resident-level Characteristics ......................................................................................97
Section 5 NFI 2 Outcomes Studied ................................................................................................99 5.1 Outcome Measures.......................................................................................................99 5.2 Definition of Potentially Avoidable Hospitalizations and Identification of Six
Qualifying Conditions ................................................................................................101 5.2.1 Updating the Overall List of ICD-10 Codes for Potentially Avoidable
Hospitalization Conditions.............................................................................101 5.2.2 Identifying Subsets of ICD-10 Codes for the Six Qualifying
Conditions ......................................................................................................102
Section 6 Descriptive Statistics: Base Year .................................................................................105 6.1 Descriptive Analysis Results: Base Year (FY 2016: October 2015–September
2016) ..........................................................................................................................105 6.1.1 Key Medicare Utilization Outcomes (Percentage with Any Utilization
and Number of Stays/Visits per 1,000 Person-days) .....................................105 6.1.2 Key Medicare Expenditure Outcomes (Average Expenditures per
Beneficiary)....................................................................................................121
Section 7 Overview of the Qualitative Data Collection Activities ..............................................129 7.1 Site Visits and Telephone Interviews ........................................................................130 7.2 Web-based Survey of Participating Nursing Facilities ..............................................130 7.3 Key Stakeholder Telephone Interviews .....................................................................130 7.4 Sharing Collaborative ................................................................................................131 7.5 Qualitative Data Collection Activities Accomplished by July 21, 2017 ...................131
7.5.1 Site Visits .......................................................................................................131 7.5.2 Telephone Interviews .....................................................................................132 7.5.3 Preliminary Findings from Telephone Interviews .........................................133 7.5.4 Key Stakeholder Interviews ...........................................................................139 7.5.5 Web-based Survey of Participating Nursing Facilities ..................................140
7.6 Next Steps ..................................................................................................................141
Section 8 Summary ......................................................................................................................143 8.1 Quantitative Data Analysis ........................................................................................143 8.2 Qualitative Data Collection........................................................................................144 8.3 Areas of Focus for the Upcoming Analyses and Data Collection .............................145
References ....................................................................................................................................147
vii
List of Figures 3-1 A hypothetical resident’s nursing facility use and the Initiative-related exposure ........... 27 4-1 Propensity score distribution of ECCP and candidate comparison facilities,
Alabama, Group A ............................................................................................................ 36 4-2 Propensity score distribution of ECCP and matched comparison facilities,
Alabama, Group A ........................................................................................................... 37 4-3 Geographic location of ECCP and matched comparison facilities by county,
Alabama, Group A ............................................................................................................ 39 4-4 Propensity score distribution of ECCP and candidate comparison facilities,
Alabama, Group B ............................................................................................................ 40 4-5 Propensity score distribution of ECCP and matched comparison facilities,
Alabama, Group B ........................................................................................................... 41 4-6 Geographic location of ECCP and matched comparison facilities by county,
Alabama, Group B ............................................................................................................ 43 4-7 Propensity score distribution of ECCP and candidate comparison facilities,
Indiana, Group A ............................................................................................................. 44 4-8 Propensity score distribution of ECCP and matched comparison facilities,
Indiana, Group A ............................................................................................................. 45 4-9 Geographic location of ECCP and matched comparison facilities by county,
Indiana, Group A .............................................................................................................. 47 4-10 Propensity score distribution of ECCP and candidate comparison facilities,
Indiana, Group B .............................................................................................................. 48 4-11 Propensity score distribution of ECCP and matched comparison facilities,
Indiana, Group B .............................................................................................................. 49 4-12 Geographic location of ECCP and matched comparison facilities by county,
Indiana, Group B ............................................................................................................... 51 4-13 Propensity score distribution of ECCP and candidate comparison facilities,
Missouri, Group A ............................................................................................................ 52 4-14 Propensity score distribution of ECCP and matched comparison facilities,
Missouri, Group A ........................................................................................................... 53 4-15 Geographic location of ECCP and matched comparison facilities by county,
Missouri, Group A ............................................................................................................ 55 4-16 Propensity score distribution of ECCP and candidate comparison facilities,
Missouri, Group B ............................................................................................................ 56 4-17 Propensity score distribution of ECCP and matched comparison facilities,
Missouri, Group B ........................................................................................................... 57 4-18 Geographic location of ECCP and matched comparison facilities by county,
Missouri, Group B ............................................................................................................ 59 4-19 Propensity score distribution of ECCP and candidate comparison facilities,
Colorado, Group A............................................................................................................ 61 4-20 Propensity score distribution of ECCP and matched comparison facilities,
Colorado, Group A............................................................................................................ 62 4-21 Geographic location of ECCP facilities by county, Colorado, Group A .......................... 65 4-22 Geographic location of matched comparison facilities by county, Texas, Group A ........ 66
viii
4-23 Propensity score distribution of ECCP and candidate comparison facilities, Nevada, Group B ............................................................................................................. 67
4-24 Propensity score distribution of ECCP and matched comparison facilities, Nevada, Group B .............................................................................................................. 68
4-25 Geographic location of ECCP facilities by county, Nevada, Group B ............................. 71 4-26 Geographic location of matched comparison facilities by county, Texas, Group B ........ 72 4-27 Propensity score distribution of ECCP and candidate comparison facilities, New
York, Group A .................................................................................................................. 73 4-28 Propensity score distribution of ECCP and matched comparison facilities, New
York, Group A .................................................................................................................. 74 4-29 Geographic location of ECCP and matched comparison facilities by county, New
York, Group A .................................................................................................................. 76 4-30 Propensity score distribution of ECCP and candidate comparison facilities, New
York, Group B .................................................................................................................. 77 4-31 Propensity score distribution of ECCP and matched comparison facilities, New
York, Group B .................................................................................................................. 78 4-32 Geographic location of ECCP and matched comparison facilities by county, New
York, Group B .................................................................................................................. 80 4-33 Propensity score distribution of ECCP and candidate comparison facilities,
Pennsylvania, Group A ..................................................................................................... 81 4-34 Propensity score distribution of ECCP and matched comparison facilities,
Pennsylvania, Group A ..................................................................................................... 82 4-35 Geographic location of ECCP and matched comparison facilities by county,
Pennsylvania, Group A ..................................................................................................... 84 4-36 Propensity score distribution of ECCP and candidate comparison facilities,
Pennsylvania, Group B ..................................................................................................... 85 4-37 Propensity score distribution of ECCP and matched comparison facilities,
Pennsylvania, Group B ..................................................................................................... 86 4-38 Geographic location of ECCP and matched comparison facilities by county,
Pennsylvania, Group B ..................................................................................................... 88 4-39 FY2014 – FY2016 all-cause hospitalization rate: Number of events per 1,000
person-days, Group A, all states ....................................................................................... 90 4-40 FY2014 – FY2016 potentially avoidable hospitalization rate: Number of events
per 1,000 person-days, Group A, all states ...................................................................... 90 4-41 FY 2014 – FY 2016 all-cause hospitalization rate: Number of events per 1,000
person-days, Group B, all states ....................................................................................... 90 4-42 FY2014 – FY2016 potentially avoidable hospitalization rate: Number of events
per 1,000 person-days, Group B, all states ...................................................................... 90 4-43 FY 2014 – FY 2016 all-cause hospitalization rate: Number of events per 1,000
person-days, Group A, Alabama ....................................................................................... 91 4-44 FY2014 – FY2016 potentially avoidable hospitalization rate: Number of events
per 1,000 person-days, Group A, Alabama....................................................................... 91 4-45 FY 2014 – FY 2016 all-cause hospitalization rate: Number of events per 1,000
person-days, Group B, Alabama ....................................................................................... 91 4-46 FY2014 – FY2016 potentially avoidable hospitalization rate: Number of events
per 1,000 person-days, Group B, Alabama ....................................................................... 91
ix
4-47 FY2014 – FY2016 all-cause hospitalization rate: Number of events per 1,000person-days, Group A, Indiana ......................................................................................... 92
4-48 FY2014 – FY2016 potentially avoidable hospitalization rate: Number of eventsper 1,000 person-days, Group A, Indiana ......................................................................... 92
4-49 FY 2014 – FY 2016 all-cause hospitalization rate: Number of events per 1,000person-days, Group B, Indiana ......................................................................................... 92
4-50 FY2014 – FY2016 potentially avoidable hospitalization rate: Number of eventsper 1,000 person-days, Group B, Indiana ......................................................................... 92
4-51 FY2014 – FY2016 all-cause hospitalization rate: Number of events per 1,000person-days, Group A, Missouri ....................................................................................... 93
4-52 FY2014 – FY2016 potentially avoidable hospitalization rate: Number of eventsper 1,000 person-days, Group A, Missouri ....................................................................... 93
4-53 FY 2014 – FY 2016 all-cause hospitalization rate: Number of events per 1,000person-days, Group B, Missouri ....................................................................................... 93
4-54 FY2014 – FY2016 potentially avoidable hospitalization rate: Number of eventsper 1,000 person-days, Group B, Missouri ....................................................................... 93
4-55 FY2014 – FY2016 all-cause hospitalization rate: Number of events per 1,000person-days, Group A, Colorado ...................................................................................... 94
4-56 FY2014 – FY2016 potentially avoidable hospitalization rate: Number of eventsper 1,000 person-days, Group A, Colorado ...................................................................... 94
4-57 FY 2014 – FY 2016 all-cause hospitalization rate: Number of events per 1,000person-days, Group B, Nevada ......................................................................................... 94
4-58 FY2014 – FY2016 potentially avoidable hospitalization rate: Number of eventsper 1,000 person-days, Group B, Nevada ......................................................................... 94
4-59 FY2014 – FY2016 all-cause hospitalization rate: Number of events per 1,000person-days, Group A, New York .................................................................................... 95
4-60 FY2014 – FY2016 potentially avoidable hospitalization rate: Number of eventsper 1,000 person-days, Group A, New York .................................................................... 95
4-61 FY 2014 – FY 2016 all-cause hospitalization rate: Number of events per 1,000person-days, Group B, New York..................................................................................... 95
4-62 FY2014 – FY2016 potentially avoidable hospitalization rate: Number of eventsper 1,000 person-days, Group B, New York .................................................................... 95
4-63 FY2014 – FY2016 all-cause hospitalization rate: Number of events per 1,000person-days, Group A, Pennsylvania ................................................................................ 96
4-64 FY2014 – FY2016 potentially avoidable hospitalization rate: Number of eventsper 1,000 person-days, Group A, Pennsylvania ................................................................ 96
4-65 FY 2014 – FY 2016 all-cause hospitalization rate: Number of events per 1,000person-days, Group B, Pennsylvania ................................................................................ 96
4-66 FY2014 – FY2016 potentially avoidable hospitalization rate: Number of eventsper 1,000 person-days, Group B, Pennsylvania ................................................................ 96
x
List of Tables ES-1 Medicare utilization: Annual percentage of residents who used each type of
service in FY 2016 ....................................................................................................... ES-5 ES-2 Medicare expenditures (in dollars) per beneficiary in FY 2016: Means (standard
deviations) ..................................................................................................................... ES-7 1-1 Comparison of the two intervention arms ........................................................................... 2 1-2 List of new billing codes for NFI 2 ..................................................................................... 4 1-3 Clinical criteria for the six qualifying conditions ............................................................... 6 1-4 Criteria for practitioner payments ....................................................................................... 9 1-5 AQAF NFI 1 model overview (as of September 2016) .................................................... 11 1-6 OPTIMISTIC NFI 1 model overview (as of September 2016) ........................................ 12 1-7 MOQI NFI 1 model overview (as of September 2016) .................................................... 13 1-8 ATOP NFI 1 model overview (as of September 2016) .................................................... 14 1-9 NY-RAH NFI 1 model overview (as of September 2016) ............................................... 15 1-10 UPMC-RAVEN NFI 1 model overview (as of September 2016) .................................... 16 3-1 Comparison of NFI 2 and NFI 1 resident eligibility criteria ............................................ 25 4-1 Criteria for selecting initial candidate comparison nursing facilities ............................... 32 4-2 Characteristics of ECCP facilities, candidate comparison facilities, and matched
comparison facilities, Alabama, Group A......................................................................... 38 4-3 Characteristics of ECCP facilities, candidate comparison facilities, and matched
comparison facilities, Alabama, Group B ......................................................................... 42 4-4 Characteristics of ECCP facilities, candidate comparison facilities, and matched
comparison facilities, Indiana, Group A ........................................................................... 46 4-5 Characteristics of ECCP facilities, candidate comparison facilities, and matched
comparison facilities, Indiana, Group B ........................................................................... 50 4-6 Characteristics of ECCP facilities, candidate comparison facilities, and matched
comparison facilities, Missouri, Group A ......................................................................... 54 4-7 Characteristics of ECCP facilities, candidate comparison facilities, and matched
comparison facilities, Missouri, Group B ......................................................................... 58 4-8 Characteristics of ECCP facilities, candidate comparison facilities, and matched
comparison facilities, uncentered, Colorado, Group A ..................................................... 63 4-9 Characteristics of ECCP facilities, candidate comparison facilities, and matched
comparison facilities, centered, Colorado, Group A......................................................... 64 4-10 Characteristics of ECCP facilities, candidate comparison facilities, and matched
comparison facilities, uncentered, Nevada, Group B ....................................................... 69 4-11 Characteristics of ECCP facilities, candidate comparison facilities, and matched
comparison facilities, centered, Nevada, Group B ........................................................... 70 4-12 Characteristics of ECCP facilities, candidate comparison facilities, and matched
comparison facilities, New York, Group A ...................................................................... 75 4-13 Characteristics of ECCP facilities, candidate comparison facilities, and matched
comparison facilities, New York, Group B ...................................................................... 79 4-14 Characteristics of ECCP facilities, candidate comparison facilities, and matched
comparison facilities, Pennsylvania, Group A .................................................................. 83
xi
4-15 Characteristics of ECCP facilities, candidate comparison facilities, and matchedcomparison facilities, Pennsylvania, Group B .................................................................. 87
6-1 Medicare utilization: Annual percentage of residents who used each type ofservice in FY 2016, all states .......................................................................................... 106
6-2 Medicare utilization: Annual percentage of residents who used each type ofservice in FY 2016, Alabama ......................................................................................... 107
6-3 Medicare utilization: Annual percentage of residents who used each type ofservice in FY 2016, Indiana ............................................................................................ 108
6-4 Medicare utilization: Annual percentage of residents who used each type ofservice in FY 2016, Missouri .......................................................................................... 109
6-5 Medicare utilization: Annual percentage of residents who used each type ofservice in FY 2016, Nevada, Colorado, and Texas ........................................................ 110
6-6 Medicare utilization: Annual percentage of residents who used each type ofservice in FY 2016, New York ....................................................................................... 111
6-7 Medicare utilization: Annual percentage of residents who used each type ofservice in FY 2016, Pennsylvania ................................................................................... 112
6-8 Medicare utilization rate: Number of events per 1,000 person-days in FY 2016, allstates ................................................................................................................................ 114
6-9 Medicare utilization rate: Number of events per 1,000 person-days in FY 2016,Alabama .......................................................................................................................... 115
6-10 Medicare utilization rate: Number of events per 1,000 person-days in FY 2016,Indiana............................................................................................................................. 116
6-11 Medicare utilization rate: Number of events per 1,000 person-days in FY 2016,Missouri .......................................................................................................................... 117
6-12 Medicare utilization rate: Number of events per 1,000 person-days in FY 2016,Nevada, Colorado, and Texas ......................................................................................... 118
6-13 Medicare utilization rate: Number of events per 1,000 person-days in FY 2016,New York ........................................................................................................................ 119
6-14 Medicare utilization rate: Number of events per 1,000 person-days in FY 2016,Pennsylvania ................................................................................................................... 120
6-15 Medicare expenditures (in dollars) per beneficiary in FY 2016: Means (standarddeviations), all states ....................................................................................................... 122
6-16 Medicare expenditures (in dollars) per beneficiary in FY 2016: Means (standarddeviations), Alabama ...................................................................................................... 123
6-17 Medicare expenditures (in dollars) per beneficiary in FY 2016: Means (standarddeviations), Indiana ......................................................................................................... 124
6-18 Medicare expenditures (in dollars) per beneficiary in FY 2016: Means (standarddeviations), Missouri....................................................................................................... 125
6-19 Medicare expenditures (in dollars) per beneficiary in FY 2016: Means (standarddeviations), Nevada, Colorado, and Texas ..................................................................... 126
6-20 Medicare expenditures (in dollars) per beneficiary in FY 2016: Means (standarddeviations), New York .................................................................................................... 127
6-21 Medicare expenditures (in dollars) per beneficiary in FY 2016: Means (standarddeviations), Pennsylvania ............................................................................................... 128
xii
7-1 RTI qualitative data schedule for NFI 2 Years 1-4 ......................................................... 129 7-2 Telephone interview activities in NFI 2, Year 1 ............................................................. 133 7-3 Telephone interview summary findings for NFI 2, Year 1: Facility staff buy-in
and implementation ......................................................................................................... 134 7-4 Definitions for rating facility buy-in ............................................................................... 135 7-5 Telephone interview detailed findings by domain, NFI 2 Year 1: Initiative
implementation ............................................................................................................... 135
ES-1
EXECUTIVE SUMMARY
E.1 Overview of Initiative to Reduce Avoidable Hospitalizations among Nursing Facility Residents—Payment Reform
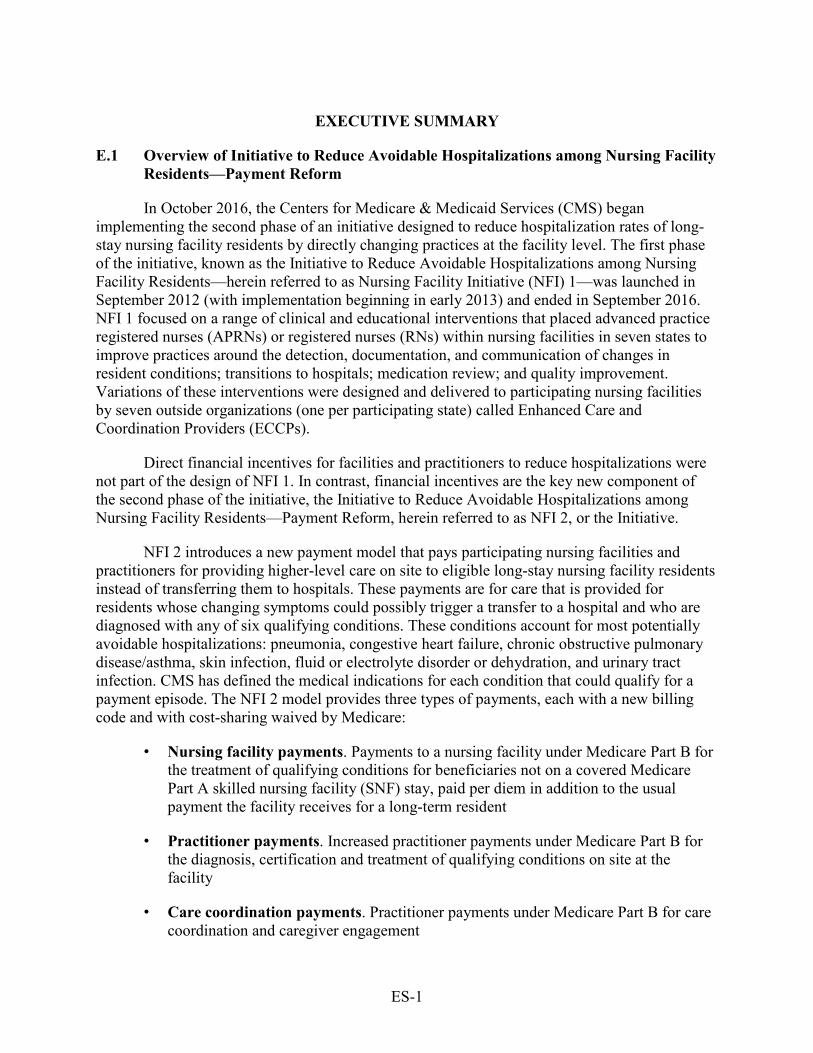
In October 2016, the Centers for Medicare & Medicaid Services (CMS) began implementing the second phase of an initiative designed to reduce hospitalization rates of long-stay nursing facility residents by directly changing practices at the facility level. The first phase of the initiative, known as the Initiative to Reduce Avoidable Hospitalizations among Nursing Facility Residents—herein referred to as Nursing Facility Initiative (NFI) 1—was launched in September 2012 (with implementation beginning in early 2013) and ended in September 2016. NFI 1 focused on a range of clinical and educational interventions that placed advanced practice registered nurses (APRNs) or registered nurses (RNs) within nursing facilities in seven states to improve practices around the detection, documentation, and communication of changes in resident conditions; transitions to hospitals; medication review; and quality improvement. Variations of these interventions were designed and delivered to participating nursing facilities by seven outside organizations (one per participating state) called Enhanced Care and Coordination Providers (ECCPs).
Direct financial incentives for facilities and practitioners to reduce hospitalizations were not part of the design of NFI 1. In contrast, financial incentives are the key new component of the second phase of the initiative, the Initiative to Reduce Avoidable Hospitalizations among Nursing Facility Residents—Payment Reform, herein referred to as NFI 2, or the Initiative.
NFI 2 introduces a new payment model that pays participating nursing facilities and practitioners for providing higher-level care on site to eligible long-stay nursing facility residents instead of transferring them to hospitals. These payments are for care that is provided for residents whose changing symptoms could possibly trigger a transfer to a hospital and who are diagnosed with any of six qualifying conditions. These conditions account for most potentially avoidable hospitalizations: pneumonia, congestive heart failure, chronic obstructive pulmonary disease/asthma, skin infection, fluid or electrolyte disorder or dehydration, and urinary tract infection. CMS has defined the medical indications for each condition that could qualify for a payment episode. The NFI 2 model provides three types of payments, each with a new billing code and with cost-sharing waived by Medicare:
• Nursing facility payments. Payments to a nursing facility under Medicare Part B for the treatment of qualifying conditions for beneficiaries not on a covered Medicare Part A skilled nursing facility (SNF) stay, paid per diem in addition to the usual payment the facility receives for a long-term resident
• Practitioner payments. Increased practitioner payments under Medicare Part B for the diagnosis, certification and treatment of qualifying conditions on site at the facility
• Care coordination payments. Practitioner payments under Medicare Part B for care coordination and caregiver engagement
ES-2
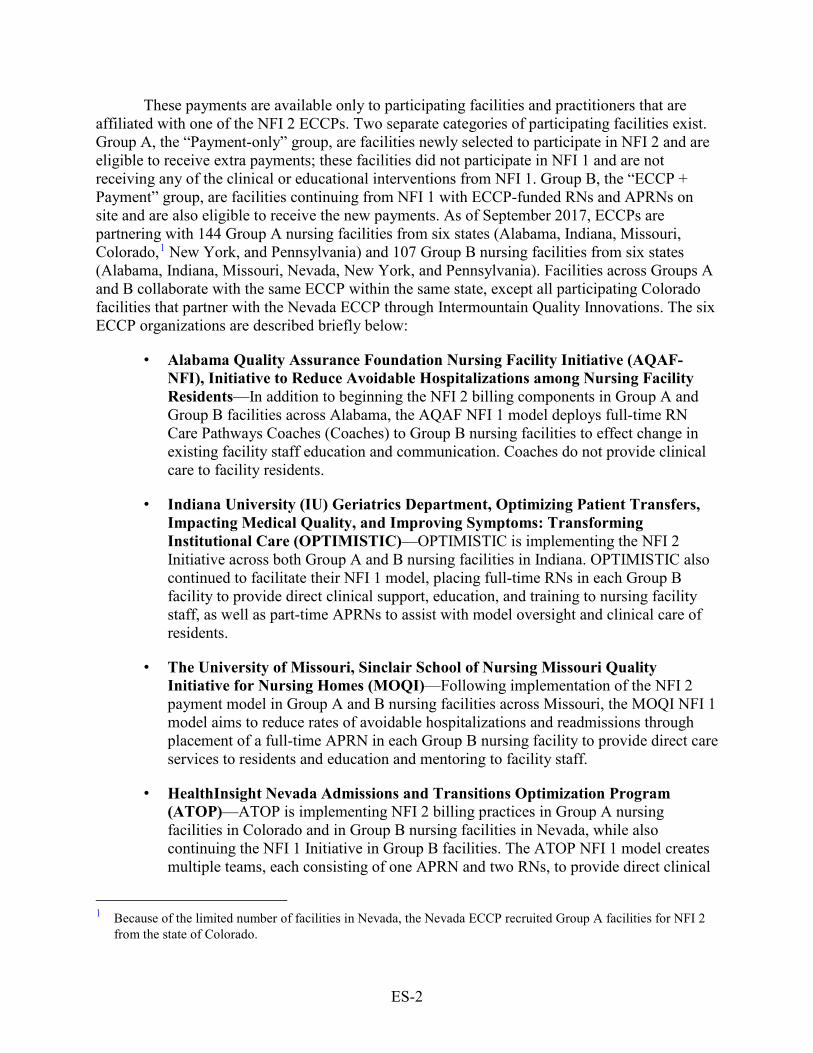
These payments are available only to participating facilities and practitioners that are affiliated with one of the NFI 2 ECCPs. Two separate categories of participating facilities exist. Group A, the “Payment-only” group, are facilities newly selected to participate in NFI 2 and are eligible to receive extra payments; these facilities did not participate in NFI 1 and are not receiving any of the clinical or educational interventions from NFI 1. Group B, the “ECCP + Payment” group, are facilities continuing from NFI 1 with ECCP-funded RNs and APRNs on site and are also eligible to receive the new payments. As of September 2017, ECCPs are partnering with 144 Group A nursing facilities from six states (Alabama, Indiana, Missouri, Colorado,1 New York, and Pennsylvania) and 107 Group B nursing facilities from six states (Alabama, Indiana, Missouri, Nevada, New York, and Pennsylvania). Facilities across Groups A and B collaborate with the same ECCP within the same state, except all participating Colorado facilities that partner with the Nevada ECCP through Intermountain Quality Innovations. The six ECCP organizations are described briefly below:
• Alabama Quality Assurance Foundation Nursing Facility Initiative (AQAF-NFI), Initiative to Reduce Avoidable Hospitalizations among Nursing Facility Residents—In addition to beginning the NFI 2 billing components in Group A and Group B facilities across Alabama, the AQAF NFI 1 model deploys full-time RN Care Pathways Coaches (Coaches) to Group B nursing facilities to effect change in existing facility staff education and communication. Coaches do not provide clinical care to facility residents.
• Indiana University (IU) Geriatrics Department, Optimizing Patient Transfers, Impacting Medical Quality, and Improving Symptoms: Transforming Institutional Care (OPTIMISTIC)—OPTIMISTIC is implementing the NFI 2 Initiative across both Group A and B nursing facilities in Indiana. OPTIMISTIC also continued to facilitate their NFI 1 model, placing full-time RNs in each Group B facility to provide direct clinical support, education, and training to nursing facility staff, as well as part-time APRNs to assist with model oversight and clinical care of residents.
• The University of Missouri, Sinclair School of Nursing Missouri Quality Initiative for Nursing Homes (MOQI)—Following implementation of the NFI 2 payment model in Group A and B nursing facilities across Missouri, the MOQI NFI 1 model aims to reduce rates of avoidable hospitalizations and readmissions through placement of a full-time APRN in each Group B nursing facility to provide direct care services to residents and education and mentoring to facility staff.
• HealthInsight Nevada Admissions and Transitions Optimization Program (ATOP)—ATOP is implementing NFI 2 billing practices in Group A nursing facilities in Colorado and in Group B nursing facilities in Nevada, while also continuing the NFI 1 Initiative in Group B facilities. The ATOP NFI 1 model creates multiple teams, each consisting of one APRN and two RNs, to provide direct clinical
1 Because of the limited number of facilities in Nevada, the Nevada ECCP recruited Group A facilities for NFI 2
from the state of Colorado.
ES-3
support to residents and education and training to facility staff across groups of four to five nursing facilities.
• New York Reducing Avoidable Hospitalizations (NY-RAH) Project of Greater New York Hospital Association (GNYHA) Foundation—NY-RAH is introducing the NFI 2 billing practices to participating Group A and Group B nursing facilities throughout New York. Additionally, NY-RAH maintains their NFI 1 Initiative, sending a full-time RN care coordinator (RNCC) to each Group B facility to act as a consultant and educator to facility staff and leadership. RNCCs do not provide any clinical care to residents.
• University of Pittsburgh Medical Center (UPMC) Community Provider Services Program to Reduce Avoidable Hospitalizations using Evidence-based Interventions for Nursing Facilities (UPMC-RAVEN)—For NFI 2, UPMC-RAVEN is initiating the payment model in Group A and Group B nursing facilities in Pennsylvania. UPMC-RAVEN leadership also continues to focus on NFI 1 components in Group B facilities, with full-time nurse practitioners and RNs to provide direct clinical care to residents and education and support to facility staff, as well as telemedicine.
E.2 Overview of Evaluation
The purpose of RTI’s analysis is to conduct an evaluation of NFI 2. Using a mix of qualitative and quantitative methods, RTI is assessing the effectiveness of the new payment model in (1) reducing avoidable hospitalizations among long-stay nursing facility residents, (2) improving other resident health outcomes, and (3) reducing overall health care spending (Medicare and Medicaid costs), without restricting access to care or choice of providers. We also describe any activities that enable or challenge the implementation in both Initiative groups. This first annual report on NFI 2 describes our work to date to address the following overarching questions:
• Does the intervention affect quality of care as evidenced by reduced rates of hospital transfers, including hospitalization, avoidable hospitalization, emergency department (ED) visits, avoidable ED visits, and observation stays, among long-stay nursing facility residents?
• Does the intervention affect additional quality of care and health outcome measures such as functional status and use of antipsychotic medications for long-stay nursing facility residents?
• Does the intervention reduce Medicare, Medicaid, and total costs?
The effect of the intervention is measured using outcomes of the interventions. We measure utilization and spending and estimate changes related to being in NFI 2 facilities relative to comparison group facilities. The eligible residents are determined in the same way in Group A, Group B, and respective comparison group facilities. All the outcomes are measured the same way in all groups. We use the information on the activities in the participating facilities to
ES-4
provide context to the quantitative findings, but we do not use that information to determine if favorable effects occurred.
E.3 Quantitative Analyses to Date
The major quantitative work done thus far and documented in this NFI 2 first annual report is the selection of separate comparison facilities for Group A and Group B intervention facilities for all ECCPs. We used multivariate propensity score modeling to select two comparison facilities for every ECCP facility in each group. For five of the six ECCPs, in Alabama, Indiana, Missouri, New York, and Pennsylvania, we selected comparison facilities for both Group A and Group B facilities within each state. The Nevada ECCP has Group A facilities operating in Colorado and Group B facilities in Nevada. Because of the limited number of nonparticipating facilities available within these two states, we selected comparison facilities for both the Nevada Group B facilities and Colorado Group A facilities from a different state, Texas, which has sufficient numbers of candidate nursing facilities that would meet the Initiative participation criteria for both groups. Texas is also close to Colorado and Nevada geographically.
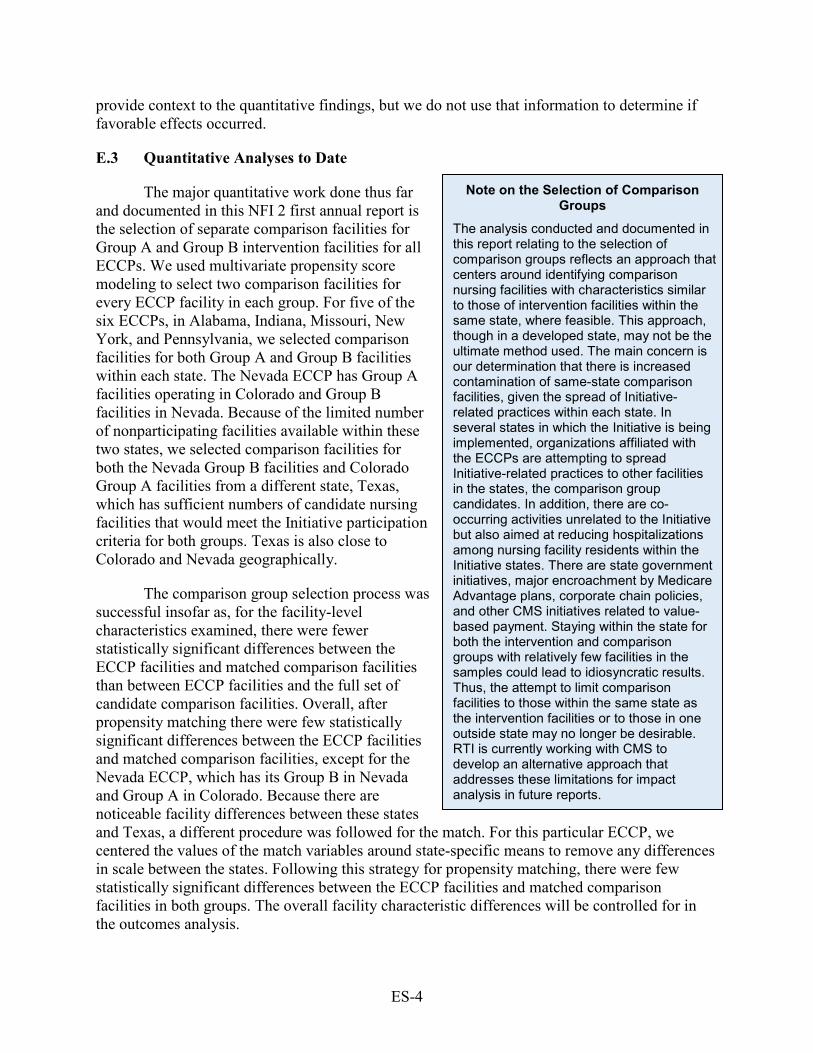
The comparison group selection process was successful insofar as, for the facility-level characteristics examined, there were fewer statistically significant differences between the ECCP facilities and matched comparison facilities than between ECCP facilities and the full set of candidate comparison facilities. Overall, after propensity matching there were few statistically significant differences between the ECCP facilities and matched comparison facilities, except for the Nevada ECCP, which has its Group B in Nevada and Group A in Colorado. Because there are noticeable facility differences between these states and Texas, a different procedure was followed for the match. For this particular ECCP, we centered the values of the match variables around state-specific means to remove any differences in scale between the states. Following this strategy for propensity matching, there were few statistically significant differences between the ECCP facilities and matched comparison facilities in both groups. The overall facility characteristic differences will be controlled for in the outcomes analysis.
Note on the Selection of Comparison Groups
The analysis conducted and documented in this report relating to the selection of comparison groups reflects an approach that centers around identifying comparison nursing facilities with characteristics similar to those of intervention facilities within the same state, where feasible. This approach, though in a developed state, may not be the ultimate method used. The main concern is our determination that there is increased contamination of same-state comparison facilities, given the spread of Initiative-related practices within each state. In several states in which the Initiative is being implemented, organizations affiliated with the ECCPs are attempting to spread Initiative-related practices to other facilities in the states, the comparison group candidates. In addition, there are co-occurring activities unrelated to the Initiative but also aimed at reducing hospitalizations among nursing facility residents within the Initiative states. There are state government initiatives, major encroachment by Medicare Advantage plans, corporate chain policies, and other CMS initiatives related to value-based payment. Staying within the state for both the intervention and comparison groups with relatively few facilities in the samples could lead to idiosyncratic results. Thus, the attempt to limit comparison facilities to those within the same state as the intervention facilities or to those in one outside state may no longer be desirable. RTI is currently working with CMS to develop an alternative approach that addresses these limitations for impact analysis in future reports.
ES-5
In addition to examining facility-level characteristics after propensity score matching, we reviewed resident-level characteristics of Groups A and B and their respective matched comparison groups during the base year, fiscal year (FY 2016). Overall, there are no major differences in the resident characteristics between the ECCP group and matched comparison group, both within each state and pooled across all states. We also compared rates of all-cause and potentially avoidable hospitalizations for FY 2014 to FY 2016, to examine the 3-year baseline trends before the implementation of NFI 2. In most cases, these rates were reasonably similar at each cross-section and parallel in trends between most ECCP and comparison groups.
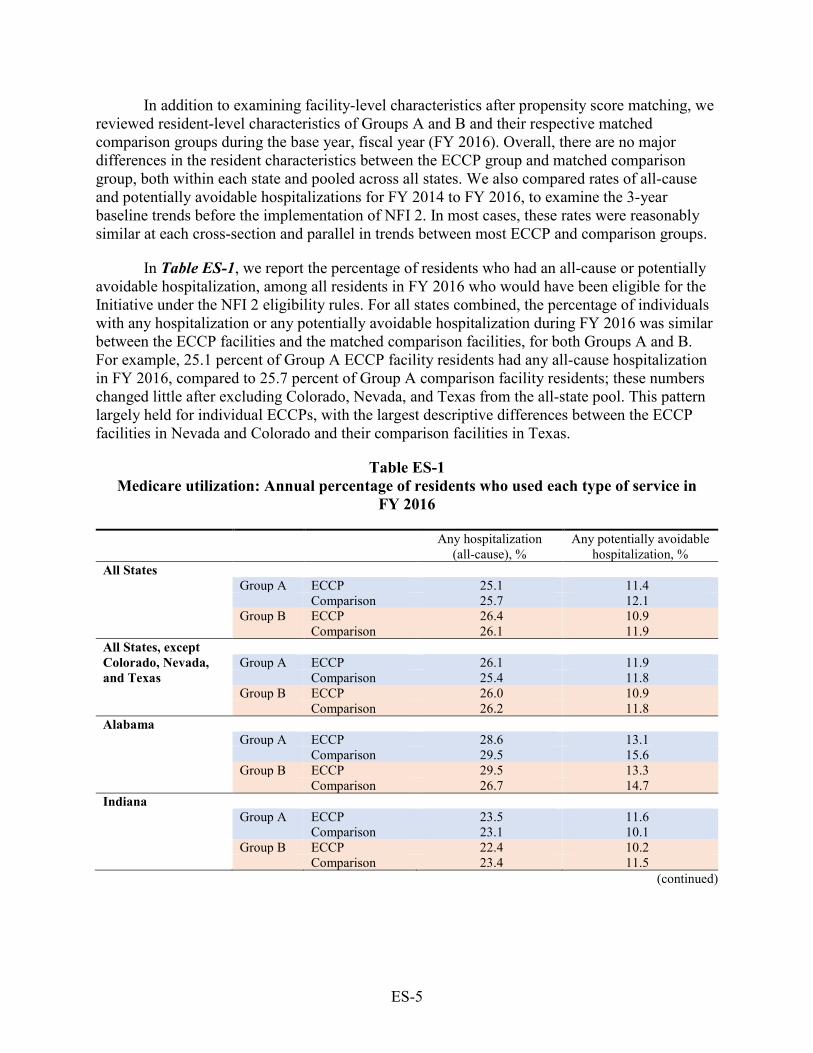
In Table ES-1, we report the percentage of residents who had an all-cause or potentially avoidable hospitalization, among all residents in FY 2016 who would have been eligible for the Initiative under the NFI 2 eligibility rules. For all states combined, the percentage of individuals with any hospitalization or any potentially avoidable hospitalization during FY 2016 was similar between the ECCP facilities and the matched comparison facilities, for both Groups A and B. For example, 25.1 percent of Group A ECCP facility residents had any all-cause hospitalization in FY 2016, compared to 25.7 percent of Group A comparison facility residents; these numbers changed little after excluding Colorado, Nevada, and Texas from the all-state pool. This pattern largely held for individual ECCPs, with the largest descriptive differences between the ECCP facilities in Nevada and Colorado and their comparison facilities in Texas.
Table ES-1 Medicare utilization: Annual percentage of residents who used each type of service in
FY 2016
Any hospitalization
(all-cause), % Any potentially avoidable
hospitalization, % All States
Group A ECCP 25.1 11.4 Comparison 25.7 12.1
Group B ECCP 26.4 10.9 Comparison 26.1 11.9 All States, except Colorado, Nevada, and Texas
Group A ECCP 26.1 11.9 Comparison 25.4 11.8
Group B ECCP 26.0 10.9 Comparison 26.2 11.8 Alabama
Group A ECCP 28.6 13.1 Comparison 29.5 15.6
Group B ECCP 29.5 13.3 Comparison 26.7 14.7 Indiana
Group A ECCP 23.5 11.6 Comparison 23.1 10.1
Group B ECCP 22.4 10.2 Comparison 23.4 11.5
(continued)
ES-6
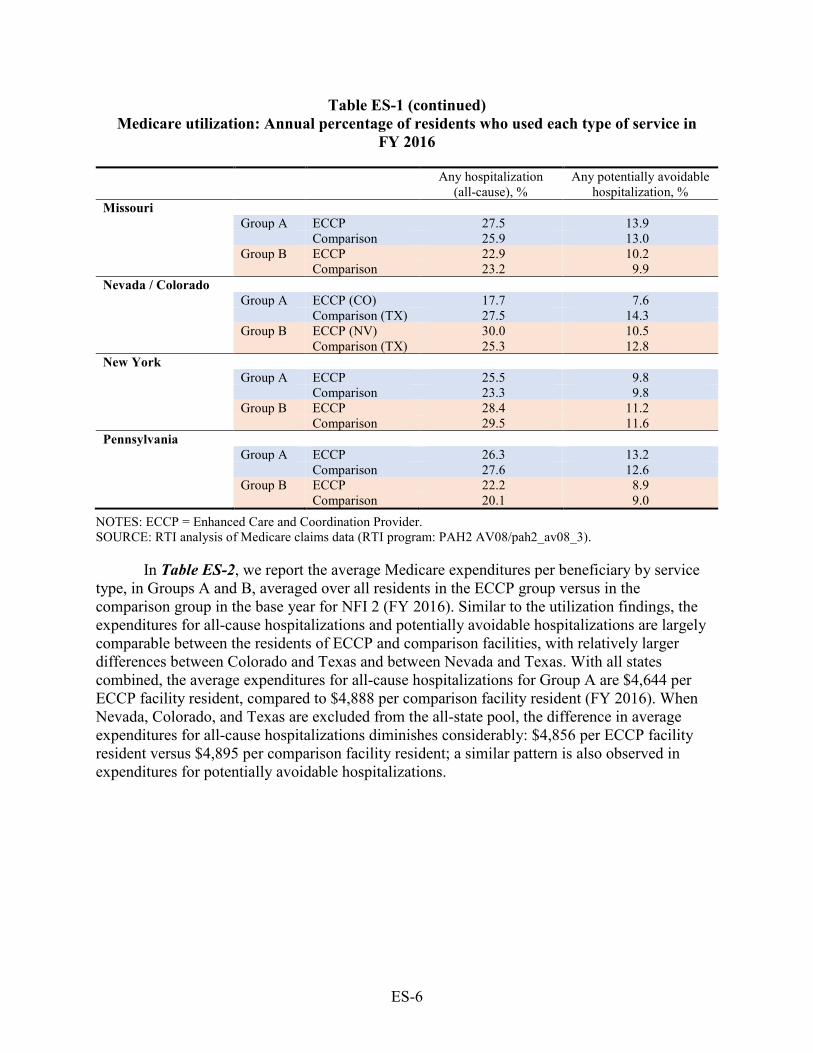
Table ES-1 (continued) Medicare utilization: Annual percentage of residents who used each type of service in
FY 2016
Any hospitalization
(all-cause), % Any potentially avoidable
hospitalization, % Missouri
Group A ECCP 27.5 13.9 Comparison 25.9 13.0
Group B ECCP 22.9 10.2 Comparison 23.2 9.9 Nevada / Colorado Group A ECCP (CO) 17.7 7.6 Comparison (TX) 27.5 14.3 Group B ECCP (NV) 30.0 10.5 Comparison (TX) 25.3 12.8 New York Group A ECCP 25.5 9.8 Comparison 23.3 9.8 Group B ECCP 28.4 11.2 Comparison 29.5 11.6 Pennsylvania Group A ECCP 26.3 13.2 Comparison 27.6 12.6 Group B ECCP 22.2 8.9 Comparison 20.1 9.0
NOTES: ECCP = Enhanced Care and Coordination Provider. SOURCE: RTI analysis of Medicare claims data (RTI program: PAH2 AV08/pah2_av08_3).
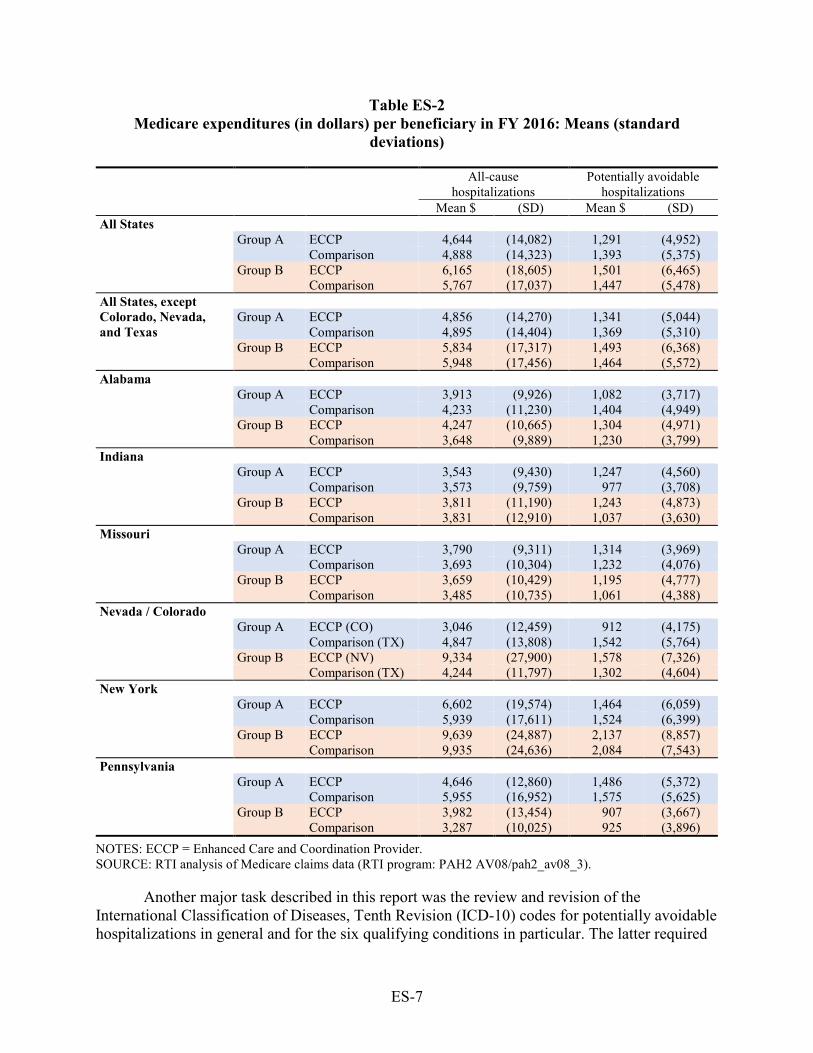
In Table ES-2, we report the average Medicare expenditures per beneficiary by service type, in Groups A and B, averaged over all residents in the ECCP group versus in the comparison group in the base year for NFI 2 (FY 2016). Similar to the utilization findings, the expenditures for all-cause hospitalizations and potentially avoidable hospitalizations are largely comparable between the residents of ECCP and comparison facilities, with relatively larger differences between Colorado and Texas and between Nevada and Texas. With all states combined, the average expenditures for all-cause hospitalizations for Group A are $4,644 per ECCP facility resident, compared to $4,888 per comparison facility resident (FY 2016). When Nevada, Colorado, and Texas are excluded from the all-state pool, the difference in average expenditures for all-cause hospitalizations diminishes considerably: $4,856 per ECCP facility resident versus $4,895 per comparison facility resident; a similar pattern is also observed in expenditures for potentially avoidable hospitalizations.
ES-7
Table ES-2 Medicare expenditures (in dollars) per beneficiary in FY 2016: Means (standard
deviations)
All-cause hospitalizations
Potentially avoidable hospitalizations
Mean $ (SD) Mean $ (SD) All States Group A ECCP 4,644 (14,082) 1,291 (4,952)
Comparison 4,888 (14,323) 1,393 (5,375) Group B ECCP 6,165 (18,605) 1,501 (6,465) Comparison 5,767 (17,037) 1,447 (5,478)
All States, except Colorado, Nevada, and Texas
Group A ECCP 4,856 (14,270) 1,341 (5,044) Comparison 4,895 (14,404) 1,369 (5,310) Group B ECCP 5,834 (17,317) 1,493 (6,368) Comparison 5,948 (17,456) 1,464 (5,572)
Alabama Group A ECCP 3,913 (9,926) 1,082 (3,717)
Comparison 4,233 (11,230) 1,404 (4,949) Group B ECCP 4,247 (10,665) 1,304 (4,971) Comparison 3,648 (9,889) 1,230 (3,799)
Indiana Group A ECCP 3,543 (9,430) 1,247 (4,560)
Comparison 3,573 (9,759) 977 (3,708) Group B ECCP 3,811 (11,190) 1,243 (4,873) Comparison 3,831 (12,910) 1,037 (3,630)
Missouri Group A ECCP 3,790 (9,311) 1,314 (3,969)
Comparison 3,693 (10,304) 1,232 (4,076) Group B ECCP 3,659 (10,429) 1,195 (4,777) Comparison 3,485 (10,735) 1,061 (4,388)
Nevada / Colorado Group A ECCP (CO) 3,046 (12,459) 912 (4,175)
Comparison (TX) 4,847 (13,808) 1,542 (5,764) Group B ECCP (NV) 9,334 (27,900) 1,578 (7,326) Comparison (TX) 4,244 (11,797) 1,302 (4,604)
New York Group A ECCP 6,602 (19,574) 1,464 (6,059)
Comparison 5,939 (17,611) 1,524 (6,399) Group B ECCP 9,639 (24,887) 2,137 (8,857) Comparison 9,935 (24,636) 2,084 (7,543)
Pennsylvania Group A ECCP 4,646 (12,860) 1,486 (5,372)
Comparison 5,955 (16,952) 1,575 (5,625) Group B ECCP 3,982 (13,454) 907 (3,667) Comparison 3,287 (10,025) 925 (3,896)
NOTES: ECCP = Enhanced Care and Coordination Provider. SOURCE: RTI analysis of Medicare claims data (RTI program: PAH2 AV08/pah2_av08_3).
Another major task described in this report was the review and revision of the International Classification of Diseases, Tenth Revision (ICD-10) codes for potentially avoidable hospitalizations in general and for the six qualifying conditions in particular. The latter required
ES-8
consideration of the signs and symptoms criteria as well as the terms used to title the qualifying conditions. There was no specific guidance provided in the Initiative documentation regarding the sets of diagnosis codes that correspond to the qualifying conditions, therefore, a clinical review was required. Tracking hospitalizations and other utilization in the claims data requires the use and regular update of ICD-10 codes.
E.4 Qualitative Data Collection and Analyses to Date
In addition to quantitative analyses of claims and related data sources, the RTI team collects qualitative data from ECCP leadership and staff, participating facility leadership and staff, practitioners, and key stakeholders. These data help provide context for quantitative findings and highlight specific areas of interest for further data collection and evaluation.
The RTI evaluation team is continuing several qualitative data collection efforts in NFI 2 that began in NFI 1, including annual site visits with each ECCP and select participating facilities, annual telephone interviews with participating facilities, and surveys of nursing facility administrators of participating facilities. In addition, for NFI 2, the RTI team is adding a two-wave survey of NFI 2-certified practitioners and a series of key stakeholder interviews. Lastly, the RTI team conducts ongoing monitoring of NFI 2 Sharing Collaborative activities.
During the first year of NFI 2 data collection, the RTI team reached out to key staff (e.g., directors of nursing or nursing facility administrators) in the 251 participating facilities, completing a total of 95 interviews (38%). Approximately half of these completed interviews were with staff from Group B facilities that are continuing from NFI 1, while the other half were with staff from Group A facilities participating only in the NFI 2 payment model. Interview topics included NFI 2 implementation, billing practices, practitioner involvement, ECCP support, Initiative effectiveness, and related topics.
Telephone interview findings highlighted good progress in implementation and use of the new billing codes, with 76% of facilities reporting that they have submitted one or more claims under NFI 2. Likewise, the majority (72%) believe the components of the Initiative are helping to reduce avoidable hospitalizations. Other key successes at this early stage include enhanced staff skills as a result of additional training on the six qualifying conditions and a general perception of facility-wide process change toward focusing more on treating residents in-house. Among Group B facilities, most reported that Initiative components from NFI 1 remain in place through NFI 2, and, although not required by CMS, a number of Group A facilities indicated that they have adopted aspects of the NFI 1 model to improve resident care (e.g., tools to improve staff–practitioner communication). The overall response from many interviewees was positive, with staff sharing anecdotes about various uses of NFI 2 payment that benefit both residents and facility staff.
Despite generally strong facility participation, interviewees reported a few early challenges, including the substantial time investment to document changes in qualifying conditions to meet claims submission requirements. Other challenges are related to practitioners and their payment. Practitioner buy-in varies significantly; interviewees said that some physicians and physician extenders are very engaged and willingly visit the facility to certify residents for claims submissions, while other practitioners have found it very challenging to
ES-9
change existing practice patterns. Among practitioners, so far there has been little interest in using the care conference billing opportunity. Interviewees also described claims challenges, with some corporate offices retaining or delaying NFI 2 payments so that facilities were not able to directly receive the financial benefits of NFI 2 in a timely manner. These delays, coupled with variable practitioner buy-in, were described as lessening the tangible benefits and engagement of some facility staff and leadership. The RTI evaluation team will continue collecting data to monitor the evolution of successes and concerns throughout NFI 2.
E.5 Discussion
Several broader issues identified early in the primary data collection have the potential to create implementation or analytical challenges for the evaluation. The evolution, sustainability, and convergence of NFI 1 model elements practiced in Group A and Group B facilities increases the complexity of interpreting the effect of NFI 2. The growth of managed care penetration rates may affect the availability of eligible fee-for-service residents. As the Initiative continues, other challenges may arise as a function of its success.
In Group B facilities, given the continuation of the clinical and educational components implemented in NFI 1, the presence of these interventions may affect the introduction of the payment model in a way that differs between the Group B and Group A facilities. Simultaneously, activities within some Group A facilities such as the hiring of APRNs, expanded physician presence in facilities, or use of INTERACT III (Interventions to Reduce Acute Care Transfers) tools, may result in a convergence with the Group B model.
Another concern identified during primary data collection, reflective of the growing state interest in managed care plans for long-term care services, is the increasing penetration of managed care into study areas, which may reduce the number of eligible residents in participating facilities. Facilities with a high prevalence of managed care would have too few NFI 2-eligible residents to be sufficiently incentivized to remain in the Initiative. RTI will monitor the growth of managed care, both in Institutional Special Needs Plans and Medicare Advantage plans, via primary data collection, particularly stakeholder interviews, and by quantitatively tracking the number and proportion of residents in NFI facilities enrolled in managed care. It is possible that there will be some attrition of facilities in the ECCP groups or the comparison groups.
A complication to the evaluation that we will be monitoring is the potential effect of other initiatives and demonstrations that are being conducted by CMS or the states. We will assess the extent to which the participating residents or providers are involved in these activities and consider how to account for their effects on the results of the Initiative.
In addition, preliminary findings from primary data collection indicate that facility staff expressed concern about the duration of the Initiative. Interviewees said that as staff skills improve and care quality increases, facilities will have fewer opportunities to submit claims under NFI 2. Facility staff may be able to identify potential changes in residents’ conditions so quickly that those conditions will not exacerbate to the level required for NFI 2 payment (e.g., high-enough bacteria count to submit a urinary tract infection claim). Thus, a lack of submitted

ES-10
claims could indicate either low engagement with the Initiative, or, eventually, positive changes in care practice resulting from Initiative success.
These potential concerns will be explored in greater detail in the coming months, as the RTI team continues quantitative analyses and conducts in-person site visits through 2017, facility administrator and practitioner surveys in early 2018, and ongoing stakeholder interviews. RTI will explore the potential effects of increased care quality and prevalence of managed care, as well as develop novel analytic approaches to address the complex study design.
1
SECTION 1 OVERVIEW
1.1 Introduction
In October 2016, the Centers for Medicare & Medicaid Services (CMS) began implementing the second phase of an initiative designed to reduce hospitalization rates of long-stay nursing facility residents by directly changing practices at the facility level. The initiative is testing a series of clinical and educational interventions, plus new payment models or new payment models alone, aimed at improving the health and health care of long-stay nursing facility residents, reducing avoidable inpatient hospital admissions, improving quality metrics, and decreasing the total cost of health care spending for the target population.
The first phase of the initiative, known as the Initiative to Reduce Avoidable Hospitalizations among Nursing Facility Residents—herein referred to as Nursing Facility Initiative (NFI) 1—was launched in September 2012 (with implementation beginning in early 2013) and ended in September 2016. NFI 1 focused on a range of clinical and educational interventions that placed advanced practice registered nurses (APRNs) or registered nurses (RNs) within nursing facilities in seven states to improve the detection, documentation, and communication of changes in resident conditions; transitions to hospitals; medication review; and quality improvement. Variations of these interventions were designed and delivered to participating nursing facilities by seven outside organizations (one per participating state), called Enhanced Care and Coordination Providers (ECCPs).
The ECCPs were academic institutions, quality improvement organizations (QIOs), a health care provider network, and a hospital association. Within the overall parameters set by CMS, the ECCPs designed their own interventions and worked directly with the facilities in their seven respective states. NFI 1 funded the ECCPs for operations in their partnering nursing facilities but did not provide funding directly to participating facilities. The ECCP staff provided a range of interventions, including training on how to use standardized communication tools within the facilities, tools to communicate with practitioners and hospitals, medication review, advance care planning training, internet-enabled telemedicine equipment, and in some cases, hands-on care of facility residents.
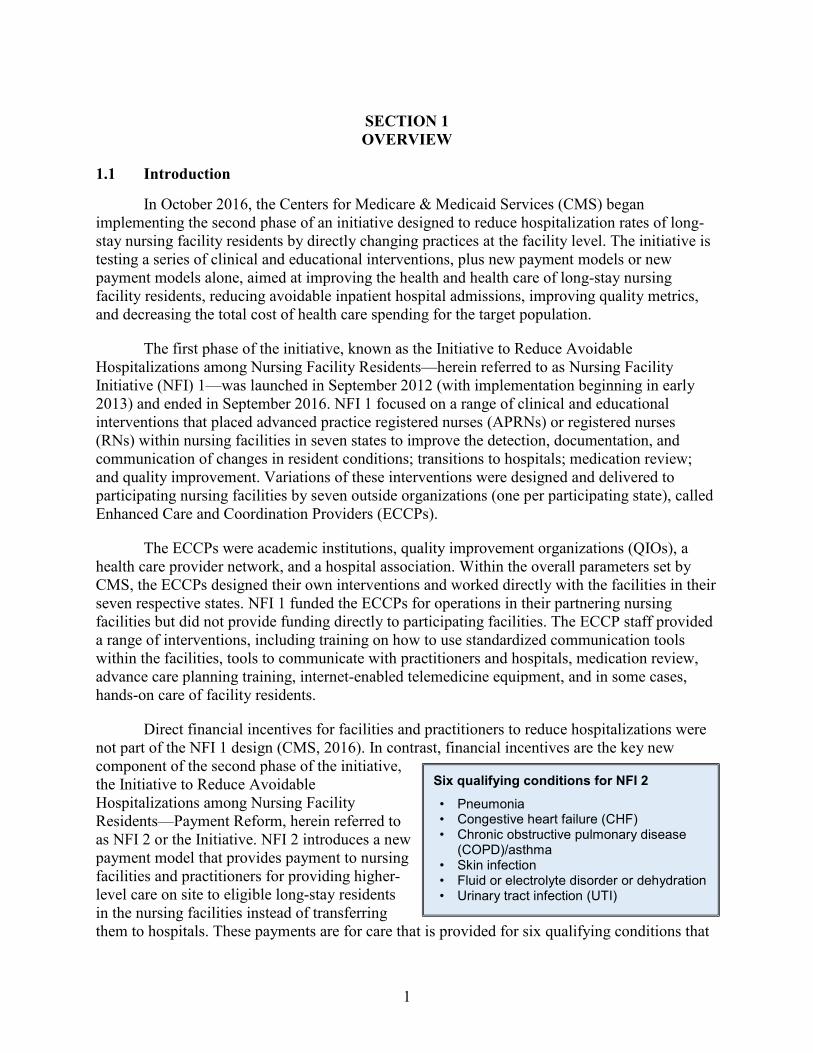
Direct financial incentives for facilities and practitioners to reduce hospitalizations were not part of the NFI 1 design (CMS, 2016). In contrast, financial incentives are the key new component of the second phase of the initiative, the Initiative to Reduce Avoidable Hospitalizations among Nursing Facility Residents—Payment Reform, herein referred to as NFI 2 or the Initiative. NFI 2 introduces a new payment model that provides payment to nursing facilities and practitioners for providing higher-level care on site to eligible long-stay residents in the nursing facilities instead of transferring them to hospitals. These payments are for care that is provided for six qualifying conditions that
Six qualifying conditions for NFI 2
• Pneumonia • Congestive heart failure (CHF) • Chronic obstructive pulmonary disease
(COPD)/asthma • Skin infection • Fluid or electrolyte disorder or dehydration • Urinary tract infection (UTI)
2
account for most potentially avoidable hospitalizations: pneumonia, congestive heart failure (CHF), chronic obstructive pulmonary disease (COPD)/asthma, skin infection, fluid or electrolyte disorder or dehydration, and urinary tract infection (UTI).
Six ECCPs (of the original seven) were selected to participate in NFI 2. They are listed in Section 1.2. NFI 2 builds upon NFI 1 and includes an expanded role for the ECCPs. Each ECCP recruited partnering nursing facilities to form two intervention groups, known as Group A and Group B, with a roughly equal number of facilities in each group. As indicated in Table 1-1, Group A is the “Payment-only Group,” newly selected; Group B is the “ECCP + Payment” group, which are facilities continuing from NFI 1.
Table 1-1 Comparison of the two intervention arms
Group A – Payment-Only Group Group B – ECCP + Payment Group • Newly recruited nursing facilities
participating in NFI 2 payment model only • “Incumbent” nursing facilities that add the
same NFI 2 payment model
• Did not participate in NFI 1 • Participated in NFI 1
• No ECCP clinical or educational interventions from NFI 1
• Continue their ECCP’s NFI 1 clinical and educational interventions
• ECCPs support these facilities with trainings on billing and data collection activities
• ECCPs also train staff on the six qualifying conditions, new billing codes, and data collection activities
As of September 2017, ECCPs are partnering with 144 Group A nursing facilities from six states (Alabama, Indiana, Missouri, Colorado,2 New York, and Pennsylvania) and 107 Group B nursing facilities from six states (Alabama, Indiana, Missouri, Nevada, New York, and Pennsylvania). The Group A facilities collaborate with the same ECCP as the Group B facilities within the same state except for the facilities in Colorado, which partner with the ECCP in Nevada through Intermountain Quality Innovations. All facilities from both Group A and Group B are listed in Appendix A.
The purpose of RTI’s analysis is to conduct an evaluation of NFI 2. Using a mix of qualitative and quantitative methods, RTI is assessing the effectiveness of the new payment model in reducing avoidable hospitalizations among long-stay residents, improving other resident health outcomes, and reducing overall health care spending (Medicare and Medicaid costs), without restricting access to care or choice of providers. We also describe the activities in the facilities that enable, or present challenges to, the implementation in both Initiative groups.
2 Because of the limited number of facilities in Nevada, the Nevada ECCP recruited Group A facilities for NFI 2
from the state of Colorado.
3
This first annual report on NFI 2 describes our work to date to address the following overarching questions:
• Does the intervention affect quality of care as evidenced by reduced rates of hospital transfers, including hospitalization, avoidable hospitalization, emergency department (ED) visits, avoidable ED visits, and observation stays, among long-stay nursing facility residents?
• Does the intervention affect additional quality of care and health outcome measures such as functional status and use of antipsychotic medications for long-stay nursing facility residents?
• Does the intervention reduce Medicare, Medicaid, and total costs?
In Section 1.2, we provide a more detailed description of the mechanics of the payment reform introduced in NFI 2, including a precise definition of each of the six qualifying conditions. We also provide descriptions of the approaches taken by the ECCPs (the six that are continuing in NFI 2) in NFI 1, which is critical for an understanding of the Group B intervention. In Section 1.3, we provide more detail about our evaluation methods.
The remainder of the report is organized as follows. Section 2 describes the data sources used for constructing comparison groups and measuring outcomes. Section 3 describes the participation criteria for nursing facility residents, as specified by CMS, and illustrates how Initiative-eligible residents meeting those criteria were identified. Section 4 describes methods used to select comparison facilities as well as descriptive information about these comparison facilities. Section 5 describes the outcome measures for evaluation, and Section 6 presents descriptive measures for key utilization and expenditure outcomes for the base year, fiscal year (FY) 2016 (October 2015–September 2016). Section 7 describes all the qualitative data collection activities to date and provides early findings from our qualitative data collection. Section 8 provides a brief summary of key results presented in the current annual report.
1.2 Description of the Initiative to Reduce Avoidable Hospitalizations among Nursing Facility Residents—Payment Reform
1.2.1 Timeline
NFI 2 officially started on October 1, 2016; about 1 year of recruitment and preparation preceded the official start date. The preparation period overlapped with the last year of NFI 1, which ran through September 2016. The ECCP organizations had to multitask during this period. NFI 2 is scheduled to run through September 2020.
1.2.2 Payment Reform Definitions and Procedures
NFI 2 is designed to test the effect of providing payment to nursing facilities and practitioners for the treatment, in house rather than in the hospital, of long-stay nursing facility residents for the six qualifying conditions. The NFI 2 model provides three types of payments, each with new billing codes and with cost sharing waived by Medicare:
4
• Nursing facility payments. Payments to a nursing facility under Medicare Part B for the treatment of qualifying conditions for beneficiaries not on a covered Medicare Part A skilled nursing facility (SNF) stay, paid per diem in addition to the usual payment the facility receives for a long-term resident.
• Practitioner payments for diagnosis, certification, and treatment. Practitioner payments under Medicare Part B for the diagnosis, certification, and treatment of qualifying conditions on site at the facility. Though there is an existing code that allows a physician to bill for services in a nursing facility (CPT 99310), this new code is reimbursed at a higher rate, equivalent to a physician initial visit in a hospital setting.
• Care coordination payments. Practitioner payments under Medicare Part B for care coordination and caregiver engagement.
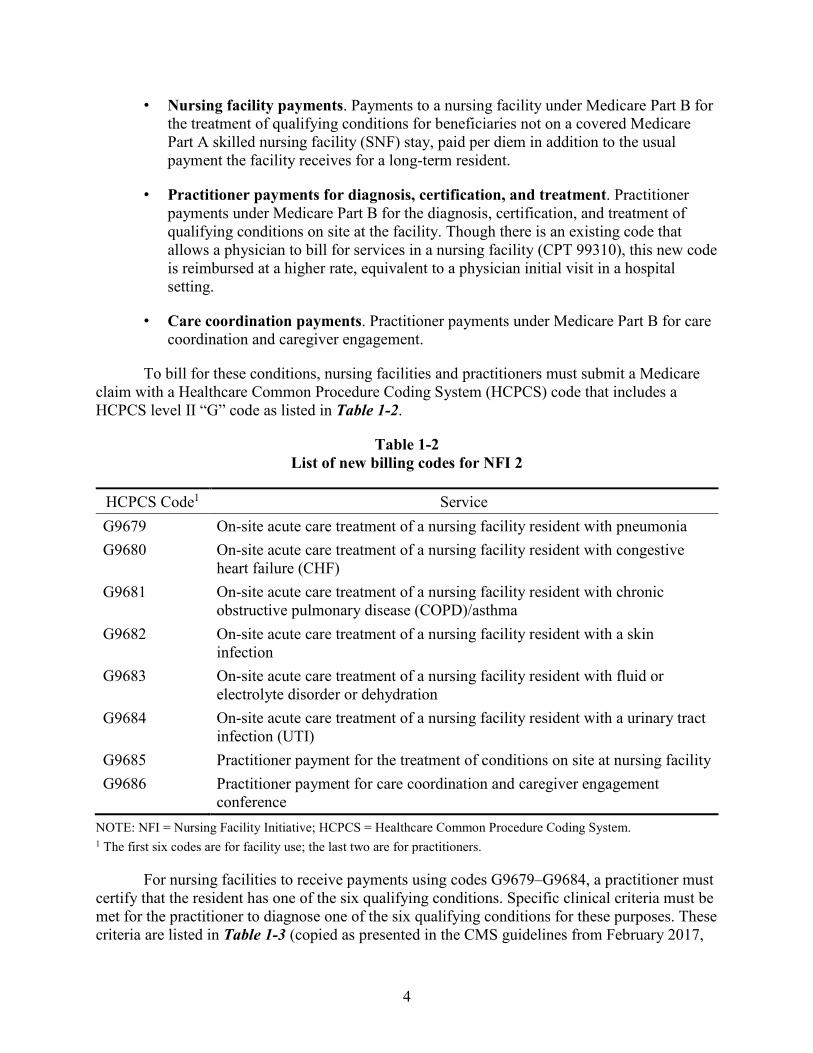
To bill for these conditions, nursing facilities and practitioners must submit a Medicare claim with a Healthcare Common Procedure Coding System (HCPCS) code that includes a HCPCS level II “G” code as listed in Table 1-2.
Table 1-2 List of new billing codes for NFI 2
HCPCS Code1 Service G9679 On-site acute care treatment of a nursing facility resident with pneumonia G9680 On-site acute care treatment of a nursing facility resident with congestive
heart failure (CHF) G9681 On-site acute care treatment of a nursing facility resident with chronic
obstructive pulmonary disease (COPD)/asthma G9682 On-site acute care treatment of a nursing facility resident with a skin
infection G9683 On-site acute care treatment of a nursing facility resident with fluid or
electrolyte disorder or dehydration G9684 On-site acute care treatment of a nursing facility resident with a urinary tract
infection (UTI) G9685 Practitioner payment for the treatment of conditions on site at nursing facility G9686 Practitioner payment for care coordination and caregiver engagement
conference NOTE: NFI = Nursing Facility Initiative; HCPCS = Healthcare Common Procedure Coding System. 1 The first six codes are for facility use; the last two are for practitioners.
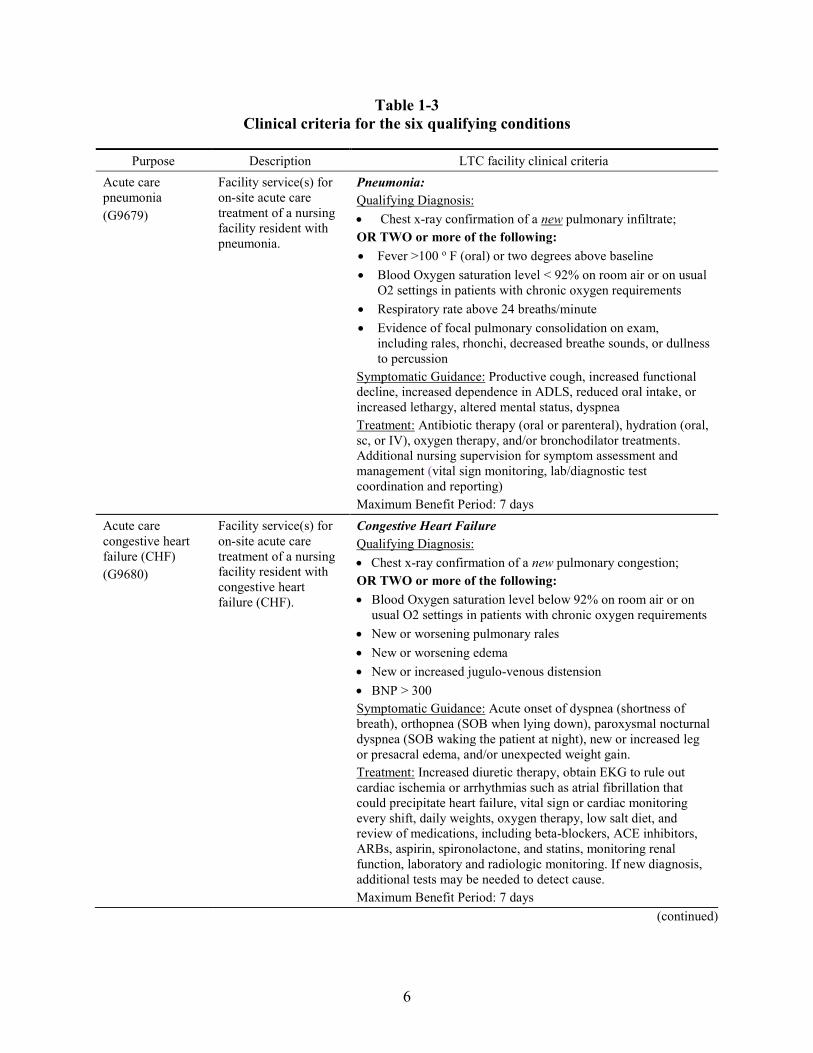
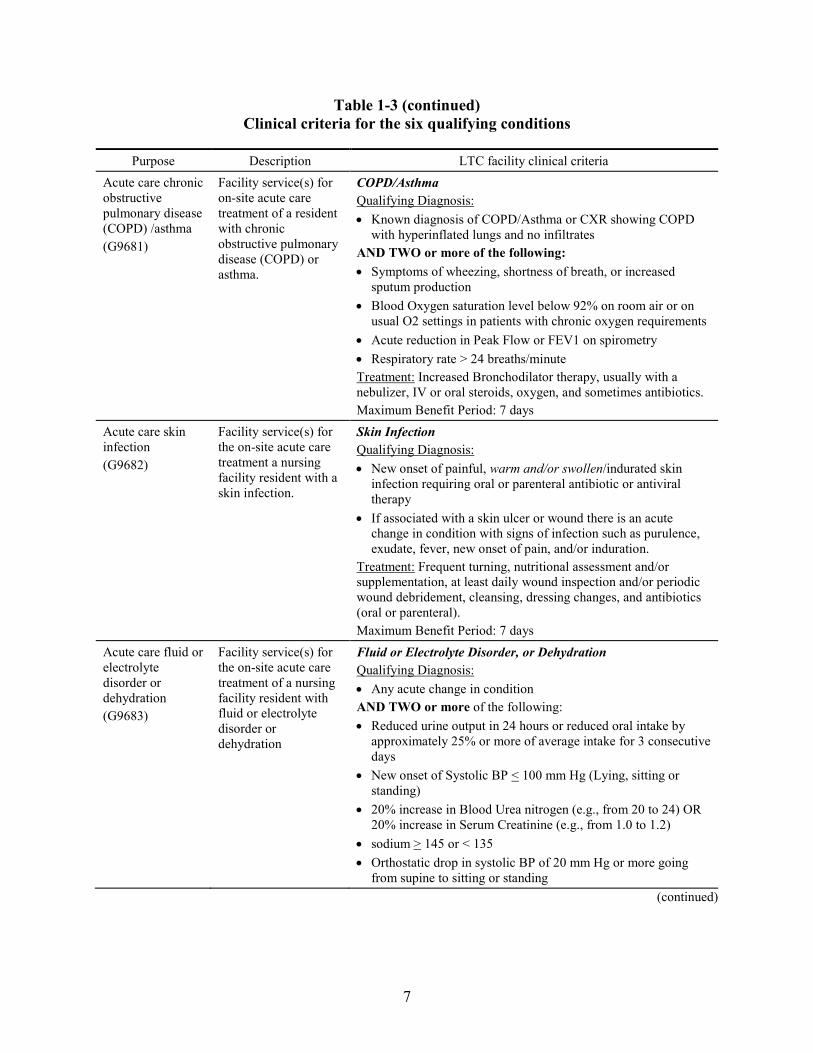
For nursing facilities to receive payments using codes G9679–G9684, a practitioner must certify that the resident has one of the six qualifying conditions. Specific clinical criteria must be met for the practitioner to diagnose one of the six qualifying conditions for these purposes. These criteria are listed in Table 1-3 (copied as presented in the CMS guidelines from February 2017,
5
“Updated Guidance for Long-Term Care (LTC) Facility Participation in the Initiative to Reduce Avoidable Hospitalizations among Nursing Facility Residents—Payment Reform”) and may be modified by CMS over time based upon lessons learned. Assuming this certification occurs within 2 days of the time when a resident’s change in condition is identified and documented by the nursing facility staff, the facility may bill from the time of the change of condition until the patient’s condition improves or they reach the maximum benefit period for that condition (5 or 7 days depending on the condition). After this benefit period is completed, patients can be recertified to enable facilities to continue billing if the condition has not resolved by that time.
Practitioners who are approved to participate in the Initiative may bill using the Initiative-specific code, G9685. Although these payments are intended for the certification and treatment of the six qualifying conditions, physicians who evaluate and treat a patient for an acute change in condition, and suspect one of the six qualifying conditions, are entitled to payment for the visit regardless of the ultimate diagnosis. This new G code is paid at the rate for a hospital inpatient visit. The practitioner may bill the code only for the first visit to the facility made in response to the beneficiary’s change in condition. For each following visit with the resident while treating the condition, practitioners should bill using the usual nursing home visit codes.
There is an additional billing code, G9686, that allows practitioners to bill for completing a nursing facility conference with residents. These care conferences may not include a physical assessment, but should be focused on the resident’s treatment goals and involve an interdisciplinary team. A summary of these meetings must be documented in the resident’s medical chart. Payments for these conferences are not tied specifically to the six qualifying conditions.
Note that these payments can be made only for long-stay residents eligible for NFI 2 and residing in participating facilities. More details on the definition of eligible long-stay residents are provided in Section 3. Although the practitioner payments apply to long-stay residents even during an intervening SNF stay, the nursing facility extra payments do not because facility payments in this case are at the Part A SNF rates.
The payments are to be used by the facility to implement programs, obtain equipment to aid in assessments, and enhance the skills of staff to provide a higher level of acute care services on site, thereby reducing potentially unnecessary hospitalizations. The increased payments for practitioners are intended to equalize the payment for a visit to treat a beneficiary in a nursing facility to the payment for a similar visit in a hospital.
6
Table 1-3 Clinical criteria for the six qualifying conditions
Purpose Description LTC facility clinical criteria Acute care pneumonia (G9679)
Facility service(s) for on-site acute care treatment of a nursing facility resident with pneumonia.
Pneumonia: Qualifying Diagnosis: • Chest x-ray confirmation of a new pulmonary infiltrate; OR TWO or more of the following: • Fever >100 o F (oral) or two degrees above baseline • Blood Oxygen saturation level < 92% on room air or on usual
O2 settings in patients with chronic oxygen requirements • Respiratory rate above 24 breaths/minute • Evidence of focal pulmonary consolidation on exam,
including rales, rhonchi, decreased breathe sounds, or dullness to percussion
Symptomatic Guidance: Productive cough, increased functional decline, increased dependence in ADLS, reduced oral intake, or increased lethargy, altered mental status, dyspnea Treatment: Antibiotic therapy (oral or parenteral), hydration (oral, sc, or IV), oxygen therapy, and/or bronchodilator treatments. Additional nursing supervision for symptom assessment and management (vital sign monitoring, lab/diagnostic test coordination and reporting) Maximum Benefit Period: 7 days
Acute care congestive heart failure (CHF) (G9680)
Facility service(s) for on-site acute care treatment of a nursing facility resident with congestive heart failure (CHF).
Congestive Heart Failure Qualifying Diagnosis: • Chest x-ray confirmation of a new pulmonary congestion; OR TWO or more of the following: • Blood Oxygen saturation level below 92% on room air or on
usual O2 settings in patients with chronic oxygen requirements • New or worsening pulmonary rales • New or worsening edema • New or increased jugulo-venous distension • BNP > 300 Symptomatic Guidance: Acute onset of dyspnea (shortness of breath), orthopnea (SOB when lying down), paroxysmal nocturnal dyspnea (SOB waking the patient at night), new or increased leg or presacral edema, and/or unexpected weight gain. Treatment: Increased diuretic therapy, obtain EKG to rule out cardiac ischemia or arrhythmias such as atrial fibrillation that could precipitate heart failure, vital sign or cardiac monitoring every shift, daily weights, oxygen therapy, low salt diet, and review of medications, including beta-blockers, ACE inhibitors, ARBs, aspirin, spironolactone, and statins, monitoring renal function, laboratory and radiologic monitoring. If new diagnosis, additional tests may be needed to detect cause. Maximum Benefit Period: 7 days
(continued)
7
Table 1-3 (continued) Clinical criteria for the six qualifying conditions
Purpose Description LTC facility clinical criteria Acute care chronic obstructive pulmonary disease (COPD) /asthma (G9681)
Facility service(s) for on-site acute care treatment of a resident with chronic obstructive pulmonary disease (COPD) or asthma.
COPD/Asthma Qualifying Diagnosis: • Known diagnosis of COPD/Asthma or CXR showing COPD
with hyperinflated lungs and no infiltrates AND TWO or more of the following: • Symptoms of wheezing, shortness of breath, or increased
sputum production • Blood Oxygen saturation level below 92% on room air or on
usual O2 settings in patients with chronic oxygen requirements • Acute reduction in Peak Flow or FEV1 on spirometry • Respiratory rate > 24 breaths/minute Treatment: Increased Bronchodilator therapy, usually with a nebulizer, IV or oral steroids, oxygen, and sometimes antibiotics. Maximum Benefit Period: 7 days
Acute care skin infection (G9682)
Facility service(s) for the on-site acute care treatment a nursing facility resident with a skin infection.
Skin Infection Qualifying Diagnosis: • New onset of painful, warm and/or swollen/indurated skin
infection requiring oral or parenteral antibiotic or antiviral therapy
• If associated with a skin ulcer or wound there is an acute change in condition with signs of infection such as purulence, exudate, fever, new onset of pain, and/or induration.
Treatment: Frequent turning, nutritional assessment and/or supplementation, at least daily wound inspection and/or periodic wound debridement, cleansing, dressing changes, and antibiotics (oral or parenteral). Maximum Benefit Period: 7 days
Acute care fluid or electrolyte disorder or dehydration (G9683)
Facility service(s) for the on-site acute care treatment of a nursing facility resident with fluid or electrolyte disorder or dehydration
Fluid or Electrolyte Disorder, or Dehydration Qualifying Diagnosis: • Any acute change in condition AND TWO or more of the following: • Reduced urine output in 24 hours or reduced oral intake by
approximately 25% or more of average intake for 3 consecutive days
• New onset of Systolic BP < 100 mm Hg (Lying, sitting or standing)
• 20% increase in Blood Urea nitrogen (e.g., from 20 to 24) OR 20% increase in Serum Creatinine (e.g., from 1.0 to 1.2)
• sodium > 145 or < 135 • Orthostatic drop in systolic BP of 20 mm Hg or more going
from supine to sitting or standing (continued)
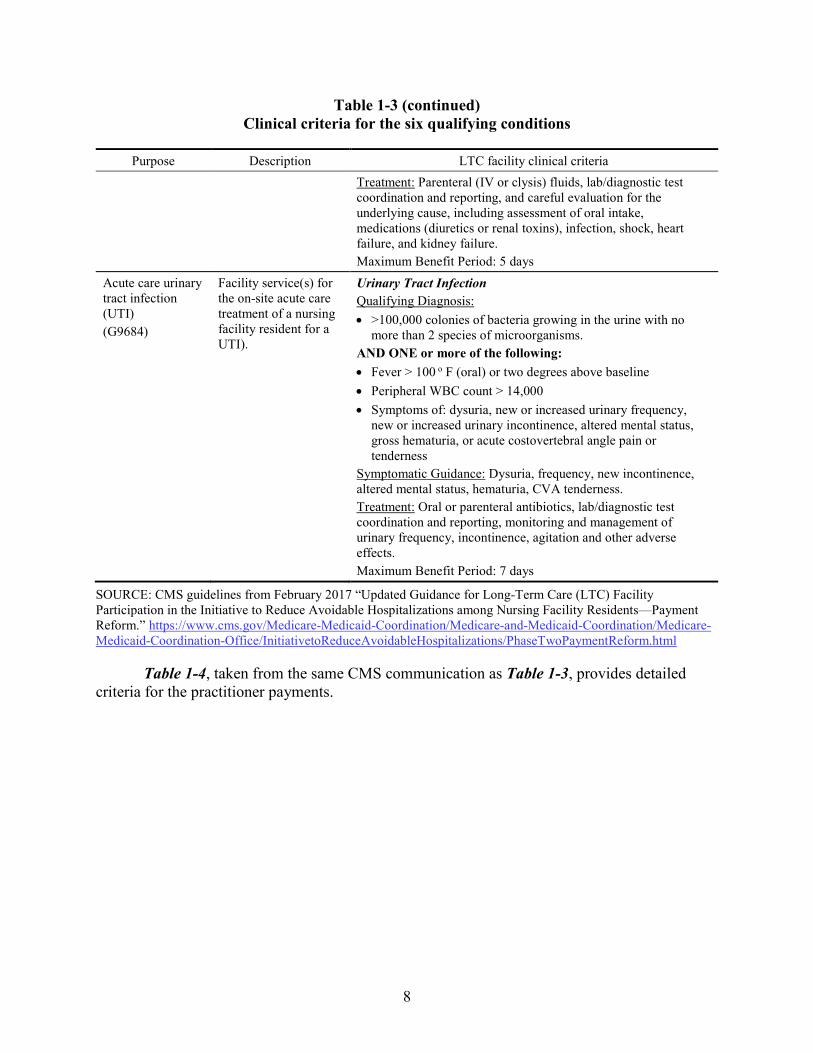
8
Table 1-3 (continued) Clinical criteria for the six qualifying conditions
Purpose Description LTC facility clinical criteria
Treatment: Parenteral (IV or clysis) fluids, lab/diagnostic test coordination and reporting, and careful evaluation for the underlying cause, including assessment of oral intake, medications (diuretics or renal toxins), infection, shock, heart failure, and kidney failure. Maximum Benefit Period: 5 days
Acute care urinary tract infection (UTI) (G9684)
Facility service(s) for the on-site acute care treatment of a nursing facility resident for a UTI).
Urinary Tract Infection Qualifying Diagnosis: • >100,000 colonies of bacteria growing in the urine with no
more than 2 species of microorganisms. AND ONE or more of the following: • Fever > 100 o F (oral) or two degrees above baseline • Peripheral WBC count > 14,000 • Symptoms of: dysuria, new or increased urinary frequency,
new or increased urinary incontinence, altered mental status, gross hematuria, or acute costovertebral angle pain or tenderness
Symptomatic Guidance: Dysuria, frequency, new incontinence, altered mental status, hematuria, CVA tenderness. Treatment: Oral or parenteral antibiotics, lab/diagnostic test coordination and reporting, monitoring and management of urinary frequency, incontinence, agitation and other adverse effects. Maximum Benefit Period: 7 days
SOURCE: CMS guidelines from February 2017 “Updated Guidance for Long-Term Care (LTC) Facility Participation in the Initiative to Reduce Avoidable Hospitalizations among Nursing Facility Residents—Payment Reform.” https://www.cms.gov/Medicare-Medicaid-Coordination/Medicare-and-Medicaid-Coordination/Medicare-Medicaid-Coordination-Office/InitiativetoReduceAvoidableHospitalizations/PhaseTwoPaymentReform.html
Table 1-4, taken from the same CMS communication as Table 1-3, provides detailed criteria for the practitioner payments.
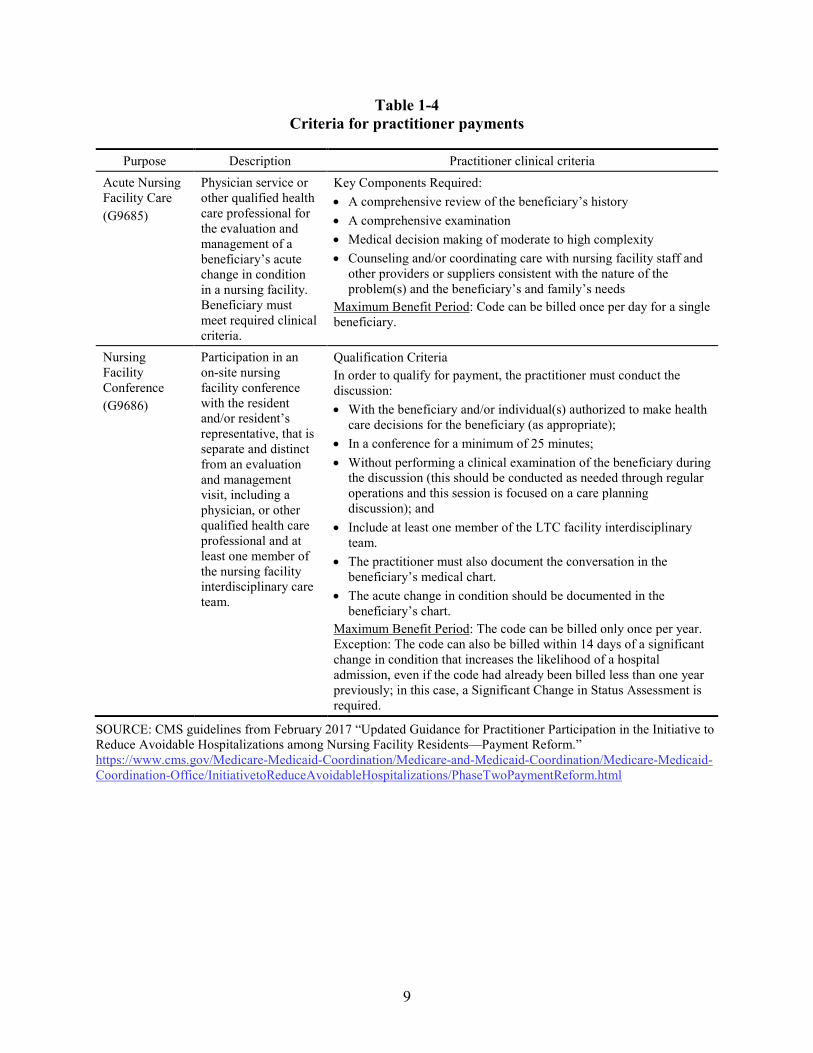
9
Table 1-4 Criteria for practitioner payments
Purpose Description Practitioner clinical criteria Acute Nursing Facility Care (G9685)
Physician service or other qualified health care professional for the evaluation and management of a beneficiary’s acute change in condition in a nursing facility. Beneficiary must meet required clinical criteria.
Key Components Required: • A comprehensive review of the beneficiary’s history • A comprehensive examination • Medical decision making of moderate to high complexity • Counseling and/or coordinating care with nursing facility staff and
other providers or suppliers consistent with the nature of the problem(s) and the beneficiary’s and family’s needs
Maximum Benefit Period: Code can be billed once per day for a single beneficiary.
Nursing Facility Conference (G9686)
Participation in an on-site nursing facility conference with the resident and/or resident’s representative, that is separate and distinct from an evaluation and management visit, including a physician, or other qualified health care professional and at least one member of the nursing facility interdisciplinary care team.
Qualification Criteria In order to qualify for payment, the practitioner must conduct the discussion: • With the beneficiary and/or individual(s) authorized to make health
care decisions for the beneficiary (as appropriate); • In a conference for a minimum of 25 minutes; • Without performing a clinical examination of the beneficiary during
the discussion (this should be conducted as needed through regular operations and this session is focused on a care planning discussion); and
• Include at least one member of the LTC facility interdisciplinary team.
• The practitioner must also document the conversation in the beneficiary’s medical chart.
• The acute change in condition should be documented in the beneficiary’s chart.
Maximum Benefit Period: The code can be billed only once per year. Exception: The code can also be billed within 14 days of a significant change in condition that increases the likelihood of a hospital admission, even if the code had already been billed less than one year previously; in this case, a Significant Change in Status Assessment is required.
SOURCE: CMS guidelines from February 2017 “Updated Guidance for Practitioner Participation in the Initiative to Reduce Avoidable Hospitalizations among Nursing Facility Residents—Payment Reform.” https://www.cms.gov/Medicare-Medicaid-Coordination/Medicare-and-Medicaid-Coordination/Medicare-Medicaid-Coordination-Office/InitiativetoReduceAvoidableHospitalizations/PhaseTwoPaymentReform.html
10
1.2.3 Background on NFI 1
We describe the approaches taken by the ECCPs during NFI 1 to provide important background for understanding the Group B intervention in NFI 2. In NFI 1, the facilities implemented a range of clinical and educational interventions aimed at improving the health and health care of long-stay nursing facility residents, with the following main objectives:
• Reduce the frequency of avoidable hospital admissions and readmissions.
• Improve resident health outcomes.
• Improve the process of transition between inpatient hospitals and nursing facilities.
• Reduce overall health care spending without restricting access to care or choice of providers.
All interventions were also required to include the following activities:
• Hire staff who partner with nursing facility staff to improve recognition, assessment, and management of conditions that are often a cause of avoidable hospitalizations.
• Work in cooperation with existing providers, including residents’ primary care providers, nursing facility staff, and families.
• Focus on quality improvement practices related to avoidable hospitalizations while working in cooperation with existing providers.
• Facilitate residents’ transitions to and from inpatient hospitals and nursing facilities and facilitate timely and complete exchange of health information.
• Provide support for improved communication and coordination among hospital staff, including attending physicians, nursing facility staff, residents’ primary care providers and other specialists, and pharmacy staff.
• Coordinate and improve management and monitoring of prescription drugs to reduce polypharmacy, adverse drug events, and inappropriate use of psychotropic drugs.
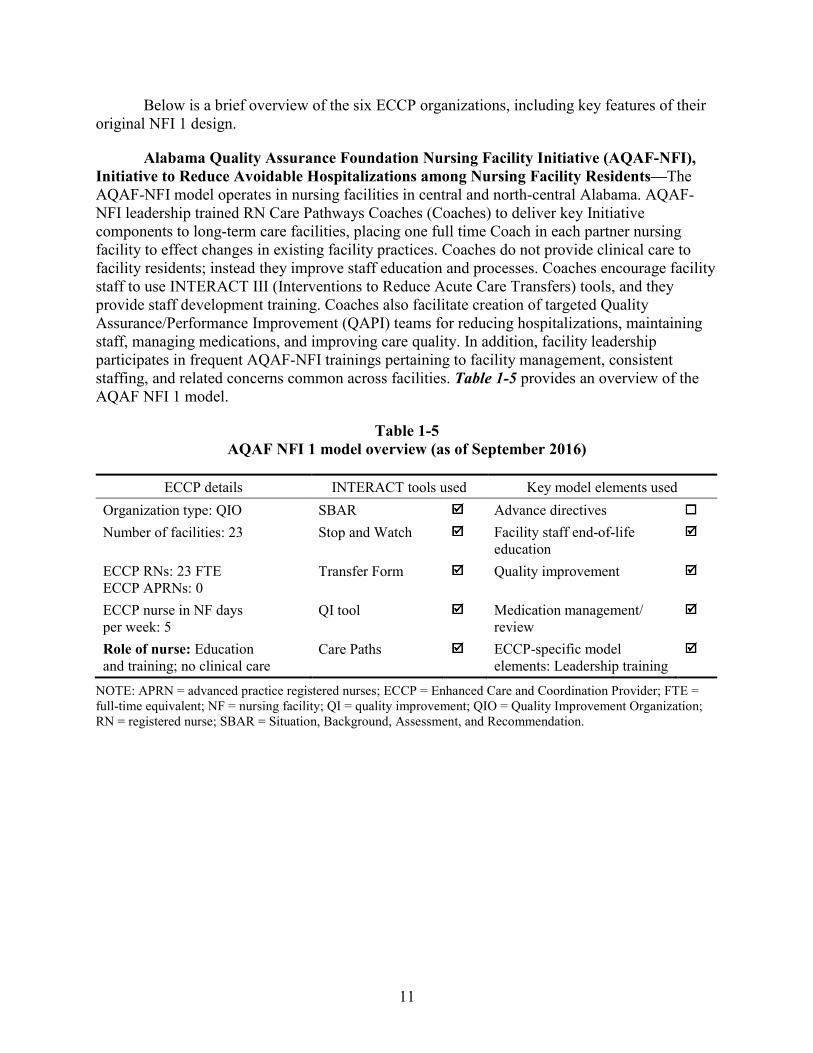
11
Below is a brief overview of the six ECCP organizations, including key features of their original NFI 1 design.
Alabama Quality Assurance Foundation Nursing Facility Initiative (AQAF-NFI), Initiative to Reduce Avoidable Hospitalizations among Nursing Facility Residents—The AQAF-NFI model operates in nursing facilities in central and north-central Alabama. AQAF-NFI leadership trained RN Care Pathways Coaches (Coaches) to deliver key Initiative components to long-term care facilities, placing one full time Coach in each partner nursing facility to effect changes in existing facility practices. Coaches do not provide clinical care to facility residents; instead they improve staff education and processes. Coaches encourage facility staff to use INTERACT III (Interventions to Reduce Acute Care Transfers) tools, and they provide staff development training. Coaches also facilitate creation of targeted Quality Assurance/Performance Improvement (QAPI) teams for reducing hospitalizations, maintaining staff, managing medications, and improving care quality. In addition, facility leadership participates in frequent AQAF-NFI trainings pertaining to facility management, consistent staffing, and related concerns common across facilities. Table 1-5 provides an overview of the AQAF NFI 1 model.
Table 1-5 AQAF NFI 1 model overview (as of September 2016)
ECCP details INTERACT tools used Key model elements used Organization type: QIO SBAR Advance directives Number of facilities: 23 Stop and Watch Facility staff end-of-life
education
ECCP RNs: 23 FTE ECCP APRNs: 0
Transfer Form Quality improvement
ECCP nurse in NF days per week: 5
QI tool Medication management/ review
Role of nurse: Education and training; no clinical care
Care Paths ECCP-specific model elements: Leadership training
NOTE: APRN = advanced practice registered nurses; ECCP = Enhanced Care and Coordination Provider; FTE = full-time equivalent; NF = nursing facility; QI = quality improvement; QIO = Quality Improvement Organization; RN = registered nurse; SBAR = Situation, Background, Assessment, and Recommendation.
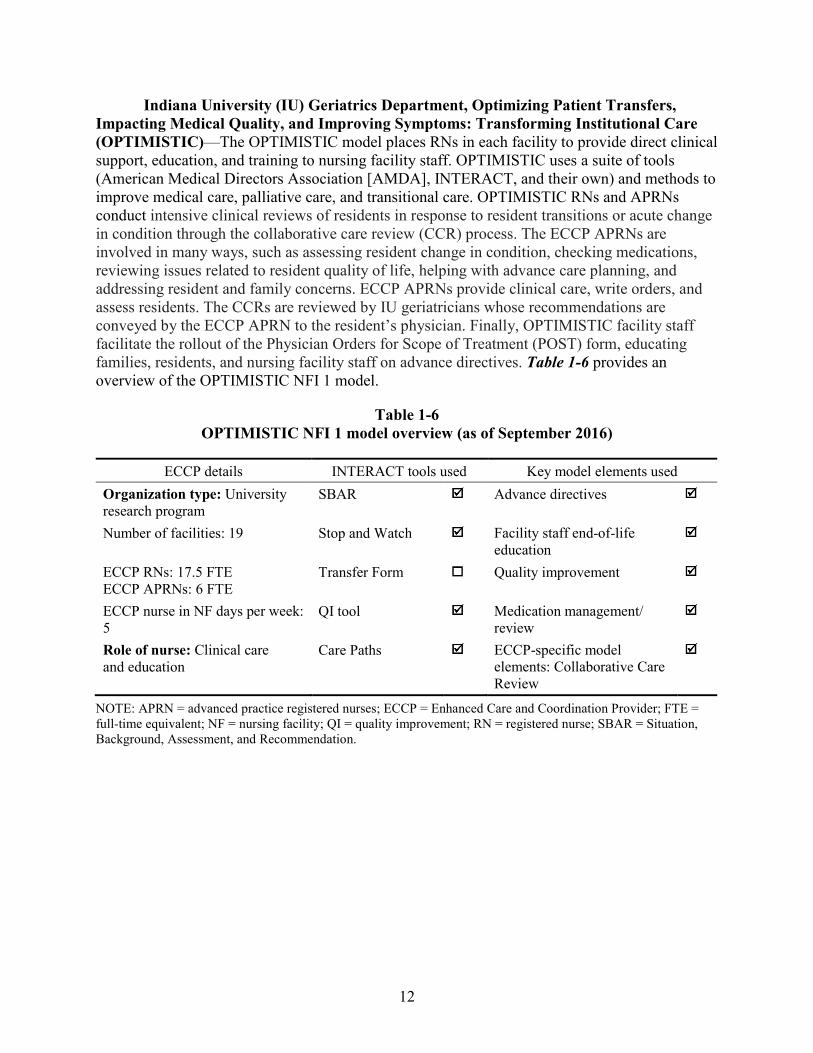
12
Indiana University (IU) Geriatrics Department, Optimizing Patient Transfers, Impacting Medical Quality, and Improving Symptoms: Transforming Institutional Care (OPTIMISTIC)—The OPTIMISTIC model places RNs in each facility to provide direct clinical support, education, and training to nursing facility staff. OPTIMISTIC uses a suite of tools (American Medical Directors Association [AMDA], INTERACT, and their own) and methods to improve medical care, palliative care, and transitional care. OPTIMISTIC RNs and APRNs conduct intensive clinical reviews of residents in response to resident transitions or acute change in condition through the collaborative care review (CCR) process. The ECCP APRNs are involved in many ways, such as assessing resident change in condition, checking medications, reviewing issues related to resident quality of life, helping with advance care planning, and addressing resident and family concerns. ECCP APRNs provide clinical care, write orders, and assess residents. The CCRs are reviewed by IU geriatricians whose recommendations are conveyed by the ECCP APRN to the resident’s physician. Finally, OPTIMISTIC facility staff facilitate the rollout of the Physician Orders for Scope of Treatment (POST) form, educating families, residents, and nursing facility staff on advance directives. Table 1-6 provides an overview of the OPTIMISTIC NFI 1 model.
Table 1-6 OPTIMISTIC NFI 1 model overview (as of September 2016)
ECCP details INTERACT tools used Key model elements used Organization type: University research program
SBAR Advance directives
Number of facilities: 19 Stop and Watch Facility staff end-of-life education
ECCP RNs: 17.5 FTE ECCP APRNs: 6 FTE
Transfer Form Quality improvement
ECCP nurse in NF days per week: 5
QI tool Medication management/ review
Role of nurse: Clinical care and education
Care Paths ECCP-specific model elements: Collaborative Care Review
NOTE: APRN = advanced practice registered nurses; ECCP = Enhanced Care and Coordination Provider; FTE = full-time equivalent; NF = nursing facility; QI = quality improvement; RN = registered nurse; SBAR = Situation, Background, Assessment, and Recommendation.
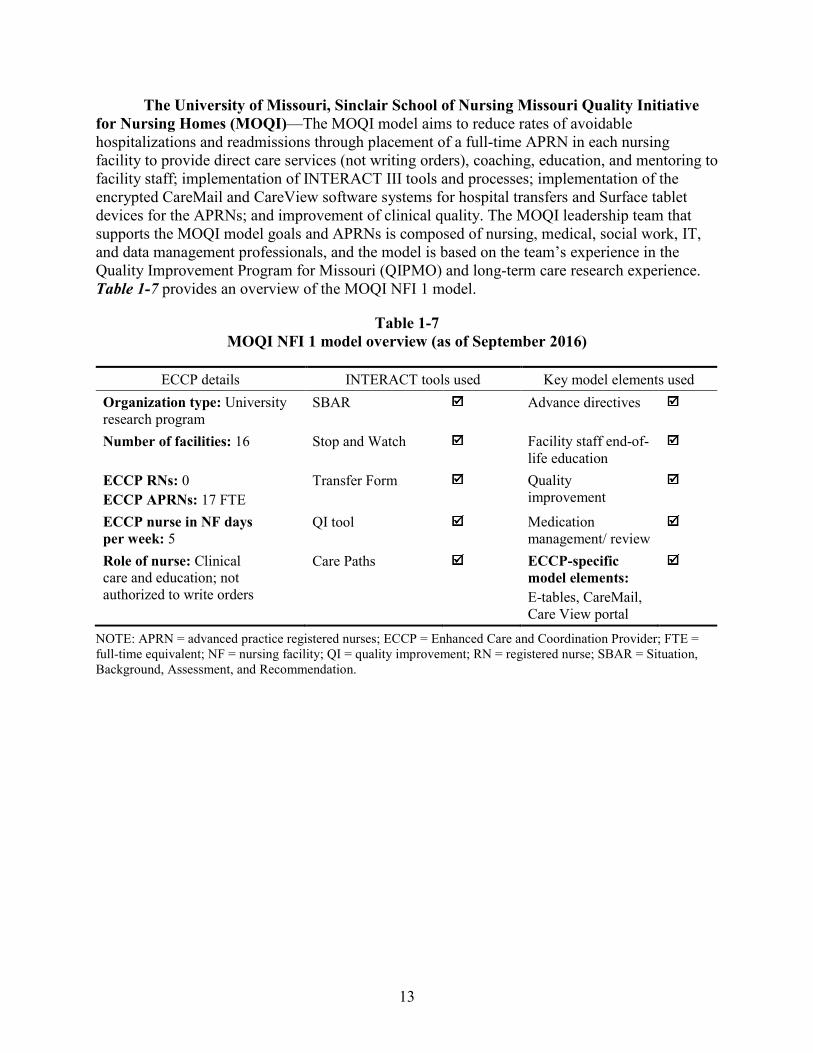
13
The University of Missouri, Sinclair School of Nursing Missouri Quality Initiative for Nursing Homes (MOQI)—The MOQI model aims to reduce rates of avoidable hospitalizations and readmissions through placement of a full-time APRN in each nursing facility to provide direct care services (not writing orders), coaching, education, and mentoring to facility staff; implementation of INTERACT III tools and processes; implementation of the encrypted CareMail and CareView software systems for hospital transfers and Surface tablet devices for the APRNs; and improvement of clinical quality. The MOQI leadership team that supports the MOQI model goals and APRNs is composed of nursing, medical, social work, IT, and data management professionals, and the model is based on the team’s experience in the Quality Improvement Program for Missouri (QIPMO) and long-term care research experience. Table 1-7 provides an overview of the MOQI NFI 1 model.
Table 1-7 MOQI NFI 1 model overview (as of September 2016)
ECCP details INTERACT tools used Key model elements used Organization type: University research program
SBAR Advance directives
Number of facilities: 16 Stop and Watch Facility staff end-of-life education
ECCP RNs: 0 ECCP APRNs: 17 FTE
Transfer Form Quality improvement
ECCP nurse in NF days per week: 5
QI tool Medication management/ review
Role of nurse: Clinical care and education; not authorized to write orders
Care Paths ECCP-specific model elements: E-tables, CareMail, Care View portal
NOTE: APRN = advanced practice registered nurses; ECCP = Enhanced Care and Coordination Provider; FTE = full-time equivalent; NF = nursing facility; QI = quality improvement; RN = registered nurse; SBAR = Situation, Background, Assessment, and Recommendation.
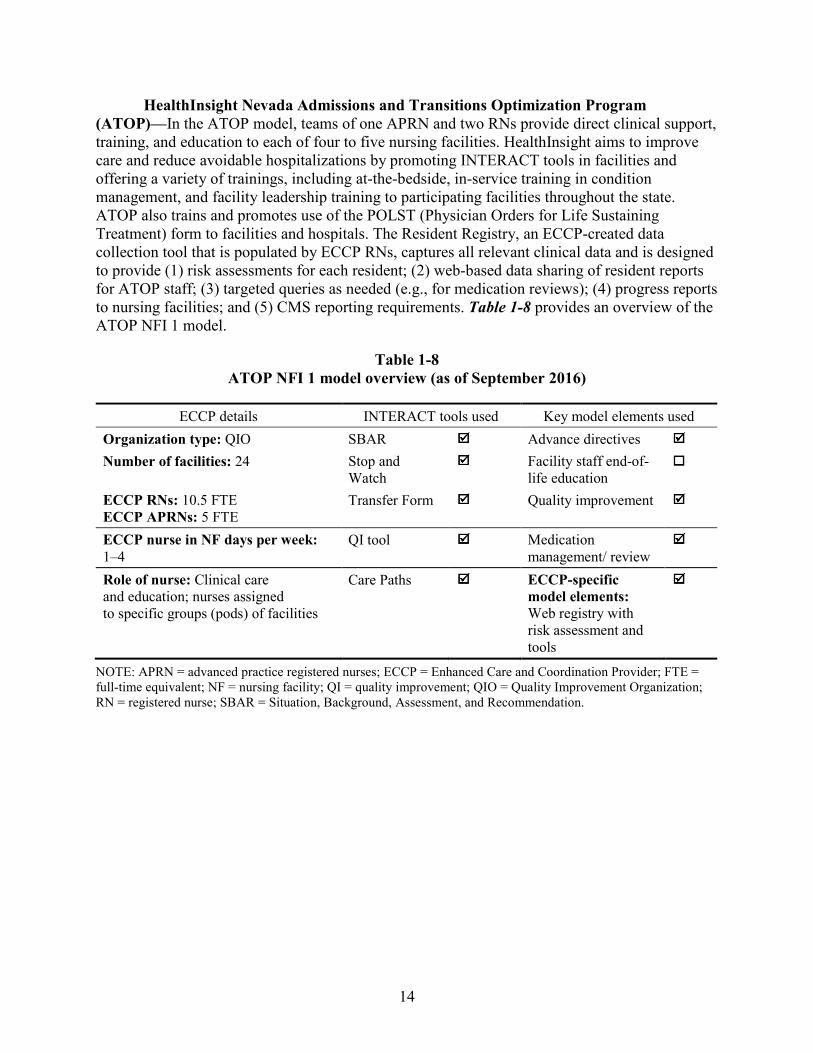
14
HealthInsight Nevada Admissions and Transitions Optimization Program (ATOP)—In the ATOP model, teams of one APRN and two RNs provide direct clinical support, training, and education to each of four to five nursing facilities. HealthInsight aims to improve care and reduce avoidable hospitalizations by promoting INTERACT tools in facilities and offering a variety of trainings, including at-the-bedside, in-service training in condition management, and facility leadership training to participating facilities throughout the state. ATOP also trains and promotes use of the POLST (Physician Orders for Life Sustaining Treatment) form to facilities and hospitals. The Resident Registry, an ECCP-created data collection tool that is populated by ECCP RNs, captures all relevant clinical data and is designed to provide (1) risk assessments for each resident; (2) web-based data sharing of resident reports for ATOP staff; (3) targeted queries as needed (e.g., for medication reviews); (4) progress reports to nursing facilities; and (5) CMS reporting requirements. Table 1-8 provides an overview of the ATOP NFI 1 model.
Table 1-8 ATOP NFI 1 model overview (as of September 2016)
ECCP details INTERACT tools used Key model elements used Organization type: QIO SBAR Advance directives Number of facilities: 24 Stop and
Watch Facility staff end-of-
life education
ECCP RNs: 10.5 FTE ECCP APRNs: 5 FTE
Transfer Form Quality improvement
ECCP nurse in NF days per week: 1–4
QI tool Medication management/ review
Role of nurse: Clinical care and education; nurses assigned to specific groups (pods) of facilities
Care Paths ECCP-specific model elements: Web registry with risk assessment and tools
NOTE: APRN = advanced practice registered nurses; ECCP = Enhanced Care and Coordination Provider; FTE = full-time equivalent; NF = nursing facility; QI = quality improvement; QIO = Quality Improvement Organization; RN = registered nurse; SBAR = Situation, Background, Assessment, and Recommendation.
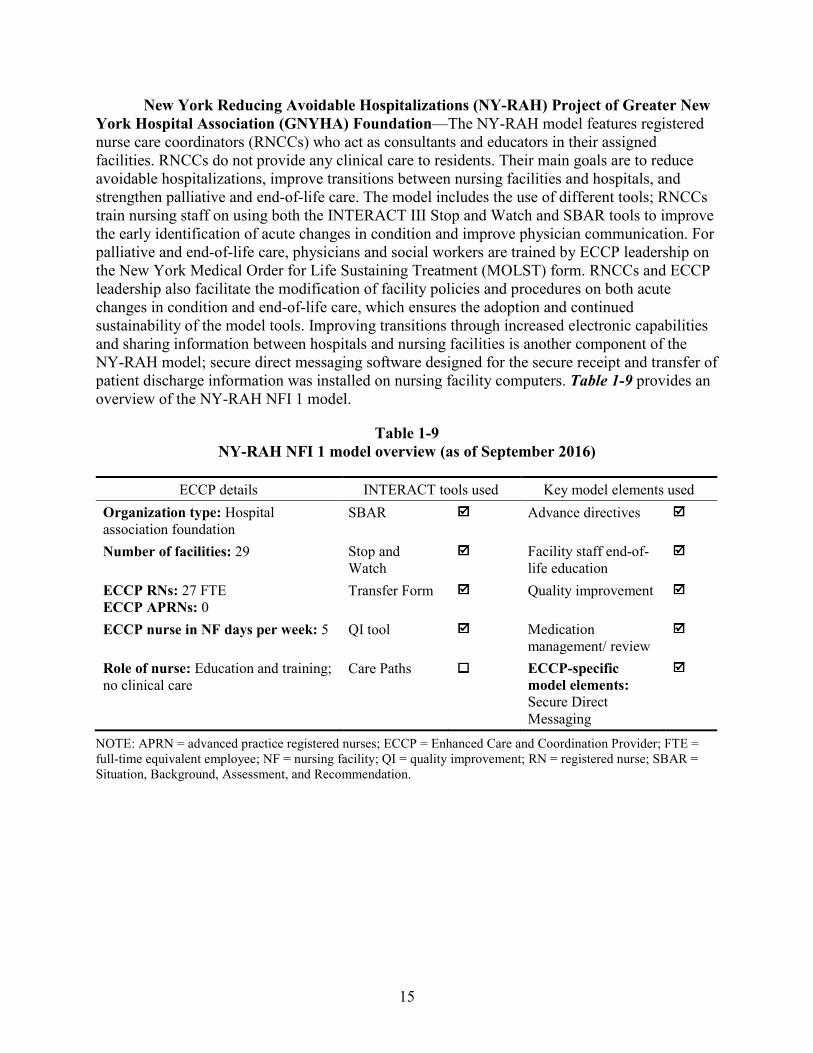
15
New York Reducing Avoidable Hospitalizations (NY-RAH) Project of Greater New York Hospital Association (GNYHA) Foundation—The NY-RAH model features registered nurse care coordinators (RNCCs) who act as consultants and educators in their assigned facilities. RNCCs do not provide any clinical care to residents. Their main goals are to reduce avoidable hospitalizations, improve transitions between nursing facilities and hospitals, and strengthen palliative and end-of-life care. The model includes the use of different tools; RNCCs train nursing staff on using both the INTERACT III Stop and Watch and SBAR tools to improve the early identification of acute changes in condition and improve physician communication. For palliative and end-of-life care, physicians and social workers are trained by ECCP leadership on the New York Medical Order for Life Sustaining Treatment (MOLST) form. RNCCs and ECCP leadership also facilitate the modification of facility policies and procedures on both acute changes in condition and end-of-life care, which ensures the adoption and continued sustainability of the model tools. Improving transitions through increased electronic capabilities and sharing information between hospitals and nursing facilities is another component of the NY-RAH model; secure direct messaging software designed for the secure receipt and transfer of patient discharge information was installed on nursing facility computers. Table 1-9 provides an overview of the NY-RAH NFI 1 model.
Table 1-9 NY-RAH NFI 1 model overview (as of September 2016)
ECCP details INTERACT tools used Key model elements used Organization type: Hospital association foundation
SBAR Advance directives
Number of facilities: 29 Stop and Watch
Facility staff end-of-life education
ECCP RNs: 27 FTE ECCP APRNs: 0
Transfer Form Quality improvement
ECCP nurse in NF days per week: 5 QI tool Medication management/ review
Role of nurse: Education and training; no clinical care
Care Paths ECCP-specific model elements: Secure Direct Messaging
NOTE: APRN = advanced practice registered nurses; ECCP = Enhanced Care and Coordination Provider; FTE = full-time equivalent employee; NF = nursing facility; QI = quality improvement; RN = registered nurse; SBAR = Situation, Background, Assessment, and Recommendation.
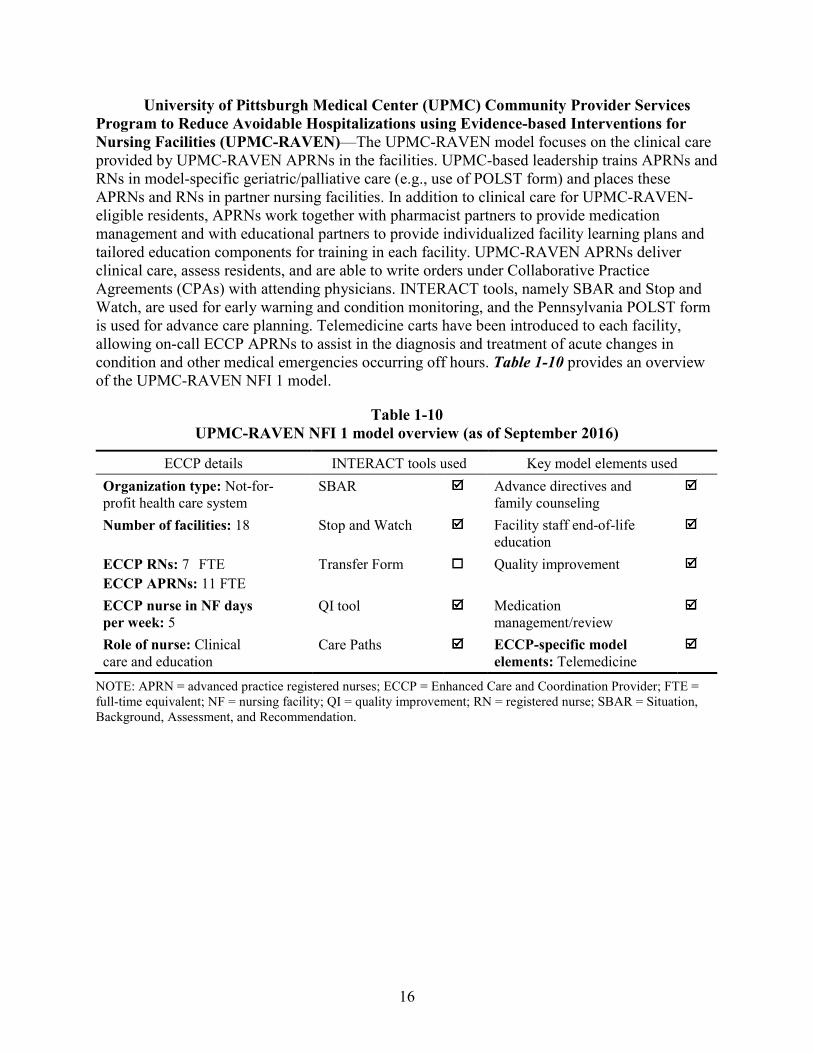
16
University of Pittsburgh Medical Center (UPMC) Community Provider Services Program to Reduce Avoidable Hospitalizations using Evidence-based Interventions for Nursing Facilities (UPMC-RAVEN)—The UPMC-RAVEN model focuses on the clinical care provided by UPMC-RAVEN APRNs in the facilities. UPMC-based leadership trains APRNs and RNs in model-specific geriatric/palliative care (e.g., use of POLST form) and places these APRNs and RNs in partner nursing facilities. In addition to clinical care for UPMC-RAVEN-eligible residents, APRNs work together with pharmacist partners to provide medication management and with educational partners to provide individualized facility learning plans and tailored education components for training in each facility. UPMC-RAVEN APRNs deliver clinical care, assess residents, and are able to write orders under Collaborative Practice Agreements (CPAs) with attending physicians. INTERACT tools, namely SBAR and Stop and Watch, are used for early warning and condition monitoring, and the Pennsylvania POLST form is used for advance care planning. Telemedicine carts have been introduced to each facility, allowing on-call ECCP APRNs to assist in the diagnosis and treatment of acute changes in condition and other medical emergencies occurring off hours. Table 1-10 provides an overview of the UPMC-RAVEN NFI 1 model.
Table 1-10 UPMC-RAVEN NFI 1 model overview (as of September 2016)
ECCP details INTERACT tools used Key model elements used Organization type: Not-for-profit health care system
SBAR Advance directives and family counseling
Number of facilities: 18 Stop and Watch Facility staff end-of-life education
ECCP RNs: 7 FTE ECCP APRNs: 11 FTE
Transfer Form Quality improvement
ECCP nurse in NF days per week: 5
QI tool Medication management/review
Role of nurse: Clinical care and education
Care Paths ECCP-specific model elements: Telemedicine
NOTE: APRN = advanced practice registered nurses; ECCP = Enhanced Care and Coordination Provider; FTE = full-time equivalent; NF = nursing facility; QI = quality improvement; RN = registered nurse; SBAR = Situation, Background, Assessment, and Recommendation.
17
1.3 Overview of Evaluation Methods We use quantitative and qualitative research methods to evaluate the effectiveness of the
NFI 2. The general evaluation design features are discussed below.
Quantitative Analysis. We employ a quasi-experimental study design to evaluate the impact of the interventions on utilization outcomes; expenditures; quality of care, health, and functional outcomes; mortality; and other end-of-life outcomes for long-stay nursing facility residents in Initiative-participating facilities. This involves using propensity-matched comparison nursing facilities in a difference-in-differences multivariate regression model.
We will conduct separate evaluations in each state because of the different clinical and educational interventions implemented by each state-based ECCP. Separate analyses will be conducted for Group A and Group B within each state because we view these as two separate arms of interventions. Pooled analysis across states will also be conducted, separately for Group A and Group B, where appropriate, to evaluate the overall impact of the Initiative. To measure outcomes, we will analyze a wide range of quantitative data sources (further described in Section 2), such as Medicare and Medicaid claims and the Minimum Data Set (MDS). In addition, we will use resident-level data sources to obtain control variables for inclusion in regression models. The control variables for facility characteristics will be obtained from the CASPER (Certification and Survey Provider Enhanced Reports) data.
The effect of the intervention is measured using outcomes of the interventions. We measure utilization and spending, and estimate changes related to being in NFI 2 facilities relative to comparisons. The eligible residents are determined in the same way in Group A, Group B, and both comparison groups. All the outcomes are also measured the same way across all groups. We use information on the activities in the participating facilities to give context to the quantitative findings, but do not use that information in determining if favorable effects occurred.
Multivariate analyses require at least one completed year of data following the official start of NFI 2 on October 1, 2016. Some ECCPs began implementation in November or December 2016. Such analyses are scheduled to be reported starting with Annual Report Two in August 2018. Beginning in Annual Report Two, we will also report the use of the new billing codes in Group A and Group B facilities across states and will examine the link between the use of the new billing codes and utilization and expenditure outcomes.
In the present annual report, we report two sets of quantitative activities. In Section 4 below, we describe how we selected two groups of comparison facilities, specific to each of the two groups (Group A and Group B) of intervention facilities under NFI 2. The presentation of these detailed results about the selection of comparison facilities is unique to the present report and will not be repeated in future reports. In addition, in Section 6 of this annual report, we report descriptive measures for key utilization and expenditure outcomes of interest for the Initiative-participating facilities and their matched comparison facilities.
Because of the October start date of NFI 2, our analyses in this and all future reports will be based on fiscal years from October–September. All analyses presented in Section 6 of this
18
report are based on the base year of October 2015–September 2016, prior to the start of NFI 2. Unless otherwise noted, references to a year in this report refer to a fiscal year.
Qualitative Data Collection and Analysis. We employ several methods to collect qualitative data for this project. Specifically, RTI conducts site visits, telephone interviews, key stakeholder interviews, a nursing facility administrator survey, and a survey of medical practitioners (physicians, physician assistants, and APRNs) participating in NFI 2. Relevant state polices (such as Medicaid bed-hold policies), as well as federal and state innovations and demonstrations related to the Initiative or similar efforts are examined under the stakeholder interview task. Under this task, we work with our consultant Dr. Mary Naylor to examine and classify state policies and regulations related to scope of practice and licensing for APRNs, as well as examine other licensing issues related to NFI 2 as these policies can impact the scope of nursing practice in ways that may affect avoidable hospitalization rates. We will also ask about whether facility practices are affected by the presence of managed care plans or other nonpolicy-related drivers.
Formal protocols for site visits and telephone surveys are used to ensure standardized qualitative data are collected. These protocols have already been developed and field tested under NFI 1 and have been further modified to meet the more complex evaluation needs under NFI 2. The qualitative data analyses complement quantitative data analyses, providing critical context to interpret evaluation findings. In addition to aiding the interpretation of quantitative analysis results, the qualitative data analyses will deepen our understanding of the ECCPs and their partnering nursing facilities (both Group A and Group B) in the process of implementing various models for the Initiative, allow us to assess the fidelity to the ECCPs’ original Initiative design (in Group B), and gather necessary information to describe barriers to implementation. Qualitative data collection and analysis will also inform constructing measures of specific intervention features that can be incorporated in quantitative analyses to evaluate their effects on key outcomes.
For this report, data collection includes telephone interviews conducted through July 2017. A full schedule of qualitative data activities is described in Section 7 of this report.
19
SECTION 2 DATA SOURCES
2.1 Data for Quantitative Analyses
RTI uses a number of CMS administrative data sources for this evaluation, including the MDS, Medicare claims and eligibility data, nursing facility data, Medicaid data (planned), and Medicare Advantage (MA) encounter data (planned). RTI has secured the necessary Data Use Agreements (DUAs) to obtain these data files. RTI will also evaluate the appropriateness of using the administrative data submitted to CMS by each ECCP and collected by the implementation contractor as these data become available. Below, we briefly describe these data sources and their planned use in our analyses.
2.1.1 Resident Assessment Data—Minimum Data Set 3.0
RTI uses the Minimum Data Set (MDS) 3.0 as the data source for identifying Initiative-eligible residents and Initiative-related exposure periods; defining the resident-level, MDS-based quality outcomes; and identifying some of the resident-level characteristics (used in multivariate modeling) associated with these outcomes. MDS is also used to define aggregated facility-level resident characteristics, including resident mix by demographic characteristics (e.g., age, gender, and race) and case mix, which we use as control variables and in propensity score matching to select comparison facilities. We use a 6-week runout time for MDS data; that is, we request MDS data for the target quarter about 6 weeks after the end of the quarter so that almost all data for the target quarter have been submitted.
All Medicare- and Medicaid-certified nursing facilities are required to collect and submit MDS data to CMS for every resident in a certified bed (regardless of payment sources) on admission, quarterly, and annually, as well as upon a significant change in resident status, and to submit any significant corrections to prior comprehensive or quarterly assessments. In addition, facilities are required to submit assessments when residents are discharged from the facility, regardless of plan for returning. The data collection and submission requirement is intended to encourage facilities to base a given resident’s care planning on a comprehensive set of health and functional information. In addition, providers must complete and submit assessments for Medicare beneficiaries who receive Medicare Part A–covered post-acute care. These assessments are completed at 5, 14, 30, 60, and 90 days of the Medicare Part A stay and upon readmission or return to the facility. Thus, examining the MDS data stream for each resident allows the identification of the resident’s time residing in or out of the facility.
MDS items measure each resident’s demographic characteristics, physical health (e.g., chronic diseases, infections, and skin conditions), mental health (e.g., mood and psychological status), and functional and cognitive status (e.g., activities of daily living [ADL] and cognitive performance) and give a multidimensional view of his/her health and functional status. MDS 3.0 has excellent to very good reliability, or reproducibility of measurement, when assessments by research nurses are compared to assessments by facility nurses (Saliba and Buchanan, 2008).
20
2.1.2 Medicare Claims and Eligibility
RTI uses Medicare claims as the data source for tracking outcomes on service utilization (e.g., hospitalizations, ED visits) and expenditures. For NFI 2, CMS has approved the use of the Medicare enrollment, eligibility, and claims data through the CMS Integrated Data Repository (IDR) system. With data updated on a weekly (or at least monthly) basis, the IDR provides more timely and complete data that better meet CMS’s needs for rapid-cycle reporting (through RTI’s ongoing midyear reports). The IDR also provides up-to-date monthly indicators for dual-eligible status, which we use to identify dual-eligible residents in our analyses.
RTI creates Medicare utilization and expenditure measures per beneficiary in each fiscal year (or within 6-month periods for the midyear reports). We allow 3 months for claims runout from the end of the fiscal year (or the end of each 6-month period). A longer runout period would allow more time for late submissions or adjustments; however, it would leave less time for processing and analyzing those claims for the annual or midyear reports. We make an exception and use a 6-month runout period to be able to detect the use of the new billing codes, which may have a longer delay.
In addition to using Medicare data to track outcomes (utilization events and expenditures), we will also use Medicare data to capture resident-level health characteristics for use in multivariate modeling. For this purpose, we will use Medicare Hierarchical Condition Categories (HCCs), which are updated by CMS annually and are derived from ICD-10-CM codes on principal hospital inpatient, secondary hospital inpatient, hospital outpatient, physician, and clinically trained nonphysicians’ claims. HCCs are clinically meaningful groupings of ICD-10 diagnosis codes maintained by CMS to risk adjust capitation payments to MA insurance plans. HCCs are binary variables: a given Medicare beneficiary is designated as having or not having a condition or diagnosis contained in a given HCC cluster. HCC data for beneficiaries for a given year represent information from claims submitted during the prior year. CMS first implemented the RTI-designed HCC model for capitation in 2004.
2.1.3 Nursing Facility Data
We use data from the CMS CASPER system, and Nursing Home Compare, to identify facility characteristics of the intervention groups. These characteristics, including inspection survey-based measures of quality and staffing levels, are then used for selecting comparison groups. Selected characteristics will also be included in multivariate analyses of individual-level outcomes.
CASPER (formerly known as OSCAR, or Online Survey Certification and Reporting) is a data system maintained by CMS in cooperation with the state long-term care survey agencies. CASPER includes a compilation of data collected by surveyors during the on-site inspection surveys conducted at nursing facilities for the purpose of certification for and continued participation in the Medicare and Medicaid programs. CASPER is the most comprehensive source of facility-level information on the operations, patient census, and regulatory compliance of nursing facilities. Most information in the CASPER system is typically collected during on-site evaluations conducted by state survey agencies. The evaluations occur at least once during a 15-month period (with a 12-month statewide average), with additional surveys occurring because of a complaint being investigated. Thus, although the time lag for facility data should be small
21
compared to other data sources (e.g., Medicaid claims), the information may not reflect the most current status.
Staffing data from CASPER is known to be unreliable, with the potential for gaming schedules by facilities, but the new Payroll-based Journal (PBJ) system is designed to be more precise and to feed from payroll systems. Facilities were required to submit through the recently developed PBJ system beginning in July 2016. It is not known how reliable the data are at this time. The first posted files are expected to be available in November 2017. We will compare information from these early files with data from CASPER as a first level of check of credibility and robustness. Data from this system is too late to be used in the comparison group matching process.
Nursing Home Compare (NHC), which is part of public reporting, provides quality of resident care and staffing information for more than 15,000 Medicare- and Medicaid-certified nursing facilities across the country. It includes a compilation of nursing facility inspection results, staffing levels, federal penalties, and quality ratings in specific areas of care. The star rating feature gives each facility a rating between one and five stars, from poor to excellent, based on health inspection, staffing, and quality of resident care measures. Each facility receives a star rating for each of the three domains along with an overall star rating. Data about staffing, penalties, nursing facility characteristics, and health deficiencies are reported from CMS’s health inspection database.
2.1.4 Medicaid Data
The transition from Medicaid Statistical Information System (MSIS) to Transformed Medicaid Statistical Information System (T-MSIS) is currently underway, and the last quarter a state could report to CMS in MSIS was July to September 2015. Some, but not all states, began the transition to T-MSIS prior to this date and may therefore have data in the T-MSIS system for both the base year and Initiative years. However, T-MSIS data are not anticipated to be available until 2018 and will not be available for all states initially. We continue to monitor the availability of T-MSIS data for states relevant to the Initiative and will begin processing Medicaid data (eligibility and claims) as soon as it is available through T-MSIS.
2.1.5 Medicare Advantage Institutional Special Needs Plans Enrollee Data and Encounter Data
RTI will analyze MA encounter data from Institutional Special Needs Plans (I-SNPs) to understand the service utilization of beneficiaries enrolled in these plans and how I-SNP presence affects NFI. We will identify I-SNPs through the enrollment information available on the CMS website. These files provide the plan identifier and general geographic area of operation, but do not describe plans’ areas of operation in a uniform way; some plans are defined at the county level, while other plans are defined regionally (e.g., Upstate New York). Additional research will be required to understand which I-SNPs are operational in the geographic areas involved in the Initiative. Specifically, after identifying a set of I-SNPs with coverage areas in the Initiative and comparison states we will use the Common Medicare Environment (CME) or monthly membership files to obtain the MA contract and plan numbers for I-SNP enrollees. We will then match these I-SNP enrollees to MDS assessments to determine whether they are
22
residents of an ECCP facility or of a comparison facility. In addition, we will also be inquiring about the extent of overlap with I-SNPs and other MA plans via qualitative data collection.
We are aware that the MDS assessments filed for MA plan enrollees are less frequent than the assessments for SNF patients covered under the Medicare SNF Prospective Payment System. We will carefully examine the pattern of assessments associated with the I-SNP population because they will be following the rules for MA plans and Medicaid. We expect to be able to identify the admission dates for both the fee-for-service (FFS) and MA long-stay residents to count length of stay in a facility to determine eligibility using the OBRA (Omnibus Budget Reconciliation Act)-type Comprehensive Assessments.
For utilization of services the resident IDs must be matched to the encounter data in the IDR. Although payment information on encounter records is not fully comparable to FFS claims, the encounters are markers for utilization—inpatient stays and ED visits, to some level of accuracy. Potential data challenges are discussed in Section 2.2.
2.2 Challenges in Quantitative Data Analysis
We note several challenges associated with the quantitative data analysis.
2.2.1 Medicaid Data
We anticipate that there may be challenges associated with the new T-MSIS data. Although T-MSIS data are anticipated to be timely, accurate, and readily available, it is not known how the system will perform over time. As with the prior MSIS data, the coding of the T-MSIS data varies by state. The MSIS system, and to a greater extent, the more uniformly coded Medicaid Analytic eXtract (MAX) system, face significant challenges in providing timely data to researchers and stakeholders.
2.2.2 MA Encounter/I-SNP Data
The MA encounter data may be used in a limited way to address comparisons of service utilization among nursing facility residents. These files contain no usable payment information. Monthly capitation payments, which may be found in another CMS source, would not be useful in determining service use. Even if encounters are pulled from the IDR with payment fields, the accuracy of the payments, both the imputed FFS payments and plan-reported payments, is not established. The data can be used to do descriptive analysis for the I-SNP and other plans, tabulating counts of hospitalizations, potentially avoidable hospitalizations, and other services. Comparisons can be made to all the groups for which data are collected, but attempts at modeling with risk adjustment would have to be interpreted with caution because diagnosis coding in MA plans is known to differ in intensity from FFS coding. For plan capitated payments, adjustments are made in the risk scores of MA enrollees to compensate for the relatively high coding of number of conditions and their severity.
2.2.3 Confounding Factors
Of interest to CMS is the potential for unrelated initiatives and interventions to mask or otherwise distort the effects of this Initiative. RTI’s survey of comparison facilities in NFI 1 indicated that a majority of responding facilities had introduced Initiative-analogous practices to
23
reduce potentially avoidable hospitalizations among their long-stay residents, despite being uninvolved in this Initiative. For NFI 2, RTI will pull data for the residents and providers from the Master Data Management (MDM) system to discover overlaps of other Medicare programs. Markers for the various overlaps (e.g., Accountable Care Organizations [ACOs], bundled payment initiatives) will be created and used in the multivariate analyses to attempt to control for confounding effects. Current RTI projects that use the MDM system include the Medicare Shared Savings Program and other ACO Programs, and the Measurement and Evaluation of the Medicare-Medicaid Financial Alignment Initiative. Our prior experience suggests that the greatest data challenges for MDM are primarily operational. Given the designated predetermined “windows” throughout the year when specific programs can upload their enrollment information, there are some data lags.
For NFI 2, we also plan to interview key state administrators and other stakeholders to develop an understanding of the local policy environment and any other potentially competing initiatives. These interviews will also keep RTI up to date on changes in Medicare rulemaking, the MA program, other initiatives sponsored by CMS, and/or changes in individual Medicaid state plans and programs. The presence of these federal- and state-level programs will likely affect both the Initiative and the comparison groups, but perhaps not to the same degree. We have also added questions to our site visit protocol to assess the impact of managed care, particularly I-SNP penetration, as well as other activities that may have overlapping effects with the Initiative, including interventions to reduce hospital readmissions during post-acute periods that coincide with SNF coverage. For more detailed information, please see Section 7. Our team will integrate the MDM system data into our models, along with insights from the qualitative data collection.

24
[This page intentionally left blank.]
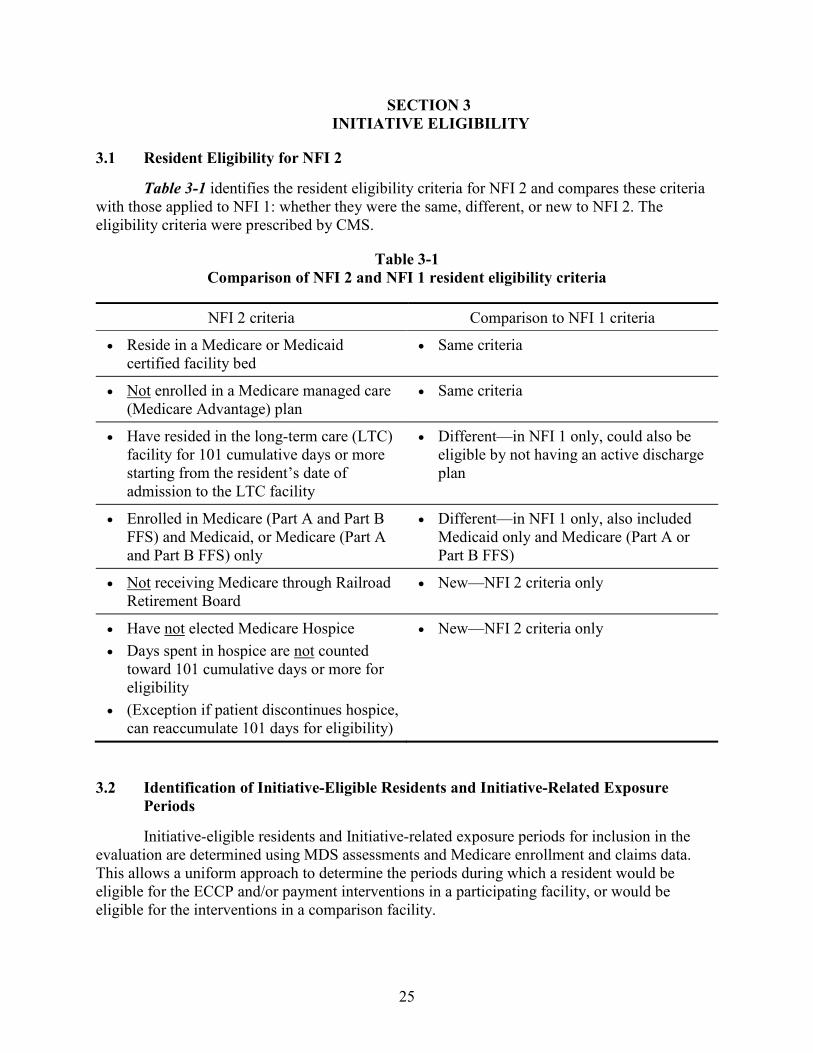
25
SECTION 3 INITIATIVE ELIGIBILITY
3.1 Resident Eligibility for NFI 2
Table 3-1 identifies the resident eligibility criteria for NFI 2 and compares these criteria with those applied to NFI 1: whether they were the same, different, or new to NFI 2. The eligibility criteria were prescribed by CMS.
Table 3-1 Comparison of NFI 2 and NFI 1 resident eligibility criteria
NFI 2 criteria Comparison to NFI 1 criteria
• Reside in a Medicare or Medicaid certified facility bed
• Same criteria
• Not enrolled in a Medicare managed care (Medicare Advantage) plan
• Same criteria
• Have resided in the long-term care (LTC) facility for 101 cumulative days or more starting from the resident’s date of admission to the LTC facility
• Different—in NFI 1 only, could also be eligible by not having an active discharge plan
• Enrolled in Medicare (Part A and Part B FFS) and Medicaid, or Medicare (Part A and Part B FFS) only
• Different—in NFI 1 only, also included Medicaid only and Medicare (Part A or Part B FFS)
• Not receiving Medicare through Railroad Retirement Board
• New—NFI 2 criteria only
• Have not elected Medicare Hospice • Days spent in hospice are not counted
toward 101 cumulative days or more for eligibility
• (Exception if patient discontinues hospice, can reaccumulate 101 days for eligibility)
• New—NFI 2 criteria only
3.2 Identification of Initiative-Eligible Residents and Initiative-Related Exposure Periods
Initiative-eligible residents and Initiative-related exposure periods for inclusion in the evaluation are determined using MDS assessments and Medicare enrollment and claims data. This allows a uniform approach to determine the periods during which a resident would be eligible for the ECCP and/or payment interventions in a participating facility, or would be eligible for the interventions in a comparison facility.
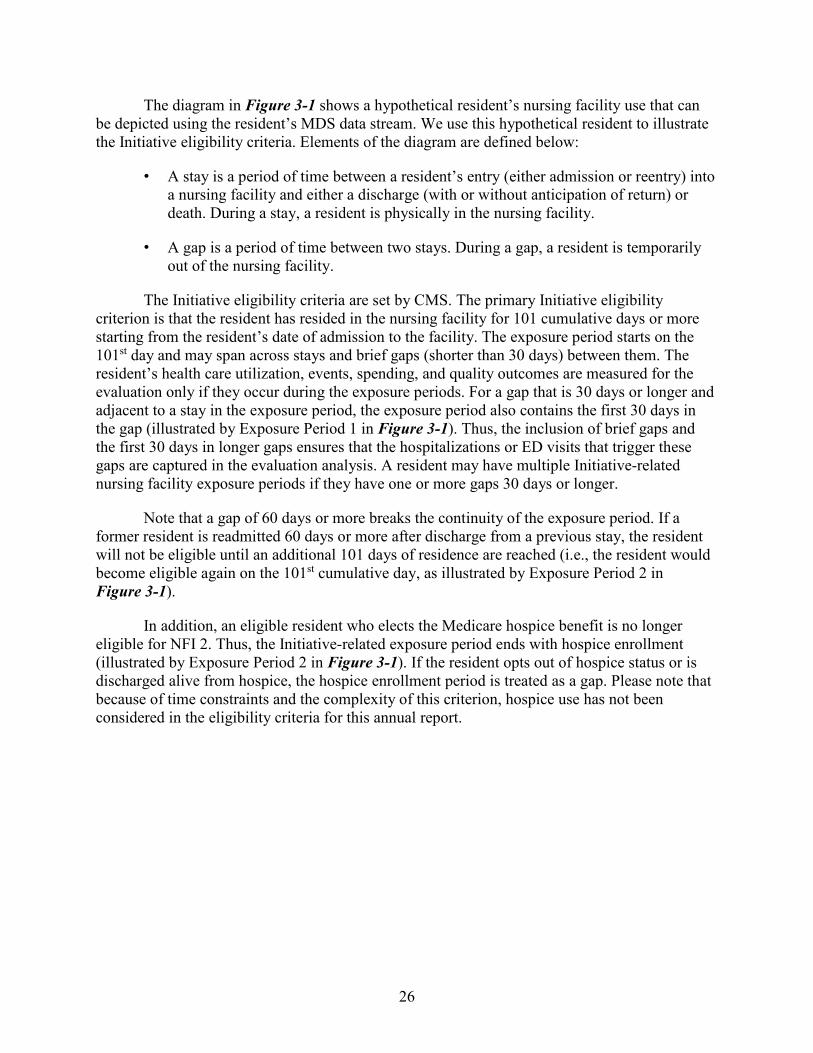
26
The diagram in Figure 3-1 shows a hypothetical resident’s nursing facility use that can be depicted using the resident’s MDS data stream. We use this hypothetical resident to illustrate the Initiative eligibility criteria. Elements of the diagram are defined below:
• A stay is a period of time between a resident’s entry (either admission or reentry) into a nursing facility and either a discharge (with or without anticipation of return) or death. During a stay, a resident is physically in the nursing facility.
• A gap is a period of time between two stays. During a gap, a resident is temporarily out of the nursing facility.
The Initiative eligibility criteria are set by CMS. The primary Initiative eligibility criterion is that the resident has resided in the nursing facility for 101 cumulative days or more starting from the resident’s date of admission to the facility. The exposure period starts on the 101st day and may span across stays and brief gaps (shorter than 30 days) between them. The resident’s health care utilization, events, spending, and quality outcomes are measured for the evaluation only if they occur during the exposure periods. For a gap that is 30 days or longer and adjacent to a stay in the exposure period, the exposure period also contains the first 30 days in the gap (illustrated by Exposure Period 1 in Figure 3-1). Thus, the inclusion of brief gaps and the first 30 days in longer gaps ensures that the hospitalizations or ED visits that trigger these gaps are captured in the evaluation analysis. A resident may have multiple Initiative-related nursing facility exposure periods if they have one or more gaps 30 days or longer.
Note that a gap of 60 days or more breaks the continuity of the exposure period. If a former resident is readmitted 60 days or more after discharge from a previous stay, the resident will not be eligible until an additional 101 days of residence are reached (i.e., the resident would become eligible again on the 101st cumulative day, as illustrated by Exposure Period 2 in Figure 3-1).
In addition, an eligible resident who elects the Medicare hospice benefit is no longer eligible for NFI 2. Thus, the Initiative-related exposure period ends with hospice enrollment (illustrated by Exposure Period 2 in Figure 3-1). If the resident opts out of hospice status or is discharged alive from hospice, the hospice enrollment period is treated as a gap. Please note that because of time constraints and the complexity of this criterion, hospice use has not been considered in the eligibility criteria for this annual report.
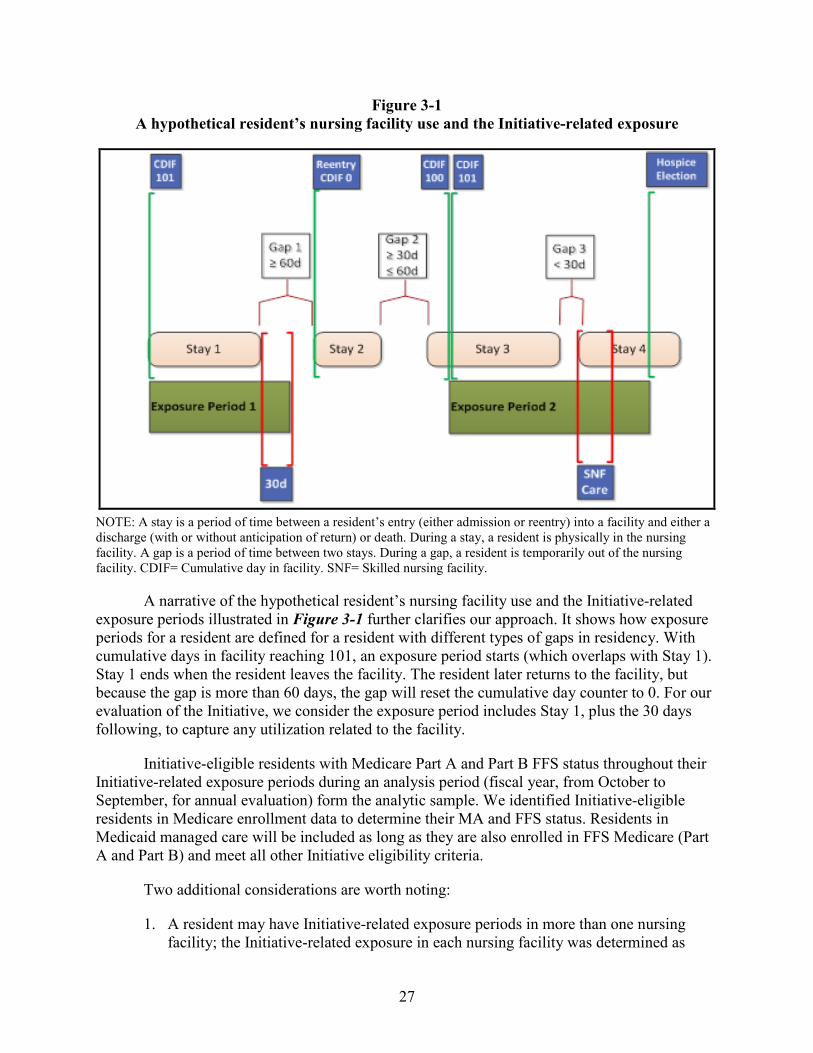
27
Figure 3-1 A hypothetical resident’s nursing facility use and the Initiative-related exposure
NOTE: A stay is a period of time between a resident’s entry (either admission or reentry) into a facility and either a discharge (with or without anticipation of return) or death. During a stay, a resident is physically in the nursing facility. A gap is a period of time between two stays. During a gap, a resident is temporarily out of the nursing facility. CDIF= Cumulative day in facility. SNF= Skilled nursing facility.
A narrative of the hypothetical resident’s nursing facility use and the Initiative-related exposure periods illustrated in Figure 3-1 further clarifies our approach. It shows how exposure periods for a resident are defined for a resident with different types of gaps in residency. With cumulative days in facility reaching 101, an exposure period starts (which overlaps with Stay 1). Stay 1 ends when the resident leaves the facility. The resident later returns to the facility, but because the gap is more than 60 days, the gap will reset the cumulative day counter to 0. For our evaluation of the Initiative, we consider the exposure period includes Stay 1, plus the 30 days following, to capture any utilization related to the facility.
Initiative-eligible residents with Medicare Part A and Part B FFS status throughout their Initiative-related exposure periods during an analysis period (fiscal year, from October to September, for annual evaluation) form the analytic sample. We identified Initiative-eligible residents in Medicare enrollment data to determine their MA and FFS status. Residents in Medicaid managed care will be included as long as they are also enrolled in FFS Medicare (Part A and Part B) and meet all other Initiative eligibility criteria.
Two additional considerations are worth noting:
1. A resident may have Initiative-related exposure periods in more than one nursing facility; the Initiative-related exposure in each nursing facility was determined as
28
previously mentioned. When a resident transfers from one nursing facility directly to another (i.e., both the end of the Initiative-related exposure period in the first facility and the start of the Initiative-related exposure period in the second facility fall on the day of transfer), we count utilization, events, and spending starting on the day of transfer against the first facility, as it is more likely to be responsible for these occurrences. This would include the entire cost of a hospital stay with an admission on that day.
2. By including stays and brief gaps, the exposure periods may contain SNF care episodes following hospitalizations and covered under Medicare Part A (illustrated by the SNF care period in Exposure Period 2 in Figure 3-1). Although nursing facilities are not eligible for the Initiative-related payment during these SNF episodes because they are already paid at the higher SNF rate (compared to the Medicaid or private pay nursing facility rate), practitioners participating in the Initiative are eligible for the higher Initiative-related payment and in some Group B (ECCP+payment) facilities, the resident would remain subject to the clinical interventions. Thus, there are Initiative-related incentives, albeit smaller than the rest of the exposure period, to reduce hospitalizations during these SNF episodes.
Upon return to the facility the cumulative day counter starts anew for Stay 2. The resident has not been in the facility for 101 cumulative days when there is another gap, of less than 60 days. This ends Stay 2. The day counter is frozen while the resident is absent less than 60 days and resumes when the resident returns for Stay 3. Because the reset counter has not reached 101 days, this period is not part of an exposure period. During Stay 3 the counter reaches 101 cumulative days and a new period of eligibility for the Initiative starts, as does a second exposure period. Stay 3 ends when the resident again leaves the facility, for less than 30 days this time. The 30-day gap is included in Exposure Period 2 so we can capture hospitalizations or other utilization that may occur during this gap. The resident returns for Stay 4, still in Exposure Period 2. This stay continues, but the exposure period is terminated when the resident elects Medicare hospice care while remaining a resident.
The analyses reported in this annual report focus on the Initiative-related exposure periods in the base year, the fiscal year October 2015 through September 2016 preceding the start of NFI 2.
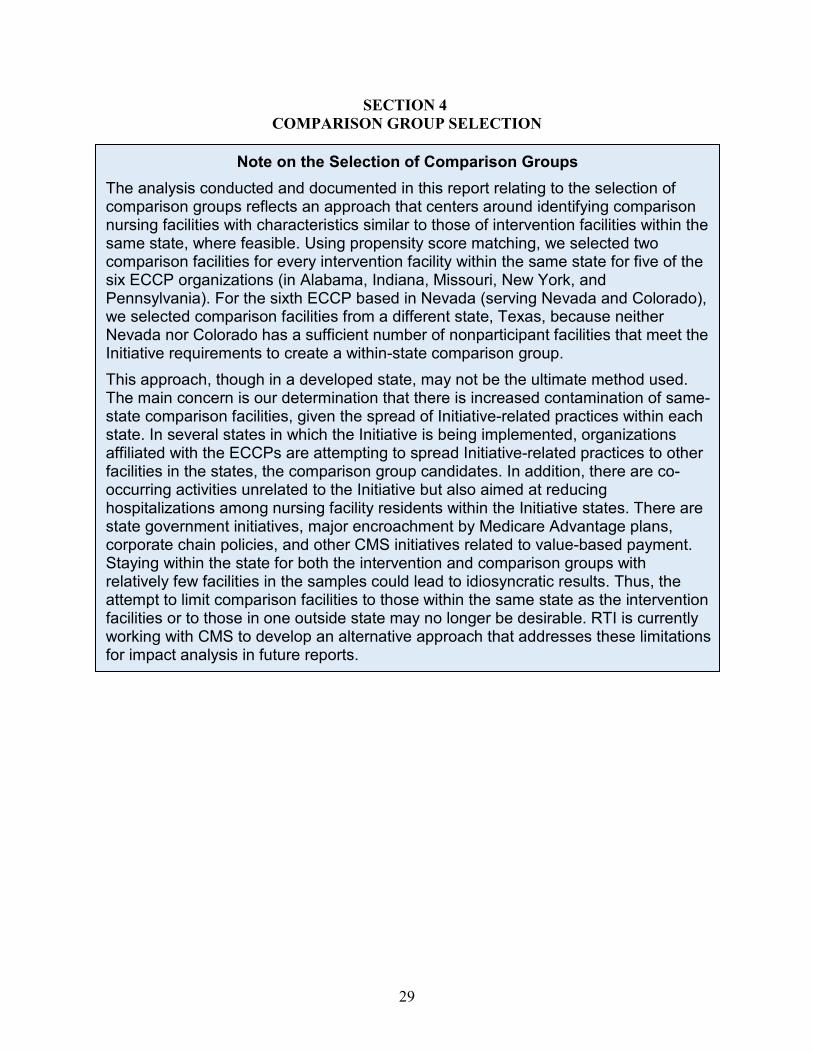
29
SECTION 4 COMPARISON GROUP SELECTION
Note on the Selection of Comparison Groups The analysis conducted and documented in this report relating to the selection of comparison groups reflects an approach that centers around identifying comparison nursing facilities with characteristics similar to those of intervention facilities within the same state, where feasible. Using propensity score matching, we selected two comparison facilities for every intervention facility within the same state for five of the six ECCP organizations (in Alabama, Indiana, Missouri, New York, and Pennsylvania). For the sixth ECCP based in Nevada (serving Nevada and Colorado), we selected comparison facilities from a different state, Texas, because neither Nevada nor Colorado has a sufficient number of nonparticipant facilities that meet the Initiative requirements to create a within-state comparison group. This approach, though in a developed state, may not be the ultimate method used. The main concern is our determination that there is increased contamination of same-state comparison facilities, given the spread of Initiative-related practices within each state. In several states in which the Initiative is being implemented, organizations affiliated with the ECCPs are attempting to spread Initiative-related practices to other facilities in the states, the comparison group candidates. In addition, there are co-occurring activities unrelated to the Initiative but also aimed at reducing hospitalizations among nursing facility residents within the Initiative states. There are state government initiatives, major encroachment by Medicare Advantage plans, corporate chain policies, and other CMS initiatives related to value-based payment. Staying within the state for both the intervention and comparison groups with relatively few facilities in the samples could lead to idiosyncratic results. Thus, the attempt to limit comparison facilities to those within the same state as the intervention facilities or to those in one outside state may no longer be desirable. RTI is currently working with CMS to develop an alternative approach that addresses these limitations for impact analysis in future reports.
30
4.1 Introduction
As in the NFI 1 evaluation, we conducted analyses to identify a set of nursing facilities to serve as a comparison group for the intervention (i.e., ECCP Group A and Group B) facilities participating in the Initiative. This section describes the process of and statistical approach to selecting comparison groups and the results from the comparison group selection analysis.
We used a two-stage, multivariate propensity score modeling (PSM) approach to identify separate comparison groups for Group A and Group B facilities. The ratio of comparison facilities to intervention facilities was chosen to be 2:1. The process of selecting comparison nursing facilities and the analytic approach used to identify the comparison groups are described in greater detail in Section 4.2. In Section 4.3, we present results from the comparison group selection analysis, including histograms to visualize the distribution of propensity scores across the Initiative-participating facilities, candidate comparison facilities, and matched comparison facilities; summary tables showing facility-level characteristics for these three groups; and maps containing the county location and counts of Initiative-participating facilities and matched comparison facilities. Descriptive trends in rates of all-cause and potentially avoidable hospitalizations per 1,000 person-days in the pre-Initiative 3-year period are presented in Section 4.4. Finally, in Section 4.5, we present resident-level characteristics between Initiative participating facilities and matched comparison facilities.
4.2 Process of Comparison Group Selection and Statistical Modeling
In this section, we describe the selection process and the statistical modeling methods for matching comparison groups to the intervention groups. The same selection process and analytic methods were applied in identifying Comparison Group A and Comparison Group B facilities.
To construct comparison groups, we first identified all candidate nursing facilities for the comparison groups (details in Section 4.2.1). After the initial candidate comparison facilities pools were identified, we conducted propensity score matching analysis to select each comparison group (details in Section 4.2.2). The method for propensity score matching in NFI 2 was similar to that used in NFI 1. In this section, we give a brief overview of the methods used to identify comparison groups, highlighting the updates in NFI 2.
4.2.1 Selection of Initial Candidate Comparison Facilities
We identified candidate comparison nursing facilities based on geographic location and the participation criteria for NFI 2. Since the participation criteria for Group A and Group B facilities are different, we constructed the initial candidate comparison facility pool separately for Group A and Group B analysis.
4.2.1.1 Geographic Restriction of Comparison Group Selection As in the NFI 1 evaluation, we restricted the pool of potential comparison nursing
facilities to the same state in which the intervention facilities are located, wherever possible (Feng et al., 2013). This restriction was preferred because of the considerable cross-state variation in ways that may impact the estimation of intervention effects. There are variations from state to state in regulations and policies governing nursing facility care, insurance, labor markets, health care providers, and penetration of MA I-SNPs. These and many other state-
31
specific characteristics could be correlated with the quality of care, health outcomes, health care utilization, and expenditures for nursing facility residents. Medicaid policies and payment for nursing facilities, in particular, vary greatly across the states and over time. These factors, some observed and many unobserved, might influence the estimated effect of the intervention on the outcomes examined in this evaluation. Given these concerns, we selected comparison facilities within the Initiative state wherever possible. A mitigating factor in the cases where same-state comparisons could not be used is that our outcome models include variables that control for a great number of factors that differ between residents, facilities, and the states.
In NFI 2, Group A and Group B facilities collaborate with the same ECCP and are in the same state, with the exception of Group A facilities associated with the Nevada ECCP. The Nevada ECCP Group A facilities are in Colorado as there are too few facilities in Nevada to support more than one group. In Alabama, Indiana, Missouri, New York, and Pennsylvania we selected Comparison Group A and Comparison Group B facilities within each state. For the Nevada ECCP, because of the limited number of nonparticipating facilities available, we selected comparison groups for both the Group B facilities in Nevada and the associated Group A facilities in Colorado from one common comparison state, Texas. The reason for selecting Texas as a common comparison state is, for the most part, practical (detailed below). Because the Nevada Group B facilities and Colorado Group A facilities both operate under the same ECCP, we prefer to draw comparison facilities for each group from the same state—to be consistent, at least conceptually, with the approach used for other ECCPs. In addition, bringing multiple states outside of the ECCP states into the picture would compound the challenge of comparison group matching for both intervention groups because of increased heterogeneity in facility and state attributes.
To select a comparison state for Colorado and Nevada, regional geographic location and number of facilities that met the NFI 2 participation criteria (for both Group A and Group B) were considered. We started with Colorado and the neighboring states of Nevada, including Arizona, California, Idaho, Oregon, and Utah. Then we restricted the facilities to those that would have met the NFI 2 participation criteria (more details follow). After applying these criteria, only California was found to have a sufficient number of nursing facilities for a possible 2:1 match ratio for both Colorado and Nevada. However, we determined that because of the differences in California, both culturally and in Medicaid policy, California would not be the ideal candidate comparison state for Colorado and Nevada. We then explored the remaining neighboring states (Arizona, Idaho, Oregon, and Utah) but found none of them have sufficient numbers of candidate comparison nursing facilities for both groups. Ultimately, we selected Texas as the comparison state, because it has large numbers of candidate nursing facilities that would meet the participation criteria for both groups; it is also close to Colorado and Nevada geographically.
Within a state, it would be desirable to draw comparison facilities from areas close to intervention facilities to minimize potential bias driven by geographic differences in the local health care market conditions and infrastructure of long-term services and supports for the elderly. In New York and Pennsylvania, because of the geographic isolation of the Group A and Group B facilities and the greater number of facilities in these states, we initially limited our selection of comparison facilities to geographic areas where the Group A and Group B facilities are located. However, with the restricted initial comparison nursing facility pool, the propensity score models produced limited matches, as indicated by relatively low overlap in the estimated propensity scores between participating and candidate comparison facilities, suggesting that many of the candidate facilities in
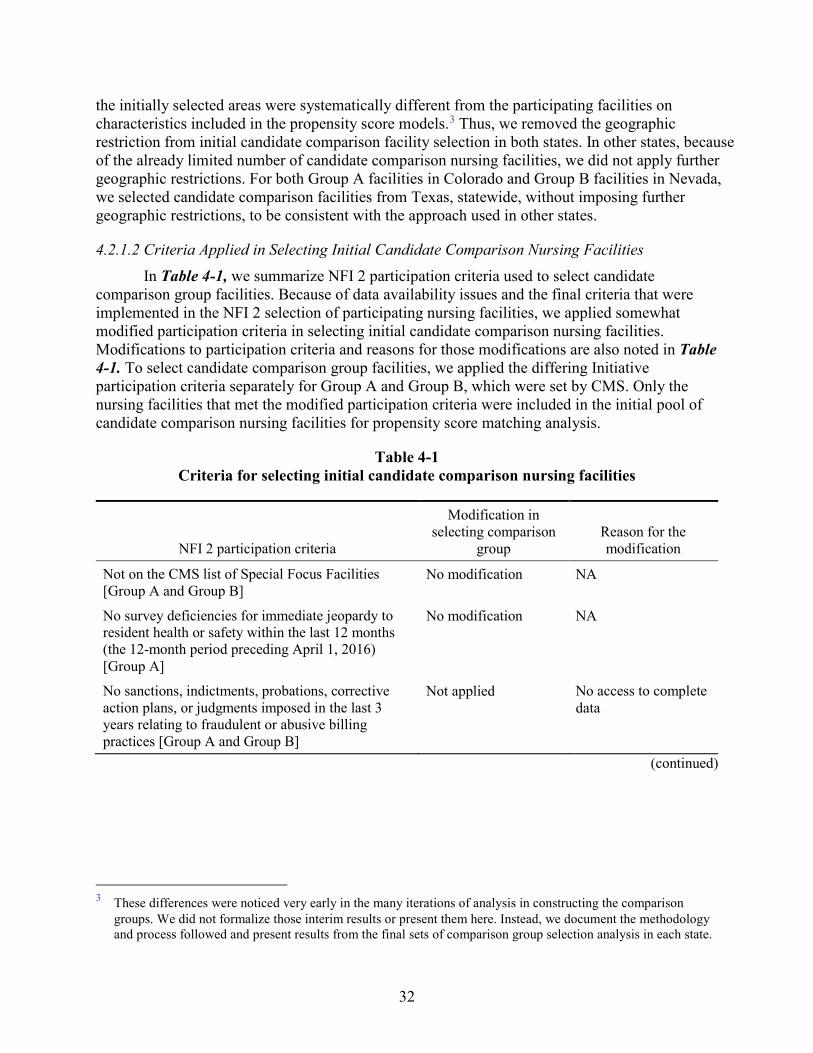
32
the initially selected areas were systematically different from the participating facilities on characteristics included in the propensity score models.3 Thus, we removed the geographic restriction from initial candidate comparison facility selection in both states. In other states, because of the already limited number of candidate comparison nursing facilities, we did not apply further geographic restrictions. For both Group A facilities in Colorado and Group B facilities in Nevada, we selected candidate comparison facilities from Texas, statewide, without imposing further geographic restrictions, to be consistent with the approach used in other states.
4.2.1.2 Criteria Applied in Selecting Initial Candidate Comparison Nursing Facilities In Table 4-1, we summarize NFI 2 participation criteria used to select candidate
comparison group facilities. Because of data availability issues and the final criteria that were implemented in the NFI 2 selection of participating nursing facilities, we applied somewhat modified participation criteria in selecting initial candidate comparison nursing facilities. Modifications to participation criteria and reasons for those modifications are also noted in Table 4-1. To select candidate comparison group facilities, we applied the differing Initiative participation criteria separately for Group A and Group B, which were set by CMS. Only the nursing facilities that met the modified participation criteria were included in the initial pool of candidate comparison nursing facilities for propensity score matching analysis.
Table 4-1 Criteria for selecting initial candidate comparison nursing facilities
NFI 2 participation criteria
Modification in selecting comparison
group Reason for the modification
Not on the CMS list of Special Focus Facilities [Group A and Group B]
No modification NA
No survey deficiencies for immediate jeopardy to resident health or safety within the last 12 months (the 12-month period preceding April 1, 2016) [Group A]
No modification NA
No sanctions, indictments, probations, corrective action plans, or judgments imposed in the last 3 years relating to fraudulent or abusive billing practices [Group A and Group B]
Not applied No access to complete data
(continued)
3 These differences were noticed very early in the many iterations of analysis in constructing the comparison
groups. We did not formalize those interim results or present them here. Instead, we document the methodology and process followed and present results from the final sets of comparison group selection analysis in each state.
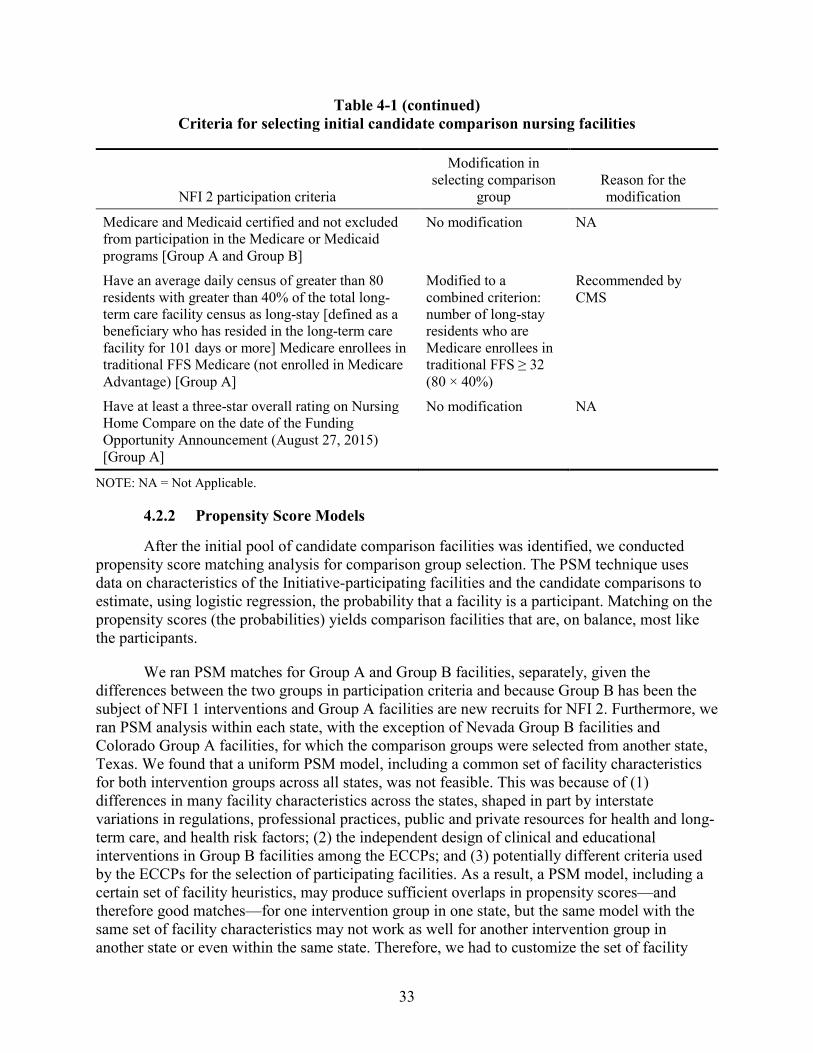
33
Table 4-1 (continued) Criteria for selecting initial candidate comparison nursing facilities
NFI 2 participation criteria
Modification in selecting comparison
group Reason for the modification
Medicare and Medicaid certified and not excluded from participation in the Medicare or Medicaid programs [Group A and Group B]
No modification NA
Have an average daily census of greater than 80 residents with greater than 40% of the total long-term care facility census as long-stay [defined as a beneficiary who has resided in the long-term care facility for 101 days or more] Medicare enrollees in traditional FFS Medicare (not enrolled in Medicare Advantage) [Group A]
Modified to a combined criterion: number of long-stay residents who are Medicare enrollees in traditional FFS ≥ 32 (80 × 40%)
Recommended by CMS
Have at least a three-star overall rating on Nursing Home Compare on the date of the Funding Opportunity Announcement (August 27, 2015) [Group A]
No modification NA
NOTE: NA = Not Applicable.
4.2.2 Propensity Score Models
After the initial pool of candidate comparison facilities was identified, we conducted propensity score matching analysis for comparison group selection. The PSM technique uses data on characteristics of the Initiative-participating facilities and the candidate comparisons to estimate, using logistic regression, the probability that a facility is a participant. Matching on the propensity scores (the probabilities) yields comparison facilities that are, on balance, most like the participants.
We ran PSM matches for Group A and Group B facilities, separately, given the differences between the two groups in participation criteria and because Group B has been the subject of NFI 1 interventions and Group A facilities are new recruits for NFI 2. Furthermore, we ran PSM analysis within each state, with the exception of Nevada Group B facilities and Colorado Group A facilities, for which the comparison groups were selected from another state, Texas. We found that a uniform PSM model, including a common set of facility characteristics for both intervention groups across all states, was not feasible. This was because of (1) differences in many facility characteristics across the states, shaped in part by interstate variations in regulations, professional practices, public and private resources for health and long-term care, and health risk factors; (2) the independent design of clinical and educational interventions in Group B facilities among the ECCPs; and (3) potentially different criteria used by the ECCPs for the selection of participating facilities. As a result, a PSM model, including a certain set of facility heuristics, may produce sufficient overlaps in propensity scores—and therefore good matches—for one intervention group in one state, but the same model with the same set of facility characteristics may not work as well for another intervention group in another state or even within the same state. Therefore, we had to customize the set of facility
34
characteristics in the model for each intervention group within each state to achieve the best possible propensity score matches. In other words, the facility-level variables included in the final propensity score models vary by state and intervention group (A or B). Below, we explain the modeling and matching methodology in greater detail and then present state-specific results for each group from the finalized PSM matching analysis.
4.2.2.1 Model Development and Refinement Because the primary goal of a propensity score model is to yield the best match between
the treatment and comparison groups based on a range of observed characteristics, not in estimating a model that has the most predictive power (as is the case in most research), overidentification is not a concern. A Monte Carlo study by Millimet and Tchernis (2009) found that including too many relevant covariates imposes little penalty on the propensity score estimation, whereas underfitting can impose significant penalty on the estimation. They argue that, because in most cases researchers do not have good knowledge of the determinants of treatment, it is prudent to overfit propensity models (Millimet and Tchernis, 2009). To achieve a propensity score assignment that creates sufficient overlap between intervention and potential comparison facilities, the PSM as a whole must be only moderately predictive of treatment. Including characteristics found to be unique to the participants would result in no overlap of propensity scores.
We began each state-specific propensity score model with a relatively large number of facility characteristics included as covariates, including a key outcome variable aggregated to the facility level: the all-cause hospitalization rate during FY 2016. As explained in Section 5, this facility-specific rate was calculated from individual-level Medicare claims data, based on the individual’s Initiative-related exposure period during FY 2016, and is measured as the number of events (inpatient admissions) per 1,000 person-days. Here, we use the results aggregated to the facility level for all long-stay residents in the facility.
We compiled facility characteristics from CASPER (e.g., staffing levels and mix, bed size, for-profit status, chain membership, resident case-mix, percentage of residents with advance directives), Nursing Home Compare (e.g., overall five-star rating and separate ratings for health inspections, staffing, and quality), MDS assessment data aggregated to the facility level (e.g., percentage of residents younger than 65, percentage with dementia, percentage nonwhite, percentage Hispanic, percentage and number of long-stay residents), and Medicare eligibility and enrollment files (e.g., percentage of residents in MA plans). All these characteristics were measured for FY 2016. Given small sample sizes, it is not feasible to include too many variables in the model. One strategy we used for model reduction was to combine multiple individual measures in the same domain into a summary index. For example, we created a summary case-mix index measure for each facility by combining a range of ADL dependencies and special treatment measures for all residents in each facility (Feng et al., 2006). A full list of facility characteristics we considered in developing and refining the propensity score models is provided in Appendix B, along with the final variables used in PSM models in Appendix C.
We dropped many variables from each state-specific model during multiple iterations of model refinements. When two covariates were found to be highly correlated, for example, one of them was removed from the model. In some cases, we removed facilities that were outliers based on variables with drastic differences in distribution in the ECCP group as compared to the
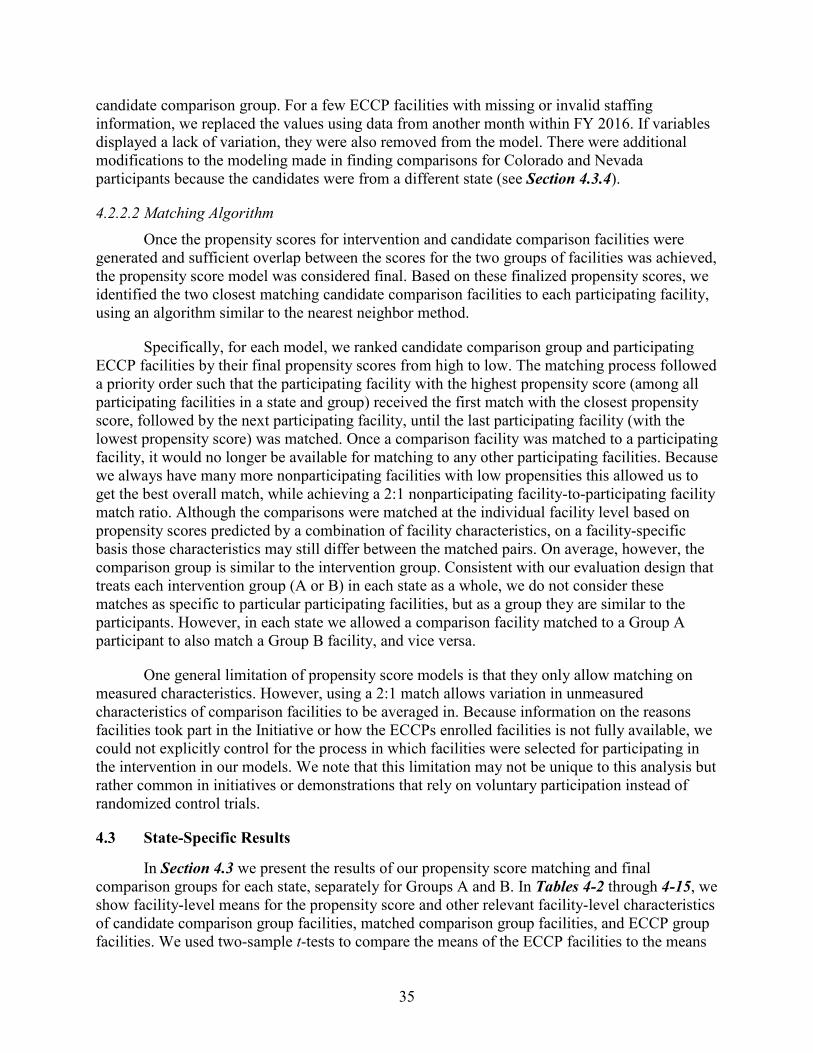
35
candidate comparison group. For a few ECCP facilities with missing or invalid staffing information, we replaced the values using data from another month within FY 2016. If variables displayed a lack of variation, they were also removed from the model. There were additional modifications to the modeling made in finding comparisons for Colorado and Nevada participants because the candidates were from a different state (see Section 4.3.4).
4.2.2.2 Matching Algorithm Once the propensity scores for intervention and candidate comparison facilities were
generated and sufficient overlap between the scores for the two groups of facilities was achieved, the propensity score model was considered final. Based on these finalized propensity scores, we identified the two closest matching candidate comparison facilities to each participating facility, using an algorithm similar to the nearest neighbor method.
Specifically, for each model, we ranked candidate comparison group and participating ECCP facilities by their final propensity scores from high to low. The matching process followed a priority order such that the participating facility with the highest propensity score (among all participating facilities in a state and group) received the first match with the closest propensity score, followed by the next participating facility, until the last participating facility (with the lowest propensity score) was matched. Once a comparison facility was matched to a participating facility, it would no longer be available for matching to any other participating facilities. Because we always have many more nonparticipating facilities with low propensities this allowed us to get the best overall match, while achieving a 2:1 nonparticipating facility-to-participating facility match ratio. Although the comparisons were matched at the individual facility level based on propensity scores predicted by a combination of facility characteristics, on a facility-specific basis those characteristics may still differ between the matched pairs. On average, however, the comparison group is similar to the intervention group. Consistent with our evaluation design that treats each intervention group (A or B) in each state as a whole, we do not consider these matches as specific to particular participating facilities, but as a group they are similar to the participants. However, in each state we allowed a comparison facility matched to a Group A participant to also match a Group B facility, and vice versa.
One general limitation of propensity score models is that they only allow matching on measured characteristics. However, using a 2:1 match allows variation in unmeasured characteristics of comparison facilities to be averaged in. Because information on the reasons facilities took part in the Initiative or how the ECCPs enrolled facilities is not fully available, we could not explicitly control for the process in which facilities were selected for participating in the intervention in our models. We note that this limitation may not be unique to this analysis but rather common in initiatives or demonstrations that rely on voluntary participation instead of randomized control trials.
4.3 State-Specific Results
In Section 4.3 we present the results of our propensity score matching and final comparison groups for each state, separately for Groups A and B. In Tables 4-2 through 4-15, we show facility-level means for the propensity score and other relevant facility-level characteristics of candidate comparison group facilities, matched comparison group facilities, and ECCP group facilities. We used two-sample t-tests to compare the means of the ECCP facilities to the means
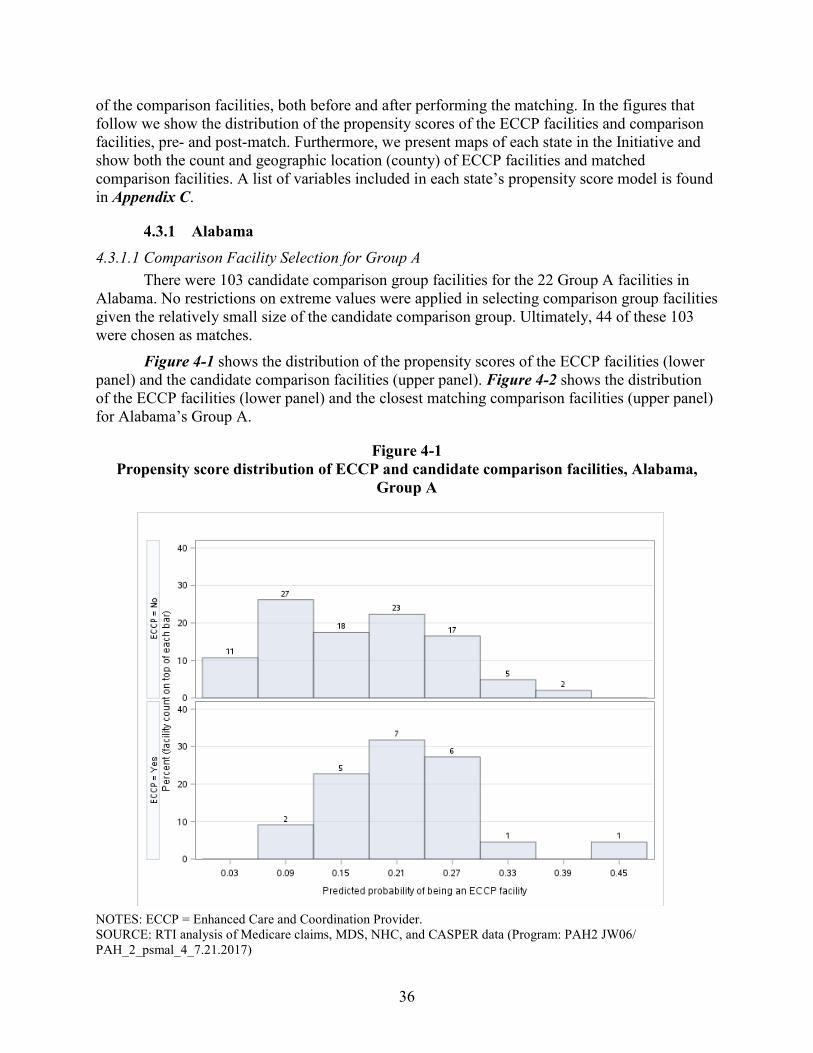
36
of the comparison facilities, both before and after performing the matching. In the figures that follow we show the distribution of the propensity scores of the ECCP facilities and comparison facilities, pre- and post-match. Furthermore, we present maps of each state in the Initiative and show both the count and geographic location (county) of ECCP facilities and matched comparison facilities. A list of variables included in each state’s propensity score model is found in Appendix C.
4.3.1 Alabama 4.3.1.1 Comparison Facility Selection for Group A
There were 103 candidate comparison group facilities for the 22 Group A facilities in Alabama. No restrictions on extreme values were applied in selecting comparison group facilities given the relatively small size of the candidate comparison group. Ultimately, 44 of these 103 were chosen as matches.
Figure 4-1 shows the distribution of the propensity scores of the ECCP facilities (lower panel) and the candidate comparison facilities (upper panel). Figure 4-2 shows the distribution of the ECCP facilities (lower panel) and the closest matching comparison facilities (upper panel) for Alabama’s Group A.
Figure 4-1 Propensity score distribution of ECCP and candidate comparison facilities, Alabama,
Group A
NOTES: ECCP = Enhanced Care and Coordination Provider. SOURCE: RTI analysis of Medicare claims, MDS, NHC, and CASPER data (Program: PAH2 JW06/ PAH_2_psmal_4_7.21.2017)
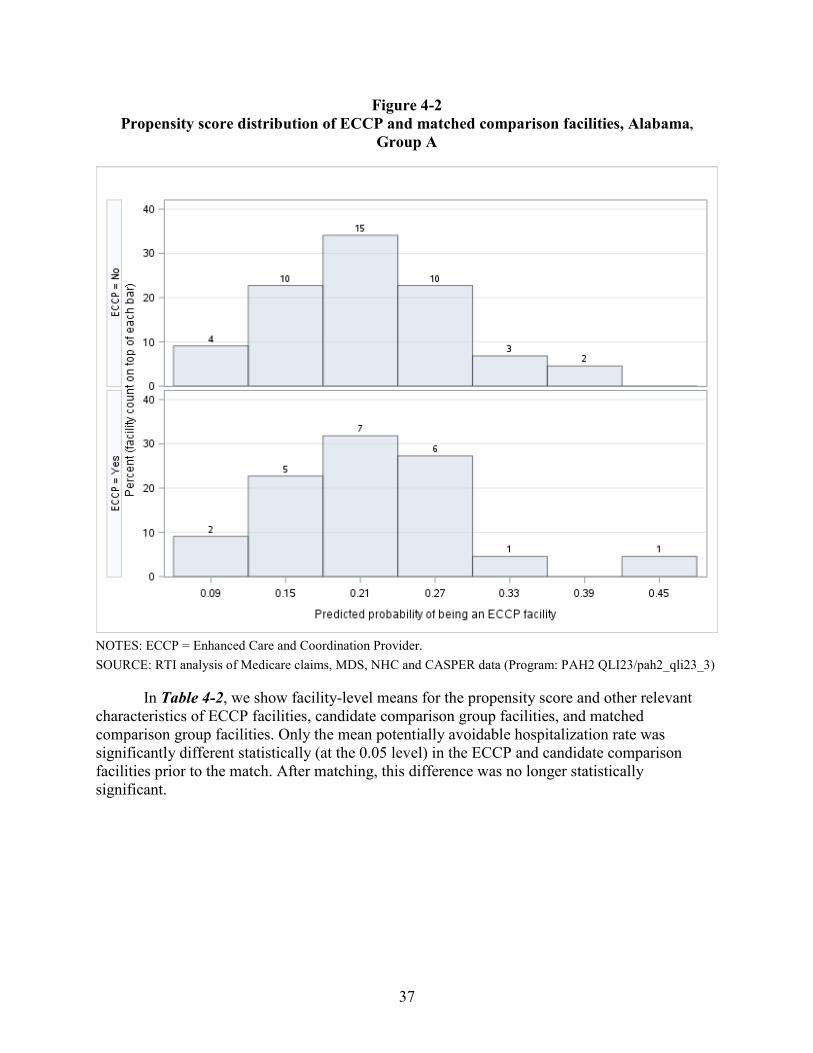
37
Figure 4-2 Propensity score distribution of ECCP and matched comparison facilities, Alabama,
Group A
NOTES: ECCP = Enhanced Care and Coordination Provider. SOURCE: RTI analysis of Medicare claims, MDS, NHC and CASPER data (Program: PAH2 QLI23/pah2_qli23_3)
In Table 4-2, we show facility-level means for the propensity score and other relevant characteristics of ECCP facilities, candidate comparison group facilities, and matched comparison group facilities. Only the mean potentially avoidable hospitalization rate was significantly different statistically (at the 0.05 level) in the ECCP and candidate comparison facilities prior to the match. After matching, this difference was no longer statistically significant.
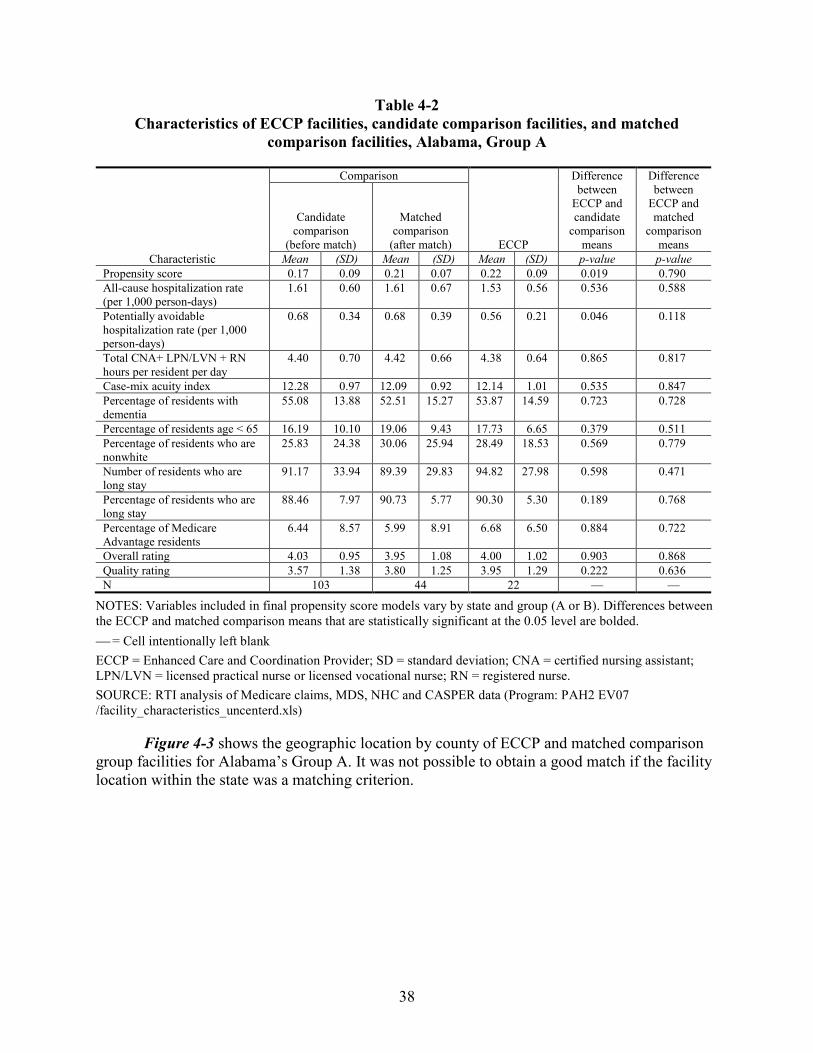
38
Table 4-2 Characteristics of ECCP facilities, candidate comparison facilities, and matched
comparison facilities, Alabama, Group A
Characteristic
Comparison
ECCP
Difference between
ECCP and candidate
comparison means
Difference between
ECCP and matched
comparison means
Candidate comparison
(before match)
Matched comparison
(after match)
Mean (SD) Mean (SD) Mean (SD) p-value p-value Propensity score 0.17 0.09 0.21 0.07 0.22 0.09 0.019 0.790 All-cause hospitalization rate (per 1,000 person-days)
1.61 0.60 1.61 0.67 1.53 0.56 0.536 0.588
Potentially avoidable hospitalization rate (per 1,000 person-days)
0.68 0.34 0.68 0.39 0.56 0.21 0.046 0.118
Total CNA+ LPN/LVN + RN hours per resident per day
4.40 0.70 4.42 0.66 4.38 0.64 0.865 0.817
Case-mix acuity index 12.28 0.97 12.09 0.92 12.14 1.01 0.535 0.847 Percentage of residents with dementia
55.08 13.88 52.51 15.27 53.87 14.59 0.723 0.728
Percentage of residents age < 65 16.19 10.10 19.06 9.43 17.73 6.65 0.379 0.511 Percentage of residents who are nonwhite
25.83 24.38 30.06 25.94 28.49 18.53 0.569 0.779
Number of residents who are long stay
91.17 33.94 89.39 29.83 94.82 27.98 0.598 0.471
Percentage of residents who are long stay
88.46 7.97 90.73 5.77 90.30 5.30 0.189 0.768
Percentage of Medicare Advantage residents
6.44 8.57 5.99 8.91 6.68 6.50 0.884 0.722
Overall rating 4.03 0.95 3.95 1.08 4.00 1.02 0.903 0.868 Quality rating 3.57 1.38 3.80 1.25 3.95 1.29 0.222 0.636 N 103 44 22 — —
NOTES: Variables included in final propensity score models vary by state and group (A or B). Differences between the ECCP and matched comparison means that are statistically significant at the 0.05 level are bolded. = Cell intentionally left blank ECCP = Enhanced Care and Coordination Provider; SD = standard deviation; CNA = certified nursing assistant; LPN/LVN = licensed practical nurse or licensed vocational nurse; RN = registered nurse. SOURCE: RTI analysis of Medicare claims, MDS, NHC and CASPER data (Program: PAH2 EV07 /facility_characteristics_uncenterd.xls)
Figure 4-3 shows the geographic location by county of ECCP and matched comparison group facilities for Alabama’s Group A. It was not possible to obtain a good match if the facility location within the state was a matching criterion.
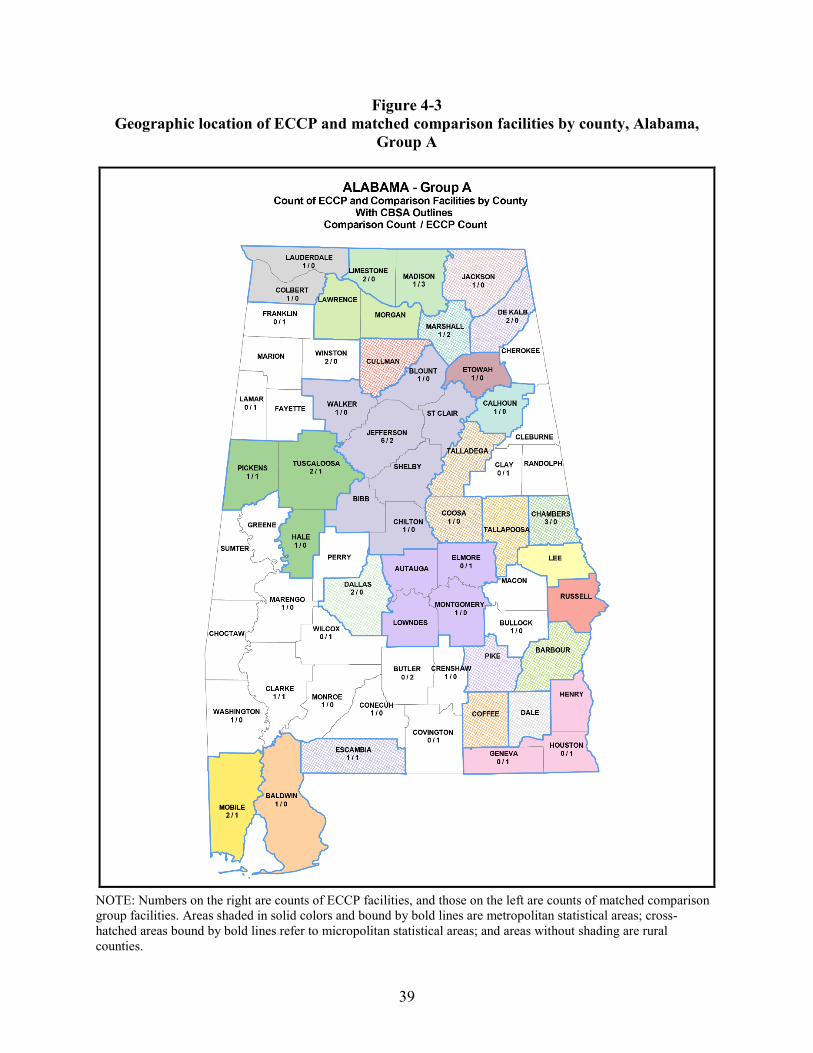
39
Figure 4-3 Geographic location of ECCP and matched comparison facilities by county, Alabama,
Group A
NOTE: Numbers on the right are counts of ECCP facilities, and those on the left are counts of matched comparison group facilities. Areas shaded in solid colors and bound by bold lines are metropolitan statistical areas; cross-hatched areas bound by bold lines refer to micropolitan statistical areas; and areas without shading are rural counties.
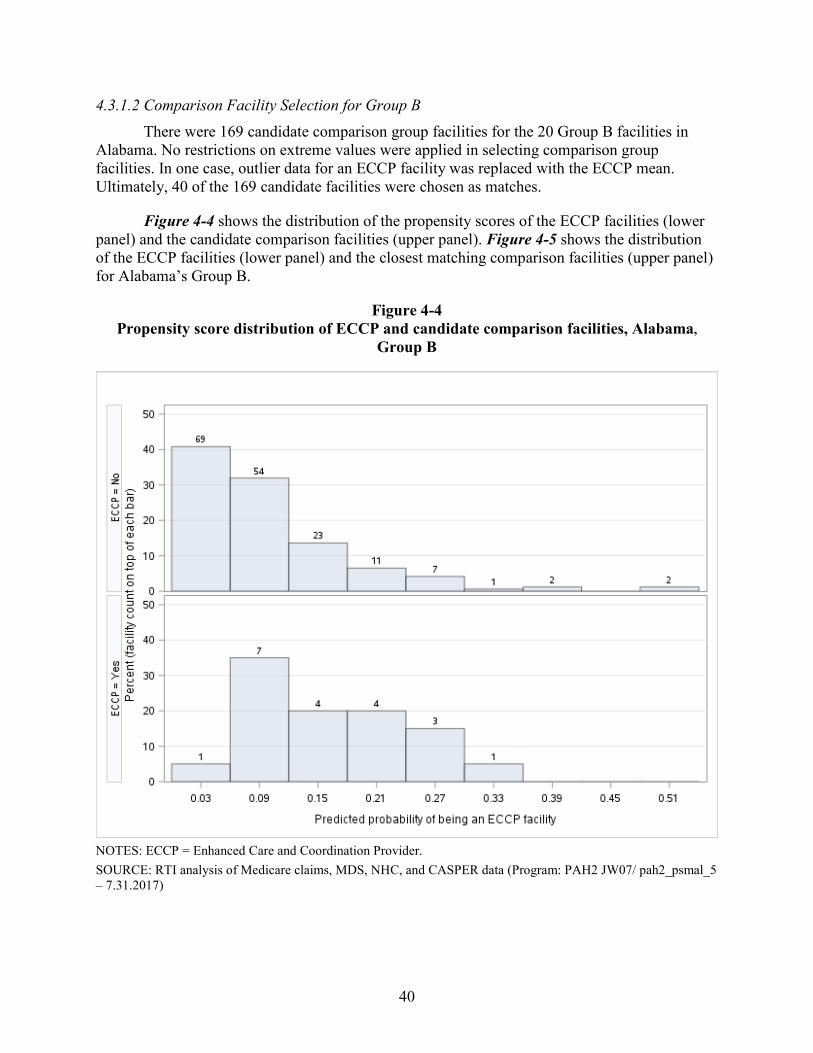
40
4.3.1.2 Comparison Facility Selection for Group B There were 169 candidate comparison group facilities for the 20 Group B facilities in
Alabama. No restrictions on extreme values were applied in selecting comparison group facilities. In one case, outlier data for an ECCP facility was replaced with the ECCP mean. Ultimately, 40 of the 169 candidate facilities were chosen as matches.
Figure 4-4 shows the distribution of the propensity scores of the ECCP facilities (lower panel) and the candidate comparison facilities (upper panel). Figure 4-5 shows the distribution of the ECCP facilities (lower panel) and the closest matching comparison facilities (upper panel) for Alabama’s Group B.
Figure 4-4 Propensity score distribution of ECCP and candidate comparison facilities, Alabama,
Group B
NOTES: ECCP = Enhanced Care and Coordination Provider. SOURCE: RTI analysis of Medicare claims, MDS, NHC, and CASPER data (Program: PAH2 JW07/ pah2_psmal_5 – 7.31.2017)
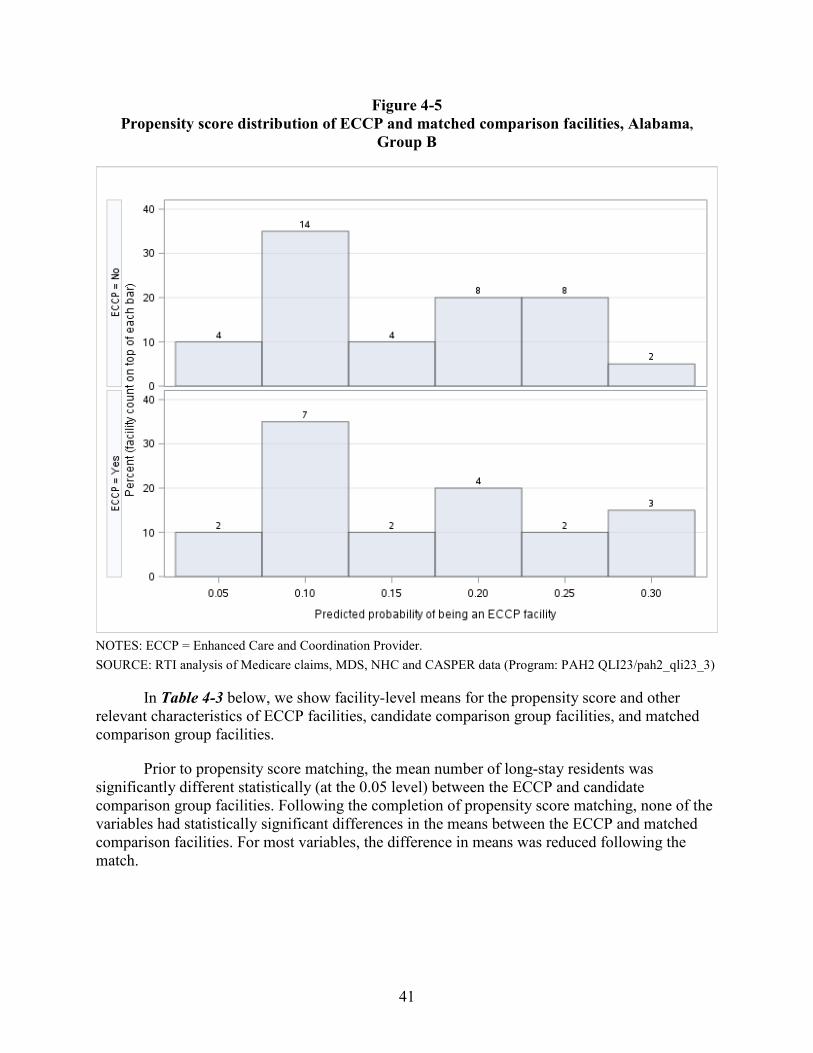
41
Figure 4-5 Propensity score distribution of ECCP and matched comparison facilities, Alabama,
Group B
NOTES: ECCP = Enhanced Care and Coordination Provider. SOURCE: RTI analysis of Medicare claims, MDS, NHC and CASPER data (Program: PAH2 QLI23/pah2_qli23_3)
In Table 4-3 below, we show facility-level means for the propensity score and other relevant characteristics of ECCP facilities, candidate comparison group facilities, and matched comparison group facilities.
Prior to propensity score matching, the mean number of long-stay residents was significantly different statistically (at the 0.05 level) between the ECCP and candidate comparison group facilities. Following the completion of propensity score matching, none of the variables had statistically significant differences in the means between the ECCP and matched comparison facilities. For most variables, the difference in means was reduced following the match.
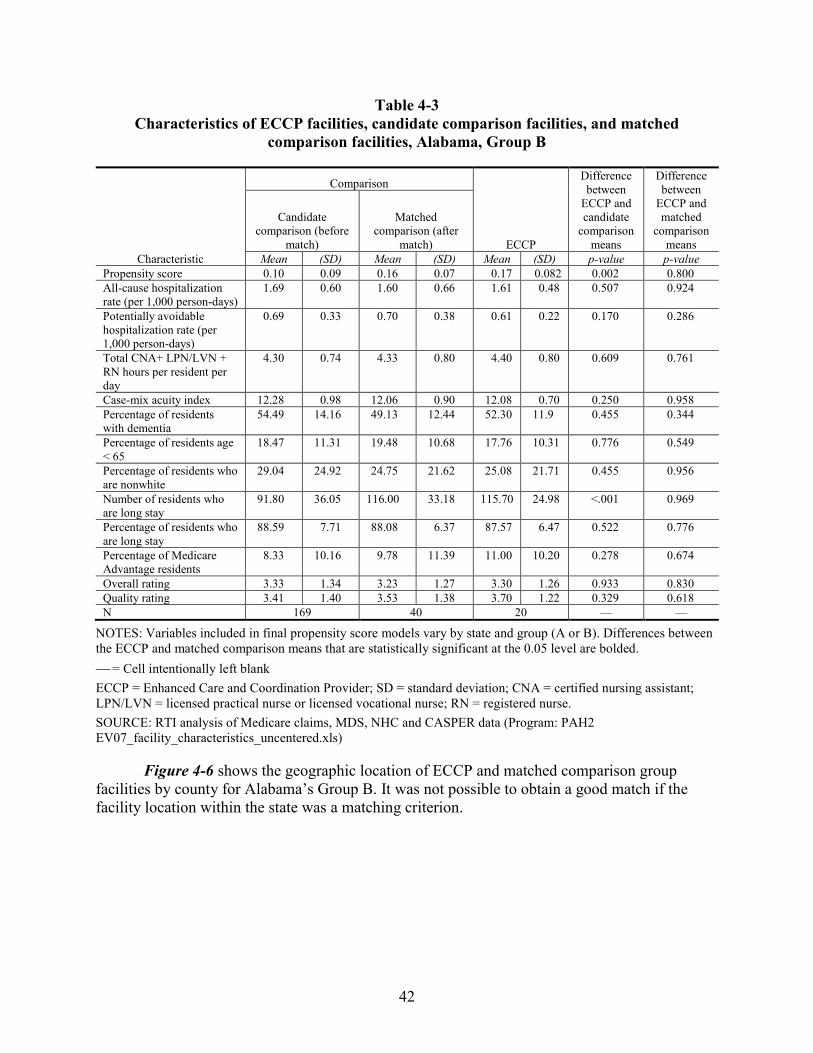
42
Table 4-3 Characteristics of ECCP facilities, candidate comparison facilities, and matched
comparison facilities, Alabama, Group B
Characteristic
Comparison
ECCP
Difference between
ECCP and candidate
comparison means
Difference between
ECCP and matched
comparison means
Candidate comparison (before
match)
Matched comparison (after
match)Mean (SD) Mean (SD) Mean (SD) p-value p-value
Propensity score 0.10 0.09 0.16 0.07 0.17 0.082 0.002 0.800 All-cause hospitalization rate (per 1,000 person-days)
1.69 0.60 1.60 0.66 1.61 0.48 0.507 0.924
Potentially avoidable hospitalization rate (per 1,000 person-days)
0.69 0.33 0.70 0.38 0.61 0.22 0.170 0.286
Total CNA+ LPN/LVN + RN hours per resident per day
4.30 0.74 4.33 0.80 4.40 0.80 0.609 0.761
Case-mix acuity index 12.28 0.98 12.06 0.90 12.08 0.70 0.250 0.958 Percentage of residents with dementia
54.49 14.16 49.13 12.44 52.30 11.9 0.455 0.344
Percentage of residents age < 65
18.47 11.31 19.48 10.68 17.76 10.31 0.776 0.549
Percentage of residents who are nonwhite
29.04 24.92 24.75 21.62 25.08 21.71 0.455 0.956
Number of residents who are long stay
91.80 36.05 116.00 33.18 115.70 24.98 <.001 0.969
Percentage of residents who are long stay
88.59 7.71 88.08 6.37 87.57 6.47 0.522 0.776
Percentage of Medicare Advantage residents
8.33 10.16 9.78 11.39 11.00 10.20 0.278 0.674
Overall rating 3.33 1.34 3.23 1.27 3.30 1.26 0.933 0.830 Quality rating 3.41 1.40 3.53 1.38 3.70 1.22 0.329 0.618 N 169 40 20 — —
NOTES: Variables included in final propensity score models vary by state and group (A or B). Differences between the ECCP and matched comparison means that are statistically significant at the 0.05 level are bolded. = Cell intentionally left blank ECCP = Enhanced Care and Coordination Provider; SD = standard deviation; CNA = certified nursing assistant; LPN/LVN = licensed practical nurse or licensed vocational nurse; RN = registered nurse. SOURCE: RTI analysis of Medicare claims, MDS, NHC and CASPER data (Program: PAH2 EV07_facility_characteristics_uncentered.xls)
Figure 4-6 shows the geographic location of ECCP and matched comparison group facilities by county for Alabama’s Group B. It was not possible to obtain a good match if the facility location within the state was a matching criterion.
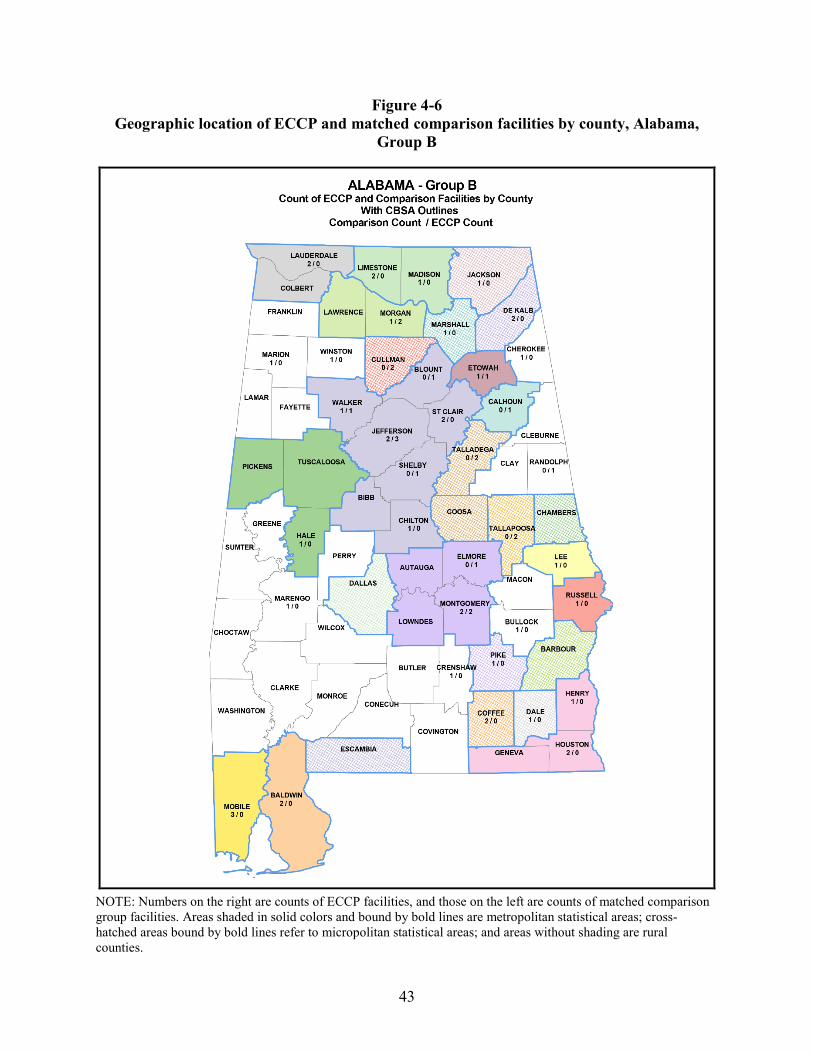
43
Figure 4-6 Geographic location of ECCP and matched comparison facilities by county, Alabama,
Group B
NOTE: Numbers on the right are counts of ECCP facilities, and those on the left are counts of matched comparison group facilities. Areas shaded in solid colors and bound by bold lines are metropolitan statistical areas; cross-hatched areas bound by bold lines refer to micropolitan statistical areas; and areas without shading are rural counties.
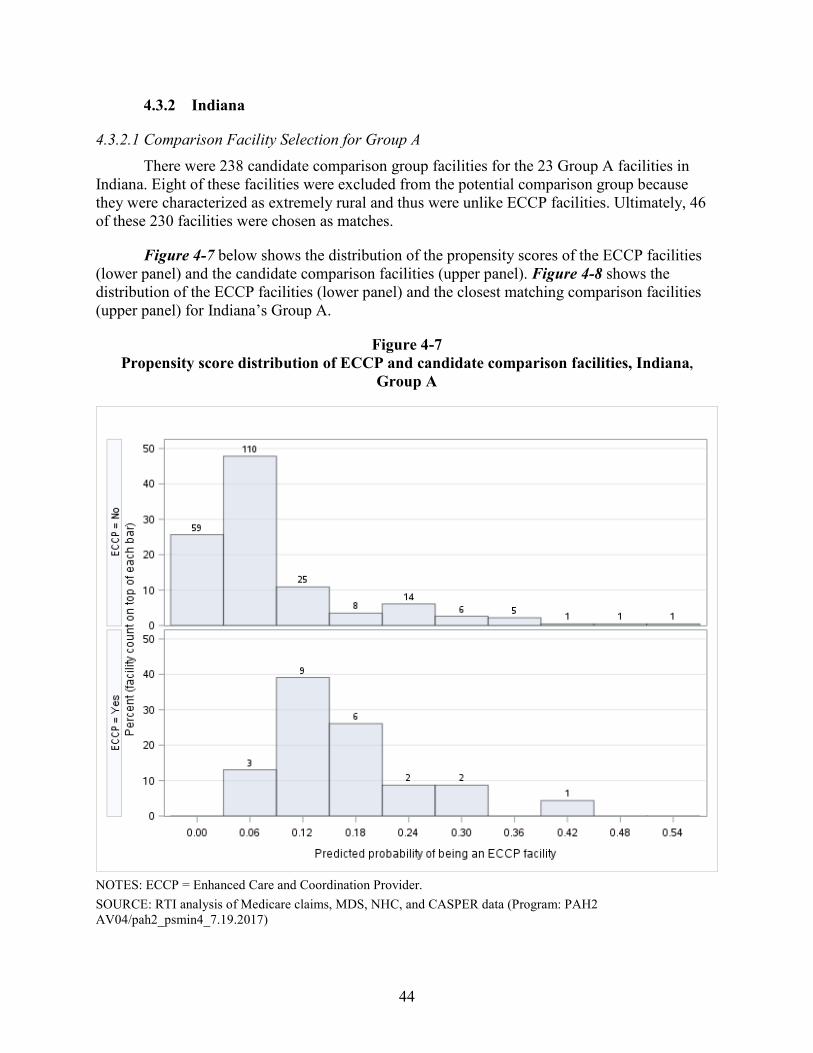
44
4.3.2 Indiana
4.3.2.1 Comparison Facility Selection for Group A There were 238 candidate comparison group facilities for the 23 Group A facilities in
Indiana. Eight of these facilities were excluded from the potential comparison group because they were characterized as extremely rural and thus were unlike ECCP facilities. Ultimately, 46 of these 230 facilities were chosen as matches.
Figure 4-7 below shows the distribution of the propensity scores of the ECCP facilities (lower panel) and the candidate comparison facilities (upper panel). Figure 4-8 shows the distribution of the ECCP facilities (lower panel) and the closest matching comparison facilities (upper panel) for Indiana’s Group A.
Figure 4-7 Propensity score distribution of ECCP and candidate comparison facilities, Indiana,
Group A
NOTES: ECCP = Enhanced Care and Coordination Provider. SOURCE: RTI analysis of Medicare claims, MDS, NHC, and CASPER data (Program: PAH2 AV04/pah2_psmin4_7.19.2017)
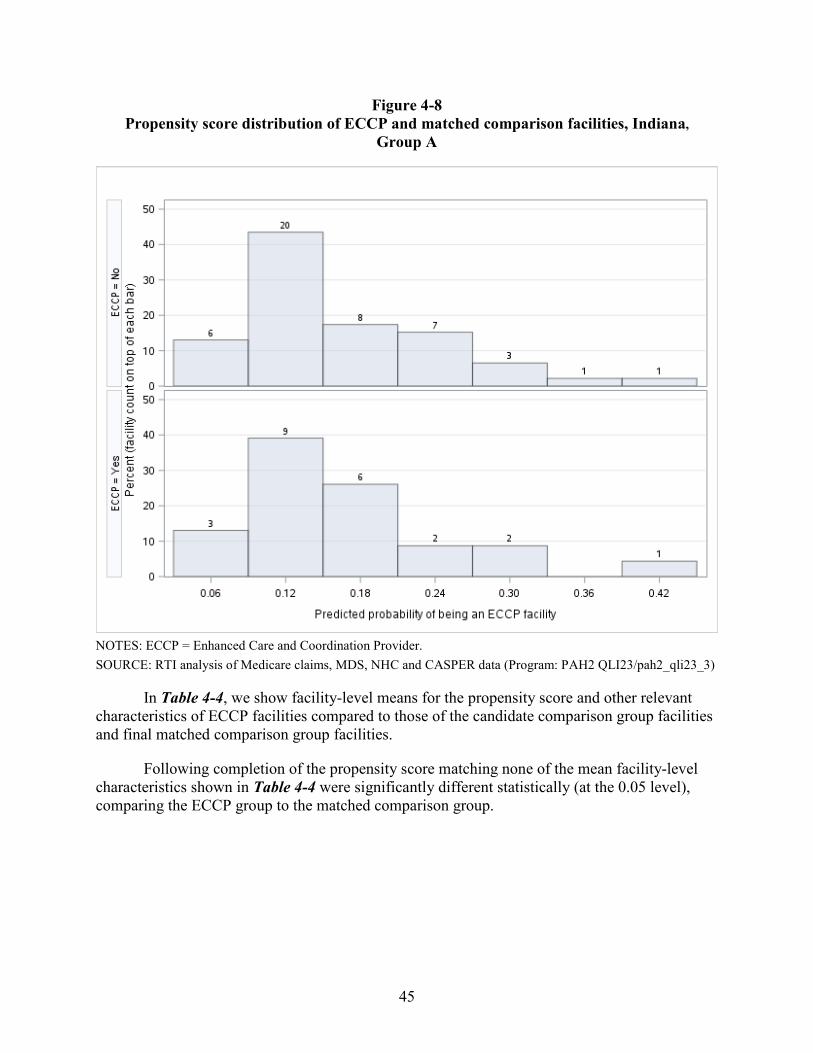
45
Figure 4-8 Propensity score distribution of ECCP and matched comparison facilities, Indiana,
Group A
NOTES: ECCP = Enhanced Care and Coordination Provider. SOURCE: RTI analysis of Medicare claims, MDS, NHC and CASPER data (Program: PAH2 QLI23/pah2_qli23_3)
In Table 4-4, we show facility-level means for the propensity score and other relevant characteristics of ECCP facilities compared to those of the candidate comparison group facilities and final matched comparison group facilities.
Following completion of the propensity score matching none of the mean facility-level characteristics shown in Table 4-4 were significantly different statistically (at the 0.05 level), comparing the ECCP group to the matched comparison group.

46
Table 4-4 Characteristics of ECCP facilities, candidate comparison facilities, and matched
comparison facilities, Indiana, Group A
Characteristic
Comparison
ECCP
Difference between
ECCP and candidate
comparison means
Difference between
ECCP and matched
comparison means
Candidate comparison
(before match)
Matched comparison (after
match)
Mean (SD) Mean (SD) Mean (SD) p-value p-value Propensity score 0.08 0.09 0.16 0.08 0.16 0.09 <.001 0.812 All-cause hospitalization rate (per 1,000 person-days)
1.52 0.71 1.38 0.62 1.36 0.45 0.141 0.892
Potentially avoidable hospitalization rate (per 1,000 person-days)
0.60 0.32 0.49 0.26 0.54 0.25 0.342 0.409
Total CNA+ LPN/LVN + RN hours per resident per day
4.20 0.75 4.38 0.89 4.33 0.67 0.376 0.803
Case-mix acuity index 11.56 1.07 11.55 1.11 11.56 0.88 0.991 0.976 Percentage of residents with dementia
50.70 16.01 48.12 15.27 48.69 15.86 0.568 0.886
Percentage of residents age < 65 12.26 13.18 13.84 12.99 12.11 11.90 0.954 0.583 Percentage of residents who are nonwhite
8.28 11.60 12.05 14.60 9.80 9.18 0.466 0.438
Number of residents who are long stay
68.44 27.54 93.11 27.80 95.30 19.31 <.001 0.704
Percentage of residents who are long stay
86.03 9.34 85.11 9.13 85.83 8.12 0.913 0.740
Percentage of Medicare Advantage residents
11.26 10.03 15.16 12.08 14.44 10.66 0.182 0.801
Overall rating 3.99 1.03 4.17 0.82 4.22 0.90 0.259 0.847 Quality rating 3.89 1.36 3.93 1.24 3.96 1.36 0.817 0.949 N 230 46 23 — —
NOTES: Variables included in final propensity score models vary by state and group (A or B). Differences between the ECCP and matched comparison means that are statistically significant at the 0.05 level are bolded. = Cell intentionally left blank ECCP = Enhanced Care and Coordination Provider; SD = standard deviation; CNA = certified nursing assistant; LPN/LVN = licensed practical nurse or licensed vocational nurse; RN = registered nurse. SOURCE: RTI analysis of Medicare claims, MDS, NHC and CASPER data (Program: PAH2 EV07 /pah2_ev07_facility_characteristics_unctrd)
Figure 4-9 shows the geographic location of ECCP and matched comparison group facilities for Indiana’s Group A. It was not possible to obtain a good match if the facility location within the state was a matching criterion.
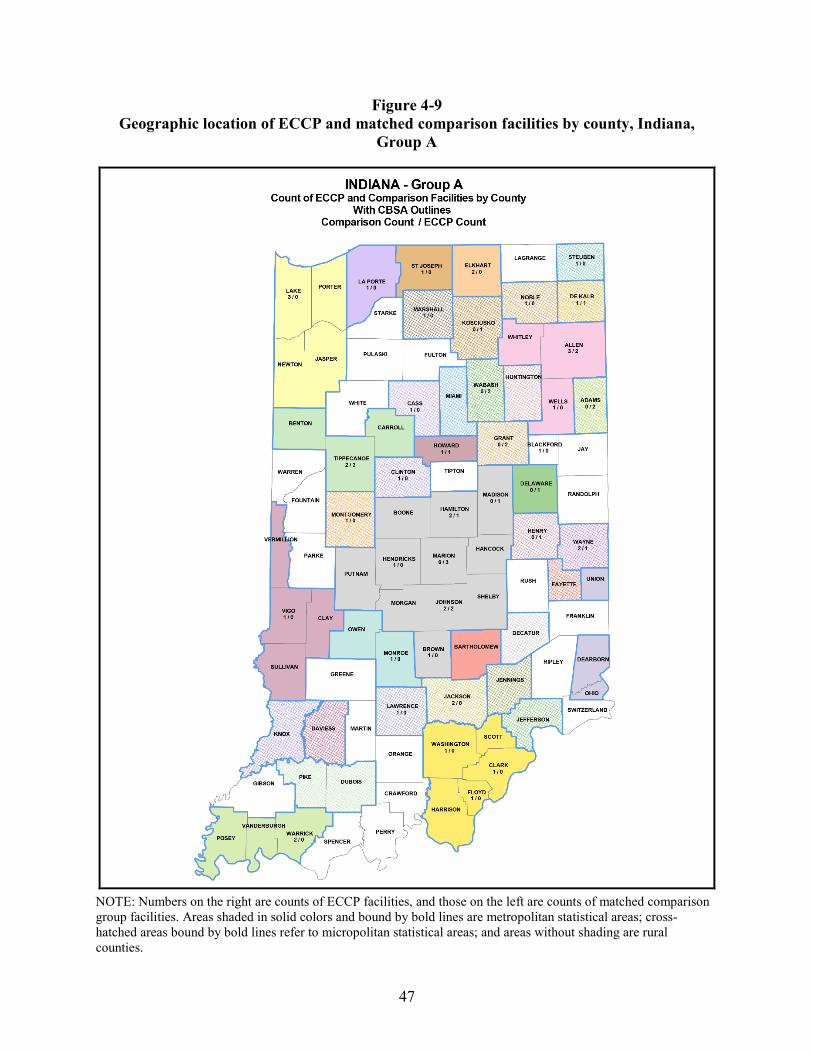
47
Figure 4-9 Geographic location of ECCP and matched comparison facilities by county, Indiana,
Group A
NOTE: Numbers on the right are counts of ECCP facilities, and those on the left are counts of matched comparison group facilities. Areas shaded in solid colors and bound by bold lines are metropolitan statistical areas; cross-hatched areas bound by bold lines refer to micropolitan statistical areas; and areas without shading are rural counties.
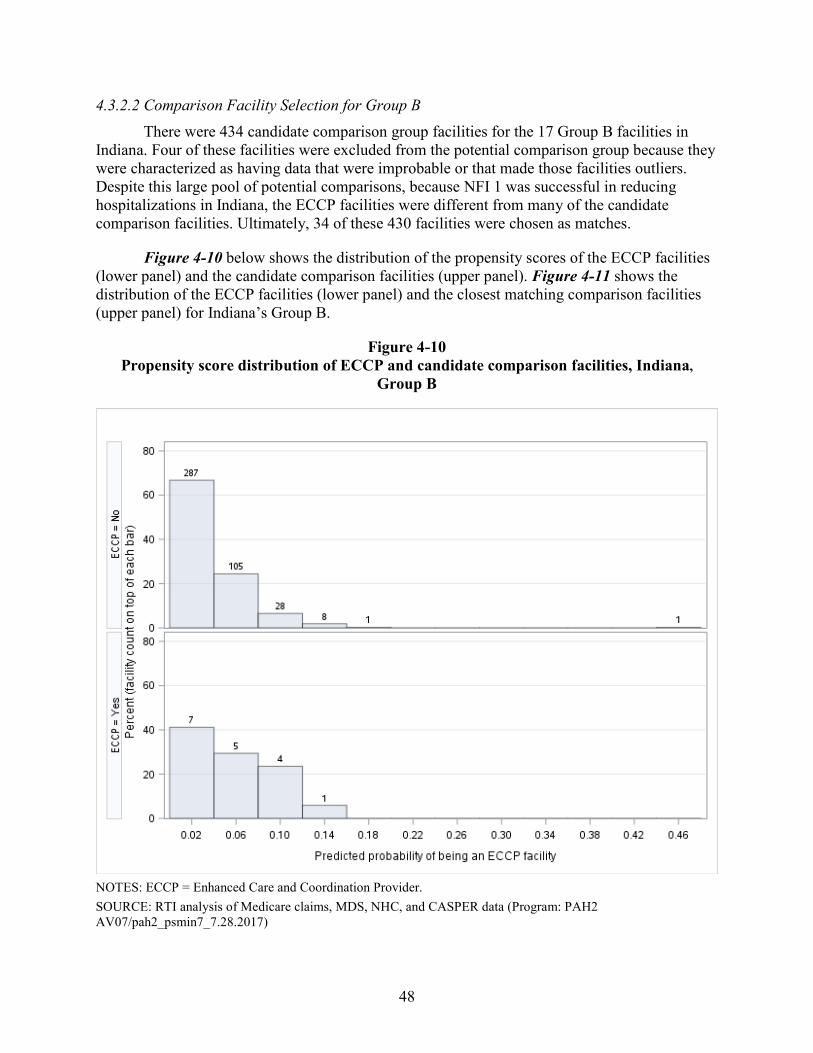
48
4.3.2.2 Comparison Facility Selection for Group B There were 434 candidate comparison group facilities for the 17 Group B facilities in
Indiana. Four of these facilities were excluded from the potential comparison group because they were characterized as having data that were improbable or that made those facilities outliers. Despite this large pool of potential comparisons, because NFI 1 was successful in reducing hospitalizations in Indiana, the ECCP facilities were different from many of the candidate comparison facilities. Ultimately, 34 of these 430 facilities were chosen as matches.
Figure 4-10 below shows the distribution of the propensity scores of the ECCP facilities (lower panel) and the candidate comparison facilities (upper panel). Figure 4-11 shows the distribution of the ECCP facilities (lower panel) and the closest matching comparison facilities (upper panel) for Indiana’s Group B.
Figure 4-10 Propensity score distribution of ECCP and candidate comparison facilities, Indiana,
Group B
NOTES: ECCP = Enhanced Care and Coordination Provider. SOURCE: RTI analysis of Medicare claims, MDS, NHC, and CASPER data (Program: PAH2 AV07/pah2_psmin7_7.28.2017)
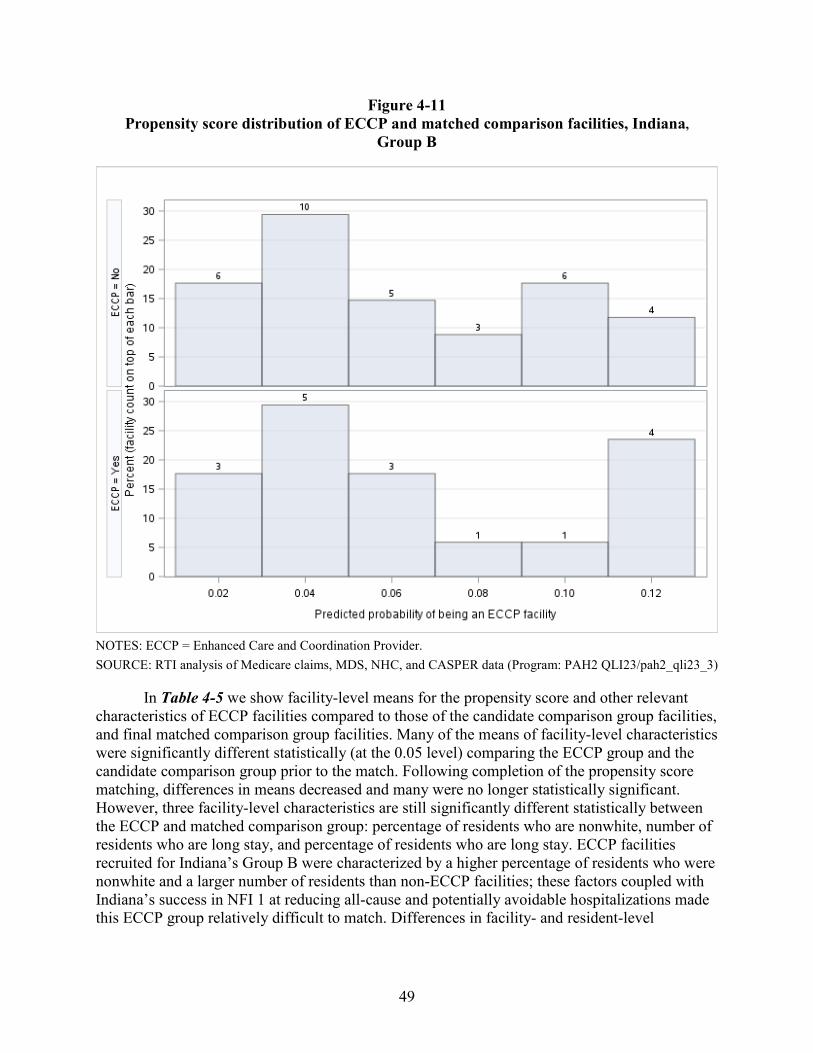
49
Figure 4-11 Propensity score distribution of ECCP and matched comparison facilities, Indiana,
Group B
NOTES: ECCP = Enhanced Care and Coordination Provider. SOURCE: RTI analysis of Medicare claims, MDS, NHC, and CASPER data (Program: PAH2 QLI23/pah2_qli23_3)
In Table 4-5 we show facility-level means for the propensity score and other relevant characteristics of ECCP facilities compared to those of the candidate comparison group facilities, and final matched comparison group facilities. Many of the means of facility-level characteristics were significantly different statistically (at the 0.05 level) comparing the ECCP group and the candidate comparison group prior to the match. Following completion of the propensity score matching, differences in means decreased and many were no longer statistically significant. However, three facility-level characteristics are still significantly different statistically between the ECCP and matched comparison group: percentage of residents who are nonwhite, number of residents who are long stay, and percentage of residents who are long stay. ECCP facilities recruited for Indiana’s Group B were characterized by a higher percentage of residents who were nonwhite and a larger number of residents than non-ECCP facilities; these factors coupled with Indiana’s success in NFI 1 at reducing all-cause and potentially avoidable hospitalizations made this ECCP group relatively difficult to match. Differences in facility- and resident-level
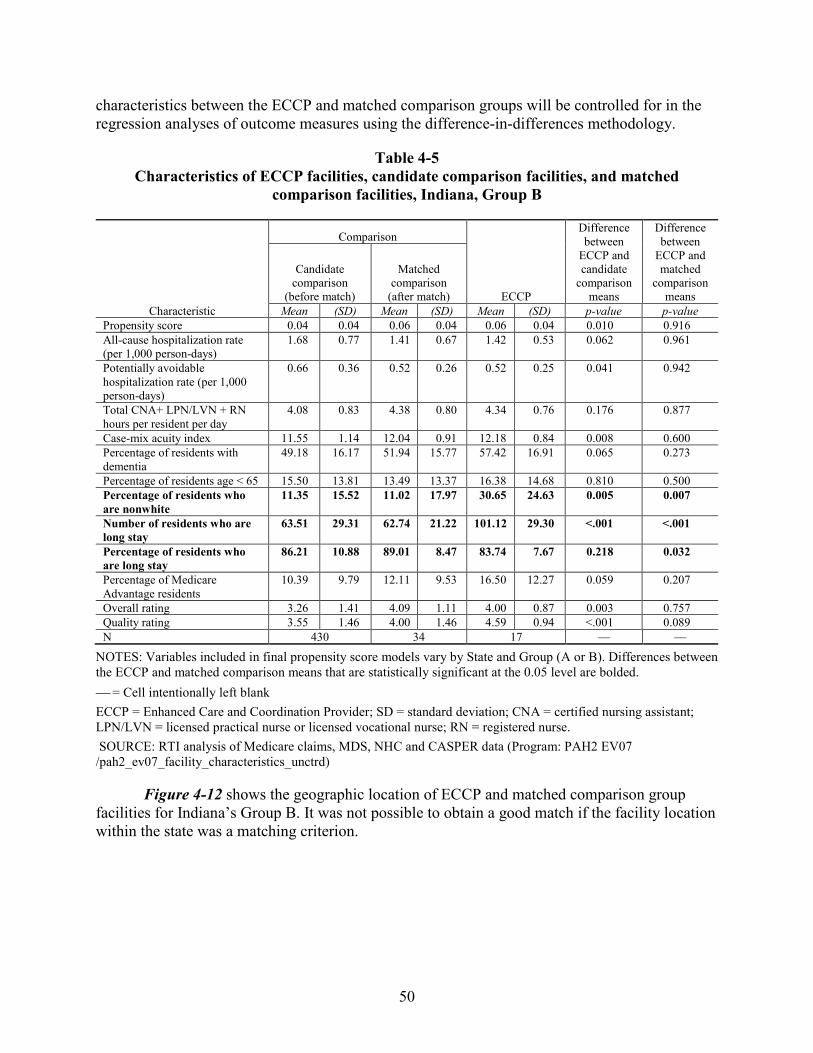
50
characteristics between the ECCP and matched comparison groups will be controlled for in the regression analyses of outcome measures using the difference-in-differences methodology.
Table 4-5 Characteristics of ECCP facilities, candidate comparison facilities, and matched
comparison facilities, Indiana, Group B
Characteristic
Comparison
ECCP
Difference between
ECCP and candidate
comparison means
Difference between
ECCP and matched
comparison means
Candidate comparison
(before match)
Matched comparison
(after match)
Mean (SD) Mean (SD) Mean (SD) p-value p-value Propensity score 0.04 0.04 0.06 0.04 0.06 0.04 0.010 0.916 All-cause hospitalization rate (per 1,000 person-days)
1.68 0.77 1.41 0.67 1.42 0.53 0.062 0.961
Potentially avoidable hospitalization rate (per 1,000 person-days)
0.66 0.36 0.52 0.26 0.52 0.25 0.041 0.942
Total CNA+ LPN/LVN + RN hours per resident per day
4.08 0.83 4.38 0.80 4.34 0.76 0.176 0.877
Case-mix acuity index 11.55 1.14 12.04 0.91 12.18 0.84 0.008 0.600 Percentage of residents with dementia
49.18 16.17 51.94 15.77 57.42 16.91 0.065 0.273
Percentage of residents age < 65 15.50 13.81 13.49 13.37 16.38 14.68 0.810 0.500 Percentage of residents who are nonwhite
11.35 15.52 11.02 17.97 30.65 24.63 0.005 0.007
Number of residents who are long stay
63.51 29.31 62.74 21.22 101.12 29.30 <.001 <.001
Percentage of residents who are long stay
86.21 10.88 89.01 8.47 83.74 7.67 0.218 0.032
Percentage of Medicare Advantage residents
10.39 9.79 12.11 9.53 16.50 12.27 0.059 0.207
Overall rating 3.26 1.41 4.09 1.11 4.00 0.87 0.003 0.757 Quality rating 3.55 1.46 4.00 1.46 4.59 0.94 <.001 0.089 N 430 34 17 — —
NOTES: Variables included in final propensity score models vary by State and Group (A or B). Differences between the ECCP and matched comparison means that are statistically significant at the 0.05 level are bolded. = Cell intentionally left blank ECCP = Enhanced Care and Coordination Provider; SD = standard deviation; CNA = certified nursing assistant; LPN/LVN = licensed practical nurse or licensed vocational nurse; RN = registered nurse. SOURCE: RTI analysis of Medicare claims, MDS, NHC and CASPER data (Program: PAH2 EV07 /pah2_ev07_facility_characteristics_unctrd)
Figure 4-12 shows the geographic location of ECCP and matched comparison group facilities for Indiana’s Group B. It was not possible to obtain a good match if the facility location within the state was a matching criterion.
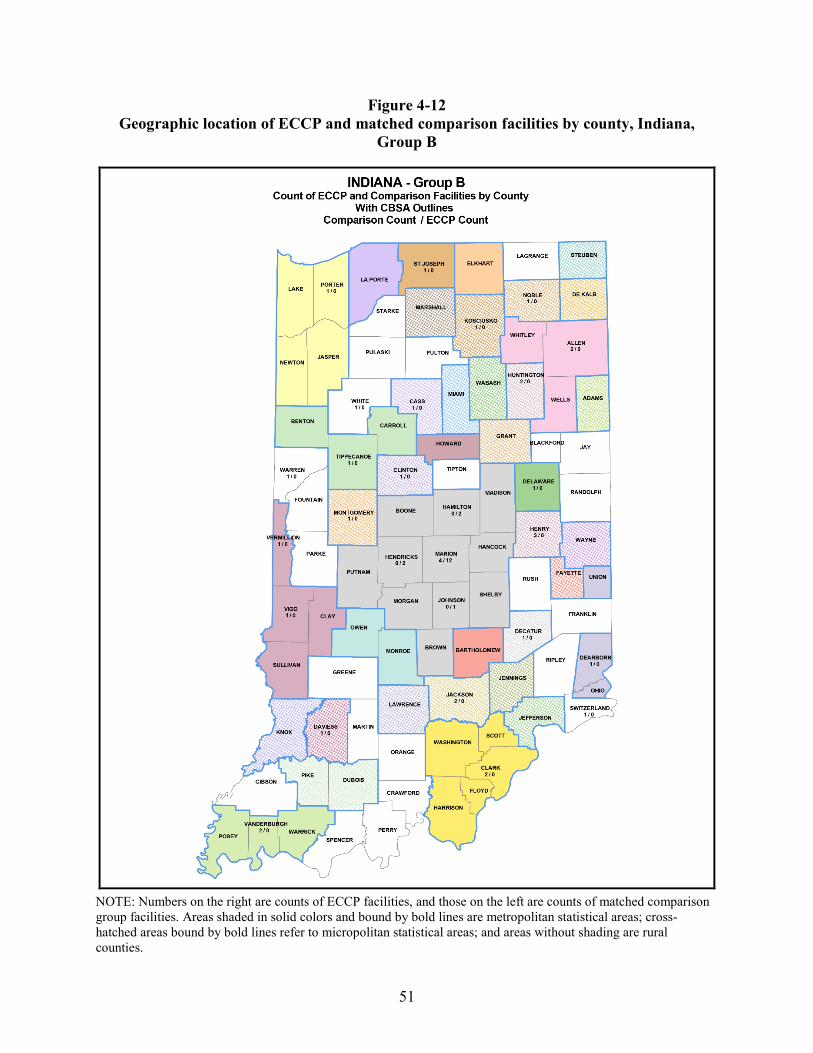
51
Figure 4-12 Geographic location of ECCP and matched comparison facilities by county, Indiana,
Group B
NOTE: Numbers on the right are counts of ECCP facilities, and those on the left are counts of matched comparison group facilities. Areas shaded in solid colors and bound by bold lines are metropolitan statistical areas; cross-hatched areas bound by bold lines refer to micropolitan statistical areas; and areas without shading are rural counties.
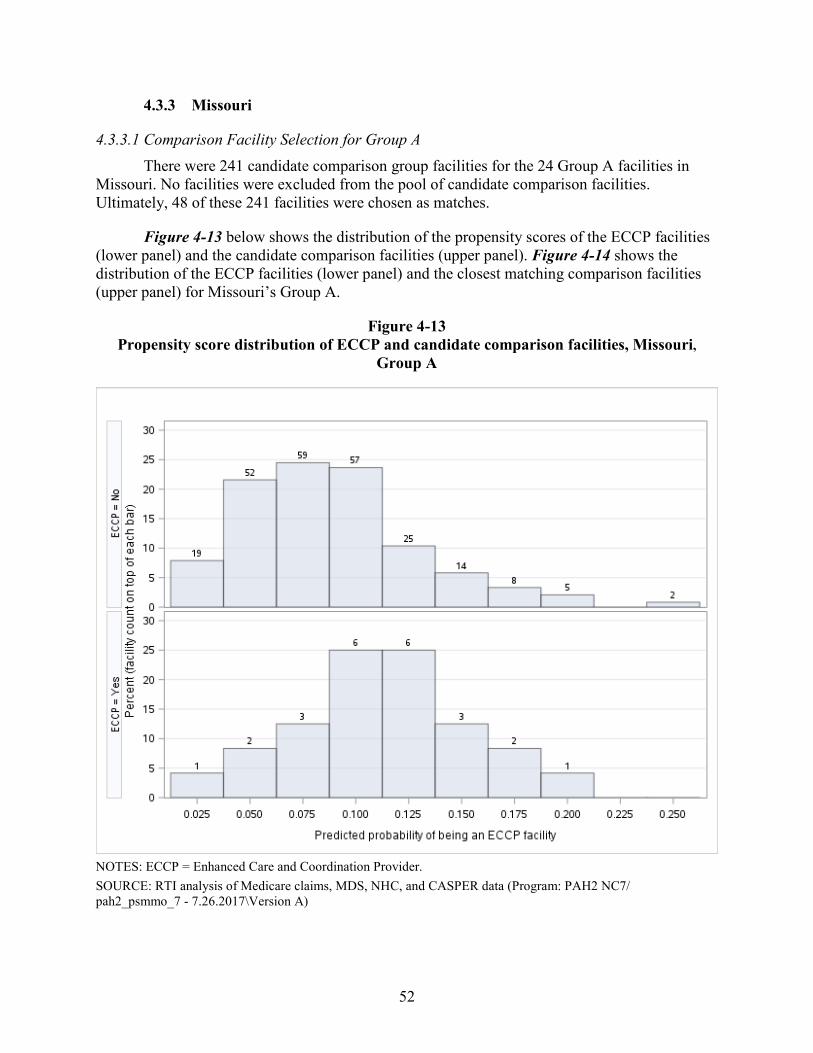
52
4.3.3 Missouri
4.3.3.1 Comparison Facility Selection for Group A There were 241 candidate comparison group facilities for the 24 Group A facilities in
Missouri. No facilities were excluded from the pool of candidate comparison facilities. Ultimately, 48 of these 241 facilities were chosen as matches.
Figure 4-13 below shows the distribution of the propensity scores of the ECCP facilities (lower panel) and the candidate comparison facilities (upper panel). Figure 4-14 shows the distribution of the ECCP facilities (lower panel) and the closest matching comparison facilities (upper panel) for Missouri’s Group A.
Figure 4-13 Propensity score distribution of ECCP and candidate comparison facilities, Missouri,
Group A
NOTES: ECCP = Enhanced Care and Coordination Provider. SOURCE: RTI analysis of Medicare claims, MDS, NHC, and CASPER data (Program: PAH2 NC7/ pah2_psmmo_7 - 7.26.2017\Version A)
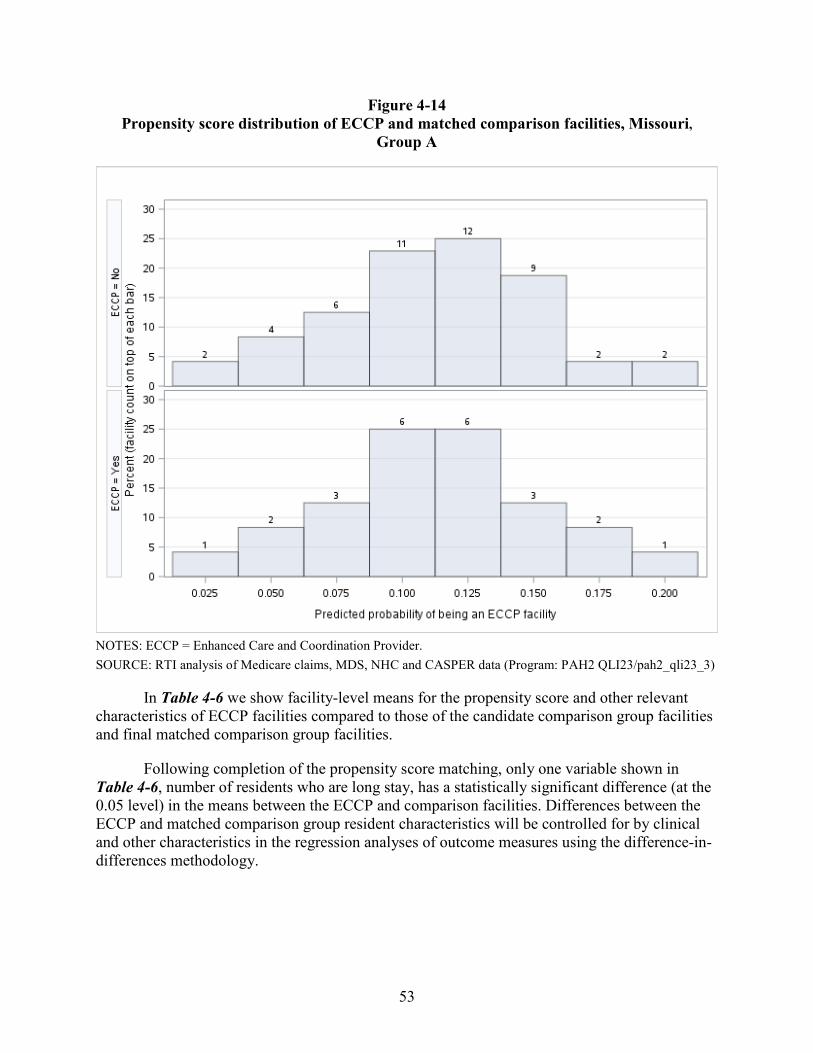
53
Figure 4-14 Propensity score distribution of ECCP and matched comparison facilities, Missouri,
Group A
NOTES: ECCP = Enhanced Care and Coordination Provider. SOURCE: RTI analysis of Medicare claims, MDS, NHC and CASPER data (Program: PAH2 QLI23/pah2_qli23_3)
In Table 4-6 we show facility-level means for the propensity score and other relevant characteristics of ECCP facilities compared to those of the candidate comparison group facilities and final matched comparison group facilities.
Following completion of the propensity score matching, only one variable shown in Table 4-6, number of residents who are long stay, has a statistically significant difference (at the 0.05 level) in the means between the ECCP and comparison facilities. Differences between the ECCP and matched comparison group resident characteristics will be controlled for by clinical and other characteristics in the regression analyses of outcome measures using the difference-in-differences methodology.

54
Table 4-6 Characteristics of ECCP facilities, candidate comparison facilities, and matched
comparison facilities, Missouri, Group A
Characteristic
Comparison
ECCP
Difference between
ECCP and candidate
comparison means
Difference between
ECCP and matched
comparison means
Candidate comparison
(before match)
Matched comparison
(after match)
Mean (SD) Mean (SD) Mean (SD) p-value p-value Propensity score 0.09 0.04 0.11 0.04 0.11 0.04 0.017 0.987 All-cause hospitalization rate (per 1,000 person-days)
1.57 0.64 1.51 0.68 1.47 0.64 0.465 0.790
Potentially avoidable hospitalization rate (per 1,000 person-days)
0.65 0.34 0.61 0.34 0.59 0.20 0.240 0.828
Total CNA+ LPN/LVN + RN hours per resident per day
3.89 0.72 3.73 0.58 3.66 0.52 0.060 0.612
Case-mix acuity index 10.54 1.17 10.83 1.03 10.79 1.17 0.329 0.884 Percentage of residents with dementia
44.95 13.79 47.34 11.86 47.16 15.57 0.508 0.960
Percentage of residents age < 65 16.60 16.55 12.56 9.23 14.90 16.69 0.638 0.528 Percentage of residents who are nonwhite
9.54 17.47 7.75 13.49 9.39 8.38 0.940 0.529
Number of residents who are long stay
65.85 27.72 71.35 29.36 96.67 24.36 <.001 <.001
Percentage of residents who are long stay
89.71 8.73 90.27 6.56 89.39 5.23 0.793 0.541
Percentage of Medicare Advantage residents
9.88 8.65 12.65 10.17 11.00 9.28 0.575 0.494
Overall rating 3.85 1.02 3.96 0.94 3.83 1.13 0.943 0.643 Quality rating 3.51 1.36 3.27 1.40 3.50 1.32 0.971 0.499 N 241 48 24 — —
NOTES: Variables included in final propensity score models vary by state and group (A or B). Differences between the ECCP and matched comparison means that are statistically significant at the 0.05 level are bolded. = Cell intentionally left blank ECCP = Enhanced Care and Coordination Provider; SD = standard deviation; CNA = certified nursing assistant; LPN/LVN = licensed practical nurse or licensed vocational nurse; RN = registered nurse. SOURCE: RTI analysis of Medicare claims, MDS, NHC, and CASPER data (Program: PAH2 EV07 /pah2_ev07_facility_characteristics_unctrd)
Figure 4-15 shows the geographic location of ECCP and matched comparison group facilities for Missouri’s Group A. It was not possible to obtain a good match if the facility location within the state was a matching criterion.
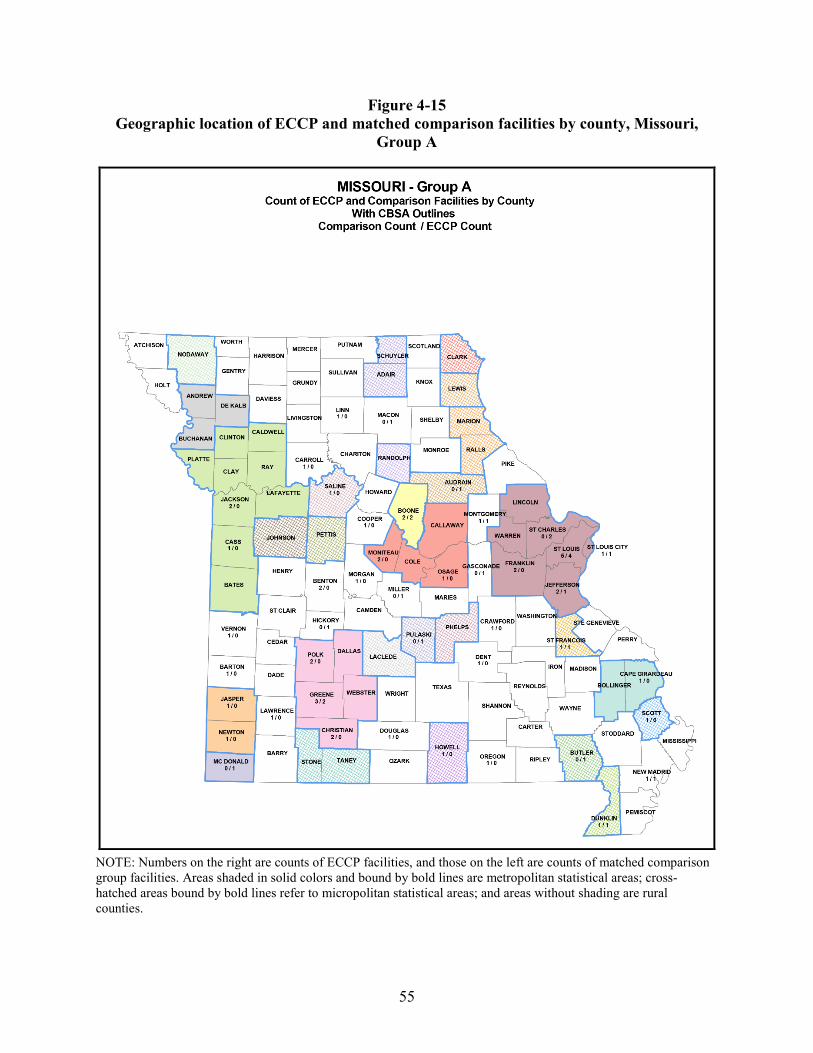
55
Figure 4-15 Geographic location of ECCP and matched comparison facilities by county, Missouri,
Group A
NOTE: Numbers on the right are counts of ECCP facilities, and those on the left are counts of matched comparison group facilities. Areas shaded in solid colors and bound by bold lines are metropolitan statistical areas; cross-hatched areas bound by bold lines refer to micropolitan statistical areas; and areas without shading are rural counties.
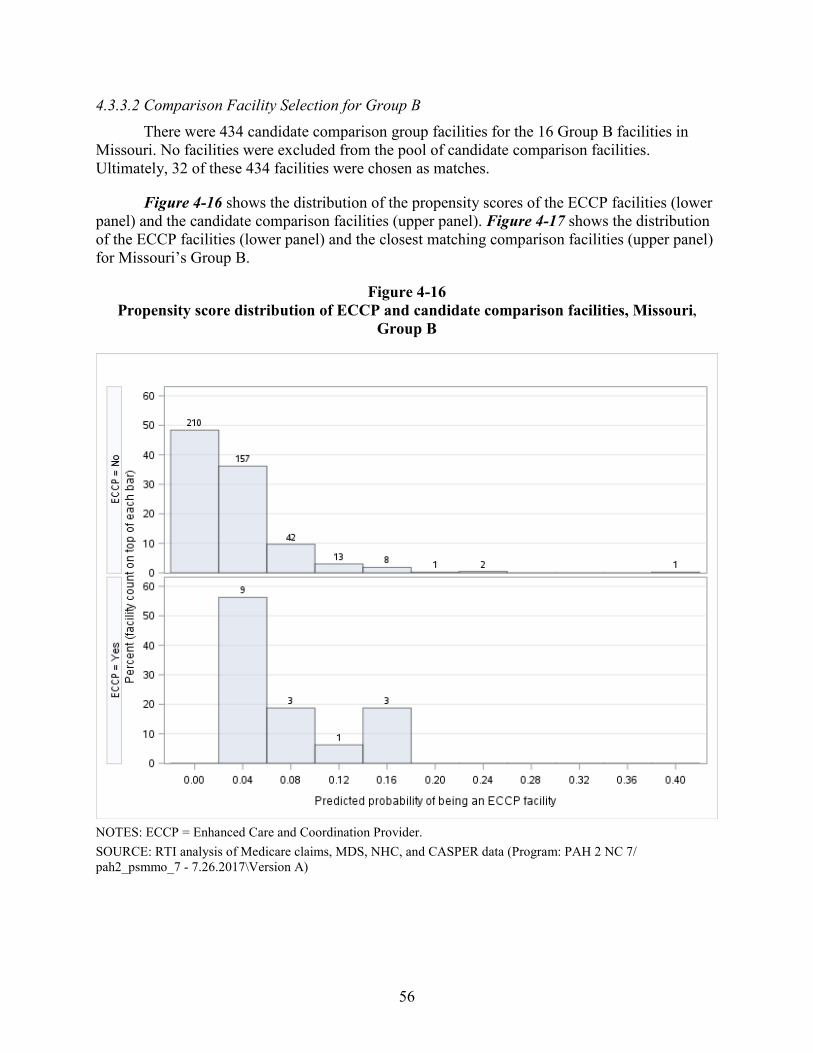
56
4.3.3.2 Comparison Facility Selection for Group B There were 434 candidate comparison group facilities for the 16 Group B facilities in
Missouri. No facilities were excluded from the pool of candidate comparison facilities. Ultimately, 32 of these 434 facilities were chosen as matches.
Figure 4-16 shows the distribution of the propensity scores of the ECCP facilities (lower panel) and the candidate comparison facilities (upper panel). Figure 4-17 shows the distribution of the ECCP facilities (lower panel) and the closest matching comparison facilities (upper panel) for Missouri’s Group B.
Figure 4-16 Propensity score distribution of ECCP and candidate comparison facilities, Missouri,
Group B
NOTES: ECCP = Enhanced Care and Coordination Provider. SOURCE: RTI analysis of Medicare claims, MDS, NHC, and CASPER data (Program: PAH 2 NC 7/ pah2_psmmo_7 - 7.26.2017\Version A)
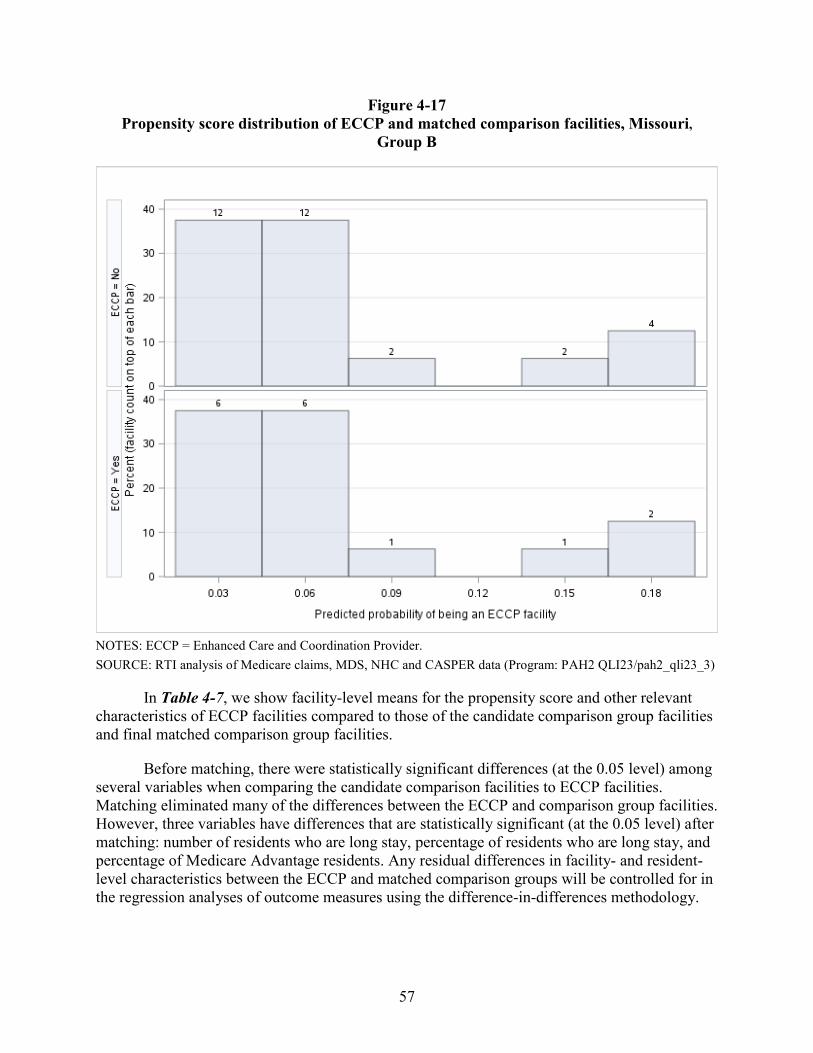
57
Figure 4-17 Propensity score distribution of ECCP and matched comparison facilities, Missouri,
Group B
NOTES: ECCP = Enhanced Care and Coordination Provider. SOURCE: RTI analysis of Medicare claims, MDS, NHC and CASPER data (Program: PAH2 QLI23/pah2_qli23_3)
In Table 4-7, we show facility-level means for the propensity score and other relevant characteristics of ECCP facilities compared to those of the candidate comparison group facilities and final matched comparison group facilities.
Before matching, there were statistically significant differences (at the 0.05 level) among several variables when comparing the candidate comparison facilities to ECCP facilities. Matching eliminated many of the differences between the ECCP and comparison group facilities. However, three variables have differences that are statistically significant (at the 0.05 level) after matching: number of residents who are long stay, percentage of residents who are long stay, and percentage of Medicare Advantage residents. Any residual differences in facility- and resident-level characteristics between the ECCP and matched comparison groups will be controlled for in the regression analyses of outcome measures using the difference-in-differences methodology.
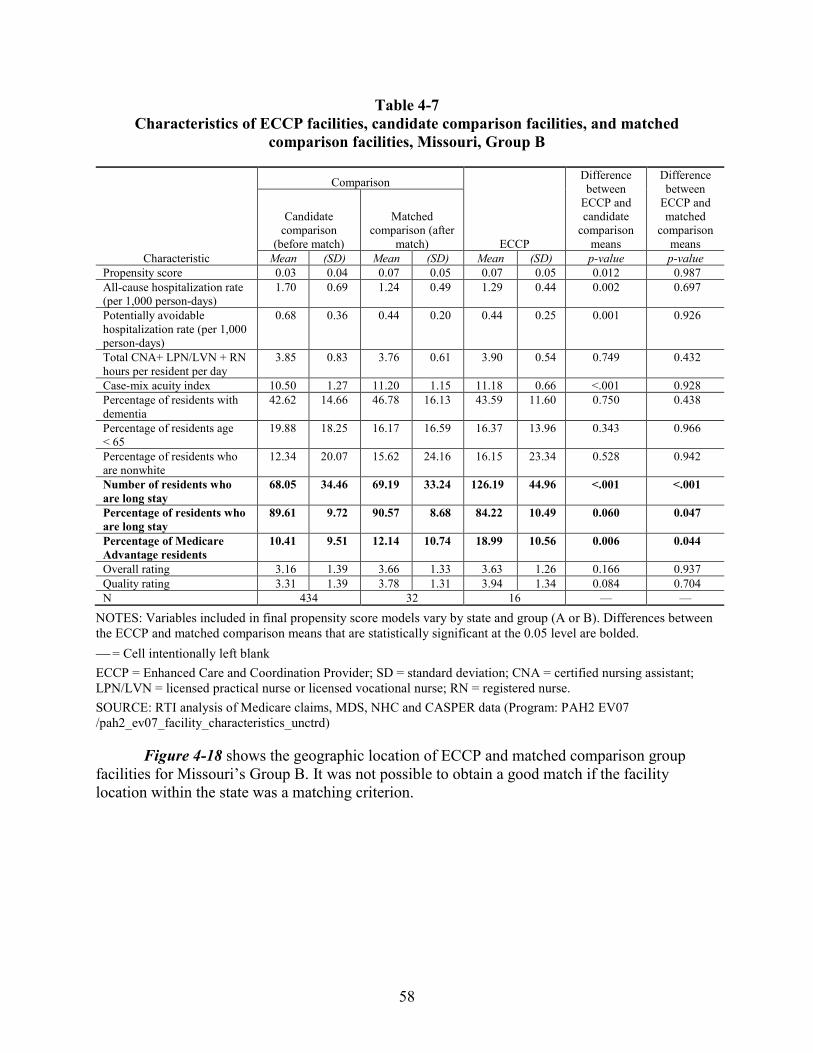
58
Table 4-7 Characteristics of ECCP facilities, candidate comparison facilities, and matched
comparison facilities, Missouri, Group B
Characteristic
Comparison
ECCP
Difference between
ECCP and candidate
comparison means
Difference between
ECCP and matched
comparison means
Candidate comparison
(before match)
Matched comparison (after
match)
Mean (SD) Mean (SD) Mean (SD) p-value p-value Propensity score 0.03 0.04 0.07 0.05 0.07 0.05 0.012 0.987 All-cause hospitalization rate (per 1,000 person-days)
1.70 0.69 1.24 0.49 1.29 0.44 0.002 0.697
Potentially avoidable hospitalization rate (per 1,000 person-days)
0.68 0.36 0.44 0.20 0.44 0.25 0.001 0.926
Total CNA+ LPN/LVN + RN hours per resident per day
3.85 0.83 3.76 0.61 3.90 0.54 0.749 0.432
Case-mix acuity index 10.50 1.27 11.20 1.15 11.18 0.66 <.001 0.928 Percentage of residents with dementia
42.62 14.66 46.78 16.13 43.59 11.60 0.750 0.438
Percentage of residents age < 65
19.88 18.25 16.17 16.59 16.37 13.96 0.343 0.966
Percentage of residents who are nonwhite
12.34 20.07 15.62 24.16 16.15 23.34 0.528 0.942
Number of residents who are long stay
68.05 34.46 69.19 33.24 126.19 44.96 <.001 <.001
Percentage of residents who are long stay
89.61 9.72 90.57 8.68 84.22 10.49 0.060 0.047
Percentage of Medicare Advantage residents
10.41 9.51 12.14 10.74 18.99 10.56 0.006 0.044
Overall rating 3.16 1.39 3.66 1.33 3.63 1.26 0.166 0.937 Quality rating 3.31 1.39 3.78 1.31 3.94 1.34 0.084 0.704 N 434 32 16 — —
NOTES: Variables included in final propensity score models vary by state and group (A or B). Differences between the ECCP and matched comparison means that are statistically significant at the 0.05 level are bolded. = Cell intentionally left blank ECCP = Enhanced Care and Coordination Provider; SD = standard deviation; CNA = certified nursing assistant; LPN/LVN = licensed practical nurse or licensed vocational nurse; RN = registered nurse. SOURCE: RTI analysis of Medicare claims, MDS, NHC and CASPER data (Program: PAH2 EV07 /pah2_ev07_facility_characteristics_unctrd)
Figure 4-18 shows the geographic location of ECCP and matched comparison group facilities for Missouri’s Group B. It was not possible to obtain a good match if the facility location within the state was a matching criterion.
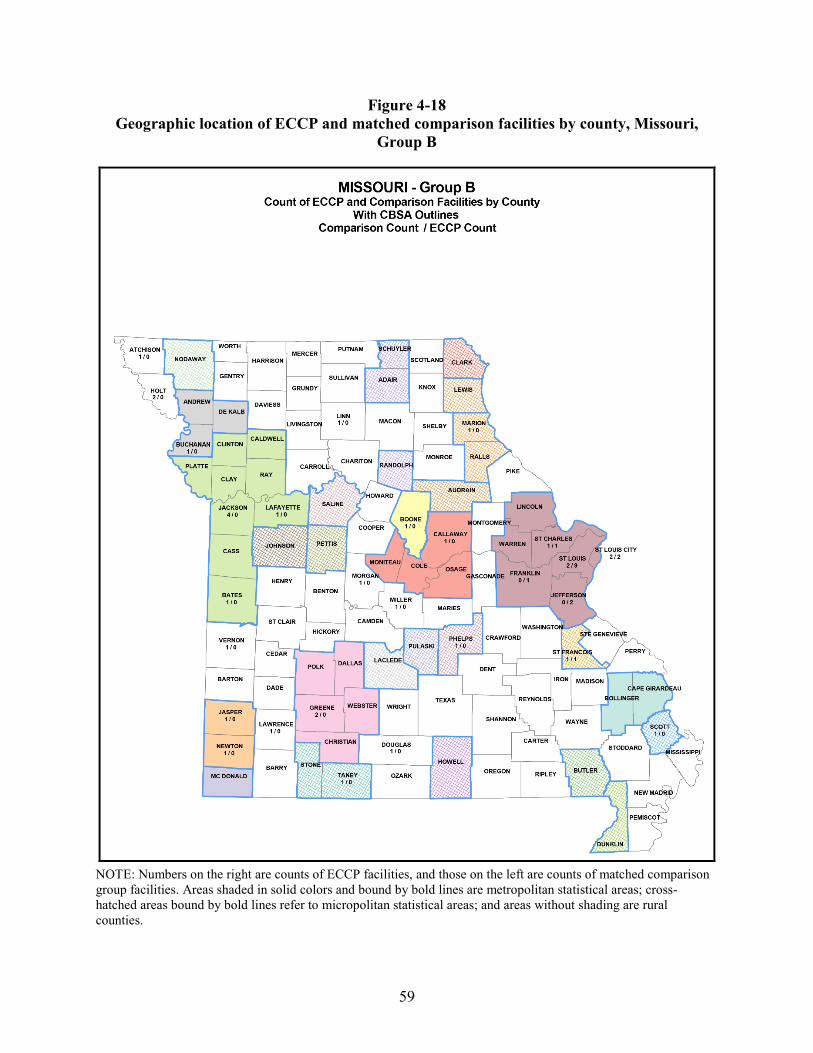
59
Figure 4-18 Geographic location of ECCP and matched comparison facilities by county, Missouri,
Group B
NOTE: Numbers on the right are counts of ECCP facilities, and those on the left are counts of matched comparison group facilities. Areas shaded in solid colors and bound by bold lines are metropolitan statistical areas; cross-hatched areas bound by bold lines refer to micropolitan statistical areas; and areas without shading are rural counties.
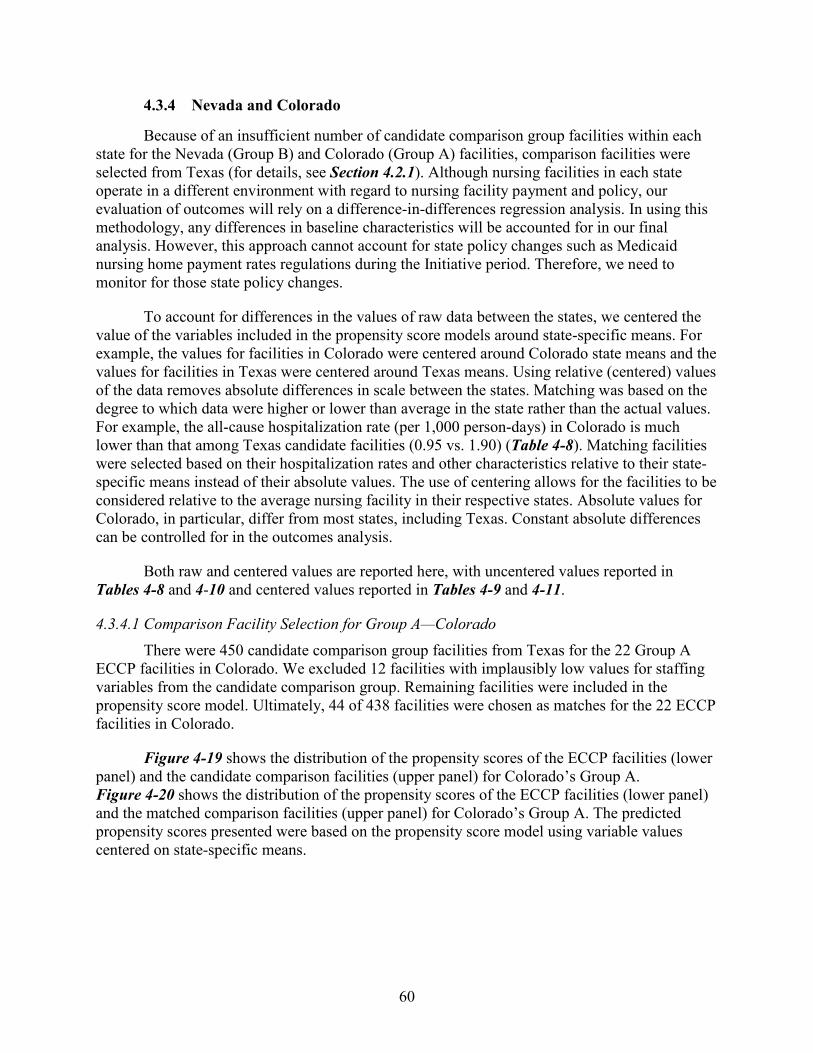
60
4.3.4 Nevada and Colorado
Because of an insufficient number of candidate comparison group facilities within each state for the Nevada (Group B) and Colorado (Group A) facilities, comparison facilities were selected from Texas (for details, see Section 4.2.1). Although nursing facilities in each state operate in a different environment with regard to nursing facility payment and policy, our evaluation of outcomes will rely on a difference-in-differences regression analysis. In using this methodology, any differences in baseline characteristics will be accounted for in our final analysis. However, this approach cannot account for state policy changes such as Medicaid nursing home payment rates regulations during the Initiative period. Therefore, we need to monitor for those state policy changes.
To account for differences in the values of raw data between the states, we centered the value of the variables included in the propensity score models around state-specific means. For example, the values for facilities in Colorado were centered around Colorado state means and the values for facilities in Texas were centered around Texas means. Using relative (centered) values of the data removes absolute differences in scale between the states. Matching was based on the degree to which data were higher or lower than average in the state rather than the actual values. For example, the all-cause hospitalization rate (per 1,000 person-days) in Colorado is much lower than that among Texas candidate facilities (0.95 vs. 1.90) (Table 4-8). Matching facilities were selected based on their hospitalization rates and other characteristics relative to their state-specific means instead of their absolute values. The use of centering allows for the facilities to be considered relative to the average nursing facility in their respective states. Absolute values for Colorado, in particular, differ from most states, including Texas. Constant absolute differences can be controlled for in the outcomes analysis.
Both raw and centered values are reported here, with uncentered values reported in Tables 4-8 and 4-10 and centered values reported in Tables 4-9 and 4-11.
4.3.4.1 Comparison Facility Selection for Group A—Colorado There were 450 candidate comparison group facilities from Texas for the 22 Group A
ECCP facilities in Colorado. We excluded 12 facilities with implausibly low values for staffing variables from the candidate comparison group. Remaining facilities were included in the propensity score model. Ultimately, 44 of 438 facilities were chosen as matches for the 22 ECCP facilities in Colorado.
Figure 4-19 shows the distribution of the propensity scores of the ECCP facilities (lower panel) and the candidate comparison facilities (upper panel) for Colorado’s Group A. Figure 4-20 shows the distribution of the propensity scores of the ECCP facilities (lower panel) and the matched comparison facilities (upper panel) for Colorado’s Group A. The predicted propensity scores presented were based on the propensity score model using variable values centered on state-specific means.
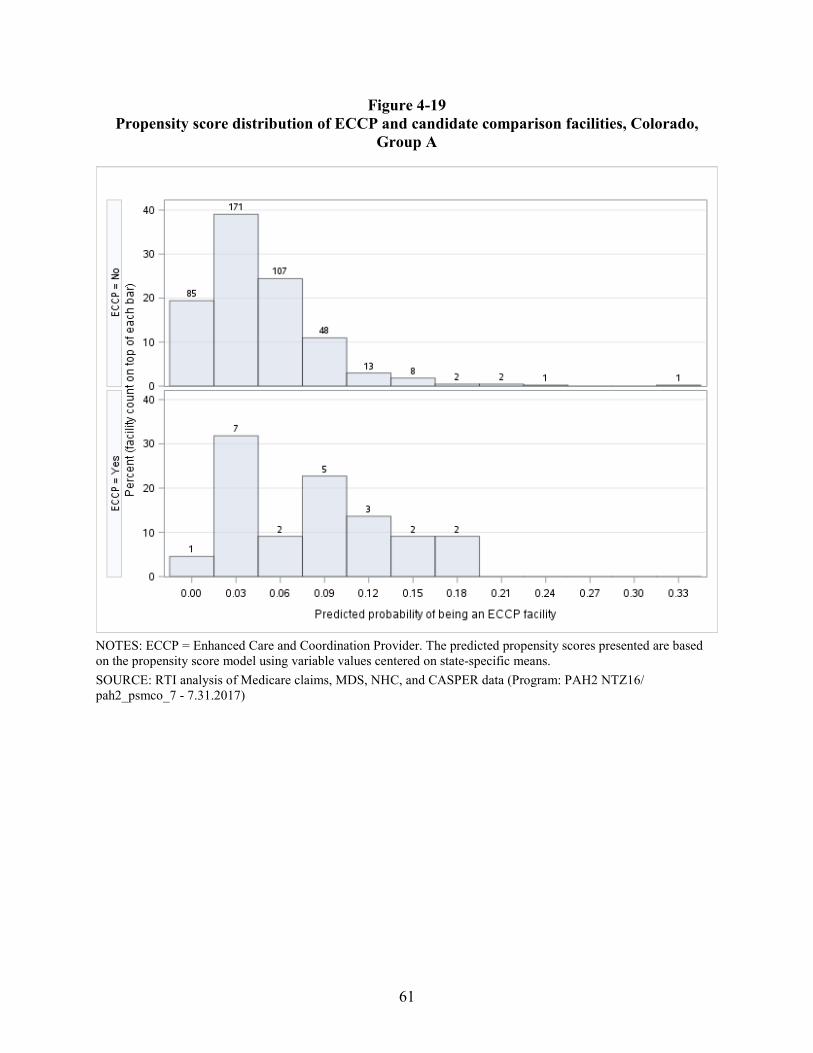
61
Figure 4-19 Propensity score distribution of ECCP and candidate comparison facilities, Colorado,
Group A
NOTES: ECCP = Enhanced Care and Coordination Provider. The predicted propensity scores presented are based on the propensity score model using variable values centered on state-specific means. SOURCE: RTI analysis of Medicare claims, MDS, NHC, and CASPER data (Program: PAH2 NTZ16/ pah2_psmco_7 - 7.31.2017)
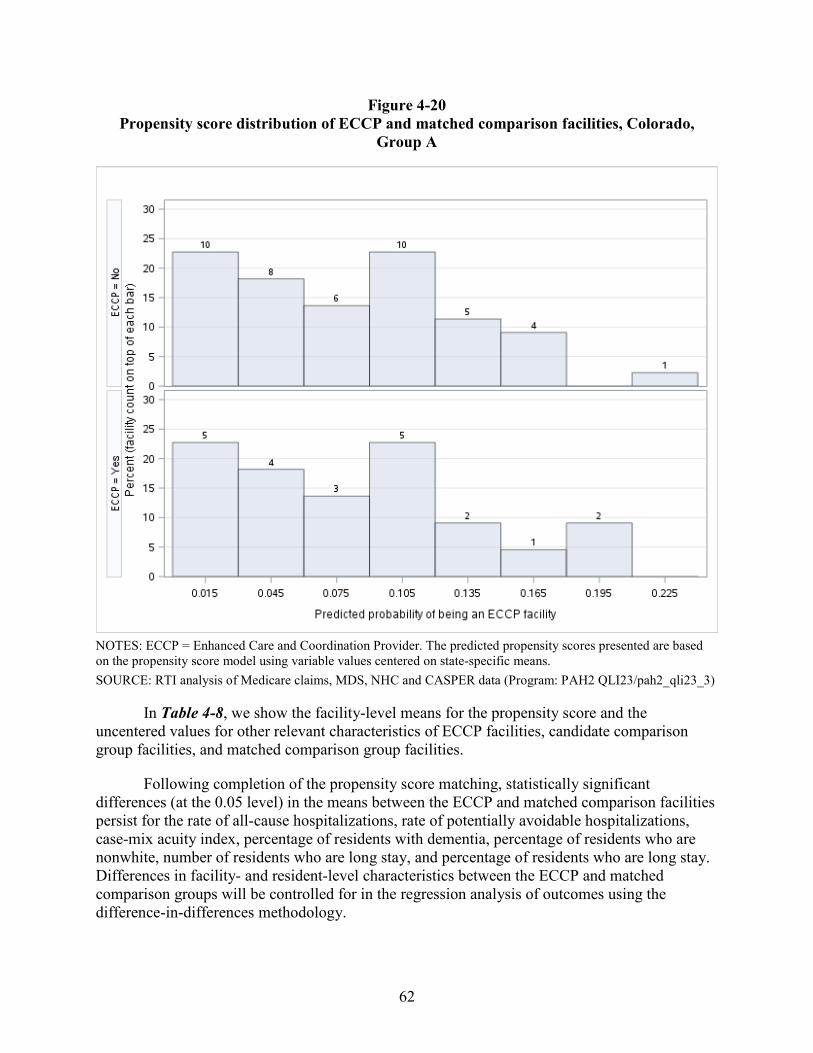
62
Figure 4-20 Propensity score distribution of ECCP and matched comparison facilities, Colorado,
Group A
NOTES: ECCP = Enhanced Care and Coordination Provider. The predicted propensity scores presented are based on the propensity score model using variable values centered on state-specific means. SOURCE: RTI analysis of Medicare claims, MDS, NHC and CASPER data (Program: PAH2 QLI23/pah2_qli23_3)
In Table 4-8, we show the facility-level means for the propensity score and the uncentered values for other relevant characteristics of ECCP facilities, candidate comparison group facilities, and matched comparison group facilities.
Following completion of the propensity score matching, statistically significant differences (at the 0.05 level) in the means between the ECCP and matched comparison facilities persist for the rate of all-cause hospitalizations, rate of potentially avoidable hospitalizations, case-mix acuity index, percentage of residents with dementia, percentage of residents who are nonwhite, number of residents who are long stay, and percentage of residents who are long stay. Differences in facility- and resident-level characteristics between the ECCP and matched comparison groups will be controlled for in the regression analysis of outcomes using the difference-in-differences methodology.
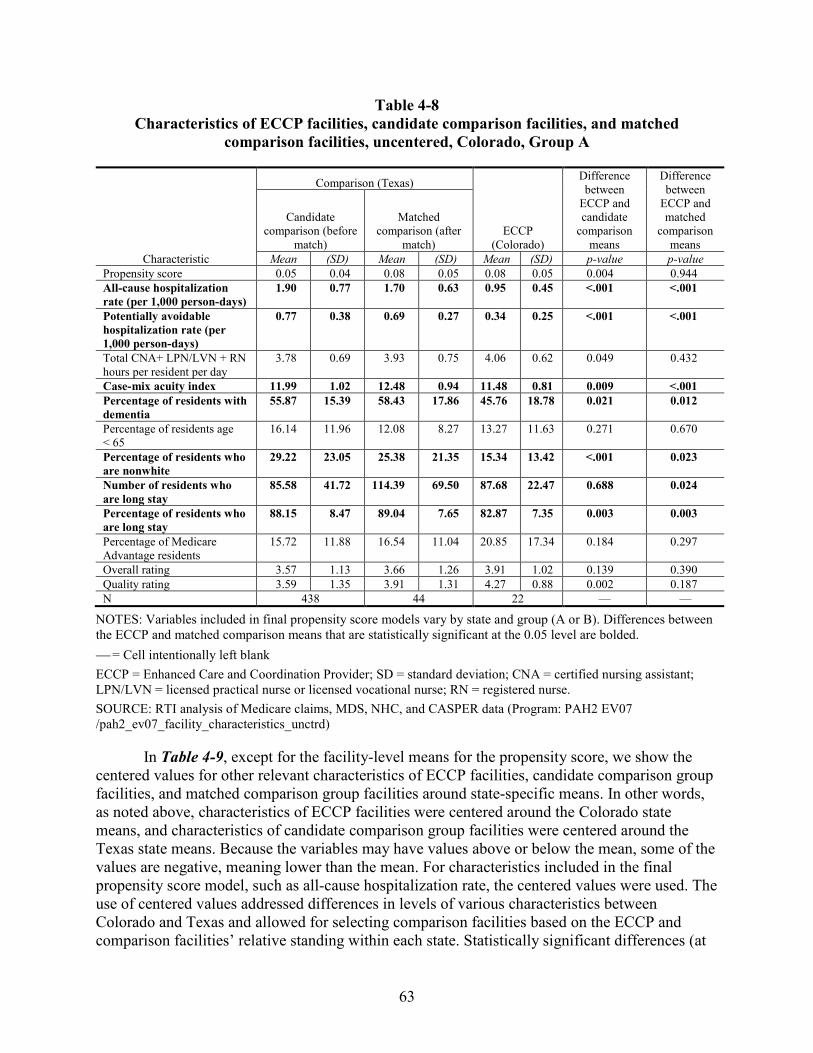
63
Table 4-8 Characteristics of ECCP facilities, candidate comparison facilities, and matched
comparison facilities, uncentered, Colorado, Group A
Characteristic
Comparison (Texas)
ECCP (Colorado)
Difference between
ECCP and candidate
comparison means
Difference between
ECCP and matched
comparison means
Candidate comparison (before
match)
Matched comparison (after
match)
Mean (SD) Mean (SD) Mean (SD) p-value p-value Propensity score 0.05 0.04 0.08 0.05 0.08 0.05 0.004 0.944 All-cause hospitalization rate (per 1,000 person-days)
1.90 0.77 1.70 0.63 0.95 0.45 <.001 <.001
Potentially avoidable hospitalization rate (per 1,000 person-days)
0.77 0.38 0.69 0.27 0.34 0.25 <.001 <.001
Total CNA+ LPN/LVN + RN hours per resident per day
3.78 0.69 3.93 0.75 4.06 0.62 0.049 0.432
Case-mix acuity index 11.99 1.02 12.48 0.94 11.48 0.81 0.009 <.001 Percentage of residents with dementia
55.87 15.39 58.43 17.86 45.76 18.78 0.021 0.012
Percentage of residents age < 65
16.14 11.96 12.08 8.27 13.27 11.63 0.271 0.670
Percentage of residents who are nonwhite
29.22 23.05 25.38 21.35 15.34 13.42 <.001 0.023
Number of residents who are long stay
85.58 41.72 114.39 69.50 87.68 22.47 0.688 0.024
Percentage of residents who are long stay
88.15 8.47 89.04 7.65 82.87 7.35 0.003 0.003
Percentage of Medicare Advantage residents
15.72 11.88 16.54 11.04 20.85 17.34 0.184 0.297
Overall rating 3.57 1.13 3.66 1.26 3.91 1.02 0.139 0.390 Quality rating 3.59 1.35 3.91 1.31 4.27 0.88 0.002 0.187 N 438 44 22 — —
NOTES: Variables included in final propensity score models vary by state and group (A or B). Differences between the ECCP and matched comparison means that are statistically significant at the 0.05 level are bolded. = Cell intentionally left blank ECCP = Enhanced Care and Coordination Provider; SD = standard deviation; CNA = certified nursing assistant; LPN/LVN = licensed practical nurse or licensed vocational nurse; RN = registered nurse. SOURCE: RTI analysis of Medicare claims, MDS, NHC, and CASPER data (Program: PAH2 EV07 /pah2_ev07_facility_characteristics_unctrd)
In Table 4-9, except for the facility-level means for the propensity score, we show the centered values for other relevant characteristics of ECCP facilities, candidate comparison group facilities, and matched comparison group facilities around state-specific means. In other words, as noted above, characteristics of ECCP facilities were centered around the Colorado state means, and characteristics of candidate comparison group facilities were centered around the Texas state means. Because the variables may have values above or below the mean, some of the values are negative, meaning lower than the mean. For characteristics included in the final propensity score model, such as all-cause hospitalization rate, the centered values were used. The use of centered values addressed differences in levels of various characteristics between Colorado and Texas and allowed for selecting comparison facilities based on the ECCP and comparison facilities’ relative standing within each state. Statistically significant differences (at
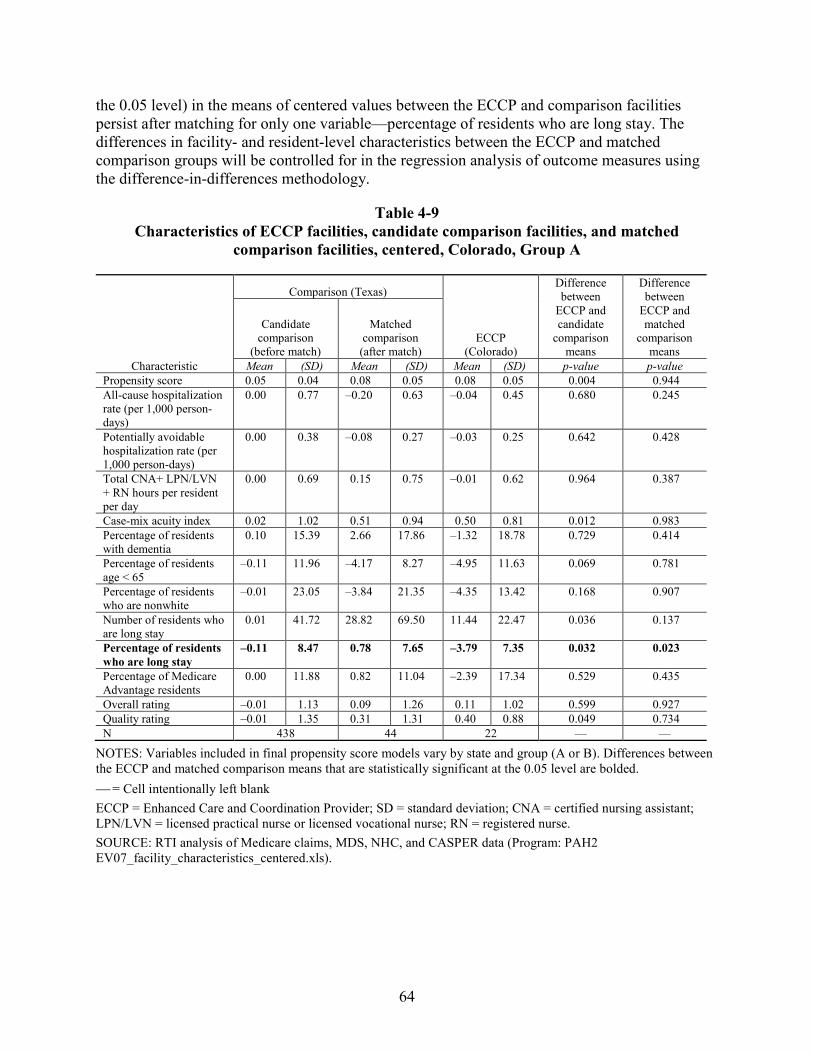
64
the 0.05 level) in the means of centered values between the ECCP and comparison facilities persist after matching for only one variable—percentage of residents who are long stay. The differences in facility- and resident-level characteristics between the ECCP and matched comparison groups will be controlled for in the regression analysis of outcome measures using the difference-in-differences methodology.
Table 4-9 Characteristics of ECCP facilities, candidate comparison facilities, and matched
comparison facilities, centered, Colorado, Group A
Characteristic
Comparison (Texas)
ECCP (Colorado)
Difference between
ECCP and candidate
comparison means
Difference between
ECCP and matched
comparison means
Candidate comparison
(before match)
Matched comparison
(after match)
Mean (SD) Mean (SD) Mean (SD) p-value p-value Propensity score 0.05 0.04 0.08 0.05 0.08 0.05 0.004 0.944 All-cause hospitalization rate (per 1,000 person-days)
0.00 0.77 –0.20 0.63 –0.04 0.45 0.680 0.245
Potentially avoidable hospitalization rate (per 1,000 person-days)
0.00 0.38 –0.08 0.27 –0.03 0.25 0.642 0.428
Total CNA+ LPN/LVN + RN hours per resident per day
0.00 0.69 0.15 0.75 –0.01 0.62 0.964 0.387
Case-mix acuity index 0.02 1.02 0.51 0.94 0.50 0.81 0.012 0.983 Percentage of residents with dementia
0.10 15.39 2.66 17.86 –1.32 18.78 0.729 0.414
Percentage of residents age < 65
–0.11 11.96 –4.17 8.27 –4.95 11.63 0.069 0.781
Percentage of residents who are nonwhite
–0.01 23.05 –3.84 21.35 –4.35 13.42 0.168 0.907
Number of residents who are long stay
0.01 41.72 28.82 69.50 11.44 22.47 0.036 0.137
Percentage of residents who are long stay
–0.11 8.47 0.78 7.65 –3.79 7.35 0.032 0.023
Percentage of Medicare Advantage residents
0.00 11.88 0.82 11.04 –2.39 17.34 0.529 0.435
Overall rating –0.01 1.13 0.09 1.26 0.11 1.02 0.599 0.927 Quality rating –0.01 1.35 0.31 1.31 0.40 0.88 0.049 0.734 N 438 44 22 — —
NOTES: Variables included in final propensity score models vary by state and group (A or B). Differences between the ECCP and matched comparison means that are statistically significant at the 0.05 level are bolded. = Cell intentionally left blank ECCP = Enhanced Care and Coordination Provider; SD = standard deviation; CNA = certified nursing assistant; LPN/LVN = licensed practical nurse or licensed vocational nurse; RN = registered nurse. SOURCE: RTI analysis of Medicare claims, MDS, NHC, and CASPER data (Program: PAH2 EV07_facility_characteristics_centered.xls).
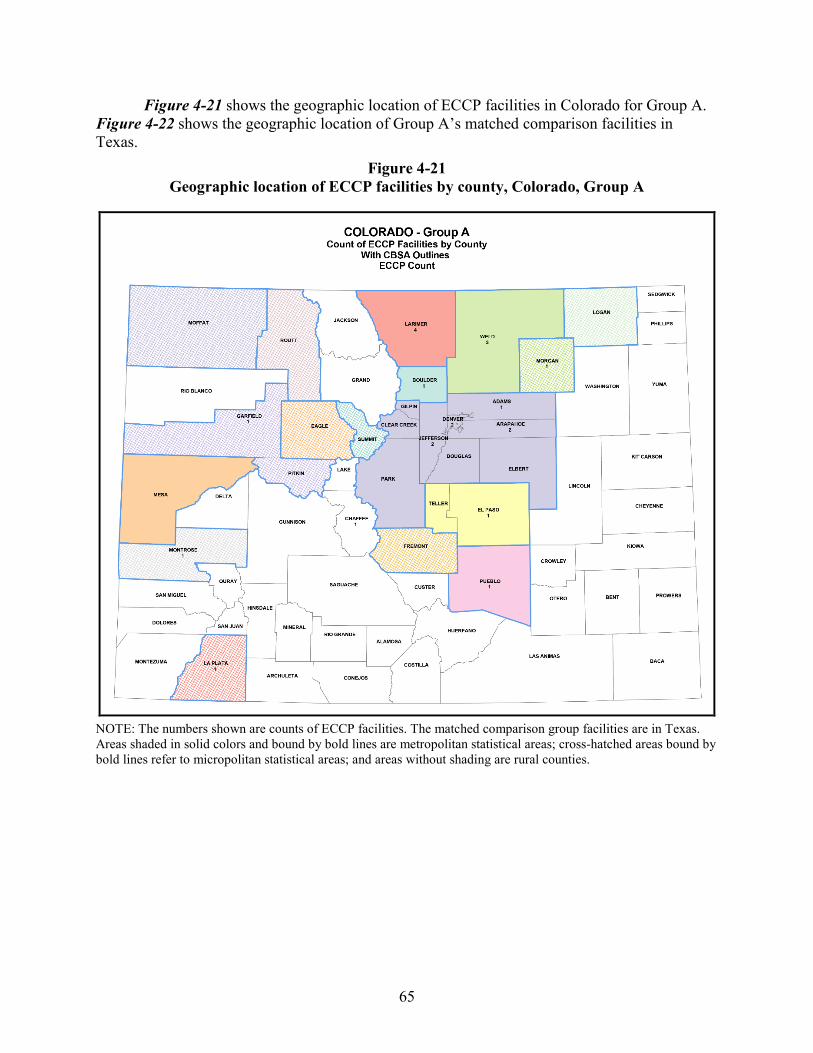
65
Figure 4-21 shows the geographic location of ECCP facilities in Colorado for Group A. Figure 4-22 shows the geographic location of Group A’s matched comparison facilities in Texas.
Figure 4-21 Geographic location of ECCP facilities by county, Colorado, Group A
NOTE: The numbers shown are counts of ECCP facilities. The matched comparison group facilities are in Texas. Areas shaded in solid colors and bound by bold lines are metropolitan statistical areas; cross-hatched areas bound by bold lines refer to micropolitan statistical areas; and areas without shading are rural counties.
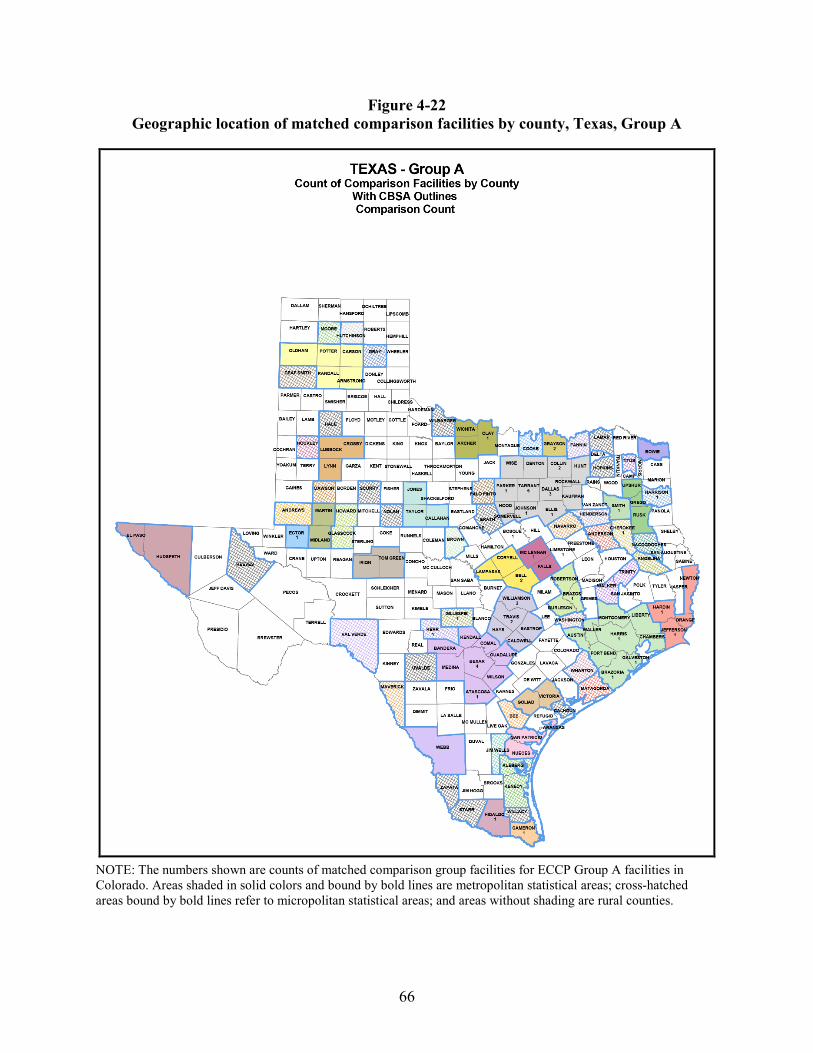
66
Figure 4-22 Geographic location of matched comparison facilities by county, Texas, Group A
NOTE: The numbers shown are counts of matched comparison group facilities for ECCP Group A facilities in Colorado. Areas shaded in solid colors and bound by bold lines are metropolitan statistical areas; cross-hatched areas bound by bold lines refer to micropolitan statistical areas; and areas without shading are rural counties.
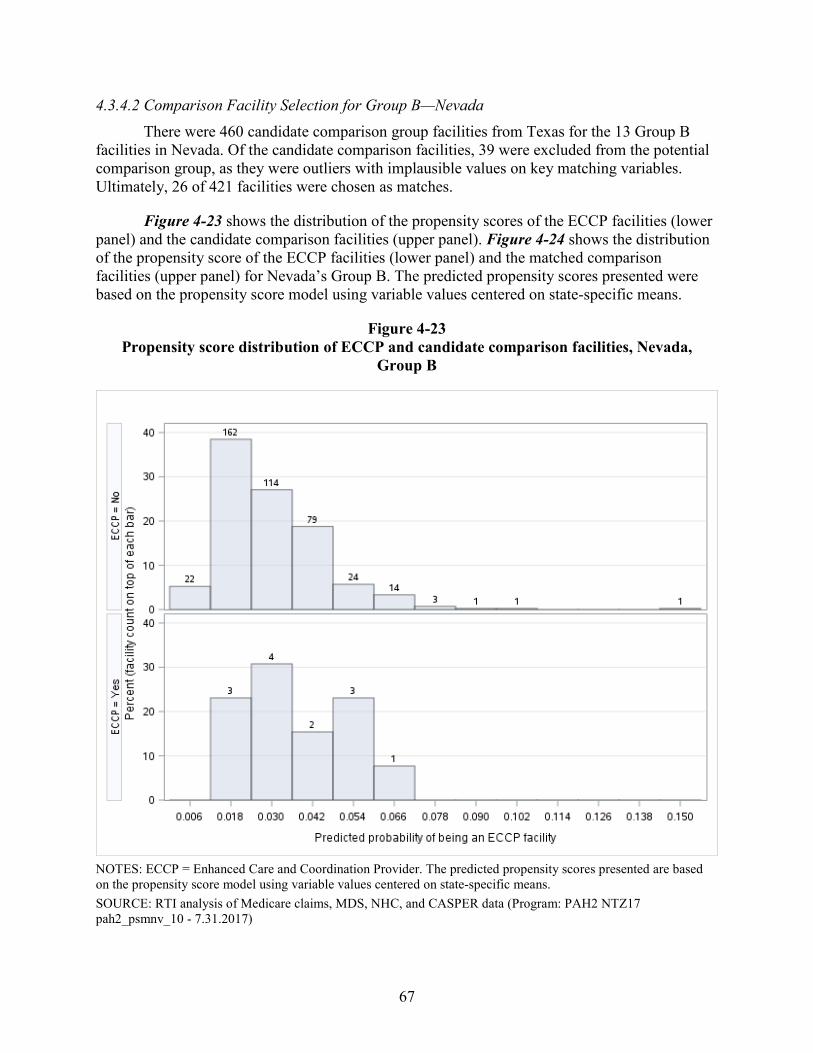
67
4.3.4.2 Comparison Facility Selection for Group B—Nevada There were 460 candidate comparison group facilities from Texas for the 13 Group B
facilities in Nevada. Of the candidate comparison facilities, 39 were excluded from the potential comparison group, as they were outliers with implausible values on key matching variables. Ultimately, 26 of 421 facilities were chosen as matches.
Figure 4-23 shows the distribution of the propensity scores of the ECCP facilities (lower panel) and the candidate comparison facilities (upper panel). Figure 4-24 shows the distribution of the propensity score of the ECCP facilities (lower panel) and the matched comparison facilities (upper panel) for Nevada’s Group B. The predicted propensity scores presented were based on the propensity score model using variable values centered on state-specific means.
Figure 4-23 Propensity score distribution of ECCP and candidate comparison facilities, Nevada,
Group B
NOTES: ECCP = Enhanced Care and Coordination Provider. The predicted propensity scores presented are based on the propensity score model using variable values centered on state-specific means. SOURCE: RTI analysis of Medicare claims, MDS, NHC, and CASPER data (Program: PAH2 NTZ17 pah2_psmnv_10 - 7.31.2017)
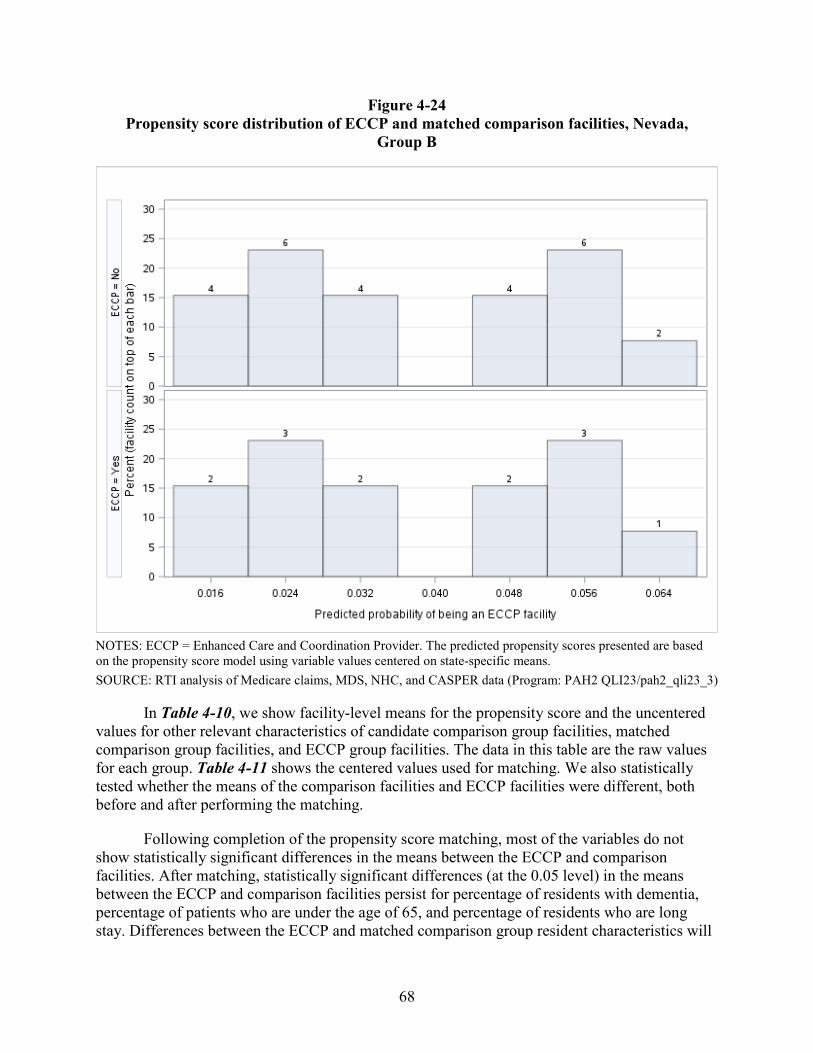
68
Figure 4-24 Propensity score distribution of ECCP and matched comparison facilities, Nevada,
Group B
NOTES: ECCP = Enhanced Care and Coordination Provider. The predicted propensity scores presented are based on the propensity score model using variable values centered on state-specific means. SOURCE: RTI analysis of Medicare claims, MDS, NHC, and CASPER data (Program: PAH2 QLI23/pah2_qli23_3)
In Table 4-10, we show facility-level means for the propensity score and the uncentered values for other relevant characteristics of candidate comparison group facilities, matched comparison group facilities, and ECCP group facilities. The data in this table are the raw values for each group. Table 4-11 shows the centered values used for matching. We also statistically tested whether the means of the comparison facilities and ECCP facilities were different, both before and after performing the matching.
Following completion of the propensity score matching, most of the variables do not show statistically significant differences in the means between the ECCP and comparison facilities. After matching, statistically significant differences (at the 0.05 level) in the means between the ECCP and comparison facilities persist for percentage of residents with dementia, percentage of patients who are under the age of 65, and percentage of residents who are long stay. Differences between the ECCP and matched comparison group resident characteristics will
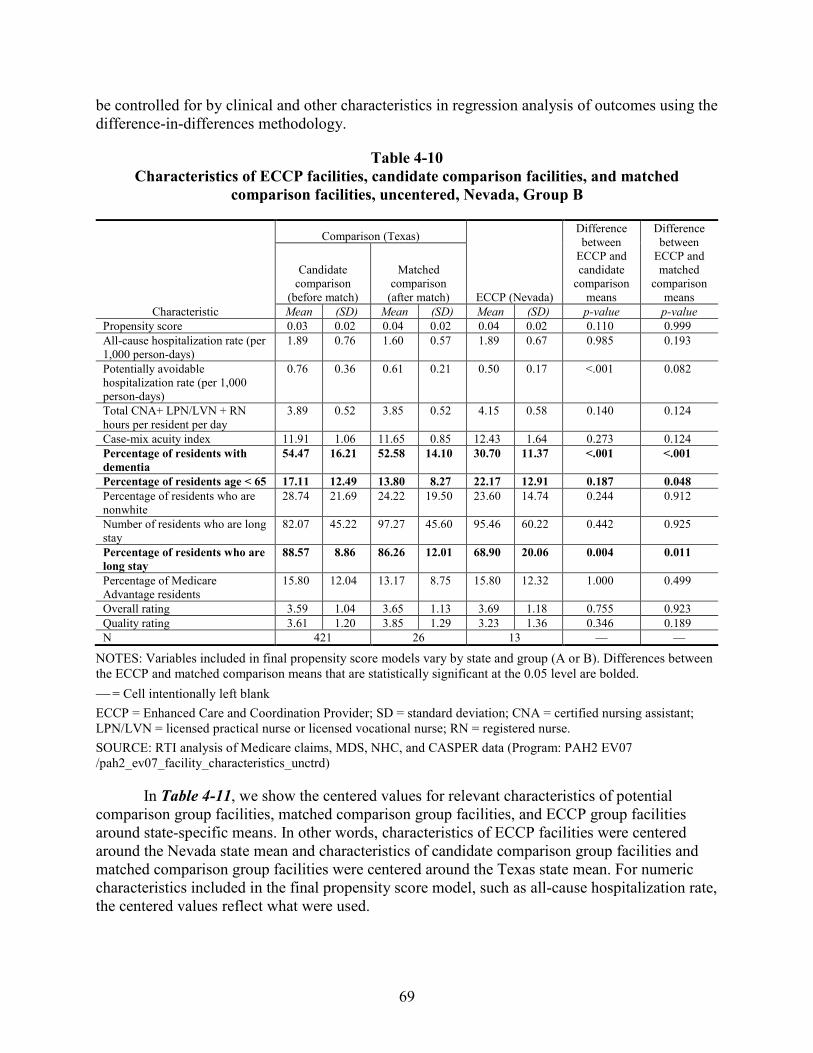
69
be controlled for by clinical and other characteristics in regression analysis of outcomes using the difference-in-differences methodology.
Table 4-10 Characteristics of ECCP facilities, candidate comparison facilities, and matched
comparison facilities, uncentered, Nevada, Group B
Characteristic
Comparison (Texas)
ECCP (Nevada)
Difference between
ECCP and candidate
comparison means
Difference between
ECCP and matched
comparison means
Candidate comparison
(before match)
Matched comparison
(after match)
Mean (SD) Mean (SD) Mean (SD) p-value p-value Propensity score 0.03 0.02 0.04 0.02 0.04 0.02 0.110 0.999 All-cause hospitalization rate (per 1,000 person-days)
1.89 0.76 1.60 0.57 1.89 0.67 0.985 0.193
Potentially avoidable hospitalization rate (per 1,000 person-days)
0.76 0.36 0.61 0.21 0.50 0.17 <.001 0.082
Total CNA+ LPN/LVN + RN hours per resident per day
3.89 0.52 3.85 0.52 4.15 0.58 0.140 0.124
Case-mix acuity index 11.91 1.06 11.65 0.85 12.43 1.64 0.273 0.124 Percentage of residents with dementia
54.47 16.21 52.58 14.10 30.70 11.37 <.001 <.001
Percentage of residents age < 65 17.11 12.49 13.80 8.27 22.17 12.91 0.187 0.048 Percentage of residents who are nonwhite
28.74 21.69 24.22 19.50 23.60 14.74 0.244 0.912
Number of residents who are long stay
82.07 45.22 97.27 45.60 95.46 60.22 0.442 0.925
Percentage of residents who are long stay
88.57 8.86 86.26 12.01 68.90 20.06 0.004 0.011
Percentage of Medicare Advantage residents
15.80 12.04 13.17 8.75 15.80 12.32 1.000 0.499
Overall rating 3.59 1.04 3.65 1.13 3.69 1.18 0.755 0.923 Quality rating 3.61 1.20 3.85 1.29 3.23 1.36 0.346 0.189 N 421 26 13 — —
NOTES: Variables included in final propensity score models vary by state and group (A or B). Differences between the ECCP and matched comparison means that are statistically significant at the 0.05 level are bolded. = Cell intentionally left blank ECCP = Enhanced Care and Coordination Provider; SD = standard deviation; CNA = certified nursing assistant; LPN/LVN = licensed practical nurse or licensed vocational nurse; RN = registered nurse. SOURCE: RTI analysis of Medicare claims, MDS, NHC, and CASPER data (Program: PAH2 EV07 /pah2_ev07_facility_characteristics_unctrd)
In Table 4-11, we show the centered values for relevant characteristics of potential comparison group facilities, matched comparison group facilities, and ECCP group facilities around state-specific means. In other words, characteristics of ECCP facilities were centered around the Nevada state mean and characteristics of candidate comparison group facilities and matched comparison group facilities were centered around the Texas state mean. For numeric characteristics included in the final propensity score model, such as all-cause hospitalization rate, the centered values reflect what were used.
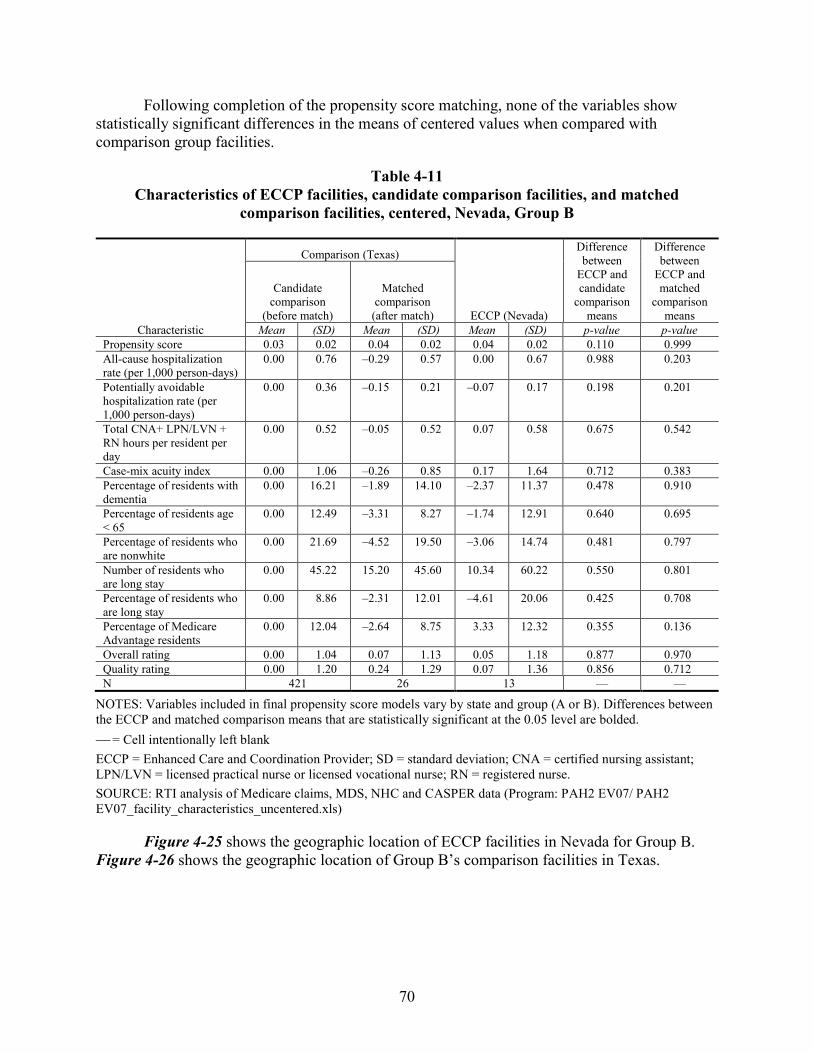
70
Following completion of the propensity score matching, none of the variables show statistically significant differences in the means of centered values when compared with comparison group facilities.
Table 4-11 Characteristics of ECCP facilities, candidate comparison facilities, and matched
comparison facilities, centered, Nevada, Group B
Characteristic
Comparison (Texas)
ECCP (Nevada)
Difference between
ECCP and candidate
comparison means
Difference between
ECCP and matched
comparison means
Candidate comparison
(before match)
Matched comparison
(after match)
Mean (SD) Mean (SD) Mean (SD) p-value p-value Propensity score 0.03 0.02 0.04 0.02 0.04 0.02 0.110 0.999 All-cause hospitalization rate (per 1,000 person-days)
0.00 0.76 –0.29 0.57 0.00 0.67 0.988 0.203
Potentially avoidable hospitalization rate (per 1,000 person-days)
0.00 0.36 –0.15 0.21 –0.07 0.17 0.198 0.201
Total CNA+ LPN/LVN + RN hours per resident per day
0.00 0.52 –0.05 0.52 0.07 0.58 0.675 0.542
Case-mix acuity index 0.00 1.06 –0.26 0.85 0.17 1.64 0.712 0.383 Percentage of residents with dementia
0.00 16.21 –1.89 14.10 –2.37 11.37 0.478 0.910
Percentage of residents age < 65
0.00 12.49 –3.31 8.27 –1.74 12.91 0.640 0.695
Percentage of residents who are nonwhite
0.00 21.69 –4.52 19.50 –3.06 14.74 0.481 0.797
Number of residents who are long stay
0.00 45.22 15.20 45.60 10.34 60.22 0.550 0.801
Percentage of residents who are long stay
0.00 8.86 –2.31 12.01 –4.61 20.06 0.425 0.708
Percentage of Medicare Advantage residents
0.00 12.04 –2.64 8.75 3.33 12.32 0.355 0.136
Overall rating 0.00 1.04 0.07 1.13 0.05 1.18 0.877 0.970 Quality rating 0.00 1.20 0.24 1.29 0.07 1.36 0.856 0.712 N 421 26 13 — —
NOTES: Variables included in final propensity score models vary by state and group (A or B). Differences between the ECCP and matched comparison means that are statistically significant at the 0.05 level are bolded. = Cell intentionally left blank ECCP = Enhanced Care and Coordination Provider; SD = standard deviation; CNA = certified nursing assistant; LPN/LVN = licensed practical nurse or licensed vocational nurse; RN = registered nurse. SOURCE: RTI analysis of Medicare claims, MDS, NHC and CASPER data (Program: PAH2 EV07/ PAH2 EV07_facility_characteristics_uncentered.xls)
Figure 4-25 shows the geographic location of ECCP facilities in Nevada for Group B. Figure 4-26 shows the geographic location of Group B’s comparison facilities in Texas.
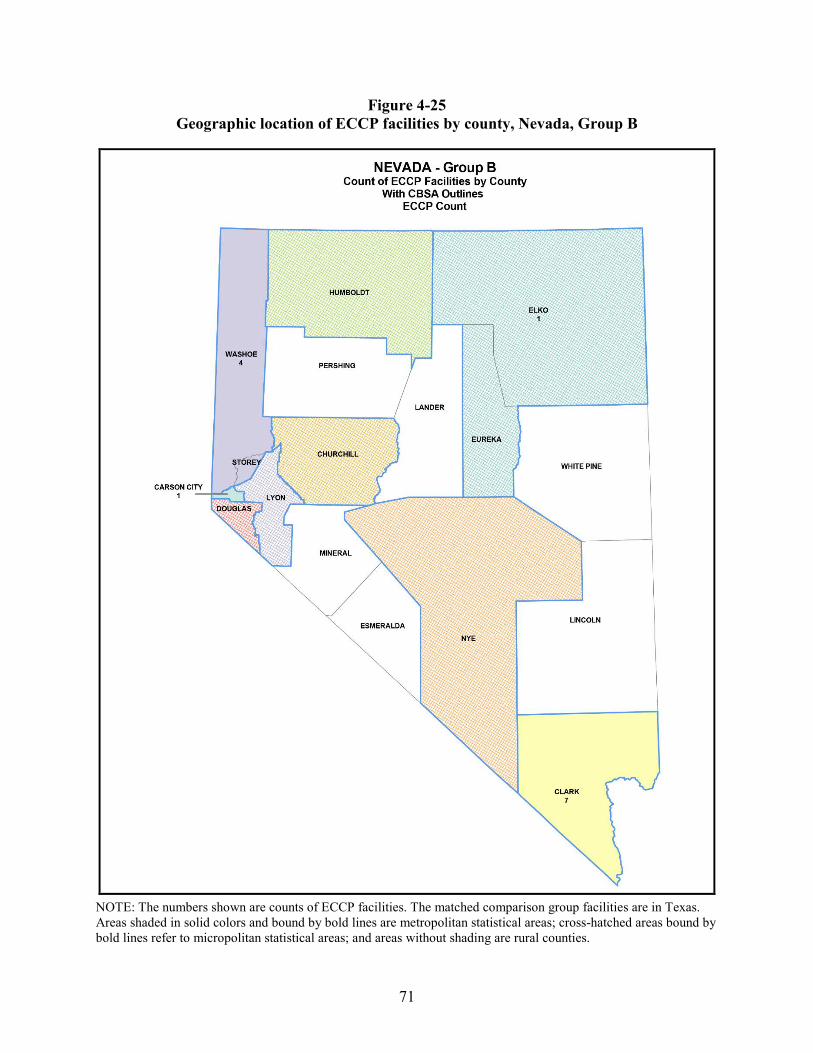
71
Figure 4-25 Geographic location of ECCP facilities by county, Nevada, Group B
NOTE: The numbers shown are counts of ECCP facilities. The matched comparison group facilities are in Texas. Areas shaded in solid colors and bound by bold lines are metropolitan statistical areas; cross-hatched areas bound by bold lines refer to micropolitan statistical areas; and areas without shading are rural counties.
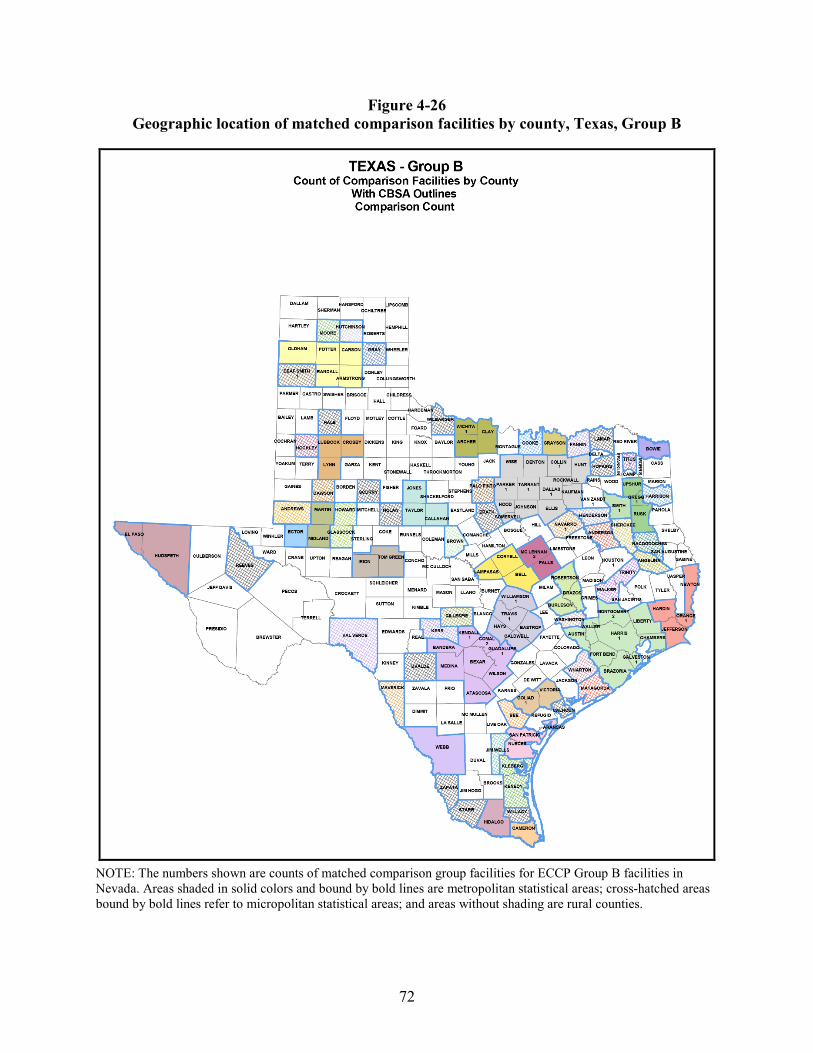
72
Figure 4-26 Geographic location of matched comparison facilities by county, Texas, Group B
NOTE: The numbers shown are counts of matched comparison group facilities for ECCP Group B facilities in Nevada. Areas shaded in solid colors and bound by bold lines are metropolitan statistical areas; cross-hatched areas bound by bold lines refer to micropolitan statistical areas; and areas without shading are rural counties.
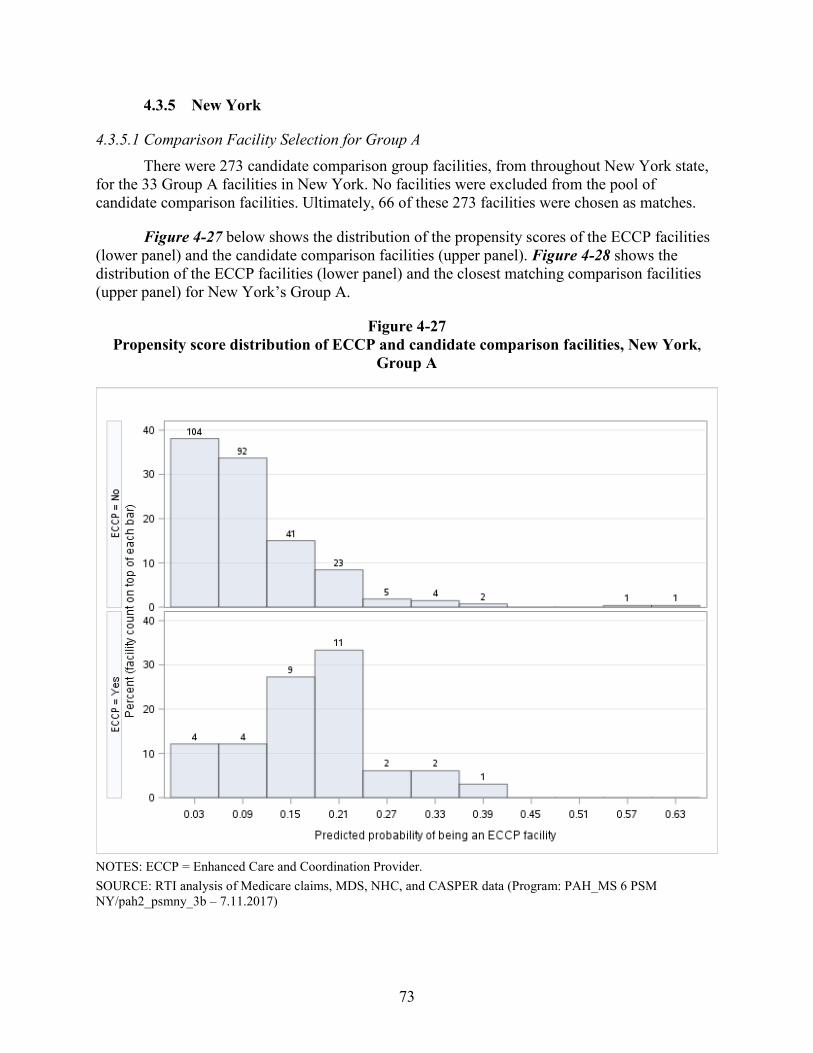
73
4.3.5 New York
4.3.5.1 Comparison Facility Selection for Group A There were 273 candidate comparison group facilities, from throughout New York state,
for the 33 Group A facilities in New York. No facilities were excluded from the pool of candidate comparison facilities. Ultimately, 66 of these 273 facilities were chosen as matches.
Figure 4-27 below shows the distribution of the propensity scores of the ECCP facilities (lower panel) and the candidate comparison facilities (upper panel). Figure 4-28 shows the distribution of the ECCP facilities (lower panel) and the closest matching comparison facilities (upper panel) for New York’s Group A.
Figure 4-27 Propensity score distribution of ECCP and candidate comparison facilities, New York,
Group A
NOTES: ECCP = Enhanced Care and Coordination Provider. SOURCE: RTI analysis of Medicare claims, MDS, NHC, and CASPER data (Program: PAH_MS 6 PSM NY/pah2_psmny_3b – 7.11.2017)
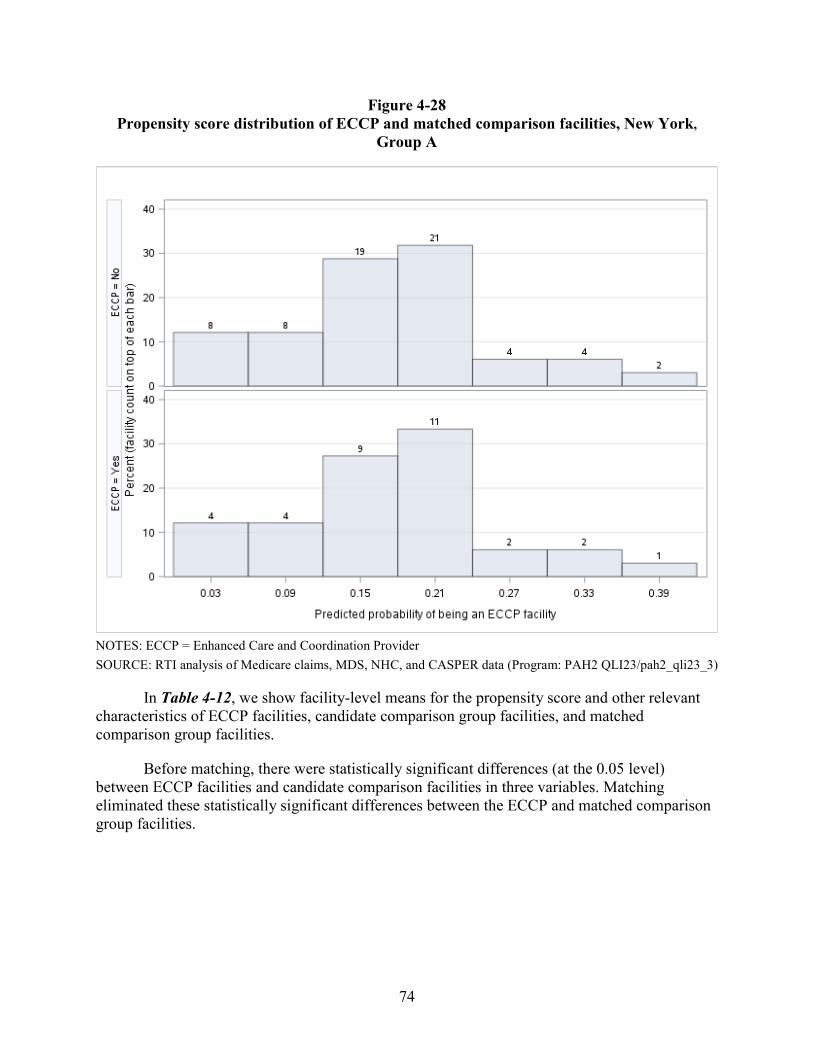
74
Figure 4-28 Propensity score distribution of ECCP and matched comparison facilities, New York,
Group A
NOTES: ECCP = Enhanced Care and Coordination Provider SOURCE: RTI analysis of Medicare claims, MDS, NHC, and CASPER data (Program: PAH2 QLI23/pah2_qli23_3)
In Table 4-12, we show facility-level means for the propensity score and other relevant characteristics of ECCP facilities, candidate comparison group facilities, and matched comparison group facilities.
Before matching, there were statistically significant differences (at the 0.05 level) between ECCP facilities and candidate comparison facilities in three variables. Matching eliminated these statistically significant differences between the ECCP and matched comparison group facilities.

75
Table 4-12 Characteristics of ECCP facilities, candidate comparison facilities, and matched
comparison facilities, New York, Group A
Characteristic
Comparison
ECCP
Difference between
ECCP and candidate
comparison means
Difference between
ECCP and matched
comparison means
Candidate comparison
(before match)
Matched comparison (after
match)
Mean (SD) Mean (SD) Mean (SD) p-value p-value Propensity score 0.10 0.08 0.17 0.09 0.17 0.09 <.001 0.868 All-cause hospitalization rate (per 1,000 person-days)
1.60 0.80 1.25 0.69 1.33 0.58 0.018 0.583
Potentially avoidable hospitalization rate (per 1,000 person-days)
0.50 0.27 0.41 0.24 0.41 0.18 0.021 0.947
Total CNA+ LPN/LVN + RN hours per resident per day
3.87 0.83 4.08 0.76 4.38 0.77 <.001 0.071
Case-mix acuity index 11.93 1.46 11.76 1.03 11.89 1.08 0.818 0.586 Percentage of residents with dementia
50.46 16.88 53.78 13.87 54.18 9.39 0.058 0.865
Percentage of residents age < 65 14.87 16.04 8.64 8.20 12.17 11.21 0.221 0.115 Percentage of residents who are nonwhite
33.28 31.01 20.09 25.60 23.57 29.01 0.079 0.561
Number of residents who are long stay
169.79 102.37 169.52 97.81 172.94 76.45 0.831 0.849
Percentage of residents who are long stay
86.68 9.46 83.39 12.27 84.99 6.53 0.189 0.400
Percentage of Medicare Advantage residents
25.45 19.47 24.50 18.42 23.21 15.21 0.443 0.713
Overall rating 3.77 1.09 3.91 1.06 3.91 1.01 0.473 1.000 Quality rating 3.93 1.21 4.00 1.23 3.85 1.30 0.721 0.580 N 273 66 33 — —
NOTES: Variables included in final propensity score models vary by state and group (A or B). Differences between the ECCP and matched comparison means that are statistically significant at the 0.05 level are bolded. = Cell intentionally left blank Variables included in final propensity score models vary by State and Group (A or B). ECCP = Enhanced Care and Coordination Provider; SD = standard deviation; CNA = certified nursing assistant; LPN/LVN = licensed practical nurse or licensed vocational nurse; RN = registered nurse. SOURCE: RTI analysis of Medicare claims, MDS, NHC, and CASPER data (Program: PAH2 EV07 /pah2_ev07_facility_characteristics_unctrd)
Figure 4-29 shows the geographic location of ECCP and matched comparison group facilities for New York’s Group A. It was not possible to obtain a good match if the facility location within the state was a matching criterion.
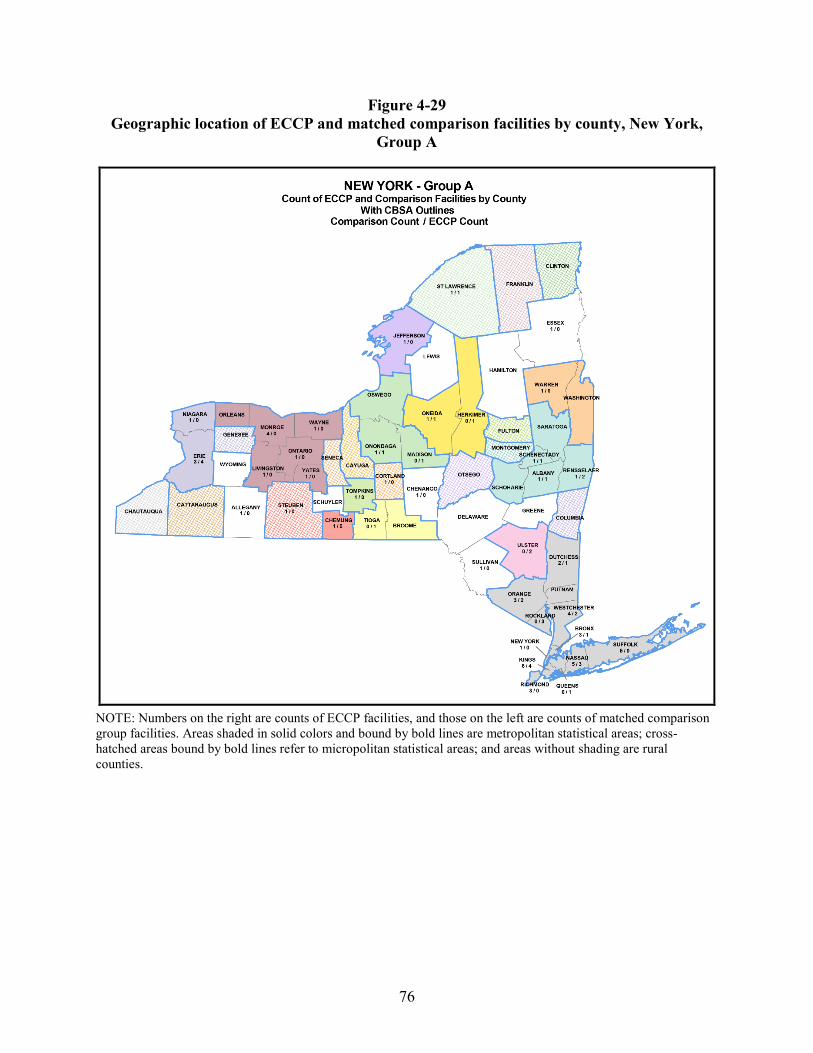
76
Figure 4-29 Geographic location of ECCP and matched comparison facilities by county, New York,
Group A
NOTE: Numbers on the right are counts of ECCP facilities, and those on the left are counts of matched comparison group facilities. Areas shaded in solid colors and bound by bold lines are metropolitan statistical areas; cross-hatched areas bound by bold lines refer to micropolitan statistical areas; and areas without shading are rural counties.
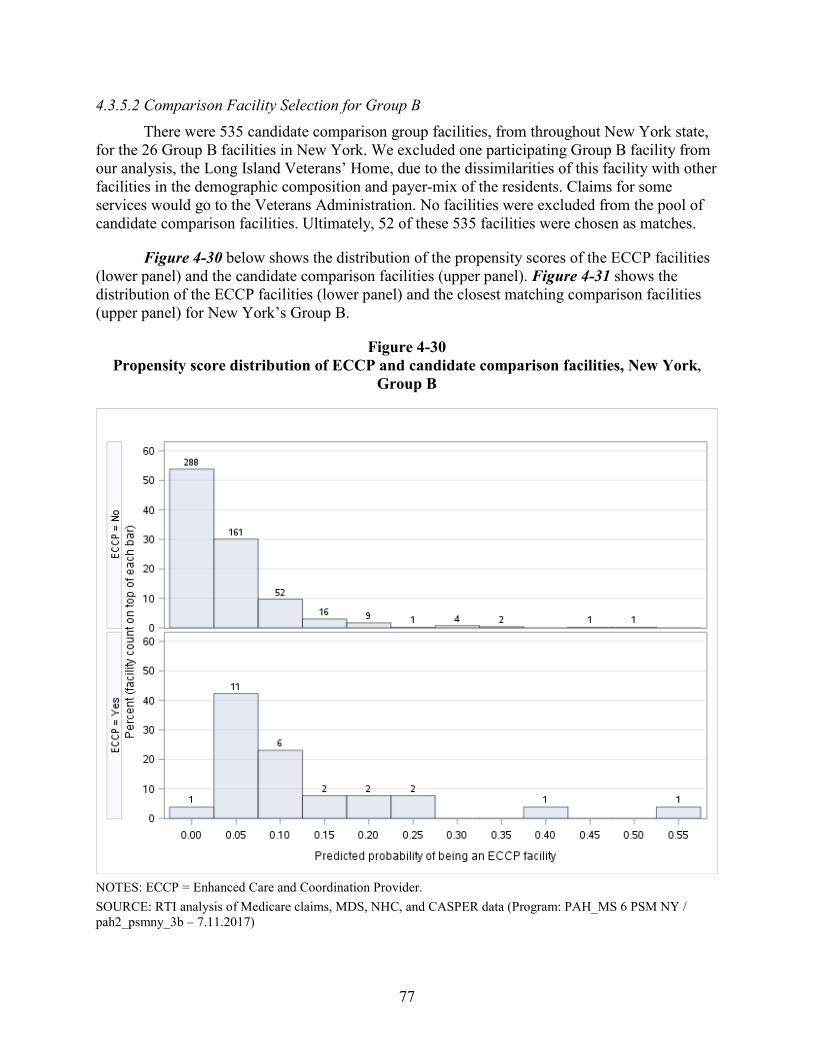
77
4.3.5.2 Comparison Facility Selection for Group B There were 535 candidate comparison group facilities, from throughout New York state,
for the 26 Group B facilities in New York. We excluded one participating Group B facility from our analysis, the Long Island Veterans’ Home, due to the dissimilarities of this facility with other facilities in the demographic composition and payer-mix of the residents. Claims for some services would go to the Veterans Administration. No facilities were excluded from the pool of candidate comparison facilities. Ultimately, 52 of these 535 facilities were chosen as matches.
Figure 4-30 below shows the distribution of the propensity scores of the ECCP facilities (lower panel) and the candidate comparison facilities (upper panel). Figure 4-31 shows the distribution of the ECCP facilities (lower panel) and the closest matching comparison facilities (upper panel) for New York’s Group B.
Figure 4-30 Propensity score distribution of ECCP and candidate comparison facilities, New York,
Group B
NOTES: ECCP = Enhanced Care and Coordination Provider. SOURCE: RTI analysis of Medicare claims, MDS, NHC, and CASPER data (Program: PAH_MS 6 PSM NY / pah2_psmny_3b – 7.11.2017)
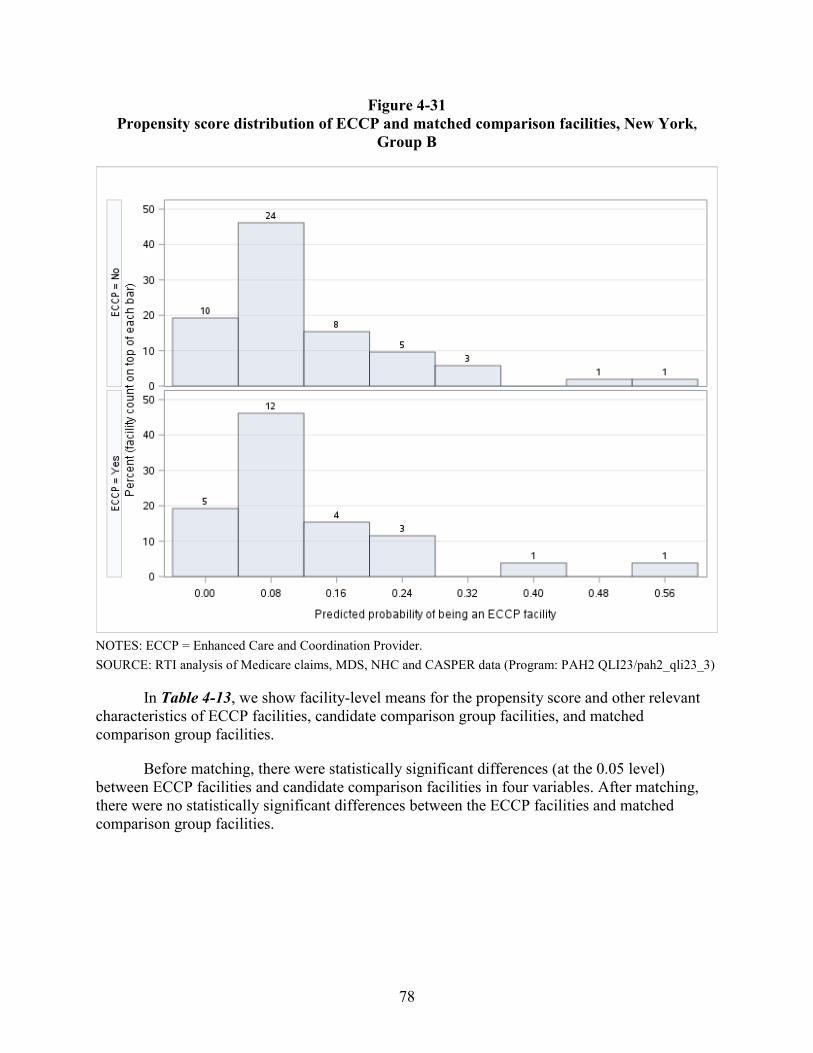
78
Figure 4-31 Propensity score distribution of ECCP and matched comparison facilities, New York,
Group B
NOTES: ECCP = Enhanced Care and Coordination Provider. SOURCE: RTI analysis of Medicare claims, MDS, NHC and CASPER data (Program: PAH2 QLI23/pah2_qli23_3)
In Table 4-13, we show facility-level means for the propensity score and other relevant characteristics of ECCP facilities, candidate comparison group facilities, and matched comparison group facilities.
Before matching, there were statistically significant differences (at the 0.05 level) between ECCP facilities and candidate comparison facilities in four variables. After matching, there were no statistically significant differences between the ECCP facilities and matched comparison group facilities.
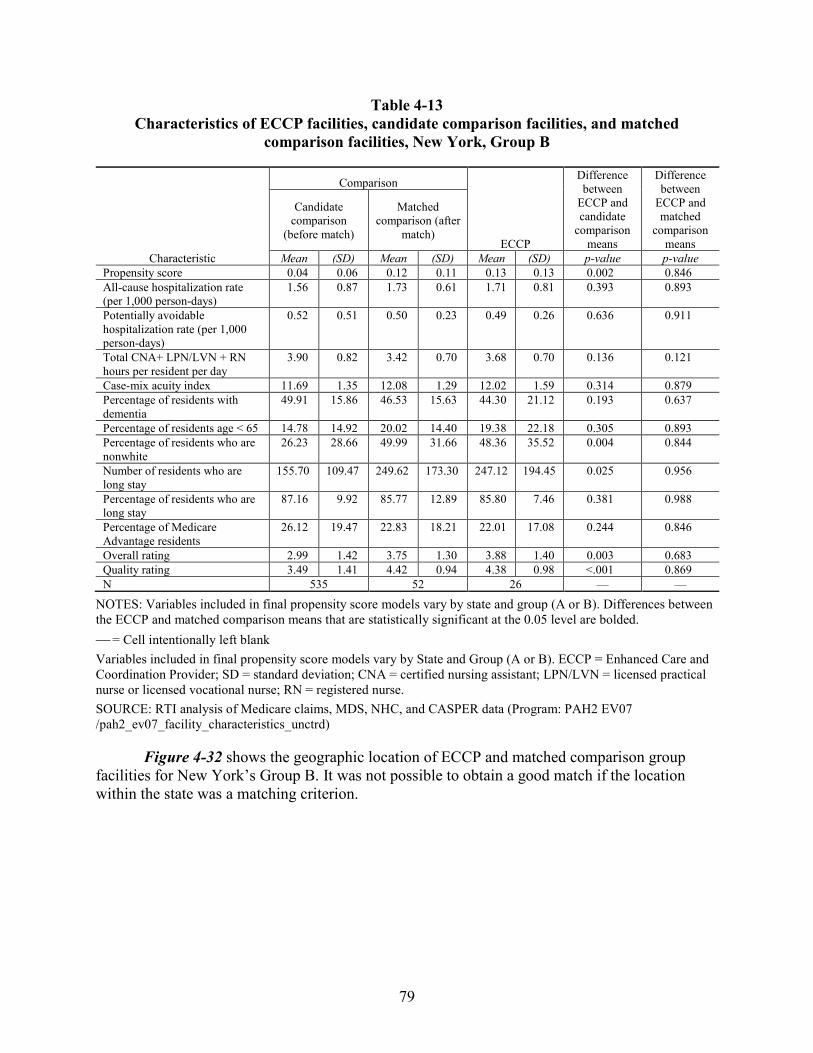
79
Table 4-13 Characteristics of ECCP facilities, candidate comparison facilities, and matched
comparison facilities, New York, Group B
Characteristic
Comparison
ECCP
Difference between
ECCP and candidate
comparison means
Difference between
ECCP and matched
comparison means
Candidate comparison
(before match)
Matched comparison (after
match)
Mean (SD) Mean (SD) Mean (SD) p-value p-valuePropensity score 0.04 0.06 0.12 0.11 0.13 0.13 0.002 0.846 All-cause hospitalization rate (per 1,000 person-days)
1.56 0.87 1.73 0.61 1.71 0.81 0.393 0.893
Potentially avoidable hospitalization rate (per 1,000 person-days)
0.52 0.51 0.50 0.23 0.49 0.26 0.636 0.911
Total CNA+ LPN/LVN + RN hours per resident per day
3.90 0.82 3.42 0.70 3.68 0.70 0.136 0.121
Case-mix acuity index 11.69 1.35 12.08 1.29 12.02 1.59 0.314 0.879 Percentage of residents with dementia
49.91 15.86 46.53 15.63 44.30 21.12 0.193 0.637
Percentage of residents age < 65 14.78 14.92 20.02 14.40 19.38 22.18 0.305 0.893 Percentage of residents who are nonwhite
26.23 28.66 49.99 31.66 48.36 35.52 0.004 0.844
Number of residents who are long stay
155.70 109.47 249.62 173.30 247.12 194.45 0.025 0.956
Percentage of residents who are long stay
87.16 9.92 85.77 12.89 85.80 7.46 0.381 0.988
Percentage of Medicare Advantage residents
26.12 19.47 22.83 18.21 22.01 17.08 0.244 0.846
Overall rating 2.99 1.42 3.75 1.30 3.88 1.40 0.003 0.683 Quality rating 3.49 1.41 4.42 0.94 4.38 0.98 <.001 0.869 N 535 52 26 — —
NOTES: Variables included in final propensity score models vary by state and group (A or B). Differences between the ECCP and matched comparison means that are statistically significant at the 0.05 level are bolded. = Cell intentionally left blank Variables included in final propensity score models vary by State and Group (A or B). ECCP = Enhanced Care and Coordination Provider; SD = standard deviation; CNA = certified nursing assistant; LPN/LVN = licensed practical nurse or licensed vocational nurse; RN = registered nurse. SOURCE: RTI analysis of Medicare claims, MDS, NHC, and CASPER data (Program: PAH2 EV07 /pah2_ev07_facility_characteristics_unctrd)
Figure 4-32 shows the geographic location of ECCP and matched comparison group facilities for New York’s Group B. It was not possible to obtain a good match if the location within the state was a matching criterion.
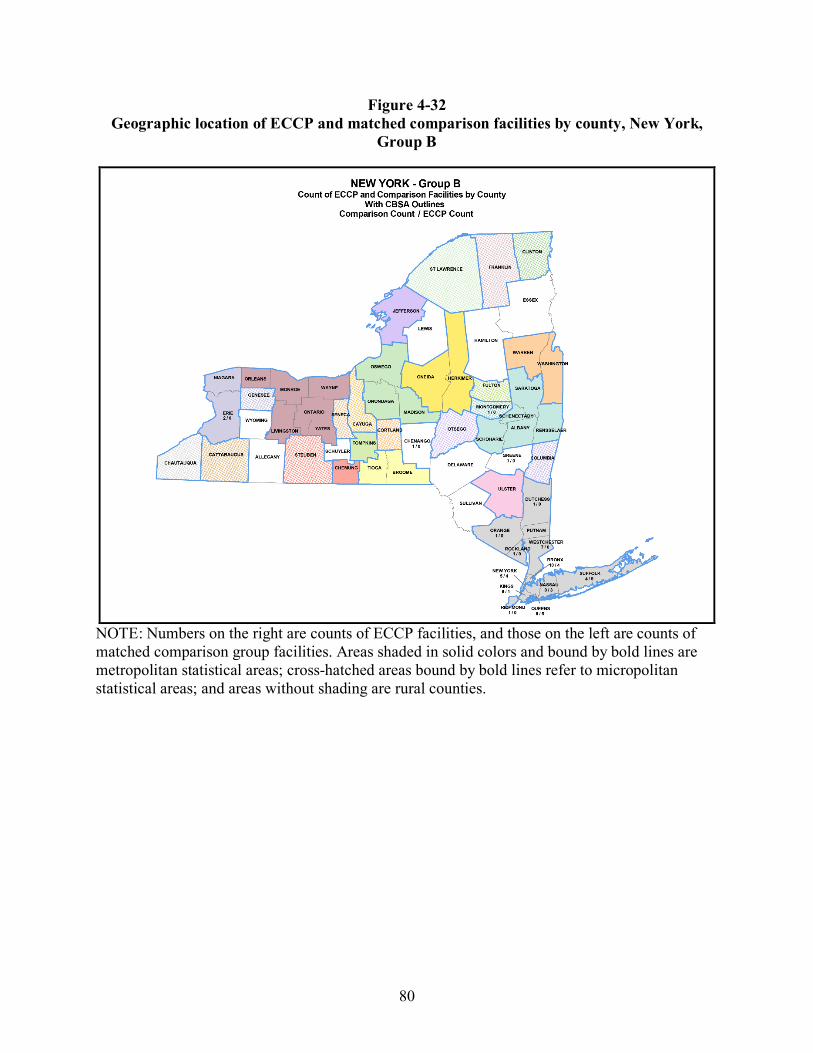
80
Figure 4-32 Geographic location of ECCP and matched comparison facilities by county, New York,
Group B
NOTE: Numbers on the right are counts of ECCP facilities, and those on the left are counts of matched comparison group facilities. Areas shaded in solid colors and bound by bold lines are metropolitan statistical areas; cross-hatched areas bound by bold lines refer to micropolitan statistical areas; and areas without shading are rural counties.
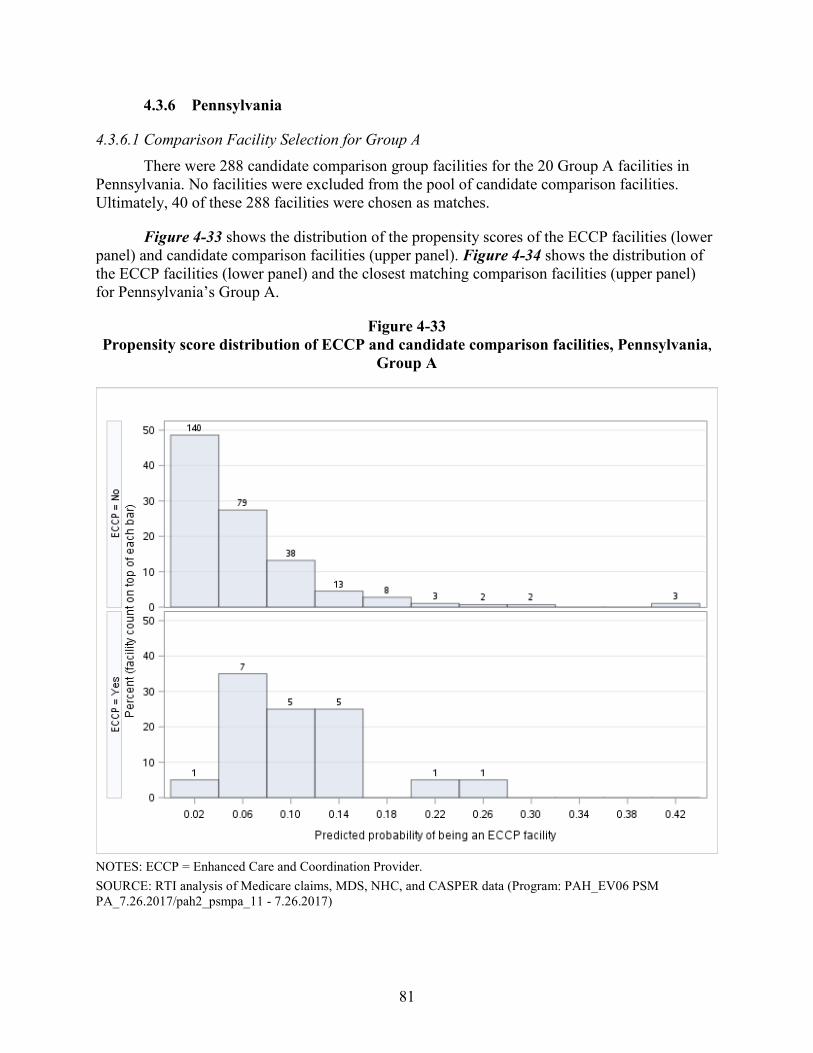
81
4.3.6 Pennsylvania
4.3.6.1 Comparison Facility Selection for Group A There were 288 candidate comparison group facilities for the 20 Group A facilities in
Pennsylvania. No facilities were excluded from the pool of candidate comparison facilities. Ultimately, 40 of these 288 facilities were chosen as matches.
Figure 4-33 shows the distribution of the propensity scores of the ECCP facilities (lower panel) and candidate comparison facilities (upper panel). Figure 4-34 shows the distribution of the ECCP facilities (lower panel) and the closest matching comparison facilities (upper panel) for Pennsylvania’s Group A.
Figure 4-33 Propensity score distribution of ECCP and candidate comparison facilities, Pennsylvania,
Group A
NOTES: ECCP = Enhanced Care and Coordination Provider. SOURCE: RTI analysis of Medicare claims, MDS, NHC, and CASPER data (Program: PAH_EV06 PSM PA_7.26.2017/pah2_psmpa_11 - 7.26.2017)
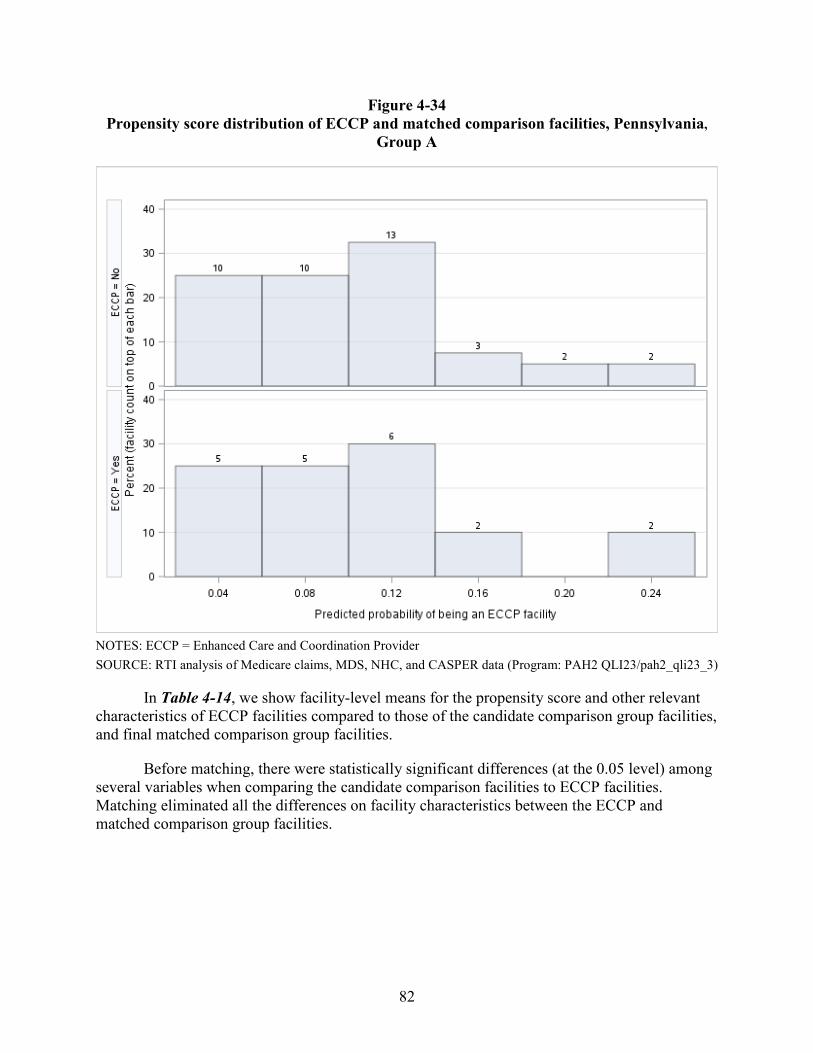
82
Figure 4-34 Propensity score distribution of ECCP and matched comparison facilities, Pennsylvania,
Group A
NOTES: ECCP = Enhanced Care and Coordination Provider SOURCE: RTI analysis of Medicare claims, MDS, NHC, and CASPER data (Program: PAH2 QLI23/pah2_qli23_3)
In Table 4-14, we show facility-level means for the propensity score and other relevant characteristics of ECCP facilities compared to those of the candidate comparison group facilities, and final matched comparison group facilities.
Before matching, there were statistically significant differences (at the 0.05 level) among several variables when comparing the candidate comparison facilities to ECCP facilities. Matching eliminated all the differences on facility characteristics between the ECCP and matched comparison group facilities.
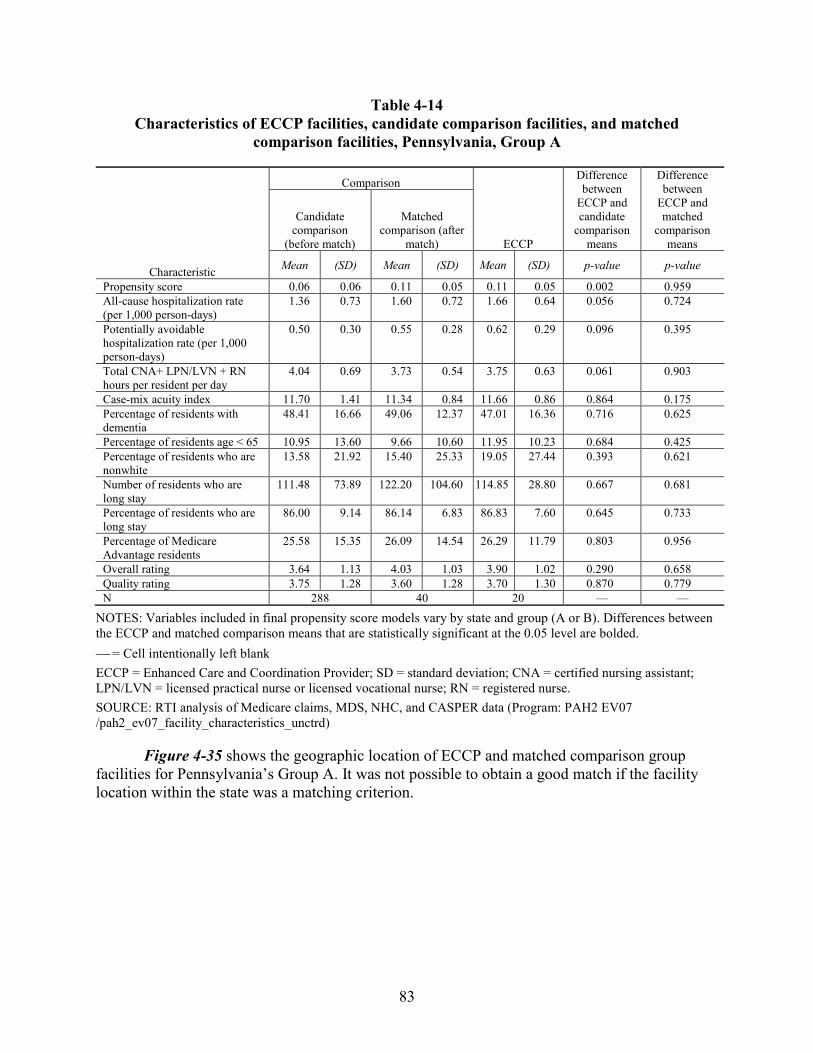
83
Table 4-14 Characteristics of ECCP facilities, candidate comparison facilities, and matched
comparison facilities, Pennsylvania, Group A
Characteristic
Comparison
ECCP
Difference between
ECCP and candidate
comparison means
Difference between
ECCP and matched
comparison means
Candidate comparison
(before match)
Matched comparison (after
match)
Mean (SD) Mean (SD) Mean (SD) p-value p-value
Propensity score 0.06 0.06 0.11 0.05 0.11 0.05 0.002 0.959 All-cause hospitalization rate (per 1,000 person-days)
1.36 0.73 1.60 0.72 1.66 0.64 0.056 0.724
Potentially avoidable hospitalization rate (per 1,000 person-days)
0.50 0.30 0.55 0.28 0.62 0.29 0.096 0.395
Total CNA+ LPN/LVN + RN hours per resident per day
4.04 0.69 3.73 0.54 3.75 0.63 0.061 0.903
Case-mix acuity index 11.70 1.41 11.34 0.84 11.66 0.86 0.864 0.175 Percentage of residents with dementia
48.41 16.66 49.06 12.37 47.01 16.36 0.716 0.625
Percentage of residents age < 65 10.95 13.60 9.66 10.60 11.95 10.23 0.684 0.425 Percentage of residents who are nonwhite
13.58 21.92 15.40 25.33 19.05 27.44 0.393 0.621
Number of residents who are long stay
111.48 73.89 122.20 104.60 114.85 28.80 0.667 0.681
Percentage of residents who are long stay
86.00 9.14 86.14 6.83 86.83 7.60 0.645 0.733
Percentage of Medicare Advantage residents
25.58 15.35 26.09 14.54 26.29 11.79 0.803 0.956
Overall rating 3.64 1.13 4.03 1.03 3.90 1.02 0.290 0.658 Quality rating 3.75 1.28 3.60 1.28 3.70 1.30 0.870 0.779 N 288 40 20 — —
NOTES: Variables included in final propensity score models vary by state and group (A or B). Differences between the ECCP and matched comparison means that are statistically significant at the 0.05 level are bolded. = Cell intentionally left blank ECCP = Enhanced Care and Coordination Provider; SD = standard deviation; CNA = certified nursing assistant; LPN/LVN = licensed practical nurse or licensed vocational nurse; RN = registered nurse. SOURCE: RTI analysis of Medicare claims, MDS, NHC, and CASPER data (Program: PAH2 EV07 /pah2_ev07_facility_characteristics_unctrd)
Figure 4-35 shows the geographic location of ECCP and matched comparison group facilities for Pennsylvania’s Group A. It was not possible to obtain a good match if the facility location within the state was a matching criterion.
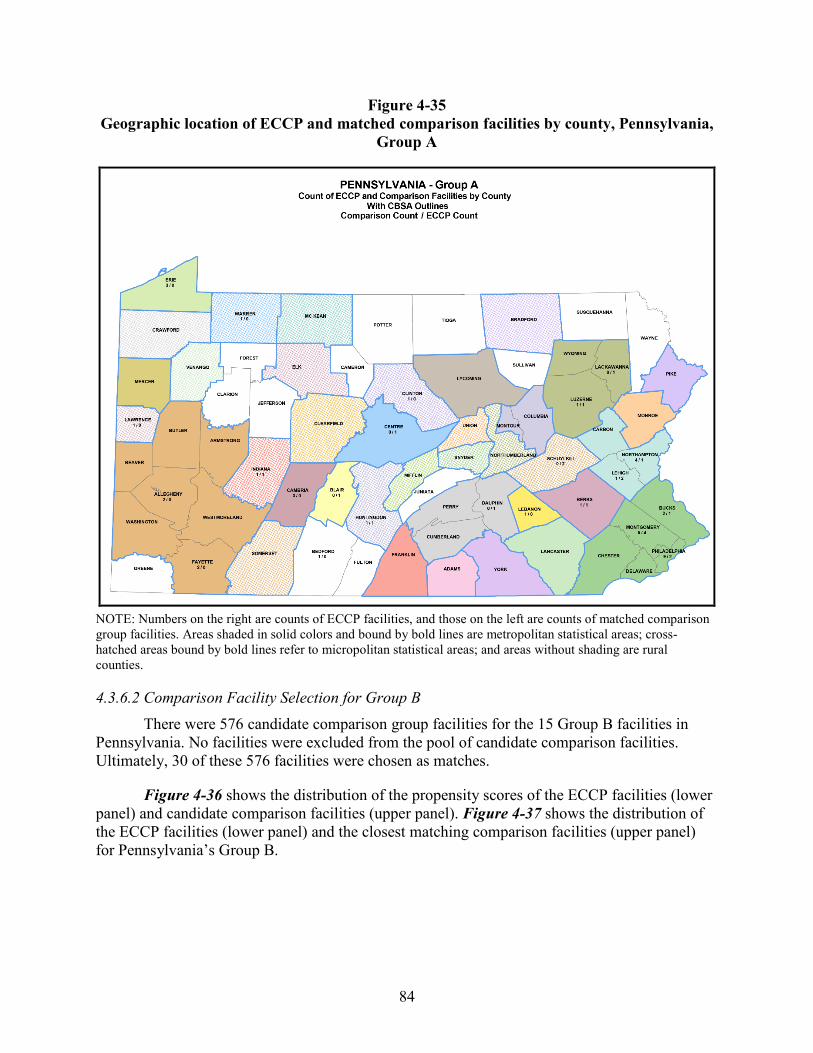
84
Figure 4-35 Geographic location of ECCP and matched comparison facilities by county, Pennsylvania,
Group A
NOTE: Numbers on the right are counts of ECCP facilities, and those on the left are counts of matched comparison group facilities. Areas shaded in solid colors and bound by bold lines are metropolitan statistical areas; cross-hatched areas bound by bold lines refer to micropolitan statistical areas; and areas without shading are rural counties.
4.3.6.2 Comparison Facility Selection for Group B There were 576 candidate comparison group facilities for the 15 Group B facilities in
Pennsylvania. No facilities were excluded from the pool of candidate comparison facilities. Ultimately, 30 of these 576 facilities were chosen as matches.
Figure 4-36 shows the distribution of the propensity scores of the ECCP facilities (lower panel) and candidate comparison facilities (upper panel). Figure 4-37 shows the distribution of the ECCP facilities (lower panel) and the closest matching comparison facilities (upper panel) for Pennsylvania’s Group B.
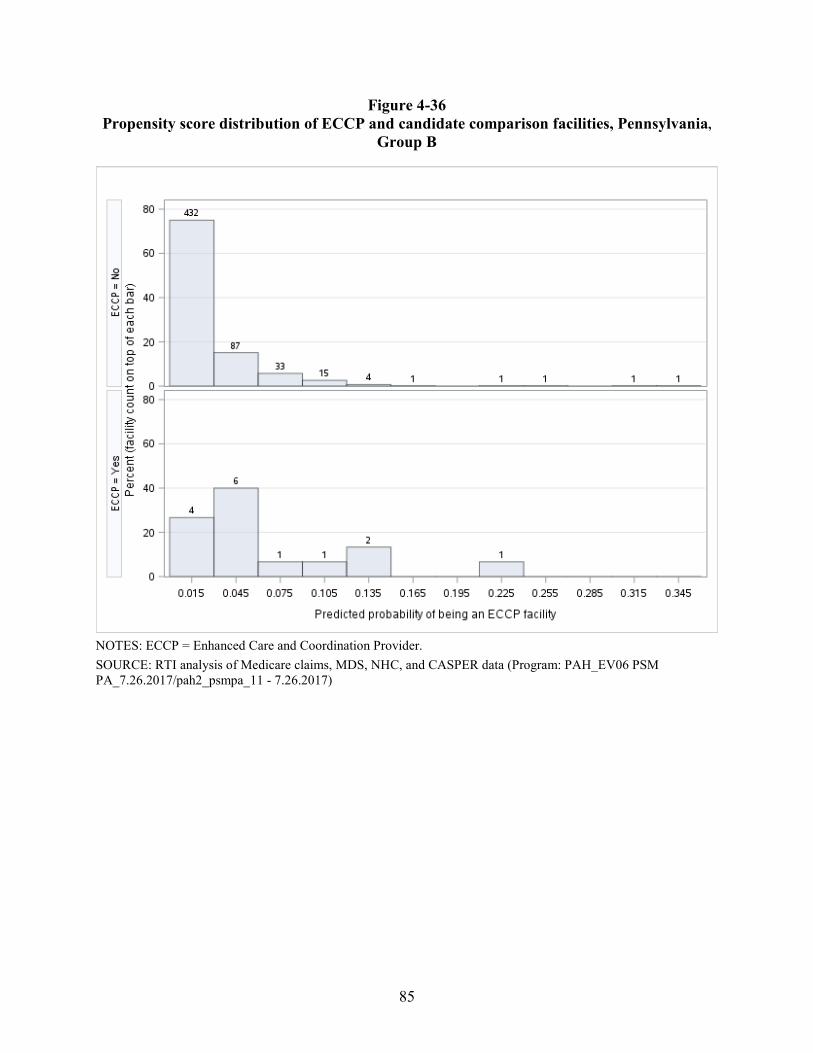
85
Figure 4-36 Propensity score distribution of ECCP and candidate comparison facilities, Pennsylvania,
Group B
NOTES: ECCP = Enhanced Care and Coordination Provider. SOURCE: RTI analysis of Medicare claims, MDS, NHC, and CASPER data (Program: PAH_EV06 PSM PA_7.26.2017/pah2_psmpa_11 - 7.26.2017)
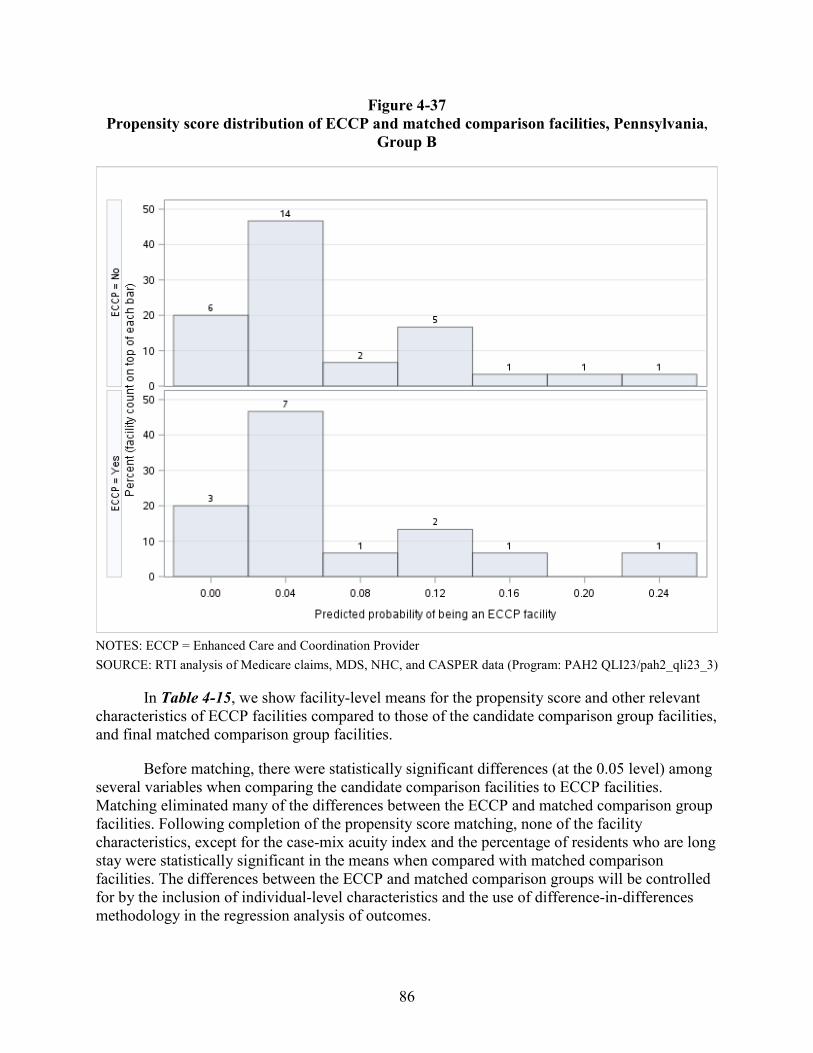
86
Figure 4-37 Propensity score distribution of ECCP and matched comparison facilities, Pennsylvania,
Group B
NOTES: ECCP = Enhanced Care and Coordination Provider SOURCE: RTI analysis of Medicare claims, MDS, NHC, and CASPER data (Program: PAH2 QLI23/pah2_qli23_3)
In Table 4-15, we show facility-level means for the propensity score and other relevant characteristics of ECCP facilities compared to those of the candidate comparison group facilities, and final matched comparison group facilities.
Before matching, there were statistically significant differences (at the 0.05 level) among several variables when comparing the candidate comparison facilities to ECCP facilities. Matching eliminated many of the differences between the ECCP and matched comparison group facilities. Following completion of the propensity score matching, none of the facility characteristics, except for the case-mix acuity index and the percentage of residents who are long stay were statistically significant in the means when compared with matched comparison facilities. The differences between the ECCP and matched comparison groups will be controlled for by the inclusion of individual-level characteristics and the use of difference-in-differences methodology in the regression analysis of outcomes.
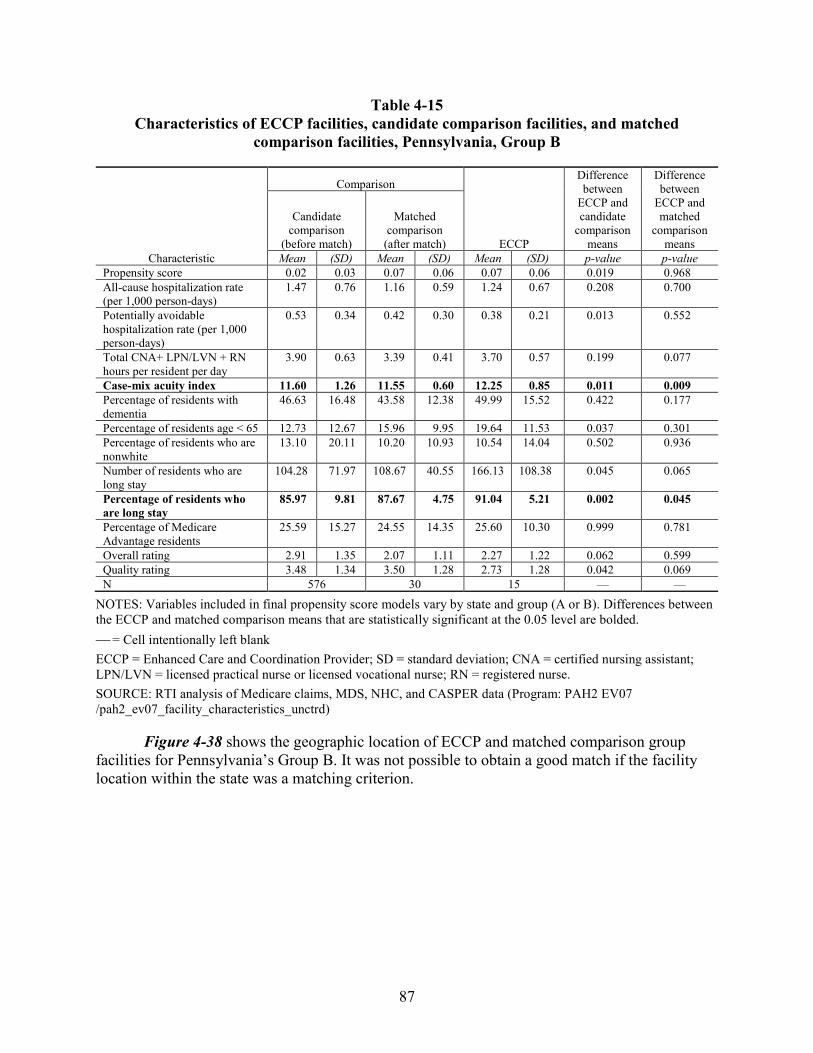
87
Table 4-15 Characteristics of ECCP facilities, candidate comparison facilities, and matched
comparison facilities, Pennsylvania, Group B
Characteristic
Comparison
ECCP
Difference between
ECCP and candidate
comparison means
Difference between
ECCP and matched
comparison means
Candidate comparison
(before match)
Matched comparison
(after match)
Mean (SD) Mean (SD) Mean (SD) p-value p-value Propensity score 0.02 0.03 0.07 0.06 0.07 0.06 0.019 0.968 All-cause hospitalization rate (per 1,000 person-days)
1.47 0.76 1.16 0.59 1.24 0.67 0.208 0.700
Potentially avoidable hospitalization rate (per 1,000 person-days)
0.53 0.34 0.42 0.30 0.38 0.21 0.013 0.552
Total CNA+ LPN/LVN + RN hours per resident per day
3.90 0.63 3.39 0.41 3.70 0.57 0.199 0.077
Case-mix acuity index 11.60 1.26 11.55 0.60 12.25 0.85 0.011 0.009 Percentage of residents with dementia
46.63 16.48 43.58 12.38 49.99 15.52 0.422 0.177
Percentage of residents age < 65 12.73 12.67 15.96 9.95 19.64 11.53 0.037 0.301 Percentage of residents who are nonwhite
13.10 20.11 10.20 10.93 10.54 14.04 0.502 0.936
Number of residents who are long stay
104.28 71.97 108.67 40.55 166.13 108.38 0.045 0.065
Percentage of residents who are long stay
85.97 9.81 87.67 4.75 91.04 5.21 0.002 0.045
Percentage of Medicare Advantage residents
25.59 15.27 24.55 14.35 25.60 10.30 0.999 0.781
Overall rating 2.91 1.35 2.07 1.11 2.27 1.22 0.062 0.599 Quality rating 3.48 1.34 3.50 1.28 2.73 1.28 0.042 0.069 N 576 30 15 — —
NOTES: Variables included in final propensity score models vary by state and group (A or B). Differences between the ECCP and matched comparison means that are statistically significant at the 0.05 level are bolded. = Cell intentionally left blank ECCP = Enhanced Care and Coordination Provider; SD = standard deviation; CNA = certified nursing assistant; LPN/LVN = licensed practical nurse or licensed vocational nurse; RN = registered nurse. SOURCE: RTI analysis of Medicare claims, MDS, NHC, and CASPER data (Program: PAH2 EV07 /pah2_ev07_facility_characteristics_unctrd)
Figure 4-38 shows the geographic location of ECCP and matched comparison group facilities for Pennsylvania’s Group B. It was not possible to obtain a good match if the facility location within the state was a matching criterion.
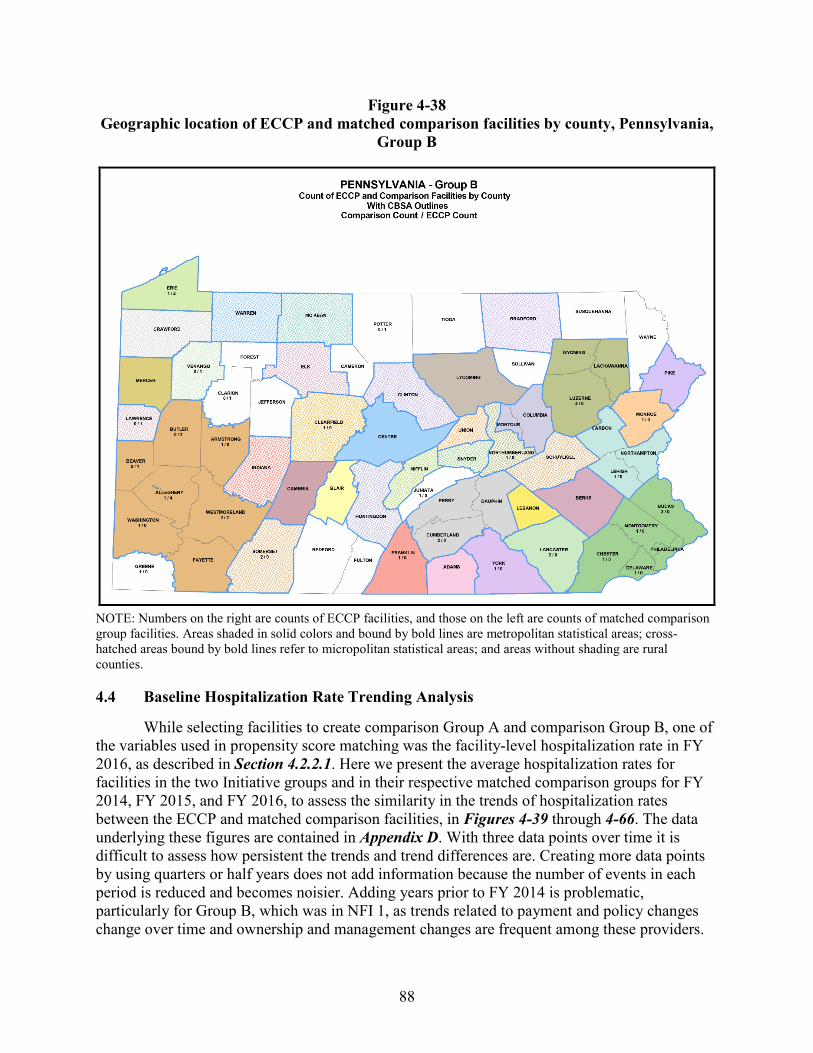
88
Figure 4-38 Geographic location of ECCP and matched comparison facilities by county, Pennsylvania,
Group B
NOTE: Numbers on the right are counts of ECCP facilities, and those on the left are counts of matched comparison group facilities. Areas shaded in solid colors and bound by bold lines are metropolitan statistical areas; cross-hatched areas bound by bold lines refer to micropolitan statistical areas; and areas without shading are rural counties.
4.4 Baseline Hospitalization Rate Trending Analysis
While selecting facilities to create comparison Group A and comparison Group B, one of the variables used in propensity score matching was the facility-level hospitalization rate in FY 2016, as described in Section 4.2.2.1. Here we present the average hospitalization rates for facilities in the two Initiative groups and in their respective matched comparison groups for FY 2014, FY 2015, and FY 2016, to assess the similarity in the trends of hospitalization rates between the ECCP and matched comparison facilities, in Figures 4-39 through 4-66. The data underlying these figures are contained in Appendix D. With three data points over time it is difficult to assess how persistent the trends and trend differences are. Creating more data points by using quarters or half years does not add information because the number of events in each period is reduced and becomes noisier. Adding years prior to FY 2014 is problematic, particularly for Group B, which was in NFI 1, as trends related to payment and policy changes change over time and ownership and management changes are frequent among these providers.
89
Our difference-in-differences model of outcomes will account for fixed differences in hospitalization rates between the ECCP and comparison groups. However, our model must assume that absent any intervention, if the hospitalization rates of the ECCP and comparison groups change, they will change by the same amount. If the hospitalization rates are changing more quickly or more slowly in the ECCP group relative to the comparison group, this will impair our ability to accurately determine the effect of the intervention. Thus, examining the hospitalization rate trends will enable us to assess the reasonableness of our model’s assumption.
As shown in Figure 4-39 for Group A in all states combined, the rates of all-cause hospitalization for the ECCP and comparison groups were close and followed a similar trend, with the ECCP group’s rate dropping slightly more between 2015 and 2016 than the comparison group’s rate. A similar pattern held for potentially avoidable hospitalizations (Figure 4-40). For Group B with all states combined, the rate of all-cause hospitalization in the comparison group started above the rate for the ECCP group and then dropped between 2015 and 2016, falling below the rate of the ECCP group (Figure 4-41). For potentially avoidable hospitalizations, rates for the two groups declined gradually between 2014 and 2015. However, between 2015 and 2016 the rate in the comparison group continued to gradually decline, while the rate in the ECCP group increased slightly (Figure 4-42). Overall, all these differences, both cross-sectional and over time (change in rate), were relatively small.
Looking at each ECCP separately, in most cases there is reasonably good agreement between the trends in the ECCP group and comparison group, in both Group A and Group B, for both all-cause and potentially avoidable hospitalization rates. We highlight a few examples where there are moderate differences. In Alabama Group A, there is a more pronounced downward trend in rates of both all-cause hospitalizations (Figure 4-43) and potentially avoidable hospitalizations (Figure 4-44) in the ECCP group than in the comparison group. In Missouri Group A (Figure 4-51) and in New York Group A (Figure 4-60), there is somewhat steeper decline in hospitalization rates between 2015 and 2016 in the ECCP group than in the comparison group. In Pennsylvania Group B, the rates of all-cause hospitalizations in the ECCP and comparison groups cross each other twice and almost appear to be the mirror images of each other (Figure 4-64).
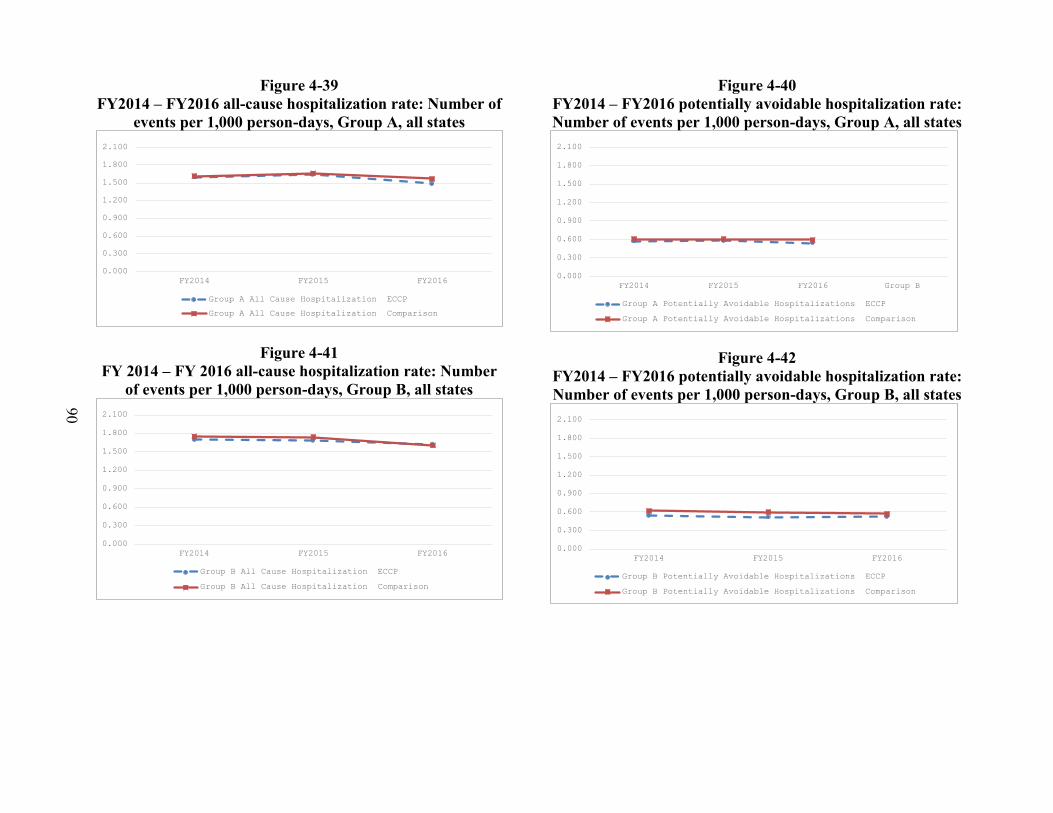
90
Figure 4-39 FY2014 – FY2016 all-cause hospitalization rate: Number of
events per 1,000 person-days, Group A, all states
Figure 4-41 FY 2014 – FY 2016 all-cause hospitalization rate: Number
of events per 1,000 person-days, Group B, all states
Figure 4-40 FY2014 – FY2016 potentially avoidable hospitalization rate: Number of events per 1,000 person-days, Group A, all states
Figure 4-42 FY2014 – FY2016 potentially avoidable hospitalization rate: Number of events per 1,000 person-days, Group B, all states
0.000
0.300
0.600
0.900
1.200
1.500
1.800
2.100
FY2014 FY2015 FY2016
Group A All Cause Hospitalization ECCP
Group A All Cause Hospitalization Comparison
0.000
0.300
0.600
0.900
1.200
1.500
1.800
2.100
FY2014 FY2015 FY2016
Group B All Cause Hospitalization ECCP
Group B All Cause Hospitalization Comparison
0.000
0.300
0.600
0.900
1.200
1.500
1.800
2.100
FY2014 FY2015 FY2016 Group B
Group A Potentially Avoidable Hospitalizations ECCP
Group A Potentially Avoidable Hospitalizations Comparison
0.000
0.300
0.600
0.900
1.200
1.500
1.800
2.100
FY2014 FY2015 FY2016
Group B Potentially Avoidable Hospitalizations ECCP
Group B Potentially Avoidable Hospitalizations Comparison
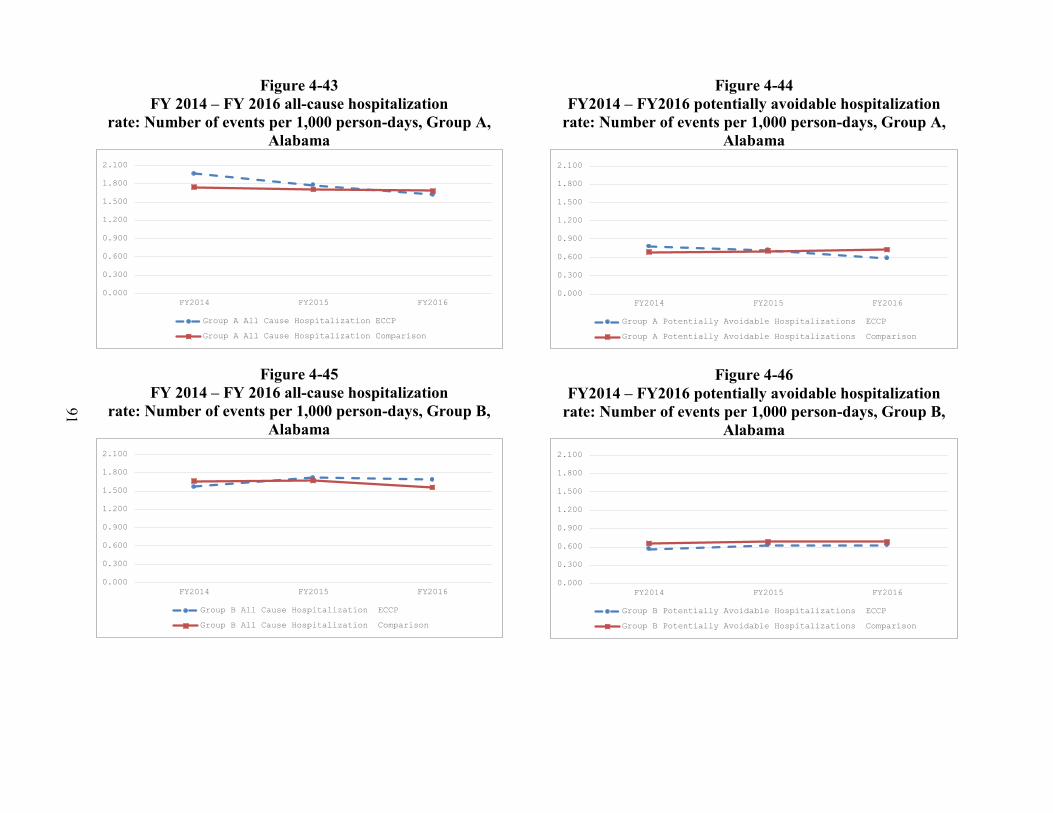
91
Figure 4-43 FY 2014 – FY 2016 all-cause hospitalization
rate: Number of events per 1,000 person-days, Group A, Alabama
Figure 4-45 FY 2014 – FY 2016 all-cause hospitalization
rate: Number of events per 1,000 person-days, Group B, Alabama
Figure 4-44 FY2014 – FY2016 potentially avoidable hospitalization
rate: Number of events per 1,000 person-days, Group A, Alabama
Figure 4-46 FY2014 – FY2016 potentially avoidable hospitalization
rate: Number of events per 1,000 person-days, Group B, Alabama
0.000
0.300
0.600
0.900
1.200
1.500
1.800
2.100
FY2014 FY2015 FY2016
Group A All Cause Hospitalization ECCP
Group A All Cause Hospitalization Comparison
0.000
0.300
0.600
0.900
1.200
1.500
1.800
2.100
FY2014 FY2015 FY2016
Group B All Cause Hospitalization ECCP
Group B All Cause Hospitalization Comparison
0.000
0.300
0.600
0.900
1.200
1.500
1.800
2.100
FY2014 FY2015 FY2016
Group A Potentially Avoidable Hospitalizations ECCP
Group A Potentially Avoidable Hospitalizations Comparison
0.000
0.300
0.600
0.900
1.200
1.500
1.800
2.100
FY2014 FY2015 FY2016
Group B Potentially Avoidable Hospitalizations ECCP
Group B Potentially Avoidable Hospitalizations Comparison
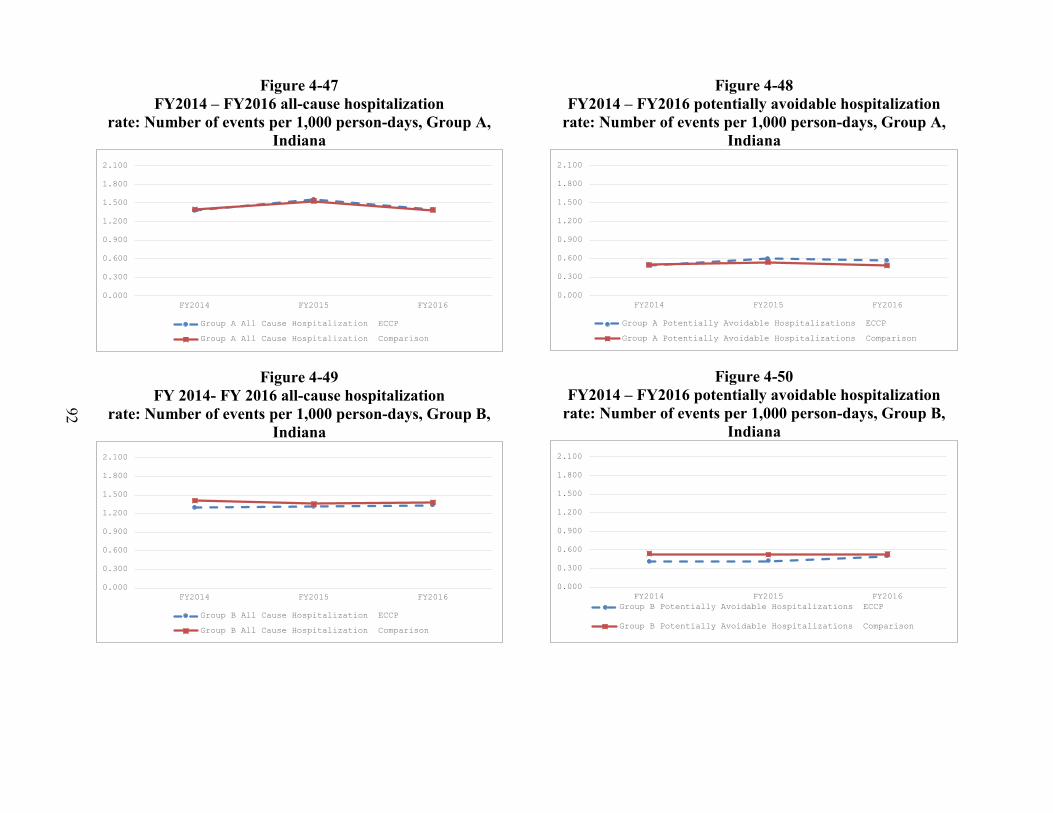
92
Figure 4-47 FY2014 – FY2016 all-cause hospitalization
rate: Number of events per 1,000 person-days, Group A, Indiana
Figure 4-49 FY 2014- FY 2016 all-cause hospitalization
rate: Number of events per 1,000 person-days, Group B, Indiana
Figure 4-48 FY2014 – FY2016 potentially avoidable hospitalization
rate: Number of events per 1,000 person-days, Group A, Indiana
Figure 4-50 FY2014 – FY2016 potentially avoidable hospitalization
rate: Number of events per 1,000 person-days, Group B, Indiana
0.000
0.300
0.600
0.900
1.200
1.500
1.800
2.100
FY2014 FY2015 FY2016
Group A All Cause Hospitalization ECCP
Group A All Cause Hospitalization Comparison
0.000
0.300
0.600
0.900
1.200
1.500
1.800
2.100
FY2014 FY2015 FY2016
Group B All Cause Hospitalization ECCP
Group B All Cause Hospitalization Comparison
0.000
0.300
0.600
0.900
1.200
1.500
1.800
2.100
FY2014 FY2015 FY2016
Group A Potentially Avoidable Hospitalizations ECCP
Group A Potentially Avoidable Hospitalizations Comparison
0.000
0.300
0.600
0.900
1.200
1.500
1.800
2.100
FY2014 FY2015 FY2016Group B Potentially Avoidable Hospitalizations ECCP
Group B Potentially Avoidable Hospitalizations Comparison
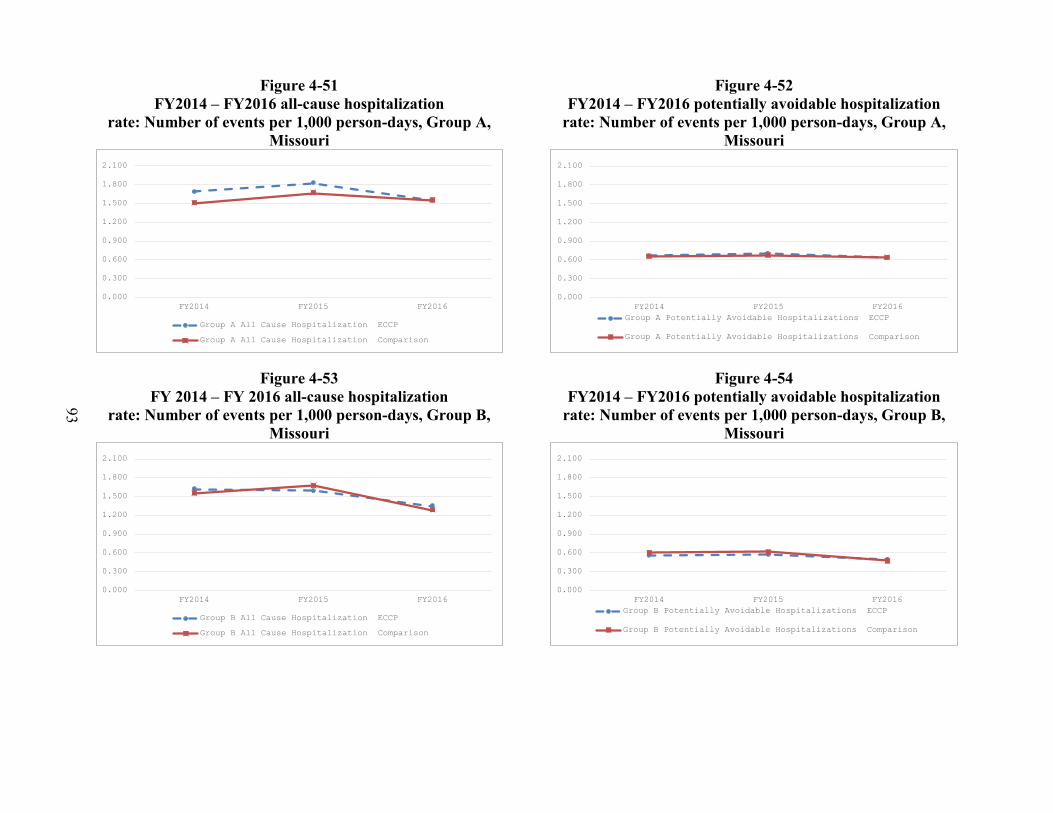
93
Figure 4-51 FY2014 – FY2016 all-cause hospitalization
rate: Number of events per 1,000 person-days, Group A, Missouri
Figure 4-53 FY 2014 – FY 2016 all-cause hospitalization
rate: Number of events per 1,000 person-days, Group B, Missouri
Figure 4-52 FY2014 – FY2016 potentially avoidable hospitalization
rate: Number of events per 1,000 person-days, Group A, Missouri
Figure 4-54 FY2014 – FY2016 potentially avoidable hospitalization
rate: Number of events per 1,000 person-days, Group B, Missouri
0.000
0.300
0.600
0.900
1.200
1.500
1.800
2.100
FY2014 FY2015 FY2016
Group A All Cause Hospitalization ECCP
Group A All Cause Hospitalization Comparison
0.000
0.300
0.600
0.900
1.200
1.500
1.800
2.100
FY2014 FY2015 FY2016
Group B All Cause Hospitalization ECCP
Group B All Cause Hospitalization Comparison
0.000
0.300
0.600
0.900
1.200
1.500
1.800
2.100
FY2014 FY2015 FY2016Group A Potentially Avoidable Hospitalizations ECCP
Group A Potentially Avoidable Hospitalizations Comparison
0.000
0.300
0.600
0.900
1.200
1.500
1.800
2.100
FY2014 FY2015 FY2016Group B Potentially Avoidable Hospitalizations ECCP
Group B Potentially Avoidable Hospitalizations Comparison
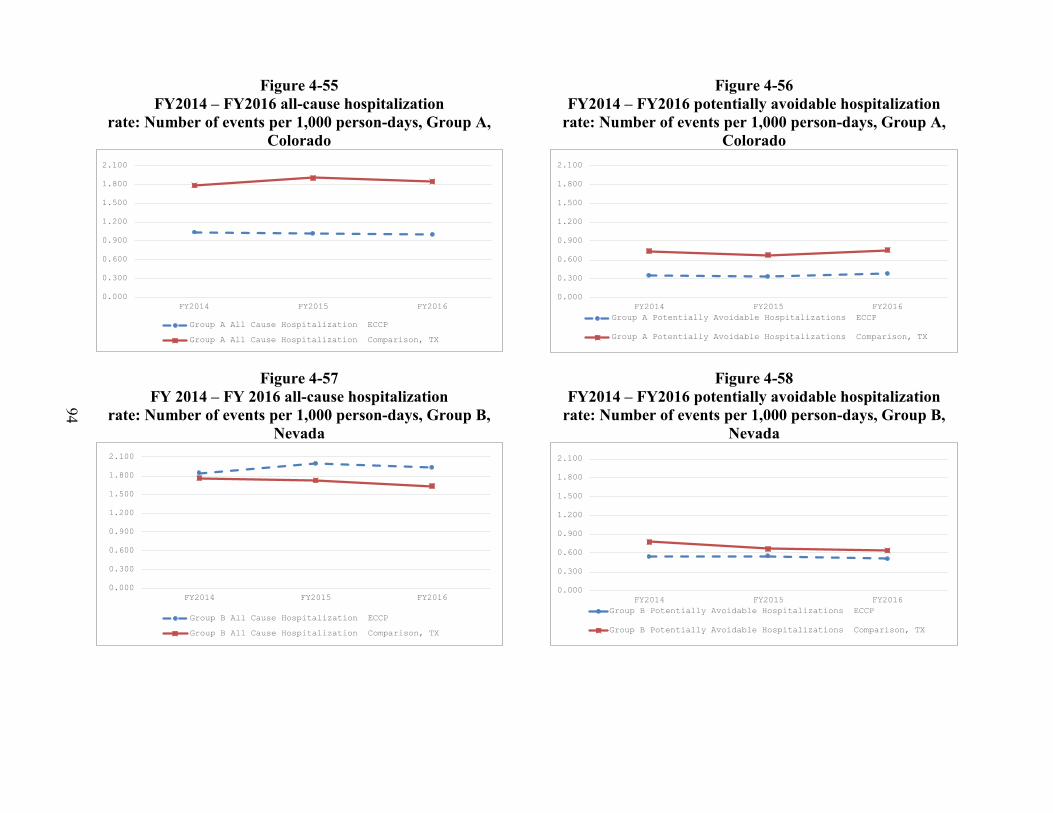
94
Figure 4-55 FY2014 – FY2016 all-cause hospitalization
rate: Number of events per 1,000 person-days, Group A, Colorado
Figure 4-57 FY 2014 – FY 2016 all-cause hospitalization
rate: Number of events per 1,000 person-days, Group B, Nevada
Figure 4-56 FY2014 – FY2016 potentially avoidable hospitalization
rate: Number of events per 1,000 person-days, Group A, Colorado
Figure 4-58 FY2014 – FY2016 potentially avoidable hospitalization
rate: Number of events per 1,000 person-days, Group B, Nevada
0.000
0.300
0.600
0.900
1.200
1.500
1.800
2.100
FY2014 FY2015 FY2016
Group A All Cause Hospitalization ECCP
Group A All Cause Hospitalization Comparison, TX
0.000
0.300
0.600
0.900
1.200
1.500
1.800
2.100
FY2014 FY2015 FY2016
Group B All Cause Hospitalization ECCP
Group B All Cause Hospitalization Comparison, TX
0.000
0.300
0.600
0.900
1.200
1.500
1.800
2.100
FY2014 FY2015 FY2016Group A Potentially Avoidable Hospitalizations ECCP
Group A Potentially Avoidable Hospitalizations Comparison, TX
0.000
0.300
0.600
0.900
1.200
1.500
1.800
2.100
FY2014 FY2015 FY2016Group B Potentially Avoidable Hospitalizations ECCP
Group B Potentially Avoidable Hospitalizations Comparison, TX
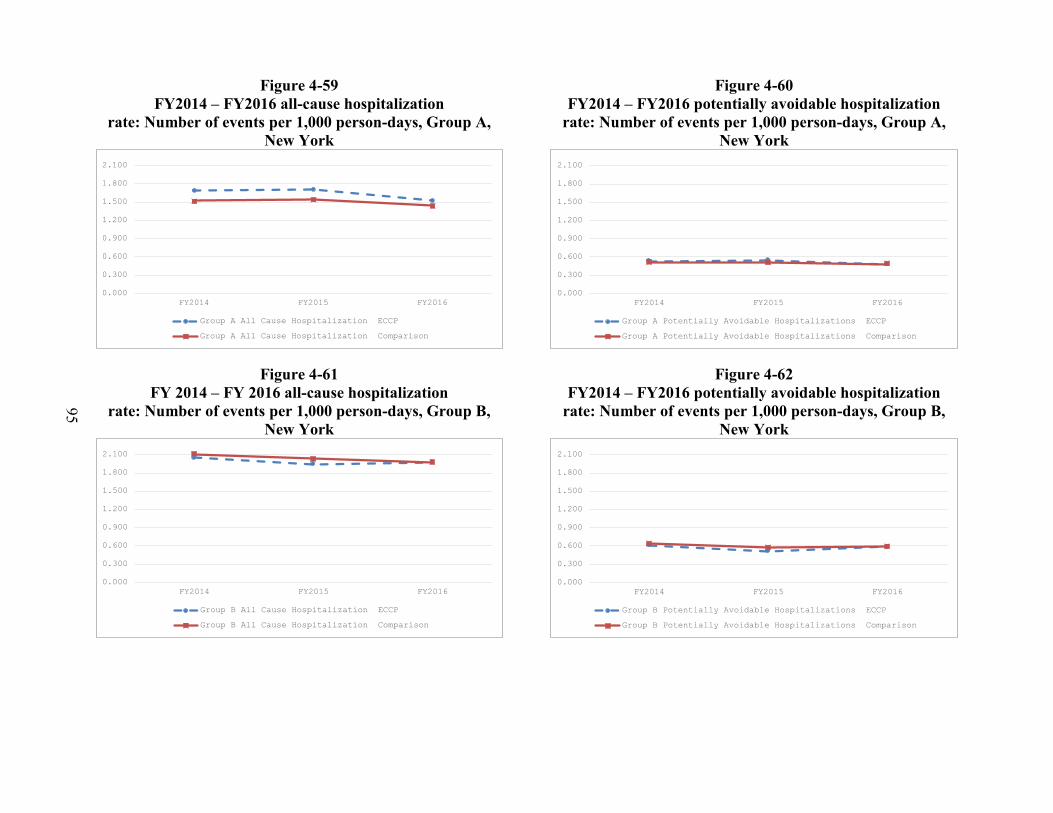
95
Figure 4-59 FY2014 – FY2016 all-cause hospitalization
rate: Number of events per 1,000 person-days, Group A, New York
Figure 4-61 FY 2014 – FY 2016 all-cause hospitalization
rate: Number of events per 1,000 person-days, Group B, New York
Figure 4-60 FY2014 – FY2016 potentially avoidable hospitalization
rate: Number of events per 1,000 person-days, Group A, New York
Figure 4-62 FY2014 – FY2016 potentially avoidable hospitalization
rate: Number of events per 1,000 person-days, Group B, New York
0.000
0.300
0.600
0.900
1.200
1.500
1.800
2.100
FY2014 FY2015 FY2016
Group A All Cause Hospitalization ECCP
Group A All Cause Hospitalization Comparison
0.000
0.300
0.600
0.900
1.200
1.500
1.800
2.100
FY2014 FY2015 FY2016
Group B All Cause Hospitalization ECCP
Group B All Cause Hospitalization Comparison
0.000
0.300
0.600
0.900
1.200
1.500
1.800
2.100
FY2014 FY2015 FY2016
Group A Potentially Avoidable Hospitalizations ECCP
Group A Potentially Avoidable Hospitalizations Comparison
0.000
0.300
0.600
0.900
1.200
1.500
1.800
2.100
FY2014 FY2015 FY2016
Group B Potentially Avoidable Hospitalizations ECCP
Group B Potentially Avoidable Hospitalizations Comparison
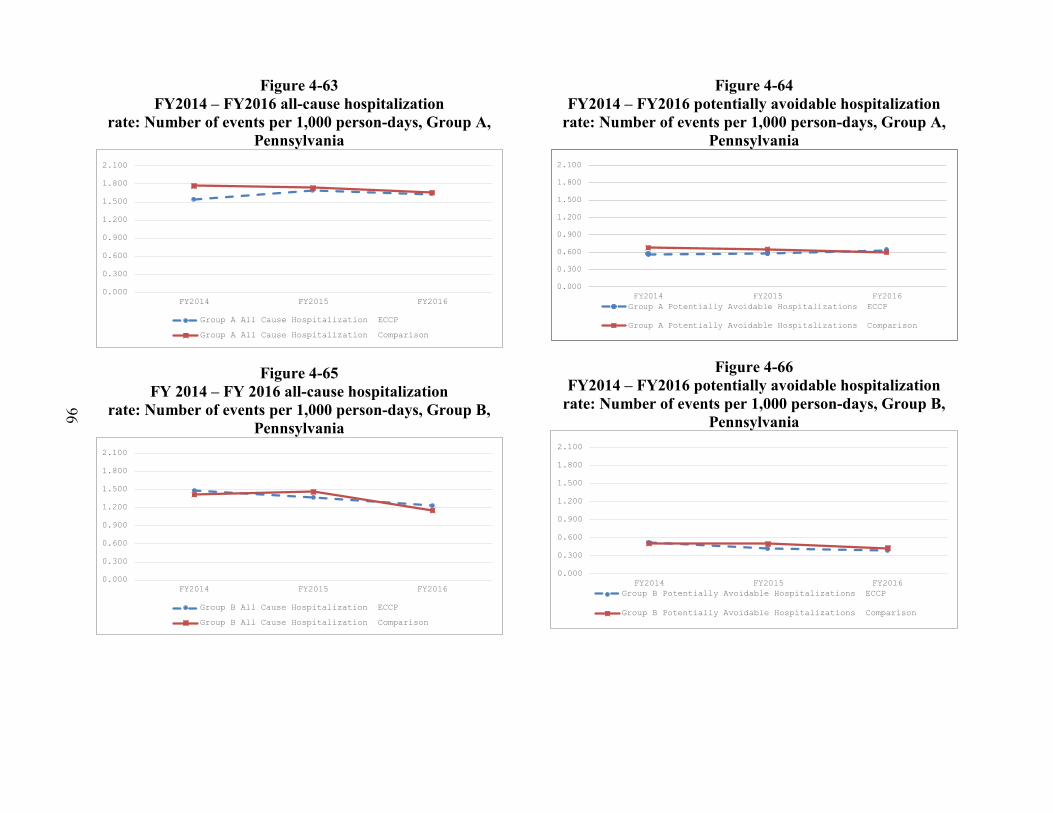
96
Figure 4-63 FY2014 – FY2016 all-cause hospitalization
rate: Number of events per 1,000 person-days, Group A, Pennsylvania
Figure 4-65 FY 2014 – FY 2016 all-cause hospitalization
rate: Number of events per 1,000 person-days, Group B, Pennsylvania
Figure 4-64 FY2014 – FY2016 potentially avoidable hospitalization
rate: Number of events per 1,000 person-days, Group A, Pennsylvania
Figure 4-66 FY2014 – FY2016 potentially avoidable hospitalization
rate: Number of events per 1,000 person-days, Group B, Pennsylvania
0.000
0.300
0.600
0.900
1.200
1.500
1.800
2.100
FY2014 FY2015 FY2016
Group A All Cause Hospitalization ECCP
Group A All Cause Hospitalization Comparison
0.000
0.300
0.600
0.900
1.200
1.500
1.800
2.100
FY2014 FY2015 FY2016
Group B All Cause Hospitalization ECCP
Group B All Cause Hospitalization Comparison
0.000
0.300
0.600
0.900
1.200
1.500
1.800
2.100
FY2014 FY2015 FY2016Group A Potentially Avoidable Hospitalizations ECCP
Group A Potentially Avoidable Hospitalizations Comparison
0.000
0.300
0.600
0.900
1.200
1.500
1.800
2.100
FY2014 FY2015 FY2016Group B Potentially Avoidable Hospitalizations ECCP
Group B Potentially Avoidable Hospitalizations Comparison
97
4.5 Resident-level Characteristics
In addition to examining facility-level characteristics after propensity score matching, we reviewed resident-level characteristics of Groups A and B and their respective matched comparison groups at the base year, FY 2016. Characteristics included age, race/ethnicity, dual eligibility status, and comorbidities coded as Hierarchical Condition Categories (HCCs, measured for the prior year). We used two-sample t-tests for continuous variables and chi-square tests for binary variables to compare the values of resident characteristics between ECCP facilities and matched comparison facilities. In Appendix E, Table E-1 shows the resident-level characteristics of all states combined, and Tables E-2 through E-7 show the resident-level characteristics for each ECCP’s Group A, Group B, and respective matched comparison group.
Overall, there are no major differences in the resident characteristics between the ECCP group and matched comparison group, for Groups A and B, across all states. As shown in Table E-1, however, which is combined across all states, the match is generally better for Group A than Group B, with fewer statistically significant differences (at the 0.05 level) between the ECCP and matched comparison group, particularly for comorbidities. For Group B, the residents in ECCP facilities have slightly worse health compared to those in the matched comparison facilities, which is a pattern reflected to a varying degree in all states (see Tables E-2 through E-7). In a few states, the residents in ECCP and comparison facilities also differ by racial/ethnic makeup. For Group A, there are fewer differences between the ECCP and comparison group, but for most states, residents in the comparison group have slightly worse health. One exception is Colorado, whose Group A, like Nevada’s Group B, was matched to a different state, Texas. Both Colorado’s Group A and Nevada’s Group B have more differences in resident-level characteristics compared to their respective matched comparison groups (in Texas) than do other ECCP groups. In the analyses of outcomes these variables will be included as risk adjusters in the equations for all states, to control for resident-level characteristics that differ between the ECCP and comparison groups. We note that whenever a very large number of tests are computed, as in these tables, there will be differences with statistical significance randomly observed.

98
[This page intentionally left blank.]
99
SECTION 5 NFI 2 OUTCOMES STUDIED
5.1 Outcome Measures
This section provides a brief description of the key outcome measures to assess the effects of the interventions, including utilization, expenditures, end-of-life care, and MDS-based quality measures. All the outcome measures, as listed in Appendix H, will be created at the resident level for a given year using the same eligibility definition for all residents across the intervention and comparison groups. As explained in Section 3, each resident’s health care utilization, events, spending, and MDS-based quality outcomes are measured for the evaluation only if they occurred during the Initiative-related exposure periods. Given the large number of outcome measures, for some of them we report only summary statistics from descriptive analyses because multivariate regression analyses are not feasible or desirable in these cases. Although all the proposed MDS-based quality measures are to be monitored and reported, only a selected set will be included in multivariate analyses; measures for descriptive analysis only are determined based on poor distribution or cross-facility variation, lack of clinical relevance, or lack of validation by the National Quality Forum. In the current report for the base year, no multivariate results are reported and only a subset of the descriptive measures, aggregated to the ECCP group or comparison group level, are included in Section 6, as noted in the last column of Appendix H. Note that in Section 6, the aggregated measures of the count outcomes are reported as rates per 1,000 person-days.
Utilization and Expenditures. Utilization and Medicare expenditure measures include service use for all-cause and potentially avoidable hospitalizations, ED visits, and observation stays. We also report several measures regarding service utilization and expenditures directly related to the six qualifying conditions for NFI 2. We present
• hospitalizations because of any of the six qualifying conditions and ED visits because of any of these conditions;
• descriptive statistics on hospitalizations and ED visits for each of these six qualifying conditions, separately; and
• hospital transfers, an aggregate measure of hospitalizations, ED visits, and observation stays because of any of the six qualifying conditions. We have added this aggregate measure because in attempting to prevent a hospitalization, a facility would also prevent ED visits and observation stays.
We also report total Medicare payments, as defined in Appendix H, and Medicare payments for select services. Select services include outpatient (institutional), SNF, hospice, home health, durable medical equipment, carrier file services, and total payments for Part D drugs. We will also provide descriptive statistics on Medicaid expenditures for these select service categories to the extent possible and when the T-MSIS data become available.
The ICD-10 codes that correspond to the full set of potentially avoidable admissions were revised from the set used for the NFI 1 study, as described in greater detail below. We have also used ICD-10 diagnosis codes to identify the six qualifying conditions. Based on clinical
100
consultation, which matched general medical terms to the sets of symptoms used in the Initiative documentation, we selected ICD-10 codes most likely to match the conditions described. In the claims data, the diagnosis codes are the only marker available for identifying hospitalizations in the Initiative and comparison groups; values of tests and x-ray impressions are not available. We are proposing a subset of the ICD-10 codes that match the qualifying conditions and will consult with CMS in finalizing it. The assumption behind the evaluation is that the number of ICD-10–defined cases seen in the hospital data will be reduced when the Initiative-defined cases are treated in the facilities. We will be looking at the codes that the Initiative practitioners are using, which may be narrower. However, we think that the specificity used by hospital coders could result in an inadvertent mismatch if we use only codes on physician Initiative claims. For more detail on the codes, see Section 5.2.
End-of-Life Care Measures. Future reports will examine the effects of the interventions on end-of-life care. Baseline information was not available at the time of this report and is therefore not presented. To assess the effects of the interventions on end-of-life care, we anticipate examining utilization and expenditures in the last 6 months of life for each Initiative-eligible resident who died within 30 days of the end of the resident’s Initiative-eligible exposure period. The resident will be included in the analysis for the year of death.
In addition, we anticipate examining six end-of-life care outcomes. These outcomes are mortality, site of mortality (nursing facility vs. elsewhere), length of terminal hospital stay (residents who died in a hospital only), hospice use, and length of hospice use and hospice expenditures. See Appendix H for the specifications for these measures. We propose to measure these outcomes in the last 6 months of life, regardless of whether they occur during the resident’s Initiative-eligible exposure periods. The Initiative may have an impact on these outcomes via increasing hospice use (e.g., through better advance care planning), which ends the resident’s Initiative-eligible exposure. Thus, looking at these outcomes during the Initiative-eligible exposure periods only may discount the Initiative’s impact on end-of-life outcomes.
We anticipate examining descriptive statistics of these end-of-life care measures in future reports. The feasibility of multivariate analysis will be assessed based on the annual sample of deceased residents in each state. States may be combined to increase sample size for multivariate analysis.
MDS-Based Quality Measures. MDS-based outcomes assess quality of care, health, and functional outcomes, which we refer to broadly as MDS-based quality outcomes. We have selected quality measures based on two major criteria: (1) clinical relevance to potentially avoidable hospitalizations and the six qualifying conditions, and (2) alignment with other CMS initiatives (e.g., Nursing Home Compare, the Nursing Home Value-Based Purchasing Demonstration, and the Five-Star Quality Rating system) or partnering initiatives (e.g., Advancing Excellence in America’s Nursing Homes).
We will measure MDS-based quality outcomes in two ways. First, similar to NFI 1, we measure the proportion of observed quarters with the presence of each adverse outcome for each resident, producing an annual score for each resident ranging from 0 to 1. Because residents can be observed for between one and four quarters, this proportion is weighted by the number of observed quarters as a proportion of a year. This weighted proportion will be reported in our
101
descriptive analysis and modeled in multivariate analyses. Second, we measure whether an adverse outcome is observed for at least one quarter within a year, which results in a dichotomous variable for each outcome. We will apply the same weighting strategy for these dichotomous variables. We will run analyses based on these two specifications and select the one that results in more consistent findings across states and outcomes.
As noted above, measures of utilization and expenditures, end-of-life care and MDS-based quality outcomes, their data sources, and whether they are included in the current report, are summarized in Appendix H.
5.2 Definition of Potentially Avoidable Hospitalizations and Identification of Six Qualifying Conditions
The principal desired outcome of the Initiative is the reduction of avoidable hospitalizations among long-stay nursing facility residents. Our starting point for defining potentially avoidable hospitalization (same applies to defining potentially avoidable ED visits) was the list of potentially avoidable hospitalization conditions and corresponding diagnosis codes developed by Walsh et al. (2010) in their study of high-cost Medicare-Medicaid dually eligible populations. We have updated this initial list to reflect subsequent updates and changes to the clinical diagnosis coding system (including the conversion from ICD-9 to ICD-10 on October 1, 2015). Under NFI 2, the payment incentives are specifically targeted at the in-house treatment of acute changes in six qualifying conditions that are a subset of conditions deemed potentially avoidable for hospital admissions. We have identified the ICD-10 codes that correspond to each of the six qualifying conditions in accordance with the clinical criteria specified by CMS. Below is a brief description of updates made to the overall list of ICD-10 codes for potentially avoidable hospitalizations and the subset of ICD-10 codes identified for each of the six qualifying conditions.
5.2.1 Updating the Overall List of ICD-10 Codes for Potentially Avoidable Hospitalization Conditions
The initial list of potentially avoidable hospitalization conditions by Walsh et al. (2010, 2012) were based on ICD-9 codes. We have updated and converted those potentially avoidable hospitalization codes from ICD-9 to ICD-10, which are applicable to any hospital claims with service dates starting on or after October 1, 2015. We conducted a comprehensive review and assessment of the appropriateness of the converted ICD-10 codes for potentially avoidable hospitalization conditions, with clinical input and decisional support from an RTI physician, Dr. Christopher Beadles. 4 Summarized below are changes implemented:
• For certain codes related to fractures that are identified as the principal diagnosis inthe ICD-9 list of potentially avoidable conditions, the ICD-10 instructions for theparallel codes are to code first any spinal cord injury—including injury of nerves andspinal cord at neck level or at thorax level, and injury of lumbar and sacral spinal cordand nerves at abdomen, lower back, or pelvis level—if it occurred. To properlyidentify these codes, it is necessary to detect the spinal cord lesion in the principal
4 The codes for NFI 2 were revised somewhat from the ICD-10 codes use in the last data year of NFI 1.
102
diagnosis and detect one of the fracture codes in the secondary diagnosis. We added such combinations of codes to our updated ICD-10 list of potentially avoidable hospitalization conditions. The fractures may also occur as a principal diagnosis if there is no spinal cord lesion.
• Certain electrolyte disorder codes reflect dehydration if they appear in combination with codes indicating volume depletion. To identify these codes, it is necessary to detect the electrolyte disorder in the principal diagnosis and detect one of the codes for volume depletion in secondary diagnosis. We added such combinations of codes to our updated ICD-10 list of potentially avoidable hospitalization conditions. The volume depletion may also occur as a principal diagnosis.
• Based on clinical review and consultant recommendations, we deleted all ICD-10 “sequela” codes that are mapped to ICD-9 “late effect” codes, but added “initial encounter” codes for any ICD-9 “late effect” codes that are mapped to ICD-10 “sequela” codes. “Late effect” codes were in the original list. Because there is no specified lookback period for late effect (sequela) codes, these are not good indicators of the recency of the incident conditions and they do not specify the nature of the sequela.
• Where appropriate, we made further additions, deletions, and edits, with clinical consultant validation.
The finalized overall list of ICD-10 codes for potentially avoidable hospitalization conditions—with codes updated through September 2016—contains a total of 11,286 standalone principal diagnosis codes and 105 additional principal diagnosis codes each to be identified in conjunction with one appropriate secondary diagnosis code. The full list of these ICD-10 codes can be provided upon request (not included in this report for reasons of space).
5.2.2 Identifying Subsets of ICD-10 Codes for the Six Qualifying Conditions
The NFI 2 Funding Opportunity Announcement defined rules regarding payments to a nursing facility for treatment of the six qualifying conditions, including the confirmation requirements and the duration of the benefit. Each of the six conditions has qualifying criteria defining the clinical or diagnostic conditions of a beneficiary that could trigger the benefit. Although CMS specified the clinical criteria for each of the six qualifying conditions, as described in Section 1, it has provided no guidance on which specific ICD-10 codes should be used to identify those conditions. Although the final list of potentially avoidable hospitalization conditions identified by the RTI team contains subsets of ICD-10 codes that generally match each of the six broadly categorized qualifying conditions—pneumonia, CHF, COPD/asthma, skin infection, fluid or electrolyte disorder or dehydration, and UTI—there is not always exact correspondence between those codes, the categorization of each condition, and the clinical criteria qualifying for each condition as specified by CMS. The symptoms of acute change in each condition, as described in the clinical criteria, are observable to the clinicians who treat a resident in the facility and may be in the medical record; they are not available in the claims. With clinical guidance from our consultant, Dr. Beadles, the RTI team has identified, reviewed, and finalized a subset of ICD-10 codes for potentially avoidable hospitalization conditions that
103
approximately matches the CMS-specified clinical criteria for each qualifying condition, briefly summarized below.
• Pneumonia: The symptomatic and treatment guidance specified by CMS suggests that bacterial pneumonia is the focus here, not viral pneumonia. Thus, we removed any ICD-10 codes for viral pneumonia. The RTI proposed subset of ICD-10 codes for potentially avoidable hospitalization conditions that meet the qualifying criteria for pneumonia is provided in Appendix F.
• CHF: The qualifying diagnosis, symptoms, and treatment guidance, as specified by CMS, are not limiting to a type of CHF. The RTI proposed subset of ICD-10 codes for potentially avoidable hospitalization conditions that meet the qualifying criteria for CHF is provided in Appendix F.
• COPD/Asthma: The qualifying diagnosis, symptoms, and treatment guidance, as specified by CMS, are not limiting in the type of asthma. The RTI proposed subset of ICD-10 codes for potentially avoidable hospitalization conditions that meet the qualifying criteria for COPD or asthma is provided in Appendix F.
• Skin Infection: The qualifying diagnosis, as specified by CMS, focuses on “new onset of painful, warm and/or swollen/indurated skin infection requiring oral or parenteral antibiotic or antiviral therapy.” It further clarifies that “if associated with a skin ulcer or wound there is an acute change in condition with signs of infection such as purulence, exudate, fever, new onset of pain, and/or induration.” Therefore, the presence of skin ulcers alone but without infection does not meet the clinical criteria for the qualifying condition. We identified cellulitis, acute lymphadenitis, and other specified local infections of the skin that meet the qualifying criteria. However, certain skin ulcer codes reflect infection if they appear in combination with codes indicating cellulitis, acute lymphadenitis, and other specified local infections of the skin. These codes are identified by the presence of skin ulcers in the principal diagnosis in conjunction with a secondary diagnosis code for cellulitis, acute lymphadenitis, or other specified skin infections. The RTI proposed subset of ICD-10 codes for potentially avoidable hospitalization conditions that meet the qualifying criteria for skin infection is provided in Appendix F.
• Dehydration: The qualifying diagnosis and treatment guidance, as specified by CMS, pertain to fluid or electrolyte disorder or dehydration, and the focus is on dehydration or volume depletion. As noted earlier, certain electrolyte disorder codes reflect dehydration if they appear in combination with codes indicating volume depletion. These codes are identified by the presence of electrolyte disorder in the principal diagnosis and presence of volume depletion in the secondary diagnosis. The RTI proposed subset of ICD-10 codes for potentially avoidable hospitalization conditions that meet the qualifying criteria for dehydration is provided in Appendix F.
• UTI: The symptomatic and treatment guidance provided by CMS focuses on dysuria, frequency, new incontinence, altered mental status, hematuria, and costovertebral angle (CVA) tenderness. We identified a subset of 10 ICD-10 codes that reasonably
104
match the condition of UTI; they are listed in Appendix F. As with the other conditions, all the possible signs and symptoms related to the diagnosis of the condition are not observed in the codes.
105
SECTION 6 DESCRIPTIVE STATISTICS: BASE YEAR
6.1 Descriptive Analysis Results: Base Year (FY 2016: October 2015–September 2016)
In this section, we present summary results from descriptive analyses of key outcome measures for Medicare utilization and expenditures for the base year (FY 2016: October 2015–September 2016). We present the results in two ways. First, we present results aggregated across all ECCPs. Results are presented separately for Group A and Group B, and separately within each of these two groups, the intervention facilities and matched comparison facilities. Next, we present separate results for each ECCP. These results are aggregated to the ECCP group and comparison group level within each state, separately for Group A and Group B.
We report the percentage of Initiative-eligible residents who were hospitalized or visited the ED—overall, for a potentially avoidable condition, and for the six qualifying conditions. Next, we present the rates of utilization, expressed as the total number of utilization events per 1,000 person-days for these same outcome measures. Finally, we present the average expenditures per beneficiary for each of these utilization categories.
6.1.1 Key Medicare Utilization Outcomes (Percentage with Any Utilization and Number of Stays/Visits per 1,000 Person-days)
In this section, we report on the percentage of Initiative-eligible residents who were hospitalized or visited the ED—overall, for a potentially avoidable condition, and for the six qualifying conditions in Group A and Group B, by ECCP and comparison. Full results are presented in Tables 6-1 through 6-7.
For all states combined, the percentage of individuals with an all-cause hospitalization for Group A ECCP facilities is similar to the percentage in matched comparison facilities, with 25.1 percent of ECCP residents having any hospitalization during FY 2016 compared to 25.7 percent of comparison residents (see Table 6-1). A similar pattern is seen in Group B, where 26.4 percent of ECCP residents had a hospitalization compared to 26.1 percent of comparison residents (see Table 6-1). Looking at utilization associated with the six qualifying conditions, for all states combined in Groups A and B, hospitalizations and ED visits because of pneumonia, UTI, and CHF were the most common (Table 6-1).
Across individual ECCPs, in Group A, the largest gap in percent of residents who had any hospitalization is between ECCP facilities in Colorado, 17.7 percent, and their comparison facilities in Texas, 27.5 percent (see Table 6-5). Hospitalization rates in Colorado are particularly low among the study states. The next biggest gap is in New York: 25.5 percent in the ECCP group versus 23.3 percent in its comparison group (see Table 6-6).
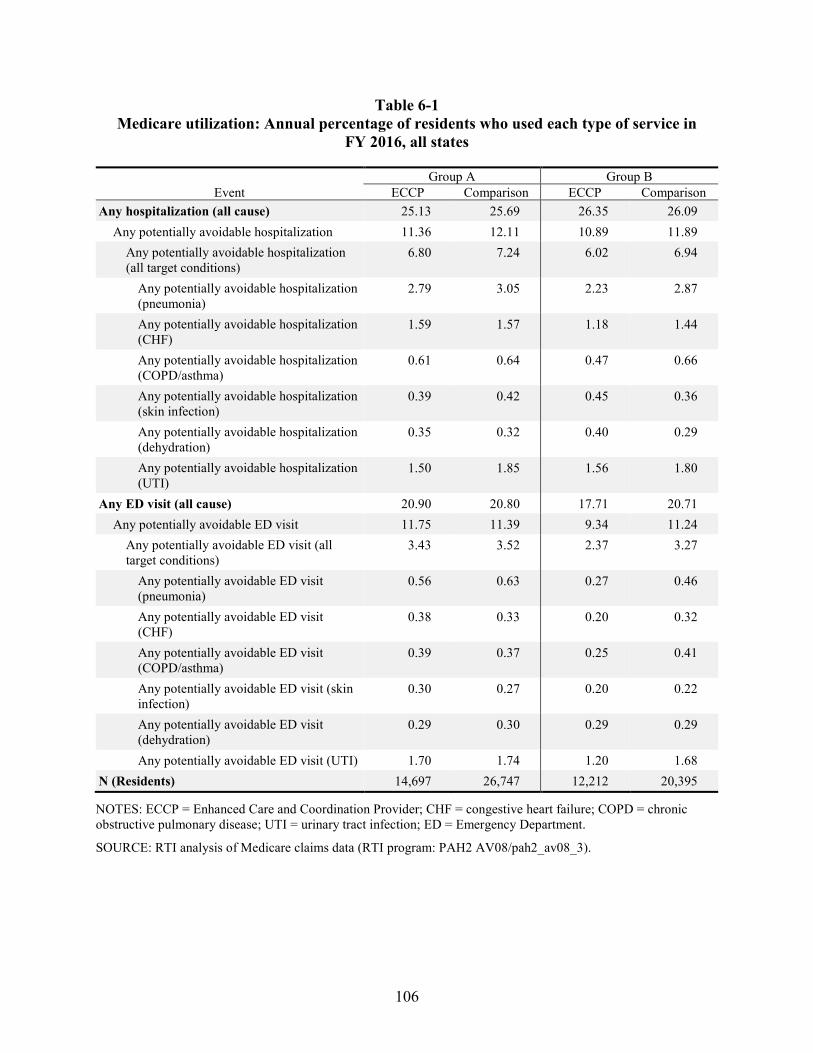
106
Table 6-1 Medicare utilization: Annual percentage of residents who used each type of service in
FY 2016, all states
Event Group A Group B
ECCP Comparison ECCP Comparison Any hospitalization (all cause) 25.13 25.69 26.35 26.09
Any potentially avoidable hospitalization 11.36 12.11 10.89 11.89 Any potentially avoidable hospitalization (all target conditions)
6.80 7.24 6.02 6.94
Any potentially avoidable hospitalization (pneumonia)
2.79 3.05 2.23 2.87
Any potentially avoidable hospitalization (CHF)
1.59 1.57 1.18 1.44
Any potentially avoidable hospitalization (COPD/asthma)
0.61 0.64 0.47 0.66
Any potentially avoidable hospitalization (skin infection)
0.39 0.42 0.45 0.36
Any potentially avoidable hospitalization (dehydration)
0.35 0.32 0.40 0.29
Any potentially avoidable hospitalization (UTI)
1.50 1.85 1.56 1.80
Any ED visit (all cause) 20.90 20.80 17.71 20.71 Any potentially avoidable ED visit 11.75 11.39 9.34 11.24
Any potentially avoidable ED visit (all target conditions)
3.43 3.52 2.37 3.27
Any potentially avoidable ED visit (pneumonia)
0.56 0.63 0.27 0.46
Any potentially avoidable ED visit (CHF)
0.38 0.33 0.20 0.32
Any potentially avoidable ED visit (COPD/asthma)
0.39 0.37 0.25 0.41
Any potentially avoidable ED visit (skin infection)
0.30 0.27 0.20 0.22
Any potentially avoidable ED visit (dehydration)
0.29 0.30 0.29 0.29
Any potentially avoidable ED visit (UTI) 1.70 1.74 1.20 1.68 N (Residents) 14,697 26,747 12,212 20,395
NOTES: ECCP = Enhanced Care and Coordination Provider; CHF = congestive heart failure; COPD = chronic obstructive pulmonary disease; UTI = urinary tract infection; ED = Emergency Department.
SOURCE: RTI analysis of Medicare claims data (RTI program: PAH2 AV08/pah2_av08_3).

107
Table 6-2 Medicare utilization: Annual percentage of residents who used each type of service in
FY 2016, Alabama
Event Group A Group B
ECCP Comparison ECCP Comparison Any hospitalization (all cause) 28.57 29.54 29.95 27.34
Any potentially avoidable hospitalization 13.07 15.64 13.26 14.70 Any potentially avoidable hospitalization (all target conditions)
8.10 9.72 7.25 8.74
Any potentially avoidable hospitalization (pneumonia)
3.09 4.68 2.63 3.74
Any potentially avoidable hospitalization (CHF)
1.64 1.67 1.29 1.67
Any potentially avoidable hospitalization (COPD/asthma)
0.80 1.11 0.80 0.96
Any potentially avoidable hospitalization (skin infection)
0.37 0.30 0.22 0.24
Any potentially avoidable hospitalization (dehydration)
0.37 0.40 0.49 0.41
Any potentially avoidable hospitalization (UTI)
2.15 2.23 2.18 2.35
Any ED visit (all cause) 24.12 24.35 22.61 23.90 Any potentially avoidable ED visit 13.54 13.97 13.17 13.55
Any potentially avoidable ED visit (all target conditions)
4.22 4.68 4.14 4.28
Any potentially avoidable ED visit (pneumonia)
0.47 1.11 0.49 0.70
Any potentially avoidable ED visit (CHF)
0.52 0.23 0.45 0.35
Any potentially avoidable ED visit (COPD/asthma)
0.66 0.84 0.40 0.74
Any potentially avoidable ED visit (skin infection)
0.33 0.15 0.18 0.24
Any potentially avoidable ED visit (dehydration)
0.23 0.15 0.53 0.43
Any potentially avoidable ED visit (UTI) 2.20 2.35 2.23 2.02 N (Residents) 2,135 3,951 2,247 4,598
NOTES: ECCP = Enhanced Care and Coordination Provider; CHF = congestive heart failure; COPD = chronic obstructive pulmonary disease; UTI = urinary tract infection; ED = Emergency Department.
SOURCE: RTI analysis of Medicare claims data (RTI program: PAH2 AV08/pah2_av08_3).

108
Table 6-3 Medicare utilization: Annual percentage of residents who used each type of service in
FY 2016, Indiana
Event Group A Group B
ECCP Comparison ECCP Comparison Any hospitalization (all cause) 23.55 23.07 22.37 23.38
Any potentially avoidable hospitalization 11.57 10.10 10.16 11.50 Any potentially avoidable hospitalization (all target conditions)
6.61 5.70 5.05 6.39
Any potentially avoidable hospitalization (pneumonia)
2.41 2.55 1.76 2.46
Any potentially avoidable hospitalization (CHF)
1.65 1.26 1.02 1.51
Any potentially avoidable hospitalization (COPD/asthma)
0.98 0.49 0.34 0.57
Any potentially avoidable hospitalization (skin infection)
0.31 0.35 0.34 0.28
Any potentially avoidable hospitalization (dehydration)
0.09 0.14 0.40 0.14
Any potentially avoidable hospitalization (UTI)
1.47 1.31 1.25 1.70
Any ED visit (all cause) 21.81 21.06 18.63 22.53 Any potentially avoidable ED visit 13.27 12.22 9.99 13.35
Any potentially avoidable ED visit (all target conditions)
3.89 4.07 2.21 4.73
Any potentially avoidable ED visit (pneumonia)
0.85 0.77 0.28 0.95
Any potentially avoidable ED visit (CHF)
0.71 0.33 0.28 0.47
Any potentially avoidable ED visit (COPD/asthma)
0.54 0.42 0.28 0.52
Any potentially avoidable ED visit (skin infection)
0.36 0.42 0.17 0.43
Any potentially avoidable ED visit (dehydration)
0.27 0.37 0.17 0.19
Any potentially avoidable ED visit (UTI) 1.47 1.89 1.08 2.41 N (Residents) 2,238 4,279 1,761 2,113
NOTES: ECCP = Enhanced Care and Coordination Provider; CHF = congestive heart failure; COPD = chronic obstructive pulmonary disease; UTI = urinary tract infection; ED = Emergency Department.
SOURCE: RTI analysis of Medicare claims data (RTI program: PAH2 AV08/pah2_av08_3).
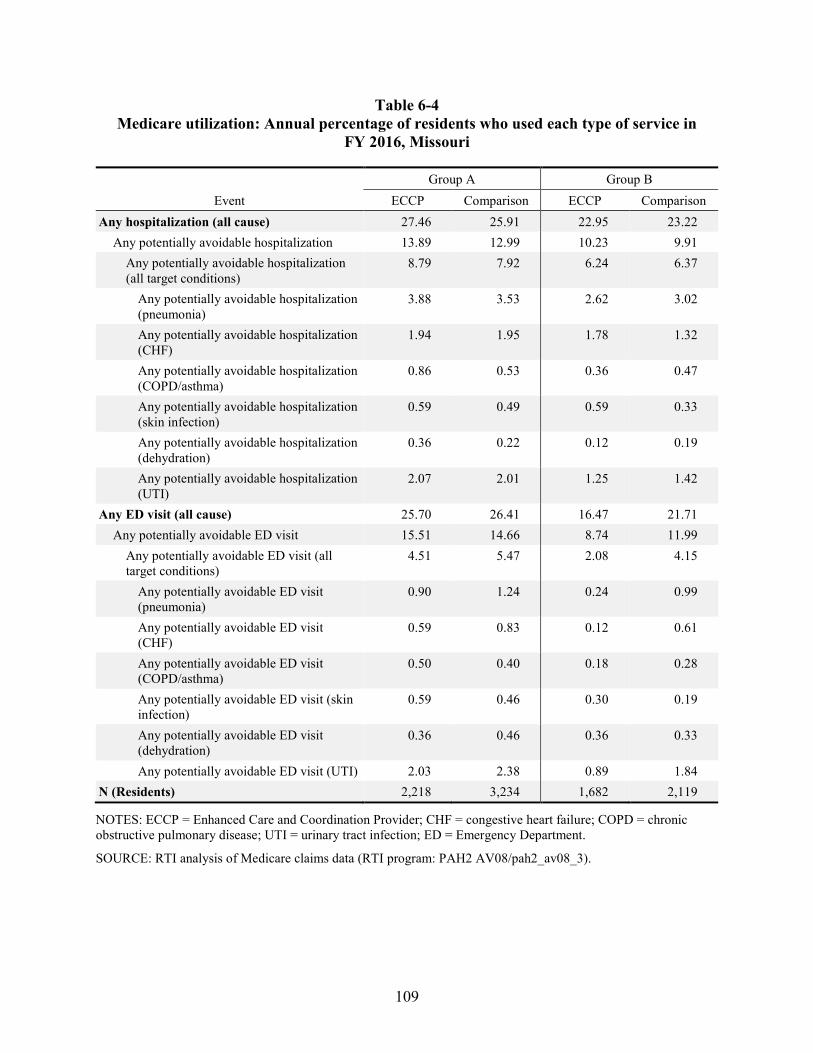
109
Table 6-4 Medicare utilization: Annual percentage of residents who used each type of service in
FY 2016, Missouri
Event Group A Group B
ECCP Comparison ECCP Comparison Any hospitalization (all cause) 27.46 25.91 22.95 23.22
Any potentially avoidable hospitalization 13.89 12.99 10.23 9.91 Any potentially avoidable hospitalization (all target conditions)
8.79 7.92 6.24 6.37
Any potentially avoidable hospitalization (pneumonia)
3.88 3.53 2.62 3.02
Any potentially avoidable hospitalization (CHF)
1.94 1.95 1.78 1.32
Any potentially avoidable hospitalization (COPD/asthma)
0.86 0.53 0.36 0.47
Any potentially avoidable hospitalization (skin infection)
0.59 0.49 0.59 0.33
Any potentially avoidable hospitalization (dehydration)
0.36 0.22 0.12 0.19
Any potentially avoidable hospitalization (UTI)
2.07 2.01 1.25 1.42
Any ED visit (all cause) 25.70 26.41 16.47 21.71 Any potentially avoidable ED visit 15.51 14.66 8.74 11.99
Any potentially avoidable ED visit (all target conditions)
4.51 5.47 2.08 4.15
Any potentially avoidable ED visit (pneumonia)
0.90 1.24 0.24 0.99
Any potentially avoidable ED visit (CHF)
0.59 0.83 0.12 0.61
Any potentially avoidable ED visit (COPD/asthma)
0.50 0.40 0.18 0.28
Any potentially avoidable ED visit (skin infection)
0.59 0.46 0.30 0.19
Any potentially avoidable ED visit (dehydration)
0.36 0.46 0.36 0.33
Any potentially avoidable ED visit (UTI) 2.03 2.38 0.89 1.84 N (Residents) 2,218 3,234 1,682 2,119
NOTES: ECCP = Enhanced Care and Coordination Provider; CHF = congestive heart failure; COPD = chronic obstructive pulmonary disease; UTI = urinary tract infection; ED = Emergency Department.
SOURCE: RTI analysis of Medicare claims data (RTI program: PAH2 AV08/pah2_av08_3).
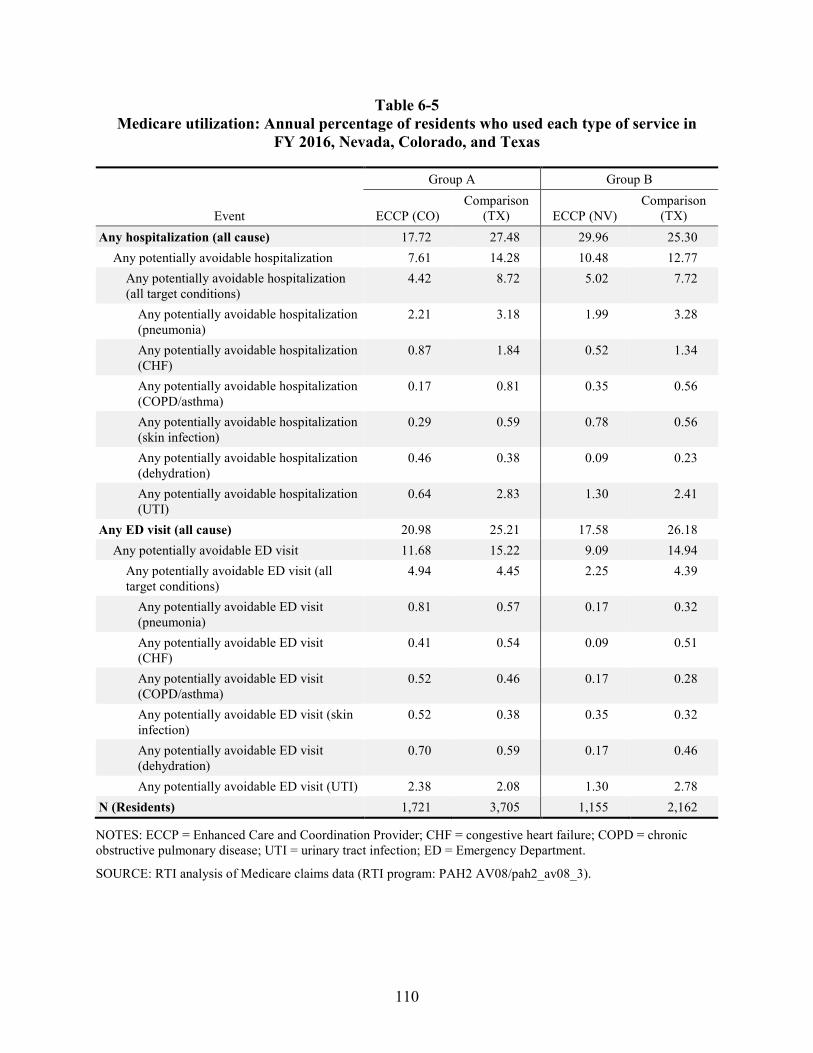
110
Table 6-5 Medicare utilization: Annual percentage of residents who used each type of service in
FY 2016, Nevada, Colorado, and Texas
Event
Group A Group B
ECCP (CO) Comparison
(TX) ECCP (NV) Comparison
(TX) Any hospitalization (all cause) 17.72 27.48 29.96 25.30
Any potentially avoidable hospitalization 7.61 14.28 10.48 12.77 Any potentially avoidable hospitalization (all target conditions)
4.42 8.72 5.02 7.72
Any potentially avoidable hospitalization (pneumonia)
2.21 3.18 1.99 3.28
Any potentially avoidable hospitalization (CHF)
0.87 1.84 0.52 1.34
Any potentially avoidable hospitalization (COPD/asthma)
0.17 0.81 0.35 0.56
Any potentially avoidable hospitalization (skin infection)
0.29 0.59 0.78 0.56
Any potentially avoidable hospitalization (dehydration)
0.46 0.38 0.09 0.23
Any potentially avoidable hospitalization (UTI)
0.64 2.83 1.30 2.41
Any ED visit (all cause) 20.98 25.21 17.58 26.18 Any potentially avoidable ED visit 11.68 15.22 9.09 14.94
Any potentially avoidable ED visit (all target conditions)
4.94 4.45 2.25 4.39
Any potentially avoidable ED visit (pneumonia)
0.81 0.57 0.17 0.32
Any potentially avoidable ED visit (CHF)
0.41 0.54 0.09 0.51
Any potentially avoidable ED visit (COPD/asthma)
0.52 0.46 0.17 0.28
Any potentially avoidable ED visit (skin infection)
0.52 0.38 0.35 0.32
Any potentially avoidable ED visit (dehydration)
0.70 0.59 0.17 0.46
Any potentially avoidable ED visit (UTI) 2.38 2.08 1.30 2.78 N (Residents) 1,721 3,705 1,155 2,162
NOTES: ECCP = Enhanced Care and Coordination Provider; CHF = congestive heart failure; COPD = chronic obstructive pulmonary disease; UTI = urinary tract infection; ED = Emergency Department.
SOURCE: RTI analysis of Medicare claims data (RTI program: PAH2 AV08/pah2_av08_3).

111
Table 6-6 Medicare utilization: Annual percentage of residents who used each type of service in
FY 2016, New York
Event Group A Group B
ECCP Comparison ECCP Comparison Any hospitalization (all cause) 25.47 23.33 28.40 29.51
Any potentially avoidable hospitalization 9.81 9.80 11.16 11.55 Any potentially avoidable hospitalization (all target conditions)
6.01 6.01 6.60 6.40
Any potentially avoidable hospitalization (pneumonia)
2.31 2.35 2.32 2.29
Any potentially avoidable hospitalization (CHF)
1.58 1.39 1.42 1.39
Any potentially avoidable hospitalization (COPD/asthma)
0.41 0.54 0.38 0.66
Any potentially avoidable hospitalization (skin infection)
0.38 0.46 0.49 0.46
Any potentially avoidable hospitalization (dehydration)
0.38 0.33 0.55 0.34
Any potentially avoidable hospitalization (UTI)
1.27 1.48 1.75 1.67
Any ED visit (all cause) 17.76 15.62 15.58 16.85 Any potentially avoidable ED visit 9.69 7.59 7.23 8.21
Any potentially avoidable ED visit (all target conditions)
2.10 1.80 1.50 1.72
Any potentially avoidable ED visit (pneumonia)
0.23 0.24 0.08 0.10
Any potentially avoidable ED visit (CHF)
0.14 0.13 0.05 0.16
Any potentially avoidable ED visit (COPD/asthma)
0.20 0.17 0.16 0.19
Any potentially avoidable ED visit (skin infection)
0.11 0.14 0.14 0.18
Any potentially avoidable ED visit (dehydration)
0.23 0.11 0.25 0.16
Any potentially avoidable ED visit (UTI) 1.20 1.02 0.85 0.94 N (Residents) 4,425 7,843 3,665 6,812
NOTES: ECCP = Enhanced Care and Coordination Provider; CHF = congestive heart failure; COPD = chronic obstructive pulmonary disease; UTI = urinary tract infection; ED = Emergency Department.
SOURCE: RTI analysis of Medicare claims data (RTI program: PAH2 AV08/pah2_av08_3).
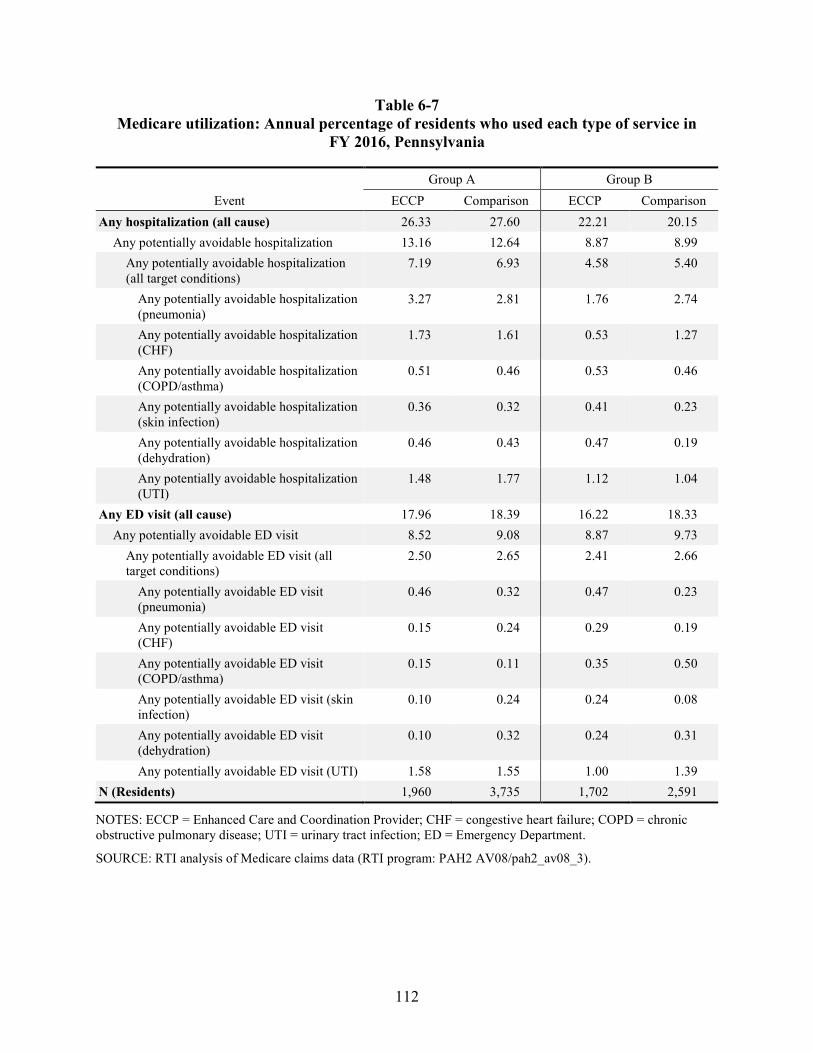
112
Table 6-7 Medicare utilization: Annual percentage of residents who used each type of service in
FY 2016, Pennsylvania
Event Group A Group B
ECCP Comparison ECCP Comparison Any hospitalization (all cause) 26.33 27.60 22.21 20.15
Any potentially avoidable hospitalization 13.16 12.64 8.87 8.99 Any potentially avoidable hospitalization (all target conditions)
7.19 6.93 4.58 5.40
Any potentially avoidable hospitalization (pneumonia)
3.27 2.81 1.76 2.74
Any potentially avoidable hospitalization (CHF)
1.73 1.61 0.53 1.27
Any potentially avoidable hospitalization (COPD/asthma)
0.51 0.46 0.53 0.46
Any potentially avoidable hospitalization (skin infection)
0.36 0.32 0.41 0.23
Any potentially avoidable hospitalization (dehydration)
0.46 0.43 0.47 0.19
Any potentially avoidable hospitalization (UTI)
1.48 1.77 1.12 1.04
Any ED visit (all cause) 17.96 18.39 16.22 18.33 Any potentially avoidable ED visit 8.52 9.08 8.87 9.73
Any potentially avoidable ED visit (all target conditions)
2.50 2.65 2.41 2.66
Any potentially avoidable ED visit (pneumonia)
0.46 0.32 0.47 0.23
Any potentially avoidable ED visit (CHF)
0.15 0.24 0.29 0.19
Any potentially avoidable ED visit (COPD/asthma)
0.15 0.11 0.35 0.50
Any potentially avoidable ED visit (skin infection)
0.10 0.24 0.24 0.08
Any potentially avoidable ED visit (dehydration)
0.10 0.32 0.24 0.31
Any potentially avoidable ED visit (UTI) 1.58 1.55 1.00 1.39 N (Residents) 1,960 3,735 1,702 2,591
NOTES: ECCP = Enhanced Care and Coordination Provider; CHF = congestive heart failure; COPD = chronic obstructive pulmonary disease; UTI = urinary tract infection; ED = Emergency Department.
SOURCE: RTI analysis of Medicare claims data (RTI program: PAH2 AV08/pah2_av08_3).
113
Across individual ECCPs in Group B, the biggest differences are between the ECCP group in Nevada and the corresponding comparison group in Texas (Table 6-5) and between the ECCP and comparison groups in Alabama (Table 6-2). Note that for Colorado and Nevada, a likely explanation for many of the descriptive differences we observe in the ECCP groups compared to their respective comparison groups are because they are located in different states. Furthermore, as described above, the comparison matches for Nevada and Colorado facilities were based on facility-level hospitalization rates and other characteristics centered around state-specific means. Thus, the descriptive statistics for the ECCP groups in Colorado and Nevada, in raw values and not centered, are different from those of their comparison groups in Texas. These differences will be accounted for in future regression analysis using the difference-in-differences method.
Utilization rates, measured by the number of events per 1,000 person-days for hospitalizations and ED visits overall, potentially avoidable, and specifically for the six qualifying conditions follow similar patterns to results discussed above for the percentage of residents with any utilization. Full results on utilization rates per 1,000 person-days are displayed in Tables 6-8 through 6-14.
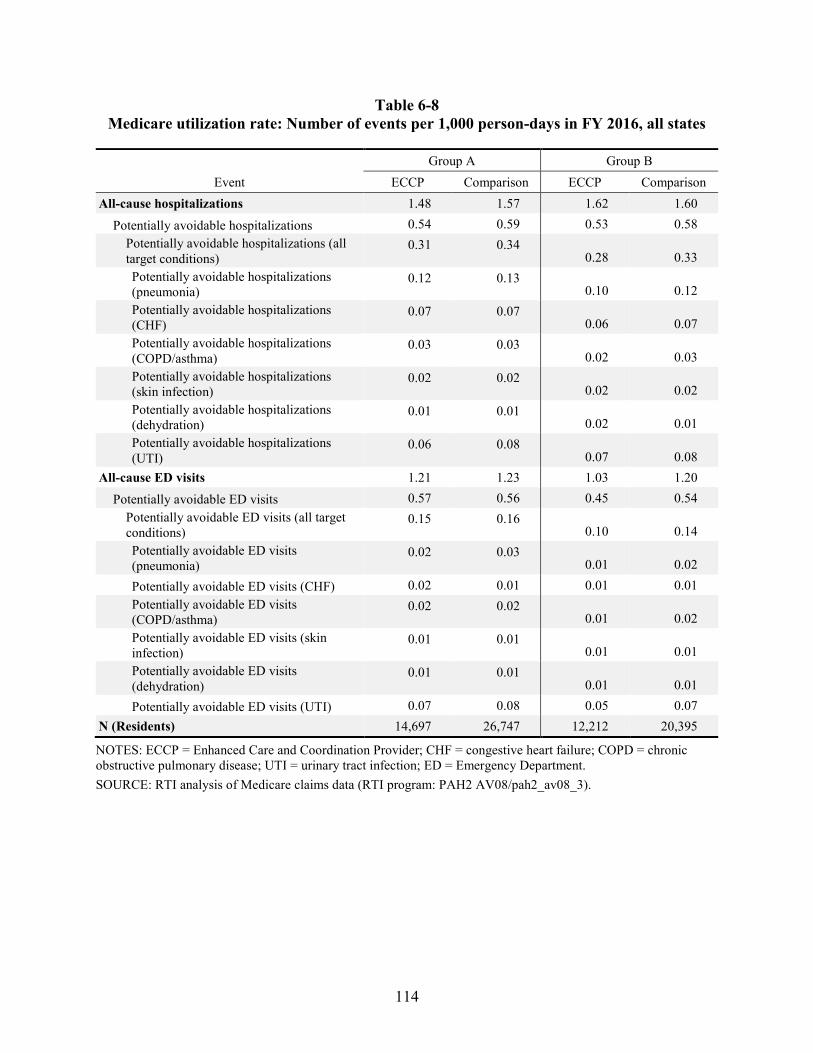
114
Table 6-8 Medicare utilization rate: Number of events per 1,000 person-days in FY 2016, all states
Event Group A Group B
ECCP Comparison ECCP Comparison All-cause hospitalizations 1.48 1.57 1.62 1.60
Potentially avoidable hospitalizations 0.54 0.59 0.53 0.58 Potentially avoidable hospitalizations (all target conditions)
0.31 0.34 0.28 0.33
Potentially avoidable hospitalizations (pneumonia)
0.12 0.13 0.10 0.12
Potentially avoidable hospitalizations (CHF)
0.07 0.07 0.06 0.07
Potentially avoidable hospitalizations (COPD/asthma)
0.03 0.03 0.02 0.03
Potentially avoidable hospitalizations (skin infection)
0.02 0.02 0.02 0.02
Potentially avoidable hospitalizations (dehydration)
0.01 0.01 0.02 0.01
Potentially avoidable hospitalizations (UTI)
0.06 0.08 0.07 0.08
All-cause ED visits 1.21 1.23 1.03 1.20 Potentially avoidable ED visits 0.57 0.56 0.45 0.54
Potentially avoidable ED visits (all target conditions)
0.15 0.16 0.10 0.14
Potentially avoidable ED visits (pneumonia)
0.02 0.03 0.01 0.02
Potentially avoidable ED visits (CHF) 0.02 0.01 0.01 0.01 Potentially avoidable ED visits (COPD/asthma)
0.02 0.02 0.01 0.02
Potentially avoidable ED visits (skin infection)
0.01 0.01 0.01 0.01
Potentially avoidable ED visits (dehydration)
0.01 0.01 0.01 0.01
Potentially avoidable ED visits (UTI) 0.07 0.08 0.05 0.07 N (Residents) 14,697 26,747 12,212 20,395
NOTES: ECCP = Enhanced Care and Coordination Provider; CHF = congestive heart failure; COPD = chronic obstructive pulmonary disease; UTI = urinary tract infection; ED = Emergency Department. SOURCE: RTI analysis of Medicare claims data (RTI program: PAH2 AV08/pah2_av08_3).
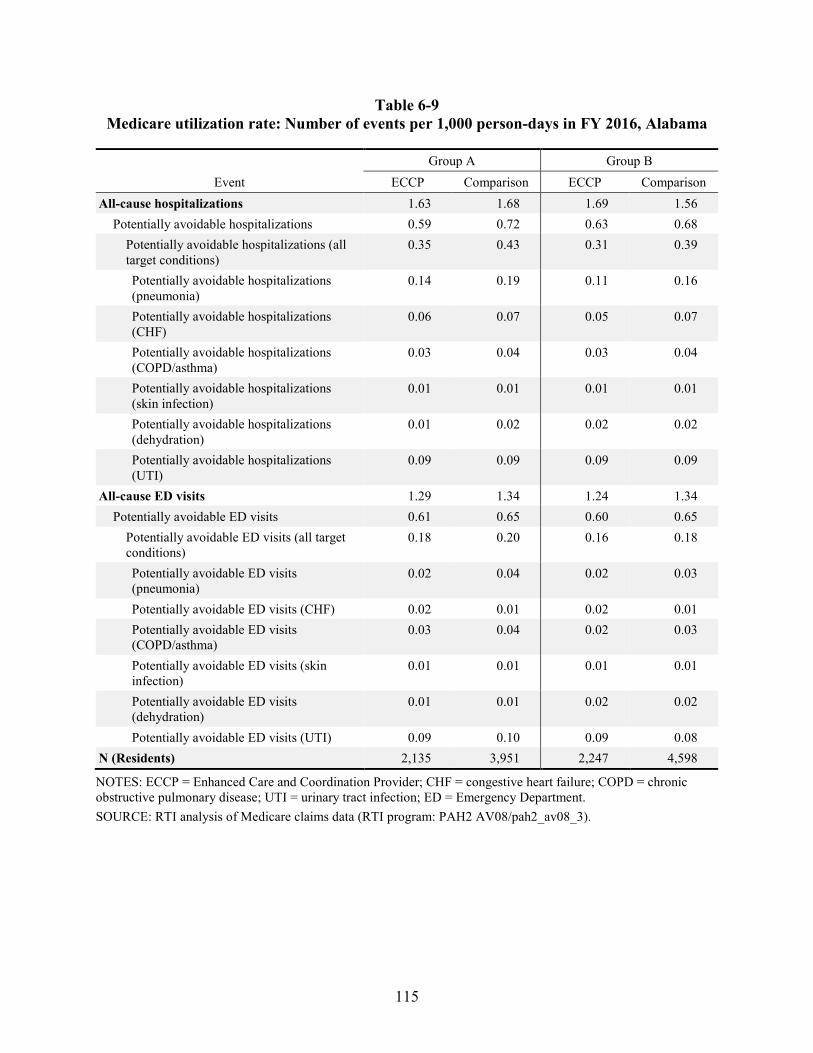
115
Table 6-9 Medicare utilization rate: Number of events per 1,000 person-days in FY 2016, Alabama
Event Group A Group B
ECCP Comparison ECCP Comparison All-cause hospitalizations 1.63 1.68 1.69 1.56
Potentially avoidable hospitalizations 0.59 0.72 0.63 0.68 Potentially avoidable hospitalizations (all target conditions)
0.35 0.43 0.31 0.39
Potentially avoidable hospitalizations (pneumonia)
0.14 0.19 0.11 0.16
Potentially avoidable hospitalizations (CHF)
0.06 0.07 0.05 0.07
Potentially avoidable hospitalizations (COPD/asthma)
0.03 0.04 0.03 0.04
Potentially avoidable hospitalizations (skin infection)
0.01 0.01 0.01 0.01
Potentially avoidable hospitalizations (dehydration)
0.01 0.02 0.02 0.02
Potentially avoidable hospitalizations (UTI)
0.09 0.09 0.09 0.09
All-cause ED visits 1.29 1.34 1.24 1.34 Potentially avoidable ED visits 0.61 0.65 0.60 0.65
Potentially avoidable ED visits (all target conditions)
0.18 0.20 0.16 0.18
Potentially avoidable ED visits (pneumonia)
0.02 0.04 0.02 0.03
Potentially avoidable ED visits (CHF) 0.02 0.01 0.02 0.01 Potentially avoidable ED visits (COPD/asthma)
0.03 0.04 0.02 0.03
Potentially avoidable ED visits (skin infection)
0.01 0.01 0.01 0.01
Potentially avoidable ED visits (dehydration)
0.01 0.01 0.02 0.02
Potentially avoidable ED visits (UTI) 0.09 0.10 0.09 0.08 N (Residents) 2,135 3,951 2,247 4,598
NOTES: ECCP = Enhanced Care and Coordination Provider; CHF = congestive heart failure; COPD = chronic obstructive pulmonary disease; UTI = urinary tract infection; ED = Emergency Department. SOURCE: RTI analysis of Medicare claims data (RTI program: PAH2 AV08/pah2_av08_3).

116
Table 6-10 Medicare utilization rate: Number of events per 1,000 person-days in FY 2016, Indiana
Event Group A Group B
ECCP Comparison ECCP Comparison All-cause hospitalizations 1.40 1.39 1.33 1.37
Potentially avoidable hospitalizations 0.58 0.49 0.50 0.53 Potentially avoidable hospitalizations (all target conditions)
0.31 0.27 0.24 0.28
Potentially avoidable hospitalizations (pneumonia)
0.10 0.11 0.08 0.10
Potentially avoidable hospitalizations (CHF)
0.08 0.06 0.05 0.06
Potentially avoidable hospitalizations (COPD/asthma)
0.04 0.02 0.02 0.03
Potentially avoidable hospitalizations (skin infection)
0.01 0.02 0.01 0.01
Potentially avoidable hospitalizations (dehydration)
0.00 0.01 0.02 0.01
Potentially avoidable hospitalizations (UTI)
0.07 0.06 0.06 0.07
All-cause ED visits 1.26 1.25 1.15 1.36 Potentially avoidable ED visits 0.66 0.61 0.51 0.66
Potentially avoidable ED visits (all target conditions)
0.18 0.18 0.10 0.22
Potentially avoidable ED visits (pneumonia)
0.04 0.03 0.01 0.05
Potentially avoidable ED visits (CHF) 0.03 0.01 0.01 0.02 Potentially avoidable ED visits (COPD/asthma)
0.02 0.02 0.01 0.02
Potentially avoidable ED visits (skin infection)
0.01 0.02 0.01 0.02
Potentially avoidable ED visits (dehydration)
0.01 0.02 0.01 0.01
Potentially avoidable ED visits (UTI) 0.06 0.08 0.05 0.11 N (Residents) 2,238 4,279 1,761 2,113
NOTES: ECCP = Enhanced Care and Coordination Provider; CHF = congestive heart failure; COPD = chronic obstructive pulmonary disease; UTI = urinary tract infection; ED = Emergency Department. SOURCE: RTI analysis of Medicare claims data (RTI program: PAH2 AV08/pah2_av08_3).
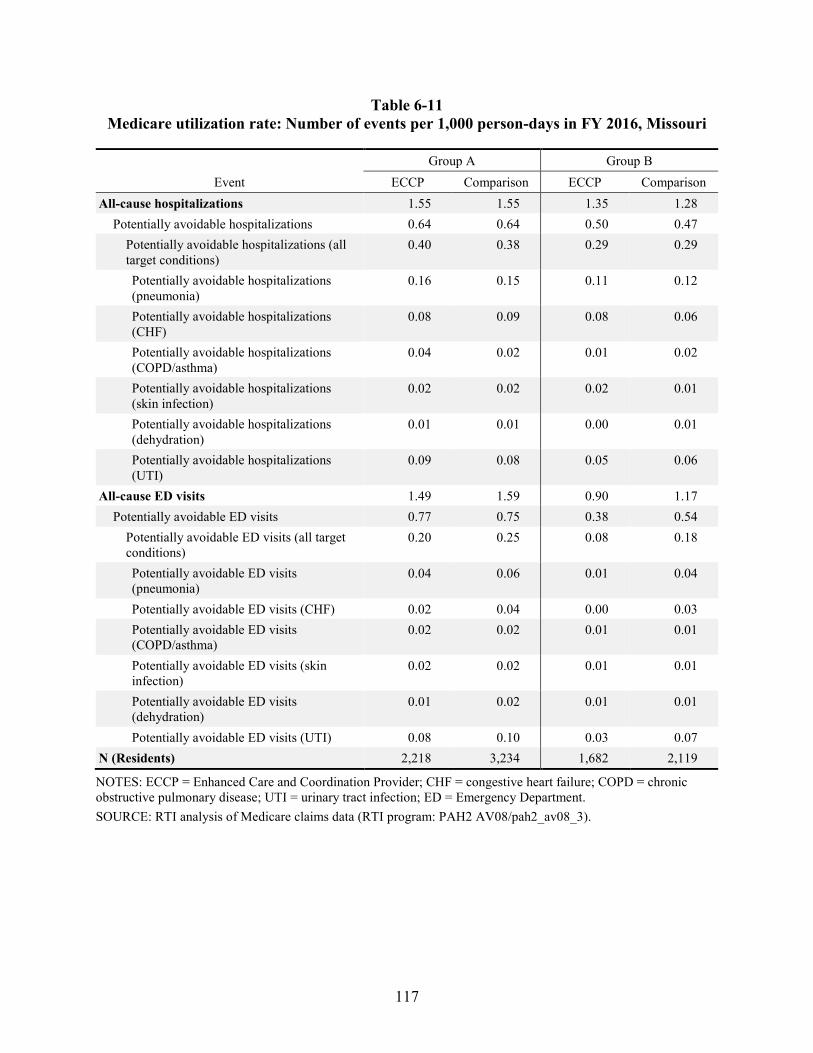
117
Table 6-11 Medicare utilization rate: Number of events per 1,000 person-days in FY 2016, Missouri
Event Group A Group B
ECCP Comparison ECCP Comparison All-cause hospitalizations 1.55 1.55 1.35 1.28
Potentially avoidable hospitalizations 0.64 0.64 0.50 0.47 Potentially avoidable hospitalizations (all target conditions)
0.40 0.38 0.29 0.29
Potentially avoidable hospitalizations (pneumonia)
0.16 0.15 0.11 0.12
Potentially avoidable hospitalizations (CHF)
0.08 0.09 0.08 0.06
Potentially avoidable hospitalizations (COPD/asthma)
0.04 0.02 0.01 0.02
Potentially avoidable hospitalizations (skin infection)
0.02 0.02 0.02 0.01
Potentially avoidable hospitalizations (dehydration)
0.01 0.01 0.00 0.01
Potentially avoidable hospitalizations (UTI)
0.09 0.08 0.05 0.06
All-cause ED visits 1.49 1.59 0.90 1.17 Potentially avoidable ED visits 0.77 0.75 0.38 0.54
Potentially avoidable ED visits (all target conditions)
0.20 0.25 0.08 0.18
Potentially avoidable ED visits (pneumonia)
0.04 0.06 0.01 0.04
Potentially avoidable ED visits (CHF) 0.02 0.04 0.00 0.03 Potentially avoidable ED visits (COPD/asthma)
0.02 0.02 0.01 0.01
Potentially avoidable ED visits (skin infection)
0.02 0.02 0.01 0.01
Potentially avoidable ED visits (dehydration)
0.01 0.02 0.01 0.01
Potentially avoidable ED visits (UTI) 0.08 0.10 0.03 0.07 N (Residents) 2,218 3,234 1,682 2,119
NOTES: ECCP = Enhanced Care and Coordination Provider; CHF = congestive heart failure; COPD = chronic obstructive pulmonary disease; UTI = urinary tract infection; ED = Emergency Department. SOURCE: RTI analysis of Medicare claims data (RTI program: PAH2 AV08/pah2_av08_3).
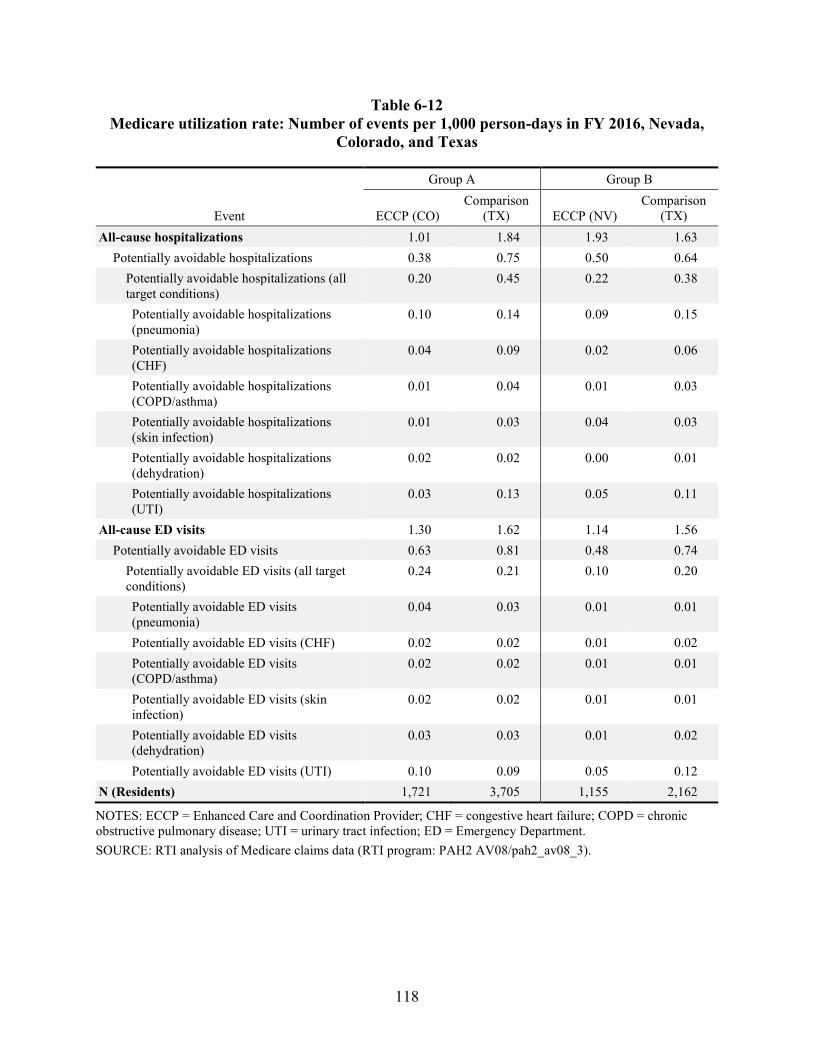
118
Table 6-12 Medicare utilization rate: Number of events per 1,000 person-days in FY 2016, Nevada,
Colorado, and Texas
Event
Group A Group B
ECCP (CO) Comparison
(TX) ECCP (NV) Comparison
(TX) All-cause hospitalizations 1.01 1.84 1.93 1.63
Potentially avoidable hospitalizations 0.38 0.75 0.50 0.64 Potentially avoidable hospitalizations (all target conditions)
0.20 0.45 0.22 0.38
Potentially avoidable hospitalizations (pneumonia)
0.10 0.14 0.09 0.15
Potentially avoidable hospitalizations (CHF)
0.04 0.09 0.02 0.06
Potentially avoidable hospitalizations (COPD/asthma)
0.01 0.04 0.01 0.03
Potentially avoidable hospitalizations (skin infection)
0.01 0.03 0.04 0.03
Potentially avoidable hospitalizations (dehydration)
0.02 0.02 0.00 0.01
Potentially avoidable hospitalizations (UTI)
0.03 0.13 0.05 0.11
All-cause ED visits 1.30 1.62 1.14 1.56 Potentially avoidable ED visits 0.63 0.81 0.48 0.74
Potentially avoidable ED visits (all target conditions)
0.24 0.21 0.10 0.20
Potentially avoidable ED visits (pneumonia)
0.04 0.03 0.01 0.01
Potentially avoidable ED visits (CHF) 0.02 0.02 0.01 0.02 Potentially avoidable ED visits (COPD/asthma)
0.02 0.02 0.01 0.01
Potentially avoidable ED visits (skin infection)
0.02 0.02 0.01 0.01
Potentially avoidable ED visits (dehydration)
0.03 0.03 0.01 0.02
Potentially avoidable ED visits (UTI) 0.10 0.09 0.05 0.12 N (Residents) 1,721 3,705 1,155 2,162
NOTES: ECCP = Enhanced Care and Coordination Provider; CHF = congestive heart failure; COPD = chronic obstructive pulmonary disease; UTI = urinary tract infection; ED = Emergency Department. SOURCE: RTI analysis of Medicare claims data (RTI program: PAH2 AV08/pah2_av08_3).

119
Table 6-13 Medicare utilization rate: Number of events per 1,000 person-days in FY 2016, New York
Event Group A Group B
ECCP Comparison ECCP Comparison All-cause hospitalizations 1.52 1.44 1.97 1.97
Potentially avoidable hospitalizations 0.48 0.49 0.59 0.59 Potentially avoidable hospitalizations (all target conditions)
0.27 0.29 0.34 0.32
Potentially avoidable hospitalizations (pneumonia)
0.10 0.10 0.11 0.10
Potentially avoidable hospitalizations (CHF)
0.07 0.07 0.08 0.08
Potentially avoidable hospitalizations (COPD/asthma)
0.02 0.03 0.02 0.03
Potentially avoidable hospitalizations (skin infection)
0.02 0.02 0.02 0.02
Potentially avoidable hospitalizations (dehydration)
0.02 0.01 0.03 0.01
Potentially avoidable hospitalizations (UTI)
0.05 0.06 0.08 0.08
All-cause ED visits 1.04 0.91 0.97 0.99 Potentially avoidable ED visits 0.46 0.36 0.38 0.39
Potentially avoidable ED visits (all target conditions)
0.09 0.08 0.07 0.07
Potentially avoidable ED visits (pneumonia)
0.01 0.01 0.00 0.00
Potentially avoidable ED visits (CHF) 0.01 0.01 0.00 0.01 Potentially avoidable ED visits (COPD/asthma)
0.01 0.01 0.01 0.01
Potentially avoidable ED visits (skin infection)
0.00 0.01 0.01 0.01
Potentially avoidable ED visits (dehydration)
0.01 0.00 0.01 0.01
Potentially avoidable ED visits (UTI) 0.05 0.05 0.04 0.04 N (Residents) 4,425 7,843 3,665 6,812
NOTES: ECCP = Enhanced Care and Coordination Provider; CHF = congestive heart failure; COPD = chronic obstructive pulmonary disease; UTI = urinary tract infection; ED = Emergency Department. SOURCE: RTI analysis of Medicare claims data (RTI program: PAH2 AV08/pah2_av08_3).
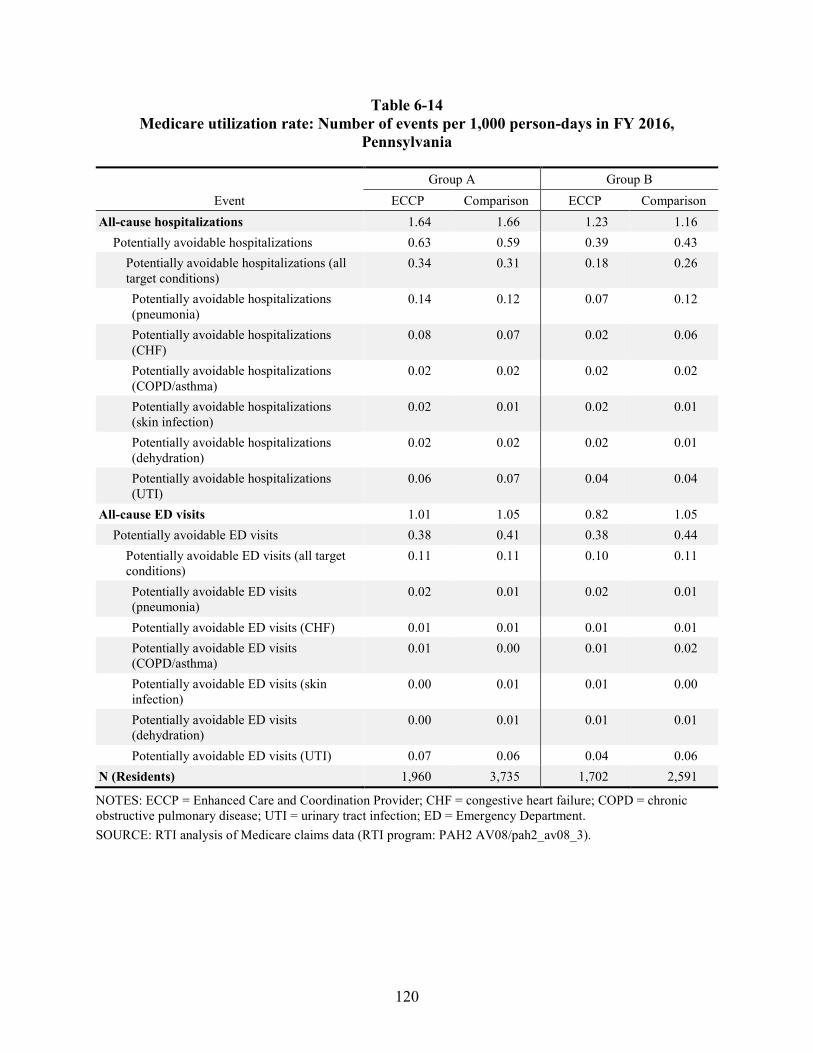
120
Table 6-14 Medicare utilization rate: Number of events per 1,000 person-days in FY 2016,
Pennsylvania
Event Group A Group B
ECCP Comparison ECCP Comparison All-cause hospitalizations 1.64 1.66 1.23 1.16
Potentially avoidable hospitalizations 0.63 0.59 0.39 0.43 Potentially avoidable hospitalizations (all target conditions)
0.34 0.31 0.18 0.26
Potentially avoidable hospitalizations (pneumonia)
0.14 0.12 0.07 0.12
Potentially avoidable hospitalizations (CHF)
0.08 0.07 0.02 0.06
Potentially avoidable hospitalizations (COPD/asthma)
0.02 0.02 0.02 0.02
Potentially avoidable hospitalizations (skin infection)
0.02 0.01 0.02 0.01
Potentially avoidable hospitalizations (dehydration)
0.02 0.02 0.02 0.01
Potentially avoidable hospitalizations (UTI)
0.06 0.07 0.04 0.04
All-cause ED visits 1.01 1.05 0.82 1.05 Potentially avoidable ED visits 0.38 0.41 0.38 0.44
Potentially avoidable ED visits (all target conditions)
0.11 0.11 0.10 0.11
Potentially avoidable ED visits (pneumonia)
0.02 0.01 0.02 0.01
Potentially avoidable ED visits (CHF) 0.01 0.01 0.01 0.01 Potentially avoidable ED visits (COPD/asthma)
0.01 0.00 0.01 0.02
Potentially avoidable ED visits (skin infection)
0.00 0.01 0.01 0.00
Potentially avoidable ED visits (dehydration)
0.00 0.01 0.01 0.01
Potentially avoidable ED visits (UTI) 0.07 0.06 0.04 0.06 N (Residents) 1,960 3,735 1,702 2,591
NOTES: ECCP = Enhanced Care and Coordination Provider; CHF = congestive heart failure; COPD = chronic obstructive pulmonary disease; UTI = urinary tract infection; ED = Emergency Department. SOURCE: RTI analysis of Medicare claims data (RTI program: PAH2 AV08/pah2_av08_3).
121
6.1.2 Key Medicare Expenditure Outcomes (Average Expenditures per Beneficiary)
In Tables 6-15 through 6-21, we report Medicare expenditures for select services per beneficiary in Group A and Group B, averaged over all residents (users and nonusers) in the ECCP group versus the comparison group in the base year, FY 2016. Specifically, we report average per-beneficiary expenditures for hospitalizations and ED visits—broken down by all-cause, potentially avoidable in general, and potentially avoidable specifically for the six qualifying conditions.
For all states combined, all-cause hospitalization expenditures for Group A ECCP facilities are similar to their matched comparison facilities, with average expenditures of $4,644 per resident in ECCP facilities compared to $4,888 per resident in comparison facilities (Table 6-15). In Group B, all-cause hospitalization expenditures were relatively higher, with an average of $6,165 per resident in the ECCP group and $5,767 per resident in the comparison group. In both Group A and Group B no clear pattern of differences is shown between ECCP and comparison residents in average per-beneficiary expenditures for hospitalizations associated with the six qualifying conditions.
Across individual ECCPs, in Group A, the biggest difference in expenditures for all-cause hospitalizations between ECCP and comparison groups was for Colorado, with an average of $3,046 per resident compared to $4,847 per resident in the comparison group in Texas (Table 6-19). The next biggest gap was in Pennsylvania, with an average of $4,646 per resident in the ECCP group versus $5,955 per resident in the comparison group (Table 6-21).
Across individual ECCPs, in Group B, the biggest differences in expenditures per beneficiary are between the ECCP facilities in Nevada and the comparison facilities in Texas (Table 6-19). The highest average expenditures per resident for all-cause hospitalizations in ECCP and comparison facilities for Group B was in New York, with $9,639 in the ECCP group and $9,935 in the comparison group (Table 6-20).
In Appendix D, we include additional results from statistical tests of the difference in Medicare expenditures in FY 2016 between the ECCP and matched comparison groups for all-cause hospitalizations, potentially avoidable hospitalizations, all-cause ED visits, and potentially avoidable ED visits. The analysis is done in three ways: (1) all states combined; (2) all states combined except for Nevada, Colorado and their comparison state, Texas; and (3) each state individually. A brief summary of the results is also provided.
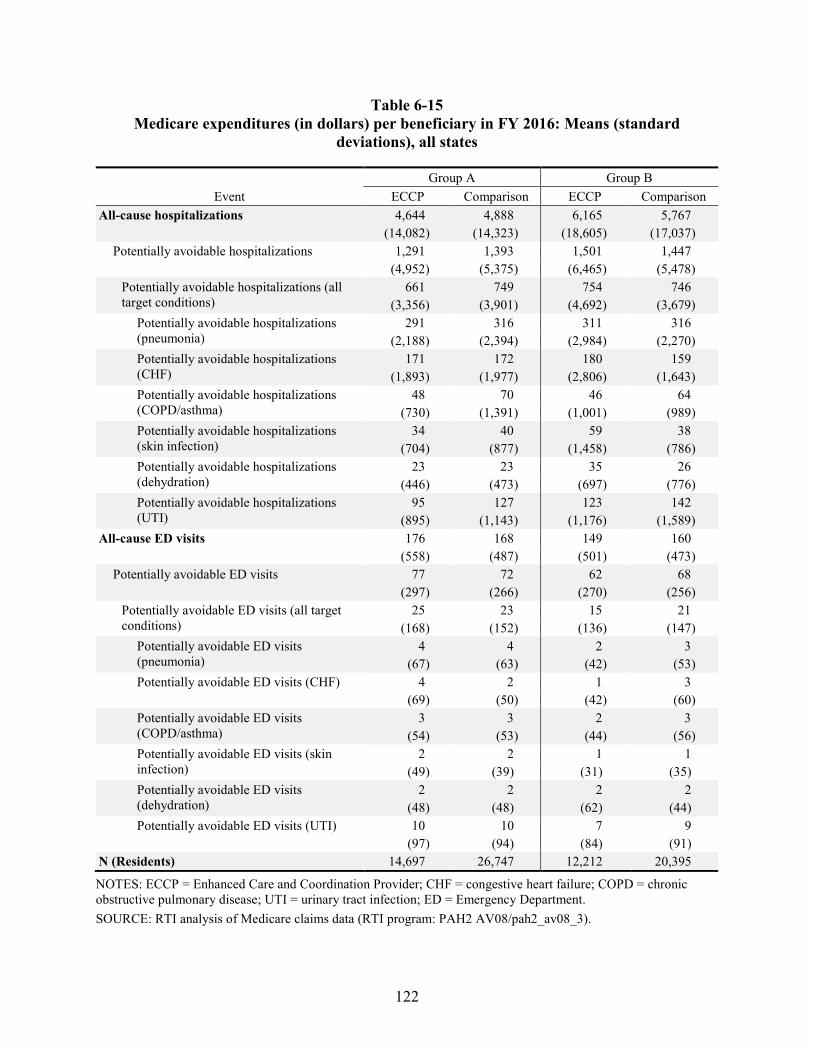
122
Table 6-15 Medicare expenditures (in dollars) per beneficiary in FY 2016: Means (standard
deviations), all states
Event Group A Group B
ECCP Comparison ECCP Comparison All-cause hospitalizations 4,644 4,888 6,165 5,767
(14,082) (14,323) (18,605) (17,037) Potentially avoidable hospitalizations 1,291 1,393 1,501 1,447
(4,952) (5,375) (6,465) (5,478) Potentially avoidable hospitalizations (all target conditions)
661 749 754 746 (3,356) (3,901) (4,692) (3,679)
Potentially avoidable hospitalizations (pneumonia)
291 316 311 316 (2,188) (2,394) (2,984) (2,270)
Potentially avoidable hospitalizations (CHF)
171 172 180 159 (1,893) (1,977) (2,806) (1,643)
Potentially avoidable hospitalizations (COPD/asthma)
48 70 46 64 (730) (1,391) (1,001) (989)
Potentially avoidable hospitalizations (skin infection)
34 40 59 38 (704) (877) (1,458) (786)
Potentially avoidable hospitalizations (dehydration)
23 23 35 26 (446) (473) (697) (776)
Potentially avoidable hospitalizations (UTI)
95 127 123 142 (895) (1,143) (1,176) (1,589)
All-cause ED visits 176 168 149 160 (558) (487) (501) (473)
Potentially avoidable ED visits 77 72 62 68 (297) (266) (270) (256)
Potentially avoidable ED visits (all target conditions)
25 23 15 21 (168) (152) (136) (147)
Potentially avoidable ED visits (pneumonia)
4 4 2 3 (67) (63) (42) (53)
Potentially avoidable ED visits (CHF) 4 2 1 3 (69) (50) (42) (60)
Potentially avoidable ED visits (COPD/asthma)
3 3 2 3 (54) (53) (44) (56)
Potentially avoidable ED visits (skin infection)
2 2 1 1 (49) (39) (31) (35)
Potentially avoidable ED visits (dehydration)
2 2 2 2 (48) (48) (62) (44)
Potentially avoidable ED visits (UTI) 10 10 7 9 (97) (94) (84) (91)
N (Residents) 14,697 26,747 12,212 20,395
NOTES: ECCP = Enhanced Care and Coordination Provider; CHF = congestive heart failure; COPD = chronic obstructive pulmonary disease; UTI = urinary tract infection; ED = Emergency Department. SOURCE: RTI analysis of Medicare claims data (RTI program: PAH2 AV08/pah2_av08_3).
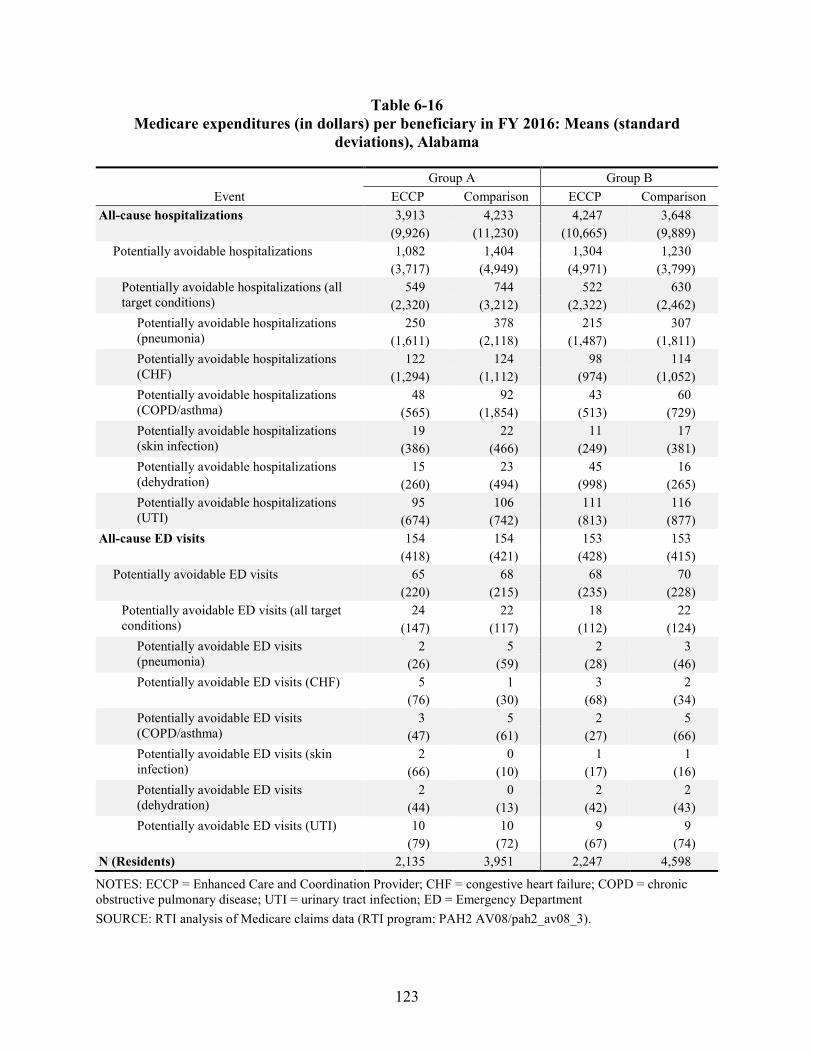
123
Table 6-16 Medicare expenditures (in dollars) per beneficiary in FY 2016: Means (standard
deviations), Alabama
Event Group A Group B
ECCP Comparison ECCP Comparison All-cause hospitalizations 3,913 4,233 4,247 3,648
(9,926) (11,230) (10,665) (9,889) Potentially avoidable hospitalizations 1,082 1,404 1,304 1,230
(3,717) (4,949) (4,971) (3,799) Potentially avoidable hospitalizations (all target conditions)
549 744 522 630 (2,320) (3,212) (2,322) (2,462)
Potentially avoidable hospitalizations (pneumonia)
250 378 215 307 (1,611) (2,118) (1,487) (1,811)
Potentially avoidable hospitalizations (CHF)
122 124 98 114 (1,294) (1,112) (974) (1,052)
Potentially avoidable hospitalizations (COPD/asthma)
48 92 43 60 (565) (1,854) (513) (729)
Potentially avoidable hospitalizations (skin infection)
19 22 11 17 (386) (466) (249) (381)
Potentially avoidable hospitalizations (dehydration)
15 23 45 16 (260) (494) (998) (265)
Potentially avoidable hospitalizations (UTI)
95 106 111 116 (674) (742) (813) (877)
All-cause ED visits 154 154 153 153 (418) (421) (428) (415)
Potentially avoidable ED visits 65 68 68 70 (220) (215) (235) (228)
Potentially avoidable ED visits (all target conditions)
24 22 18 22 (147) (117) (112) (124)
Potentially avoidable ED visits (pneumonia)
2 5 2 3 (26) (59) (28) (46)
Potentially avoidable ED visits (CHF) 5 1 3 2 (76) (30) (68) (34)
Potentially avoidable ED visits (COPD/asthma)
3 5 2 5 (47) (61) (27) (66)
Potentially avoidable ED visits (skin infection)
2 0 1 1 (66) (10) (17) (16)
Potentially avoidable ED visits (dehydration)
2 0 2 2 (44) (13) (42) (43)
Potentially avoidable ED visits (UTI) 10 10 9 9 (79) (72) (67) (74)
N (Residents) 2,135 3,951 2,247 4,598
NOTES: ECCP = Enhanced Care and Coordination Provider; CHF = congestive heart failure; COPD = chronic obstructive pulmonary disease; UTI = urinary tract infection; ED = Emergency Department SOURCE: RTI analysis of Medicare claims data (RTI program: PAH2 AV08/pah2_av08_3).

124
Table 6-17 Medicare expenditures (in dollars) per beneficiary in FY 2016: Means (standard
deviations), Indiana
Event Group A Group B
ECCP Comparison ECCP Comparison All-cause hospitalizations 3,543 3,573 3,811 3,831 (9,430) (9,759) (11,190) (12,910)
Potentially avoidable hospitalizations 1,247 977 1,243 1,037 (4,560) (3,708) (4,873) (3,630)
Potentially avoidable hospitalizations (all target conditions)
606 471 485 501 (3,049) (2,274) (2,574) (2,205)
Potentially avoidable hospitalizations (pneumonia)
250 225 226 220 (2,117) (1,627) (2,084) (1,515)
Potentially avoidable hospitalizations (CHF)
165 98 95 117 (1,447) (920) (984) (1,051)
Potentially avoidable hospitalizations (COPD/asthma)
70 36 37 44 (850) (684) (756) (729)
Potentially avoidable hospitalizations (skin infection)
27 22 22 19 (580) (490) (404) (376)
Potentially avoidable hospitalizations (dehydration)
11 6 29 7 (406) (162) (481) (192)
Potentially avoidable hospitalizations (UTI)
83 83 75 94 (748) (804) (705) (787)
All-cause ED visits 178 174 151 191 (537) (483) (471) (506)
Potentially avoidable ED visits 88 78 68 88 (291) (274) (266) (293)
Potentially avoidable ED visits (all target conditions)
29 27 15 36 (172) (165) (132) (205)
Potentially avoidable ED visits (pneumonia)
6 5 3 7 (76) (70) (63) (82)
Potentially avoidable ED visits (CHF) 6 2 1 6 (78) (55) (25) (103)
Potentially avoidable ED visits (COPD/asthma)
3 3 3 4 (59) (49) (74) (83)
Potentially avoidable ED visits (skin infection)
2 2 1 3 (30) (36) (43) (62)
Potentially avoidable ED visits (dehydration)
2 3 1 1 (46) (54) (17) (38)
Potentially avoidable ED visits (UTI) 10 12 6 15 (101) (109) (67) (109)
N (Residents) 2,238 4,279 1,761 2,113
NOTES: ECCP = Enhanced Care and Coordination Provider; CHF = congestive heart failure; COPD = chronic obstructive pulmonary disease; UTI = urinary tract infection; ED = Emergency Department. SOURCE: RTI analysis of Medicare claims data (RTI program: PAH2 AV08/pah2_av08_3).
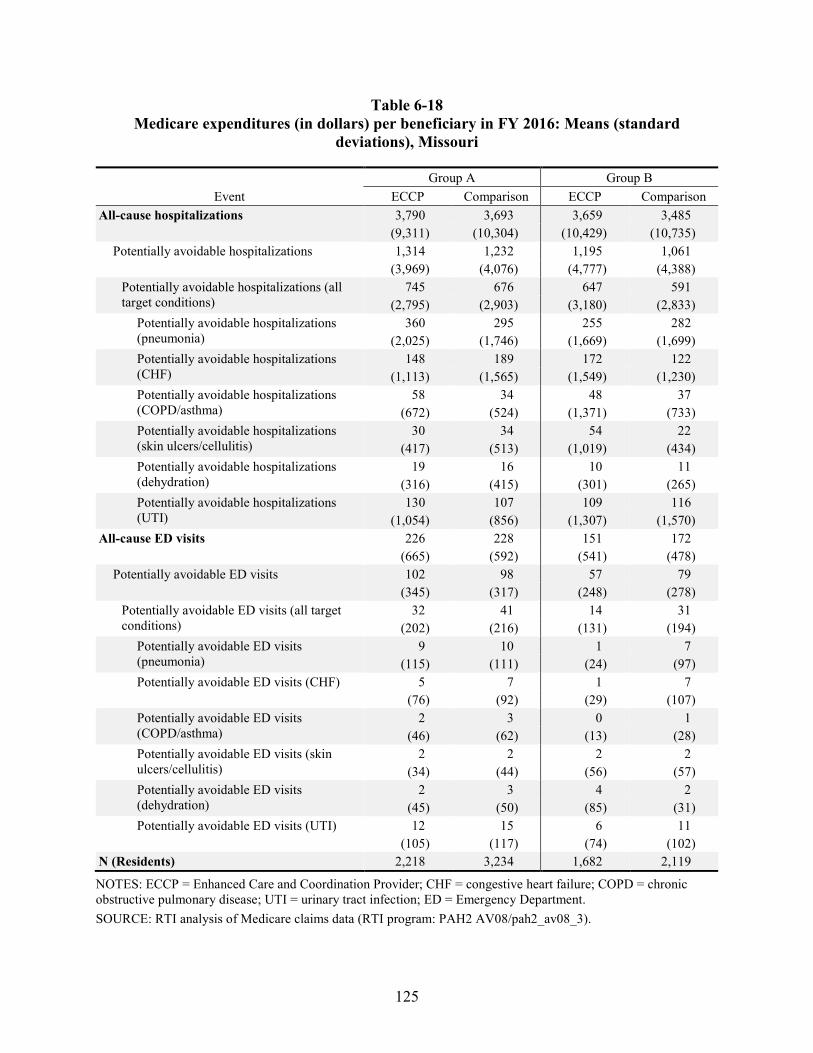
125
Table 6-18 Medicare expenditures (in dollars) per beneficiary in FY 2016: Means (standard
deviations), Missouri
Event Group A Group B
ECCP Comparison ECCP Comparison All-cause hospitalizations 3,790 3,693 3,659 3,485
(9,311) (10,304) (10,429) (10,735) Potentially avoidable hospitalizations 1,314 1,232 1,195 1,061
(3,969) (4,076) (4,777) (4,388) Potentially avoidable hospitalizations (all target conditions)
745 676 647 591 (2,795) (2,903) (3,180) (2,833)
Potentially avoidable hospitalizations (pneumonia)
360 295 255 282 (2,025) (1,746) (1,669) (1,699)
Potentially avoidable hospitalizations (CHF)
148 189 172 122 (1,113) (1,565) (1,549) (1,230)
Potentially avoidable hospitalizations (COPD/asthma)
58 34 48 37 (672) (524) (1,371) (733)
Potentially avoidable hospitalizations (skin ulcers/cellulitis)
30 34 54 22 (417) (513) (1,019) (434)
Potentially avoidable hospitalizations (dehydration)
19 16 10 11 (316) (415) (301) (265)
Potentially avoidable hospitalizations (UTI)
130 107 109 116 (1,054) (856) (1,307) (1,570)
All-cause ED visits 226 228 151 172 (665) (592) (541) (478)
Potentially avoidable ED visits 102 98 57 79 (345) (317) (248) (278)
Potentially avoidable ED visits (all target conditions)
32 41 14 31 (202) (216) (131) (194)
Potentially avoidable ED visits (pneumonia)
9 10 1 7 (115) (111) (24) (97)
Potentially avoidable ED visits (CHF) 5 7 1 7 (76) (92) (29) (107)
Potentially avoidable ED visits (COPD/asthma)
2 3 0 1 (46) (62) (13) (28)
Potentially avoidable ED visits (skin ulcers/cellulitis)
2 2 2 2 (34) (44) (56) (57)
Potentially avoidable ED visits (dehydration)
2 3 4 2 (45) (50) (85) (31)
Potentially avoidable ED visits (UTI) 12 15 6 11 (105) (117) (74) (102)
N (Residents) 2,218 3,234 1,682 2,119
NOTES: ECCP = Enhanced Care and Coordination Provider; CHF = congestive heart failure; COPD = chronic obstructive pulmonary disease; UTI = urinary tract infection; ED = Emergency Department. SOURCE: RTI analysis of Medicare claims data (RTI program: PAH2 AV08/pah2_av08_3).
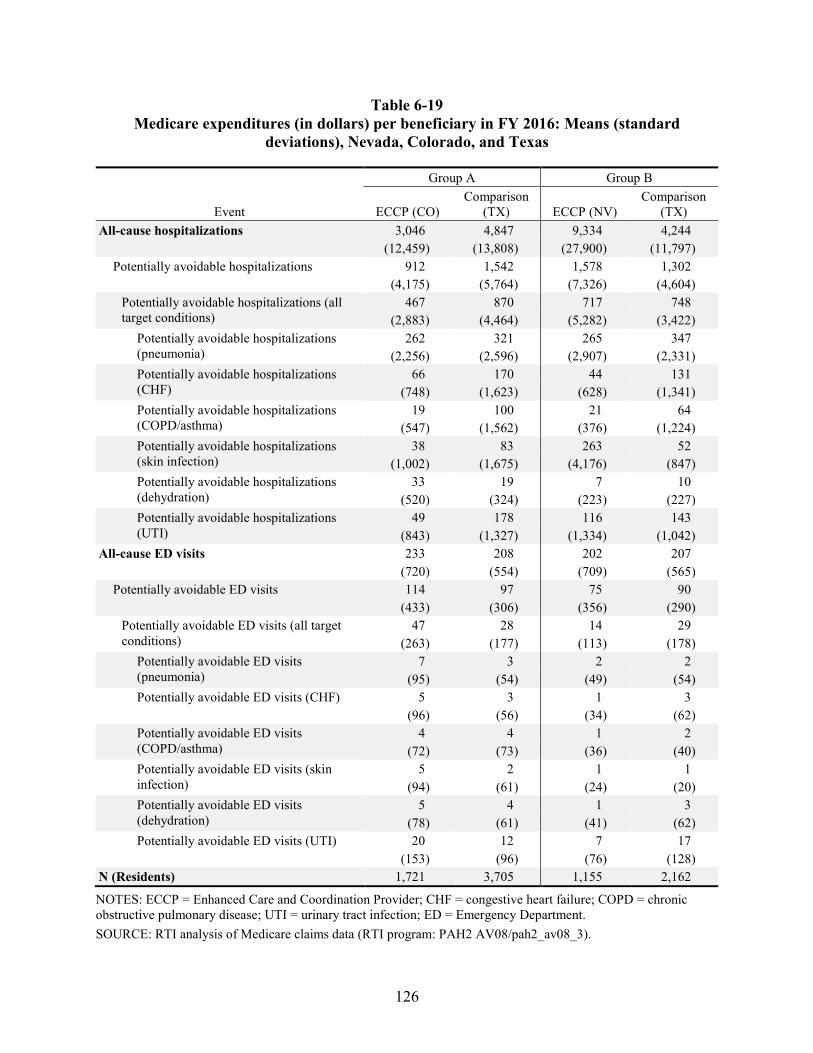
126
Table 6-19 Medicare expenditures (in dollars) per beneficiary in FY 2016: Means (standard
deviations), Nevada, Colorado, and Texas
Event
Group A Group B
ECCP (CO) Comparison
(TX) ECCP (NV) Comparison
(TX) All-cause hospitalizations 3,046 4,847 9,334 4,244
(12,459) (13,808) (27,900) (11,797) Potentially avoidable hospitalizations 912 1,542 1,578 1,302
(4,175) (5,764) (7,326) (4,604) Potentially avoidable hospitalizations (all target conditions)
467 870 717 748 (2,883) (4,464) (5,282) (3,422)
Potentially avoidable hospitalizations (pneumonia)
262 321 265 347 (2,256) (2,596) (2,907) (2,331)
Potentially avoidable hospitalizations (CHF)
66 170 44 131 (748) (1,623) (628) (1,341)
Potentially avoidable hospitalizations (COPD/asthma)
19 100 21 64 (547) (1,562) (376) (1,224)
Potentially avoidable hospitalizations (skin infection)
38 83 263 52 (1,002) (1,675) (4,176) (847)
Potentially avoidable hospitalizations (dehydration)
33 19 7 10 (520) (324) (223) (227)
Potentially avoidable hospitalizations (UTI)
49 178 116 143 (843) (1,327) (1,334) (1,042)
All-cause ED visits 233 208 202 207 (720) (554) (709) (565)
Potentially avoidable ED visits 114 97 75 90 (433) (306) (356) (290)
Potentially avoidable ED visits (all target conditions)
47 28 14 29 (263) (177) (113) (178)
Potentially avoidable ED visits (pneumonia)
7 3 2 2 (95) (54) (49) (54)
Potentially avoidable ED visits (CHF) 5 3 1 3 (96) (56) (34) (62)
Potentially avoidable ED visits (COPD/asthma)
4 4 1 2 (72) (73) (36) (40)
Potentially avoidable ED visits (skin infection)
5 2 1 1 (94) (61) (24) (20)
Potentially avoidable ED visits (dehydration)
5 4 1 3 (78) (61) (41) (62)
Potentially avoidable ED visits (UTI) 20 12 7 17 (153) (96) (76) (128)
N (Residents) 1,721 3,705 1,155 2,162
NOTES: ECCP = Enhanced Care and Coordination Provider; CHF = congestive heart failure; COPD = chronic obstructive pulmonary disease; UTI = urinary tract infection; ED = Emergency Department. SOURCE: RTI analysis of Medicare claims data (RTI program: PAH2 AV08/pah2_av08_3).
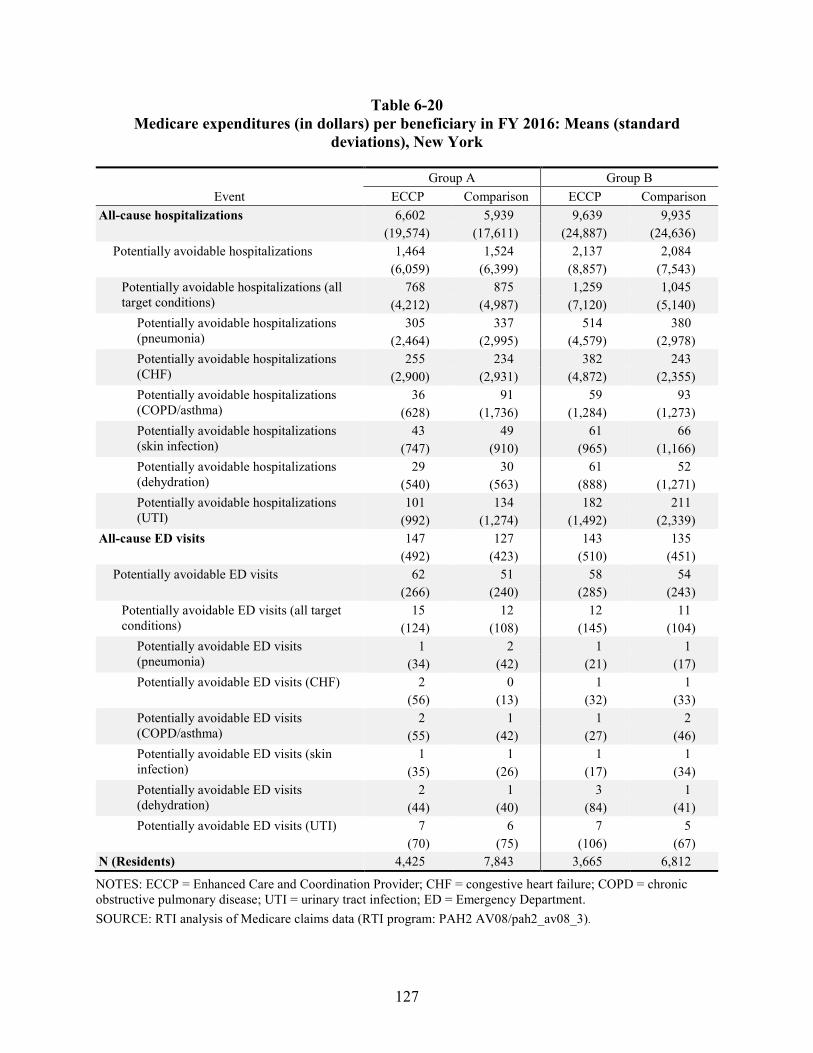
127
Table 6-20 Medicare expenditures (in dollars) per beneficiary in FY 2016: Means (standard
deviations), New York
Event Group A Group B
ECCP Comparison ECCP Comparison All-cause hospitalizations 6,602 5,939 9,639 9,935
(19,574) (17,611) (24,887) (24,636) Potentially avoidable hospitalizations 1,464 1,524 2,137 2,084
(6,059) (6,399) (8,857) (7,543) Potentially avoidable hospitalizations (all target conditions)
768 875 1,259 1,045 (4,212) (4,987) (7,120) (5,140)
Potentially avoidable hospitalizations (pneumonia)
305 337 514 380 (2,464) (2,995) (4,579) (2,978)
Potentially avoidable hospitalizations (CHF)
255 234 382 243 (2,900) (2,931) (4,872) (2,355)
Potentially avoidable hospitalizations (COPD/asthma)
36 91 59 93 (628) (1,736) (1,284) (1,273)
Potentially avoidable hospitalizations (skin infection)
43 49 61 66 (747) (910) (965) (1,166)
Potentially avoidable hospitalizations (dehydration)
29 30 61 52 (540) (563) (888) (1,271)
Potentially avoidable hospitalizations (UTI)
101 134 182 211 (992) (1,274) (1,492) (2,339)
All-cause ED visits 147 127 143 135 (492) (423) (510) (451)
Potentially avoidable ED visits 62 51 58 54 (266) (240) (285) (243)
Potentially avoidable ED visits (all target conditions)
15 12 12 11 (124) (108) (145) (104)
Potentially avoidable ED visits (pneumonia)
1 2 1 1 (34) (42) (21) (17)
Potentially avoidable ED visits (CHF) 2 0 1 1 (56) (13) (32) (33)
Potentially avoidable ED visits (COPD/asthma)
2 1 1 2 (55) (42) (27) (46)
Potentially avoidable ED visits (skin infection)
1 1 1 1 (35) (26) (17) (34)
Potentially avoidable ED visits (dehydration)
2 1 3 1 (44) (40) (84) (41)
Potentially avoidable ED visits (UTI) 7 6 7 5 (70) (75) (106) (67)
N (Residents) 4,425 7,843 3,665 6,812
NOTES: ECCP = Enhanced Care and Coordination Provider; CHF = congestive heart failure; COPD = chronic obstructive pulmonary disease; UTI = urinary tract infection; ED = Emergency Department. SOURCE: RTI analysis of Medicare claims data (RTI program: PAH2 AV08/pah2_av08_3).

128
Table 6-21 Medicare expenditures (in dollars) per beneficiary in FY 2016: Means (standard
deviations), Pennsylvania
Event Group A Group B
ECCP Comparison ECCP Comparison All-cause hospitalizations 4,646 5,955 3,982 3,287
(12,860) (16,952) (13,454) (10,025) Potentially avoidable hospitalizations 1,486 1,575 907 925
(5,372) (5,625) (3,667) (3,896) Potentially avoidable hospitalizations (all target conditions)
682 753 382 489 (3,428) (3,568) (2,262) (2,374)
Potentially avoidable hospitalizations (pneumonia)
299 324 175 245 (2,268) (2,260) (1,654) (1,629)
Potentially avoidable hospitalizations (CHF)
159 164 41 103 (1,322) (1,711) (618) (1,023)
Potentially avoidable hospitalizations (COPD/asthma)
60 48 47 36 (1,078) (835) (862) (606)
Potentially avoidable hospitalizations (skin infection)
39 25 20 18 (915) (500) (331) (399)
Potentially avoidable hospitalizations (dehydration)
30 37 21 17 (473) (626) (327) (487)
Potentially avoidable hospitalizations (UTI)
96 155 78 70 (876) (1,496) (918) (830)
All-cause ED visits 157 167 118 162 (556) (505) (374) (504)
Potentially avoidable ED visits 53 63 53 63 (227) (261) (231) (254)
Potentially avoidable ED visits (all target conditions)
15 21 20 19 (108) (157) (167) (152)
Potentially avoidable ED visits (pneumonia)
2 2 4 2 (33) (44) (64) (45)
Potentially avoidable ED visits (CHF) 1 2 3 2 (30) (48) (49) (45)
Potentially avoidable ED visits (COPD/asthma)
1 1 3 4 (40) (33) (67) (65)
Potentially avoidable ED visits (skin infection)
0 2 1 0 (13) (53) (23) (13)
Potentially avoidable ED visits (dehydration)
1 3 2 2 (16) (62) (41) (47)
Potentially avoidable ED visits (UTI) 9 11 7 9 (86) (110) (84) (105)
N (Residents) 1,960 3,735 1,702 2,591
NOTES: ECCP = Enhanced Care and Coordination Provider; CHF = congestive heart failure; COPD = chronic obstructive pulmonary disease; UTI = urinary tract infection; ED = Emergency Department. SOURCE: RTI analysis of Medicare claims data (RTI program: PAH2 AV08/pah2_av08_3).
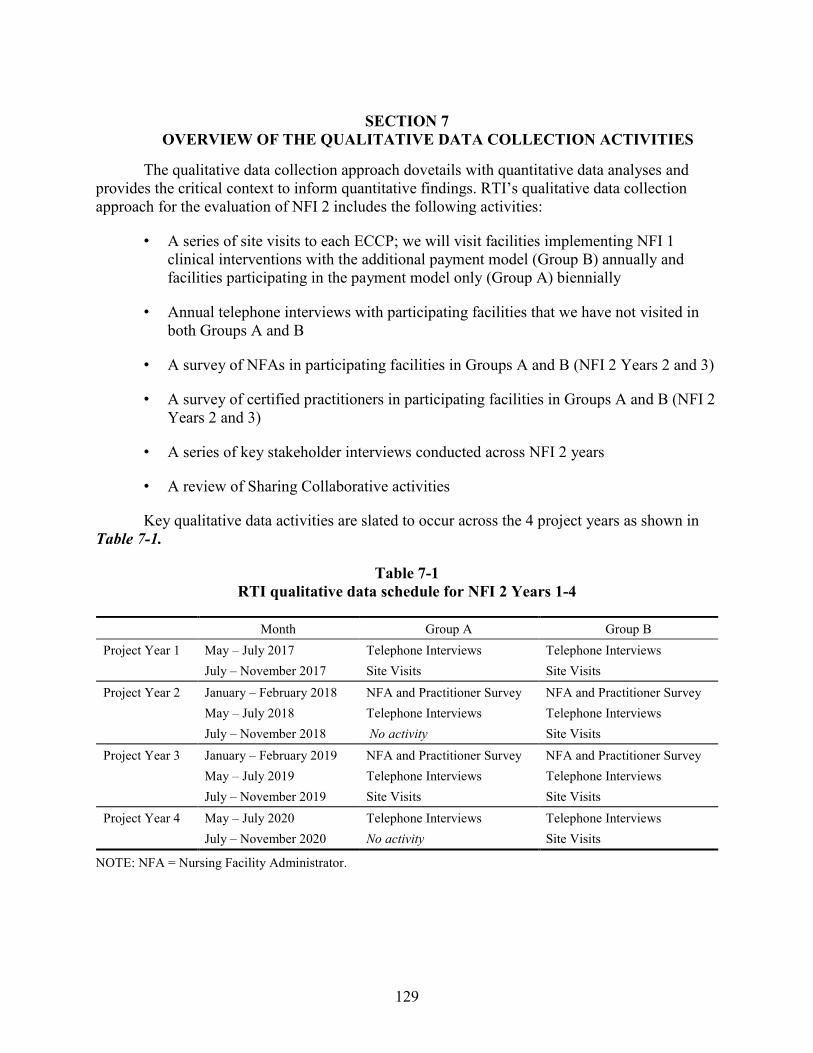
129
SECTION 7 OVERVIEW OF THE QUALITATIVE DATA COLLECTION ACTIVITIES
The qualitative data collection approach dovetails with quantitative data analyses and provides the critical context to inform quantitative findings. RTI’s qualitative data collection approach for the evaluation of NFI 2 includes the following activities:
• A series of site visits to each ECCP; we will visit facilities implementing NFI 1 clinical interventions with the additional payment model (Group B) annually and facilities participating in the payment model only (Group A) biennially
• Annual telephone interviews with participating facilities that we have not visited in both Groups A and B
• A survey of NFAs in participating facilities in Groups A and B (NFI 2 Years 2 and 3)
• A survey of certified practitioners in participating facilities in Groups A and B (NFI 2 Years 2 and 3)
• A series of key stakeholder interviews conducted across NFI 2 years
• A review of Sharing Collaborative activities
Key qualitative data activities are slated to occur across the 4 project years as shown in Table 7-1.
Table 7-1 RTI qualitative data schedule for NFI 2 Years 1-4
Month Group A Group B Project Year 1 May – July 2017 Telephone Interviews Telephone Interviews
July – November 2017 Site Visits Site Visits Project Year 2 January – February 2018 NFA and Practitioner Survey NFA and Practitioner Survey
May – July 2018 Telephone Interviews Telephone Interviews July – November 2018 No activity Site Visits
Project Year 3 January – February 2019 NFA and Practitioner Survey NFA and Practitioner Survey May – July 2019 Telephone Interviews Telephone Interviews July – November 2019 Site Visits Site Visits
Project Year 4 May – July 2020 Telephone Interviews Telephone Interviews July – November 2020 No activity Site Visits
NOTE: NFA = Nursing Facility Administrator.
130
In addition, the evaluation state teams will also review ECCP Clinical Narrative Reports and other information, such as practitioner lists and participation data provided by CMS and the NFI 2 implementation contractor, Social and Scientific Systems, and their subcontractor, Telligen (SSS-T).
7.1 Site Visits and Telephone Interviews
The site visits and telephone interviews serve as a means of collecting qualitative data to monitor and evaluate NFI 2 implementation and outcomes for Group A and Group B facilities. RTI seeks to understand the context in which each ECCP delivers new NFI 2 efforts toward improving resident health outcomes, decreasing avoidable hospitalizations, smoothing transitions between acute care hospitals and nursing facilities, and reducing overall health care spending. In addition, site visits and telephone interviews explore the billing processes and financial components of the NFI 2 Initiative among participating facilities and practitioners, while also exploring how the financial components and the new focus on six qualifying conditions may affect care management and related practices in the participating facilities. RTI conducts annual telephone interviews with participating facilities that are not visited during the site visits, speaking with one person who is the most knowledgeable about the Initiative, such as a director of nursing (DON), nursing facility administrator (NFA), or business office manager.
RTI also conducts interviews with all key staff in each ECCP, including facility-based ECCP staff in each facility we visit. Data collection includes information on model design changes related to payment component introduction, implementation timetable and experience, provider training and support, ECCP staffing changes, data collection, and detailed descriptions of the Group B clinical interventions and how they were adapted for NFI 2. During the interviews, we gather information regarding perceived barriers to implementation arising from policies or regulations of state, local, commercial, and other entities, including hospitals, and any new challenges to accepting new practices (e.g., liability or family concerns).
7.2 Web-based Survey of Participating Nursing Facilities
NFI 2 qualitative data collection survey activities include two web-based surveys: the NFA Survey and the Practitioner Survey. Overall, the goal of these web-based surveys is to obtain standardized information from participating facilities’ administrators and practitioners about the impact of the Initiative. The primary objective of the NFA Survey is to collect information about facility activities and how facilities are responding to the Initiative. The Practitioner Survey focuses on the financial impact of NFI 2, training the practitioners have received on the new billing codes, and their experiences and opinions about the new billing and treatment practices.
7.3 Key Stakeholder Telephone Interviews
RTI also conducts a series of interviews with key state administrators and other stakeholders to examine overlaps in potentially competing or complementary initiatives in the NFI 2 ECCP states (i.e., in addition to information from the CMS MDM system), such as Partnership for Patients, Accountable Care Organizations, State Innovation Models, the Financial Alignment Initiative, and Round Two of Health Care Innovation Awards. Key stakeholder interviews explore similar issues across states and build upon our NFI 1 and NFI 2 site visit
131
findings to understand the policy environment and the types of programs that affect avoidable hospitalization reduction, apart from or in conjunction with, this Initiative.
7.4 Sharing Collaborative
RTI also participates in the Sharing Collaborative calls with all the ECCPs that provide a venue for ECCP staff to discuss issues of common concern, including their successes, lessons learned, barriers encountered, and other findings that may be useful to other ECCPs. We observe and monitor the Sharing Collaborative activities, including noting the ECCP and facility staff attending, the topics presented, and the materials disseminated. We also observe and assess materials and activities on the NFI Connect website.
7.5 Qualitative Data Collection Activities Accomplished by July 21, 2017
7.5.1 Site Visits
This section describes the site visit activities as of July 21, 2017. In preparation for site visits and telephone interviews, we requested and received from CMS and ECCPs updated lists of key contacts. This contact information was used to update the RTI Access database of participating facilities that we use to track all relevant facility-level information. The six evaluation state teams trained all the site visit staff, created interactive state maps, created a standardized internal data collection summary form, and developed the following materials (Appendix G):
• Summary of the Evaluation, to be distributed during the site visit
• Summary of RTI confidentiality procedures, to distribute during the site visit
• Standardized scheduling scripts for both site visits and telephone interviews
• Interview protocols for both site visits and telephone interviews
The interview protocols were reviewed and approved by our CMS Contracting Officer Representative (COR) on March 6, 2017. As of July 21, 2017, the RTI qualitative data collection team has planned, completed scheduling, and arranged the travel logistics for site visits to all participating ECCPs between July and November 2017.
Each state team selected four Group A and four Group B facilities for site visits in NFI 2 Year 1. In no particular order, facility selection criteria included facility bed size, ownership type, five-star quality rating, deficiency history, and travel logistics. For Group B facilities that were participants in the previous NFI 1 Initiative, state teams also took into consideration prior site-visit history. After facilities were selected by each state team, the facility list was sent to the CMS COR for approval, and then it was shared with the implementation contractor, SSS-T, to mitigate ECCP and facility burden caused by two contractors conducting concurrent site visits during the same summer/fall time frame. Each site visit team spends 1 day visiting the ECCP and 4 consecutive days visiting each of the four participating Group A or Group B facilities.
132
During the ECCP site visits, we ascertain if the ECCP’s organizational structure has been modified since NFI 1. We interview ECCP leadership regarding any new supports or barriers that have emerged; communication pathways that have developed between ECCP staff and/or facility staff; internal and external data exchanges; and infrastructure modifications for data collection and project implementation. We are interested to learn about efforts in improving communications with providers through NFI 2, particularly in the context of the six qualifying conditions that are the focus of NFI 2. During the ECCP interviews we also gather information regarding perceived barriers to implementation arising from policies or regulations of state, local, commercial, and other entities, including hospitals, and any new challenges to accepting new practices (e.g., liability or family concerns). Other topics may include data collection processes, billing and claims-related concerns, unintended consequences of the project and its spillover effects (positive and negative), lessons learned and major challenges, and, if applicable, reasons for facilities withdrawing from the Initiative. When possible, we interview ECCP partners, subcontractors, or stakeholders.
At each Group B facility, the site visit team conducts multiple interviews, ranging in length by role from 15 to 45 minutes long, with DONs, NFAs, medical directors, primary care providers (PCPs) of record, nursing facility staff involved in resident transfers, direct care staff, residents and family members, if available, and possibly others. For Group A facilities, the team conducts multiple interviews of similar length, but the focus is more on identification and treatment of the six qualifying conditions and the new billing processes in NFI 2. We are also interested to know what kinds of processes and capabilities facilities in Group A implemented to prepare for NFI 2 and how well these are working since the readiness reviews were completed. Interviewees include NFAs, DONs, medical directors, PCPs of record, as well as business office staff, MDS coordinators, and other relevant staff members involved with billing processes. RTI teams also talk to residents and families when possible. Special care is given to reaching practitioners, as this population provides integral feedback regarding the payment processes and treatment of residents who have the six qualifying conditions. RTI may rely on the survey sampling frame to recruit practitioners for in-person interviews during site visits.
All interviews conducted for NFI 2 will be tracked in our Access database. RTI teams will schedule a debrief meeting with CMS and RTI project leadership within 30 days of completing the site visit. In the field, the state teams use a daily discussion guide template and populate it with new information each day in preparation for the CMS debriefing calls. This information will be combined with the summary form data collected in site visited facilities. As in prior years, we will pare down this document to share with the team and CMS prior to the debrief. This document will serve in place of the debrief call minutes.
7.5.2 Telephone Interviews
Between May 1 and July 21, 2017, RTI completed 95 telephone interviews with participating Group A and Group B facilities across all six ECCPs. Attempts were made to reach all 251 participating facilities, and 38 percent (N=95) were completed. Most interviewees were NFAs or DONs. Each interview ranged from 30 to 45 minutes. Each participant received the summary RTI evaluation explanatory document and the summary of RTI confidentiality procedures by e-mail prior to the interview. Each interview team included an interviewer and a
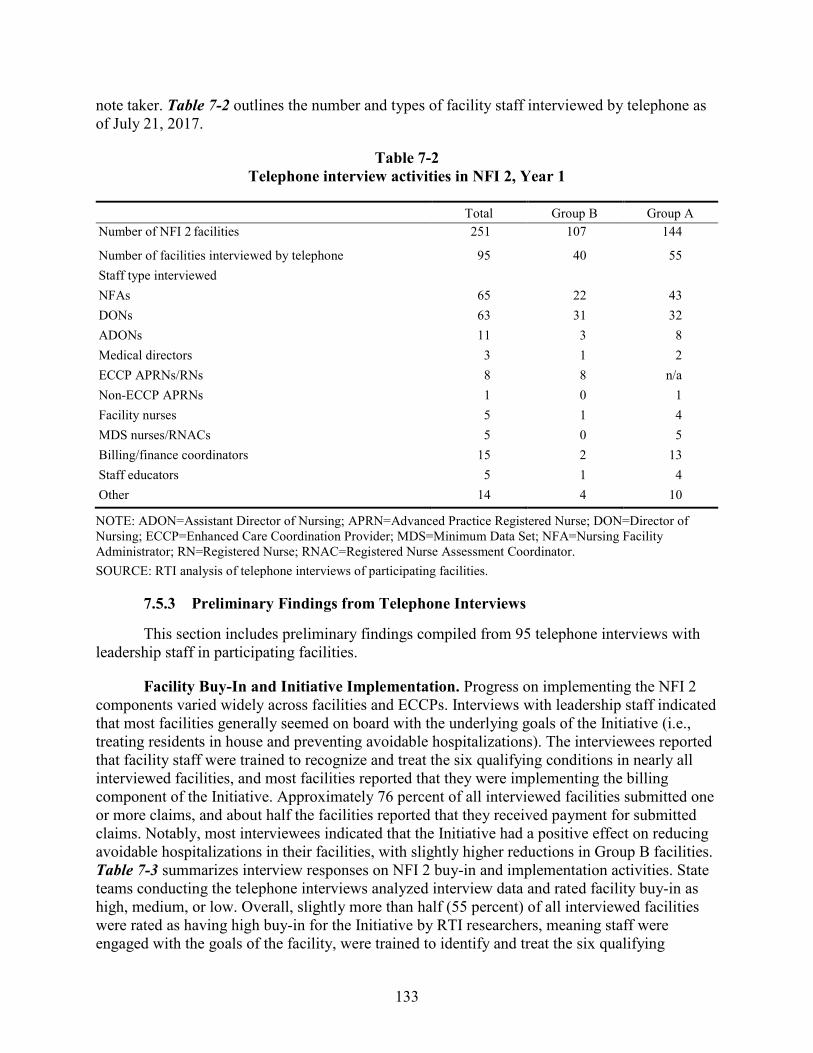
133
note taker. Table 7-2 outlines the number and types of facility staff interviewed by telephone as of July 21, 2017.
Table 7-2 Telephone interview activities in NFI 2, Year 1
Total Group B Group A Number of NFI 2 facilities 251 107 144
Number of facilities interviewed by telephone 95 40 55 Staff type interviewed NFAs 65 22 43 DONs 63 31 32 ADONs 11 3 8 Medical directors 3 1 2 ECCP APRNs/RNs 8 8 n/a Non-ECCP APRNs 1 0 1 Facility nurses 5 1 4 MDS nurses/RNACs 5 0 5 Billing/finance coordinators 15 2 13 Staff educators 5 1 4 Other 14 4 10
NOTE: ADON=Assistant Director of Nursing; APRN=Advanced Practice Registered Nurse; DON=Director of Nursing; ECCP=Enhanced Care Coordination Provider; MDS=Minimum Data Set; NFA=Nursing Facility Administrator; RN=Registered Nurse; RNAC=Registered Nurse Assessment Coordinator. SOURCE: RTI analysis of telephone interviews of participating facilities.
7.5.3 Preliminary Findings from Telephone Interviews
This section includes preliminary findings compiled from 95 telephone interviews with leadership staff in participating facilities.
Facility Buy-In and Initiative Implementation. Progress on implementing the NFI 2 components varied widely across facilities and ECCPs. Interviews with leadership staff indicated that most facilities generally seemed on board with the underlying goals of the Initiative (i.e., treating residents in house and preventing avoidable hospitalizations). The interviewees reported that facility staff were trained to recognize and treat the six qualifying conditions in nearly all interviewed facilities, and most facilities reported that they were implementing the billing component of the Initiative. Approximately 76 percent of all interviewed facilities submitted one or more claims, and about half the facilities reported that they received payment for submitted claims. Notably, most interviewees indicated that the Initiative had a positive effect on reducing avoidable hospitalizations in their facilities, with slightly higher reductions in Group B facilities. Table 7-3 summarizes interview responses on NFI 2 buy-in and implementation activities. State teams conducting the telephone interviews analyzed interview data and rated facility buy-in as high, medium, or low. Overall, slightly more than half (55 percent) of all interviewed facilities were rated as having high buy-in for the Initiative by RTI researchers, meaning staff were engaged with the goals of the facility, were trained to identify and treat the six qualifying
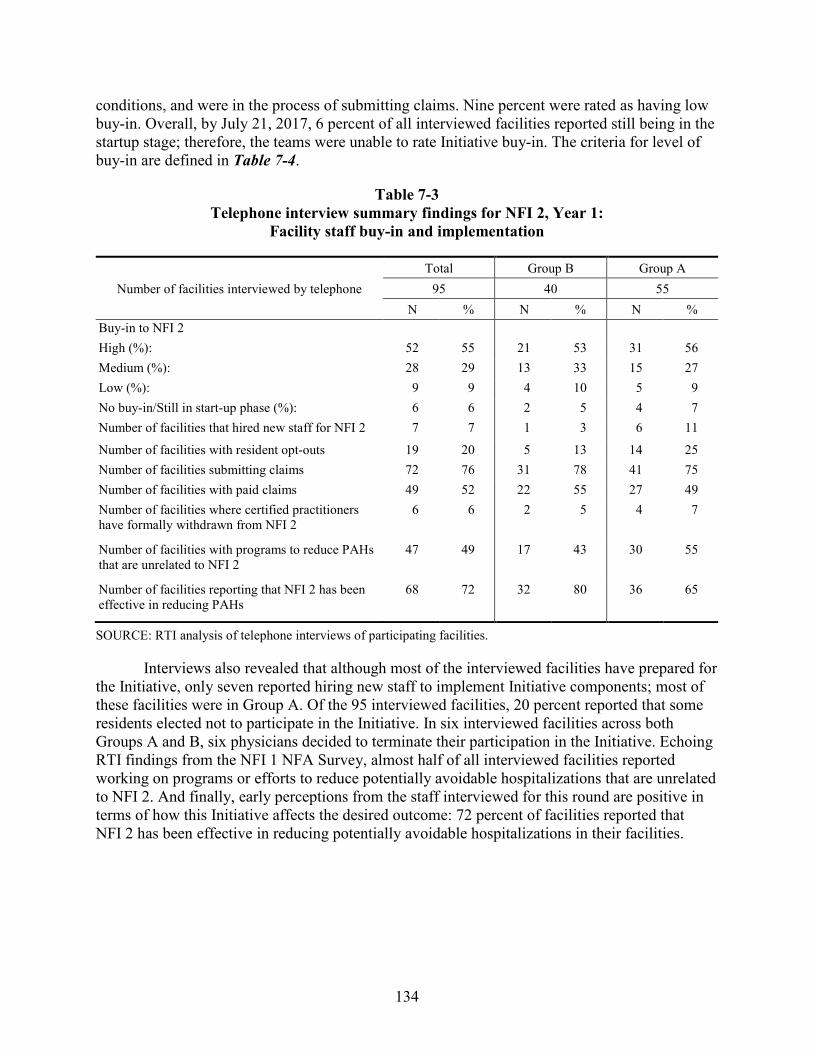
134
conditions, and were in the process of submitting claims. Nine percent were rated as having low buy-in. Overall, by July 21, 2017, 6 percent of all interviewed facilities reported still being in the startup stage; therefore, the teams were unable to rate Initiative buy-in. The criteria for level of buy-in are defined in Table 7-4.
Table 7-3 Telephone interview summary findings for NFI 2, Year 1:
Facility staff buy-in and implementation
Total Group B Group A Number of facilities interviewed by telephone 95 40 55
N % N % N % Buy-in to NFI 2 High (%): 52 55 21 53 31 56 Medium (%): 28 29 13 33 15 27 Low (%): 9 9 4 10 5 9 No buy-in/Still in start-up phase (%): 6 6 2 5 4 7 Number of facilities that hired new staff for NFI 2 7 7 1 3 6 11
Number of facilities with resident opt-outs 19 20 5 13 14 25 Number of facilities submitting claims 72 76 31 78 41 75 Number of facilities with paid claims 49 52 22 55 27 49 Number of facilities where certified practitioners have formally withdrawn from NFI 2
6 6 2 5 4 7
Number of facilities with programs to reduce PAHs that are unrelated to NFI 2
47 49 17 43 30 55
Number of facilities reporting that NFI 2 has been effective in reducing PAHs
68 72 32 80 36 65
SOURCE: RTI analysis of telephone interviews of participating facilities.
Interviews also revealed that although most of the interviewed facilities have prepared for the Initiative, only seven reported hiring new staff to implement Initiative components; most of these facilities were in Group A. Of the 95 interviewed facilities, 20 percent reported that some residents elected not to participate in the Initiative. In six interviewed facilities across both Groups A and B, six physicians decided to terminate their participation in the Initiative. Echoing RTI findings from the NFI 1 NFA Survey, almost half of all interviewed facilities reported working on programs or efforts to reduce potentially avoidable hospitalizations that are unrelated to NFI 2. And finally, early perceptions from the staff interviewed for this round are positive in terms of how this Initiative affects the desired outcome: 72 percent of facilities reported that NFI 2 has been effective in reducing potentially avoidable hospitalizations in their facilities.
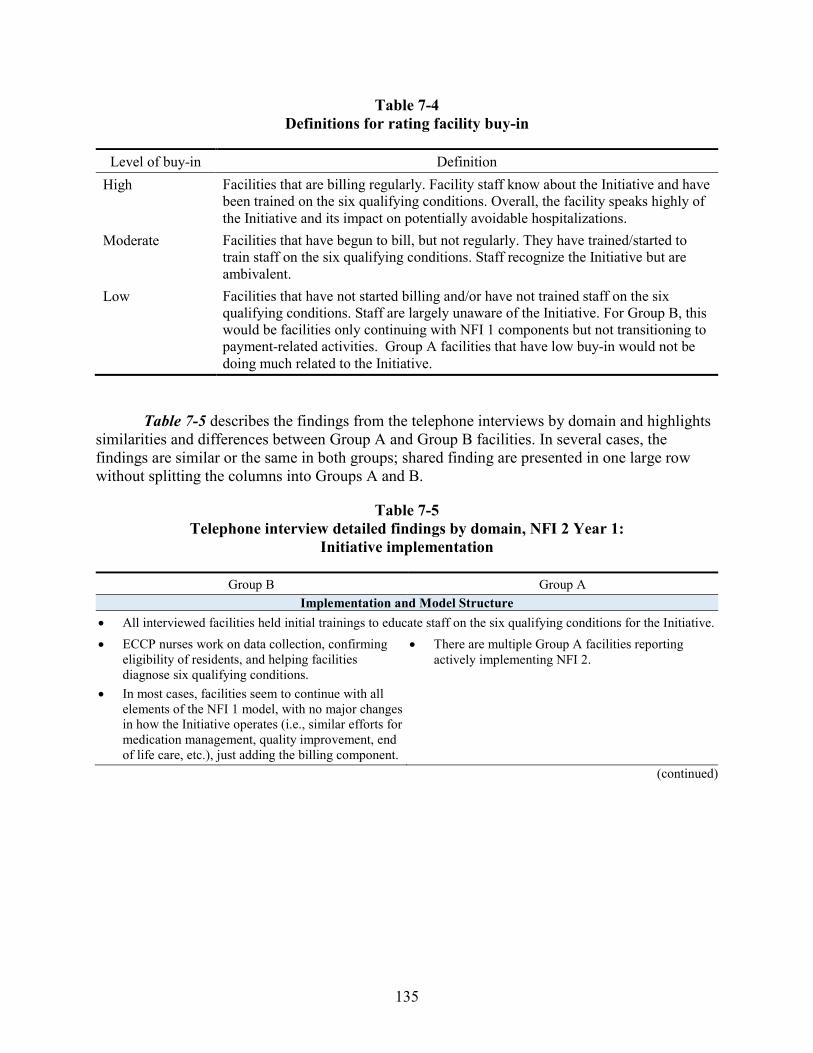
135
Table 7-4 Definitions for rating facility buy-in
Level of buy-in Definition High Facilities that are billing regularly. Facility staff know about the Initiative and have
been trained on the six qualifying conditions. Overall, the facility speaks highly of the Initiative and its impact on potentially avoidable hospitalizations.
Moderate Facilities that have begun to bill, but not regularly. They have trained/started to train staff on the six qualifying conditions. Staff recognize the Initiative but are ambivalent.
Low Facilities that have not started billing and/or have not trained staff on the six qualifying conditions. Staff are largely unaware of the Initiative. For Group B, this would be facilities only continuing with NFI 1 components but not transitioning to payment-related activities. Group A facilities that have low buy-in would not be doing much related to the Initiative.
Table 7-5 describes the findings from the telephone interviews by domain and highlights similarities and differences between Group A and Group B facilities. In several cases, the findings are similar or the same in both groups; shared finding are presented in one large row without splitting the columns into Groups A and B.
Table 7-5 Telephone interview detailed findings by domain, NFI 2 Year 1:
Initiative implementation
Group B Group A Implementation and Model Structure
• All interviewed facilities held initial trainings to educate staff on the six qualifying conditions for the Initiative. • ECCP nurses work on data collection, confirming
eligibility of residents, and helping facilities diagnose six qualifying conditions.
• In most cases, facilities seem to continue with all elements of the NFI 1 model, with no major changes in how the Initiative operates (i.e., similar efforts for medication management, quality improvement, end of life care, etc.), just adding the billing component.
• There are multiple Group A facilities reporting actively implementing NFI 2.
(continued)
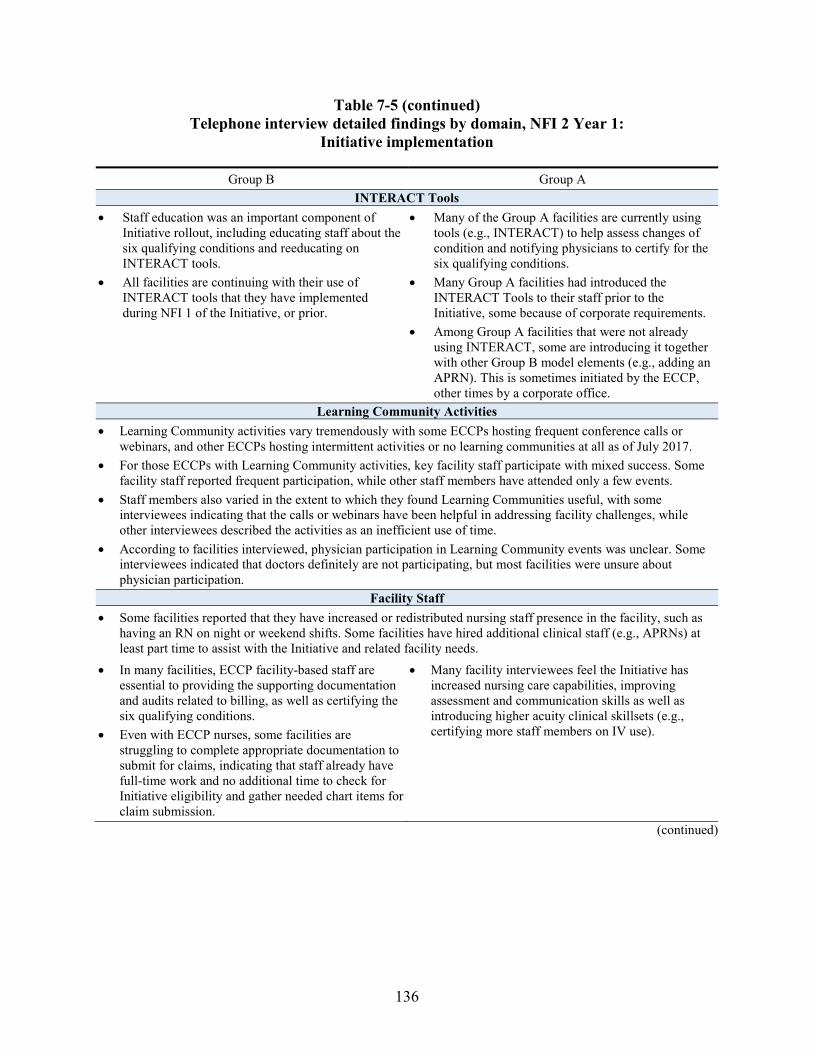
136
Table 7-5 (continued) Telephone interview detailed findings by domain, NFI 2 Year 1:
Initiative implementation
Group B Group A INTERACT Tools
• Staff education was an important component of Initiative rollout, including educating staff about the six qualifying conditions and reeducating on INTERACT tools.
• All facilities are continuing with their use of INTERACT tools that they have implemented during NFI 1 of the Initiative, or prior.
• Many of the Group A facilities are currently using tools (e.g., INTERACT) to help assess changes of condition and notifying physicians to certify for the six qualifying conditions.
• Many Group A facilities had introduced the INTERACT Tools to their staff prior to the Initiative, some because of corporate requirements.
• Among Group A facilities that were not already using INTERACT, some are introducing it together with other Group B model elements (e.g., adding an APRN). This is sometimes initiated by the ECCP, other times by a corporate office.
Learning Community Activities • Learning Community activities vary tremendously with some ECCPs hosting frequent conference calls or
webinars, and other ECCPs hosting intermittent activities or no learning communities at all as of July 2017. • For those ECCPs with Learning Community activities, key facility staff participate with mixed success. Some
facility staff reported frequent participation, while other staff members have attended only a few events. • Staff members also varied in the extent to which they found Learning Communities useful, with some
interviewees indicating that the calls or webinars have been helpful in addressing facility challenges, while other interviewees described the activities as an inefficient use of time.
• According to facilities interviewed, physician participation in Learning Community events was unclear. Some interviewees indicated that doctors definitely are not participating, but most facilities were unsure about physician participation.
Facility Staff • Some facilities reported that they have increased or redistributed nursing staff presence in the facility, such as
having an RN on night or weekend shifts. Some facilities have hired additional clinical staff (e.g., APRNs) at least part time to assist with the Initiative and related facility needs.
• In many facilities, ECCP facility-based staff are essential to providing the supporting documentation and audits related to billing, as well as certifying the six qualifying conditions.
• Even with ECCP nurses, some facilities are struggling to complete appropriate documentation to submit for claims, indicating that staff already have full-time work and no additional time to check for Initiative eligibility and gather needed chart items for claim submission.
• Many facility interviewees feel the Initiative has increased nursing care capabilities, improving assessment and communication skills as well as introducing higher acuity clinical skillsets (e.g., certifying more staff members on IV use).
(continued)
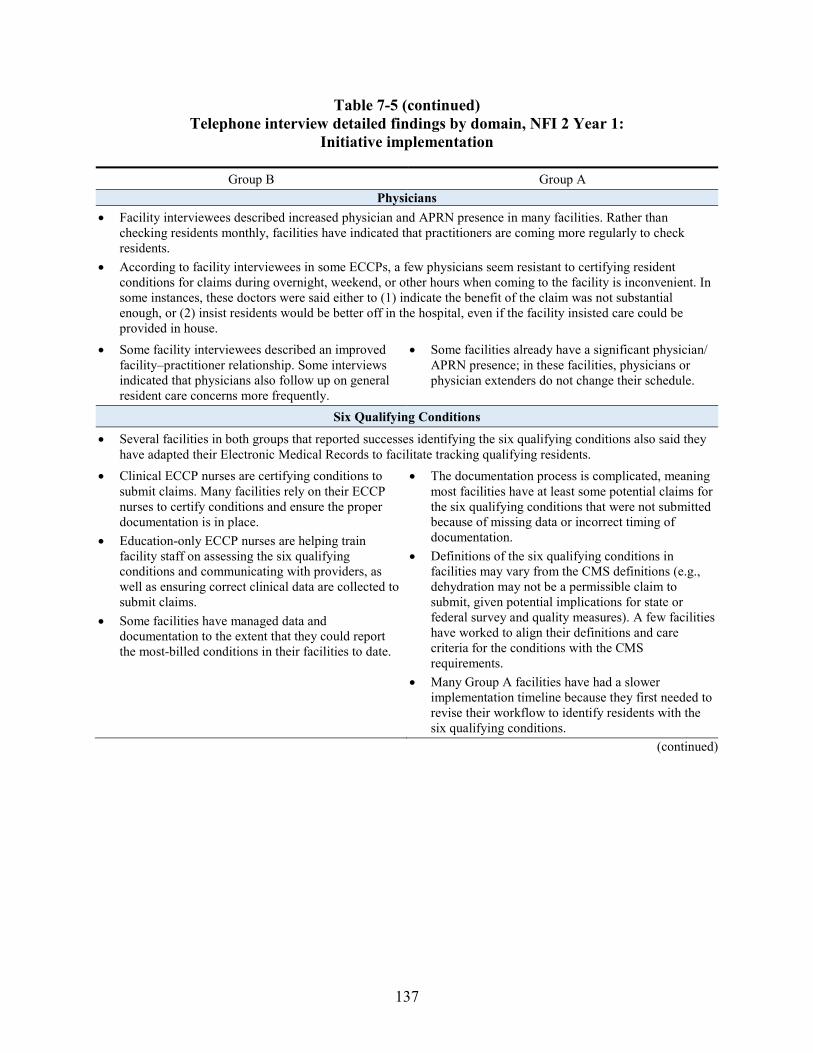
137
Table 7-5 (continued) Telephone interview detailed findings by domain, NFI 2 Year 1:
Initiative implementation
Group B Group A Physicians
• Facility interviewees described increased physician and APRN presence in many facilities. Rather than checking residents monthly, facilities have indicated that practitioners are coming more regularly to check residents.
• According to facility interviewees in some ECCPs, a few physicians seem resistant to certifying resident conditions for claims during overnight, weekend, or other hours when coming to the facility is inconvenient. In some instances, these doctors were said either to (1) indicate the benefit of the claim was not substantial enough, or (2) insist residents would be better off in the hospital, even if the facility insisted care could be provided in house.
• Some facility interviewees described an improved facility–practitioner relationship. Some interviews indicated that physicians also follow up on general resident care concerns more frequently.
• Some facilities already have a significant physician/ APRN presence; in these facilities, physicians or physician extenders do not change their schedule.
Six Qualifying Conditions
• Several facilities in both groups that reported successes identifying the six qualifying conditions also said they have adapted their Electronic Medical Records to facilitate tracking qualifying residents.
• Clinical ECCP nurses are certifying conditions to submit claims. Many facilities rely on their ECCP nurses to certify conditions and ensure the proper documentation is in place.
• Education-only ECCP nurses are helping train facility staff on assessing the six qualifying conditions and communicating with providers, as well as ensuring correct clinical data are collected to submit claims.
• Some facilities have managed data and documentation to the extent that they could report the most-billed conditions in their facilities to date.
• The documentation process is complicated, meaning most facilities have at least some potential claims for the six qualifying conditions that were not submitted because of missing data or incorrect timing of documentation.
• Definitions of the six qualifying conditions in facilities may vary from the CMS definitions (e.g., dehydration may not be a permissible claim to submit, given potential implications for state or federal survey and quality measures). A few facilities have worked to align their definitions and care criteria for the conditions with the CMS requirements.
• Many Group A facilities have had a slower implementation timeline because they first needed to revise their workflow to identify residents with the six qualifying conditions.
(continued)
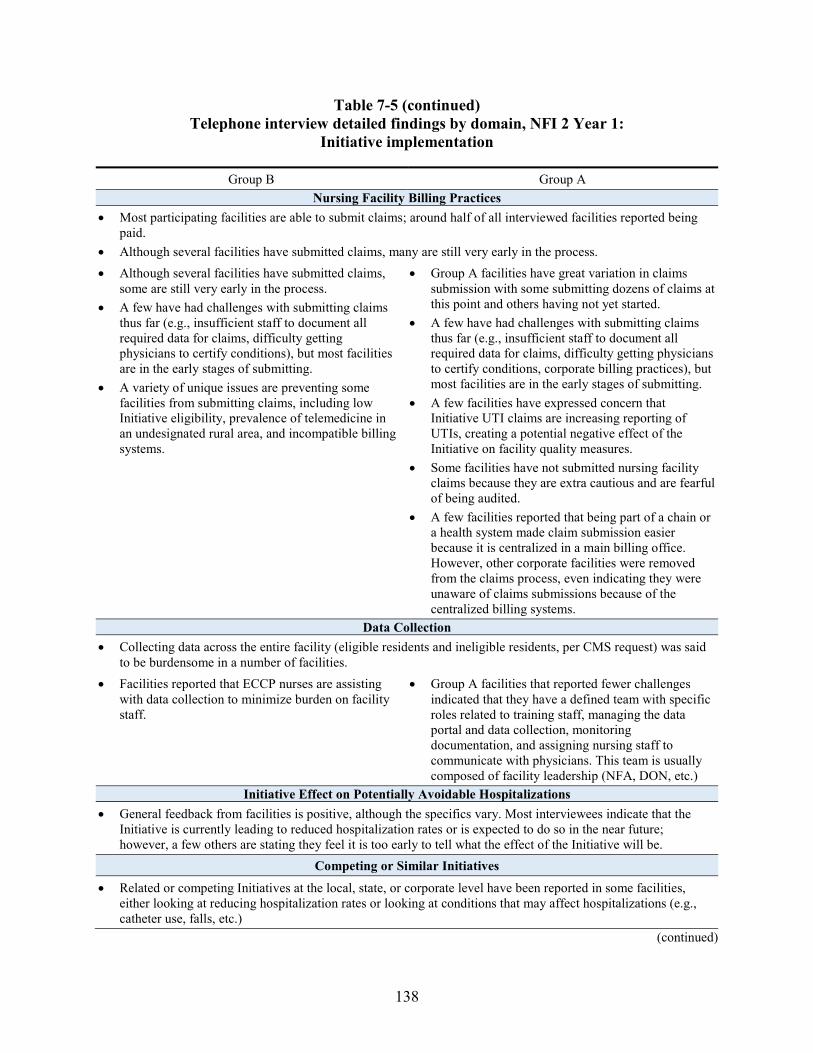
138
Table 7-5 (continued) Telephone interview detailed findings by domain, NFI 2 Year 1:
Initiative implementation
Group B Group A Nursing Facility Billing Practices
• Most participating facilities are able to submit claims; around half of all interviewed facilities reported being paid.
• Although several facilities have submitted claims, many are still very early in the process. • Although several facilities have submitted claims,
some are still very early in the process. • A few have had challenges with submitting claims
thus far (e.g., insufficient staff to document all required data for claims, difficulty getting physicians to certify conditions), but most facilities are in the early stages of submitting.
• A variety of unique issues are preventing some facilities from submitting claims, including low Initiative eligibility, prevalence of telemedicine in an undesignated rural area, and incompatible billing systems.
• Group A facilities have great variation in claims submission with some submitting dozens of claims at this point and others having not yet started.
• A few have had challenges with submitting claims thus far (e.g., insufficient staff to document all required data for claims, difficulty getting physicians to certify conditions, corporate billing practices), but most facilities are in the early stages of submitting.
• A few facilities have expressed concern that Initiative UTI claims are increasing reporting of UTIs, creating a potential negative effect of the Initiative on facility quality measures.
• Some facilities have not submitted nursing facility claims because they are extra cautious and are fearful of being audited.
• A few facilities reported that being part of a chain or a health system made claim submission easier because it is centralized in a main billing office. However, other corporate facilities were removed from the claims process, even indicating they were unaware of claims submissions because of the centralized billing systems.
Data Collection • Collecting data across the entire facility (eligible residents and ineligible residents, per CMS request) was said
to be burdensome in a number of facilities. • Facilities reported that ECCP nurses are assisting
with data collection to minimize burden on facility staff.
• Group A facilities that reported fewer challenges indicated that they have a defined team with specific roles related to training staff, managing the data portal and data collection, monitoring documentation, and assigning nursing staff to communicate with physicians. This team is usually composed of facility leadership (NFA, DON, etc.)
Initiative Effect on Potentially Avoidable Hospitalizations • General feedback from facilities is positive, although the specifics vary. Most interviewees indicate that the
Initiative is currently leading to reduced hospitalization rates or is expected to do so in the near future; however, a few others are stating they feel it is too early to tell what the effect of the Initiative will be.
Competing or Similar Initiatives
• Related or competing Initiatives at the local, state, or corporate level have been reported in some facilities, either looking at reducing hospitalization rates or looking at conditions that may affect hospitalizations (e.g., catheter use, falls, etc.)
(continued)
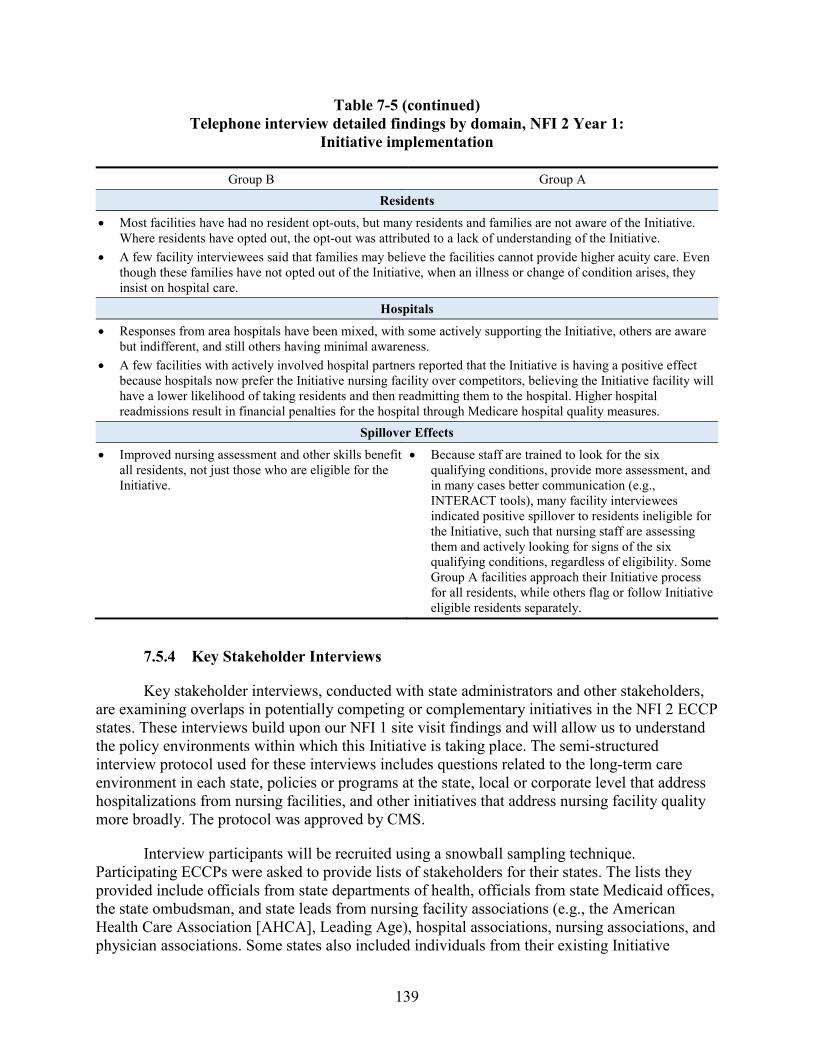
139
Table 7-5 (continued) Telephone interview detailed findings by domain, NFI 2 Year 1:
Initiative implementation
Group B Group A Residents
• Most facilities have had no resident opt-outs, but many residents and families are not aware of the Initiative. Where residents have opted out, the opt-out was attributed to a lack of understanding of the Initiative.
• A few facility interviewees said that families may believe the facilities cannot provide higher acuity care. Even though these families have not opted out of the Initiative, when an illness or change of condition arises, they insist on hospital care.
Hospitals
• Responses from area hospitals have been mixed, with some actively supporting the Initiative, others are aware but indifferent, and still others having minimal awareness.
• A few facilities with actively involved hospital partners reported that the Initiative is having a positive effect because hospitals now prefer the Initiative nursing facility over competitors, believing the Initiative facility will have a lower likelihood of taking residents and then readmitting them to the hospital. Higher hospital readmissions result in financial penalties for the hospital through Medicare hospital quality measures.
Spillover Effects
• Improved nursing assessment and other skills benefit all residents, not just those who are eligible for the Initiative.
• Because staff are trained to look for the six qualifying conditions, provide more assessment, and in many cases better communication (e.g., INTERACT tools), many facility interviewees indicated positive spillover to residents ineligible for the Initiative, such that nursing staff are assessing them and actively looking for signs of the six qualifying conditions, regardless of eligibility. Some Group A facilities approach their Initiative process for all residents, while others flag or follow Initiative eligible residents separately.
7.5.4 Key Stakeholder Interviews
Key stakeholder interviews, conducted with state administrators and other stakeholders, are examining overlaps in potentially competing or complementary initiatives in the NFI 2 ECCP states. These interviews build upon our NFI 1 site visit findings and will allow us to understand the policy environments within which this Initiative is taking place. The semi-structured interview protocol used for these interviews includes questions related to the long-term care environment in each state, policies or programs at the state, local or corporate level that address hospitalizations from nursing facilities, and other initiatives that address nursing facility quality more broadly. The protocol was approved by CMS.
Interview participants will be recruited using a snowball sampling technique. Participating ECCPs were asked to provide lists of stakeholders for their states. The lists they provided include officials from state departments of health, officials from state Medicaid offices, the state ombudsman, and state leads from nursing facility associations (e.g., the American Health Care Association [AHCA], Leading Age), hospital associations, nursing associations, and physician associations. Some states also included individuals from their existing Initiative
140
stakeholder groups or other organizations that are partnering with the ECCPs. RTI has begun recruitment using the stakeholder lists provided by the ECCPs and will ask each interview participant to suggest other key stakeholders in their state. We will continue to conduct interviews and recruit participants until reaching data saturation (i.e., we no longer receive new data from a state), but expect to conduct 7 to 10 interviews per state. As of July 21, 2017, none of the interviews have been conducted. The stakeholder interviews task began in August 2017 and will continue through NFI 2 Project Years 2 and 3.
7.5.5 Web-based Survey of Participating Nursing Facilities
NFI 2 qualitative data collection survey activities include two web-based surveys: the NFA Survey and the Practitioner Survey. Overall, the goal of these web-based surveys is to obtain standardized information from participating facilities’ administrators and practitioners about the impact of the Initiative. Although the majority of instrument development is planned to occur in NFI 2 Year 2, when both surveys will be deployed, findings from the qualitative data collection thus far have begun to inform instrument development. Discussion during the ECCP meeting held in May 2017 and findings from telephone interviews conducted from May through July of 2017 helped provide additional areas of consideration for both the NFA Survey and Practitioner Survey. To determine these areas of interest, we reviewed internal notes from the ECCP meeting and key findings from telephone interviews. Findings from in-person site visits later in 2017 will also inform the instrument development process.
The primary objective of the NFA Survey is to collect information about facility activities and how facilities are responding to the Initiative. Broad survey domains that may be evaluated include implementation processes, success, and challenges; facility engagement with Initiative; and financial impact of the Initiative on facilities. Findings from telephone interviews suggest additional domains of interest, including impact of corporate programs on the Initiative; facility training and support; relationships with practitioners; and unintended consequences of the Initiative.
The aim of the Practitioner Survey is to focus on the financial impact of NFI 2, training the practitioners received on the new billing codes, and their experiences and opinions about the new billing and treatment practices. The Practitioner Survey may include such domains as implementation processes, success, and challenges; practitioner engagement with Initiative; practitioner training and support; financial impact of the Initiative on practitioners; experience with new billing codes; and involvement/partnership with hospitals, hospices, and other agencies. Telephone interviews suggest there is great variation in practitioner involvement in the Initiative. Potential additional domains of interest include practitioner awareness of the Initiative, practitioner patient load, and the amount of time practitioners spend in facilities.
Telephone interviews also suggest that although multiple practitioners may have been approved for participation in the Initiative for a facility, operationally, a smaller fraction may actively participate. Some facilities had all their eligible practitioners approved, even though one or a few conduct the vast majority of resident condition certifications. Furthermore, because practitioners within a facility can sign off on certifying conditions for each other’s residents, the average daily census may not be representative of a practitioner’s truly active case load. Further
141
findings from qualitative data collection and discussion with CMS are expected to inform the analytic approach.
Unlike the NFA Survey, in which a complete sampling frame of administrators from the ECCPs will be received (same approach as in NFI 1), the Practitioner Survey sampling frame will need to be constructed from a new set of files received from CMS, which aggregates practitioner information from across ECCPs. CMS has distributed two types of files on a bimonthly basis:
1. A list of participating facilities and practitioners, updated with their most recent eligibility status (including start and end dates), which contains identifiers such as the CMS Certification Number (CCN) and National Provider Identifier (NPI); and
2. A crosswalk of all practitioners who were ever approved for participation in the Initiative, with contact information valid at their time of approval, in addition to some background information such as credentialing degree.
Preliminary review and analysis of the practitioner crosswalk file indicates that contact information fields for telephone numbers and e-mail addresses are mostly complete. Examination of the eligibility status of the participating list of practitioners indicates that the majority of practitioners remain eligible for NFI 2, while a small fraction are no longer eligible because they left the facility or the facility dropped out. As the list of participating facilities and practitioners continues to evolve by the end of NFI 2 Year 1, the sampling frame will be further refined before survey deployment in NFI 2 Year 2. RTI will continue to work with CMS to ensure that the most updated data available will be used to construct the sampling frame.
7.6 Next Steps
Next steps for the Qualitative Data Collection Task include the following:
• Complete the site visits.
• Complete summary data tables for all contacted facilities.
• Develop and distribute ECCP-level summary notes for the debrief calls.
• Schedule and conduct site visit debrief calls.
• Conduct stakeholder interviews and ECCP-level developed summary notes.
• Develop and test the survey instruments and receive approval from CMS.
• Develop web-based version for the survey instruments.
• Develop the plan for survey administration.

142
[This page intentionally left blank.]
143
SECTION 8 SUMMARY
As the first annual report for the NFI 2 evaluation, this report includes a description of the early steps necessary to prepare for future evaluation analyses. These include the selection of comparison facilities, transition to and refinement of ICD-10 codes, development of analytic data files, and preparation for site visits and surveys. Preliminary results on the NFI 2 implementation gleaned from the first round of phone interviews of participating facilities are included as well.
8.1 Quantitative Data Analysis
The most important quantitative work described in this NFI 2 first annual report is the selection of comparison facilities for both Group A and Group B in all ECCPs. Based on the results presented in Section 4.3, the comparison group selection process was successful insofar as, for the characteristics examined, there were fewer statistically significant differences between the ECCP facilities and matched comparison facilities than between ECCP facilities and candidate comparison facilities. This result is expected using propensity matching. Overall, there were relatively few statistically significant differences between the ECCP facilities and matched comparison facilities except for HealthInsight. For this specific ECCP, the strategy of centering the matched variables around state-specific means was used so that we selected comparison facilities based on the ECCP and comparison facilities’ relative standing within each state. After centering, there were few statistically significant differences between the ECCP facilities and matched comparison facilities.
We compared hospitalization rates for the intervention groups and the matched comparison groups in each of the ECCPs. Overall, there was reasonably good agreement between the ECCP and matched comparison groups. Whatever differences exist will be accounted for in future regression analysis using a difference-in-differences modeling strategy. We also compared rates of all-cause and potentially avoidable hospitalizations for FY 2014 to FY 2016, to examine the 3-year trend before the implementation of NFI 2. In most cases, the baseline trends were fairly similar, although there were several exceptions that we highlighted in Section 4.4.
Another major task was the review and revision of the ICD-10 codes for potentially avoidable hospitalizations in general and for the six qualifying conditions in particular. The latter required considering the signs and symptoms criteria as well as the terms used to title the qualifying conditions. There was no specific guidance given in the Initiative documentation related to the sets of diagnosis codes that correspond to the qualifying conditions, so a clinical review was required. Tracking hospitalizations and other utilization in the claims data requires the use and regular update of ICD-10 codes.
Our next steps will be to refine the analytic work, as appropriate. For the next annual report, we expect to analyze data from the first year of NFI 2 implementation (October 2016–September 2017), in conjunction with qualitative data collection findings reported and soon to be completed.
144
8.2 Qualitative Data Collection
In NFI 2 Year 1, qualitative data collection team developed NFI 2 interview protocols, selected site visit facilities, developed preliminary lists for stakeholder interviews, and began field work. We also began work on survey instrument development and started analysis of the practitioner files. As of August 31, 2017, only one annual qualitative data collection task, telephone interviews, was completed. Therefore, only incomplete, preliminary qualitative data findings were included in this report (Section 7.5).
Early findings for telephone interviews suggested that although facility buy-in and participation in NFI 2 billing is variable, most interviewed facilities had submitted claims (76 percent) and were making progress toward increasing engagement in the Initiative. Group B facilities largely have retained components of NFI 1, and a number of Group A facilities also are adopting NFI 1 components, such as tools to improve facility communication (e.g., INTERACT). Many interviewees recognized the need to increase facility staff and practitioner participation in Initiative activities, including recognizing and treating the six qualifying conditions and documenting changes in condition for claims submission. Many interviewees indicated that the Initiative has improved staff skills in identifying changes of condition and assessing residents for the six qualifying conditions. Overall, most interviewees described the Initiative as improving overall quality of care provided to residents and having a positive effect on reducing avoidable hospitalizations.
Although facilities are making progress, some challenges remain. Similar to findings from NFI 1, practitioner buy-in was described as critical to Initiative success, and some practitioners have not engaged fully with NFI 2. According to some interviewees, a few practitioners remain resistant to the Initiative and are unable or unwilling to certify conditions in the facility within the required timeframe, thus making it difficult for facilities to submit claims and participate fully in the Initiative. Furthermore, the documentation and data collection required to submit claims was viewed as burdensome for facility staff, and some interviewees indicated that the CMS criteria and definitions for the six qualifying conditions (e.g., bacteria count, days of sustained condition) differ from the definitions used previously by the facilities.
Some facilities expressed concern about receipt of reimbursement funds, as corporate billing offices may submit claims and absorb reimbursements into their general funds without disbursing payments directly to individual facilities. Lack of direct reimbursement was said to reduce facility engagement in the Initiative. Similarly, some interviewees indicated that a growing presence of managed care plans may reduce the number of eligible residents; with fewer eligible residents, facilities may not be able to submit many claims, in turn reducing facility engagement in the Initiative.
Overall, most facility interviewees reported that the Initiative is beneficial in providing quality care to residents and reducing avoidable hospitalizations. Interviewees largely attributed the Initiative’s effectiveness to the increase in focus placed on the six qualifying conditions and the increase in nursing facility staff capabilities and confidence.
145
8.3 Areas of Focus for the Upcoming Analyses and Data Collection
Given the initial qualitative data collection findings and data provided by CMS and the implementation contractor, SSS-T, the RTI evaluation team will be monitoring and tracking the following issues that have the potential to create implementation or analytical challenges:
• Incidence of facility attrition, the reasons for this attrition, and implications for the selected comparison group and planned outcome analyses;
• Practitioner participation overall, practitioner billing, as well as incidence of practitioner attrition, the reasons for this attrition, and potential ways of addressing the attrition;
• Changes in managed care penetration rates in the study areas and the implications for participating facilities and NFI 2 overall;
• Evolution and sustainability of NFI 1 components implemented previously by Group B facilities;
• Prevalence of facility billing challenges, particularly focusing on the few facilities that have not been able to bill at all;
• Low levels of practitioner care conferences and the reasons for low occurrences;
• Facility access to and use of NFI 2 payments;
• Hiring patterns and roles of physician extenders in Group A facilities; and
• Similarities and convergence of Group A and Group B facilities in terms of using NFI 1 model elements.

146
[This page intentionally left blank.]
147
REFERENCES
Centers for Medicare & Medicaid Services. Request for Proposals for Evaluation of The Initiative to Reduce Avoidable Hospitalizations among Nursing Facility Residents – Payment Reform. Prepared by Centers for Medicare & Medicaid Service, July 2016. Solicitation no.: TORP-RMADA-2016-0029.
Feng, Z., Ingber, M. J., Reilly, K., Khatutsky, G., Zheng, N. T., Smith, L., et al. Evaluation of the Initiative to Reduce Avoidable Hospitalizations among Nursing Facility Residents: Quarterly Report #1 and Data Analysis Specifications. Prepared for the Center for Medicare and Medicaid Innovation, Centers for Medicare & Medicaid Services, August 2013.
Feng, Z., D. C. Grabowski, O. Intrator, and V. Mor. 2006. “The effect of state Medicaid case-mix payment on nursing home resident acuity.” Health Serv Res 41(4 Pt 1): 1317-36.
Millimet, D.L. and Tchernis, R. 2009. “On the Specification of Propensity Scores with Applications to the Analysis of Trade Policies.” Journal of Business & Economic Statistics 27 (3):397-415.
Saliba, D. and Buchanan, J. Development & validation of a revised nursing home assessment tool: MDS 3.0. Prepared by RAND Corporation for CMS’s Division of Chronic and Post-Acute Care, April 2008.
Walsh, E., Freiman, M., Haber, S., Bragg, A., Ouslander, J., and Wiener, J. Cost drivers for dually eligible beneficiaries: Potentially avoidable hospitalizations from nursing facility, skilled nursing facility, and home and community-based services waiver programs. CMS Contract No. HHSM-500-2005-0029I, 2010. Available at: https://www.cms.gov/Research-Statistics-Data-and-Systems/Statistics-Trends-and-Reports/Reports/downloads/costdriverstask2.pdf