Embed Size (px)
Citation preview

QE 471 .E9 1981 USSOURI COOPERATIVE HIGHWAY RESEARCH PROGRAM
FINAL REPORT
EVALUATION OF THE POINT LOAD TEST FOR ROCK
Property of
MoDOTlRANSPORTATION LIBRARy
, MISSOURI HIGHWAY AND TRANSPORTATION DEPARTMENT
FEDERAL HIGHWAY ADMINISTRATION

EVALUATION OF THE POINT LOAD TEST FOR ROCK
STUDY 79-2
Prepared by
MISSOURI HIGHWAY AND TRANSPORTATION DEPARTMENT
Division of Materials and Research
Final Report
March 1981
In Cooperation With
U.S. DEPARTMENT OF TRANSPORTATION
Federal Highway Administration
The opmlOns, findings, and conclusions expressed in this publication are not necessarily those of the Department of Transportation, Federal Highway Administration. This report does not constitute a standard, specification or regulation.

ABSTRACT
NX cores from Missouri's major sedimentary rock types were tested by point
load in both axial and diametral orientations and by unconfined compression for correlation
purp0ses. A similar series of tests was performed on homogeneous mortar specimens.
Data was analyzed to establish correlations between point load and unconfined test results
and to determine the relative consistency of point load indices determined for both test
orientations by various methods of computation. The overall correlations developed do
not agree well with those reported in the literature. Methods of computing the point
load index were also evaluated by the anisotropic index values computed from tests on
mortar. Dividing force by the area of the failure surface was judged superior to the
conventional method of computing point load index in which force is divided by the
square of the distance between the platen points. Formulae were developed empirically
for adjustment of axial indices to compensate for variations in length-diameter ratios. When
computed by optimum means, the point load test was superior to the unconfined test
in consistency of results obtained on NX rock cores but was somewhat less consistent
in the comparative tests on mortar.
TABLE OF CONTENTS
Page
1. Introduction
2. Conclusions 2
3. Implementation 3
4. Scope 4
5. Test Equipment and Procedure 5
6. Comparative Testing of Prepared Mortar Specimens 8
7. Comparative Testing of NX Rock Cores 13
Table
1.
2.
3.
4.
5.
6.
7.
8.
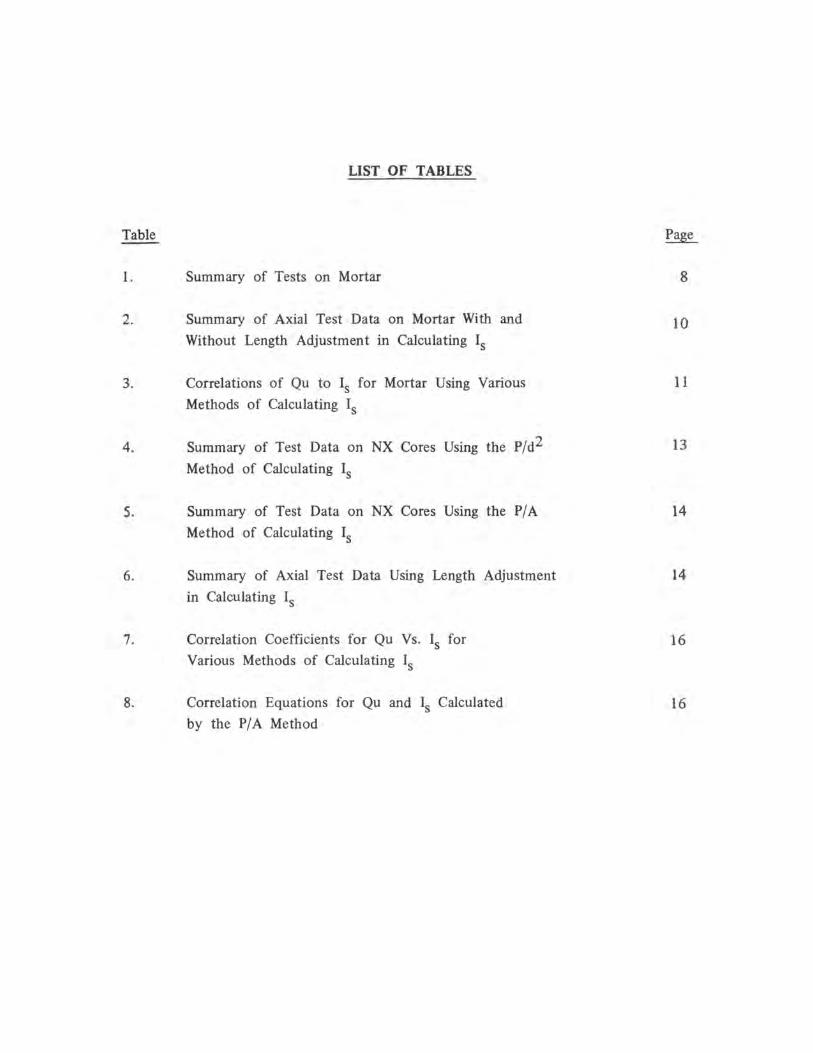
LIST OF TABLES
Summary of Tests on Mortar
Summary of Axial Test Data on Mortar With and
Without Length Adjustment in Calculating Is
Correlations of Qu to Is for Mortar Using Various
Methods of Calculating Is
Summary of Test Data on NX Cores Using the P/d2
Method of Calculating Is
Summary of Test Data on NX Cores Using the PIA
Method of Calculating Is
Summary of Axial Test Data Using Length Adjustment
in Calculating Is
Correlation Coefficients for Qu Vs. Is for
Various Methods of Calculating Is
Correlation Equations for Qu and Is Calculated
by the PI A Method
Page
8
10
11
13
14
14
16
16

Figure
1.
2.
3.
4.
5.
6.
7.
LIST OF FIGURES
Soiltest Model RM-730 point load test apparatus
Correlations of Qu to Is for diametral tests using the
Is = P/d2 method of calculation
Correlations of Qu to Is for axial tests using the
Is = P/d2 method of calculation
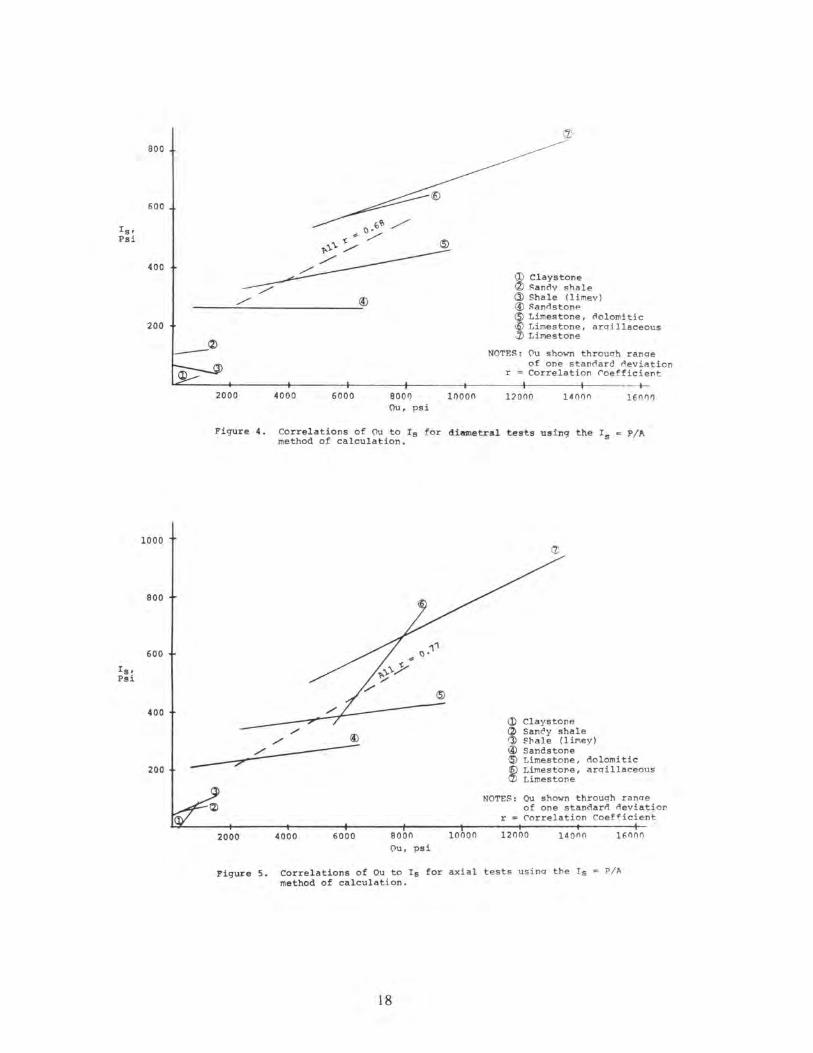
Correlations of Qu to Is for diametral tests using the
Is = PIA method of calculation
Correlations of Qu to Is for axial tests using the
Is = PIA method of calculation
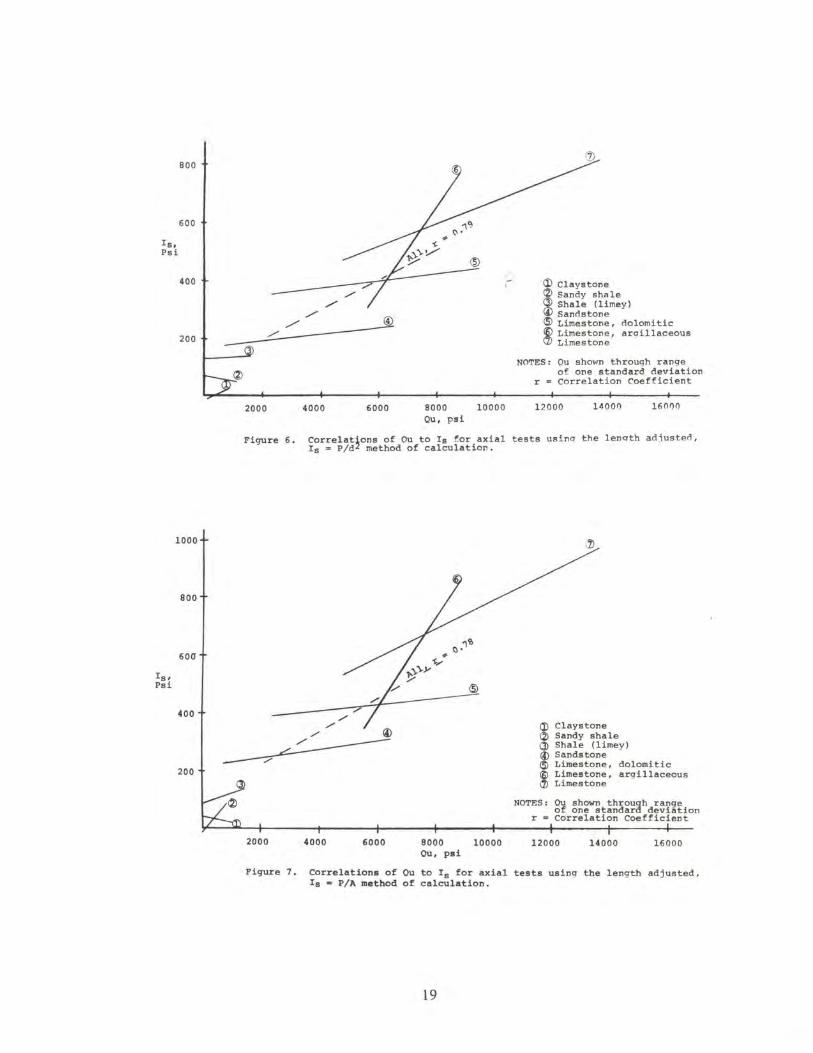
Correlations of Qu to Is for axial tests using the length
adjusted, Is = P/d2 method of calculation
Correlations of Qu to Is for axial tests using the length
adjusted, Is = PIA method of calculation
Page
5
17
17
18
18
19
19
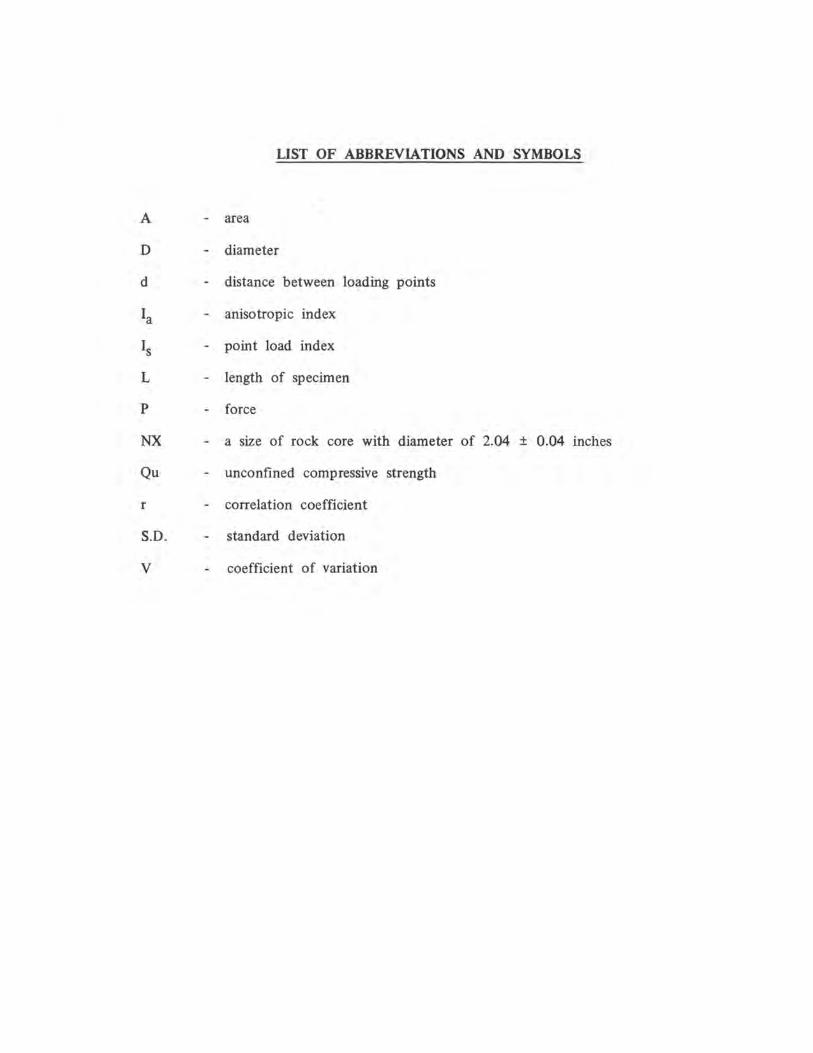
LIST OF ABBREVIATIONS AND SYMBOLS
A area
I) diameter
d distance between loading points
Ia anisotropic index
Is point load index
L length of specimen
P force
NX a size of rock core with diameter of 2004 ± 0004 inches
Qu unconfined compressive strength
r correlation coefficient
Sol) 0 standard deviation
V coefficient of variation

INTRODUCTION
This study was initiated to evaluate the reproducibility of the point load test
and its relationship to unconfined compressive strength for various types of sedimentary
rock found in Missouri.
The unconfined compression test, the conventional method of obtaining the
strength of rock, is slow and expensive, requiring laboratory personnel and equipment
to perform. The point load test has been gaining acceptance in the field of rock mechanics
as a relatively quick and inexpensive field procedure. Advantages claimed are the ability
to field test either cores or fragments of rock without preparation, at in-situ moisture
content, with light weight and inexpensive equipment. Sealing, transporting, storing,
soaking, sawing and polishing of core specimens are thereby avoided.
The theory of the point load test is to induce, through compressive loading
between two pointed platens, internal tensile stresses sufficient to rupture the specimen.
As tensile and compressive stresses are related in elastic materials according to Poisson's
ratio, it should be possible to estimate the unconfined compressive strength from the point load required for failure.
In that the point load test is related to various other ' tensile tests for concrete
and rock, the direct origins of the point load test are somewhat uncertain. In one of
the earliest references available, a Russian, Protodyakonov (1), reported testing irregular
rock specimens roughly shaped by hammering. Tensile strength was estimated by dividing
the rupture load by the 2/3 power of the volume of the specimen as measured by the
sand-displacement method. D'Andrea, Fischer and Fogelson (2), with the U.S. Bureau
of Mines, concluded that, of various rock properties studied, only the point load tensile
strength could be used alone to estimate compressive strength with fair accuracy. Hiramatsu
and Oka (3) analyzed point load stresses theoretically and experimentally, including
photo-elastic model tests which confirmed the minimal effects of surface geometry on
tensile stress distributions.
Perhaps the most comprehensive and definitive treatments of the point load test
as currently practiced are those of Broch and Franklin (4) and Bieniawski (5 ,6). Broch
and Franklin proposed a standard test method and equipment requirements which are
essentially those used in this study. Bieniawski has proposed a general relationship for
unconfmed compressive strength, Qu, and point load index, Is' for NX cores, where
Qu = 24 Is.
1

CONCLUSIONS
1. The unconfined compression test produced more consistent strength data
than did the point load test in comparative testing of homogeneous mortar specimens.
However, the unconfined produced somewhat less consistent results in comparative tests
of cores of natural sedimentary rocks after the point load index was computed by means
determined to produce optimum results.
2. The PIA (force divided by area) method appears to be the most rational
method of calculating point load index since only this method produced an anisotropic
index of approximately 1.0 with presumably homogeneous mortar specimens.
3. Restrictions proposed by others for the lengths of axial point load test
specimens may be relaxed by calculating the index by a height adjustment factor which
relates the test specimen to a common length based on a kngth to diameter ratio empirically
determined to produce an anisotropic index of unity for mortar. On this basis the range
of length to diameter ratios considered, 0.6 to 1.1, was determined to produce results
that exceeded the consistency of diametral point load tests and approached that of the
unconfmed test.
4. Widely varying correlations of unconfined compressive strength to point
load index were found by rock type with some rock types showing no correlation. The
correlation for all data combined is markedly superior to that for any individual rock
type. The overall correlations established for unconfined compression and point load
testing do not agree well with that reported in the literature. This may be a consequence
of the relatively limited range of strengths provided by the sedimentary rocks tested. Better
agreement is probable if data from other types of rocks with higher average strengths
were included.
2

IMPLEMENTATION
The point load test should not be used alone but as a supplement to the
unconfined compression test. So used, it should permit a reduction in the number of
unconfmed tests required and should permit assessment of anisotropic properties where
this may be relevant to the problem under investigation.
For use by designers, point load index values should be interpreted by the
investigator in terms of estimated equivalent unconfined compressive strengths. This
estimate should be based upon the apparent relationship revealed by the complementary
test procedures for the particular formation and rock type being investigated, supplemented
by the relationships developed and reported here and elsewhere.
The point load test procedures proposed by Broch and Franklin (4) should be
followed except that the index should be calculated by the PIA method with axial test
indices based upon length adjustment factors proposed in this report. The length to
diameter ratios permissible for axial testing may encompass a range of 0.6 to at least 1.1.
3

SCOPE
A commercially available point load test apparatus was purchased and used in
a testing program on NX cores from the major types of sedimentary rock found in Missouri.
Point load testing was performed in both axial and diametral orientations with unconfined
compression tests performed for correlation. A similar series of tests was performed on
homogeneous specimens made from mortar. Point load test data was analyzed to establish
correlations to unconfined compressive strength data and to determine the relative
consistency of point load indices determined for axial and diametral test orientations by
various methods of computation. Methods of computing the point load index were
evaluated by the anisotropic index values computed from tests on mortar. Empirical
formulae were developed for adjustment of the axial index to compensate for variations
in the length-diameter ratio.
4

EQUIPMENT AND PROCEDURE
Equipment
A Soiltest Model RM-730 point load test apparatus was obtained for use in
this study. This apparatus uses an Enerpac Model RC-102, 10 ton capacity hydraulic
ram mounted inside a reaction frame. Pressure is provided by a hand operated Enerpac
Model P-39 pump. Load is indicated by a 10,000 pound capacity Helicoid Type 430
gauge calibrated to read directly in pounds in 200 pound increments and equipped with
a manually reset following pointer. Indicated gauge accuracy is ±%of 1 % of scale range.
'~
. '\
............ -~ #
Figure 1. Soilteet Model RM-730 point load teftt apparatus.
Several changes were made to the equipment as received. The chrome plated
points were not constructed of hardened steel nor ground to a radius of 5 mm as
recommended by Broch and Franklin (4) . The points were replaced with surface hardened
points made from high carbon steel ground to the desired radius. The new points performed
without deformation during all of the sedimentary rock testing. However, one of the
few igneous rock (granite) cores tested was sufficiently hard to rupture the surface
hardening.
5
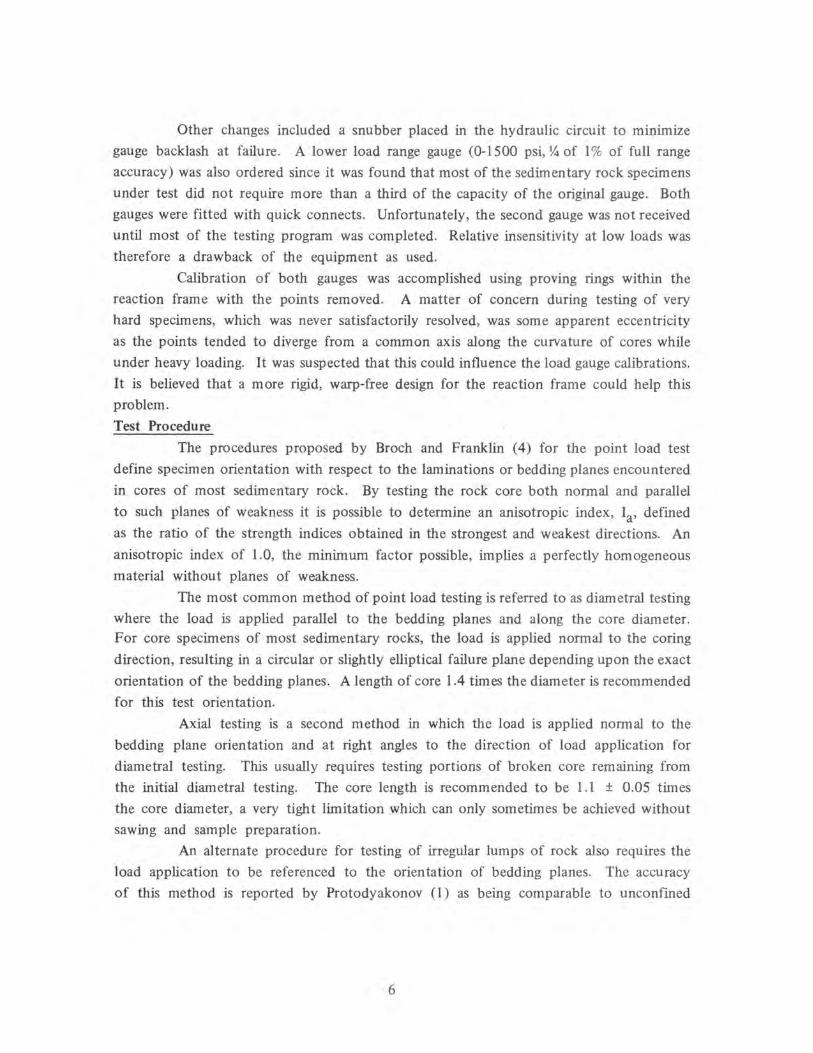
Other changes included a snubber placed in the hydraulic circuit to minimize
gauge backlash at failure. A lower load range gauge (0-1500 psi, ~ of 1% of full range
accuracy) was also ordered since it was found that most of the sedimentary rock specimens
under test did not require more than a third of the capacity of the original gauge. Both
gauges were fitted with quick connects. Unfortunately, the second gauge was not received
until most of the testing program was completed. Relative insensitivity at low loads was
therefore a drawback of the equipment as used.
Calibration of both gauges was accomplished using proving rings within the
reaction frame with the points removed. A matter of concern during testing of very
hard specimens, which was never satisfactorily resolved, was some apparent eccentricity
as the points tended to diverge from a common axis along the curvature of cores while
under heavy loading. It was suspected that this could influence the load gauge calibrations.
It is believed that a more rigid, warp-free design for the reaction frame could help this
problem.
Test Procedure
The procedures proposed by Broch and Franklin (4) for the point load test
define specimen orientation with respect to the laminations or bedding planes encountered
in cores of most sedimentary rock. By testing the rock core both normal and parallel
to such planes of weakness it is possible to determine an anisotropic index, la' defined
as the ratio of the strength indices obtained in the strongest and weakest directions. An
anisotropic index of 1.0, the minimum factor possible, implies a perfectly homogeneous
material without planes of weakness.
The most common method of point load testing is referred to as diametral testing
where the load is applied parallel to the bedding planes and along the core diameter. For core specimens of most sedimentary rocks, the load is applied normal to the coring
direction, resulting in a circular or slightly elliptical failure plane depending upon the exact
orientation of the bedding planes. A length of core 1.4 times the diameter is recommended
for this test orientation.
Axial testing is a second method in which the load is applied normal to the
bedding plane orientation and at right angles to the direction of load application for
diametral testing. This usually requires testing portions of broken core remaining from
the initial diametral testing. The core length is recommended to be 1.1 ± 0.05 times
the core diameter, a very tight limitation which can only sometimes be achieved without
sawing and sample preparation.
An alternate procedure for testing of irregular lumps of rock also requires the
load application to be referenced to the orientation of bedding planes. The accuracy
of this method is reported by Protodyakonov (1) as being comparable to unconfined
6

compression testing of cores if a large number of such lump test results can be averaged.
Test specimens are recommended to be egg shaped lumps, with maximum dimension about
1.4 times the shorter dimension and with the shorter dimension parallel to bedding
laminations. This may be a difficult type of specimen to find or shape in the quantity
required.
The strength value determined by point load testing is referred to as the point
load index, Is' and is commonly calculated as Is = P /d 2 where P is the force required
to rupture the specimen and d is the distance between the platen points. For NX cores
tested diametrally, this distance was generally found to be 2.04 ± 0.04 inches.
7
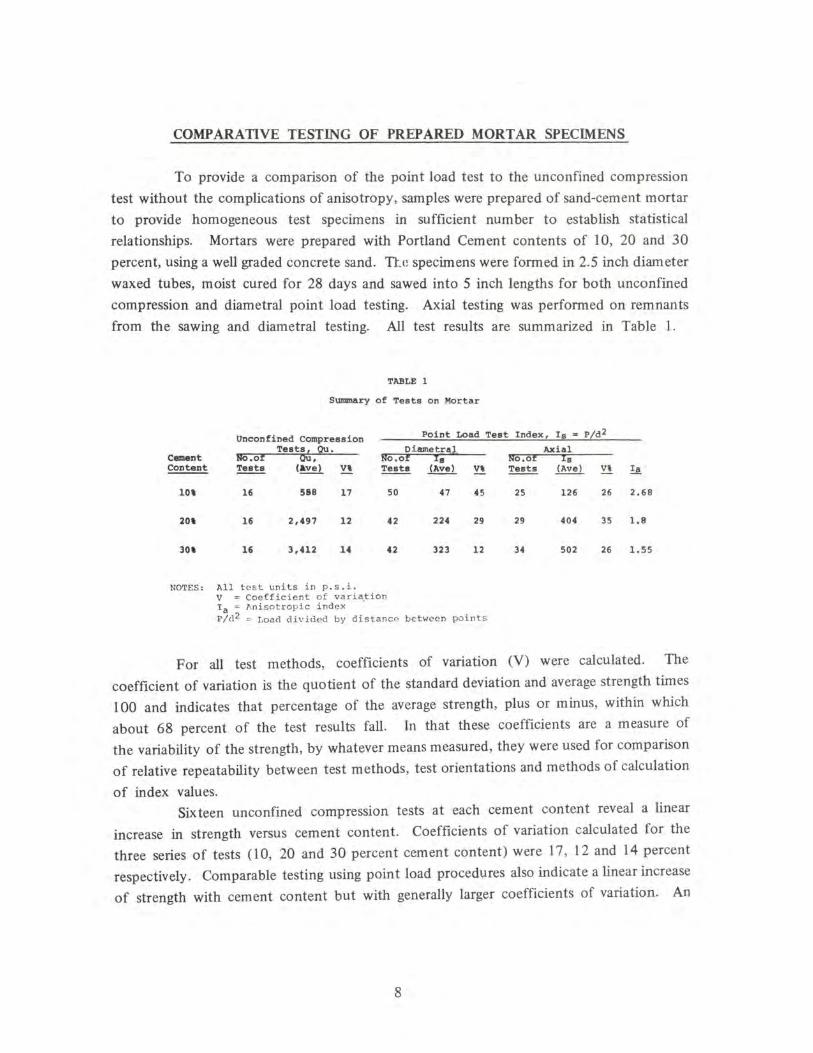
COMPARATIVE TESTING OF PREPARED MORTAR SPECIMENS
To provide a comparison of the point load test to the unconfined compression
test without the complications of anisotropy, samples were prepared of sand-cement mortar
to provide homogeneous test specimens in sufficient number to establish statistical
relationships. Mortars were prepared with Portland Cement contents of 10, 20 and 30
percent, using a well graded concrete sand. Tte specimens were fonned in 2.5 inch diameter
waxed tubes, moist cured for 28 days and sawed into 5 inch lengths for both unconfined
compression and diametral point load testing. Axial testing was performed on remnants
from the sawing and diametral testing. All test results are summarized in Table 1.
TABLE 1
Summary of Tests on Mortar
Unconfined Compression Point Load Test Index , Is c P/d2
TestQij,Ou. Diametral Axial Cement NO.or No.or III No.of Is ~ !!!!! (Ave) Y! !!.!!!. (Ave) Vt !!.!!!. (Ave) v, Ia
10' 16 5&8 17 50 47 45 25 126 26 2.68
20' 16 2,497 12 42 224 29 29 404 35 1.8
30' 16 3,412 14 42 323 12 34 502 26 1.55
NOTES : All t est units in p . s . i . V Coef f i c ient of variat ion la ; Ani sotropic index . P/d2 = Load divided by distance betwee n points
For all test methods, coefficients of variation (V) were calculated. The
coefficient of variation is the quotient of the standard deviation and average strength times
100 and indicates that percentage of the average strength, plus or minus, within which
about 68 percent of the test results fall . In that these coefficients are a measure of
the variability of the strength, by whatever means measured, they were used for comparison
of relative repeatability between test methods, test orientations and methods of calculation
of index values. Sixteen unconfined compression tests at each cement content reveal a linear
increase in strength versus cement content. Coefficients of variation calculated for the
three series of tests (10, 20 and 30 percent cement content) were 17, 12 and 14 percent
respectively. Comparable testing using point load procedures also indicate a linear increase
of strength with cement content but with generally larger coefficients of variation. An
8

average of 2.8 diametral point load tests were performed for each unconfined compression
test and an average of 1.6 axially oriented tests for each unconfined compression test.
In the diametral orientation, coefficients of variation in point load index values of 45,
30 and 12 percent were calculated. Significantly, the coefficients for the diametral point
load test and the unconfined compression test were about equal at the highest strength
level, for that set with 30 percent cement content.
A correlation equation expressing the relationship of unconfined compression
to diametral point load test data was calculated, using the least squares method, as Qu,
psi = 10.5 Is - 42. Adjusted for an origin through zero, Qu would approximate 11 Is.
It should be noted that Broch and Franklin (4) have reported a size effect relationship
for correlations of index values to unconfined compressive strength for varying core
diameters. Adjusting the 2.5 inch diameter mortar specimens by their procedure to the
standard NX core diameter results in increases in Is of from 8 to 12 percent. This modifies
the correlation equation to Qu, psi = 8.7 Is + 70 or, fitted through zero, approximately
lOIs. This equation does not compare well to the general relationship reported by
Bieniawski (5) for NX rock cores where Qu = 24 Is.
Of those mortar specimens tested which met Broch and Franklin's (4) suggested
LID ratio requirement of 1.1 ± 0.05, only 3 specimens failed in the plane between the
loading points. Failure generally occurred diagonally to the side of the specimen when
the specimen length exceeded the minimum suggested length. When this occurred the
results were discarded. Because complying with the recommended length-diameter ratio
restrictions would also require laboratory sawing, thereby negating field use, it was decided
to expand the range of length-diameter ratios tested to include all of the remnants from
the diametral testing series. Accordingly, a total of 88 axial tests were performed on
specimens having LID ratios within the range of 0.6 to 1.1.
Correlation of these axial point load indices to unconfined compressive strengths
gave the relationship Qu, psi = 7.1 Is - 360 or, adjusted through zero, approximately
6 Is. The coefficients of variation for the mortars with 10, 20 and 30 percent cement
content were 26, 35 and 26 percent respectively. The average degree of anisotropic strength
variation, la' between the diametral and axial tests was found to be 2.01. Considering
that these specimens were prepared, homogeneous mortar specimens presumably without
anisotropy, it was obvious that such axial test results were inconsistent with those Of
the diametral tests and should be adjusted.
Protodyakonov (1), in his irregular lump tests, attempted a rough approximation
of the area of the surface of rupture in calculating tensile strengths. It was decided to
similarly compute both diametral and axial index values, as shown on Table 2, as a function
of the area, A, using the equation Is = PIA. While the coefficients of variation for the
diametral tests remained unchanged, those for the axial series were reduced to 16, 26
9

and 18 percent respectively for 10, 20 and 30 percent cement content and the average
Ia value became a more logical 1.18. The equation developed for the diametral orientation
is Qu, psi = 8.2 Is - 60 or, struck through zero, approximately 8 Is ' The comparable
equation for the axial orientation is Qu, psi = 8.3 Is - 180 or, adjusted through zero,
approximately 7 Is'
TlUILE 2
Summary of Axial Telt Data on Mortar With and Without Length AdjU.t.eDt in ca1cu1atinq II
PoiDt Load IlIdu, I, - P/d2 Point Load Index, II • PIA
LeJlqth Lenqth Adjusted Adjulted
c-z,t No AdjU.t.eDt to 2.50· ~ !a. V! !a. !a Y!. !a.
No Ad~ultment to 2.16" !J. , Ia !l. Y!. !A
10' 126 26 2.68 24 54 1.98 88 16 1.4 61 20 1.03
20' 404 ]5 1.8 2]2 25 1.04 305 26 1.05 290 17 1.0
]0' 502 26 1.55 337 19 1.04 436 18 1.09 423 13 1.06
IIOI'BSI All te.t _it. in p ••• !. A • area of the plane of failure
Further examination of the data for the axial tests indicated variations in the
index value with varying sample lengths and suggested that the correlation between
diametral and axial testing results could be improved if the axial specimens were adjusted
to a common length. This confirms observations by others of variations in index values
with varying lengths of sample. As previously noted, Broch and Franklin recommend
a relatively constant length-diameter ratio of 1.1 ± 0.05.
Adjusting axial index values to a common 2.49 inch length, based on a 1.0
LID ratio determined to produce an average anisotropic index of 1.0 for the P Id 2 method
of computation, modified the results to those shown in Table 2. A similar adjustment
was made to a common 2.16 inch length based on a 0.86 LID ratio similarly determined
for the PI A method of calculation. Length adjusted index equations were developed
empirically from the test data with D used as diameter and d as distance between the
test points. The equation for the Is = P/d 2 method of calculation is :
- (P/d2 + 155) 0·99 -{0 (1) Is (Adjusted), psi = P/d2 - 3
10
(1.37 - ~ \.

The equation for the PI A method of calculation is :
(2) Is (Adjusted), psi = PIA -(PIA + 110) (0.86 --fij
~.82 - ~)
Using the second equation, the coefficients of variation for Is were reduced
substantially, to 20, 17 and 13 percent for the three respective cement contents. However,
index values were not significantly improved by the first equation which resulted in
respective coefficients of variation of 54, 25 and 19 percent. A comparison of index
values and coefficients of variation for both methods of calculation using length correction
are shown on Table 2.
The equations for correlation of unconfined compressive strength to length
adjusted index values are, Qu, psi = 8.2 Is + 420 (or about Qu = 10 Is when struck
through zero) for the P/d2 method of calculation and Qu, psi = 8.0 Is + 80 (or about
Qu = 8 Is when struck through zero) for the PIA method.
Correlation coefficients (r), shown in Table 3, relate average unconfined
compressive strengths for each cement content to corresponding average point load indices
as determined for the two test orientations and four methods of index calculation. These
coefficients are derived by the least squares method as used to determine first degree
equations of correlation and reference the fit of the data points to the equation with
a value of 1.0 being a perfect fit and a value of zero indicating no correlation.
TABLE 3
Correlation of Ou to I. for Mortar Uain9 Varioua Method. of Calculatin9 I.
Teat Orientation and Method of Calculatin9 Correlation Coefficient(r) Coefficient of Variation Point Load Index, I. for QU va. I. V,
Dianwtral P/d2 0.942 20.5
D1anwtral PIA 0.952 18.7
Axial P/d2 0.796 33.5
Axial PIA 0.905 21.9
Axial, Len9th P/l 0.933 23.9 AdjuaUd
Axial, Len9th PIA 0.955 15.3 Adju.tad
11

The correlation coefficients determined ranged from a low of 0.80 to a high
of 0.96. The lowest (poorest) value was for the P/d2 method of calculating axial index
values without length adjustment of the random lengths tested. All other values exceelied
0.90. A value of 0.95 was found for the diametral orientation using the PIA method
of calculation and 0.96 for axial tests with PIA index calculation after the random lengths
were adjusted to a common value.
Averages of the coefficients of variation, termed standard errors, were calculated
as the square root of the quotient of the averaged squared deviations and the number
of coefficients, divided by the average of the dependent variable times 100, and are also
shown on Table 2. This shows the unconfmed compression test to be superior to all forms
of the point load test with a standard error of only 15 percent. Comparable data generated for the point load tests ranged from a low of 16.3
to a high of 33 .5 percent. The PIA method of calculation was shown to be superior
to the P/d 2 method in both test orientations. The highest value found, 33.5 percent,
was for the axial test, on random lengths from 1.2 to 2.7 inches, without length adjustment
and using the P/d2 method of calculation. However, an improved value of 16.3 percent,
the lowest or best for the point load test, was determined using length adjustment and
the PIA method of calculation. This approaches the value determined for unconfined
testing.
12

NX ROCK CORE TESTS
Test results from NX (2.04 ± 0.04 inches diameter) rock cores are summarized
on Table 4. This table was compiled from a total of 145 unconfined compression tests,
360 diametrally oriented point load tests and 437 axially oriented point load tests. The
tested cores were visually classified into general rock types as claystone, sandy shale, limey
shale, sandstone, limestone, dolomitic limestone, argillaceous limestone, and granite. All
cores were selected from routine production from bridge foundation investigations
conducted throughout the state of Missouri. The various rock types were not available
in equal proportions. The number of tests on each core specimen varied according to
suitability of the available samples. Only two igneous rock samples were available and,
while the results are reported, no statistical comparisons were made.
The samples selected for axial testing varied in length to diameter (LID) ratios
from 0.6 to 1.2. Average specimen lengths for each of the rock categories are summarized
on Table 6. Test results were discarded if the plane of failure did not occur between
the loading points.
Tables 4, 5, 6 list, for each rock type, total number of tests, number of core
specimens tested, average unconfined compressive strength, average index values,
coefficients of variation and anisotropic indices for axial and diametral orientations of
point load testing and for the various methods of calculation of the point load index.
TABLE 4
Sunaary of Teat Data on NX Cores VainC] . the P/d2 Method of Calculatlnq I.
Unconfined compressive Point Load Teat l Is • pt..d2
Streng:th £ Qu. Oiametral Axial No.of No .. of Ave No.ot No.ot r:ve- No.of l\o.of
~ !.!!!! Spec. Q!! Y! !!!.!!. ~ !.L. Yo!. Tests ~
Cla)'stone 17 14 392 209 53 13 158 80 14
Sandy Shale 18 10 509 77 40 10 15 133 58 10
Shale (Limey) 18 869 82 41 38 163 59
sandstone 24 24 3,559 82 101 H 214 112 100 24
Dolomitic LllnE:ltone 23 23 5,916 60 70 23 317 47 71 24
Argillaceous 7,179 23 467 42 11 Limestone
Lilhestone 38 38 9,151 48 43 38 531 38 55 36
Granite 20,548 (N/A) 1,265 (N/A)
All Data Above 145 123 360 121 437 122 (Standard Error, ') (62) (67)
All Limestone Above 66 66 121 66 137 65 (Standard Error, ') (46) (41)
NOTES: All test units in p.s.I.
Ave
!!. 93
4~. 7
77
283
447
736
823
1,674
, Standard Error equals the square 'root of the quotient of the squared deviation and the number of coefficients divided by the average of the dependent variable times 100.
13
Yo!. !.A 77 10.7
80 3.3
58 1.3
56 1.3
37 1.5
86 1.6
51 1.6
(N/A) 1.3
(81)
(64)

TABLE 5
Surtnary or Test Data on NX Corea Using the PIA HeUlod ot Calculatlnq I.
Onconfined Compressive Point 1..oad Test L Is - pI,.,
No .of S~~~~lth, ~~e ~ !!.!!! ~. Qu_!! Clayatone
_1' Shale
Shale (LI.,e1')
SancSstone
Dolocd-tic LiJneatone
Argillaceoua L.iJwstone
Li_.tone
Granite
17
18
18
24
23
38
All Oat .. Above 145 CStandard Error, "
All Limestone .Above 66 (Standard Error. ')
14
10
H
23
38
123
66
IIO'I'EI All teat units 18 p ••• J.
392 209
509 77
86' 12
3.559 82
5.916 60
7,179 23
9,151 n
20,548 (N/A)
(62)
(46)
NO.o? ~
53
40
u
101
70
43
360
121
TABLE 6
ntMlP.:tral No.or---Ave ~ • ....!!. ~
13 11 163
10 19 129
t9 159
H '64 112
23 399 t7
607 42
38 667 42
1.5~5 (N/A)
121 (69)
6E (41)
".xial No.of No.ol ~~.!.
80 14
58 10
59
100 24 ·
71 24
11
55 36
437 122
137 65
Ave
!L Y! ~
55 78 5.0
50.2 120 2.6
78 56 1.6
246 57 1.1
388 H 1.0
5H 70 1.1
723 46 1.1
1. 532 (N/A) 1. 0
(70)
(42)
SWM\&ry of Axial Test Oat a U.lno-Length Adjustment In Calculating I.
Point Load Index £ 1:1' Length Adjusted
Tested I •• PLd2 Is - Pt.'" No.of No. of Len2,tha. In. Ave AVe
~ ~ Samples ~ ~ ..Ii. Y! !4 2A Y! !4 Clayatone 80 14 1. 79 0.28 63 193 7.0 60 76 5.5
Sandy Shale 58 10 1. 79 0.08 12 151 -1.3 54 91 2 . 8
Shale (Limey) 59 2.1 0.19 127 58 3.3 116 57 2.4
SaneS-tone 100 24 1.85 0.18 211 65 1.0 265 57 1.n
Dolomitic Limestone 71 H 1.85 0.24 397 53 1.3 430 39 1.1
Argillaceous 11 1. 76 O.H 538 43 -1.2 601 50 1.0 Lime.tone
Liaeatone 55 36 1.81 0.29 641 39 1.0 148 29 1.1
All Data J.b<)v. 437 122 (Standard Error, ., (59) • (52)
All Limestone Above 137 65 (StancS.rd Error, ') (45) (31)
NOTES. All t. •• t units in p ••• i. '.0 •• standard deviation
14

In addition to the two point load test orientations, the following four methods
of calculation of the point load index were evaluated and are summarized in the tables:
(1) Using the distance between the loading points, d, where Is = P/d2, for
both axial and diametral test orientations.
(2) Using the area of the failure surface, A, where Is = PIA, for both axial
and diametral test orientations.
(3) For the axial direction of testing, adjusting the length of the specimen to
a common LID ratio of 1.0 as determined for the mortar specimens for the Is = Pld 2
method of calculation. '
(4) For the axial direction of testing, adjusting the length to a common LID
ratio of 0.86 as determined for the mortar specimens for the Is = PIA method of
calculation.
Disregarding the 2 tests on granite, average coefficients of variation or standard
errors were calculated for each of the 7 rock types for unconfined compression, axial
and diametral point load tests and for four methods of computing the index. Since most
sedimentary rocks are non-homogeneous with anisotropic properties to some degree, the
standard errors for the tests on rock were predictably higher than for mortar by all test
methods with a range of 52 to 81 percent for point load versus 62 percent for unconfined
compression tests. The relatively higher value for unconfined tests on rock, as compared
to those on mortar, probably reflects the greater effect of non-homogeneity upon the
longer specimens used for the unconfined tests. However, experience with the mortar
tests was confirmed in that the length adjusted, PIA method of calculating axial point
load was again the lowest or best of the point load test methods with a standard error
of 52 percent. The axial, P/d 2 method' of calculation without adjustment of the random
lengths tested was again the highest at 81 percent.
Substantially lower values of standard error were found by considering only the
various types of limestone, presumably among the harder and more homogeneous of the
sedimentary rocks. For the limestone family, the range was 38 to 64 percent for point
load and 46 percent for unconfined compressive tests. Again the lowest, or best, value
was for length adjusted PI A method of calculating axial point load index.
Correlation coefficients (r) are shown in Table 7 for comparison of average
unconfined compressive strengths to corresponding average point load indices as determined
for the two test orientations and four methods of index calculation. Widely varying degrees
of correlation were found by rock type. For some rock types, no correlation at all is
indicated. Overall correlation coefficients were also calculated for all data combined,
disregarding rock type. An r value of 0.68 is indicated for diametrally oriented tests
using both the PIA and the P/d 2 methods of calculation. The highest or best values
15
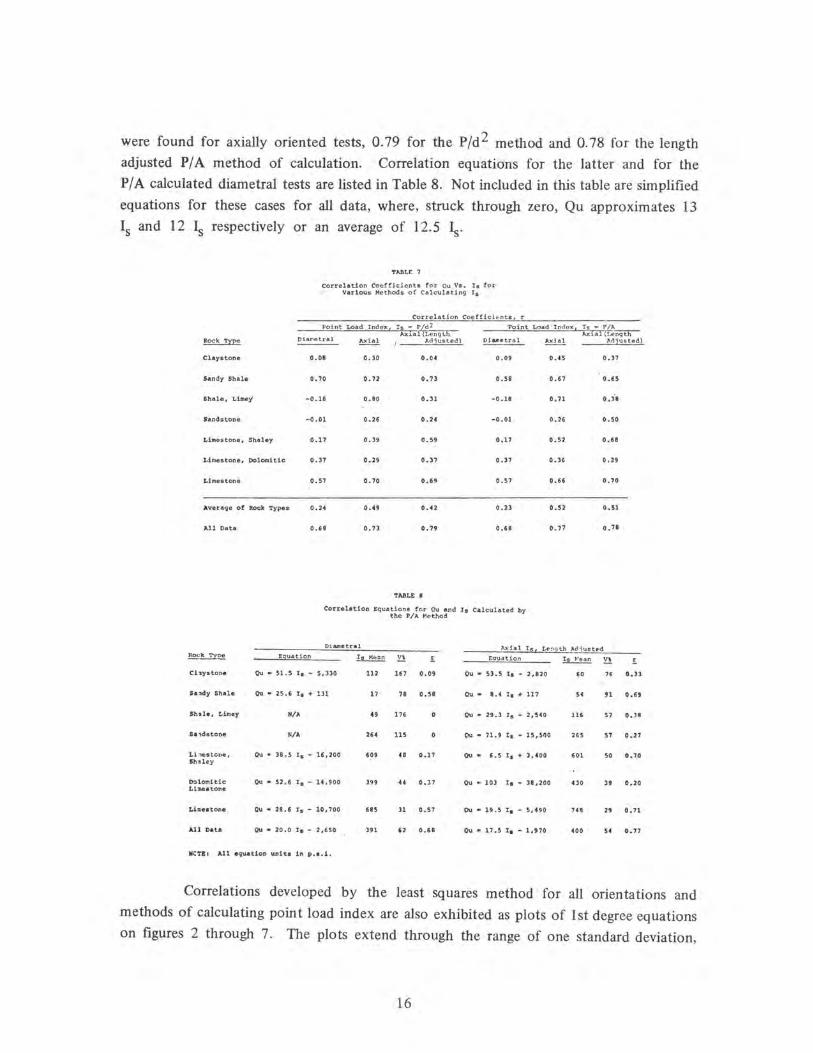
were found for axially oriented tests, 0.79 for the Pld 2 method and 0.78 for the length
adjusted PIA method of calculation. Correlation equations for the latter and for the
PI A calculated diametral tests are listed in Table 8. Not included in this table are simplified
equations for these cases for all data, where, struck through zero, Qu approximates 13
Is and 12 Is respectively or an average of 12.5 !g.
"ABLE 7
Correlation Coefficients for Ou Va _ Is tor Various Methods of Calculating Is
Correlation CoefficiE-nts. r
Poi.nt Load lndex t Is .. r/d 2 Point Load Index! Is .. PIA
Diametral Axl.aITLenglh Ax i a 1 ( Leri9t1\
~ Axi~l Ad;usled) Dibetral Ax,ial --Miust~d)
Claystone
Sandy Shale
Shale, Limey
Sandstone
Limestone. Shaley
.Limestone, Dolomitic
Limestone
Avera9c of Rock Types
All Data
0.08 0.30 0.04 0.09
0.10 0.12 0.13 0.58
-0.18 0.80 0.31 -0.18
-0.01 0.26 0.24 -0.01
0.17 0.39 C.59 0.11
0.37 0.29 0.37 0.31
0.57 0.70 0.6' 0.51
0.24 0.49 0.,412 0.23
0.68 0.13 0.19 0.68
TABLE 8
CorrelaUon Equations for Qu and J. Calculated by the PIA Method
0.415 0.31
0:61 0.65
0.11 0.38
0.26 0.50
0.52 o.n
0.36 0.29
0.66 0.70
0.52 0.51
0.71 0.11
Diametral 1\),;1.1 I§, Lp!'I9.th Miusted ~~ Eguation Is Mclin ~ !: Eouation Is f.'ean ~
Ch.y.tone Ou .. 51.5 I. - 5,330 112 161 0.09 OU .. 53.5 I ... 2.B20 60 16
Sa:tdy Shale Ou • 25.6 I. + 1ll 11 18 0.58 Qu- B.t I .... 117 54 '1
Sh.lle. L1nIey NIA 49 116 OU • 29.3 I. - 2-#540 116 51
S .. "dstone NIA 264 115 o.u • 71.9 I. - 15,51l0 265 57
Li 'eatone, Ou • 38.5 Is - 16,200 609 48 0.11 Qu- 6.5 Is + 3,400 '01 50 Sh.ley
Dolomitic Lt._tone
Ou • 52.6 I ... 14,900 39' U 0.37 Qu - 103 I ... 38,200 430 39
Lb,estone . Qu. 28.6 Is - 10,700 685 31 0.57 ()u - 19.5 I. - 5,490 148 2'
All Oata Ou • 20.0 1 ... 2,650 391 '2 0.68 Qu, - 17.5 I. - 1,'70 400 54
IICTEs All equation units 1n p ••• 1.
!:
0.33
0.69
0.31
0 .. 27
0 .. 7.0
0.20
0.71
0.77
Correlations developed by the least squares method for all orientations and
methods of calculating point load index are also exhibited as plots of I st degree equations
on figures 2 through 7. The plots extend through the range of one standard deviation,
16

Is, Psi
IS' Psi
800
600
400
200
1000
800
600
40
~ID ... ....-
~\.\.y .......... ~ . <Sl
:7 0::::: @
~
J) r1aystol'e ~ Sanrly shale ~ Shale (limev) ® Sa",~stol'e ~ Limestone, do10mi tic ~ IJ iMestone, arqillacenu~ ,]) Limestol'e
NOTES: qu shown throuoh ranoe
~ of one stan~ard neviatinn
r = rorre1ation roefficient
2000
Figure 2.
./ ./
4000 6000 8000 10000 120f)O 14000 1600n
Ou, osi
Correlations of au to Is for diametra1 tests using the Is P/d 2 method of calculation.
;'
-;7 ./
<D Claystone ~ Sandy shale i3) Shale (lirney) @) Sandstone C2) Limestone, dolomitic 6) Limestone, argillaceous \l) Limestone
NOTES: Ou shown through ranoe of one standarrl deviation
r = Correlation coefficient
2000 4000 6000 8000 Qu, psi
10000 12000 14rjnO Hn"f)n
Figure 3. Correlations of Ou to Is for axial tests usinq the Is P/d 2 method of calculation.
17
IS' Psi
IS' Psi
800
600
400
200
1000
800
600
400
200
./
_'2>
2000 4000 6000
@
8000 ()u, psi
~
10000
___ --------<J)
Q;) Claystone (2) !=;anClv shale a> Shale (limev) @ ~anrlstone ~ Limestone, Clolomitic ~ Limestone, arqillaceous J) Limestone
NOTES: 0u shown throuqh range of one stanrlard deviation
r = Correlation roefficient ---+---------r------__+_ 12000 140()O 1600~
Figure 4. Correlations of Ou to Is for diametral tests using the Is £ PIA method of calculation.
@
2000 4000 6000 8000 ()u, psi
10000
([;
cI> Claystone ~ Saney shale 13> Srale (limev) @ . ~
~
Sandstone Limestone, Limestor.e, Limestone
dolomitic argillaceous
NOTES: Qu shown through ranae of one standarrl neviation
r = Correlation Coefficient
12000 140no 160M
Figure 5. Correlations of Qu to Is for axial tests usina the Is PIA method of calculation.
18
Is, Psi
800
600
400
200
1000
Is, Psi
800
600
400
200
./ ./
./
,." 1- <D Claystone
<Z> Sandy shale (j) Shale (limey) @ Sandstone
/' @ ./ -
-:
~ Limestone, dolomitic ~ Limestone, ar9i1laceous crY Limestone
~
2000
Figure 6.
2000
4000 6000 8000 Qu, psi
10000
NOTES: Ou shown through range of one standard deviation
r = Correlation Coefficient
12000 14000 16000
Correlations of Ou to Is for axial tests using the length adjusted, Is = P/d 2 method of calculation.
./
./ ./
./
4000
~
6000
a·1 'O
®
8000 Qu, psi
10000
'.J)
<I> Claystone <Z> Sandy sha Ie 0> Shale (limey) ~ Sandstone ~ Limestone, dolomitic ~ Limestone, argillaceous i1l Limestone
NOTES: ~ g~~t~~~~~~hd~~~gfion r = Correlation Coefficient
12000 14000 16000
Figure 7. Correlations of Qu to Is for axial tests using the length adjusted, Is - PIA method of calculation.
19

plus or minus the averaged unconfined compressive strength for the rock type noted. The
axial test correlations encompass a range of specimen length to diameter ratios of 0.6
to l.2. Also plotted on each figure are the overall correlation by that method for all
tests combined. These plots show graphically that correlations for individual rock type
are at significant variance from the overall correlation, regardless of the method of
calculation, and that the overall correlation is superior to any individual correlation.
However, the overall correlations developed do not compare well to the general relationship
proposed by Bieniawski for NX cores where Qu approximates 24 Is' It should be noted
however that Bieniawski's relationship encompassed a range of unconfmed strengths greater
by a factor of more than three. It is likely that expanding the range of rock strengths
tested beyond that provided by Missouri's sedimentary formations would improve the
degree of agreement with Bieniawski's general relationship. This is supported by the
tendency found for improved correlation coefficients and coefficients of variation with
increasing strength with both the mortar and rock tested.
20

REFERENCES
1. Protodyakonov, M. M., "Method of Determining Technical Properties of Rock" ,
Proceedings of the International Conference on Strata Control, Paris, Paper C2, pp.
187-195, 1960.
2. D'Andrea, D. V., Fischer, R. L. and Fogelson, D. E., "Prediction of Compressive
Strength of Rock from Other Rock Properties", U.S. Bureau of Mines, Report of
Investigations 6702, 1965.
3. Hiramatsu, Y. and Oka, Y., "Determination of the Tensile Strength of Rock by
Compression Test of an Irregular Test Piece", International Journal of Rock Mechanics
and Mining Science, Volume 3, pp. 89-99, 1966.
4. Broch, E., and Franklin, J. A., "The Point-Load Strength Test", International Journal
of Rock Mechanics and Mining Science, Volume 9, pp. 669-697, 1972.
5. Bieniawski, Z. T., "Estimating the Strength of Rock Materials", Journal of South
African Institute of Mining and Metallurgy, pp. 312-320, 1974.
6. Bieniawski, Z. T., "The Point-Load Test in Geotechnical Practice", Engineering
Geology, Volume 9, pp. 1-11, 1975.
21


11,1111111& I RD0016084
. "
, "


![ROCK POINT 5 1st Bb Trumpet]Cornet 1 Moderato 16 23 …mrwentzel.com/ConcertSongs/Rock Point 5/Rock Point 5-Trpt.pdfROCK POINT 5 2nd Bb Trumpet]Cornet ... The name caught on and rock](https://img.pdfslide.net/doc/110x75/5ac1123c7f8b9a5a4e8cbb23/rock-point-5-1st-bb-trumpetcornet-1-moderato-16-23-point-5rock-point-5-trptpdfrock.jpg)