Embed Size (px)
Citation preview
Evaluation of the South African population census 2011
A presentation for the UN Workshop on Census Evaluation
12 – 16 November 2012Kampala, Uganda
. . . . your leading partner in quality statistics
The roadmap of census 2011
Objectives of data evaluation
Methods of data evaluation used
Demographic data – Population– Fertility– Migration and– Mortality
Lessons learnt
. . . . your leading partner in quality statistics
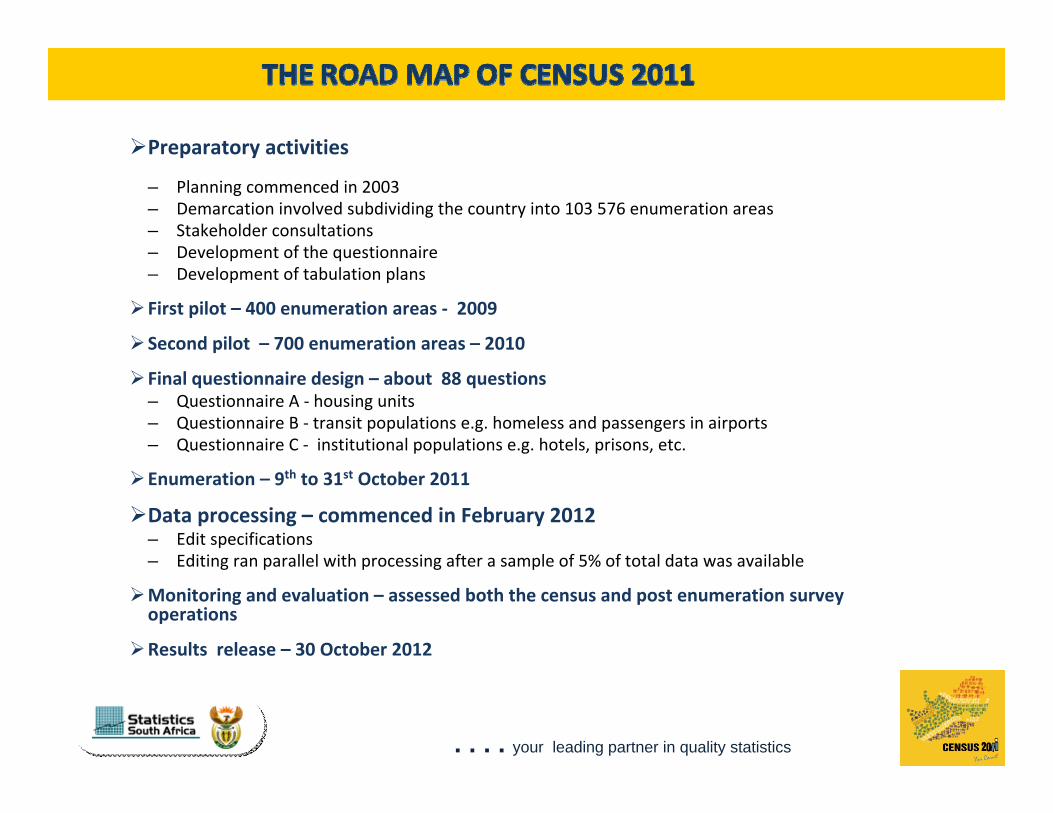
Preparatory activities
– Planning commenced in 2003– Demarcation involved subdividing the country into 103 576 enumeration areas– Stakeholder consultations– Development of the questionnaire– Development of tabulation plans
First pilot – 400 enumeration areas ‐ 2009
Second pilot – 700 enumeration areas – 2010
Final questionnaire design – about 88 questions– Questionnaire A ‐ housing units– Questionnaire B ‐ transit populations e.g. homeless and passengers in airports – Questionnaire C ‐ institutional populations e.g. hotels, prisons, etc.
Enumeration – 9th to 31st October 2011
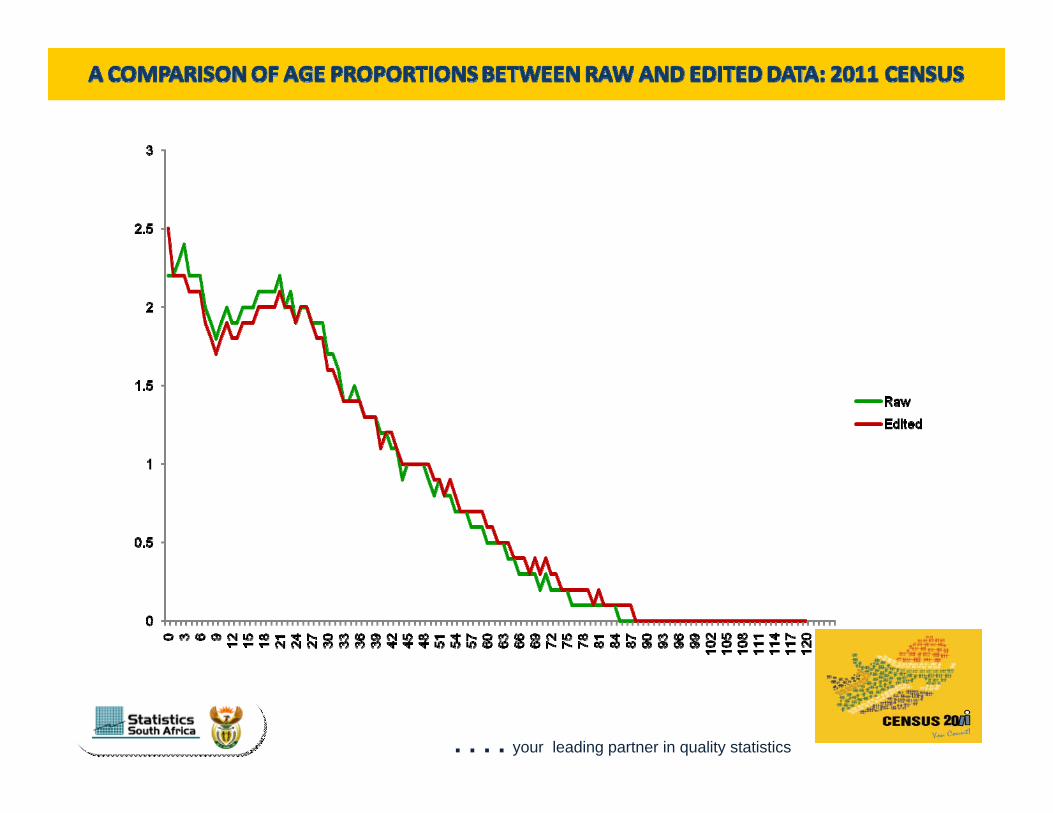
Data processing – commenced in February 2012– Edit specifications– Editing ran parallel with processing after a sample of 5% of total data was available
Monitoring and evaluation – assessed both the census and post enumeration survey operations
Results release – 30 October 2012
. . . . your leading partner in quality statistics
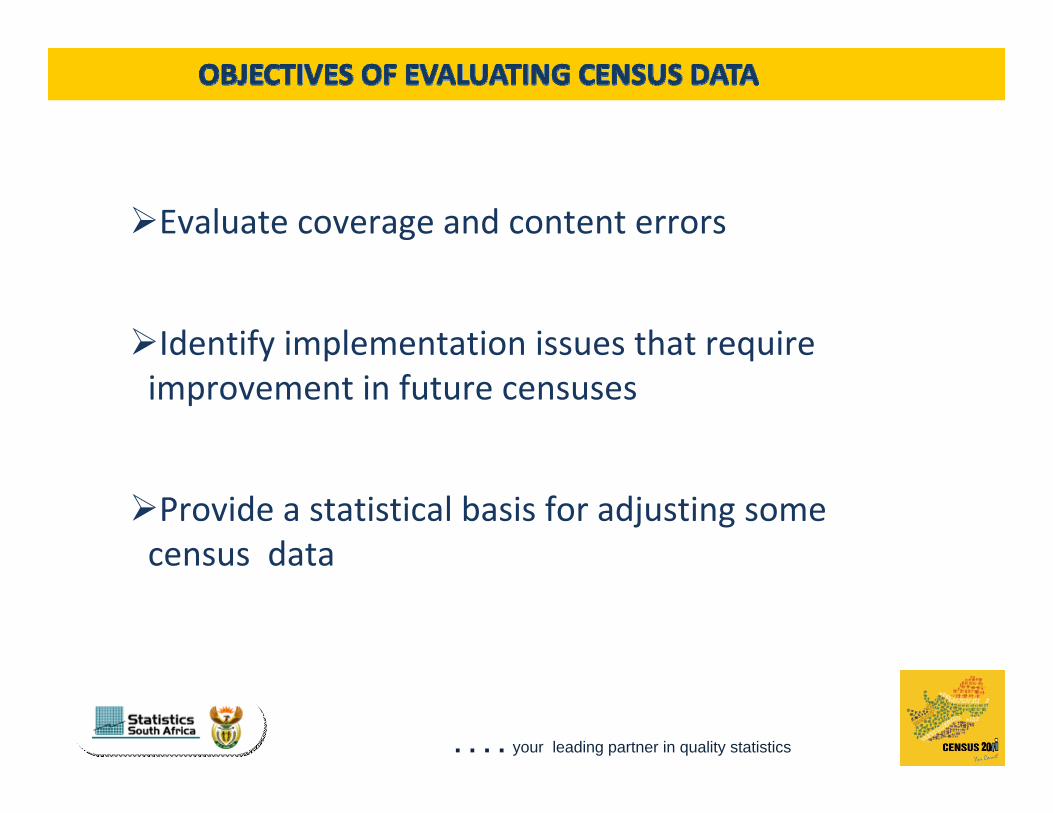
Evaluate coverage and content errors
Identify implementation issues that require improvement in future censuses
Provide a statistical basis for adjusting some census data

. . . . your leading partner in quality statistics
A post enumeration survey was conducted– two months after the main census
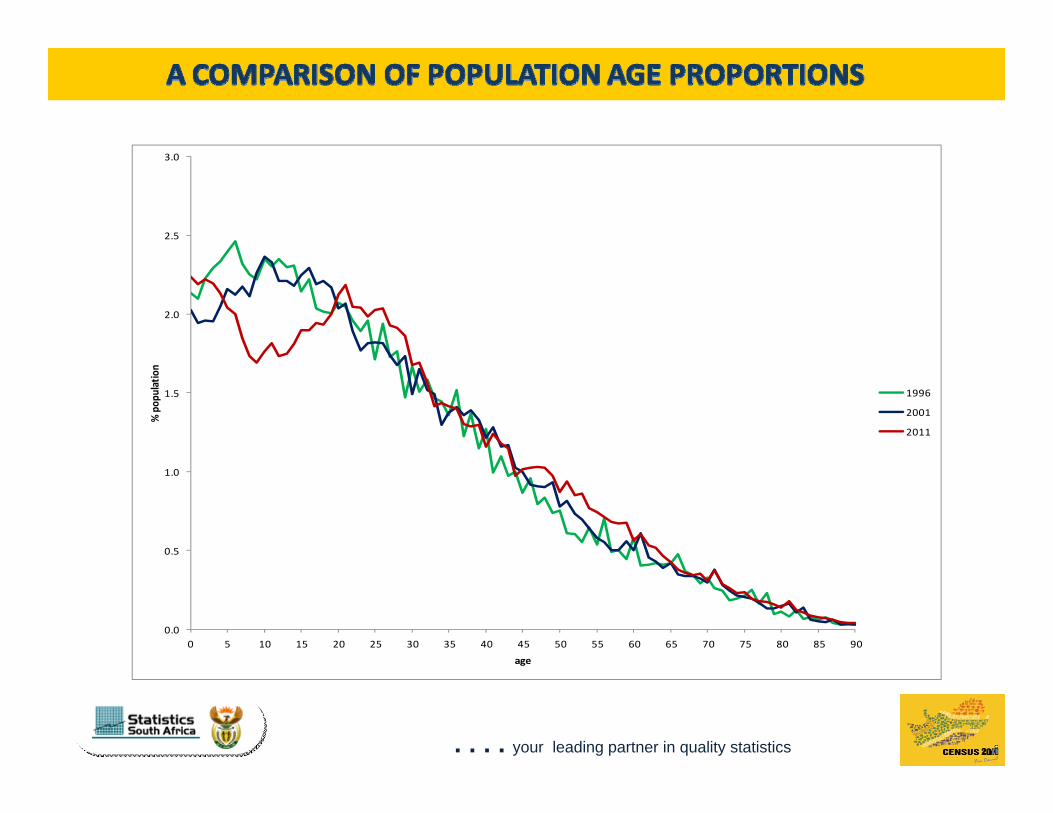
Assessment of age patterns and trends implied by the data
Assessment of comparability with other data such as previous censuses, vital registration and sample surveys
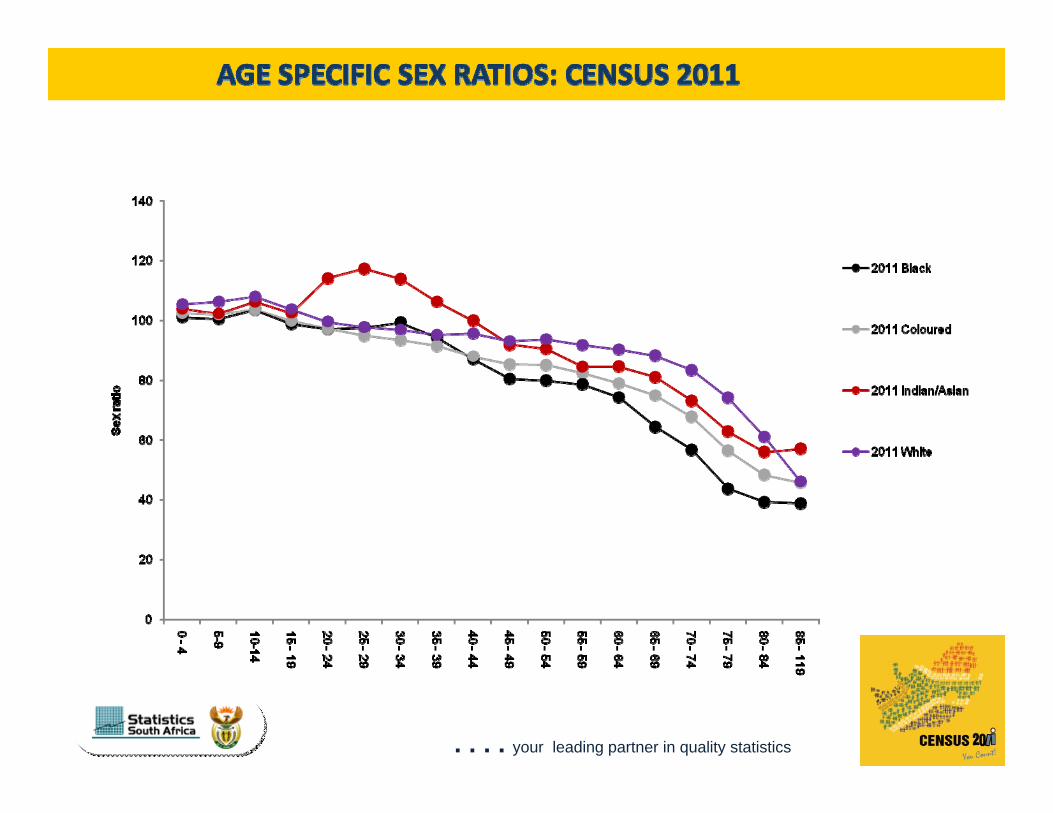
Statistics were also computed for selected indicators e.g. demographic rates and ratios, etc
. . . . your leading partner in quality statistics
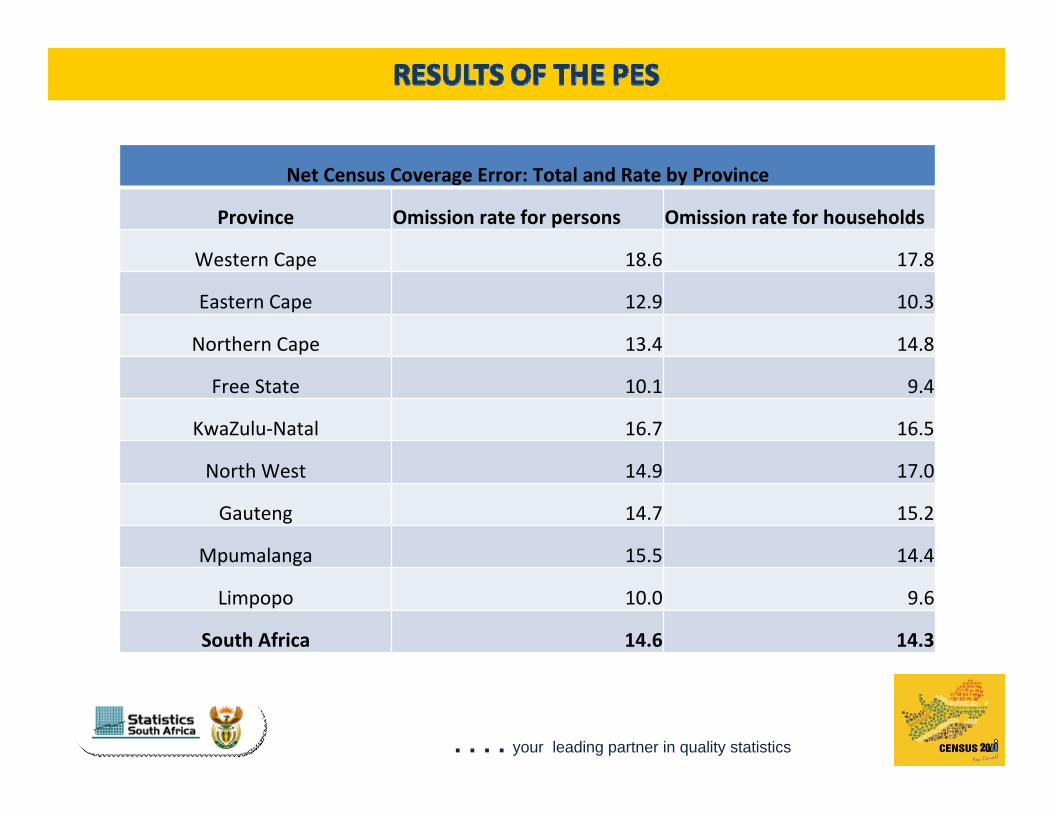
Net Census Coverage Error: Total and Rate by Province
Province Omission rate for persons Omission rate for households
Western Cape 18.6 17.8
Eastern Cape 12.9 10.3
Northern Cape 13.4 14.8
Free State 10.1 9.4
KwaZulu‐Natal 16.7 16.5
North West 14.9 17.0
Gauteng 14.7 15.2
Mpumalanga 15.5 14.4
Limpopo 10.0 9.6
South Africa 14.6 14.3
. . . . your leading partner in quality statistics
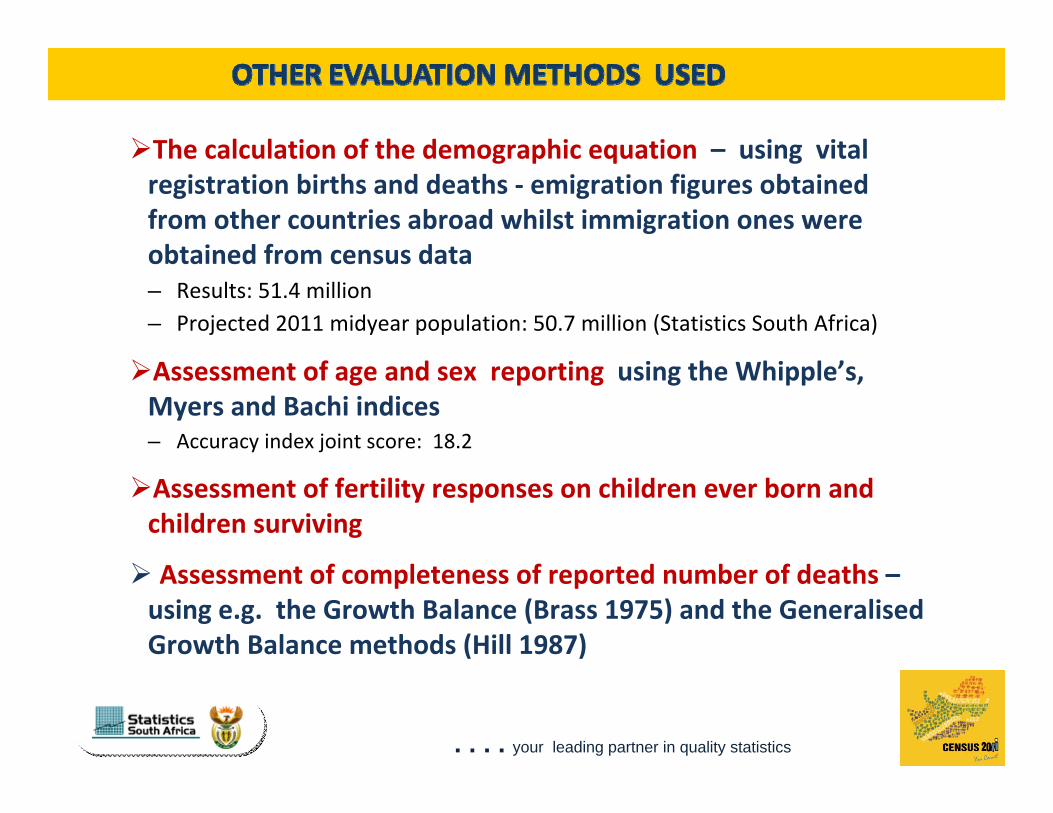
The calculation of the demographic equation – using vital registration births and deaths ‐ emigration figures obtained from other countries abroad whilst immigration ones were obtained from census data– Results: 51.4 million– Projected 2011 midyear population: 50.7 million (Statistics South Africa)
Assessment of age and sex reporting using the Whipple’s, Myers and Bachi indices– Accuracy index joint score: 18.2
Assessment of fertility responses on children ever born and children surviving
Assessment of completeness of reported number of deaths –using e.g. the Growth Balance (Brass 1975) and the Generalised Growth Balance methods (Hill 1987)
. . . . your leading partner in quality statistics
. . . . your leading partner in quality statistics
. . . . your leading partner in quality statistics
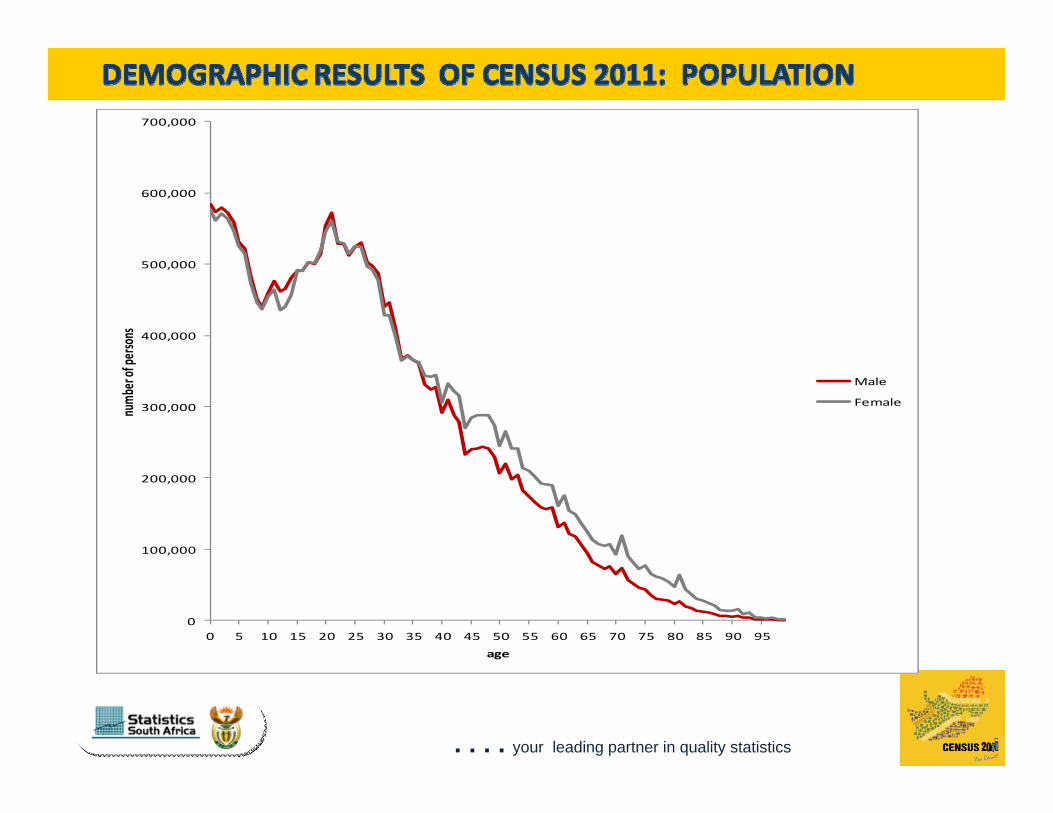
0
100,000
200,000
300,000
400,000
500,000
600,000
700,000
0 5 10 15 20 25 30 35 40 45 50 55 60 65 70 75 80 85 90 95
numbe
r of p
ersons
age
Male
Female
. . . . your leading partner in quality statistics
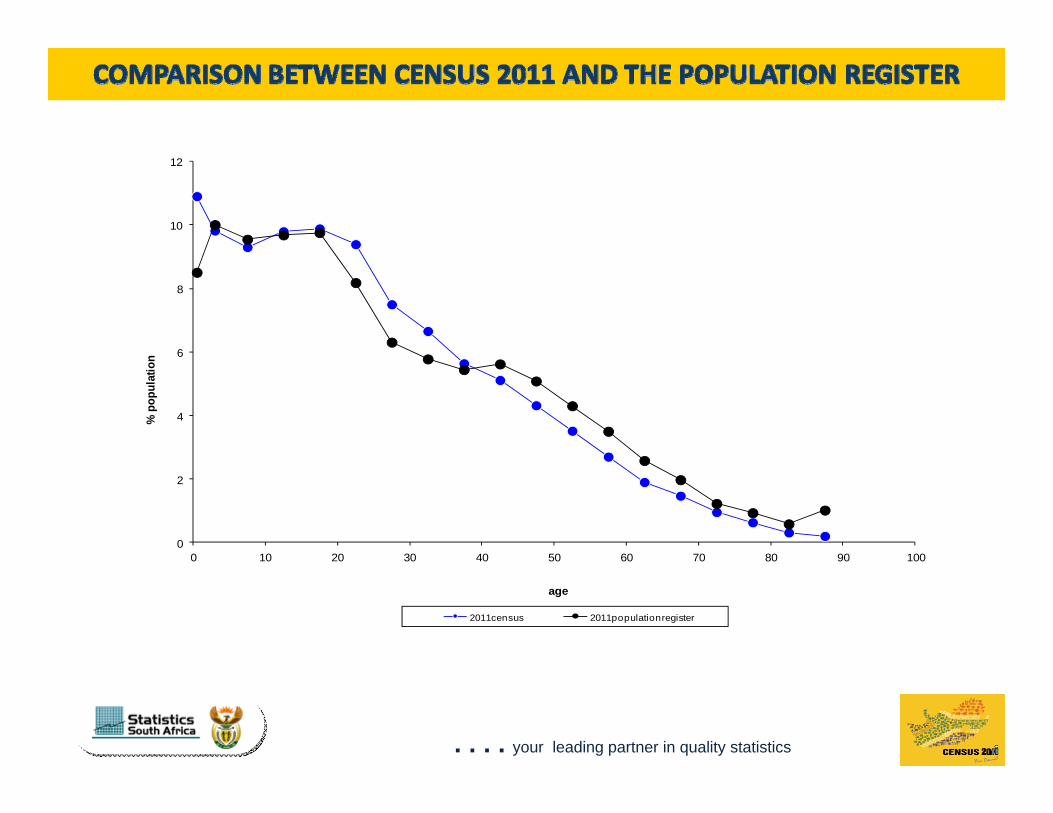
0
2
4
6
8
10
12
0 10 20 30 40 50 60 70 80 90 100
% p
opul
atio
n
age
2011census 2011populationregister
. . . . your leading partner in quality statistics
0.0
0.5
1.0
1.5
2.0
2.5
3.0
0 5 10 15 20 25 30 35 40 45 50 55 60 65 70 75 80 85 90
% pop
ulation
age
1996
2001
2011
. . . . your leading partner in quality statistics
. . . . your leading partner in quality statistics
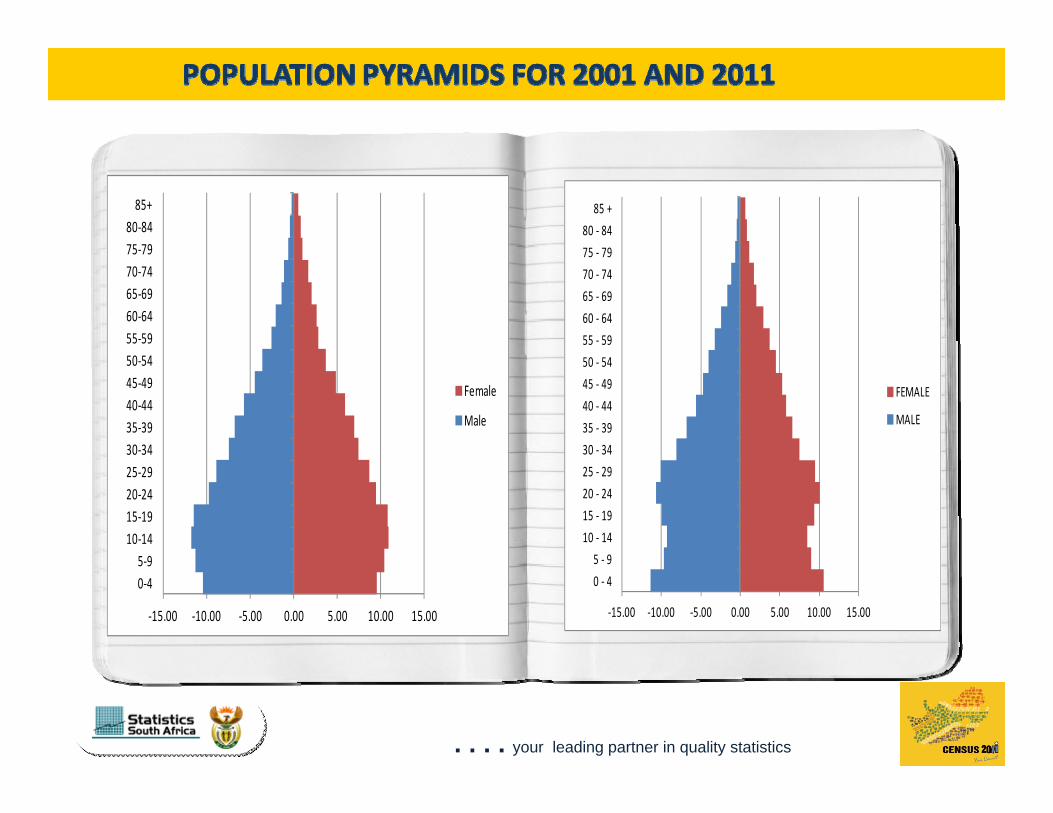
‐15.00 ‐10.00 ‐5.00 0.00 5.00 10.00 15.00
0‐45‐9
10‐1415‐1920‐2425‐2930‐3435‐3940‐4445‐4950‐5455‐5960‐6465‐6970‐7475‐7980‐8485+
Female
Male
‐15.00 ‐10.00 ‐5.00 0.00 5.00 10.00 15.00
0 ‐ 4
5 ‐ 9
10 ‐ 14
15 ‐ 19
20 ‐ 24
25 ‐ 29
30 ‐ 34
35 ‐ 39
40 ‐ 44
45 ‐ 49
50 ‐ 54
55 ‐ 59
60 ‐ 64
65 ‐ 69
70 ‐ 74
75 ‐ 79
80 ‐ 84
85 +
FEMALE
MALE
. . . . your leading partner in quality statistics
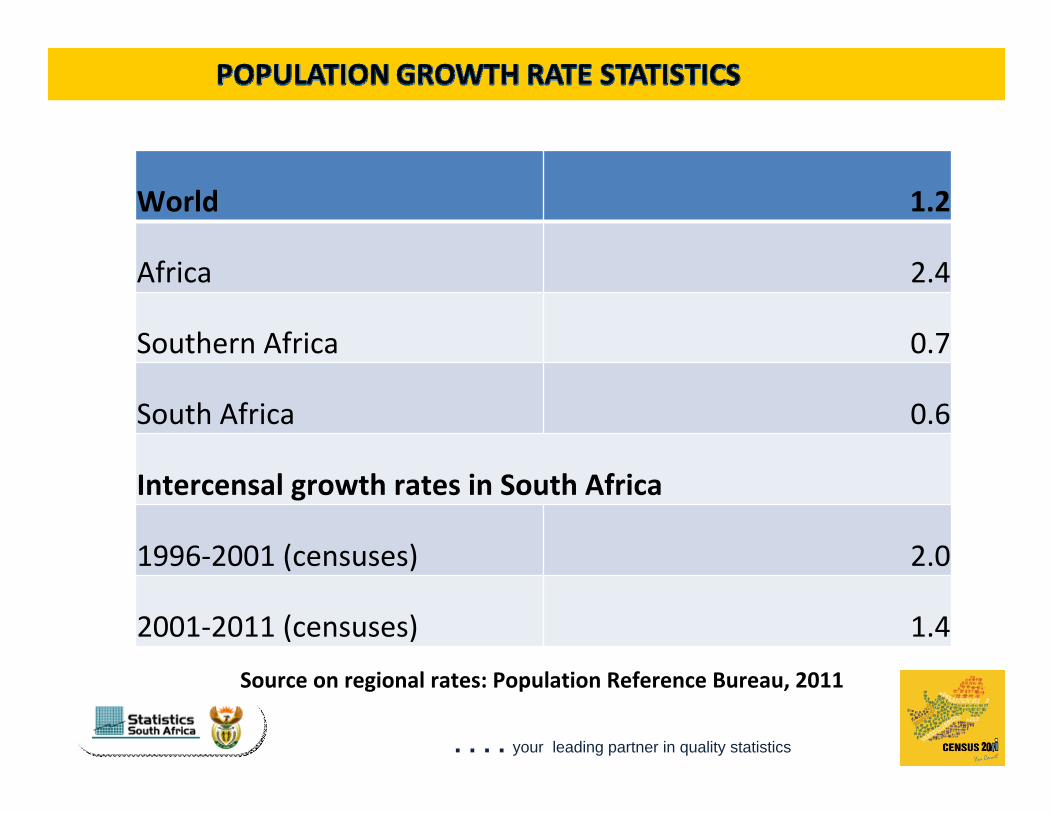
World 1.2
Africa 2.4
Southern Africa 0.7
South Africa 0.6
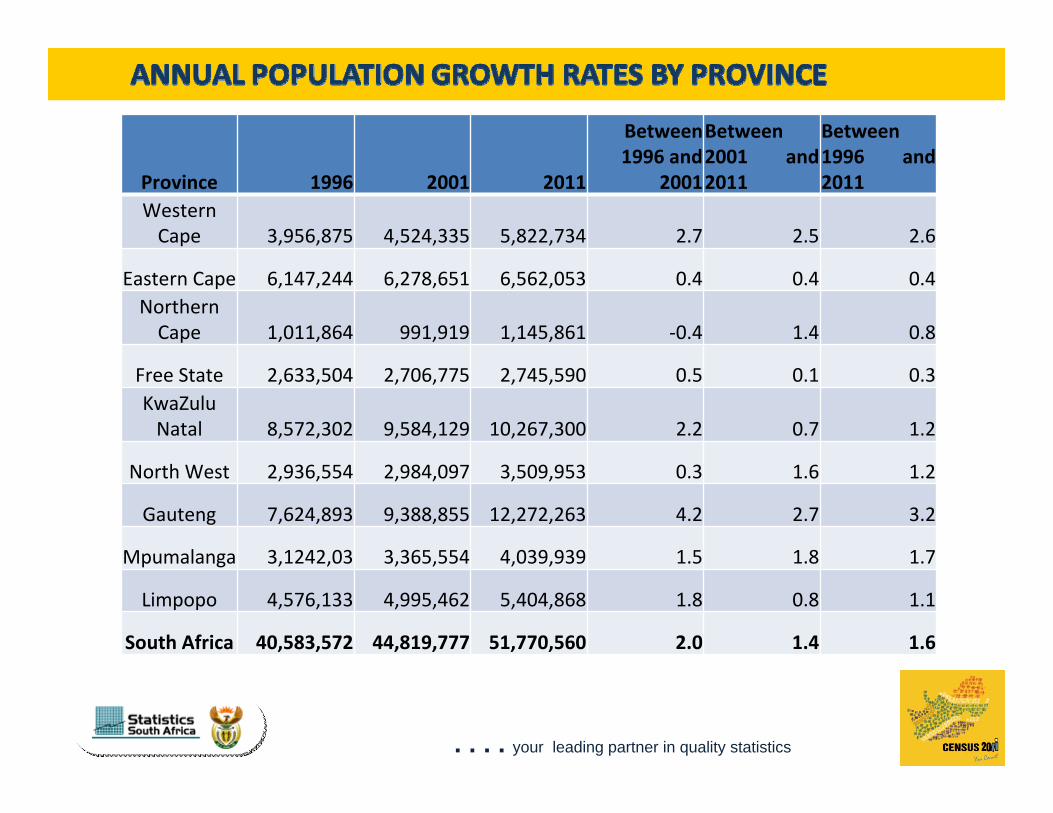
Intercensal growth rates in South Africa
1996‐2001 (censuses) 2.0
2001‐2011 (censuses) 1.4
Source on regional rates: Population Reference Bureau, 2011
. . . . your leading partner in quality statistics
Province 1996 2001 2011
Between 1996 and
2001
Between 2001 and 2011
Between 1996 and 2011
Western Cape 3,956,875 4,524,335 5,822,734 2.7 2.5 2.6
Eastern Cape 6,147,244 6,278,651 6,562,053 0.4 0.4 0.4Northern Cape 1,011,864 991,919 1,145,861 ‐0.4 1.4 0.8
Free State 2,633,504 2,706,775 2,745,590 0.5 0.1 0.3KwaZulu Natal 8,572,302 9,584,129 10,267,300 2.2 0.7 1.2
North West 2,936,554 2,984,097 3,509,953 0.3 1.6 1.2
Gauteng 7,624,893 9,388,855 12,272,263 4.2 2.7 3.2
Mpumalanga 3,1242,03 3,365,554 4,039,939 1.5 1.8 1.7
Limpopo 4,576,133 4,995,462 5,404,868 1.8 0.8 1.1
South Africa 40,583,572 44,819,777 51,770,560 2.0 1.4 1.6
. . . . your leading partner in quality statistics
. . . . your leading partner in quality statistics
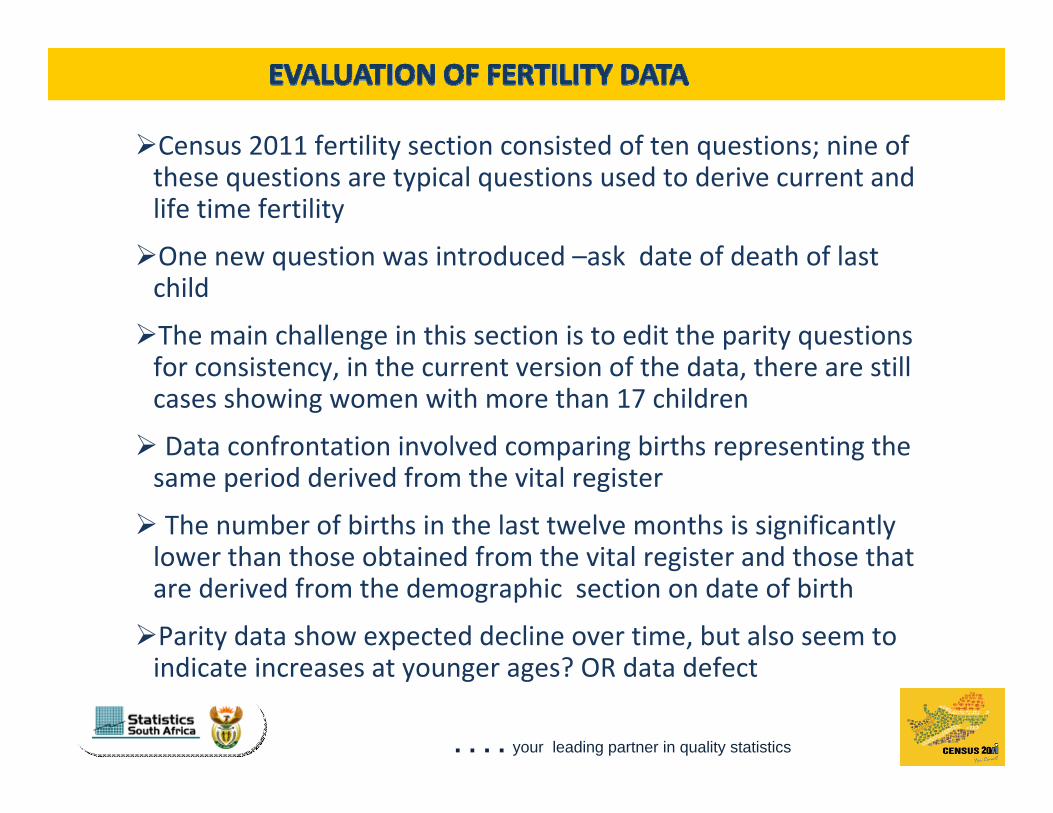
Census 2011 fertility section consisted of ten questions; nine of these questions are typical questions used to derive current andlife time fertility
One new question was introduced –ask date of death of last child
The main challenge in this section is to edit the parity questions for consistency, in the current version of the data, there are still cases showing women with more than 17 children
Data confrontation involved comparing births representing the same period derived from the vital register
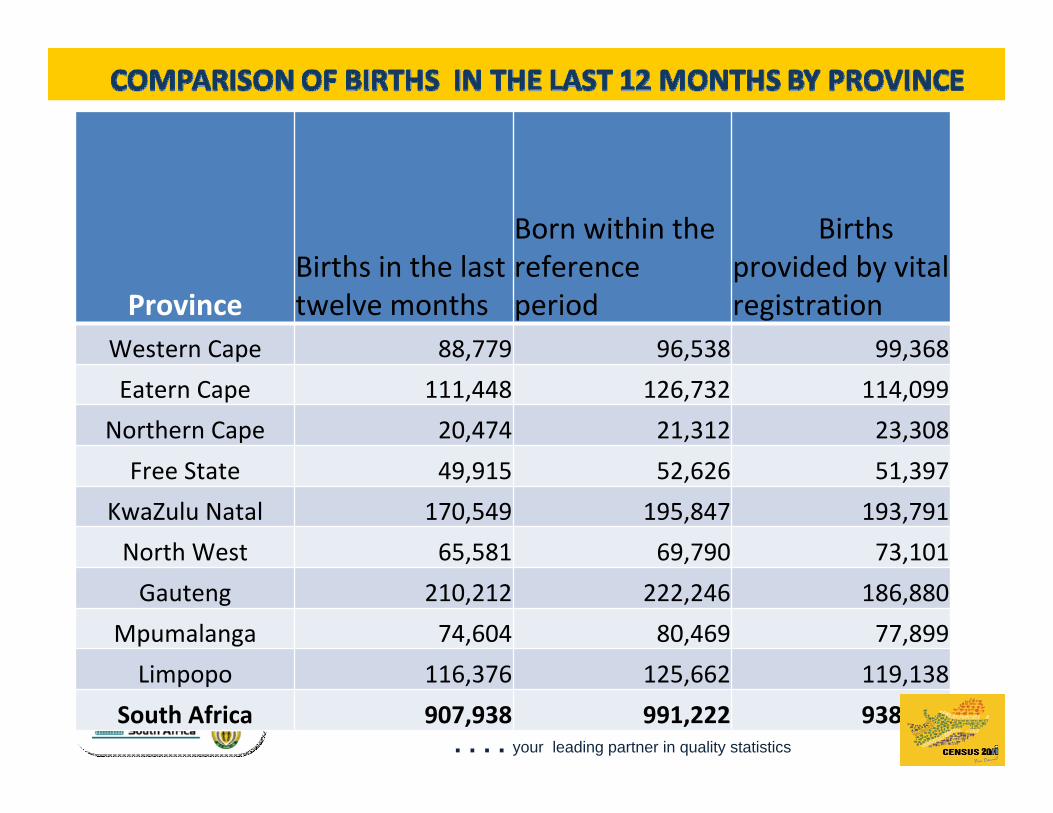
The number of births in the last twelve months is significantlylower than those obtained from the vital register and those thatare derived from the demographic section on date of birth
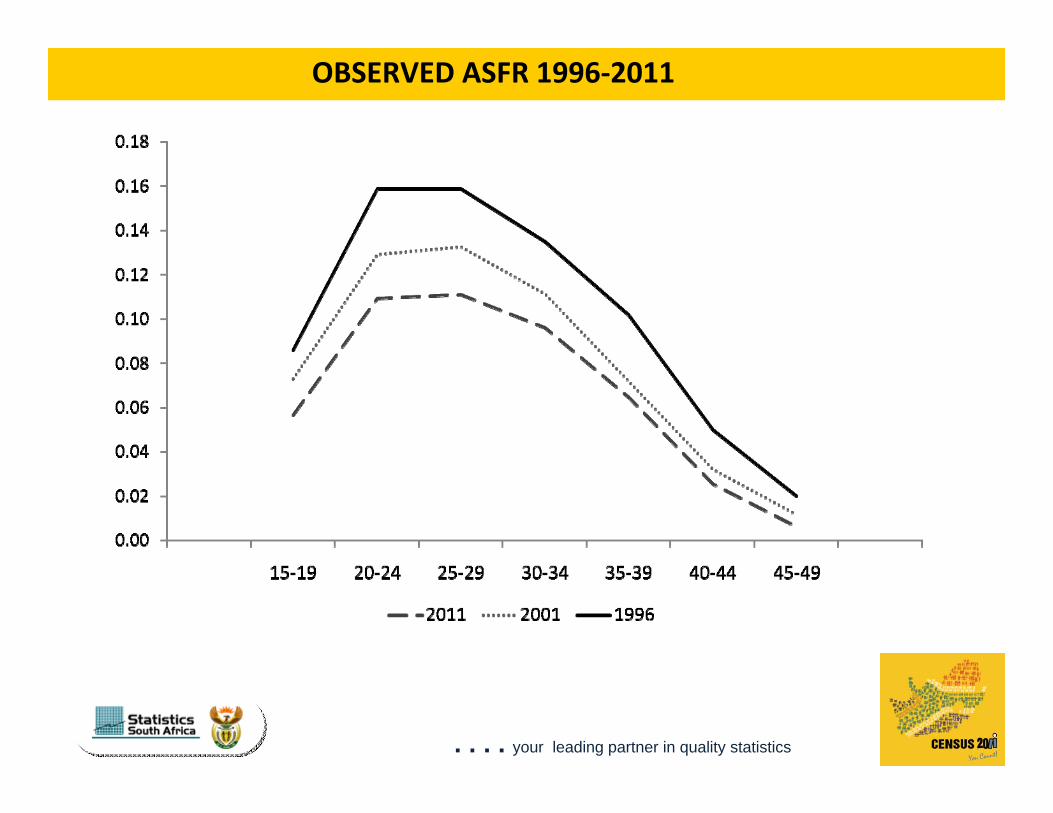
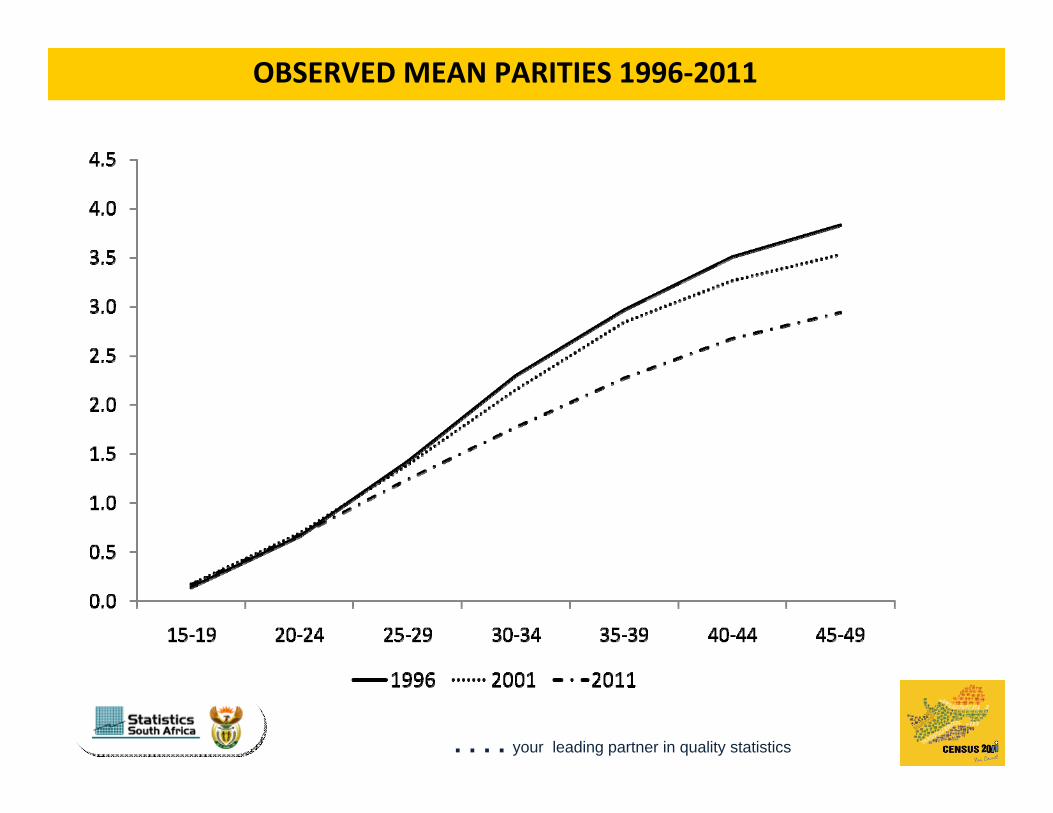
Parity data show expected decline over time, but also seem to indicate increases at younger ages? OR data defect
. . . . your leading partner in quality statistics
ProvinceBirths in the last twelve months
Born within the reference period
Births provided by vital registration
Western Cape 88,779 96,538 99,368
Eatern Cape 111,448 126,732 114,099
Northern Cape 20,474 21,312 23,308
Free State 49,915 52,626 51,397
KwaZulu Natal 170,549 195,847 193,791
North West 65,581 69,790 73,101
Gauteng 210,212 222,246 186,880
Mpumalanga 74,604 80,469 77,899
Limpopo 116,376 125,662 119,138
South Africa 907,938 991,222 938,981
. . . . your leading partner in quality statistics
OBSERVED ASFR 1996‐2011
. . . . your leading partner in quality statistics
OBSERVED MEAN PARITIES 1996‐2011
. . . . your leading partner in quality statistics
. . . . your leading partner in quality statistics
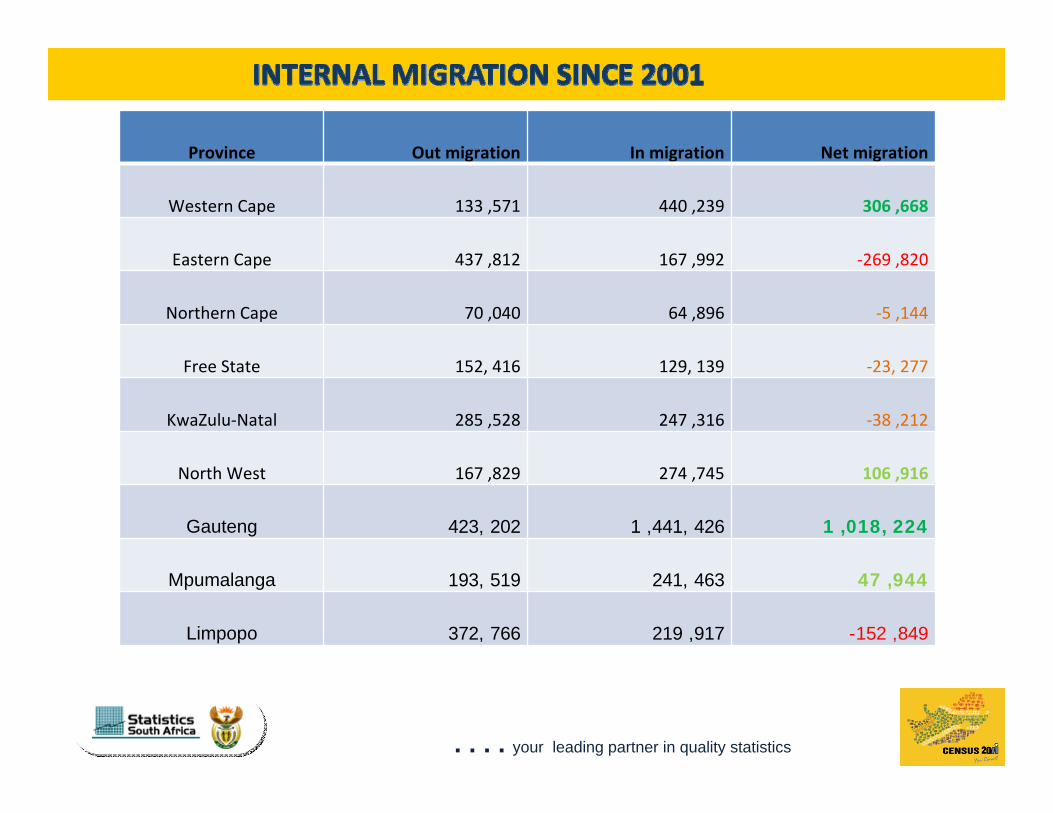
Province Out migration In migration Net migration
Western Cape 133 ,571 440 ,239 306 ,668
Eastern Cape 437 ,812 167 ,992 ‐269 ,820
Northern Cape 70 ,040 64 ,896 ‐5 ,144
Free State 152, 416 129, 139 ‐23, 277
KwaZulu‐Natal 285 ,528 247 ,316 ‐38 ,212
North West 167 ,829 274 ,745 106 ,916
Gauteng 423, 202 1 ,441, 426 1 ,018, 224
Mpumalanga 193, 519 241, 463 47 ,944
Limpopo 372, 766 219 ,917 -152 ,849
. . . . your leading partner in quality statistics
. . . . your leading partner in quality statistics
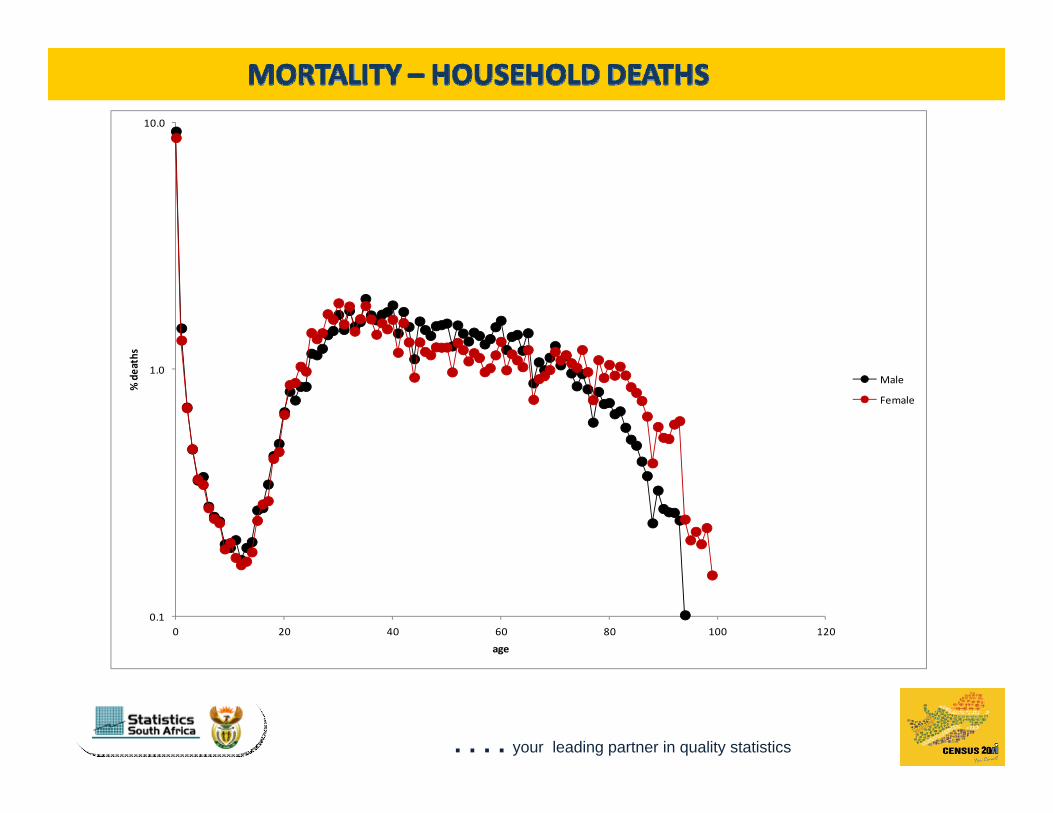
0.1
1.0
10.0
0 20 40 60 80 100 120
% deaths
age
Male
Female
. . . . your leading partner in quality statistics
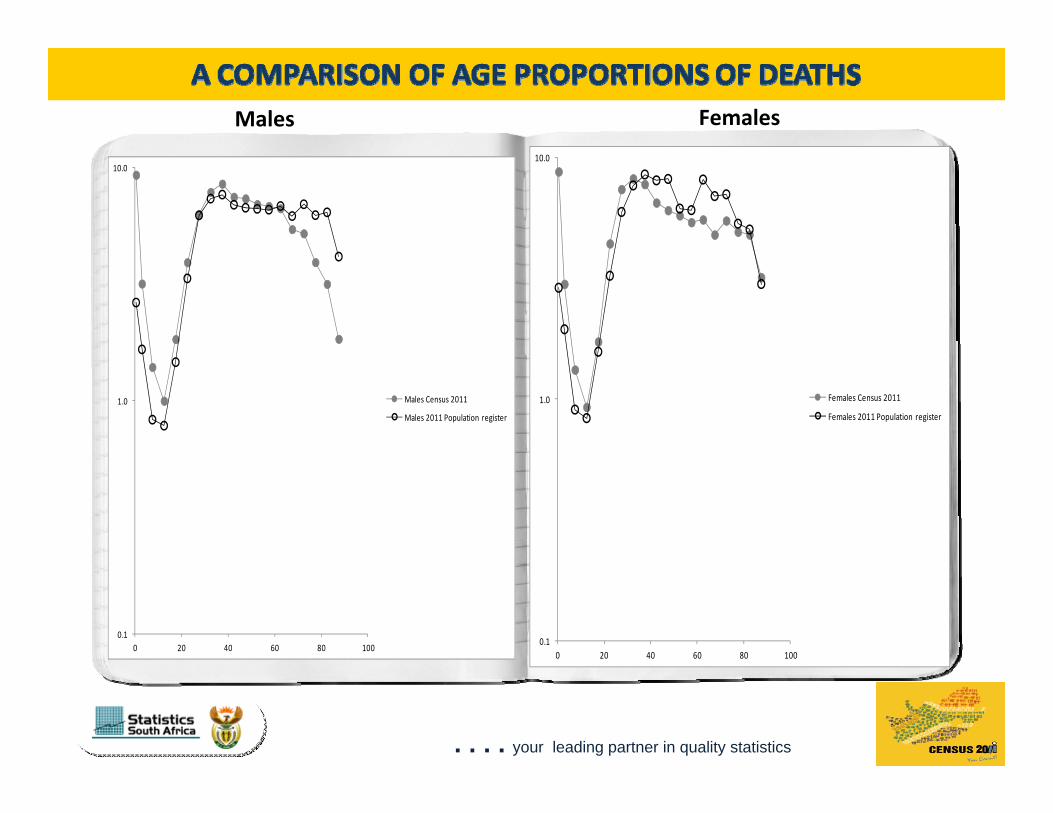
Males Females
0.1
1.0
10.0
0 20 40 60 80 100
Males Census 2011
Males 2011 Population register
0.1
1.0
10.0
0 20 40 60 80 100
Females Census 2011
Females 2011 Population register
. . . . your leading partner in quality statistics
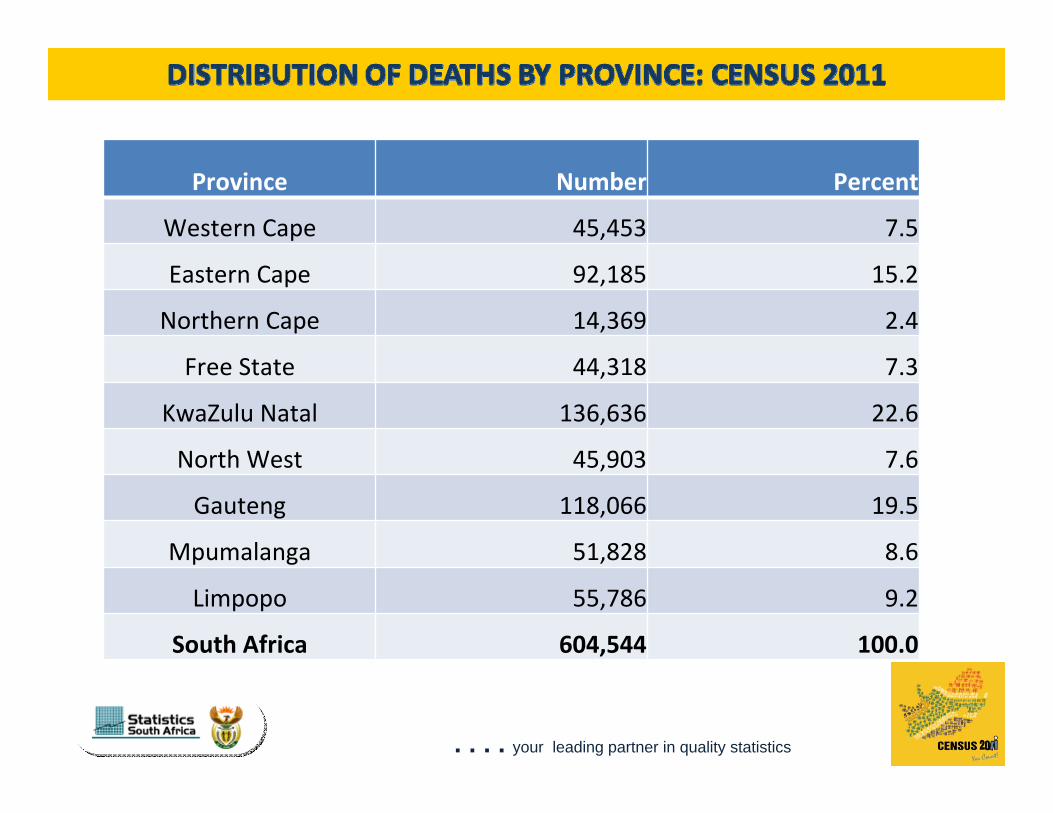
Province Number Percent
Western Cape 45,453 7.5
Eastern Cape 92,185 15.2
Northern Cape 14,369 2.4
Free State 44,318 7.3
KwaZulu Natal 136,636 22.6
North West 45,903 7.6
Gauteng 118,066 19.5
Mpumalanga 51,828 8.6
Limpopo 55,786 9.2
South Africa 604,544 100.0
. . . . your leading partner in quality statistics
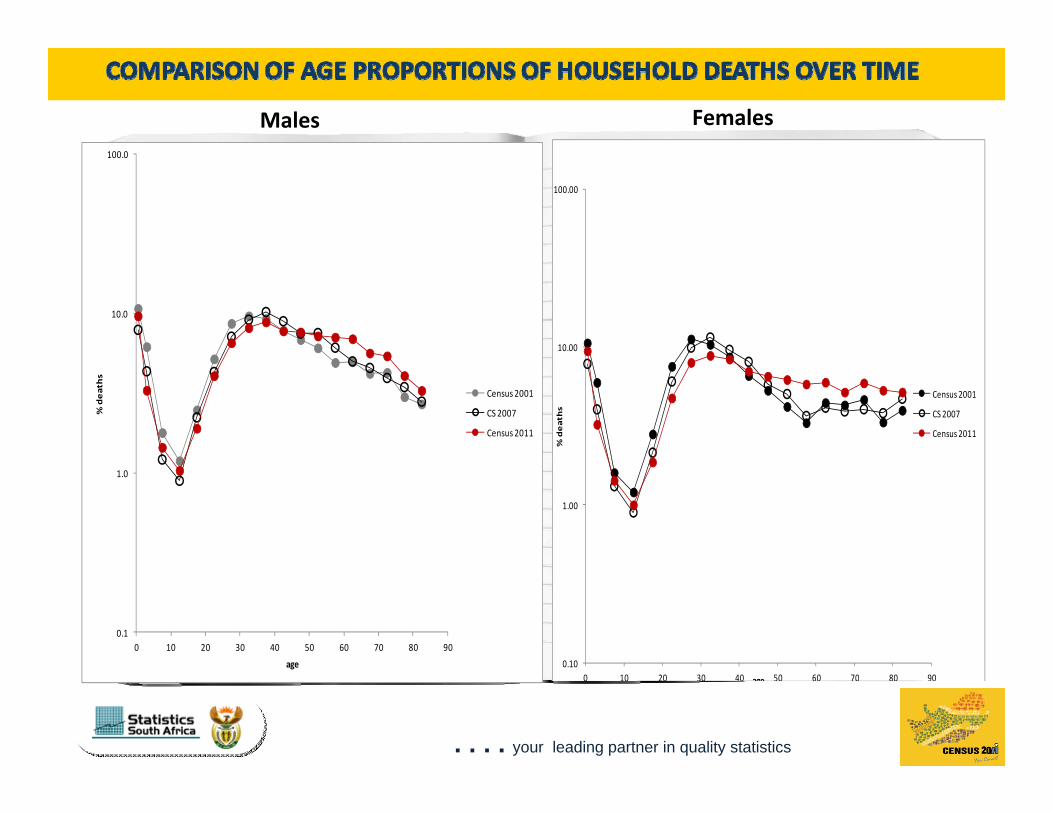
0.1
1.0
10.0
100.0
0 10 20 30 40 50 60 70 80 90
% deaths
age
Census 2001
CS 2007
Census 2011
0.10
1.00
10.00
100.00
0 10 20 30 40 50 60 70 80 90
% deaths
age
Census 2001
CS 2007
Census 2011
Males Females
. . . . your leading partner in quality statistics
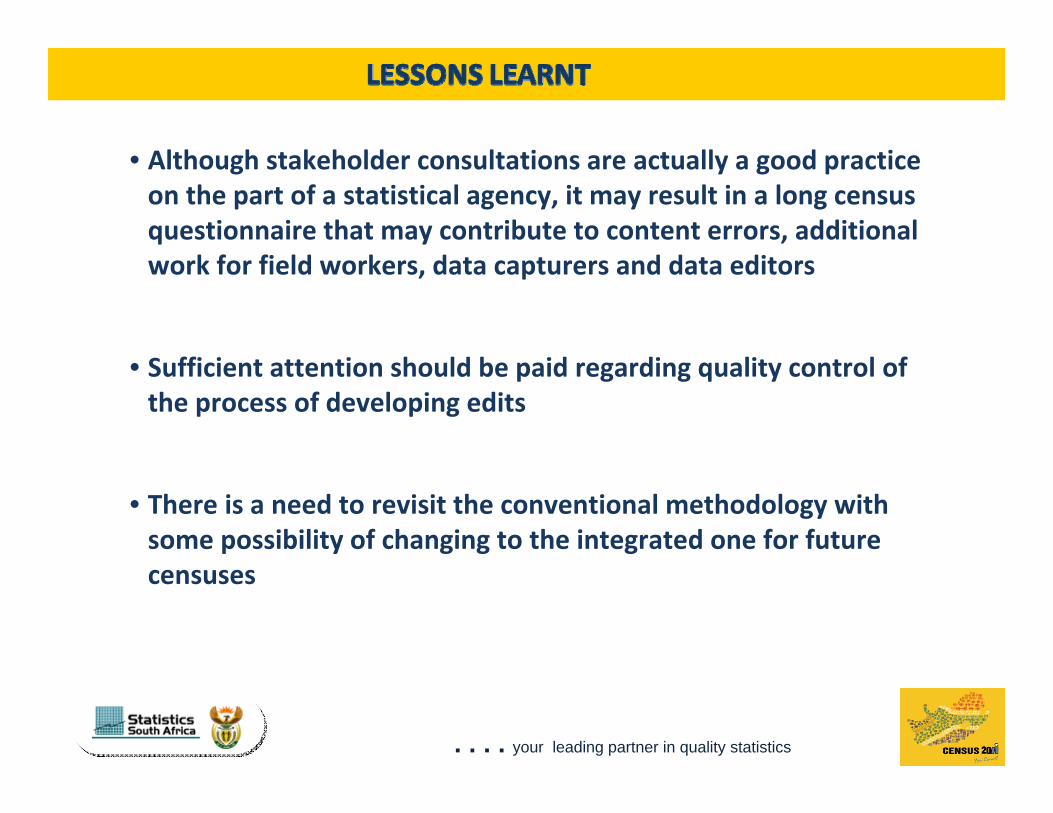
• Although stakeholder consultations are actually a good practice on the part of a statistical agency, it may result in a long census questionnaire that may contribute to content errors, additional work for field workers, data capturers and data editors
• Sufficient attention should be paid regarding quality control ofthe process of developing edits
• There is a need to revisit the conventional methodology with some possibility of changing to the integrated one for future censuses
. . . . your leading partner in quality statistics