Embed Size (px)
Citation preview

Evaluation of urban solid waste degradation processes in landfill.
A case study
GC5 Landfilling
Mário A. T. RUSSO - Polytechnic Institute of Viana do Castelo, Av do Atlântico – 4900 -348 Viana do Castelo, Portugal [email protected]
José M. P. VIEIRA – University of Minho, Campus de Gualtar, Braga, Portugal. [email protected]
ABSTRACT
Prediction of biodegradation processes for the organic fraction of municipal solid waste is an issue of paramount interest for efficient landfill design and management. This paper presents the results obtained from an extended field work developed in a time period of ten years. Solid waste samples from a landfill were collected at different depths in 5 holes with depth of 17 m, and analyzed in laboratory for the determination of total organic matter, raw cellulose, humic acid, volatile solids, total organic carbon, total nitrogen, and C/N ratio. These parameters were used to estimate the efficiency of waste disposed degradability. This research also aimed the determination of the total period of organic matter degradation and the end of leachate and gas production in a landfill, in order to establish accurate post-closure and monitoring policies. Landfill of Matosinhos, a Portuguese municipality with 165 000 inhabitants, and located in the metropolitan area of Oporto, was used as case study for applying the planned methodologies. Approximate 700 000 tonnes of solid waste have been disposed on the studied landfill since 1978, occupying, in 1993, a volume of more than 106 m3, to which a daily deposition of more than 200 tonnes of municipal solid waste have been added until 2003. From the results obtained, it was concluded that total organic matter, raw cellulose, humic acid, volatile solids, and C/N appear to be adequate parameter indicators of solid waste degradability.
Key words: landfill, biodegradation, total organic mater, decay rate, raw cellulose
1 INTRODUCTION
Landfilling of municipal solid waste remains one of the most common waste management practices around the world. Even considering recent European policy regarding reduction of biodegradable matter in sanitary landfills, these infra-structures will continue to be very important for solid waste management.
Landfilling plays a fundamental role in solid waste management policies, despite disposal reduction of organic matter due to legislation of UE, that impose precise targets until 2016,

when the amount of biodegradable urban waste allowed for disposal will be 35% of that generated in 1995. This amount of organics continue to be enough to produce leachate and biogas in order to consider the landfill as a bioreactor where emissions production will remains for a long period of time, depending on operational and local conditions. Knowledge on quality and time of the biogas production is an important issue in order to predicting the final stabilization of the landfill or, in other words, the more safety state of the landfill.
Results for the evolution of key organic matter degradation parameters, such as: total organic matter (TOM), raw cellulose (RC), humic acid (HA), volatile solids (VS), total organic carbon (TOC), total organic nitrogen (TN), and C/N ratio, along the stratographic profile of the waste disposed off in a landfill are presented. The field work was based on extracting waste samples from 5 holes (sampling stations) in the cell n2 of the landfill of Matosinhos, a Portuguese municipality with 165 000 inhabitants located in the metropolitan area of Oporto. For that purpose, 2 to 10 years old waste samples were collected.
2 MATERIAL AND METHODS
For solid waste sampling it was adopted the methodology showed in the Figure 1, where the content of residues of each meter of bore hole constitute the analytical sample. Topographic surveys twice a year were used to establish the waste age of each layer, represented in the right column of the figure.
-3.00
Dep
th (m
)
-4.00
-5.00
-6.00
-7.00
-8.00
-9.00
-10.00
-12.00
-13.00
-14.00
-15.00
-17.00
-18.00
-19.00
1
2
3
4
5
7
8
9
10
11
12
13
14
6
SA
MP
LE P
RO
FILE
SA
MP
LE Top Soil and cover
MSW
1
2
10
3
5
8
WA
STE
AG
E (y
ears
)
Material
Figure 1 – Waste sampling profile along the landfill depth
2

A schematic plan representation of the Matosinhos sanitary landfill is presented in the Figure 2, where it is showed the sampling area, the 3 new cells of MSW, the old cell where remains the dumped wastes, the administrative buildings and the leachate treatment plant (LTP).
CELL 3
1 - RECEPTION2 - Administrative Building3 - Workshop/ Garage4 - wheel wash basin5 - Balance6 - AERATED LAGOON and pilot Plant7 - Main biogas colector
LEGEND
8 - Burner9 - BIOGAS-WELL
CELL 2
CELL 1
Cell 2 (NEW CELL)
MSW OLD CELL
LEÇA RIVER Mou
lded
-Wel
l
LANDFILL CROSS SECTION - Matosinhos 1994
1
2
3
45
SAMPLING STATIONS
Figure 2 – Layout and cross section of Matosinhos landfill with sampling stations location
3
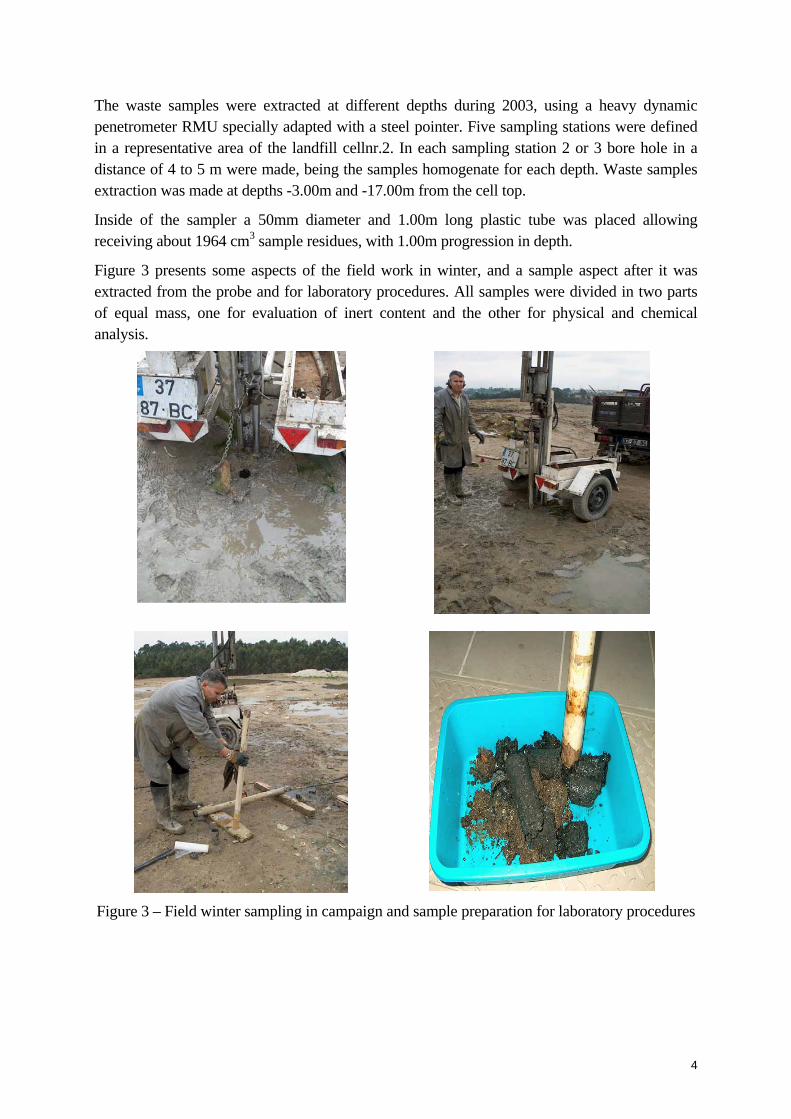
The waste samples were extracted at different depths during 2003, using a heavy dynamic penetrometer RMU specially adapted with a steel pointer. Five sampling stations were defined in a representative area of the landfill cellnr.2. In each sampling station 2 or 3 bore hole in a distance of 4 to 5 m were made, being the samples homogenate for each depth. Waste samples extraction was made at depths -3.00m and -17.00m from the cell top.
Inside of the sampler a 50mm diameter and 1.00m long plastic tube was placed allowing receiving about 1964 cm3 sample residues, with 1.00m progression in depth.
Figure 3 presents some aspects of the field work in winter, and a sample aspect after it was extracted from the probe and for laboratory procedures. All samples were divided in two parts of equal mass, one for evaluation of inert content and the other for physical and chemical analysis.
Figure 3 – Field winter sampling in campaign and sample preparation for laboratory procedures
4

2.1 ANALYTICAL PROCEDURES
2.1.1 TOTAL ORGANIC MATTER
The determination of TOM was carried out by the method of the loss for combustion, described in Russo, M. (1998). This procedure is based on the analytical gravimetric method in which TOM is obtained calculating the difference between the initial and the final sample mass after combustion of the dehydrated sample. The combustion was made at 550 ± 5ºC temperature. In this process, organic mater is oxidised by air oxygen, resulting CO2 and water vapour. Due to the fact that both products are gases, the loss in mass represents the quantity of organic mater present in the sample.
2.1.2 RAW CELLULOSE
500 mg of dry mater is weighed in a 150 mL Erlenmeyer flask to which a 50 mL of acid mixture (90 mL of concentrated HNO3 completed with 1 litre of CH3COOH at 80 %) is added. The condenser is applied and the mixture is boiled for 25 minutes with continuous agitation. The condenser is disassembled and is filtered hot under suction through a melting pot of Goosh (G3), previously weighted. The residue that remains in the filter is washed firstly with 5 mL of hot mixture and then with hot distilled water until the reaction of the filtered reaches neutral pH. After that it is washed several times with alcohol at 95º, and finally with ether. The melting pot is dried in the oven at 100 - 105 ºC during 12 hours. Then, it is weighed as soon as it is cooled.
100. xhtSampleWeig
WeightseRawCelluloRC =
RC (%) = raw cellulose
2.1.3 HUMIC ACID
The methodology used for the determination of humic acid was the same used for soils, adapted by Chaminade (Russo, 1998), using a 200 mg triturated dry sample with 50 mL of a sodium pyrophosfate solution 0.1 mol/L with pH adjusted to 9 in order to avoid humic acid oxidation. Extraction time was 12 hours with occasional manual agitation. The mixture was filtered and it was added to the filtrated 5 mL of concentrated sulphuric acid and then left it for 30 minutes in order to precipitate the humic acid.
Other filtration must be made, washing the residue with sulphuric acid solution 10% (v/v) until complete elimination of the sodium pyrophosfate, verified by “spot-test” of one drop of silver nitrate 10% (h/v) in some drops of the filtered until the AgNO3 is not darkish.
In the same filtered, the residue was treated with 20 mL of potassium permanganate 0.02 mol/L acidified with 20 mL of sulphuric acid 20% (v/v). This solution was maintained at 100ºC for a period of 30 minutes, and mixed in a 100mL balloon, before flow into the filter. After cooling it
5

was added 20 mL of standard-solution of sodium oxalate 0,05 mol/L, passing from violet colour to colourless. The titration of the excess of the oxalate is made with potassium permanganate 0.02M, just obtain a rosaceous coloration. The miliequivalents of potassium permanganate consumed in the titration is equivalent to the miliequivalents of humic acid in the initial sample.
2.1.4 TOTAL NITROGEN
Total nitrogen present in the sample is the organic nitrogen (proteins, peptides nucleid acid and urea) and inorganic nitrogen. The analytical determination of the organic content and ammonium was made by the Kjeldahl-Nitrogen method, using the digestion system Kjeldahl - Tecator 2006, the distillation system Kjeldahl - Tecator Kjeltec System 1002 and the purification system of gaseous from the digestion. The inorganic nitrogen content was made by determination of the nitrate procedure.
2.1.5 TOTAL ORGANIC CARBON (TOC)
A sample of 100 mg of solid waste previously dehydrated and triturated in a pyrex Erlenmeyer flask of 150 mL and a electric grinder, passed through a sieve 200 (#0.074mm). Reagents: 20 mL K2Cr2O7 by 8%; 30 mL of concentrated sulphuric acid; distilled water; 200 mL of a sodium fluorite 7.5 g/L ; 3-5 drops of diphenylamine. Solution of Mohr salt 0.2N.
The TOC is given by the expression:
mNVVC AB
5.7)( −=
Where:
C – Organic carbon (% of dry matter);
VB - volume of Mohr salt used in the white (mL); B
VA - volume of Mohr salt used in the sample (mL;)
N – Mohr salt normality;
m – dry mass (g).
3 RESULTS AND DISCUSSION
3.1 TOTAL ORGANIC MATTER
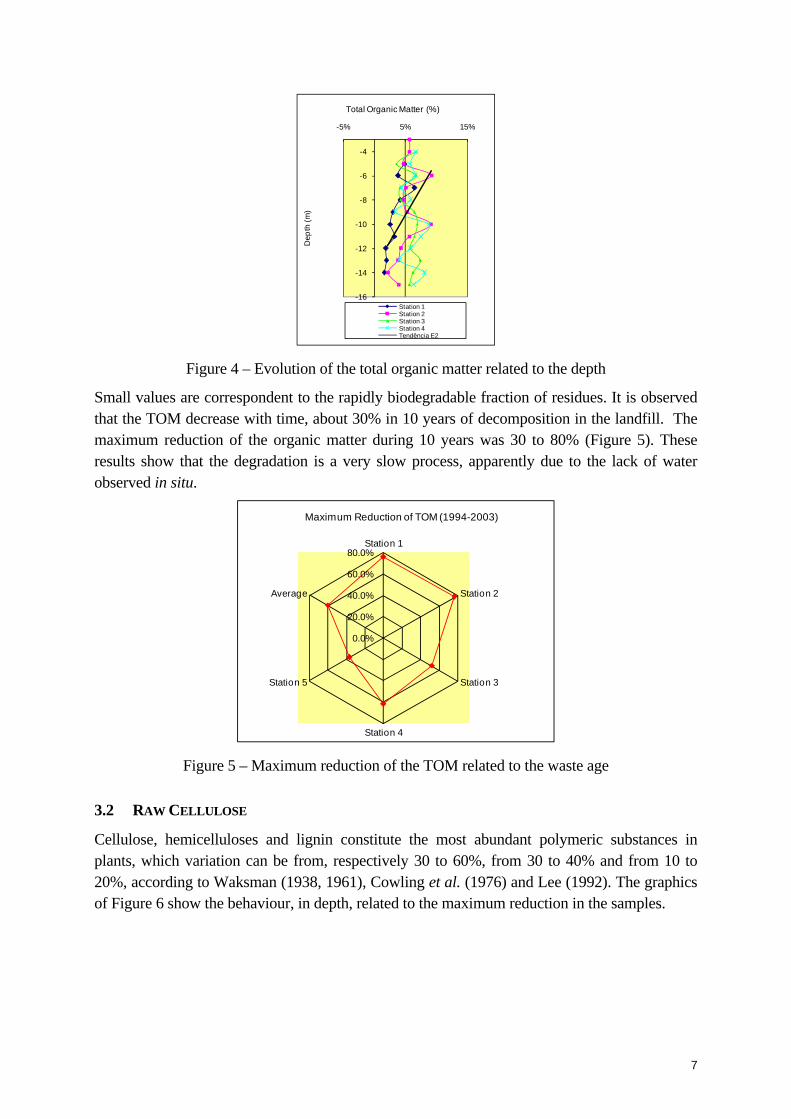
Figure 4 presents TOM evaluation with respect to the landfill depth, from the waste “raw material”. The waste organic content is used to microorganisms metabolism originating TOM decreasing in function of time. The content of TOM obtained from the mass balance by French method CEMAGREF-ANRED (Centre d´Etudes du Machinisme Agricole, du Genie Rural et des Eaux et Forets - Agence National de Récuperation et Élimination de Dêchets) adapted by Russo (2005) to landfill solid waste, also shows the same decreasing tendency.
6
-16
-14
-12
-10
-8
-6
-4
-5% 5% 15%
Dep
th (m
)
Total Organic Matter (%)
Station 1Station 2Station 3Station 4Tendência E2
Figure 4 – Evolution of the total organic matter related to the depth
Small values are correspondent to the rapidly biodegradable fraction of residues. It is observed that the TOM decrease with time, about 30% in 10 years of decomposition in the landfill. The maximum reduction of the organic matter during 10 years was 30 to 80% (Figure 5). These results show that the degradation is a very slow process, apparently due to the lack of water observed in situ.
0.0%
20.0%
40.0%
60.0%
80.0%Station 1
Station 2
Station 3
Station 4
Station 5
Average
Maximum Reduction of TOM (1994-2003)
Figure 5 – Maximum reduction of the TOM related to the waste age
3.2 RAW CELLULOSE
Cellulose, hemicelluloses and lignin constitute the most abundant polymeric substances in plants, which variation can be from, respectively 30 to 60%, from 30 to 40% and from 10 to 20%, according to Waksman (1938, 1961), Cowling et al. (1976) and Lee (1992). The graphics of Figure 6 show the behaviour, in depth, related to the maximum reduction in the samples.
7

The type of wood found in the landfill is very diverse, including agglomerates, furniture pieces, branches of trees and others wood materials, that could confer different degradation rate, related to the depth. In fact, the cellulose presents biodegradability from 50 to 90%, the hemicelulose about 70% and the lignin is practically no-biodegradable, which confirms the results presented by Waksman (1938, 1961).
0%
20%
40%
60%
80%
Station 1
Station 2
Station 3
Station 4
average
Reduction of Raw Cellulose (10 years landfilled)
R2 = 0.8937
-16
-14
-12
-10
-8
-6
-4
-2
00% 10% 20% 30%
dept
h (m
)
Raw Cellulose
Station 1 Station 2 Station 3Station 4 Tendência
Figure 6 – Raw cellulose related to depth and reduction in 10 years
From Figure 6, it has been possible to observe the behaviour of sampled waste in 3 stations relatively heterogeneous (slightly more in sampling station 4), but always with the tendency of decreasing. In fact, the decay was high, suggesting the utilization of this source of carbon by microorganisms, usually consumed when other carbon sources more bioavailable begin to disappear. The maximum decay rate (in %) in sampling stations 1, 2, 3 and 4 was 62, 77, 62, and 62, respectively.
The degradation rate is influenced by environmental factors such as N availability, oxygen, pH, moisture, presence of other carbohydrates and lignin (Alexander, 1977).
3.3 HUMIC ACID
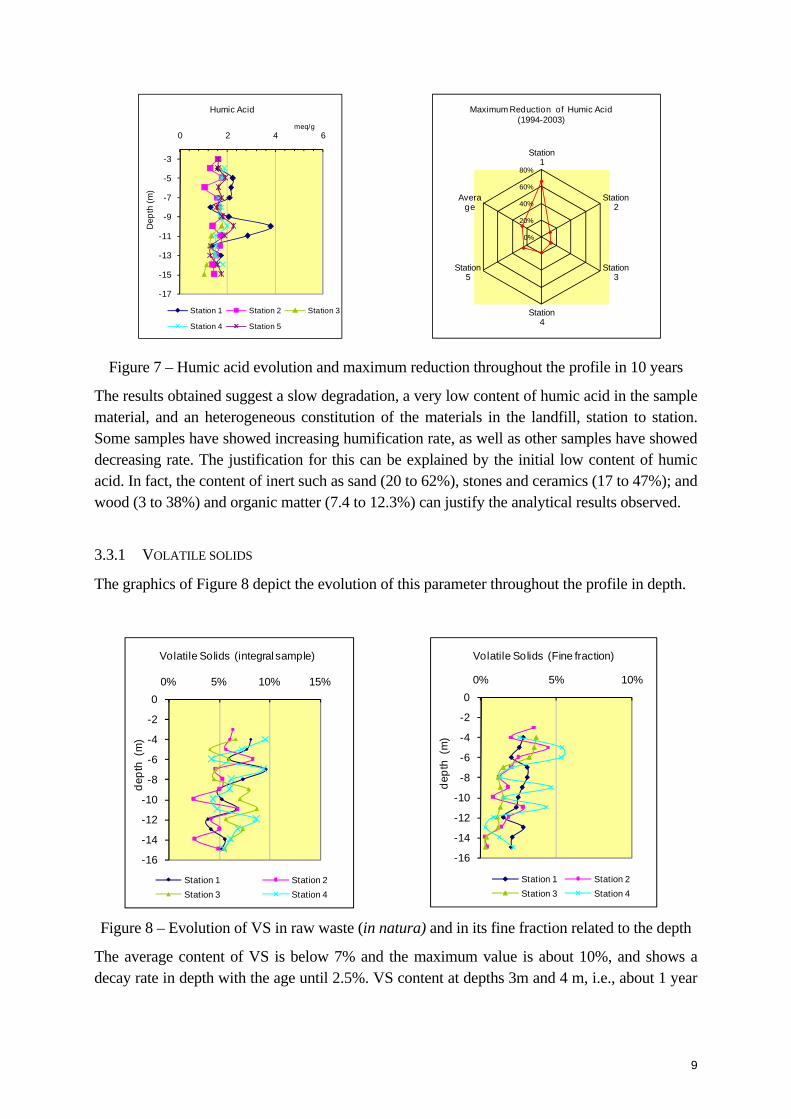
Table 2 presents the results of humic acid evolution obtained in the 5 sampling stations throughout the profile in depth. The graphics of Figure 7 present the relative distribution and maximum reduction in 10 years.
8
-17
-15
-13
-11
-9
-7
-5
-3
0 2 4 6D
epth
(m)
meq/g
Humic Acid
Station 1 Station 2 Station 3
Station 4 Station 5
0%
20%
40%
60%
80%
Station 1
Station 2
Station 3
Station 4
Station 5
Average
Maximum Reduction of Humic Acid (1994-2003)
Figure 7 – Humic acid evolution and maximum reduction throughout the profile in 10 years
The results obtained suggest a slow degradation, a very low content of humic acid in the sample material, and an heterogeneous constitution of the materials in the landfill, station to station. Some samples have showed increasing humification rate, as well as other samples have showed decreasing rate. The justification for this can be explained by the initial low content of humic acid. In fact, the content of inert such as sand (20 to 62%), stones and ceramics (17 to 47%); and wood (3 to 38%) and organic matter (7.4 to 12.3%) can justify the analytical results observed.
3.3.1 VOLATILE SOLIDS
The graphics of Figure 8 depict the evolution of this parameter throughout the profile in depth.
-16
-14
-12
-10
-8
-6
-4
-2
00% 5% 10% 15%
dept
h (m
)
Volatile Solids (integral sample)
Station 1 Station 2Station 3 Station 4
-16
-14
-12
-10
-8
-6
-4
-2
00% 5% 10%
dept
h (m
)
Volatile Solids (Fine fraction)
Station 1 Station 2Station 3 Station 4
Figure 8 – Evolution of VS in raw waste (in natura) and in its fine fraction related to the depth
The average content of VS is below 7% and the maximum value is about 10%, and shows a decay rate in depth with the age until 2.5%. VS content at depths 3m and 4 m, i.e., about 1 year
9
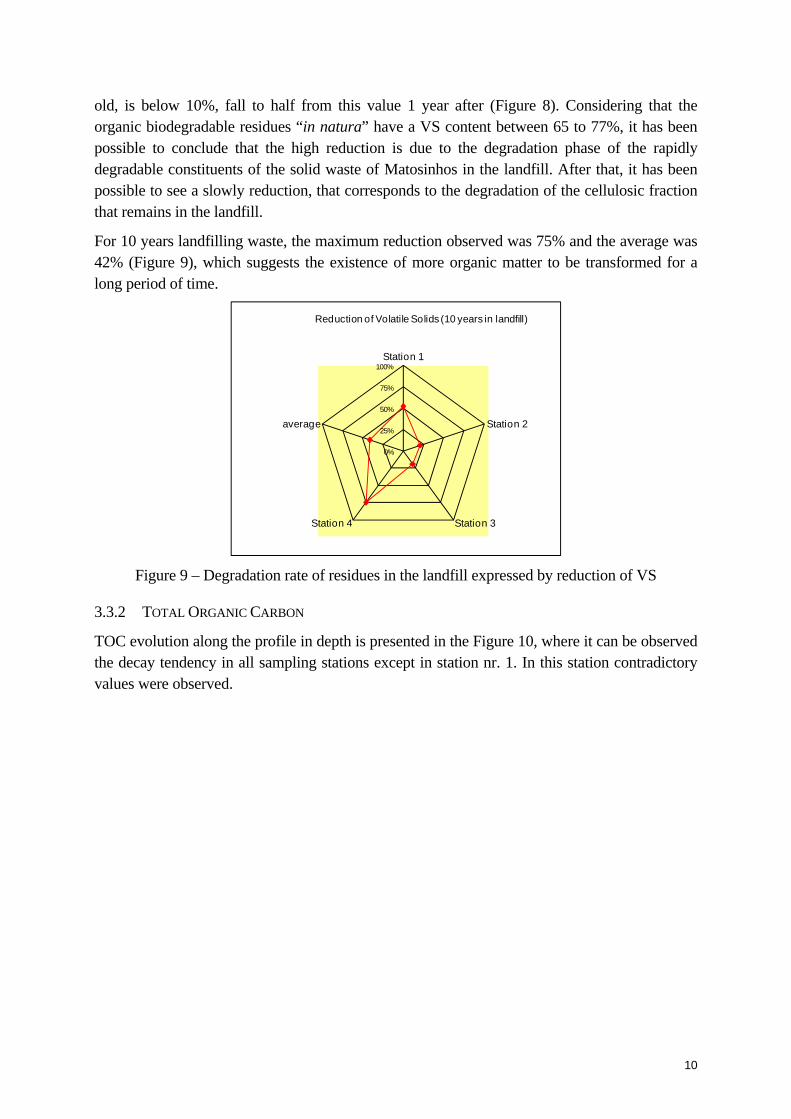
old, is below 10%, fall to half from this value 1 year after (Figure 8). Considering that the organic biodegradable residues “in natura” have a VS content between 65 to 77%, it has been possible to conclude that the high reduction is due to the degradation phase of the rapidly degradable constituents of the solid waste of Matosinhos in the landfill. After that, it has been possible to see a slowly reduction, that corresponds to the degradation of the cellulosic fraction that remains in the landfill.
For 10 years landfilling waste, the maximum reduction observed was 75% and the average was 42% (Figure 9), which suggests the existence of more organic matter to be transformed for a long period of time.
0%
25%
50%
75%
100%Station 1
Station 2
Station 3Station 4
average
Reduction of Volatile Solids (10 years in landfill)
Figure 9 – Degradation rate of residues in the landfill expressed by reduction of VS
3.3.2 TOTAL ORGANIC CARBON
TOC evolution along the profile in depth is presented in the Figure 10, where it can be observed the decay tendency in all sampling stations except in station nr. 1. In this station contradictory values were observed.
10
-16
-14
-12
-10
-8
-6
-4
-2
00% 25% 50% 75% 100%
dept
h (m
)
Total Organic Carbon
Station 1 Station 2Station 3 Station 4Tendência E2,E3,E4
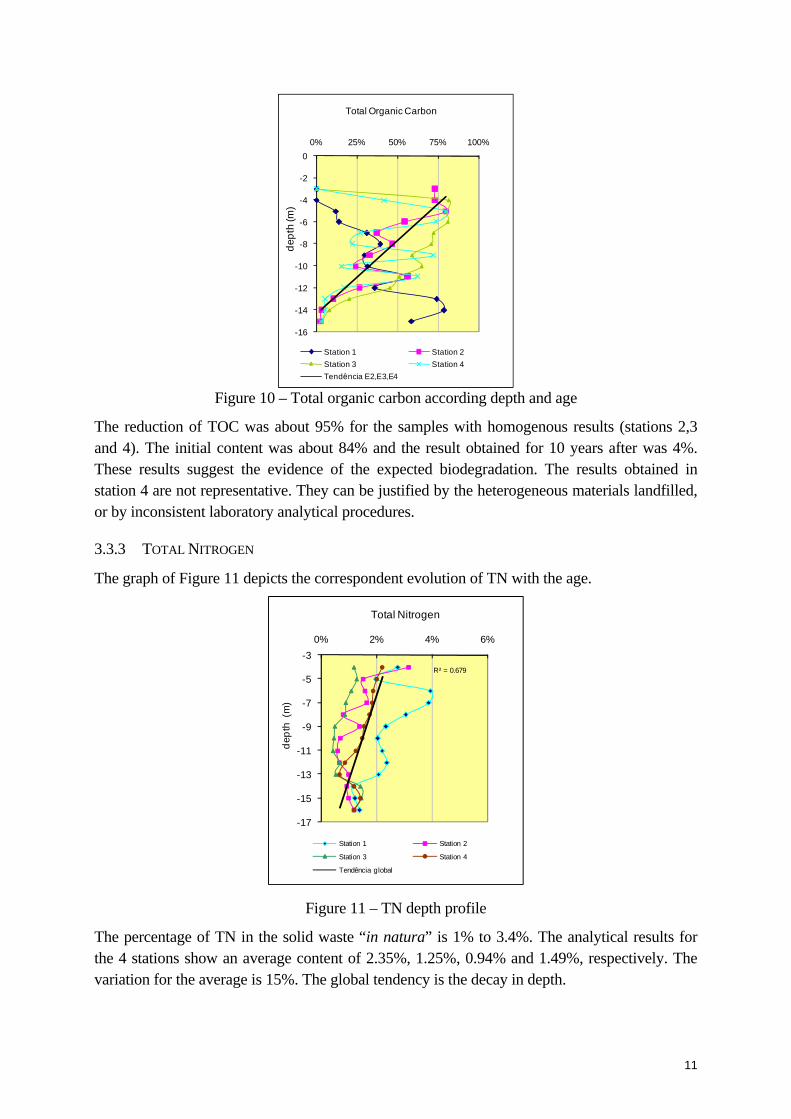
Figure 10 – Total organic carbon according depth and age
The reduction of TOC was about 95% for the samples with homogenous results (stations 2,3 and 4). The initial content was about 84% and the result obtained for 10 years after was 4%. These results suggest the evidence of the expected biodegradation. The results obtained in station 4 are not representative. They can be justified by the heterogeneous materials landfilled, or by inconsistent laboratory analytical procedures.
3.3.3 TOTAL NITROGEN
The graph of Figure 11 depicts the correspondent evolution of TN with the age.
R² = 0.679
-17
-15
-13
-11
-9
-7
-5
-30% 2% 4% 6%
dept
h (m
)
Total Nitrogen
Station 1 Station 2
Station 3 Station 4
Tendência global
Figure 11 – TN depth profile
The percentage of TN in the solid waste “in natura” is 1% to 3.4%. The analytical results for the 4 stations show an average content of 2.35%, 1.25%, 0.94% and 1.49%, respectively. The variation for the average is 15%. The global tendency is the decay in depth.
11

3.3.4 CARBON/NITROGEN RATIO
Table 1 presents the C/N ratio in the 4 stations related to the depth.
Table 1 – C/N ratios observed in the samples along the depth profile
Station 1 Station 2 Station 3 Station 4 Average-4 23.2 67.5 18.9 36.5-5 6.1 52.9 61.4 39.6 40.0-6 3.6 34.7 73.9 38.7 37.7-7 8.0 22.8 80.0 14.7 31.4-8 12.8 58.4 81.7 12.7 41.4-9 12.5 23.7 112.5 46.8 48.9
-10 15.3 34.5 134.6 10.3 48.7-11 25.5 95.9 112.0 49.3 70.7-12 15.1 39.1 67.2 20.2 35.4-13 35.6 10.4 37.1 8.2 22.8-14 67.3 3.3 5.8 4.7 20.3
depth (m)C/N
Figure 12 shows the evolution of the C/N ratio and the decay rate observed in the samples related to the depth.
-16
-14
-12
-10
-8
-6
-4
-2
00.0 50.0 100.0 150.0
dept
h (m
)
Rácio C/N
Estação 1 Estação 2Estação 3 Estação 4Tendência E2 Tendência E3Tendência E4
0%
20%
40%
60%
80%
100%
station 1
station 2
station 3
station 4
station 5
average
Reduction of racio C/N (1994-2003)
Figure 12 – Carbon/Nitrogen and decay rate in samples landfilled from 1994 to 2003
C/N ratio is a very common indicator for the biological stability of the organic matter (Morel, et al., 1985). Some authors have considered an interval of variation more appropriated to reflect the metabolic mechanisms involved. In fact, the availability of carbon is the major source of energy for the microorganisms, but their efficiency is not 100% and the need for C is grater than for N. However, N can be limitative in the metabolic process as it is essential for the microorganisms growth and cell production.
Assuming a C/N of 12 as an indicator of good biodegradability, the values observed in the samples with 10 years old (depths from -3m to -17m), have reached a level of degradation grater than 50%. In the biological conversion processes of organic matter the initial C/N ratio
12
of 30:1 to 40:1, is considered by several authors as a good ratio. The maximum observed ratio decay was about 90%, but the average of reduction of C/N was 71%. Some results show grater C/N ratios in 5 years old sample when compared with younger waste samples. This can be justified by the fact of the different content in each profile and carbon of lignin and cellulose is not easily ready for utilization by the microorganisms. Other justification for this can be the existence of a layer of solid waste in the landfill with very low C/N ratio due to the high content of N, which tendency is the loss of N, as stated by Zucconi et al. (1987).
4 CONCLUSIONS
The results obtained in this reported research work revealed TOM, RC, HA, VS, and C/N ratio as appropriate parameters for estimating waste degradation in landfills. They allow predicting solid waste degradation with age, along the landfill profile depth, evaluating the reduction of the parameter values from the initial stage until 10 years after waste disposal.
The waste organic content reduction rate during a 10 years period of time (the experimental work time) for TOM and HA was about 30%, and for raw cellulose about 60%, that suggest low biodegradability. These results associated to other particular conditions of the landfill allow estimating its end of life, in terms of gaseous emissions. In this particular case it was predict an average of 60 years for complete biodegradation of the organics and the end of biogas production, i.e., the time to reach a safe landfill.
Acknowledgements
The authors would like to express their gratitude to the Polytechnic Institute of Viana do Castelo, the University of Minho, the Municipality of Matosinhos and Mota-Engil Company, the responsible for the management of the landfill, due to the given facilities.
13
REFERENCES
1. Alexander, M. (1977): “Introduction to Soil Microbiology”, J. Wiley and sons, NY, 467 pp.
2. APHA “Standard Methods for the Examination of Water and Wastewater”. APHA publication, Washington, DC, 1995.
3. Brito, M. 1994. “Organics Composts as Soil Amendments to Agricultural Land. Quantitative Studies on Their Effects on Crop Production”. PhD thesis. Department of Horticulture, University of Reading, UK.
4. Russo, M. A. T. (1998) “Evaluation of Parameters Influencing Municipal Solid Waste Composting and its Importance in Compost Quality: Case Studies” (in Portuguese). Public thesis. Polytechnic Institute of Viana do Castelo, Portugal.
5. Russo, M. A. T., Vieira, J. M. P. (2006) - “Evaluation of Landfilled Solid Waste Stability through the Organic Fraction Degradability with Age”. XII Encontro Nacional de Saneamento Básico (in Portuguese), Cascais, Portugal.
6. Tchobanoglous, G.; Theisen H.; and Vigil, S. (1993) “Integrated Solid Waste Management: Engineering Principles Management Issues”, NY: McGraw-Hill, Inc.
7. Tinsley, J. (1950) “The Determination of Organic Carbon in Soils by Dichromate Mixture”. Proceedings IV International Congress of Soil Science, s.1., 161-164 pp
8. Zucconi, F; Bertoldi, M. (1987) “Compost Specification for the Production and Characterisation of Compost from Municipal Solid Waste”, in Compost: Production, Quality and Use. Elsevier Applied Science (Ed.), London, UK, pp 30-50.
14