Embed Size (px)
Citation preview

Evaluation of Water Losses: Study Case in Intan
Banjar Water Supply Company
Maria Setianingsih1 and Nieke Karnaningroem1
Abstract―Water losses from water distribution networks
have become a crucial problem. The BNA (Basic Need
Approach) zone has high water losses above the standard for
maximum tolerance ministry of public work as 20%. The water
losses during September - December 2018 has experienced a
fluctuation. the highest losses occurred in October at 36.05%,
but in November the level of water losses decreased to 34.17%.
The water balance can be used to know to understand the
quantity, source, and charge of water losses. The water balance
calculation in this study uses the WB-Easy Calc program
version 4.05. Based on the result, the percentage of water losses
34,81% with the composition of real losses as 30,61% and
apparent losses of 4.21%. On the other hand, the financial
impact by the water losses was deficit as Rp. 4.593.648.335.
Furthermore, gets to the action for each one of the above main
components of the water balance in order to reduce water
losses.
Keywords―Distribution, Water Balance, Water Losses.
I. INTRODUCTION1
Water is one of the important factors in determining
human needs. Intan Banjar is a water supply company in
Banjar Regency and Banjarbaru City with BNA (Basic
Need Approach) is one of theirs service zones. Intan Banjar
improves its service performance by reducing water losses.
Water losses is the management of the quantity of water
different between supply and consumption through the
distribution system. The level of water losses in the BNA
(Basic Need Approach) is above the standard for maximum
tolerance ministry of public work as 20%[1]. The high
level of water losses greatly influences ability to supply
clean water to consumers. Water balance is very important
in the program to reducing water losses. The water balance
can be used for assessing water losses conditions by
knowing the details of the components water losses. Water
balance is a water calculation method proposed by
International Water Association (IWA) at a conference in
Berlin in 2001. Being aware of the problem of different
water balance formats, methods and leakage performance
indicators, the IWA has developed a standard international
water balance structure and terminology[2]. This standard
format has meanwhile been adopted (with or without
modifications) by national associations in a number of
countries[3]. Water balance calculation in this study using
1Maria Setianingsih and Nieke Karnaningroem are with Department of
Environmental Engineering, Institut Teknologi Sepuluh Nopember,
Indonesia. Email: [email protected];
the program WB-EasyCalc version 5.16. The aim of this
research is to convince Intan Banjar of water supply
company with still high of water losses that the
introduction water balance will be an important first step
towards to reduce water losses in Intan Banjar water supply
company. The research also provides recommendations on
the best management practices to be considered in order to
minimize the water losses and maintain it below the
allowable national standard.
II. LITERATURE REVIEW
A. Water Balance
The term Water Balance has long been used to describe
the equation of the water coming in and out of a system,
expressing the network’s losses in a financial form by
essentially comparing the value of the originally provided
amount of water and therefore the value that should be
invoiced to the one actually invoiced after consumption.
B. Apparent and Real Losses
The difference observed in every Water Balance
equation derives from losses throughout the network and
its management. These losses can be easily discriminated
in apparent losses and real losses. The apparent losses
express the amount of water that is not invoiced due to
non-authorized consumption and inaccuracies of the
metering system which when combined lead to the part of
the system’s water that is actually consumed, just not paid
for. The real losses express the physical substance of water
lost due to overflows and leakages throughout the entire
network. This is the part of the system’s water that never
reaches the consumer and therefore is not paid for either. In
most developed countries, there are no or very limited
apparent losses[4].
III. METHOD
The location of this research is urban water distribution
network in Intan Banjar water supplay company in BNA
(Basic Need Approach). In this research, calculation of
water losses from the difference between the amount of
water distributed and the amount of water in the customer's
account and calculation of water balance was used software
WB EasyCalc version 5.16 to calculate the percentage of
all the components of the water losses. The data needed to
calculate the water balance in the WB-EasyCalc program is
the system input volume data, metered consumption data,
unmetered consumption data, unbilled meter consumption

data, unbilled unmetered consumption data, unofficial
consumption data, inaccurate data meters and data
handling, data on the length of distribution and
transmission pipes, official pipeline data, average pressure
data, intermittent supply data, and financial data. The data
used as input software comes from the report of Monthly
production, distribution and Non Revenue Water for 122
days (from September 2018 to December 2018), and by
quantitative research method through survey, interview and
other observations. After that, the factors determined water
losses can be known can action to reduce water losses.
Figure 1. Water Supply Distribution Zone in BNA (Basic Need Approach) Intan Banjar Company
TABLE 1.
BNA CUSTOMER CHARACTERISTICS BASED ON CUSTOMER CLASS PART 1
Zona Customer Class
General Social Special Social Tanker A1 A2 A3 A4 A5
Zona M 59 69
6 430 3833 647 21
Zona P 40 29 1 4 215 2764 1594 24
Zamp 5 7
1 25 521 422 29
MTP 41 89
12 1156 4326 570 16
Trikora 34 18
94 5127 386 23
Cempaka 41 31
31 718 4043 223 11
Sei Ulin/BLK 30 23
17 274 4196 266 17
TOTAL 250 266 1 71 2.912 24.810 4.108 141

TABLE 2.
BNA CUSTOMER CHARACTERISTICS BASED ON CUSTOMER CLASS PART 2
Zona Customer Class
B/IP Small Commerce Intermediate Commerce Big Commerce Small industry Large Industry Special HU
Zona M 74 109 664 60 1 1
1
Zona P 52 63 598 14
Zamp 32 16 187 5
MTP 98 88 549 35 3
34
Trikora 48 28 355 9
2
Cempaka 16 29 143 9
6
Sei Ulin/BLK 40 50 165 5
TOTAL 360 383 2.661 137 4 1 0 43
IV. RESULTS AND DISCUSSION
BNA (Basic Need Approach) has served 36,148 active
customers and has 16 customer classes which most
customers are dominated by A3 type with a total of 24,810
SR shown in Table 1 and Table 2.
Base on transmission and distribution section monthly
report in the BNA zone has high water losses above the
standard for maximum tolerance ministry of public work as
20%. The percentage of water losses is the difference
between the amount of water distributed and the amount of
water in the customer's account. The percentage of water
losses in BNA every month from September 2018 to
December 2018 shown in the Table 3, Table 4 and Figure
3.
Based on Table 3, Table 4 and Figure 2, that's shown the
water losses on BNA for each month during September -
December 2018 has experienced a fluctuation. It can be
seen that the highest losses occurred in October at 36.05%,
but in November the level of water losses decreased to
34.17%. This high level of water losses, the Intan Banjar
Company must carry out a reduction program. The first
thing that needs to be done in a water loss reduction
program is to calculate the water balance. The results of the
water balance calculation in the BNA zone for 122 days
from September 2018 to December 2018 using the WB-
EasyCalc program version 5.16 are shown in Figure 3.
Water balance in BNA zone in Intan Banjar water
supply company can be described as:
Annual system input volume September 2018 to
December 2018 for BNA zone Intan Banjar water
supply company from Pinus and Banjarbakula water
treatment have distributed water as 3.239.062 m3.
Authorised consumption is the monthly volume of
metered and unmetered water taken by registered
customers, laboratories,etc. For example water used in
fire hydrants and others. The Authorised consumption
of the September 2018 to December 2018 as 2,111,439
m3.
Water losses as Annual system input volume reduced
by Authorised consumption. Water losses consists of
apparent losses and real losses. So the calculation for
Water losses in the September 2018 to December 2018
for BNA zone is 3,239,062 - 2,111,439 = 1,127,623 m3.
When changed in percentage is 34.81%.
Billed Authorised Consumption is the volume of
metered or unmetered monthly water used by registered
customers. In BNA zone during September 2018 to
December 2018 currently has no billed unmeterd
consumption and only a billed metered consumption
meter as 2,097,044 m3.
Unbilled authorized consumption is authorised
consumption reduced by billed authorised consumption.
So calculation of unbilled authorized consumption in
the September 2018 to December 2018 for BNA zone is
2,111,439 - 2,097,044 = 14,395 m3.
Revenue water is billed metered consumption plus
billed unmetered consumption. So that the calculation
for revenue water for September 2018 to December
2018 in the BNA zone is 2,097,044 + 0 = 2,097,044 m3.
Unbilled metered Consumption is water for customers
with installed meters but the company dont’t charge for
collect water or free usage fees. At present, in the Intan
Banjar company haven’t unbilled metered consumption,
so during September 2018 to December 2018 of
unbilled meter consumption is 0 m3.
Unbilled unmetered consumption is all official
consumption which is not billed or not metered. This
component is used for water supplay company
operations such as washing pipes, pipe tests, roads
cleaning, etc. Unbilled unmetered consumption as
Unbilled authorized consumption which is reduced by
unbilled metered consumption. So the calculation
during September 2018 to December 2018 is 14,495 - 0
= 14,395 m3.
Unauthorized consumption is unknown use of water.
Unauthorized consumption is an illegal connection,
bypass on the meter, Unauthorized use hydrant, etc.
Unauthorized consumption in September 2018 to
December 2018 BNA zone is 4,685 m3.
Customer metering inaccuracies and data handling
errors ia an apparent loses due to customer meter

inaccuracies and errors in meter reading. Inaccuracy of
meters and data handling in September 2018 to
December 2018 its value is 131,553 m3.
Commercial losses or Apparent losses are Unauthorized
consumption plus meter inaccuracies and data handling.
So that the calculation of Apparent losses in September
2018 to December 2018 for BNA zone is 4.685 +
131.553 = 136,238 m3. When changed in the percentage
is 4.21%.
Physical losses sometimes called ‘real losses’ are the
annual volumes lost through all types of leaks, bursts,
and overflows in pipes, service reservoirs and service
connection, up to the point of the customer meter. Real
Losses as water losses reduced by apparent losses, so
that the Calculation of real losses is 1.127.623 -
136.238 = 991,385 m3. When changed in percentage, it
is 30.61%.
TABEL 3.
CALCULATION OF PERCENTAGE OF WATER LOSSES IN SEPTEMBER - OCTOBER PER ZONE
Description Sep-18 Okt-18
Input Zone Water
Distributed
Sold water % Water Losses Water Distributed
Sold water % Water Losses
M3 M3 % M3 M3 %
IPA PINUS
Zona M 155.603 117.916 37.687 24,22% 146.301 114.467 31.834 21,76%
Zona P 113.117 78.413 34.704 30,68% 107.191 77.088 30.103 28,08%
Zamp 30.322 22.819 7.503 24,74% 29.099 21.573 7.526 25,86%
MTP 171.659 102.289 69.370 40,41% 169.388 94.511 74.877 44,20%
IPA Banjarbakula +
IPA Pinus
Boster Muslimin
Trikora 102.608 63.751,00 38.857 37,87% 114252 66.324 47.928 41,95%
Cempaka 117.320 73.070,00 44.250 37,72% 128839,5 70.794 58.046 45,05%
Sei Ulin/BLK 108.779 72.684,00 36.095 33,18% 109590,98 69.817 39.774 36,29%
TOTAL 799.408 530.942 268.466 33,58% 804.661 514.574 290.087 36,05%
TABEL 4.
CALCULATION OF PERCENTAGE OF WATER LOSSES IN NOVEMBER - DECEMBER PER ZONE
Description Nov-18 Des-18
Input Zone Water
Distributed
Sold water % Water Losses Water Distributed
Sold water % Water Losses
M3 M3 % M3 M3 %
IPA PINUS
Zona M 150.292 120.170 30.122 20,04% 145.857 107.410 38.447 26,36%
Zona P 105.803 78.296 27.507 26,00% 99.801 75.197 24.604 24,65%
Zamp 29.607 22.275 7.332 24,76% 29.003 21.614 7.389 25,48%
MTP 177.755 100.913 76.842 43,23% 175.113 88.831 86.282 49,27%
IPA Banjarbakula +
IPA Pinus
Boster
Muslimin
Trikora 126.191 75.506 50.685 40,17% 103.387 69.154 34.233 33,11%
Cempaka 141.550 79.082 62.468 44,13% 119.516 70.874 48.642 40,70%
Sei Ulin/BLK 104.270 73.705 30.565 29,31% 90.735 68.501 22.234 24,50%
TOTAL 835.468 549.947 285.521 34,17% 763.412 501.581 261.831 34,30%
Figure 2. Percentage of Water Losses for September 2018 - December 2018

Figure 3. Water Balance of BNA Zone in Intan Banjar Water Supply Company
The water losses consist of real and apparent losses. Real
Losses are water losses in a distribution system indicated
by real losses and apparent losses The losses of water in
the distribution system to customers water supplay
company that doesn’t out water out of the system. The
result from the water balance analysis, percentage of water
losses is 34,81% with the composition of real losses
30,61% and apparent losses of 4.21%. So it is a matter of
concern and action is required for water losses reduction.
the percentage of water loss shown in the Figure 4.
Based on the results of observations and interviews with
the employees of Intan Banjar water supplay company, if
the high real losses was caused by visible and invisible
leakages (Background Leakage), pipe fittings connections,
and in the connection pipe service to the customer's water
meter. This is in accordance with the data in BNA zone has
repaired 12.201 points of leakage. The leakage in BNA
zone caused by many things including are high pressure,
Imperfect pipe connection, Damage to the corrosive pipe,
especially in the installed pipe for a long time, Pipe damage
due to road repair and drainage project. Cause of real losses
shown in the Figure 5.
The Factor of Apparent losses in BNA zone caused by
inccuracies meter reading customer and illegal connection.
the figure 4 shown that in the greatest apparent losses
caused by inccuracies meter reading customer as 4,06%
and This is accordance with based on data from the
customer meter accuracy survey that the margin error of
customer meter is 5%. The inccuracies costomer meter
happened because Intan Banjar water supplay company
used class B water meter customer. Class B water meter is
lower quality than class c water meter. The accuracy of
customer meters is equally important, with the main
difference being that there are many more customer meters
in operation—and each measures a relatively smaller
flow—than production meters. The accuracy of customer
mete-ring depends on several factors, including meter type,
brand, and replacement policy, maintenance, and water
quality. The water supply company should establish
guidelines for all of these factors to ensure accuracy of
customer consumption data. Customer meters used by
Intan Banjar Company be shown in Figure 6.
The water losses distribution system could in a loss of
income for the Intan Banjar water suplay. Based on the
water balance results using Easycalc Water Balance ver
5.16 it is estimated that water losses on September 2018 to
December 2018 For the BNA zone as:
1. Apparent losses is 136.238 m3
2. Real Losses is 991.385 m3.
3. Total water losses are the sum of Apparent losses and
real losses, namely 136,238 + 991,358 = so that the
Calculation is 1.127.623 m3
With each loss, the deficit of Intan Banjar water supply
company could be calculated based on the average water
sales rate per m3, and the average cost of production
/distribution of water per m3 as shown in Table 5.
Water Losses
Error Margin [+/-]:
System Input Volume
1,4%
3.239.062 m3
Error Margin [+/-]:
m3991.385
Non-Revenue Water
Error Margin [+/-]: 8,4%
136.238 m3Customer Meter Inaccuracies and Data
Handling Errors
Commercial Losses
Unauthorized Consumption4.685 m3
4,1%
Error Margin [+/-]:
4,0%
Physical Losses
1.142.018 m3
131.553 m3
Error Margin [+/-]:
1.127.623 m3 8,2%
4,8%Error Margin [+/-]:
Error Margin [+/-]:Unbilled Unmetered Consumption
14.395 m3
Error Margin [+/-]: 32,7%
8,6% Error Margin [+/-]: 8,6%
14.395 m30,1%
Unbilled Authorized
Consumption
Unbilled Metered Consumption0 m3
2.111.439 m3
Error Margin [+/-]:
m3
0 m3Authorized Consumption
2.097.044 m3 Billed Unmetered Consumption 2.097.044 m3
Billed Authorized
Consumption
Billed Metered Consumption
Revenue Water2.097.044
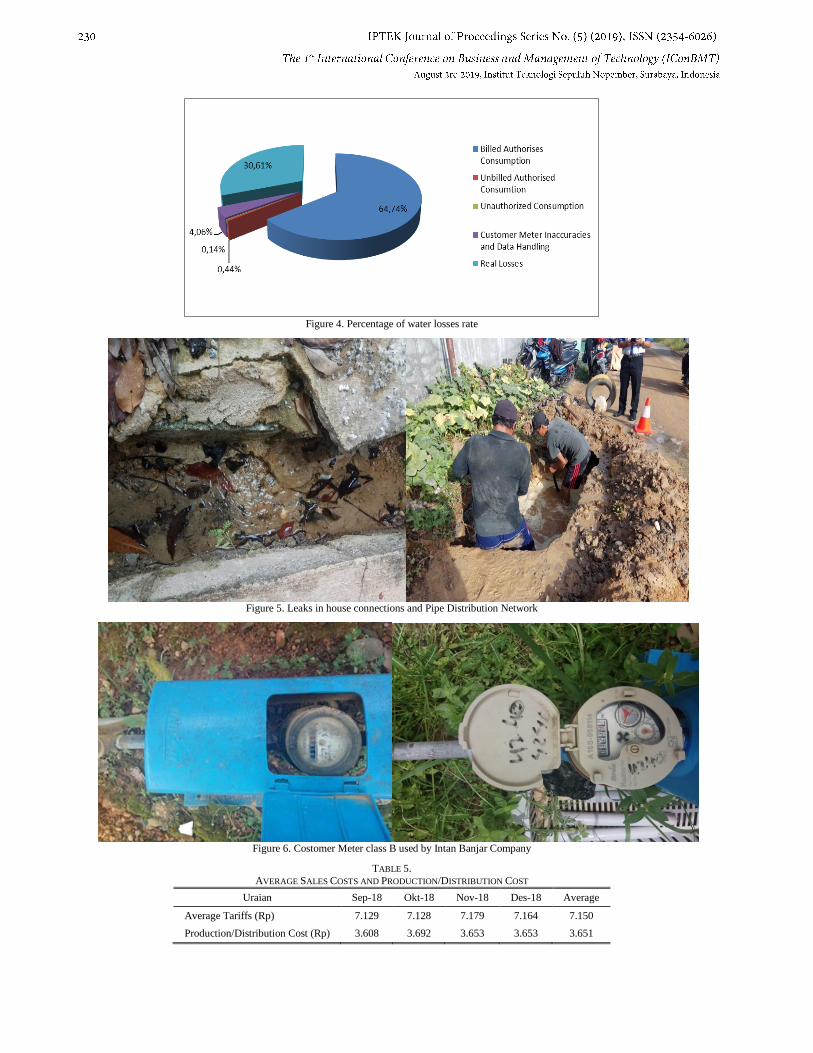
Figure 4. Percentage of water losses rate
Figure 5. Leaks in house connections and Pipe Distribution Network
Figure 6. Costomer Meter class B used by Intan Banjar Company
TABLE 5.
AVERAGE SALES COSTS AND PRODUCTION/DISTRIBUTION COST
Uraian Sep-18 Okt-18 Nov-18 Des-18 Average
Average Tariffs (Rp) 7.129 7.128 7.179 7.164 7.150
Production/Distribution Cost (Rp) 3.608 3.692 3.653 3.653 3.651

Deficit received by Intan Banjar water supply company
due to water losses could be calculated on September 2018
to December 2018 as follows:
1. Apparent losses must be an air tariff per m3 directly by
the company. Deficit of Apparent losses can calculated
Rp.7150, - x 136.238 m3 = Rp. 974.101.700,-
2. The real losses water is a leakage of the distribution
pipe which will not directly become the income of the
water tariff per m3, but will result in a loss of
production / distribution costs. So that the losses due to
real losses is: Rp. 3651, - x 991.385 m3 = Rp.
3.619.546.635,-
3. The total deficit of Intan Banjar Company due to water
losses is the total losses due to Apparent losses and real
losses, so the total is Rp. 974.101.700,- + Rp.
3.619.546.635,- = Rp. 4.593.648.335,-
In this instance the action plan needs to control water
losses that will maximise benefits which follows the steps
below: Develop an NRW master plan
The first step is to analyse water distribution system
and develop a master plan for water losses reduction.
Calculation water balance with a breakdown of the
IWA (International Water Association) will help Intan
Banjar Company quantify the different water losses
elements to prioritise activities and investments to
reduce leakage.
Pressure management
Minimum pressure is defined as 10 m H2O and
Maximum pressure is defined as 60 m H2O in the
directive.
Speed and quality of repairs
Municipalities should provide proper repair where pipe
bursts are seen
Maintenance of pipeline systems
Rehabilitation, maintenance, and repairs should be
carried out regularly depending on system needs.
Active leakage control
Municipalities should carry out an active leakage
control program using proper monitoring systems
Pipeline and assets management
Selection and installation of components of a water
distribution network should be done properly to prevent
physical water losses.
Forming pressure zones and DMAs (District Meter
Area)
These smaller subsystems often referred to as District
Meter Area (DMA). Hydraulic modeling should be
carried out in existing. DMA must be hydraulically
isolated so the company can to calculate the volume of
water lost in the DMA.
The Employment of qualified personnel to control and
reduce water losses is necessary as well.
Tackle apparent losses with the minimum expenditure;
reduce unauthorized consumption, meter reading and
accounting errors at the first instance which will
increase revenue.
Simultaneously reduce leakage in order to save money
in producing/buying less water and Invest savings in
further reducing Apparent and Real Losses.
Reducing excessive losses results are more water being
available for consumption that can be sold, Delaying the
need for capital investments, Lower operating costs,
Reducing commercial losses will generate more
revenue[5].
V. CONCLUSION
This research investigated the problem of water losses in
BNA (Basic Need Approach) zone of Intan Banjar water
supply company as a case study. The water losses on BNA
has experienced a fluctuation. It can be seen that the
highest losses occurred in October at 36.05%, but in
November the level of water losses decreased to 34.17%.
The results water balance revealed that the typical value of
water losses in BNA (Basic Need Approach) zone is
approximately 34,81%, which is very high according to the
government standards. From water balance calculations,
composition of real losses as 30,61% and apparent losses
of 4.21%. Also the results show that the main factors that
contributed to water losses are the estimation method of
water consumption due to meters inaccuracies, and
leakages pipes in some parts of the network. On the other
hand, the financial impact posed by the water losses was
found to be a loss of income for company as Rp.
4.593.648.335,- on September 2018 to Desember 2018
period.
REFERENCES
[1] Tentang Kebijakan Strategis Nasional Pengembangan Sistem Penyedia Air Minum (KSNP-SPAM), PERMEN PU
20/PRT/M/2006. 2006.
[2] H. Alegre, W. Hirnir, J. M. Baptista, R. Parena, and International Water Association., Performance Indicators for Water Supply
Services. London: IWA Publishing, 2000.
[3] M. Farley and R. Liemberger, “Developing a non-revenue water reduction strategy: planning and implementing the strategy,”
Water Sci. Technol. Water Supply, vol. 5, no. 1, pp. 41–50, Mar.
2005. [4] N. Petroulias, D. Foufeas, and E. Bougoulia, “Estimating water
losses and assessing network management intervention scenarios:
The case Study of the water utility of the City of Drama in Greece,” Procedia Eng., vol. 162, pp. 559–567, Jan. 2016.
[5] I. Simbeye, Managing Non-Revenue Water. Non-Revenue Water
(NRW) Sourcebook for Trainers WAVE Programme. Leipzig, Germany: InWEnt - Internationale Weiterbildung and
Entwicklung , 2010.