Embed Size (px)
Citation preview

P8B.3 EVALUATION STUDY ON WIND RETRIEVAL METHODS
FROM SINGLE DOPPLER RADAR
Sang-Min Jang1, Hee-Chang Lim2*, Dong-In Lee1, Dong-Soon Kim1 and Young-Sub Lee1
1Department of Env. Atmos. Sci., 2 Division of Mech. Eng., PuKyong National University, Busan, Korea
1. INTRODUCTION-
The climate changes have been an increasing impact on wind environment of the Korean peninsula over the last decade. Especially, after the several deadly typhoons (Funsen and Rusa) struck in 2002, the typhoon Ewiniar which was recorded 3rd largest in 2006 was dreadful causing a great damage in a short period. Therefore, the importance of the prediction of wind field and the preparation for a worst storm someday was expected to increase, but the wind forecast from the meteorology offices and the observatories has been likely to be worse in the nation’s history.
Since Doppler radar was first used in meteorological observations, a number of studies on the radar have been carried out to obtain the appreciable 3-dimensional flow field of the extreme wind field such as the typhoon and the heavy rainfall in summer monsoon season. Many developed countries spent a lot of time in trying to make an accurate retrieval of wind field from radars, whereas the study on these retrieval methods in Korea was relatively out of primary concern. In addition, due to the lack of high performance radar, human resources and funding it also has been rarely studied in Korea.
A Doppler radar is capable of measuring only one component of the velocity, the radial component (Vr). However, the actual wind in atmospheric flow seems a complicated 3-dimensional and its magnitude changes over time and space. In order to describe these velocity fields accurately, it’s necessary to make a simultaneous measurement with three Doppler radars. However, due to the limitations of measurement systems and the expenses, it had
* Corresponding author address: Dong-In Lee, PuKyong National University, Dept. of Env. Atmos. Sci., Nam-gu, Busan, 608-737, Korea E-mail: [email protected]
rarely been accomplished except certain nations and most of the studies were carried out by an incomplete instrumental system, i.e. two or most often a single Doppler radar. Therefore, in this study, we are interested in measurements with a single Doppler radar to develop a domestic-oriented radar system for retrieval of wind field in Korea.
2. ANALYSIS OF MEAN FLOW FIELD
Because the radar obtains only the radial component velocity, the principles to predict 3-dimensional wind components – VAD (Velocity Azimuth Display method) and VARD (Velocity Area Display method), and VVP (Volume Velocity Processing method) – have a dependency of the beam direction of radar. Therefore, to understand the physical characteristics of these methods, in this study, we reformulated those methods (i.e., VAD, VARD) (Waldteufel and Corbin, 1978).
A Cartesian coordinate system ( ) , where the radar is the origin and z the vertical coordinate, is adopted, and assume the velocity vector of the motion of scatters varies linearly around its value at a point
zyx ,,
( )wwuV ,,=( )000 ,, wwu
( )000 ,, zyx , i.e.,
)()()( 0000 zzdzduyy
dyduxx
dxduuu −+−+−+=
(1)
)()()( 0000 zzdzdvyy
dydvxx
dxdvvv −+−+−+=
)()()( 0000 zz
dzdwyy
dydwxx
dxdwww −+−+−+=
The radial velocity measured by the radar
is rV
φφθφθ sincossincoscos wvuVr −−−= (2) Where θ and φ are the azimuth and elevation angles. Transforming from rectangular to polar coordinates, introducing the radial

distance R and regrouping terms, we obtain an equation
( ) ( )( )
( )( )( ) dzdvzR
dzduzRdzdwzR
dxdvdyduRdydvRdxduR
wvuVr
0
0
0
2
2222000
sincossinsincoscos
sinsincoscossin
cossincoscos
sincossincoscos
−+−+
−+++
++
++≈
φφθφφθ
φφφθθ
φθφθ
φφθφθ
(3)
In equation (3), only terms with different
azimuth dependence can be discriminated. Since R and φ are constant, we can regroup terms (VAD method) to obtain
(4)
The VARD method which was first proposed
by Easterbrook (1975), is also applied for a conical sector, i.e., 00 ≠x , . Therefore, when low elevation angles are considered (
00 ≠y
0sin ≠φ , 1cos ≠φ ), the equation (3) becomes
( )( )
( )dxdvdyduRdydvRdxduR
dydvydxdvxvdyduydxduxuVr
++++
−−+−−≈
θθθθ
θθ
sincossincos
sincos
22000
000
(5)
Figure 1 shows the schematic diagram to get
the trans-function of wind profile in the spherical coordinate system. The procedure, as in figure 1, includes (1) the virtual domain generation and the input velocity allocation, (2) the radial velocity obtained by VAD/VARD transformation, (3) the comparison of the true velocity and the transformed velocity, and finally (4) the evaluation of the trans-function reducing the error.
Figure 2 indicates the reference velocity profiles allocated in the virtual domain. In case of the uniform flow, which is constant in velocity(~1), the velocity profile seems unreal but easy to use with, whereas the power-law profile can be a kind of atmospheric boundary layer which appears to simulate the surface roughness effect so that we can compare to see the differences of the surface effect.
Figure 3 compares the size and shape of the
virtual domain obtained in Cartesian and Spherical coordinate system. The size of the Cartesian coordinate system is 2widex2longx1high and the numbers of grid are 50x50x25, while the size of the Spherical system is 2 of radial distance and the numbers of grid are 30radialx30azimuthx30elevation. 3. RESULTS AND DISCUSSION
Figure 4 shows the contours of the streamwise wind in spherical coordinate system when the shapes of the input velocity profile are uniform and parabolic, respectively. At the first glance, both the location and the magnitude of the maximum point of the streamwise wind velocity are completely different on the surface of the hemisphere. The different magnitude must be caused by different input velocity profiles, but the different location of maximum values are interestingly coming from the different gradient of input profiles so that if one would like to predict the velocity profiles using single RADAR, it might mislead him.
( )[ ]( )[ ]
( )dxdvdyduR
wdydvR
wdxduR
vuVr
++
++
++
+≈
φθθ
φφθ
φφθ
φθφθ
20
220
2200
coscossin
sincossin
sincoscos
cossincoscos
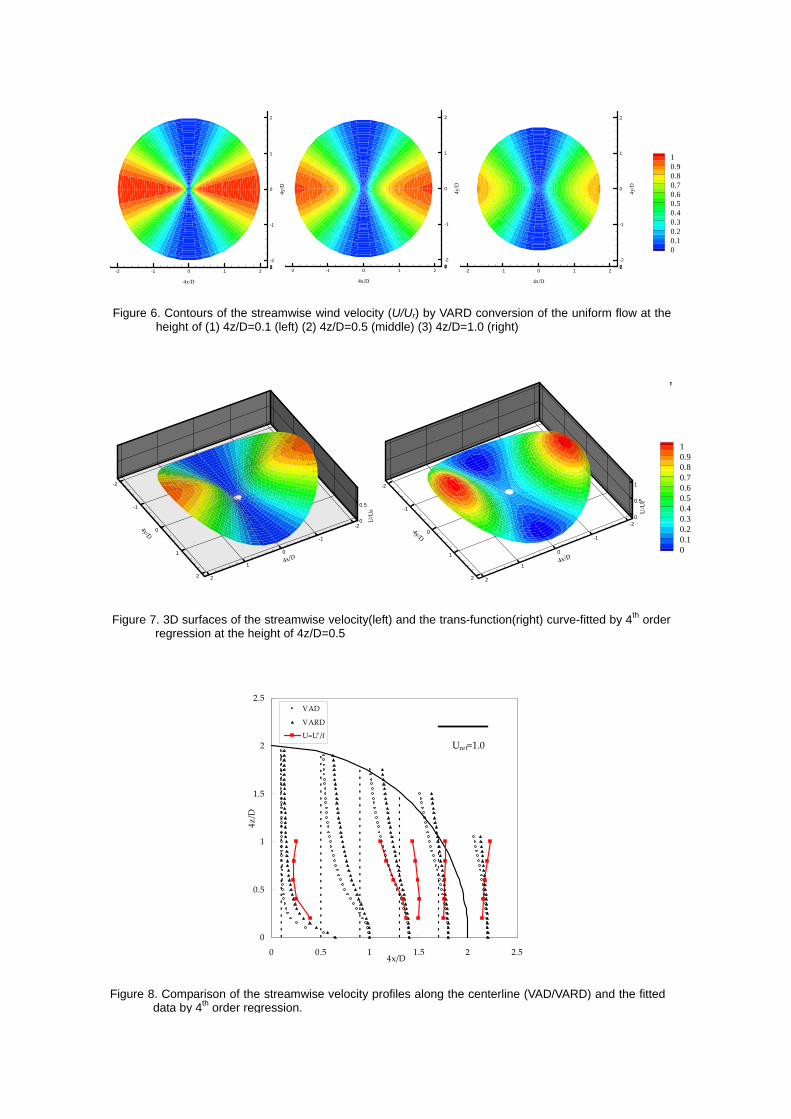
Figures 5 and 6 show the contours of the streamwise wind velocity (U/Ur) by different conversion (VAD and VARD) of the uniform input flow at different heights 4z/D=0.1, 0.5 and 1.0. The flow direction is coming from left to right in the figure and a typical sinusoidal coordinate transform from the radial velocity (Vr) is applied to get the streamwise velocity. As you can see in the figure, at the height 4z/D=0.1 close to the surface the streamwise velocity remains less than 10% errors within the angle ±25 degrees based on the horizontal line across the origin, whereas the velocity reduces rapidly with increased angles. In addition, as the height goes high this trend prevails so that the overall wind speed is gradually decreased. In comparison with VAD method, the VARD method is relatively improved in the central domain along the vertical line.
In this study, the velocity contours obtained by the VAD/VARD method are compared with the contour fitted by 4th order regression (Blane et al., 2000). As in Figure 7, the 3-dimensional surfaces of the streamwise velocity and the equivalent contours are fitted by higher order regression at the height of 4z/D=0.5. When it is applied to the velocity profiles from an existing Radar dada, it is believed to improve the retrieval accuracy of the wind field by these simple and effective

assumptions. Figure 8 shows the comparison of the results
from the existing sinusoidal method and the current method. In the spherical coordinate system, the plane is symmetry based on the vertical centreline so that we plot only a half. As in figure 8, the overall wind speeds close to the surface, which are estimated by VAD and VARD methods, reaches to the reference velocity (~1.0). However, apart from the surface, the wind speed drops rapidly. The suggested wind profile fitted by the higher order regression, interestingly, shows a reasonable agreement with the reference velocity (~1.0), but due to the geometric trait of the trans-function the wind speed was unrealistically overestimated in a region at 4x/D=0.5. However, the authors are continuing the analysis to develop the accurate wind prediction in more detail.
4. CONCLUSION An accurate wind prediction at the virtual
domain is being carried out alongside an experimental study using a single Doppler radar. In this study, the trans-function technique applied so far (and we are continuing the analysis) means that it is reasonably fitted but nevertheless still unrealistic. We have presented some preliminary results, comparing the input velocity with the calculated velocity fitted by the 4th order regression. Although we have not presented a detailed analysis, the streamwise velocity only seems to be over-estimated around 70% at the region 4x/D=0.5~0.9. However, we believe that the discrepancy between these results can be overcome to use the higher order regression rather than using the 4th order so that we’ll improve the retrieval accuracy of wind field. 5. ACKNOWLEGMENTS
This work was supported by the Korea Foundation for International Cooperation of Science & Technology(KICOS) through a grant provided by the Korean Ministry of Science & Technology(MOST) in 2006 (No. 2006-04019), and this work was financially supported by the second stage of BK21 Project of the Graduate School of Earth Environmental System. 6. REFERENCE
Waldteufel P & Corbin H (1978) On the Analysis of Single-Doppler Radar Data, J. Applied Meteorology, 18, 532-542.
Campistron B, Long AB & Huggins AW (1991) A Method of Retrieving Turbulence Parameters from Volume Processing of Single Doppler Radar Measurements. J. Atmospheric & Oceanic Tech., 8, 491-505
Easterbrook CC (1975) Estimating Horizontal Wind Fields by Two Dimensional Curve Fitting of Single Doppler Radar Measurements, Preprints 16th Radar Meteorology Conference, Houston, Amer. Meteor. Soc, 225-230.
Blane MM & Lei Z (2000) The 3L Algorithm for Fitting Implicit Polynomial Curves and Surfaces to Data, IEEE Transactions on Pattern Analysis and Machine Intelligence, 22(3), 298-313.
Figure 1. Schematic diagram to get the trans-function of wind profile in the spherical coordinate system
0
0.5
1
1.5
2
0 0.5 1 1.5U
z
Uniform
parabolic
Figure 2. Reference wind profiles - (a) uniform shape(red hidden line), (b) parabolic(blue solid line)

4x/D
-2
-1
0
1
24y/D
-2-1
01
2
4z/D
0
1
2
4x/D
-2
-1
0
1
24y/D
-2-1
01
2
4z/D
0
1
2
Figure 3. Virtual domain to generate the wind profiles (1) in the rectangular coordinate (left) (2) in the spherical coordinate (right)
4x/D
-2
-1
0
1
2
4y/D
-2-1
01
2
4z/D
0
1
2
4x/D
-2
-1
0
1
2
4y/D
-2-1
01
2
4z/D
0
1
2
10.90.80.70.60.50.40.30.20.10
Figure 4. Streamwise wind contours in spherical coordinate (1) uniform flow (left) (2) parabolic (right)
4x/D
-2 -1 0 1 2
4y/D
-2
-1
0
1
2
012
4x/D
-2 -1 0 1 2
4y/D
-2
-1
0
1
2
012
4x/D
-2 -1 0 1 2
4y/D
-2
-1
0
1
2
012
10.90.80.70.60.50.40.30.20.10
Figure 5. Contours of the streamwise wind velocity (U/Ur) by VAD conversion of the uniform flow at the height of (1) 4z/D=0.1 (left) (2) 4z/D=0.5 (middle) (3) 4z/D=1.0 (right)
4x/D
-2 -1 0 1 2
4y/D
-2
-1
0
1
2
012
4x/D
-2 -1 0 1 2
4y/D
-2
-1
0
1
2
012
4x/D
-2 -1 0 1 2
4y/D
-2
-1
0
1
2
012
10.90.80.70.60.50.40.30.20.10
Figure 6. Contours of the streamwise wind velocity (U/Ur) by VARD conversion of the uniform flow at the height of (1) 4z/D=0.1 (left) (2) 4z/D=0.5 (middle) (3) 4z/D=1.0 (right)
4x/D
-2
-1
0
1
2
4y/D
-2
-1
0
1
2
U/U
r
0
0.5
4x/D
-2
-1
0
1
2
4y/D
-2
-1
0
1
2
U/U
r
0
0.5
1
Y
10.90.80.70.60.50.40.30.20.10
Figure 7. 3D surfaces of the streamwise velocity(left) and the trans-function(right) curve-fitted by 4th order regression at the height of 4z/D=0.5
0
0.5
1
1.5
2
2.5
0 0.5 1 1.5 2 2.54x/D
4z/D
VAD
VARD
U=Uʹ/fUref=1.0
Figure 8. Comparison of the streamwise velocity profiles along the centerline (VAD/VARD) and the fitted data by 4th order regression.