Embed Size (px)
Citation preview

every student. every classroom. every day.
Impact of Governor’s (recently signed) State Budget on OUSD 2008-2009 Adoption Budget
Wednesday, October 29, 2008

every student. every classroom. every day. 2
Financial Team
• Vince Matthews – State Administrator
• Roberta Mayor – Superintendent
• Leon Glaster – Chief Financial Officer
Consultant
• Roberta Sadler – Controller
• Jason Willis – Budget Director

every student. every classroom. every day. 3
Agenda
• 2008-09 Adoption Budget Overview
• Strategies to increase District’s Fund Balance
• Budget Assumptions
• State Budget Impact on General Purpose Fund
• State Budget Impact on General Categorical Fund
• Board Questions & Discussion

every student. every classroom. every day. 4
2008-09 Adoption Budget Overview
• The District was able to achieve a balanced budget in 2008-09 Adoption budget; however, the recently approved state budget and the California economy has blunted our continued fiscal recovery.
• Our District reduced the 2008-09 budget by $24 million from the previous year. We were also not able to afford providing any increase in employee compensation in the budget. Non-labor budgets were drastically reduced.
• The California budget is in the tank. We have to make sure that we have a stable solid savings account (Fund Balance). We must take immediate action to increase our fund Balance.

every student. every classroom. every day. 5
Strategies to Increase Fund Balance (District’s Savings Account)
• The State Administrator, Superintendent, & Board President are working with staff to generate funding opportunities to increase the District savings account. The preliminary results have been very favorable.
• We must be creative and innovative with how we spend and save our resources. The following strategies represent our plan to address the financial challenges of the District.

every student. every classroom. every day. 6
Strategies to Increase the Fund Balance and Assure Fiscal Sustainability
1. Enrollment stabilization; reversal of declining enrollment. Active recruitment of students.
2. Transfer of General Purpose expenditures to Categorical expenditures wherever possible. (Beware of compliance issue risk).
3. One-time state categorical fund flexibility transfer. Could provide the District with over $8 million in one-time revenue to General Purpose fund (will need “urgency legislation” from State Representative).
4. Property lease or sale negotiations. Could provide the District with one-time and annual revenue streams.

every student. every classroom. every day. 7
Strategies to Increase the Fund Balance and Assure Fiscal Sustainability (continued)
5. Reduce the number of under-enrolled schools, or find other innovative ways to reduce the subsidized costs of these schools.
6. Significant Increase in Average Daily Attendance (ADA). A 1% increase would provide the district with $2.15 million of additional revenue. (District’s Attend & Achieve program has been launched this year to increase ADA).
7. Redistribution of retiree benefits over all General Fund programs. A savings of $200,000 to the General Purpose fund.
8. Mega-Item transfers. A potential savings of over $700,000.

every student. every classroom. every day. 8
Strategies to Increase the Fund Balance and Assure Fiscal Sustainability
(continued)
9. Continue implementing expenditure cuts at schools and central office each year.
10. Manage charter school portfolio to assure only successful, well-managed schools are approved for continuation.
11. Decrease utilities usage at all sites and central office to generate savings.

every student. every classroom. every day. 9
Budget Assumptions(Reminder)
Assumptions 2008-09 2009-10 2010-11
Increase in Employee salaries
(1.5%) Step & column Increase
(1.5%) Step & column Increase
(1.5%) Step & column Increase
Increase in Utility costs
(6%) (6%) (6%)
Increase in Health & Welfare costs
(9%) (9%) (9%)

every student. every classroom. every day. 10
Budget Assumptions(New)
Assumptions 2008-09 2009-10 2010-11Increase in Special Education encroachment
(4,500,000) (4,500,000) (4,500,000)
Cost of Living Adjustment (COLA) to Revenue Limit
.68% 0% (COLA was 4.83% at May Revise)
0% (COLA was 2.7% at May Revise; School Services is recommending 3.5%)
Estimated student Enrollment
Increase in 446 students over Adoption budget projection still 240 less than 2007-08 Actual
Enrollment Projections at Adoption budget and beginning of school year (21 day count) will be updated in January 2009
Enrollment Projections at Adoption budget and beginning of school year (21 day count) will be updated in January 2009
Categorical program expenditure adjustment
$8.5 million increase in categorical expenditures – strategy to reduce the carryover; After closing of the books adjustments
$8.5 million increase in categorical expenditures – strategy to reduce the carryover; After closing of the books adjustments
$8.5 million increase in categorical expenditures – strategy to reduce the carryover; After closing of the books adjustments
Elimination of state Categorical fund deficit of 6.5%
$2.64 million net categorical increase
$2.64 million net categorical increase
$2.64 million net categorical increase

every student. every classroom. every day. 11
State Budget Impact onOUSD Adoption Budget General Purpose Fund
2008-09 2009-10 2010-11
Adoption Budget – 6/25/2008
Beginning Fund Balance 21,069,600 22,261,390 29,778,426
Total Revenue 256,283,354 263,642,638 263,196,108
Total Expenditures 255,091,564 256,125,603 257,666,981
Ending Fund Balance 22,261,390 29,778,426 35,307,553
State Budget Adjustments
Final State budget COLA (.68%) 1,467,920 1,467,920 1,467,920
2009-10 reduction of 4.83% COLA to 0% COLA
(10,118,655)
2010-11 reduction of 2.7% COLA to 0%
(15,927,646)
Adjusted Ending Fund Balance 23,729,310 19,834,067 20,847,827

every student. every classroom. every day. 12
State Budget Impact onOUSD Adoption Budget General Purpose Fund
2008-09 2009-10 2010-11
Adjusted Ending Fund Balance from State budget adjustments
23,729,310 19,834,067 20,847,827
Unaudited Actuals final budget; change in Ending Fund Balance
(2,675,708) (2,675,708) (2,675,708)
Change in Adoption budget enrollment projections based on current 21 day count. Projected enrollment 36,731 – Actual enrollment (21 day count) 37,177. 446 more student than projected, still a actual decline of approximately 240 students from 2007-08 enrollment.
(1,784,000)This deficit
represents the increase in RBB
expenses with no change in revenue
2,419,035 2,419,035
Projected Ending Fund Balance
19,269,602 19,577,394 20,591,154
every student. every classroom. every day. 13
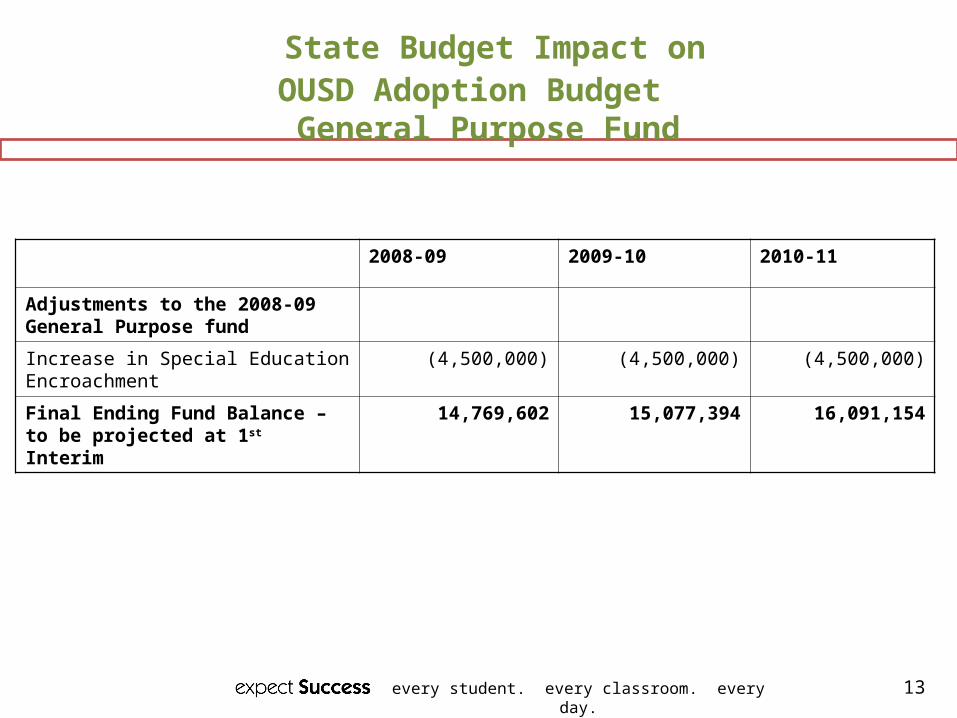
State Budget Impact onOUSD Adoption Budget General Purpose Fund
2008-09 2009-10 2010-11
Adjustments to the 2008-09 General Purpose fund
Increase in Special Education Encroachment
(4,500,000) (4,500,000) (4,500,000)
Final Ending Fund Balance – to be projected at 1st Interim
14,769,602 15,077,394 16,091,154

every student. every classroom. every day. 14
Components of Ending Fund Balance
Unrestricted General Purpose Fund
Category 2008-09 2009-10 2010-11
Ending Fund Balance
14,769,602
15,046,834 16,049,794
Reserve for Economic Uncertainty (2%)
8,900,000 8,521,359 8,462,945
Revolving Cash 150,000 150,000 150,000
Audit Findings 1,069,602 1,756,035 2,828,209
Declining Enrollment
2,500,000 2,500,000 2,500,000
Measure E 1,900,000 1,900,000 1,900,000
Oakland Athletic League
250,000 250,000 250,000
Total Components of EFB
14,769,602
15,077,394 16,091,154

every student. every classroom. every day. 15
State Budget Impact onOUSD Adoption Budget
General Categorical Fund
2008-09 2009-10 2010-11
Adoption Budget – 6/25/2008
Beginning Fund Balance 3,965,857 6,231,473 6,391,069
Total Revenue 166,510,309 160,460,492 157,451,423
Total Expenditures 164,244,693 160,300,896 157,428,462
Ending Fund Balance 6,231,473 6,391,069 6,414,030
Unaudited Actuals final budget; change in Ending Fund Balance
15,727,726 15,727,726 15,727,726
Adjusted Ending Fund Balance 21,959,199 22,118,795 22,141,756
State Budget Adjustments (Rescinding 6.5% deficit)
2,640,000 2,640,000 2,640,000
Additional projected expenditures (8,500,000) (8,500,000) (8,500,000)
Final Projected Ending Fund Balance
16,099,199 16,258,795 16,281,756

every student. every classroom. every day. 16
1% Raise in Compensation: By Union Classification
Union Annual Amount
Comments
OEA $1,440,000 Estimated annual increase is 1.5% (step & column)
SEIU $286,079 Estimated annual increase is 1.5% (step & column)
AFSCME $173,515 Estimated annual increase is 1.5% (step & column)
AFT $59,446 Estimated annual increase is 1.5% (step & column)
Teamsters $6,960 Estimated annual increase is 1.5% (step & column)
Confidential $23,508 Estimated annual increase is 1.5% (step & column)
UAOS $315,800 Estimated annual increase is 1.5% (step & column)
TOTAL $2,305,308

every student. every classroom. every day. 17
Thank You.
QUESTIONS?