Embed Size (px)
Citation preview
1
Evidence-Based Medicine and Statistics
Introductory Overview Lecture
JSM 2011
Christopher Schmid
Tufts University
1 August 2011
2
Evidence-Based Medicine
Evidence-based medicine is the conscientious, explicit and judicious use of current best evidence in making decisions about the care of individual patients
Sackett et al. Oxford. CEBM, BMJ. 1996;312:71-2.
3 3
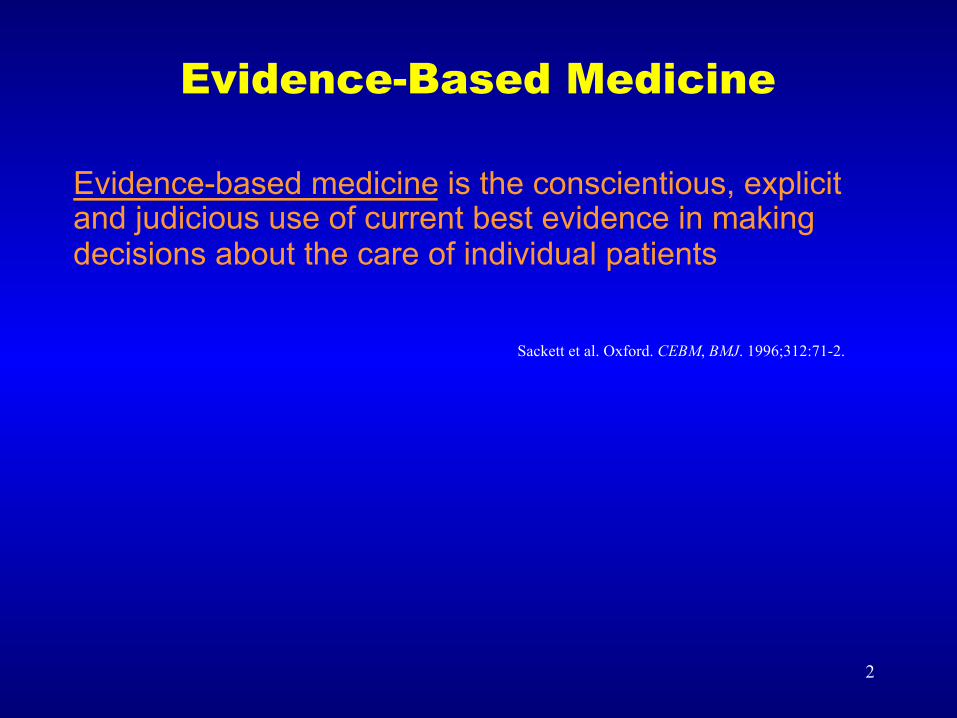
Healthcare Spending and Quality
Source: Anderson GF and Frogner BK, Health Spending in OECD Countries: Obtaining Value Per Dollar. Health Affairs 27(6); 1718-1727. Nov 2008
• $2,197 per capita more than expected
• 3.1 life years less than expected
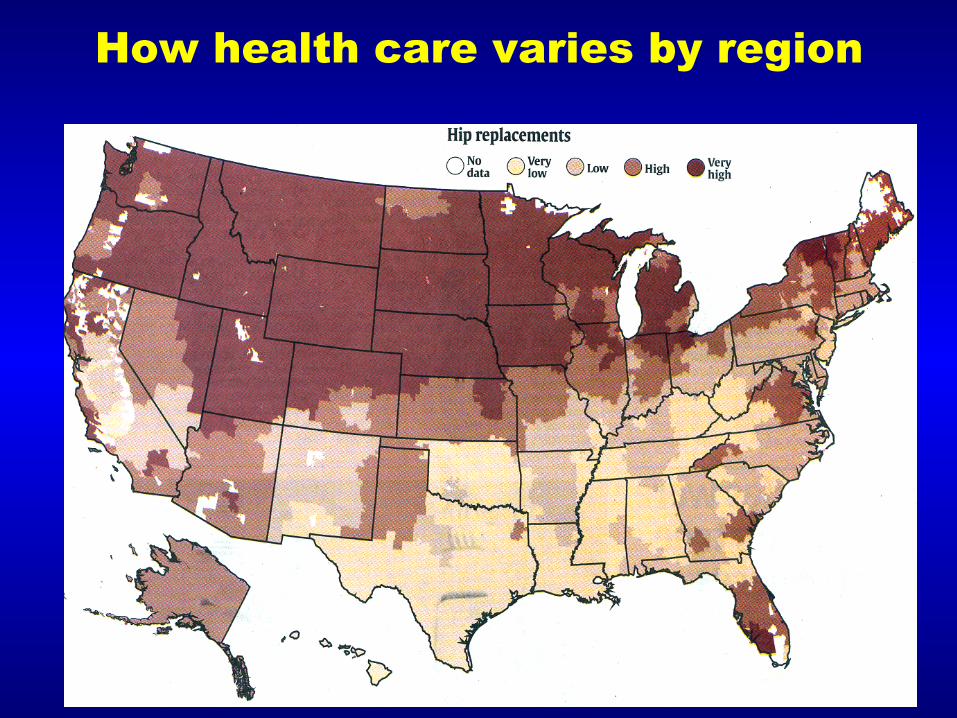
4
How health care varies by region
5
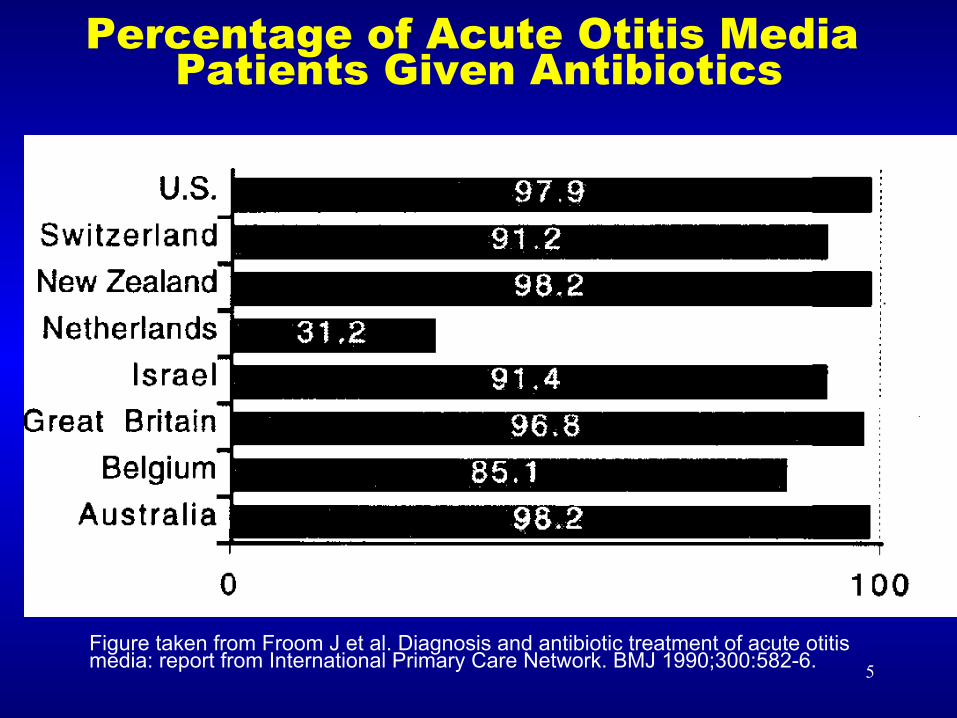
Percentage of Acute Otitis Media Patients Given Antibiotics
Figure taken from Froom J et al. Diagnosis and antibiotic treatment of acute otitis media: report from International Primary Care Network. BMJ 1990;300:582-6.
6
Tradition-based Medicine
• Emphasizes ─ primacy of knowledge ─ experience ─ intuition in exercising good clinical judgment
• Observational
• Susceptible to bias
• Individual experiences limited and problems heterogeneous
• Lack of conceptual framework for synthesizing evidence
• Lack of conceptual framework for clinical decision making
7
Evidence-Based Medicine
Stresses • examination of evidence from clinical research • systematic collection of evidence • synthesis of evidence
De-emphasizes • intuition • unsystematic experience • pathophysiological rationale (surrogates)
8
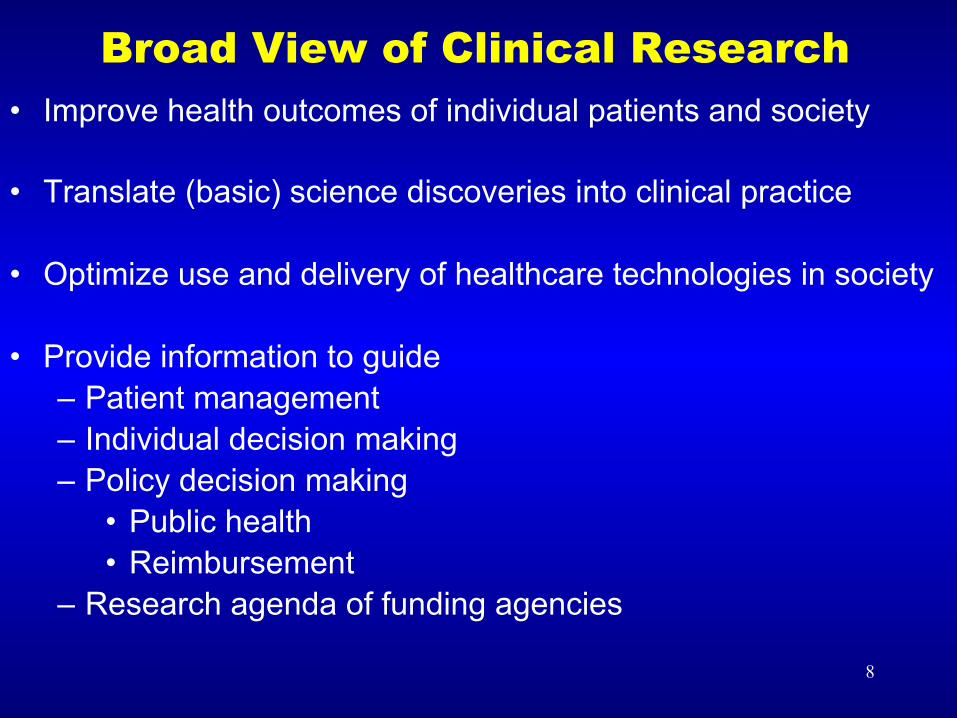
Broad View of Clinical Research • Improve health outcomes of individual patients and society
• Translate (basic) science discoveries into clinical practice
• Optimize use and delivery of healthcare technologies in society
• Provide information to guide – Patient management – Individual decision making – Policy decision making
• Public health • Reimbursement
– Research agenda of funding agencies
9
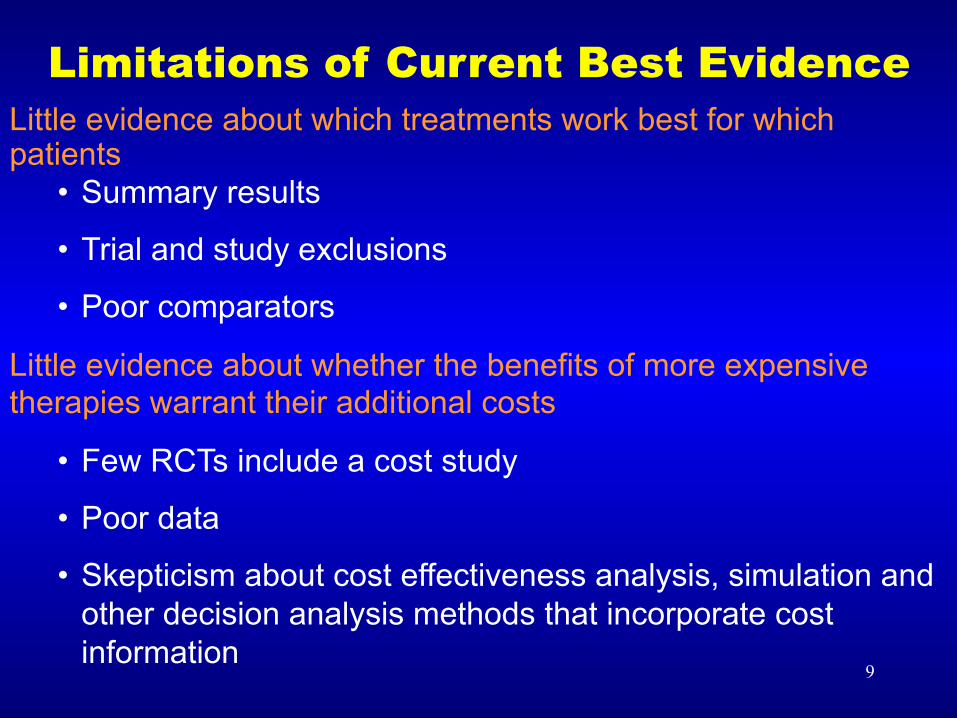
Little evidence about which treatments work best for which patients
• Summary results
• Trial and study exclusions
• Poor comparators
Little evidence about whether the benefits of more expensive therapies warrant their additional costs
• Few RCTs include a cost study
• Poor data
• Skepticism about cost effectiveness analysis, simulation and other decision analysis methods that incorporate cost information
Limitations of Current Best Evidence
10
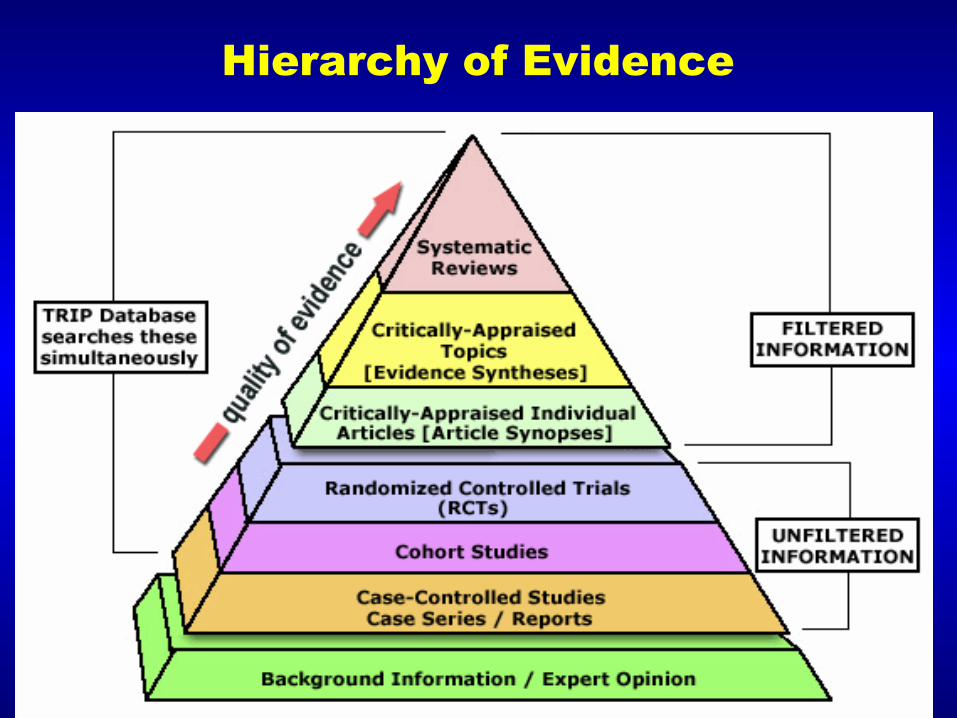
Hierarchy of Evidence
11 11
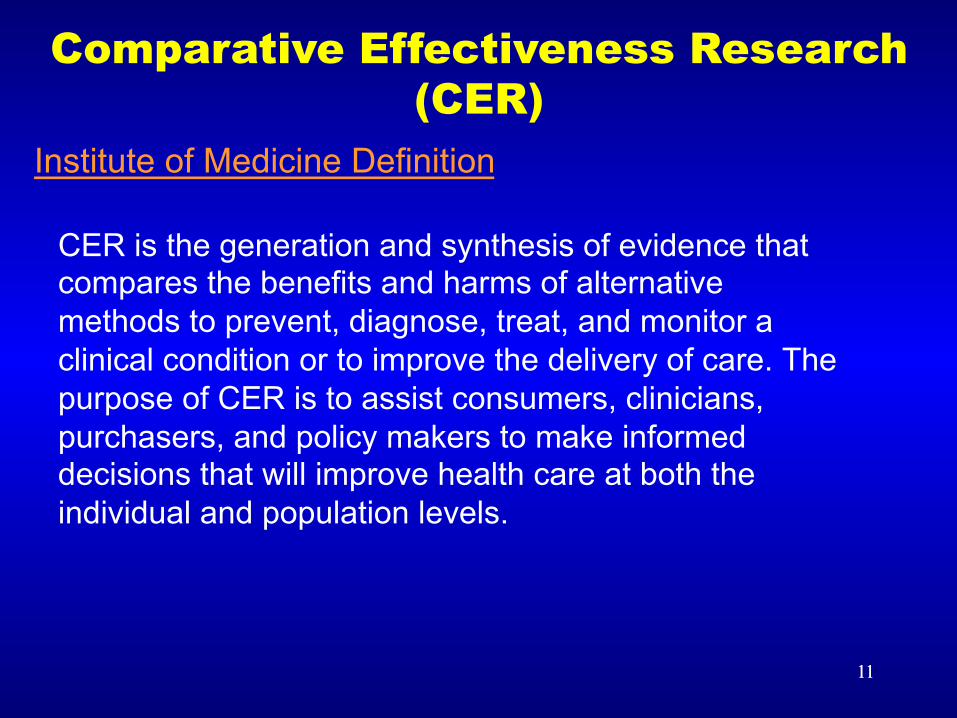
Institute of Medicine Definition CER is the generation and synthesis of evidence that compares the benefits and harms of alternative methods to prevent, diagnose, treat, and monitor a clinical condition or to improve the delivery of care. The purpose of CER is to assist consumers, clinicians, purchasers, and policy makers to make informed decisions that will improve health care at both the individual and population levels.
Comparative Effectiveness Research (CER)
12
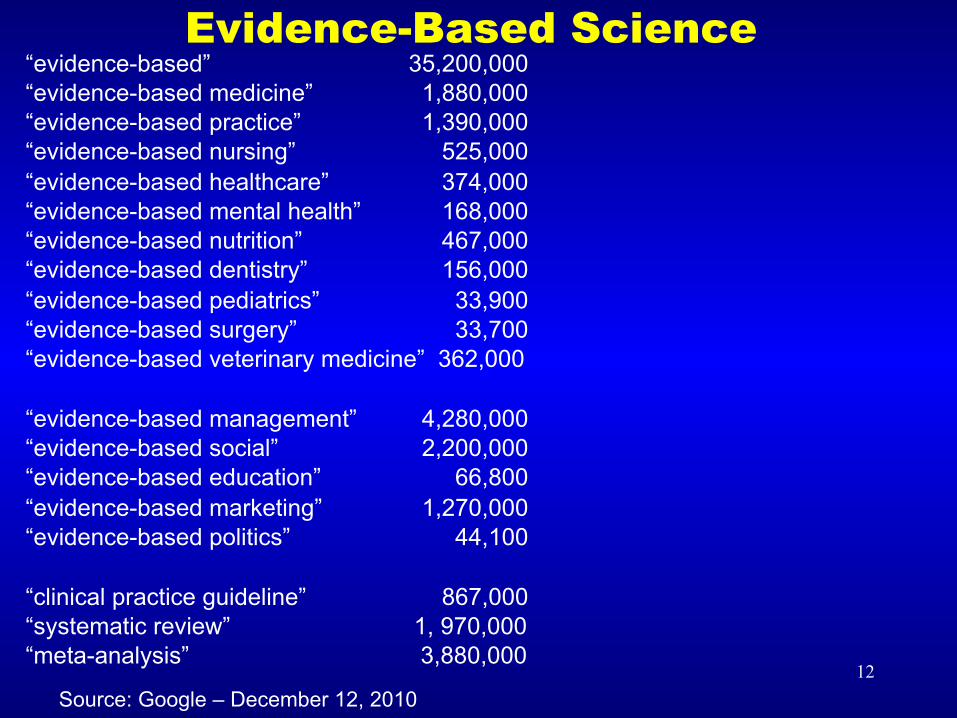
Evidence-Based Science “evidence-based” 35,200,000 “evidence-based medicine” 1,880,000 “evidence-based practice” 1,390,000 “evidence-based nursing” 525,000 “evidence-based healthcare” 374,000 “evidence-based mental health” 168,000 “evidence-based nutrition” 467,000 “evidence-based dentistry” 156,000 “evidence-based pediatrics” 33,900 “evidence-based surgery” 33,700 “evidence-based veterinary medicine” 362,000 “evidence-based management” 4,280,000 “evidence-based social” 2,200,000 “evidence-based education” 66,800 “evidence-based marketing” 1,270,000 “evidence-based politics” 44,100 “clinical practice guideline” 867,000 “systematic review” 1, 970,000 “meta-analysis” 3,880,000
Source: Google – December 12, 2010
13
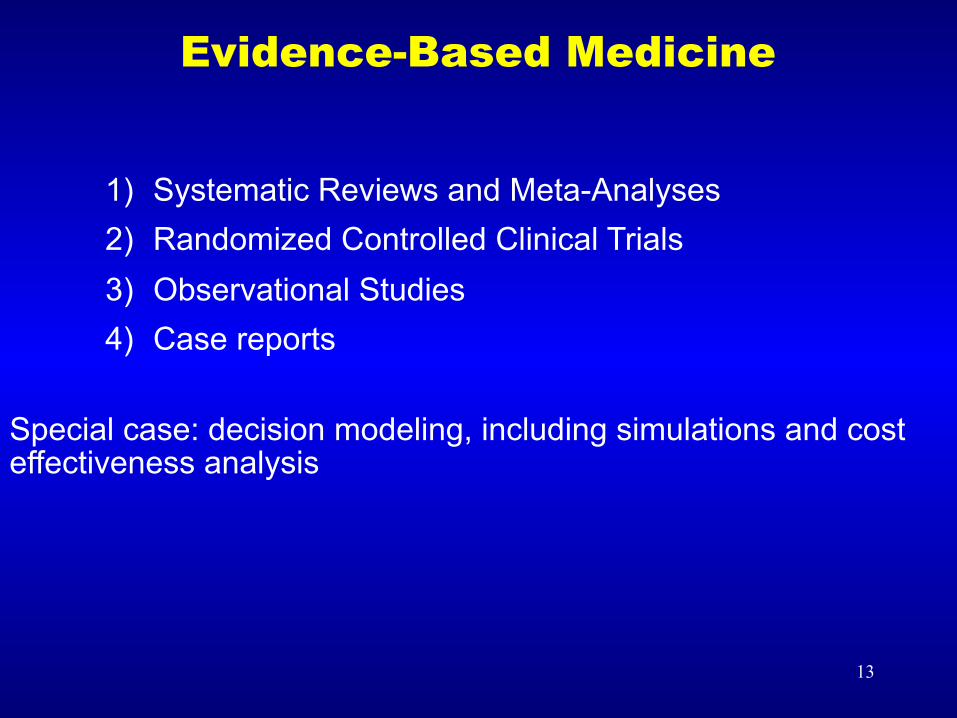
Evidence-Based Medicine
1) Systematic Reviews and Meta-Analyses 2) Randomized Controlled Clinical Trials 3) Observational Studies 4) Case reports
Special case: decision modeling, including simulations and cost effectiveness analysis
14
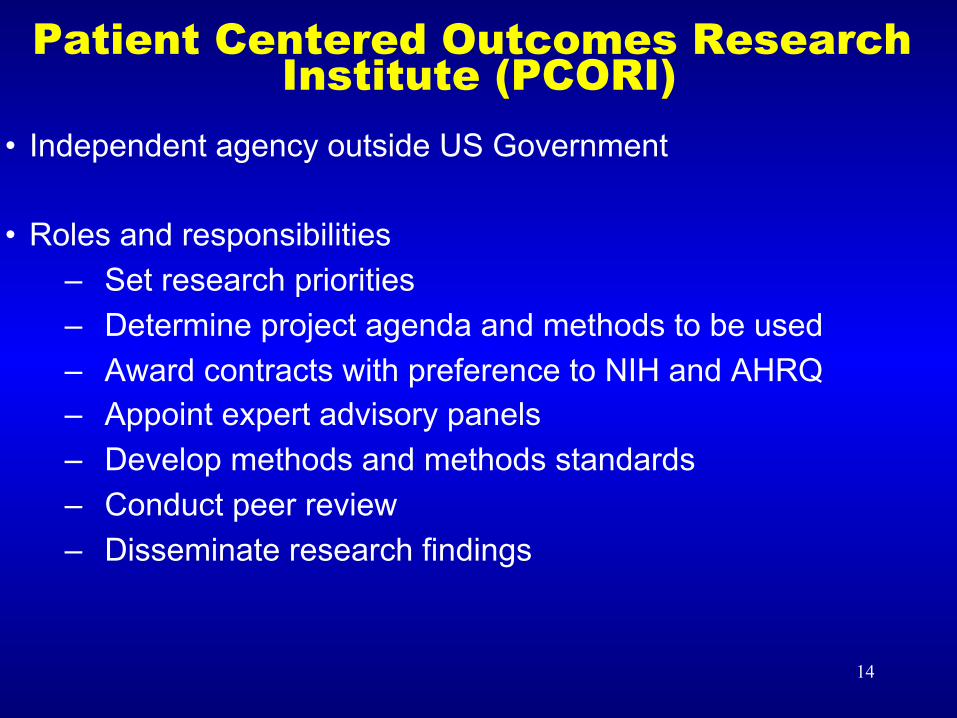
Patient Centered Outcomes Research Institute (PCORI)
• Independent agency outside US Government
• Roles and responsibilities – Set research priorities – Determine project agenda and methods to be used – Award contracts with preference to NIH and AHRQ – Appoint expert advisory panels – Develop methods and methods standards – Conduct peer review – Disseminate research findings
15
P P P P P
P
P P
P P P P P
P
P
P
P
Drug and Device Makers
Patients
Clinicians / Providers
Private Payers
Government P
P
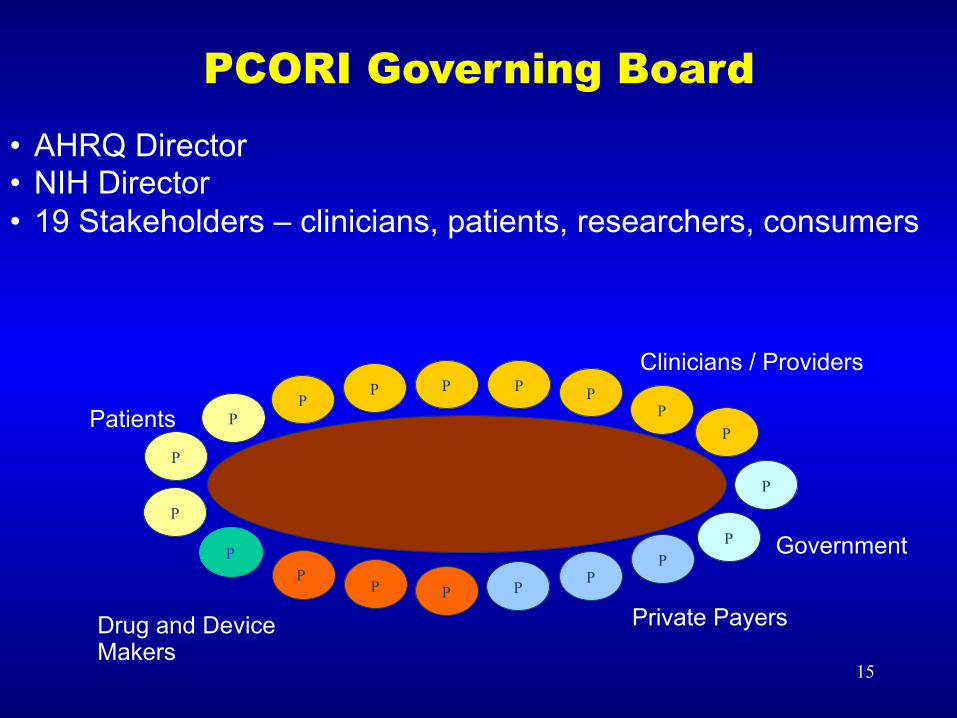
PCORI Governing Board • AHRQ Director • NIH Director • 19 Stakeholders – clinicians, patients, researchers, consumers
16
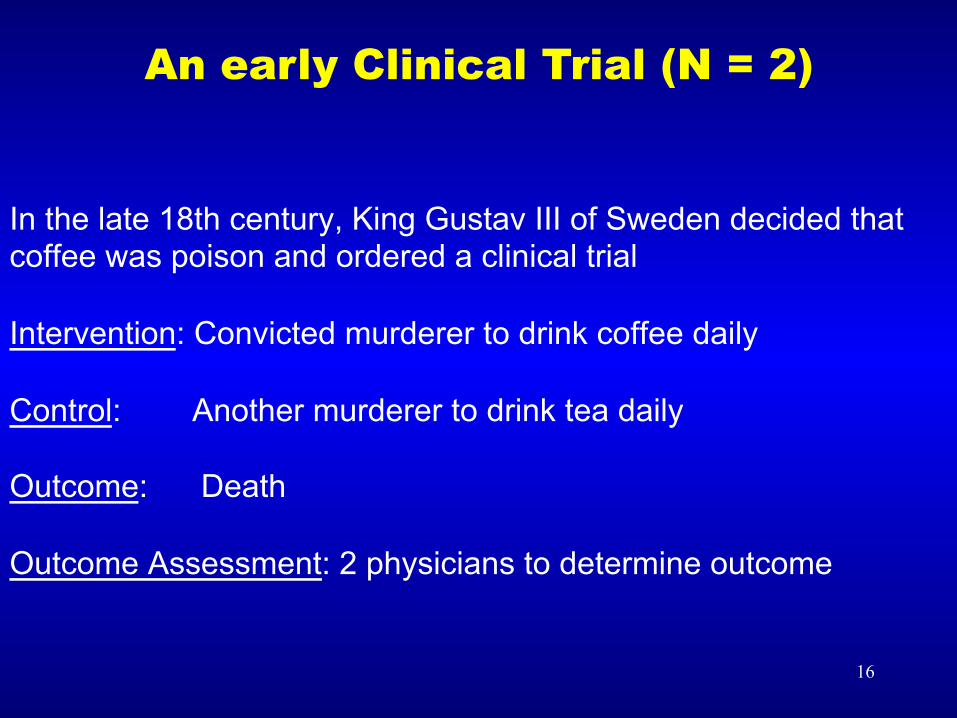
In the late 18th century, King Gustav III of Sweden decided that coffee was poison and ordered a clinical trial Intervention: Convicted murderer to drink coffee daily Control: Another murderer to drink tea daily Outcome: Death Outcome Assessment: 2 physicians to determine outcome
An early Clinical Trial (N = 2)
17
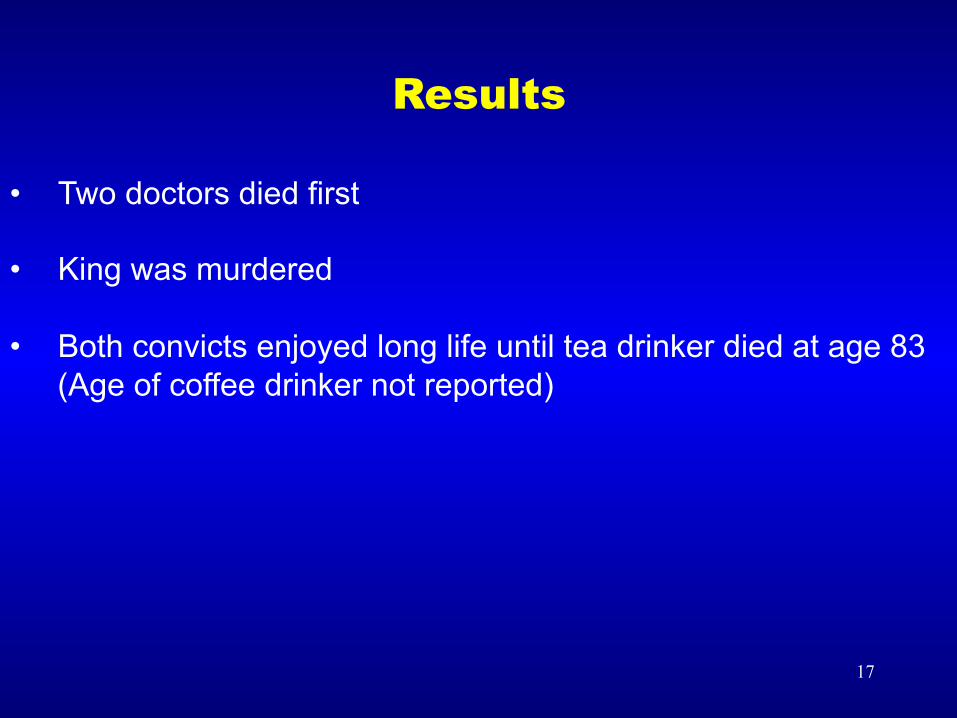
Results
• Two doctors died first
• King was murdered
• Both convicts enjoyed long life until tea drinker died at age 83 (Age of coffee drinker not reported)
18
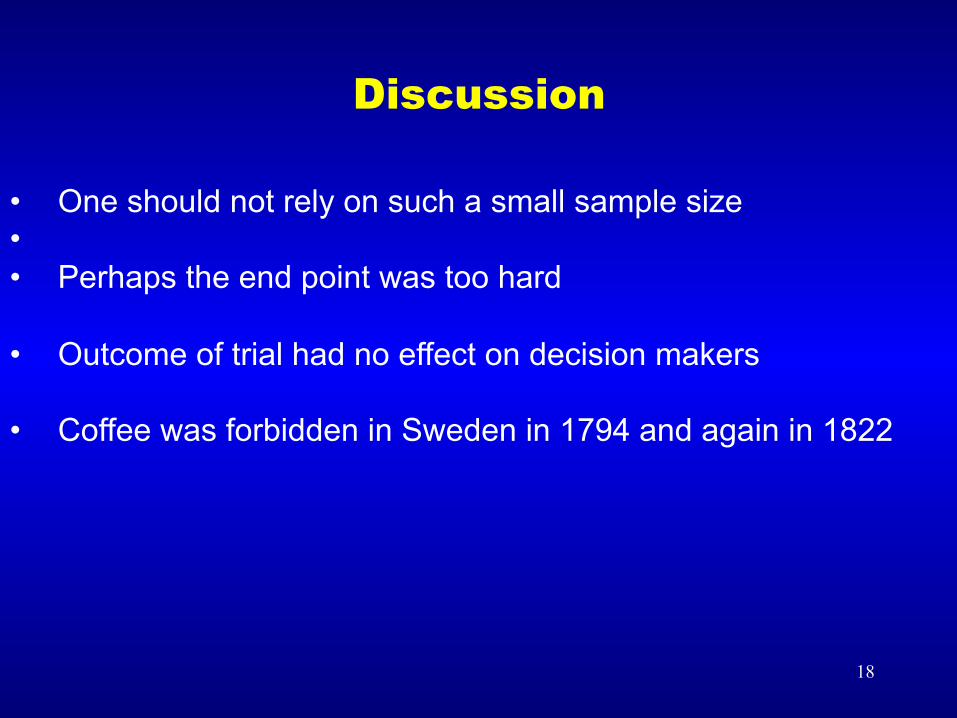
Discussion
• One should not rely on such a small sample size • • Perhaps the end point was too hard
• Outcome of trial had no effect on decision makers
• Coffee was forbidden in Sweden in 1794 and again in 1822
19
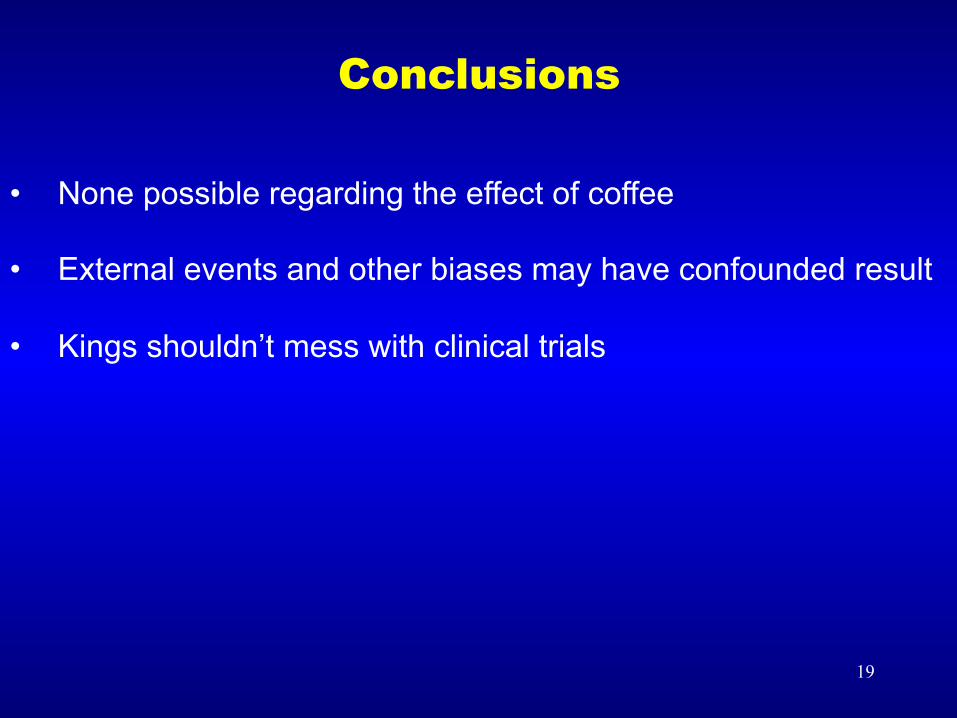
Conclusions
• None possible regarding the effect of coffee
• External events and other biases may have confounded result
• Kings shouldn’t mess with clinical trials
20
Randomized Clinical Trials (RCTs)
• Use random treatment assignment to determine efficacy of intervention under ideal circumstances
• Patients are randomly assigned to treatment or control groups with pre-and post treatment measurement, double blinding and closely followed treatment protocols
• 1993 conference reviewing quality of publications reporting clinical trials found considerable variation in quality and issued new standard for measuring quality of RCT reports
21
CONSORT Statement (Consolidated Standards of Reporting
Trials)
• Checklist for reporting of 25 items: – Title and Abstract – Scientific background and rationale – Methods – Results – Discussion
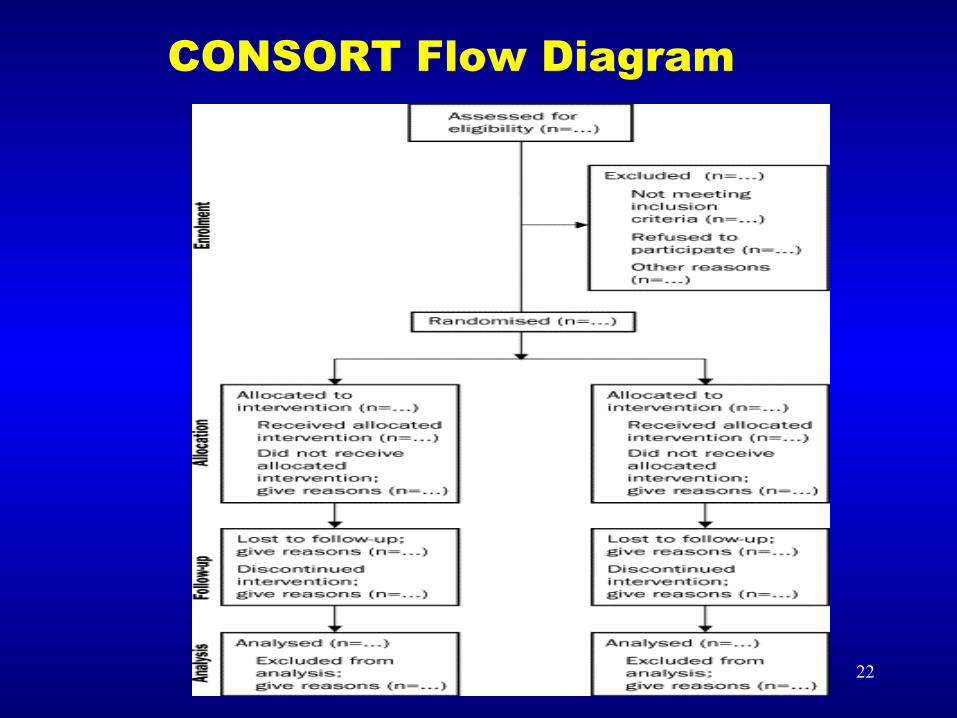
• Flow diagram to describe patient flows through enrollment, intervention allocation, follow-up and data analysis
22
CONSORT Flow Diagram
23
Advantages of RCTs
• A priori hypothesis
• Internal validity if randomized and controlled
• Near-certain test of efficacy of intervention vs. placebo
Well-designed clinical trials excel at testing an a priori causal hypotheses, typically comparing the effect of an intervention against placebo, for an ideal population, in a controlled setting
24
Limitations of RCTs
Even well-designed trials may not be very good at determining the effects of an intervention, compared to existing alternatives under the usual conditions in which they are be applied
• Limited external validity
• Uncertain effectiveness of the intervention
• Uncertain comparison to alternatives
• Difficult to apply summary results to individual patients
• RCTs are often very slow to produce results
25
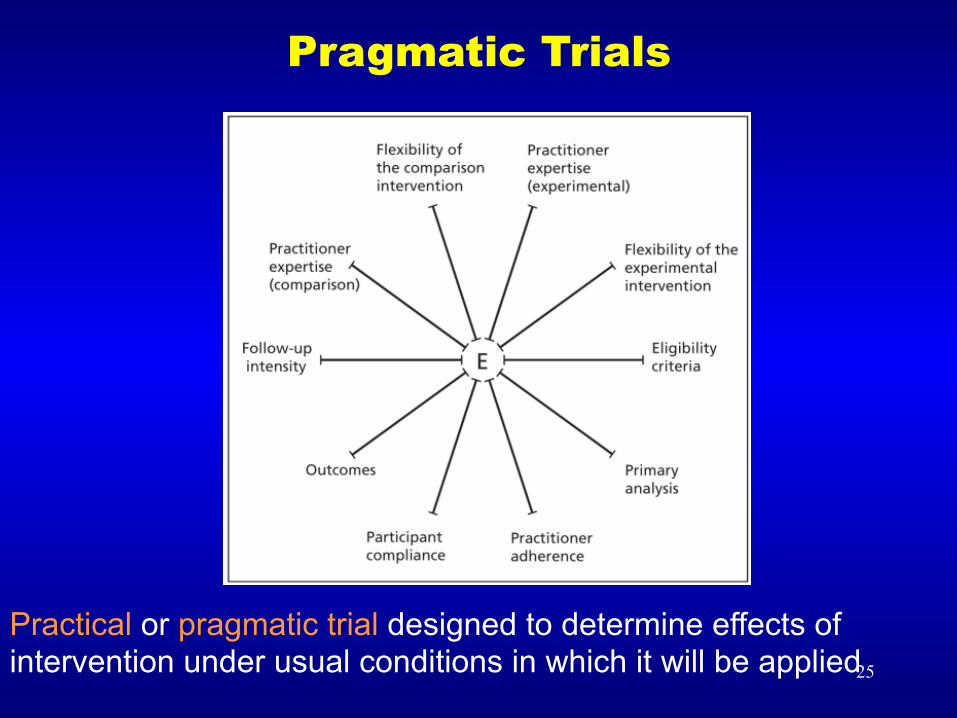
Pragmatic Trials
Practical or pragmatic trial designed to determine effects of intervention under usual conditions in which it will be applied
26
ClinicalTrials.Gov
• Website to register RCT protocols and results
• Required by many journals, US funding agencies and FDA
• May reduce problems of publication and reporting bias
27
Publication Bias
• Negative studies are more likely than positive studies to remain unpublished
• Negative” studies are likely to be small • In general, not concerned about unpublished “positive” studies. • Negative studies might invalidate meta-analysis results
• Publication bias is only a part of the bigger “missing data” problem in meta-analysis (and clinical research)
• Selective reporting bias may be a bigger problem
28
Case Reports (Case Series)
• Detailed report of diagnosis, treatment, and follow-up of individual patient
• Contain some demographic information about patient Advantages
– Helpful in medical education to describe unusual occurrences – Development of clinical judgement
Limitations
– Anecdotal evidence – Limited (to no) generalizibility
29
Observational Studies Case-control and cohort designs typically use existing population data, a hypothesis and statistical controls to evaluate a problem or identify associations between an “intervention” and an “outcome” Other non-randomized designs
– Cross sectional studies – Surveillance studies using registry data
Advantages
– For retrospective approaches, readily available data – Faster results – Hypothesis-generating
Limitations
– Confounding – Limited causal inference – Limited external validity (often, not always)
30
Major Impacts of Non-randomized Evidence
• Lind, 1747, 6 pairs of sailors with scurvy
• Jenner, smallpox, late 18th century
• Fleming, penicillin, 1928-1940s
31
Observational Study Findings Later Disproved
• Hormone therapy / cardio-protective effects of estrogen
• β carotene and α-tocopherol and cancer
• Fiber and colon cancer
32
Major Impacts of Randomized Evidence
• Streptomycin for tuberculosis
• Polio vaccine
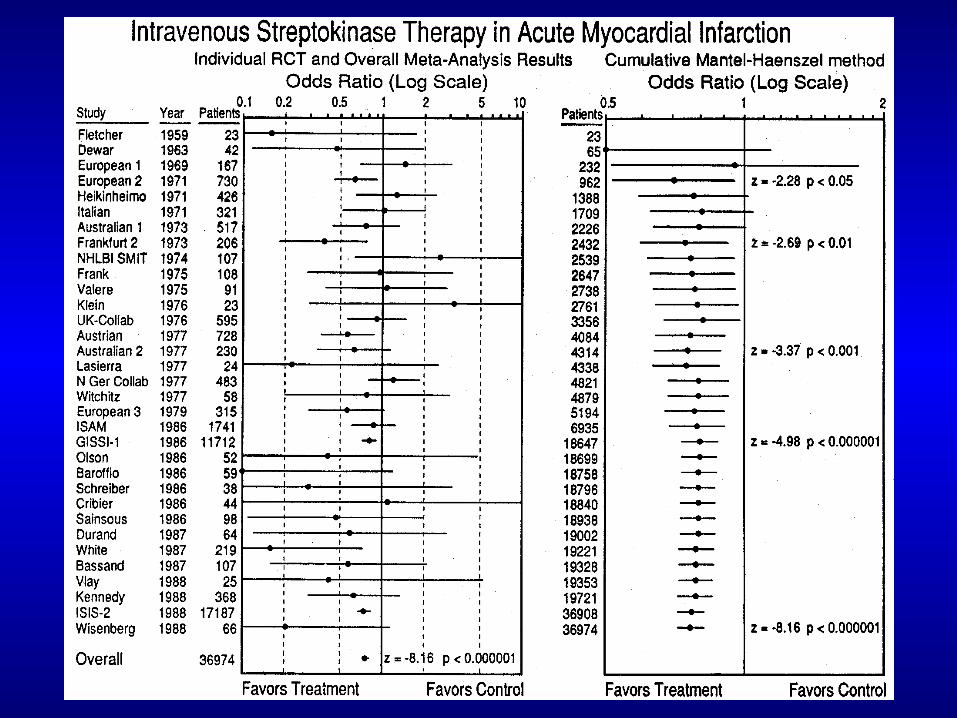
• Treatments for acute myocardial infarction
• Estrogen Replacement Therapy
33
Observational vs. Randomized Evidence • Treatment effects in RCTs and observational studies on same
topic tend to be highly correlated
– Discrepancies occur in about 1 out of 6 cases, even when accounting for between-study heterogeneity
– Discrepant pairs tend to show more favorable results in observational studies
• Discrepancies in magnitude of effect very common
• Observational studies exhibit larger variability in treatment effects than RCTs
• Discrepancies more common with retrospective designs
34
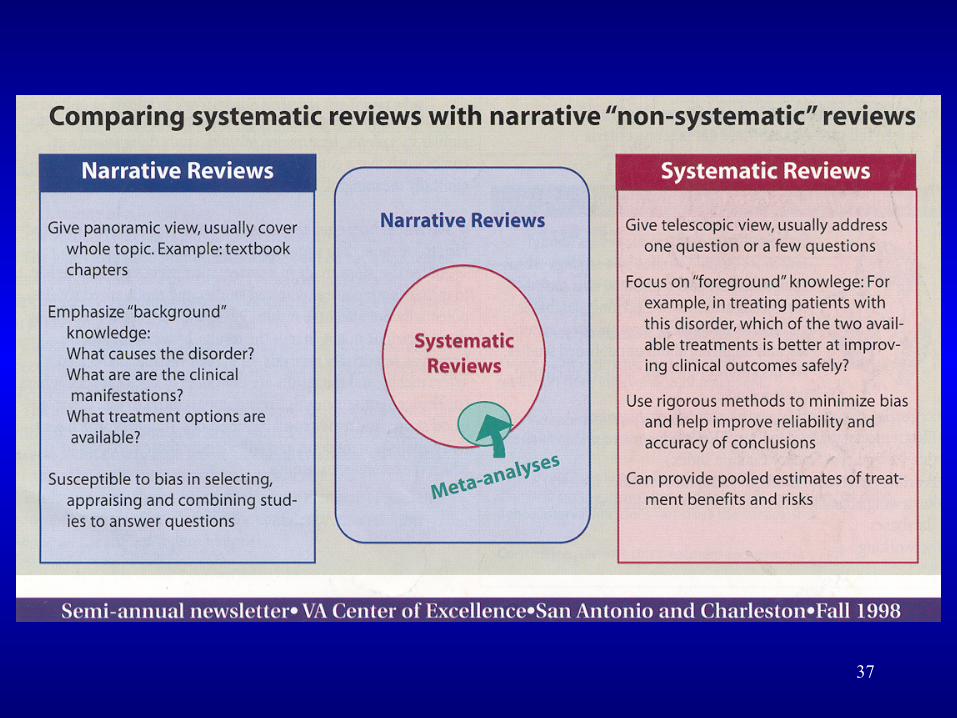
Systematic Review • Scientific discipline to combine information across studies using
defined protocol to answer focused research question(s)
• Formulate well-focused study question
• Establish eligibility criteria (study, patient, and disease characteristics, intervention, comparator, outcomes)
• Review literature comprehensively
• Identify relevant studies
• Extract data
• Critically appraise study quality and conclusions
35
Meta-Analysis
• Quantitative analysis of data from systematic review
• Estimate effect size and uncertainty (treatment effect, association, test accuracy) by statistical methods
• Combine “under-powered” studies to give more definitive conclusion
• Explore heterogeneity / explain discrepancies
• Identify research gaps and need for future studies
36
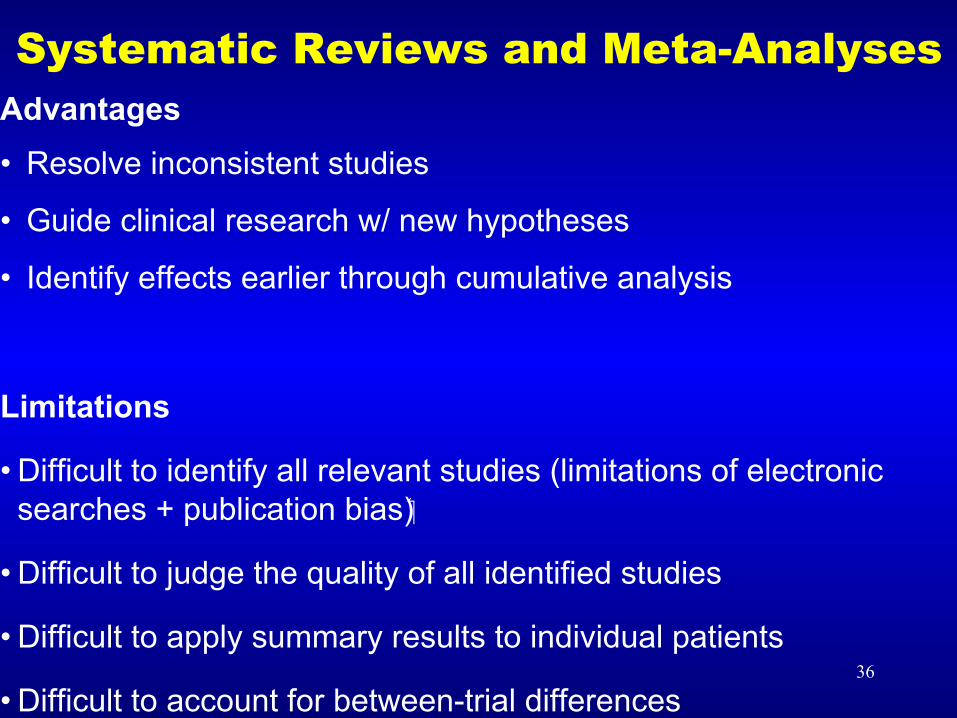
Systematic Reviews and Meta-Analyses Advantages • Resolve inconsistent studies
• Guide clinical research w/ new hypotheses
• Identify effects earlier through cumulative analysis
Limitations
• Difficult to identify all relevant studies (limitations of electronic searches + publication bias)
• Difficult to judge the quality of all identified studies
• Difficult to apply summary results to individual patients
• Difficult to account for between-trial differences
37
38
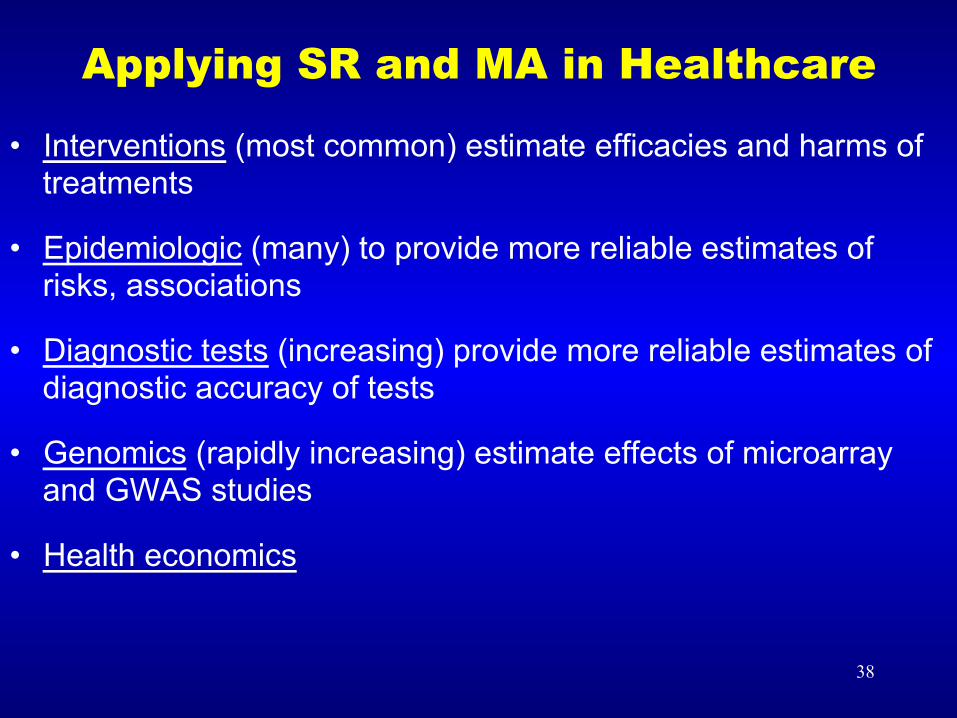
Applying SR and MA in Healthcare
• Interventions (most common) estimate efficacies and harms of treatments
• Epidemiologic (many) to provide more reliable estimates of risks, associations
• Diagnostic tests (increasing) provide more reliable estimates of diagnostic accuracy of tests
• Genomics (rapidly increasing) estimate effects of microarray and GWAS studies
• Health economics
39
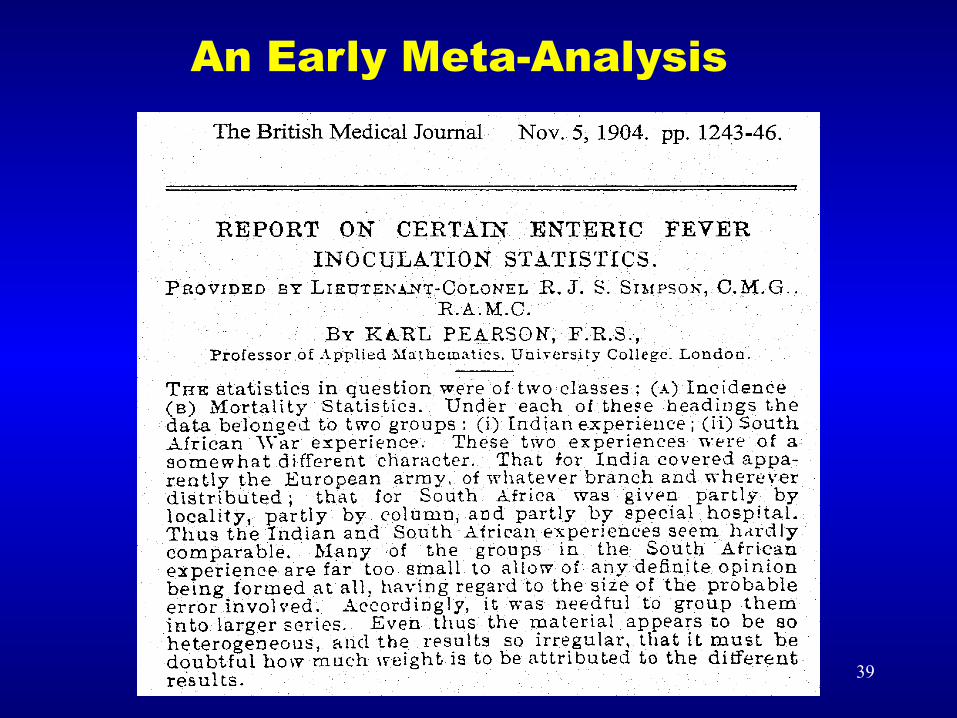
An Early Meta-Analysis
40
Systematic Review Products
• Journal publications
• Evidence reports
• Comparative effectiveness reviews (CER)
• Technology assessments
• Horizon scans
• Future research needs documents
• Feeders into clinical practice guidelines, coverage, and policy decision making
41
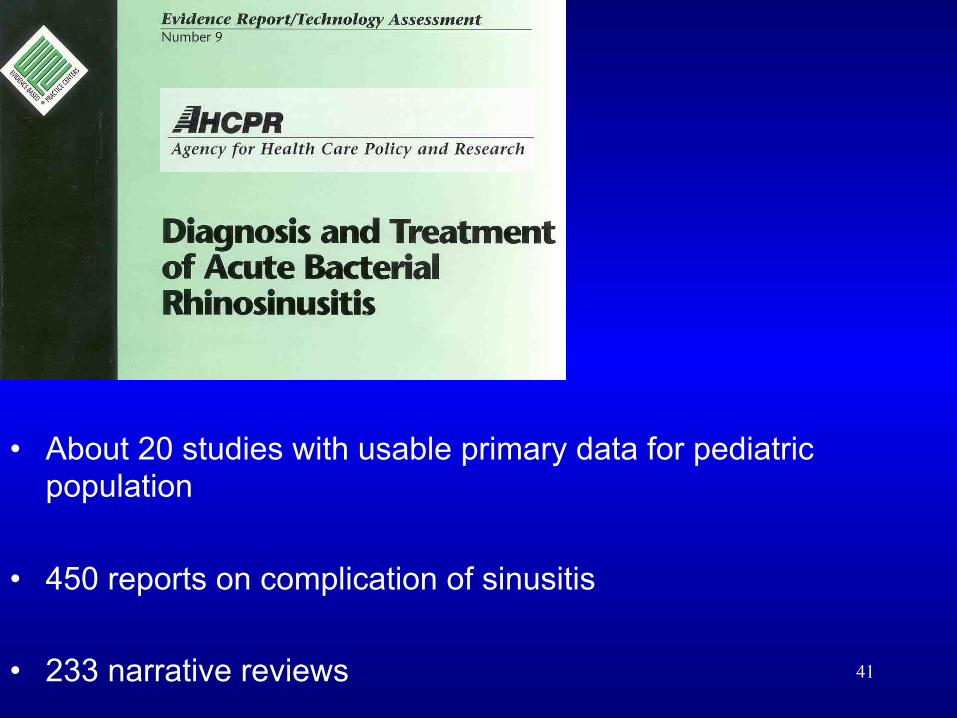
• About 20 studies with usable primary data for pediatric population
• 450 reports on complication of sinusitis
• 233 narrative reviews
42
The Cochrane Collaboration
• International collaboration to promote research synthesis
• National centers (one in USA)
• Collaborative review groups organized by clinical area
• Over 2000 meta-analyses published
• Also has register of randomized controlled trials
43
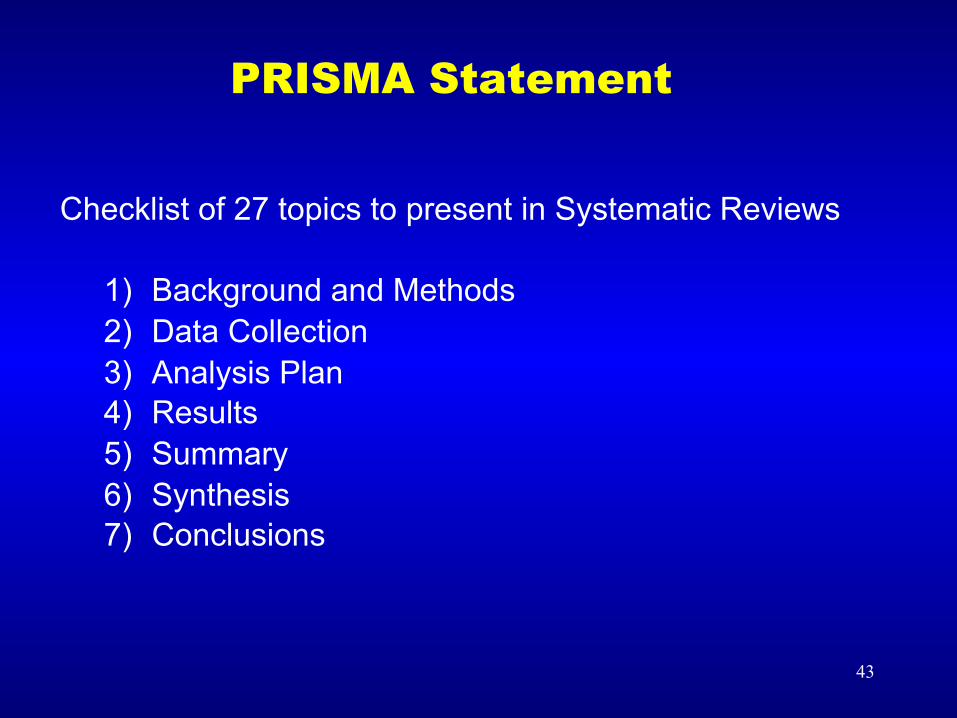
PRISMA Statement
Checklist of 27 topics to present in Systematic Reviews
1) Background and Methods 2) Data Collection 3) Analysis Plan 4) Results 5) Summary 6) Synthesis 7) Conclusions
44
Institute of Medicine (IOM) Standards for Systematic Reviews
For more information about the report go to www.iom.edu/srstandards or www.nap.edu
45
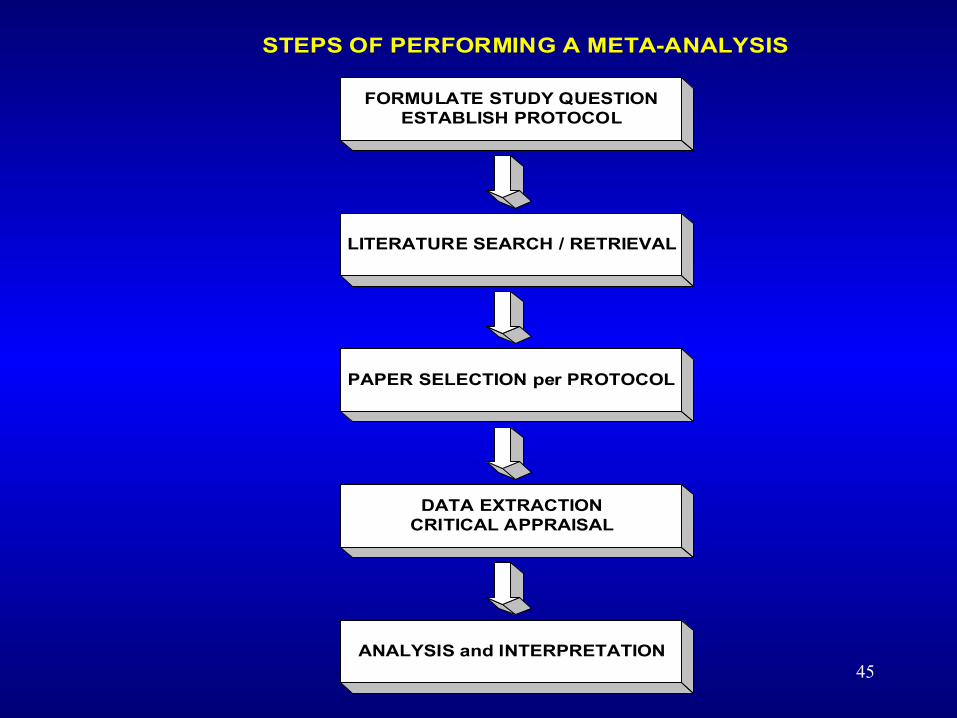
FORMULATE STUDY QUESTIONESTABLISH PROTOCOL
PAPER SELECTION per PROTOCOL
DATA EXTRACTIONCRITICAL APPRAISAL
ANALYSIS and INTERPRETATION
LITERATURE SEARCH / RETRIEVAL
STEPS OF PERFORMING A META-ANALYSIS
46
Formulating Answerable SR Questions
• Who is SR for and how will results be interpreted and used?
• Narrow versus broad question (e.g., for individual or population)
• Clinically meaningful and useful (based on sound biological and epidemiological principles)
• Very broadly defined questions may be criticized for mixing apples and oranges
• Very narrowly focused questions may have no data or have limited generalizability and sometimes may lead to misinterpretations
• Include stakeholders, clinicians, methodologists
47
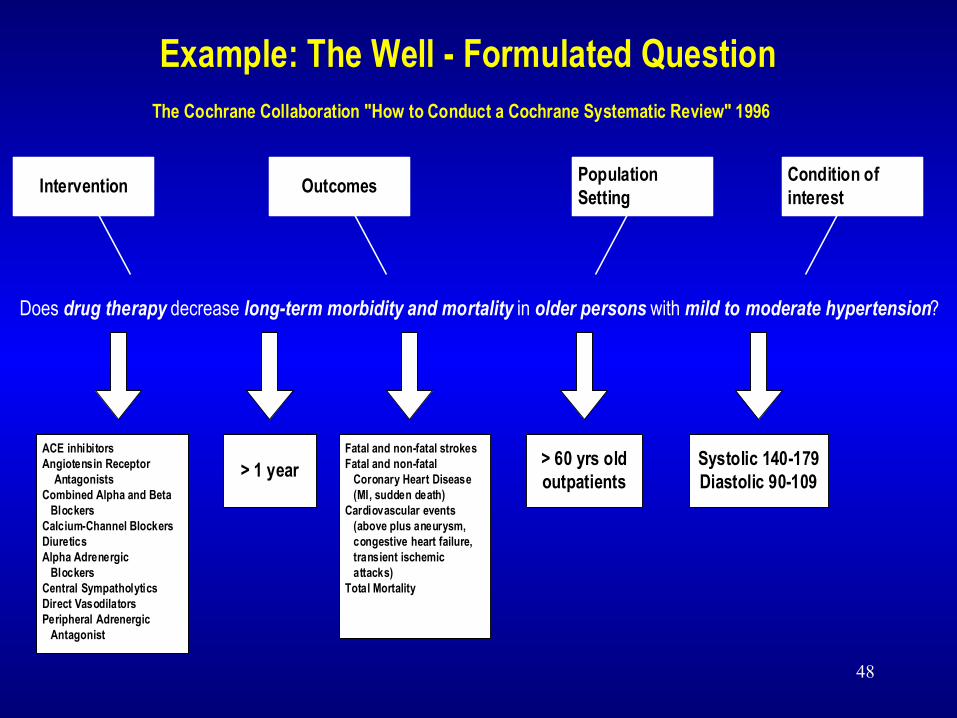
PICO(TS) Formulation
• Population • Interventions • Comparators • Outcomes • Timing • Study design
• Eligibility criteria
48
PopulationSettingIntervention Outcomes Condition of
interest
Example: The Well - Formulated Question
Does drug therapy decrease long-term morbidity and mortality in older persons with mild to moderate hypertension?
ACE inhibitorsAngiotensin Receptor AntagonistsCombined Alpha and Beta BlockersCalcium-Channel BlockersDiureticsAlpha Adrenergic BlockersCentral SympatholyticsDirect VasodilatorsPeripheral Adrenergic Antagonist
Fatal and non-fatal strokesFatal and non-fatal Coronary Heart Disease (MI, sudden death)Cardiovascular events (above plus aneurysm, congestive heart failure, transient ischemic attacks)Total Mortality
> 1 year > 60 yrs oldoutpatients
Systolic 140-179Diastolic 90-109
The Cochrane Collaboration "How to Conduct a Cochrane Systematic Review" 1996
49
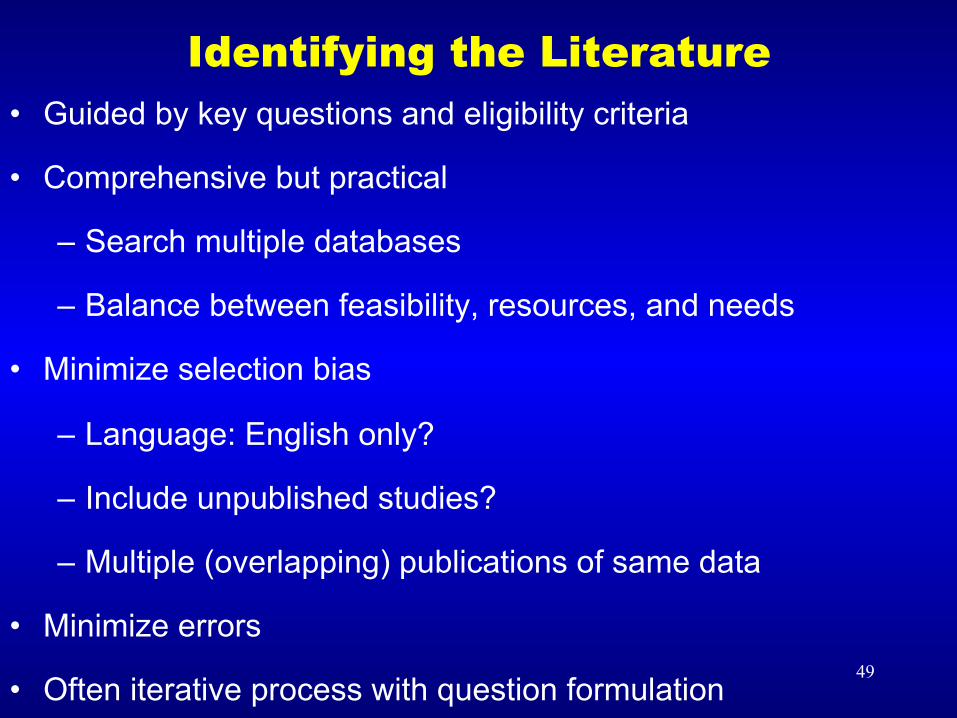
Identifying the Literature • Guided by key questions and eligibility criteria
• Comprehensive but practical
– Search multiple databases
– Balance between feasibility, resources, and needs
• Minimize selection bias
– Language: English only?
– Include unpublished studies?
– Multiple (overlapping) publications of same data
• Minimize errors
• Often iterative process with question formulation

50
18,000 citations were screened for the cancer pain evidence report
51
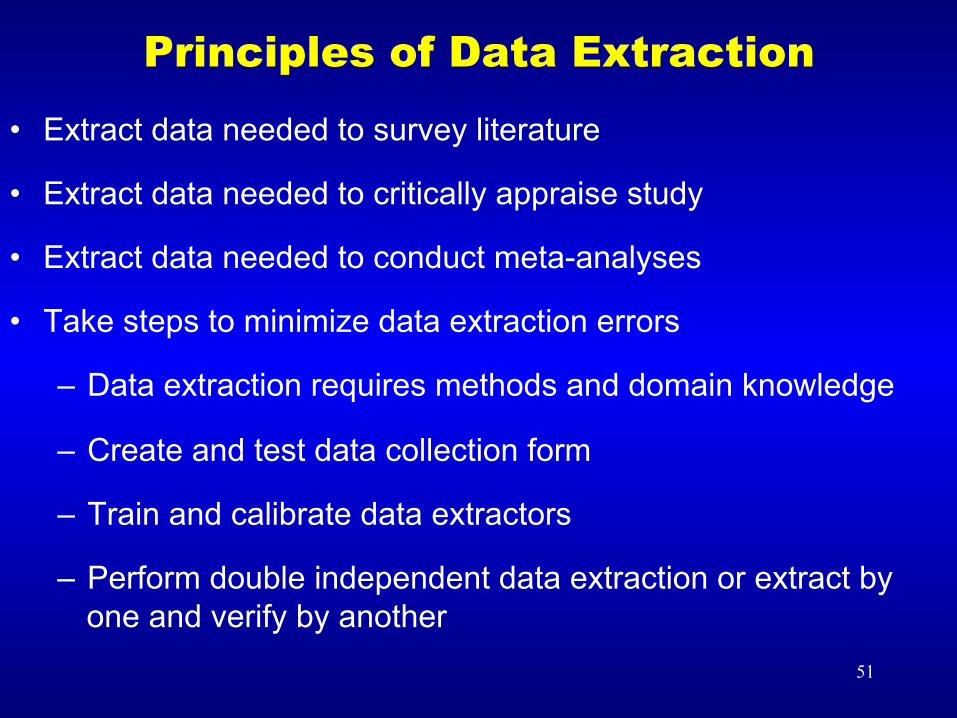
Principles of Data Extraction • Extract data needed to survey literature
• Extract data needed to critically appraise study
• Extract data needed to conduct meta-analyses
• Take steps to minimize data extraction errors
– Data extraction requires methods and domain knowledge
– Create and test data collection form
– Train and calibrate data extractors
– Perform double independent data extraction or extract by one and verify by another
52
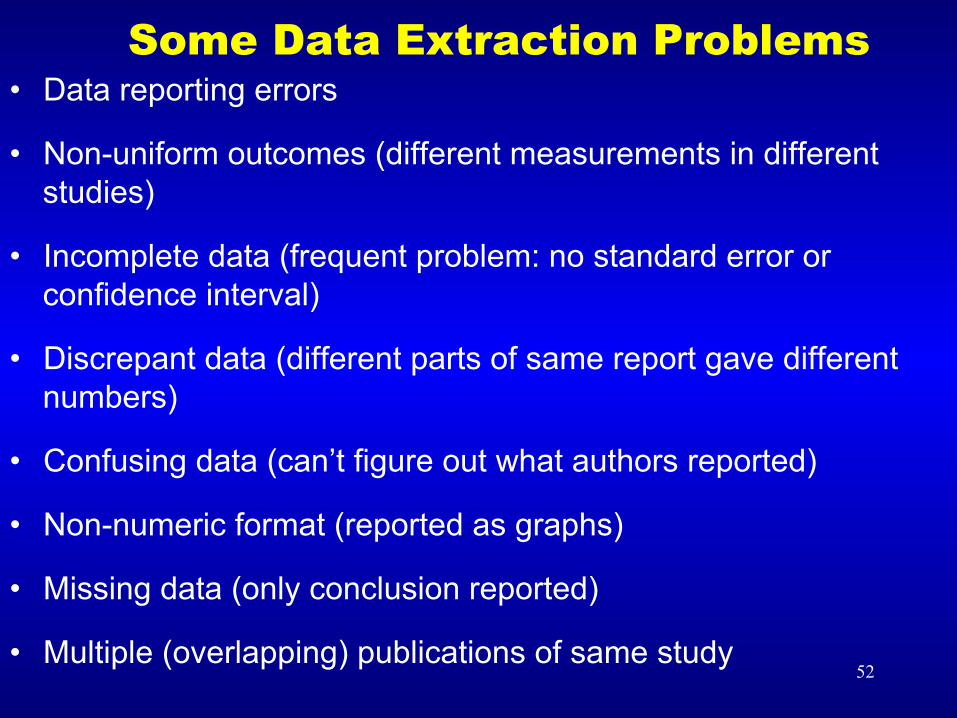
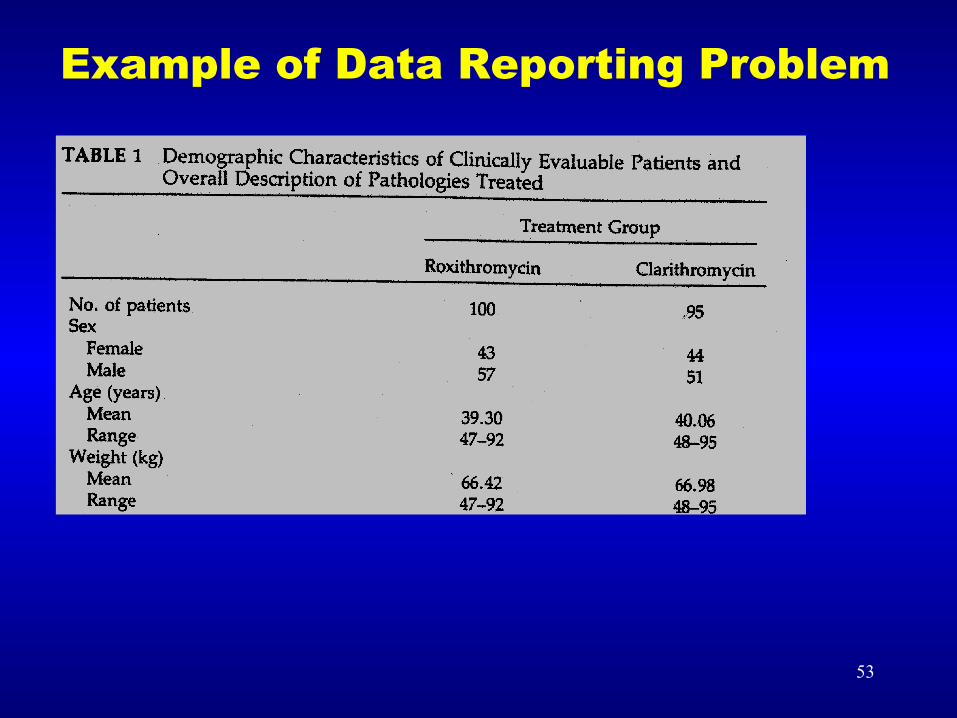
Some Data Extraction Problems • Data reporting errors
• Non-uniform outcomes (different measurements in different studies)
• Incomplete data (frequent problem: no standard error or confidence interval)
• Discrepant data (different parts of same report gave different numbers)
• Confusing data (can’t figure out what authors reported)
• Non-numeric format (reported as graphs)
• Missing data (only conclusion reported)
• Multiple (overlapping) publications of same study
53
Example of Data Reporting Problem
54
Another Example of Data Reporting Problem
Data for the 40 patients who were given all four doses of medications were considered evaluable for efficacy and safety. The overall study population consisted of ten (44%) men and 24 (56%) women, with a racial composition of 38 (88%) whites and five (12%) blacks.
55
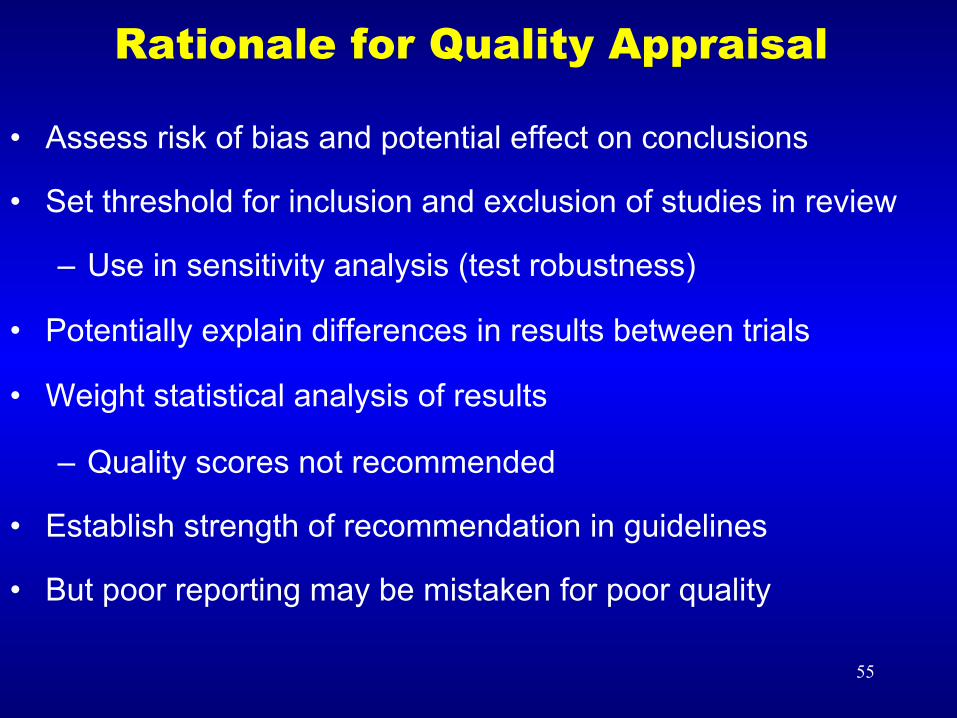
Rationale for Quality Appraisal
• Assess risk of bias and potential effect on conclusions
• Set threshold for inclusion and exclusion of studies in review
– Use in sensitivity analysis (test robustness)
• Potentially explain differences in results between trials
• Weight statistical analysis of results
– Quality scores not recommended
• Establish strength of recommendation in guidelines
• But poor reporting may be mistaken for poor quality
56
Commonly Assessed Quality Features
• Allocation concealment
• Blinding
• Description of intervention
• Withdrawals
• Statistical analysis
• Accuracy of reporting
57 57 57
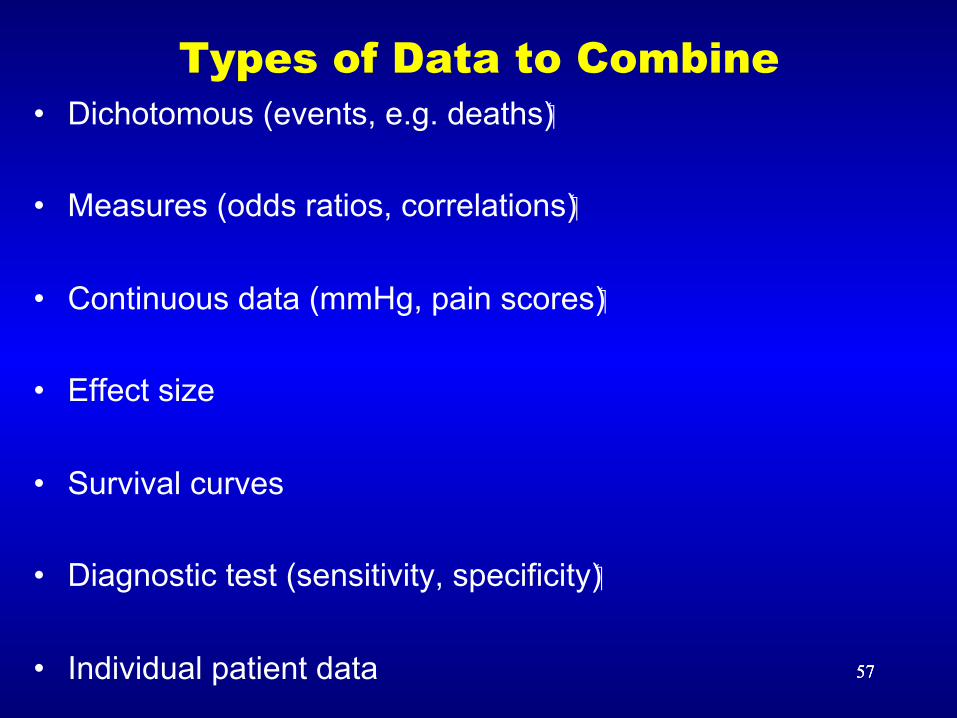
Types of Data to Combine • Dichotomous (events, e.g. deaths)
• Measures (odds ratios, correlations)
• Continuous data (mmHg, pain scores)
• Effect size
• Survival curves
• Diagnostic test (sensitivity, specificity)
• Individual patient data
58 58
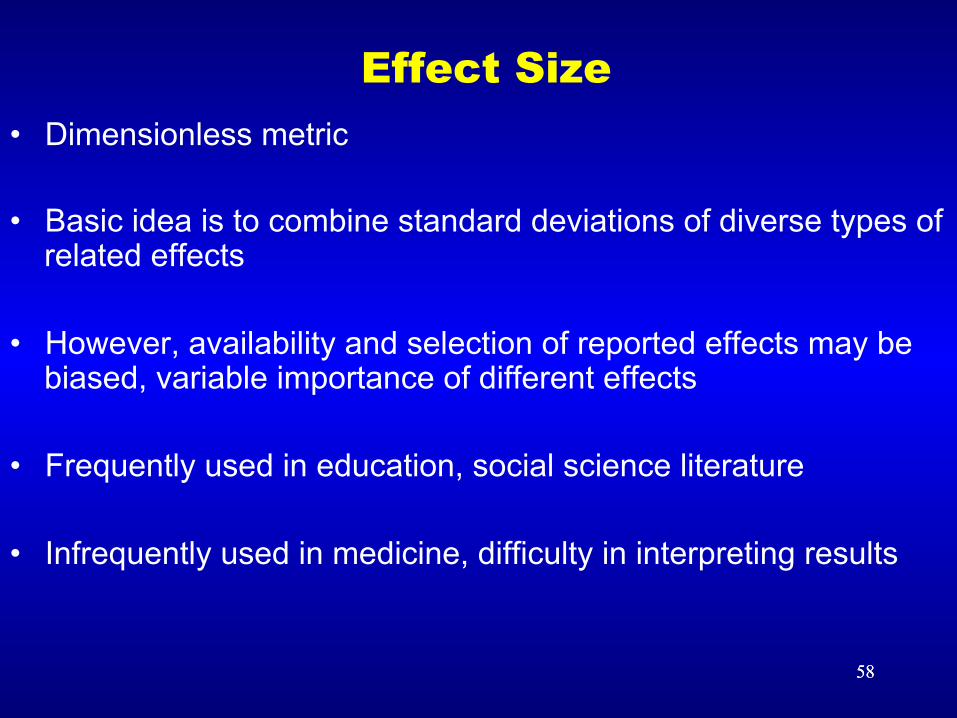
Effect Size • Dimensionless metric
• Basic idea is to combine standard deviations of diverse types of related effects
• However, availability and selection of reported effects may be biased, variable importance of different effects
• Frequently used in education, social science literature
• Infrequently used in medicine, difficulty in interpreting results
59 59 59
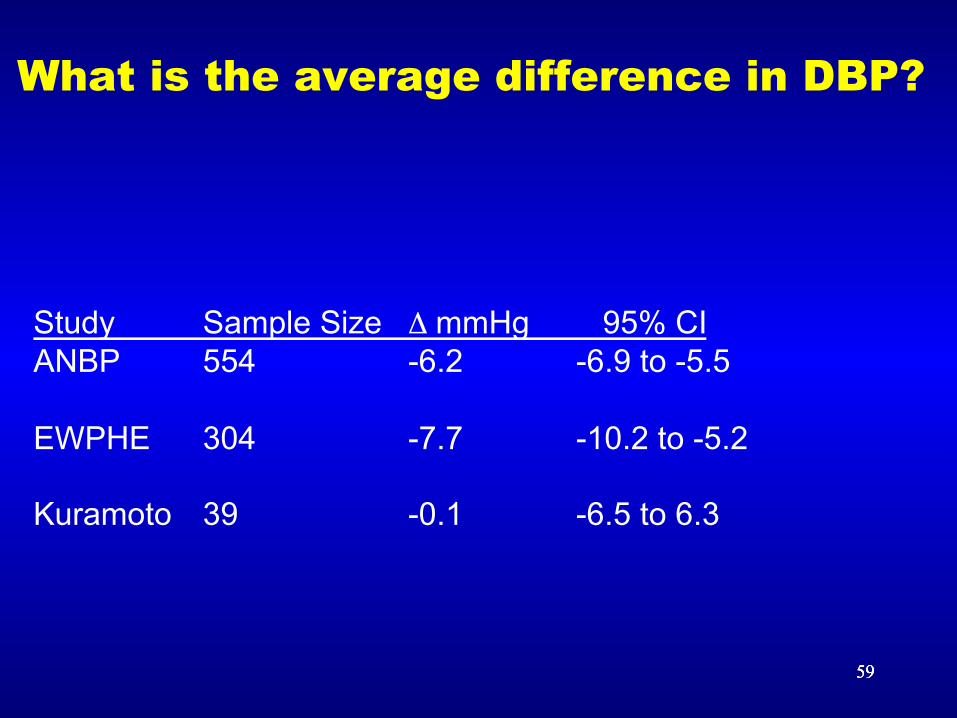
What is the average difference in DBP?
Study Sample Size Δ mmHg 95% CI ANBP 554 -6.2 -6.9 to -5.5 EWPHE 304 -7.7 -10.2 to -5.2 Kuramoto 39 -0.1 -6.5 to 6.3
60 60 60
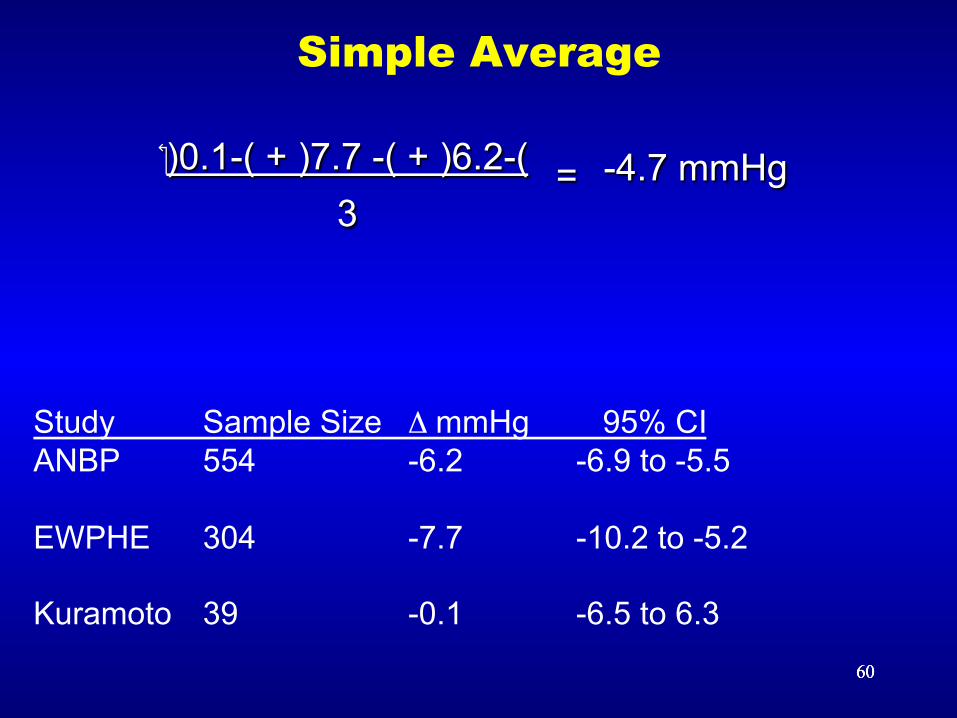
Simple Average
)-6.2( + )- 7.7( + )-0.1( 3
= -4.7 mmHg
Study Sample Size Δ mmHg 95% CI ANBP 554 -6.2 -6.9 to -5.5 EWPHE 304 -7.7 -10.2 to -5.2 Kuramoto 39 -0.1 -6.5 to 6.3
61 61 61
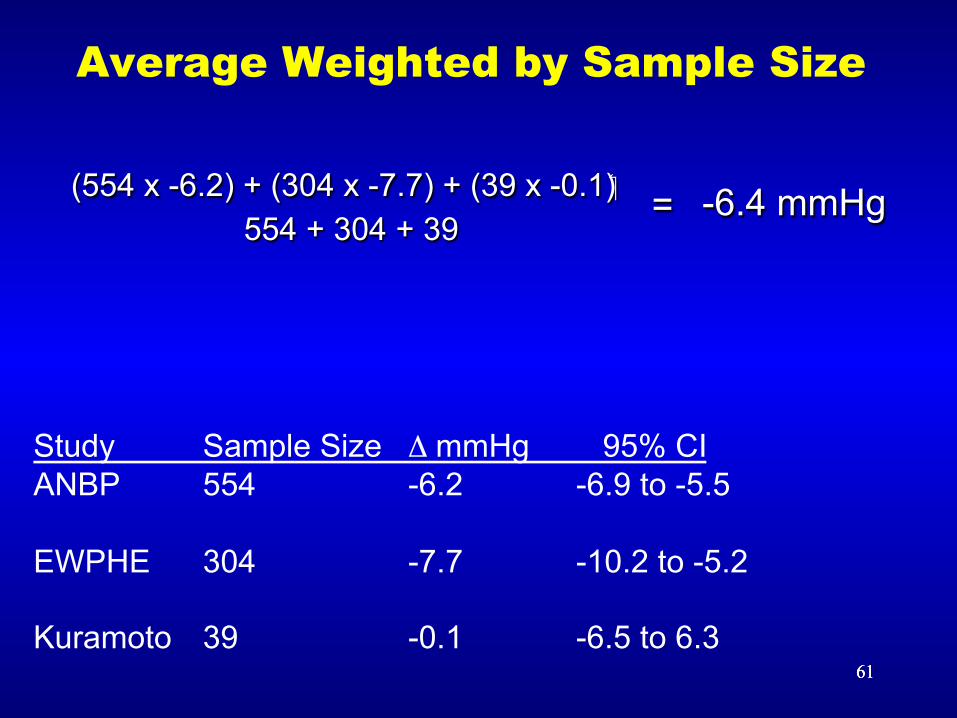
Average Weighted by Sample Size
(554 x -6.2) + (304 x -7.7) + (39 x -0.1) 554 + 304 + 39
= -6.4 mmHg
Study Sample Size Δ mmHg 95% CI ANBP 554 -6.2 -6.9 to -5.5 EWPHE 304 -7.7 -10.2 to -5.2 Kuramoto 39 -0.1 -6.5 to 6.3
62 62 62
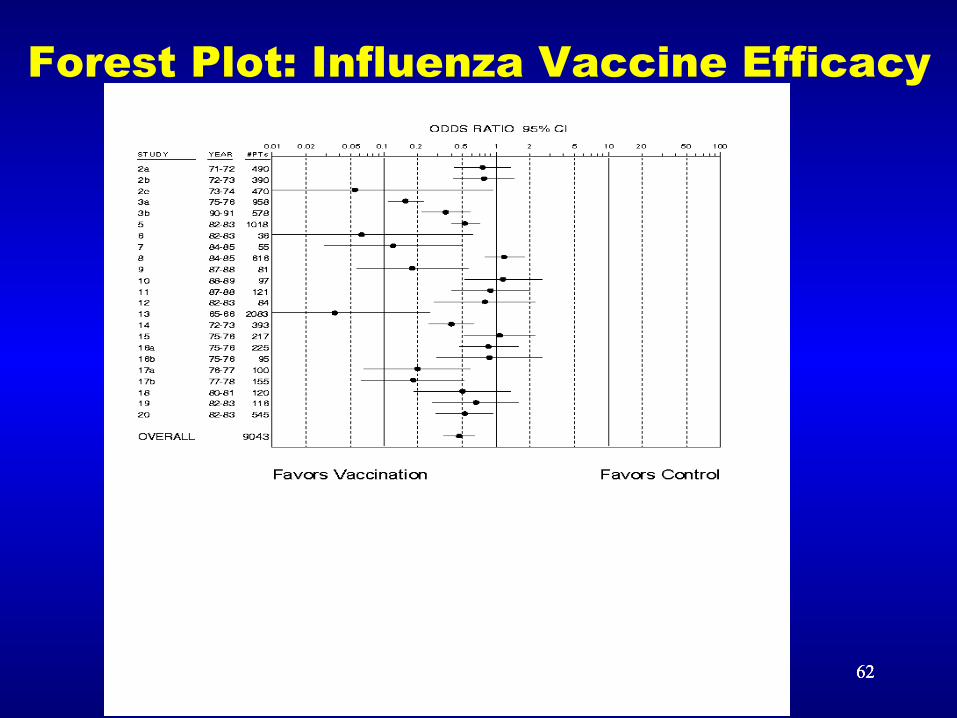
Forest Plot: Influenza Vaccine Efficacy
63 63 63
Heterogeneity (diversity)
• Is it reasonable (are studies and effects sufficiently similar) to estimate an average effect?
• Types of heterogeneity
– Conceptual (clinical) heterogeneity: Are studies of similar treatments, populations, settings, design, etc., such that an average effect would be clinically meaningful?
– Statistical heterogeneity: Is observed variability of effects
greater than that expected by chance alone?
64 TREATMENT EFFECTS (RD, OR, RR)
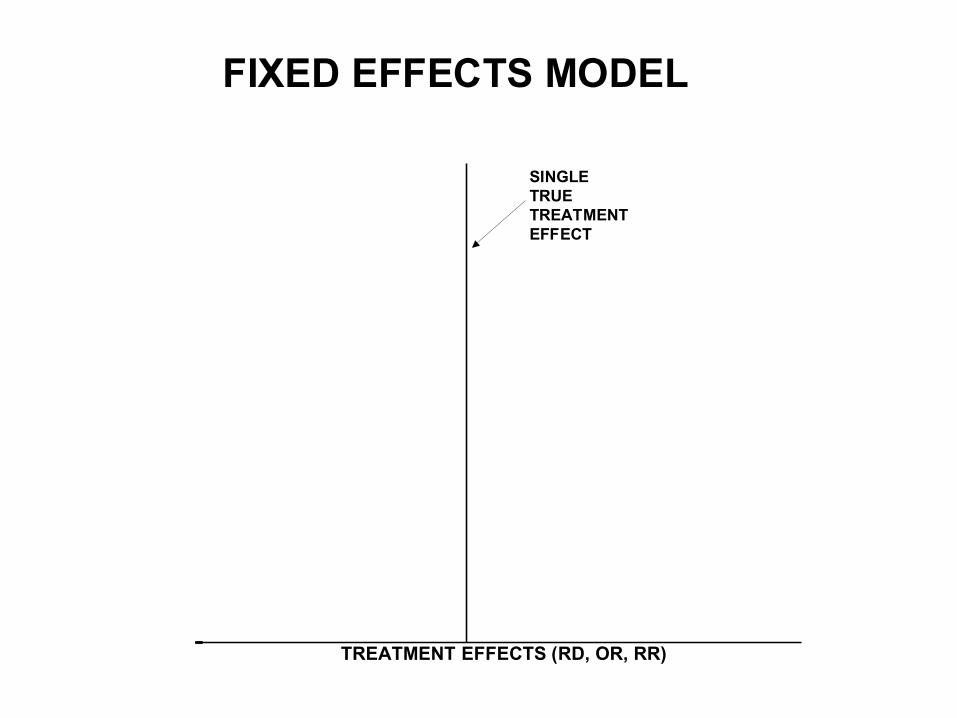
FIXED EFFECTS MODEL
SINGLETRUETREATMENTEFFECT
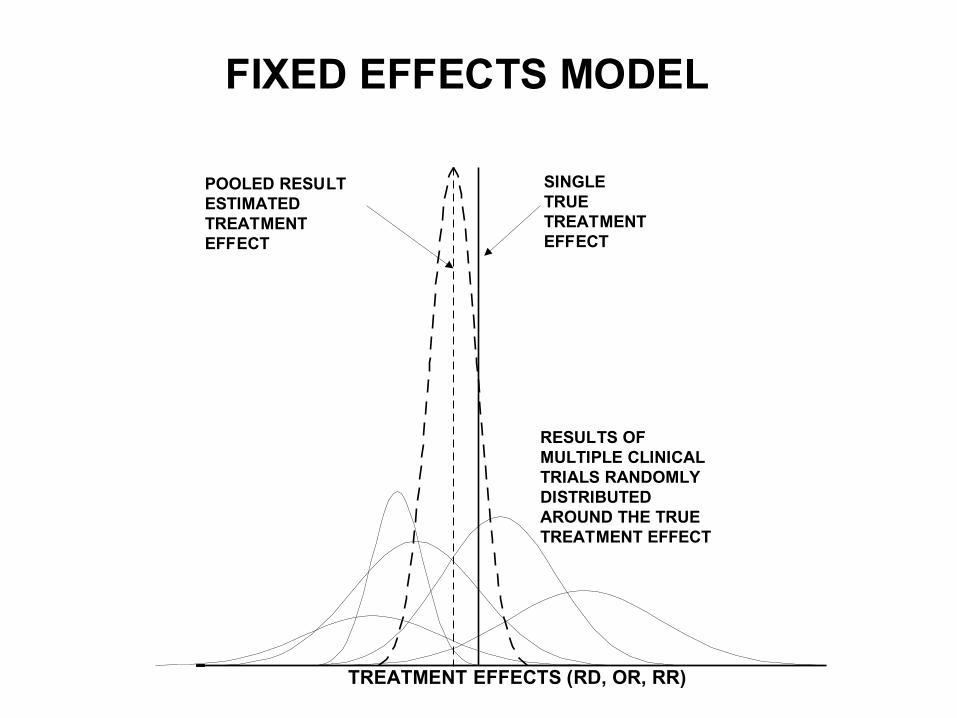
65 65 TREATMENT EFFECTS (RD, OR, RR)
FIXED EFFECTS MODEL
SINGLETRUETREATMENTEFFECT
POOLED RESULTESTIMATEDTREATMENTEFFECT
RESULTS OFMULTIPLE CLINICALTRIALS RANDOMLYDISTRIBUTEDAROUND THE TRUETREATMENT EFFECT
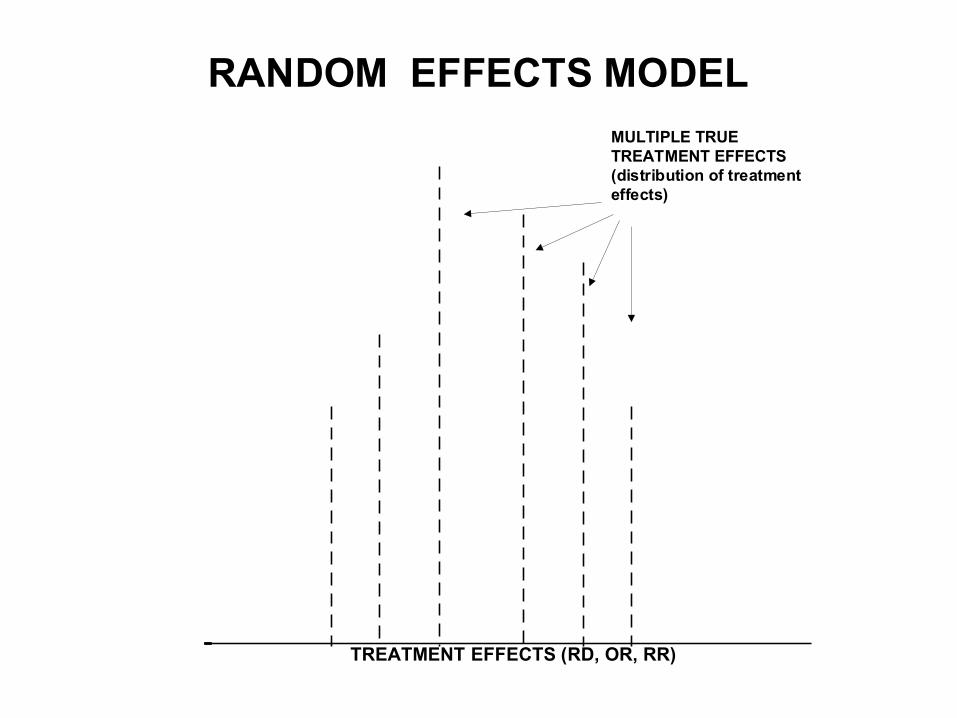
66 66 TREATMENT EFFECTS (RD, OR, RR)
RANDOM EFFECTS MODELMULTIPLE TRUETREATMENT EFFECTS(distribution of treatmenteffects)
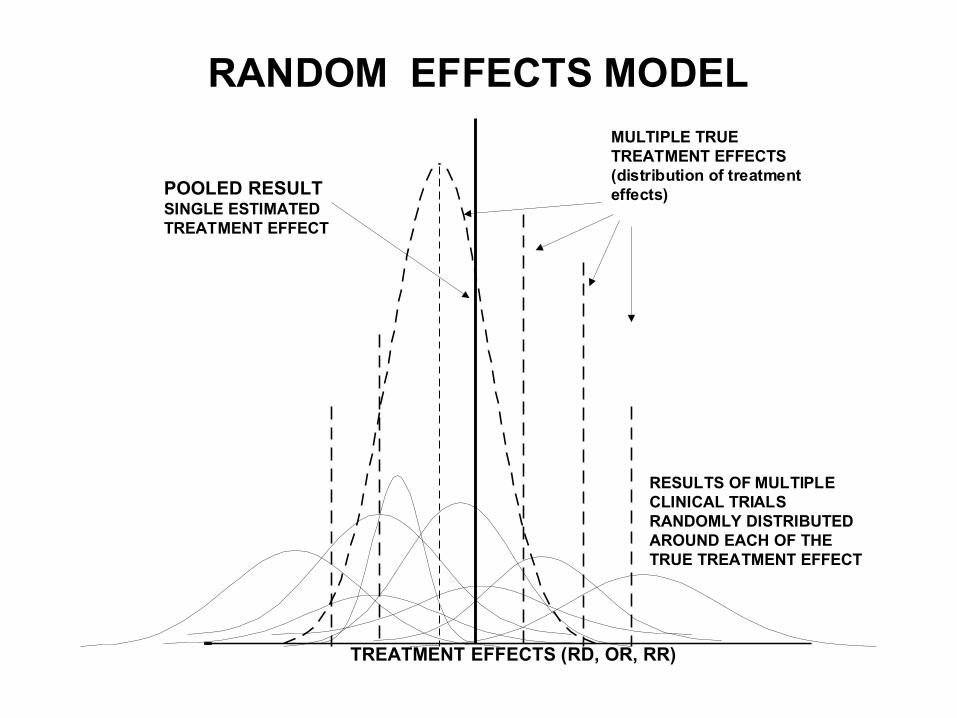
67 67 TREATMENT EFFECTS (RD, OR, RR)
RANDOM EFFECTS MODELMULTIPLE TRUETREATMENT EFFECTS(distribution of treatmenteffects)POOLED RESULT
SINGLE ESTIMATEDTREATMENT EFFECT
RESULTS OF MULTIPLECLINICAL TRIALSRANDOMLY DISTRIBUTEDAROUND EACH OF THETRUE TREATMENT EFFECT
68
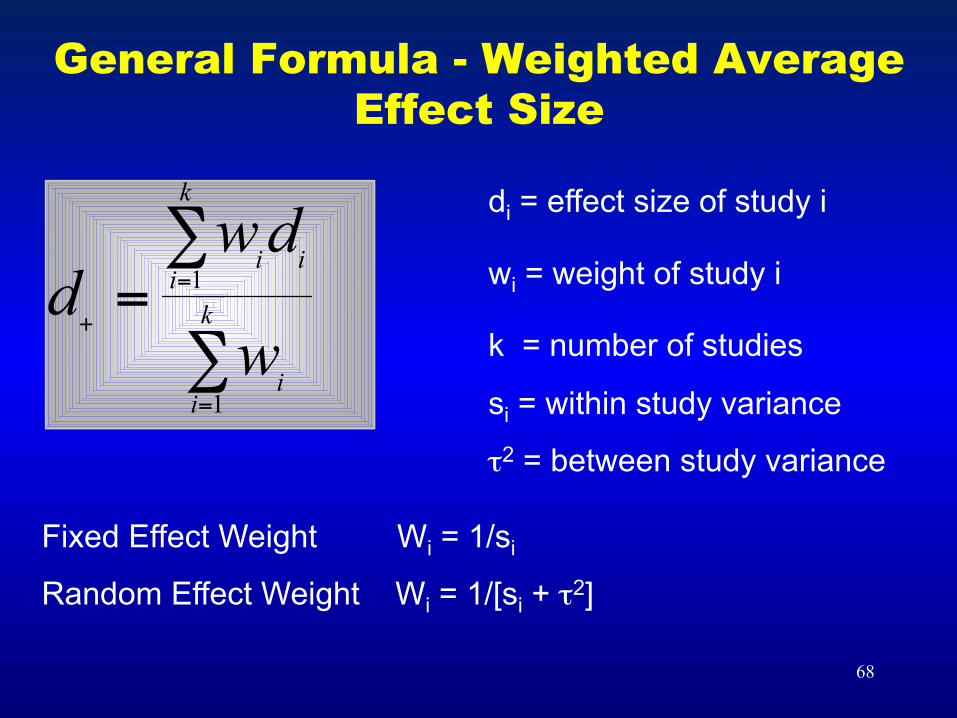
General Formula - Weighted Average Effect Size
d+=
widii=1
k
∑
wii=1
k
∑
di = effect size of study i
wi = weight of study i
k = number of studies
si = within study variance
τ2 = between study variance
Fixed Effect Weight Wi = 1/si
Random Effect Weight Wi = 1/[si + τ2]
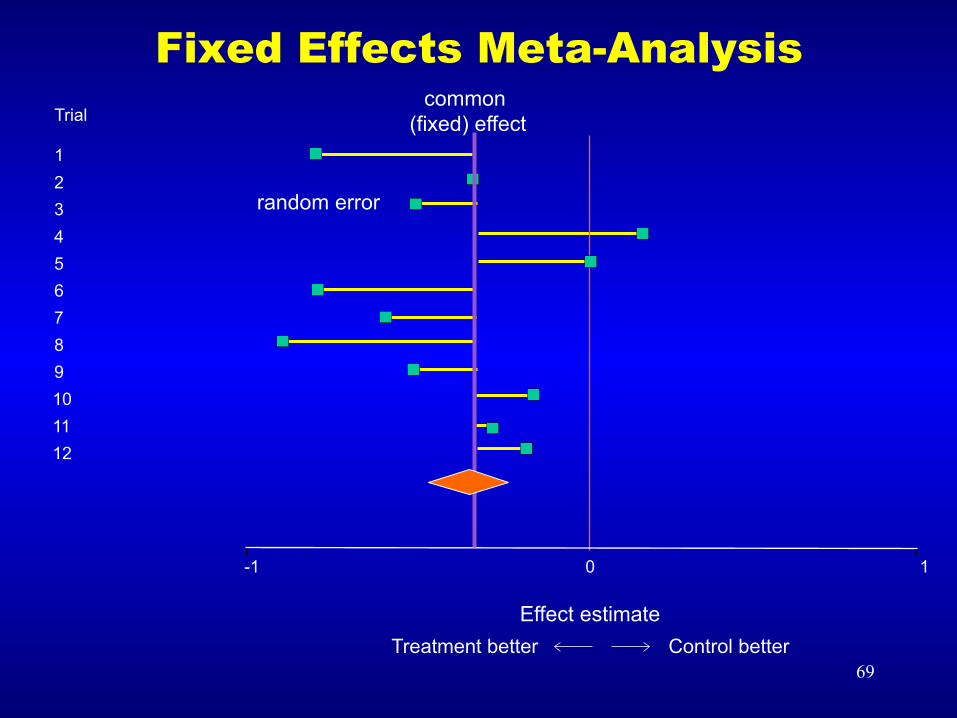
69
Fixed Effects Meta-Analysis Trial 1 2 3 4 5 6 7 8 9 10 11 12
Treatment better Control better Effect estimate
-1 0 1
random error
common (fixed) effect
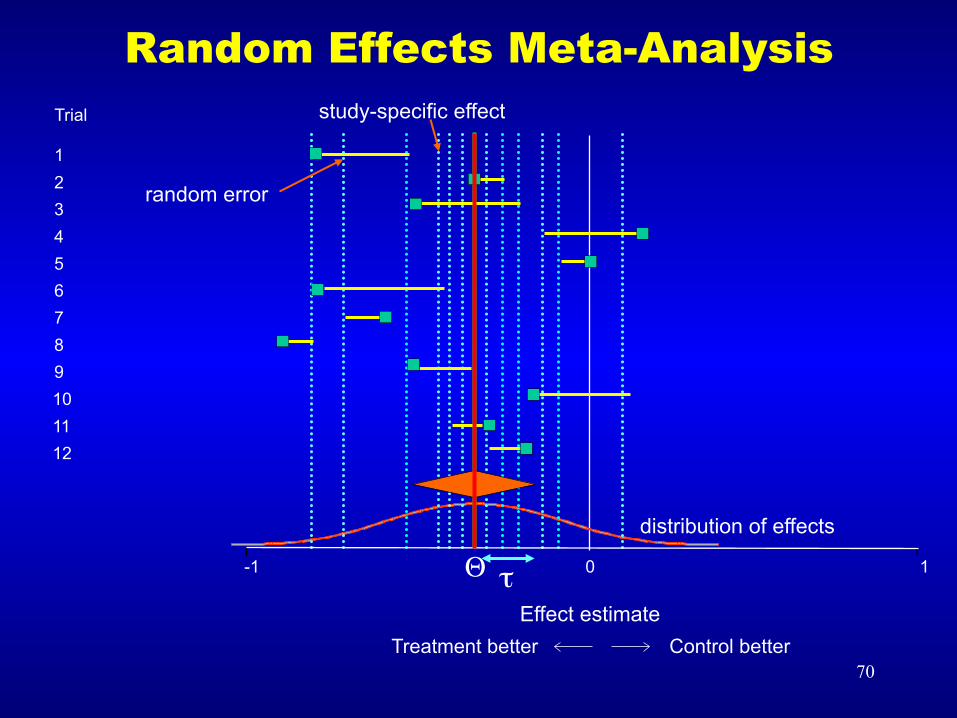
70
Random Effects Meta-Analysis study-specific effect
distribution of effects
Trial 1 2 3 4 5 6 7 8 9 10 11 12
Treatment better Control better Effect estimate
-1 0 1
random error
τ Θ
71
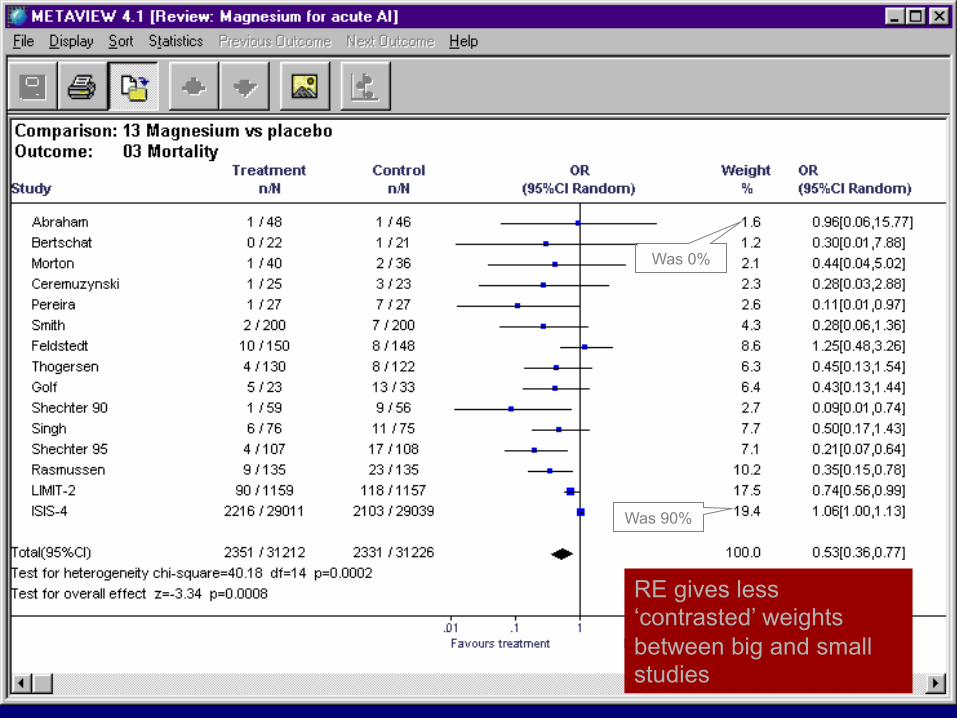
72
RE gives less ‘contrasted’ weights between big and small studies
Was 90%
Was 0%
73
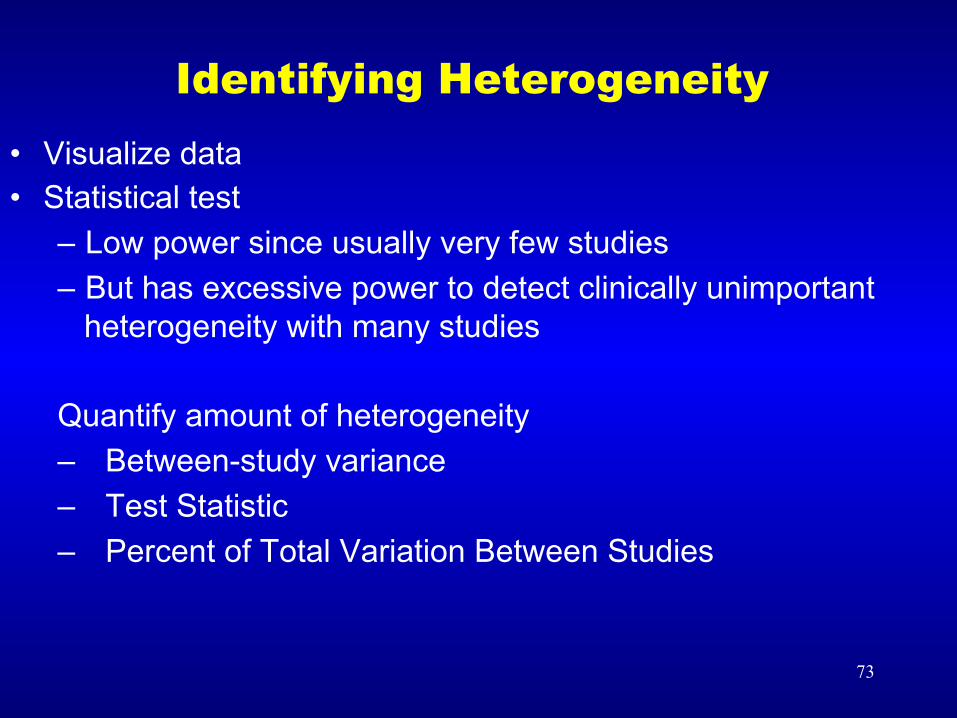
Identifying Heterogeneity • Visualize data • Statistical test
– Low power since usually very few studies – But has excessive power to detect clinically unimportant
heterogeneity with many studies Quantify amount of heterogeneity – Between-study variance – Test Statistic – Percent of Total Variation Between Studies
74 74
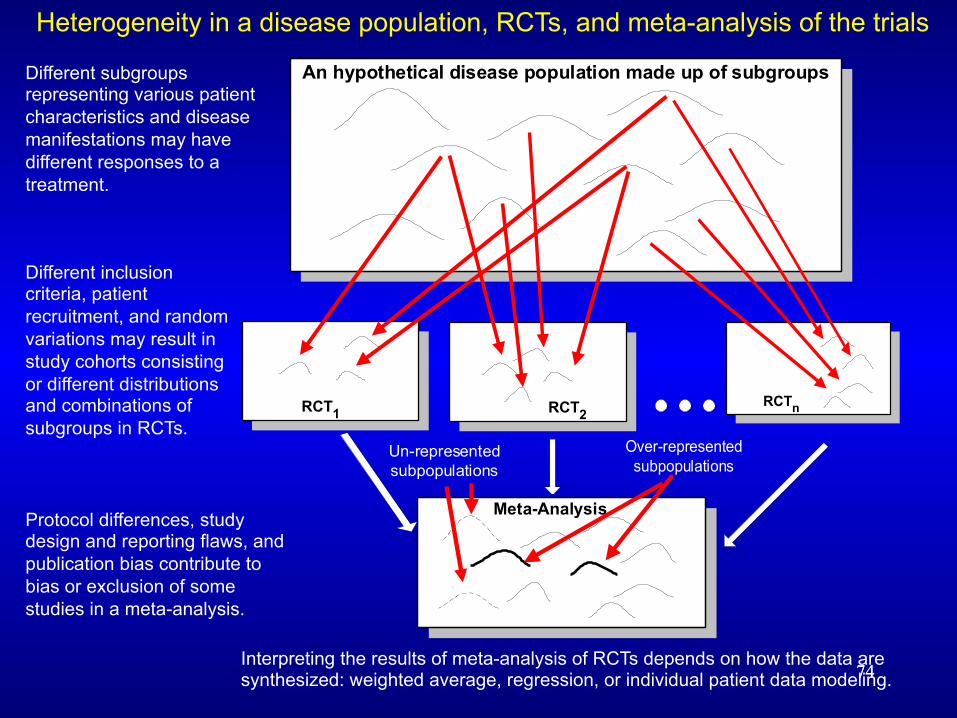
An hypothetical disease population made up of subgroups
RCT1 RCT2RCTn
Meta-Analysis
Un-representedsubpopulations
Over-representedsubpopulations
Different subgroups representing various patient characteristics and disease manifestations may have different responses to a treatment.
Different inclusion criteria, patient recruitment, and random variations may result in study cohorts consisting or different distributions and combinations of subgroups in RCTs.
Protocol differences, study design and reporting flaws, and publication bias contribute to bias or exclusion of some studies in a meta-analysis.
Interpreting the results of meta-analysis of RCTs depends on how the data are synthesized: weighted average, regression, or individual patient data modeling.
Heterogeneity in a disease population, RCTs, and meta-analysis of the trials
75 75
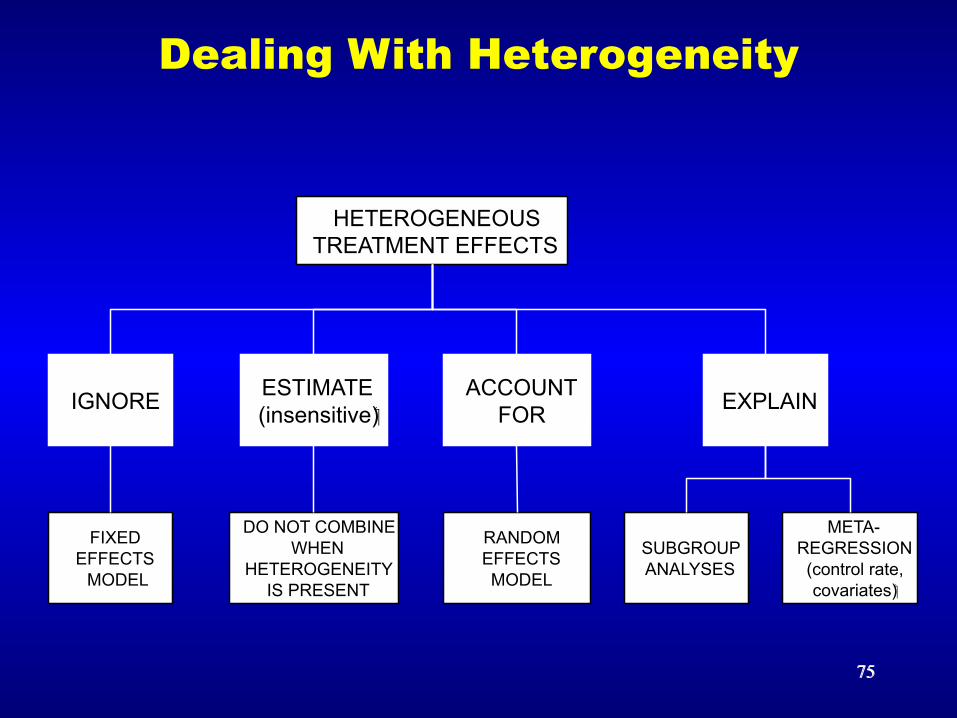
HETEROGENEOUS TREATMENT EFFECTS
IGNORE ACCOUNT FOR
ESTIMATE (insensitive) EXPLAIN
FIXED EFFECTS MODEL
DO NOT COMBINE WHEN
HETEROGENEITY IS PRESENT
RANDOM EFFECTS MODEL
SUBGROUP ANALYSES
META- REGRESSION (control rate, covariates)
Dealing With Heterogeneity
76 76 Trea
tmen
t effe
ct
Trea
tmen
t effe
ct
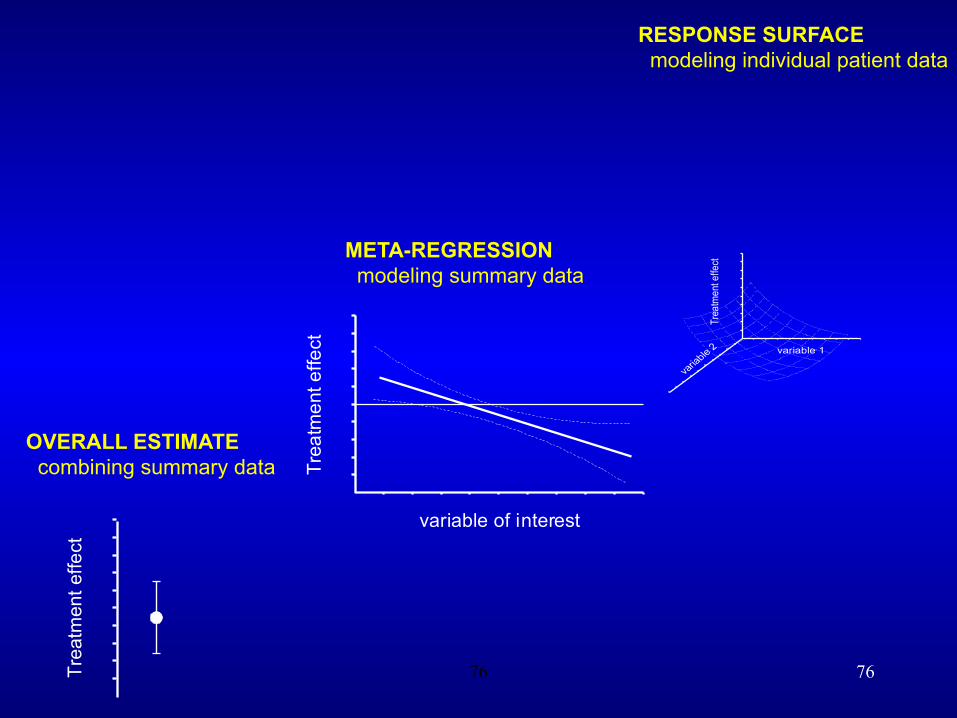
variable of interest
META-REGRESSION modeling summary data
OVERALL ESTIMATE combining summary data
RESPONSE SURFACE modeling individual patient data
varia
ble 2
Trea
tmen
t effe
ct
variable 1
77 77
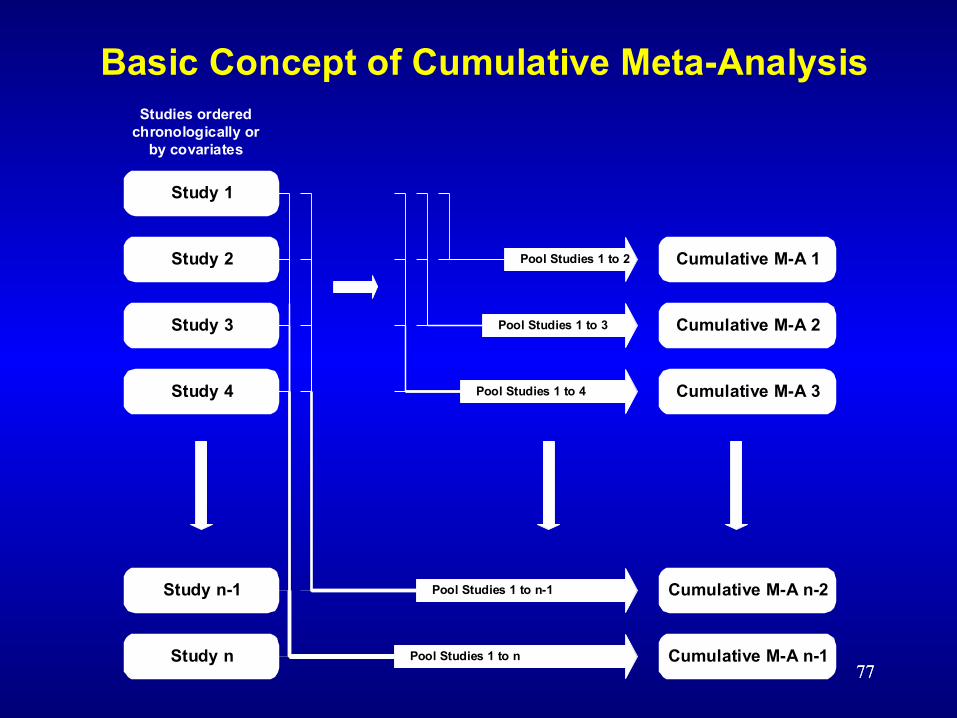
Study 1
Study 2
Study 3
Study 4
Cumulative M-A 1
Cumulative M-A 2
Cumulative M-A 3
Pool Studies 1 to 2
Basic Concept of Cumulative Meta-AnalysisStudies ordered
chronologically orby covariates
Pool Studies 1 to 4
Pool Studies 1 to 3
Study n-1 Cumulative M-A n-2
Study n Cumulative M-A n-1 Pool Studies 1 to n
Pool Studies 1 to n-1
78 78
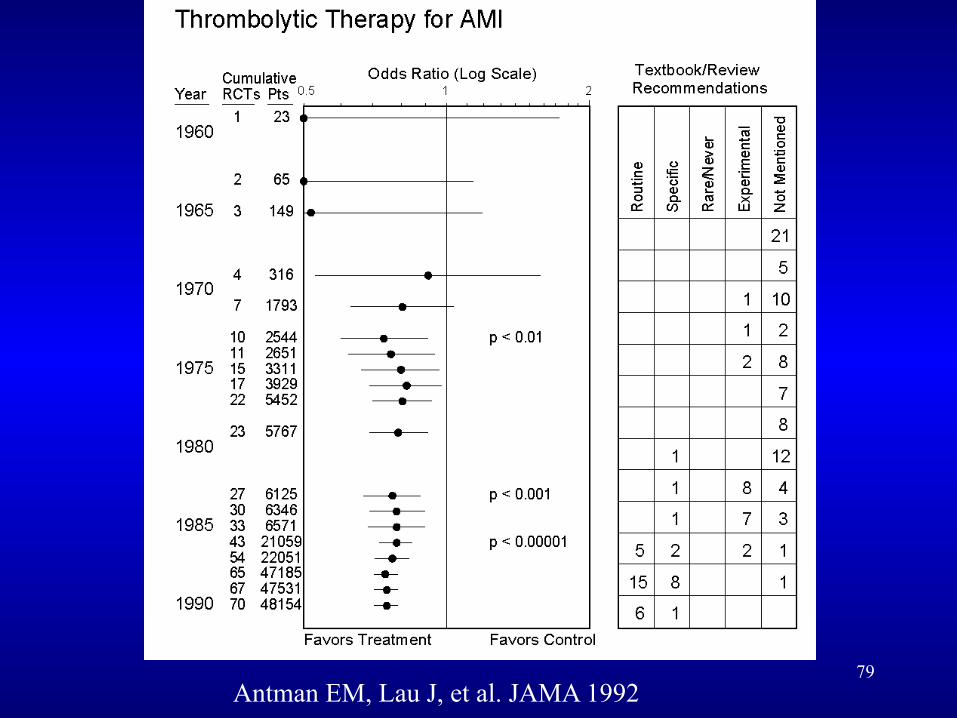
79 Antman EM, Lau J, et al. JAMA 1992
80
Findings of Cumulative Meta-analysis
• Clinical experts’ recommendations often are unreliably synchronized with developing RCT evidence.
• Large clinical trials often echo findings from meta-analyses of
several smaller studies.
• Trends established by cumulative meta-analyses of previous studies are unlikely to be reversed
• Cumulative meta-analysis is an example of Bayesian updating
81
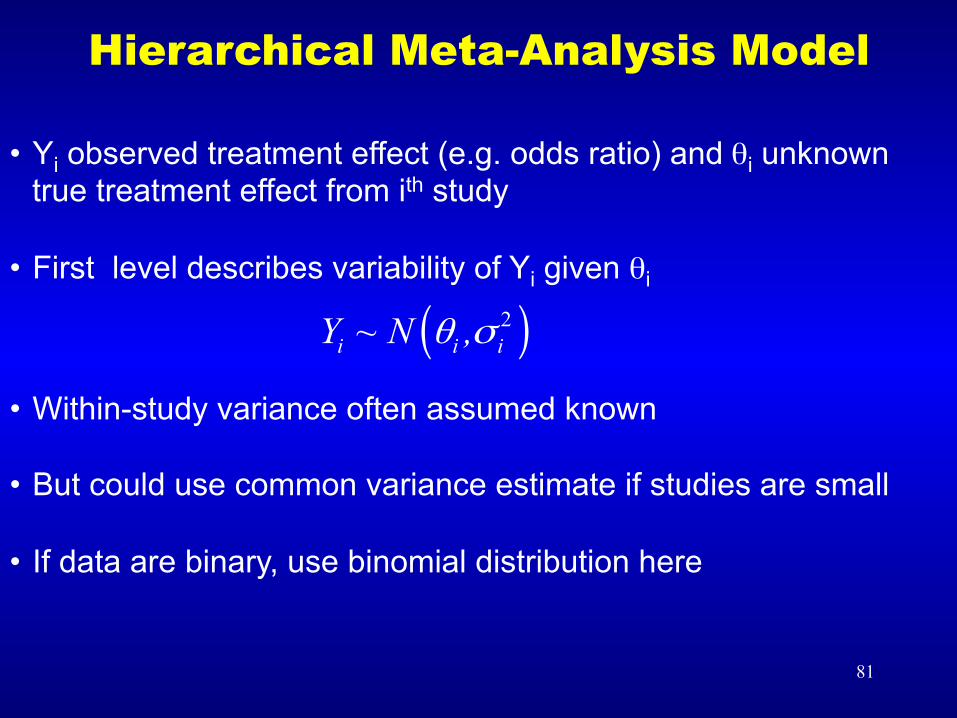
• Yi observed treatment effect (e.g. odds ratio) and θi unknown true treatment effect from ith study
• First level describes variability of Yi given θi • Within-study variance often assumed known • But could use common variance estimate if studies are small • If data are binary, use binomial distribution here
( )2i i iY ~ N ,θ σ
Hierarchical Meta-Analysis Model
82
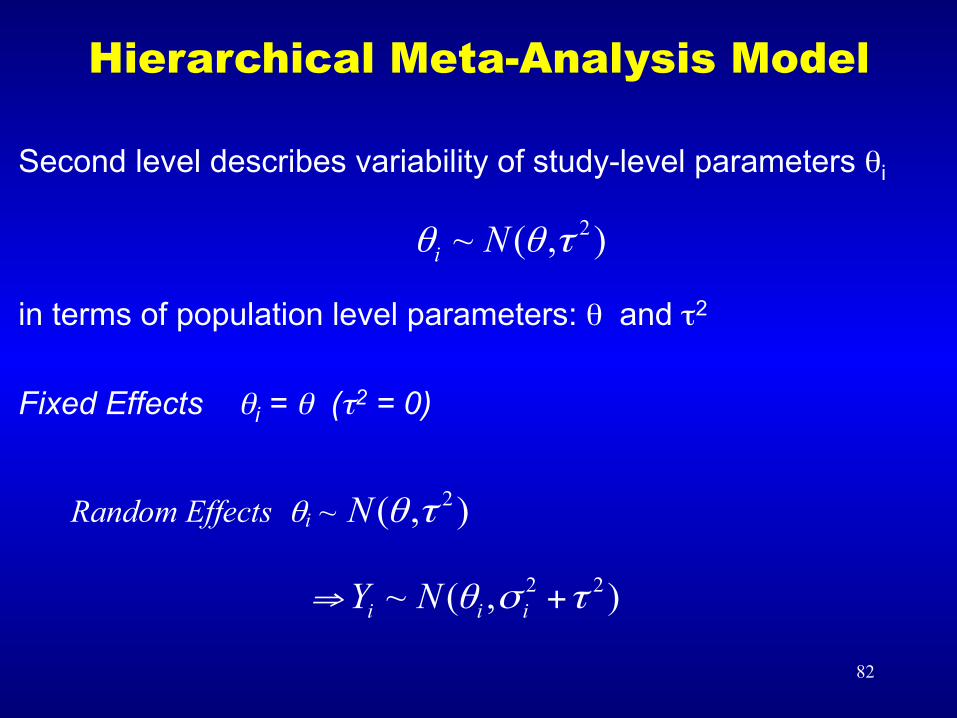
Second level describes variability of study-level parameters θi
in terms of population level parameters: θ and τ2
Fixed Effects θi = θ (τ2 = 0)
Random Effects θi ~ 2( , )N θ τ
⇒ 2 2~ ( , )i i iY N θ σ τ+
Hierarchical Meta-Analysis Model
2~ ( , )θ θ τi N
83
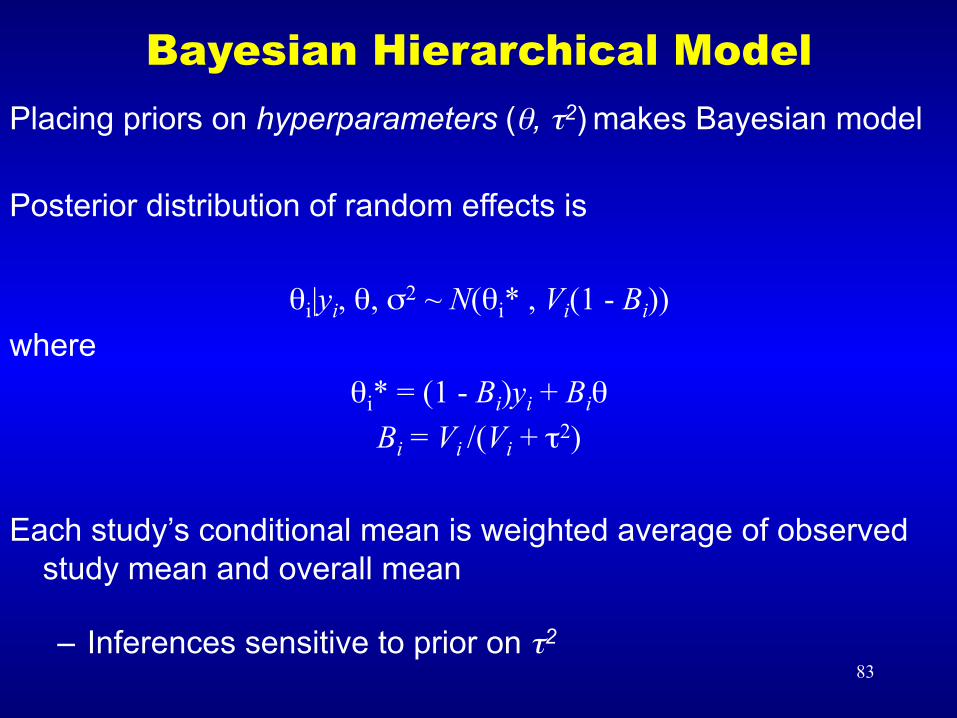
Placing priors on hyperparameters (θ, τ2) makes Bayesian model Posterior distribution of random effects is
θi|yi, θ, σ2 ~ N(θi* , Vi(1 - Bi)) where
θi* = (1 - Bi)yi + Biθ
Bi = Vi /(Vi + τ2) Each study’s conditional mean is weighted average of observed
study mean and overall mean
– Inferences sensitive to prior on τ2
Bayesian Hierarchical Model

84
Shrinkage
Bi = Vi /(Vi + τ2) are shrinkage factors • Larger Bi shrink θi* more back to the grand mean θ • Well-estimated studies (small within-study variances) weighted
most • Bigger within-study variances lead to more shrinkage • Smaller within-study variances lead to less shrinkage • Increased between-study variance weights studies more evenly
85
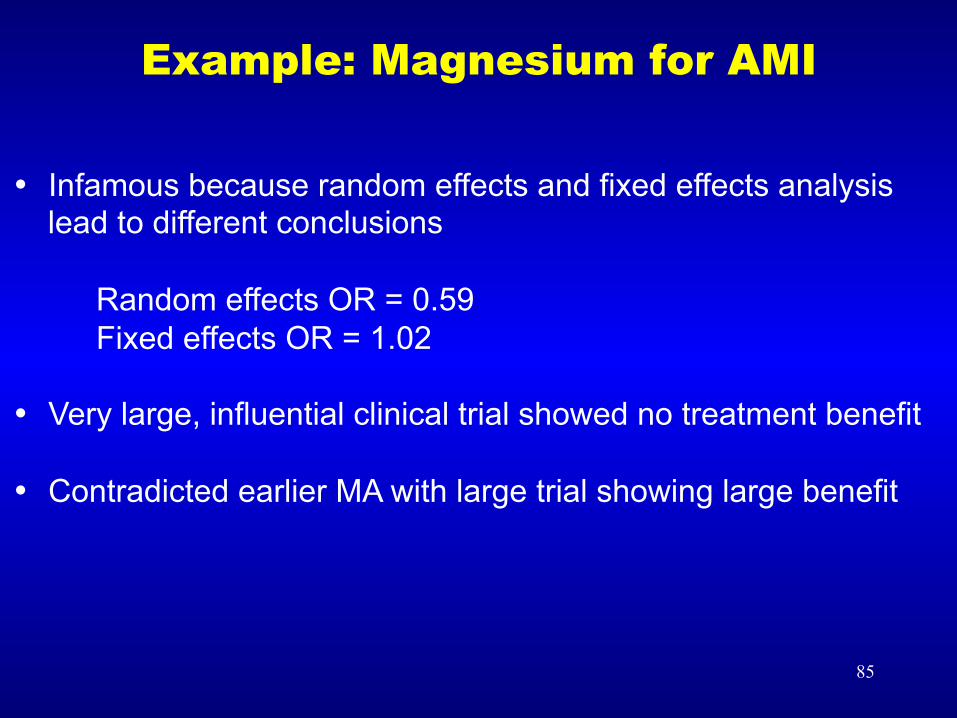
• Infamous because random effects and fixed effects analysis lead to different conclusions
Random effects OR = 0.59 Fixed effects OR = 1.02
• Very large, influential clinical trial showed no treatment benefit • Contradicted earlier MA with large trial showing large benefit
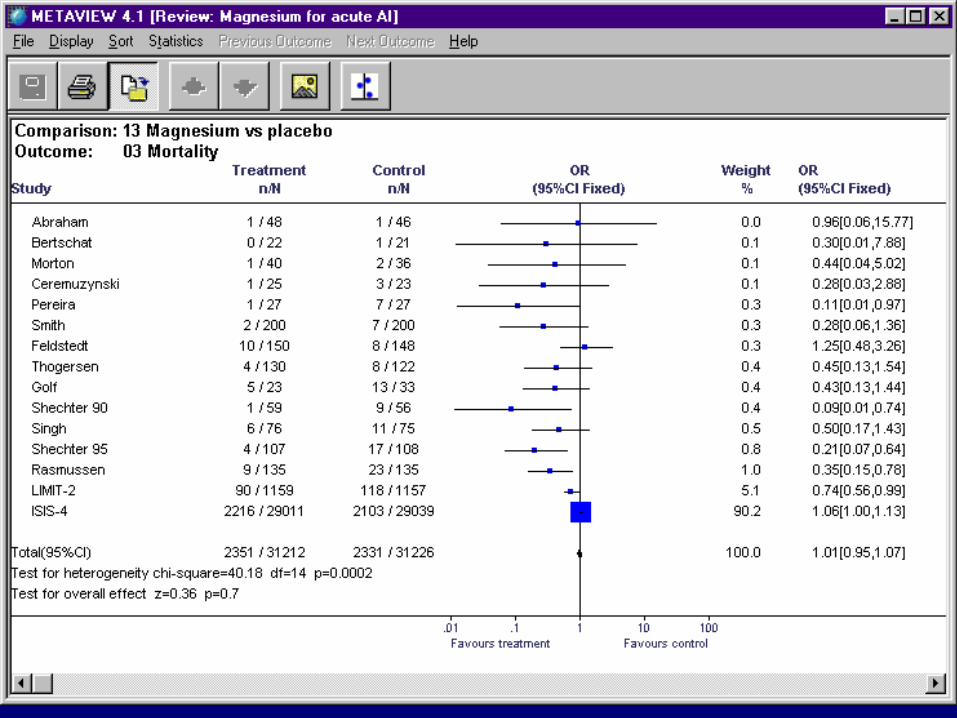
Example: Magnesium for AMI
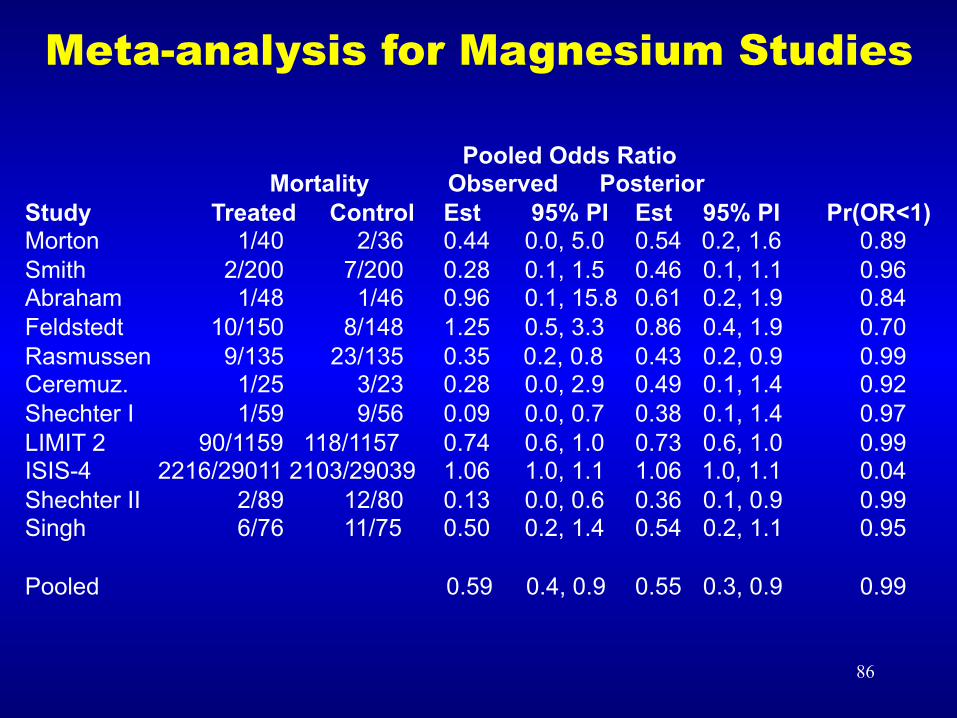
86
Meta-analysis for Magnesium Studies
Pooled Odds Ratio Mortality Observed Posterior
Study Treated Control Est 95% PI Est 95% PI Pr(OR<1) Morton 1/40 2/36 0.44 0.0, 5.0 0.54 0.2, 1.6 0.89 Smith 2/200 7/200 0.28 0.1, 1.5 0.46 0.1, 1.1 0.96 Abraham 1/48 1/46 0.96 0.1, 15.8 0.61 0.2, 1.9 0.84 Feldstedt 10/150 8/148 1.25 0.5, 3.3 0.86 0.4, 1.9 0.70 Rasmussen 9/135 23/135 0.35 0.2, 0.8 0.43 0.2, 0.9 0.99 Ceremuz. 1/25 3/23 0.28 0.0, 2.9 0.49 0.1, 1.4 0.92 Shechter I 1/59 9/56 0.09 0.0, 0.7 0.38 0.1, 1.4 0.97 LIMIT 2 90/1159 118/1157 0.74 0.6, 1.0 0.73 0.6, 1.0 0.99 ISIS-4 2216/29011 2103/29039 1.06 1.0, 1.1 1.06 1.0, 1.1 0.04 Shechter II 2/89 12/80 0.13 0.0, 0.6 0.36 0.1, 0.9 0.99 Singh 6/76 11/75 0.50 0.2, 1.4 0.54 0.2, 1.1 0.95 Pooled 0.59 0.4, 0.9 0.55 0.3, 0.9 0.99
87
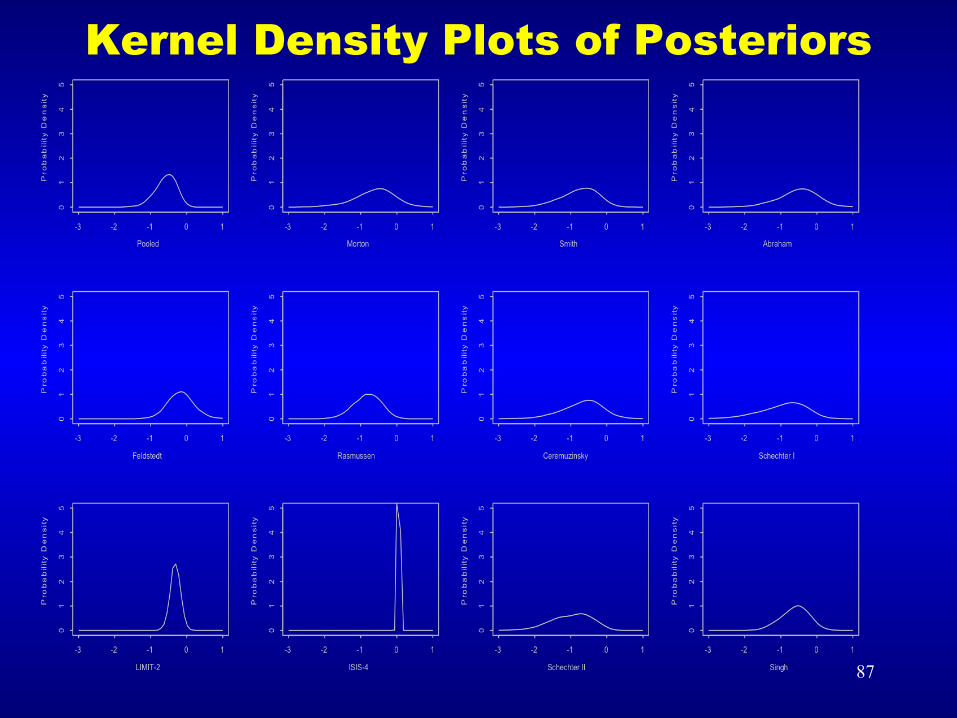
Kernel Density Plots of Posteriors
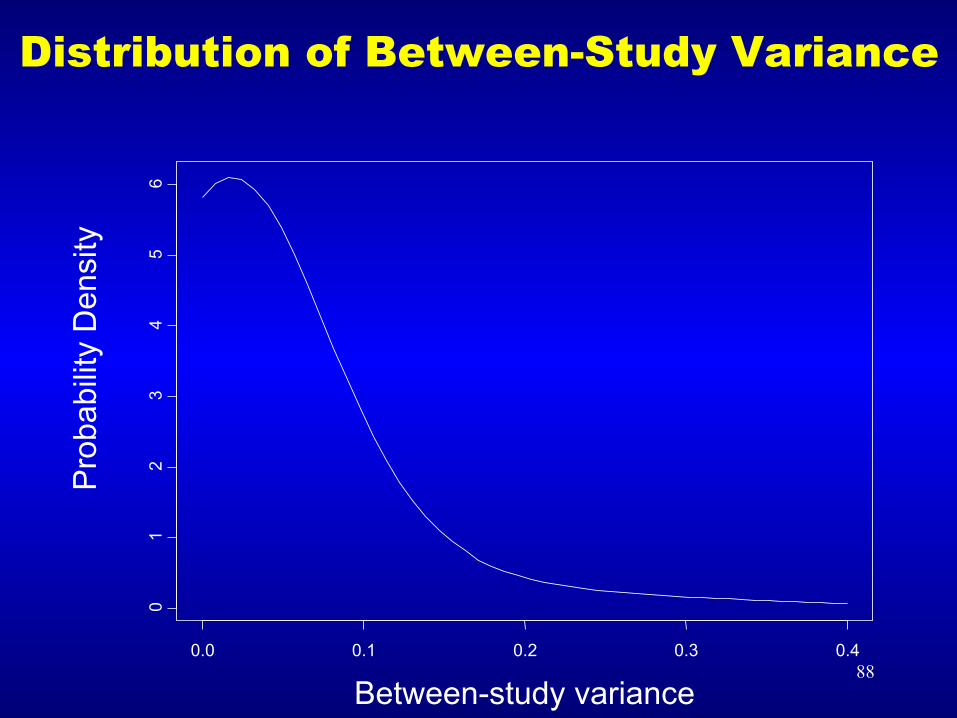
88 Between-study variance
Pro
babi
lity
Den
sity
0.0 0.1 0.2 0.3 0.4
0 1
2 3
4 5
6
Distribution of Between-Study Variance
89
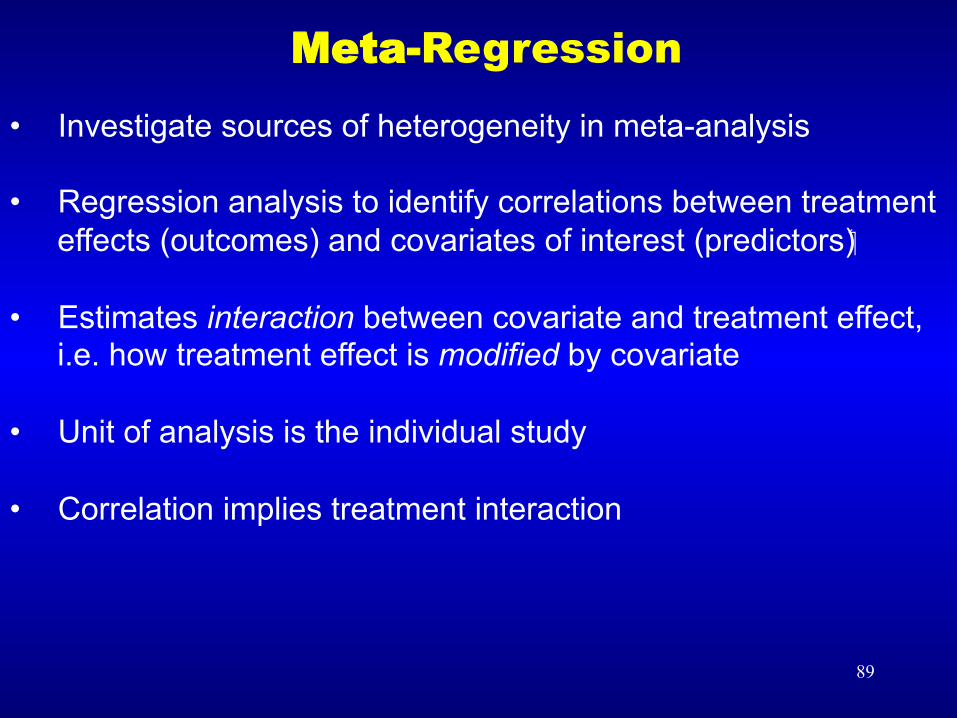
• Investigate sources of heterogeneity in meta-analysis
• Regression analysis to identify correlations between treatment effects (outcomes) and covariates of interest (predictors)
• Estimates interaction between covariate and treatment effect, i.e. how treatment effect is modified by covariate
• Unit of analysis is the individual study • Correlation implies treatment interaction
Meta-Regression
90 90
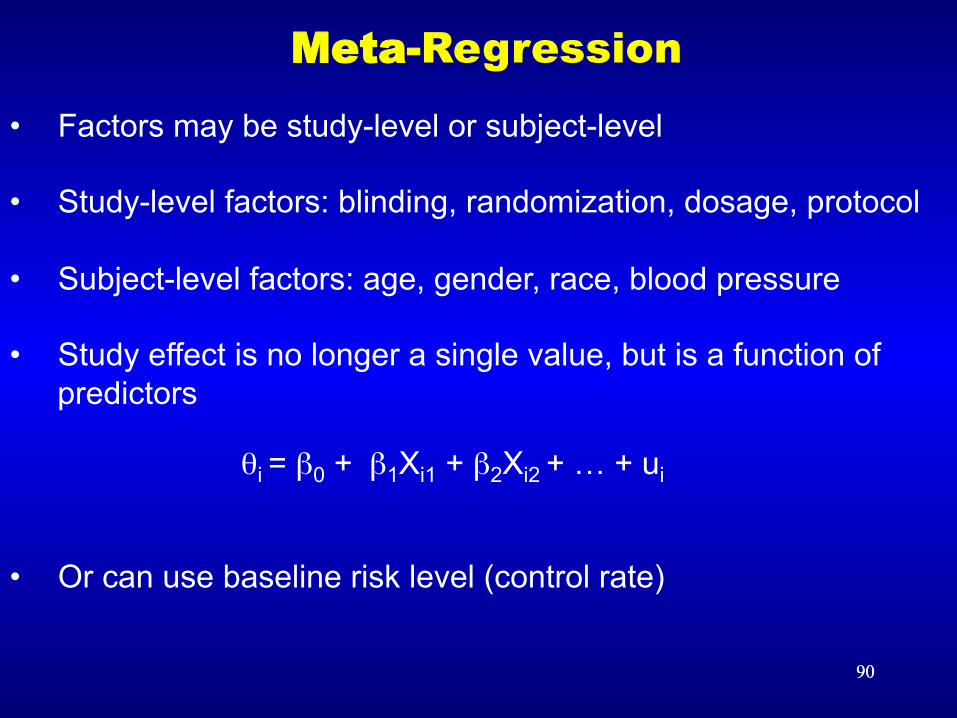
• Factors may be study-level or subject-level • Study-level factors: blinding, randomization, dosage, protocol • Subject-level factors: age, gender, race, blood pressure
• Study effect is no longer a single value, but is a function of predictors
θi = β0 + β1Xi1 + β2Xi2 + … + ui
• Or can use baseline risk level (control rate)
Meta-Regression
91 91
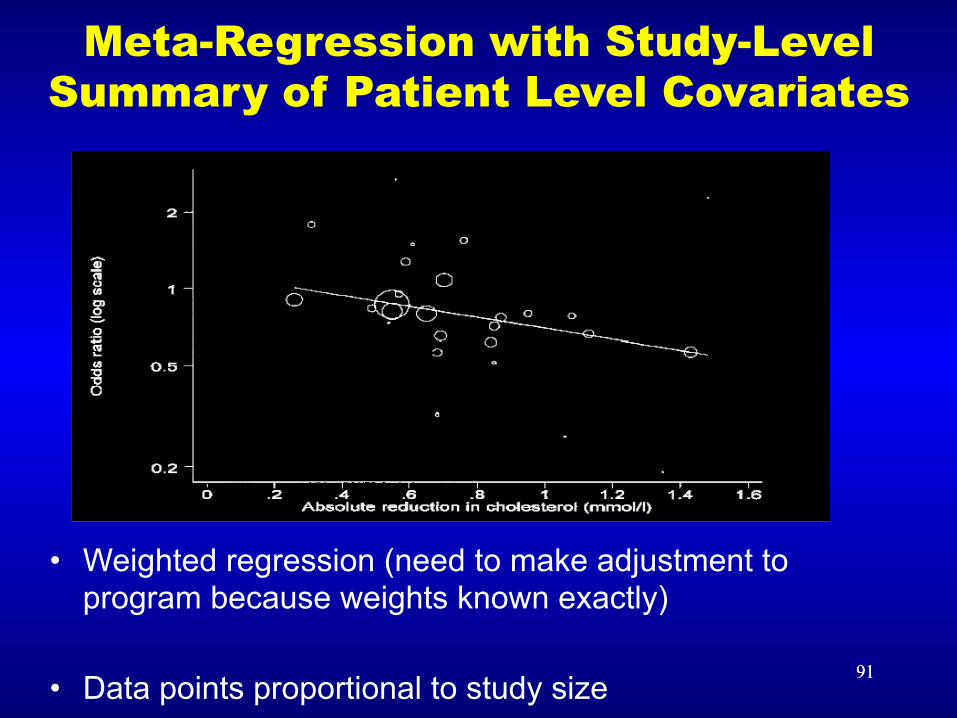
Meta-Regression with Study-Level Summary of Patient Level Covariates
• Weighted regression (need to make adjustment to program because weights known exactly)
• Data points proportional to study size
92 92 92
Problems with Meta-Regression
• Number of studies usually small
• Number of potential predictors may be large • Data may be unavailable (not conceived or not reported) • Covariates pre-selected (biased?) • Little variation in range of mean predictor • Subject-level factors can be affected by ecological bias • Causality uncertain
93 93
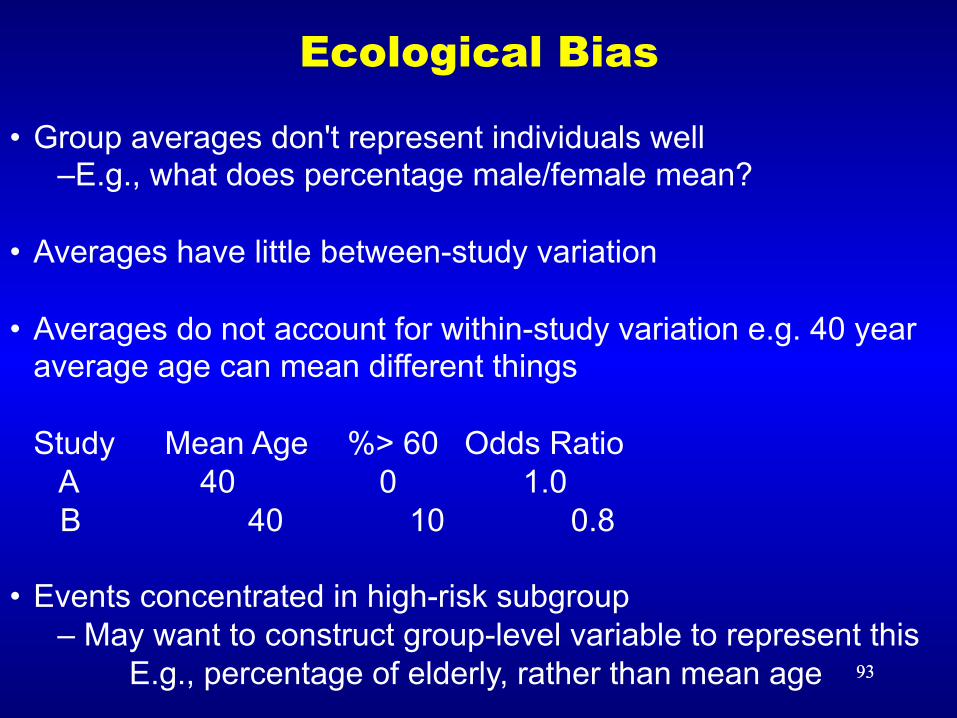
• Group averages don't represent individuals well – E.g., what does percentage male/female mean?
• Averages have little between-study variation
• Averages do not account for within-study variation e.g. 40 year average age can mean different things
Study Mean Age %> 60 Odds Ratio A 40 0 1.0 B 40 10 0.8
• Events concentrated in high-risk subgroup
– May want to construct group-level variable to represent this E.g., percentage of elderly, rather than mean age
Ecological Bias
94 94
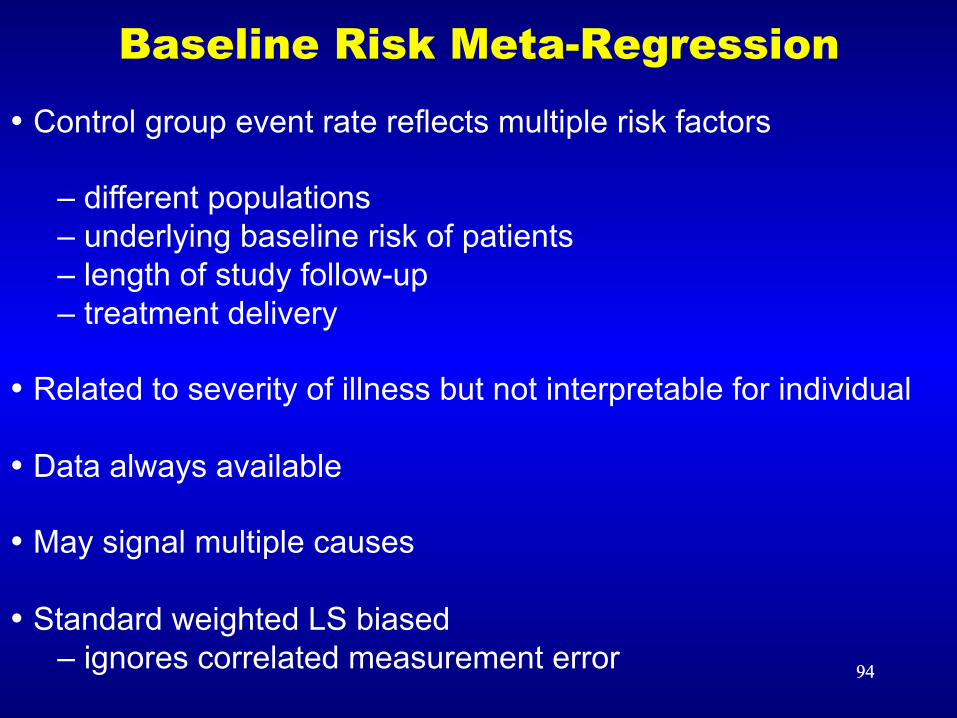
Baseline Risk Meta-Regression • Control group event rate reflects multiple risk factors
– different populations – underlying baseline risk of patients – length of study follow-up – treatment delivery
• Related to severity of illness but not interpretable for individual • Data always available • May signal multiple causes
• Standard weighted LS biased – ignores correlated measurement error
95 95
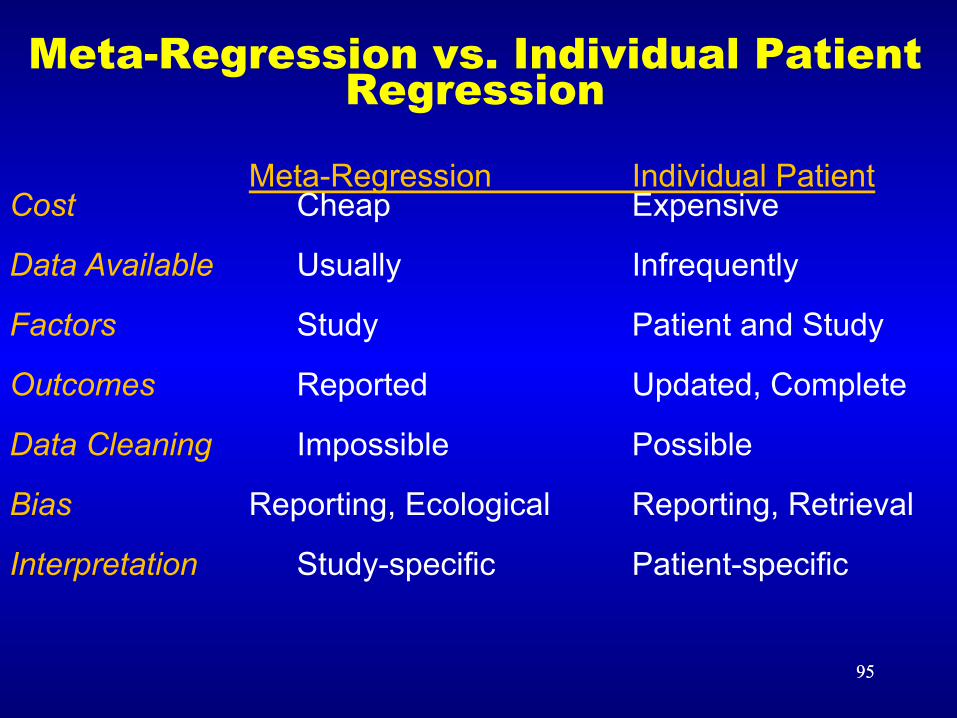
Meta-Regression vs. Individual Patient Regression
Meta-Regression Individual Patient
Cost Cheap Expensive Data Available Usually Infrequently Factors Study Patient and Study Outcomes Reported Updated, Complete Data Cleaning Impossible Possible Bias Reporting, Ecological Reporting, Retrieval Interpretation Study-specific Patient-specific
96 96
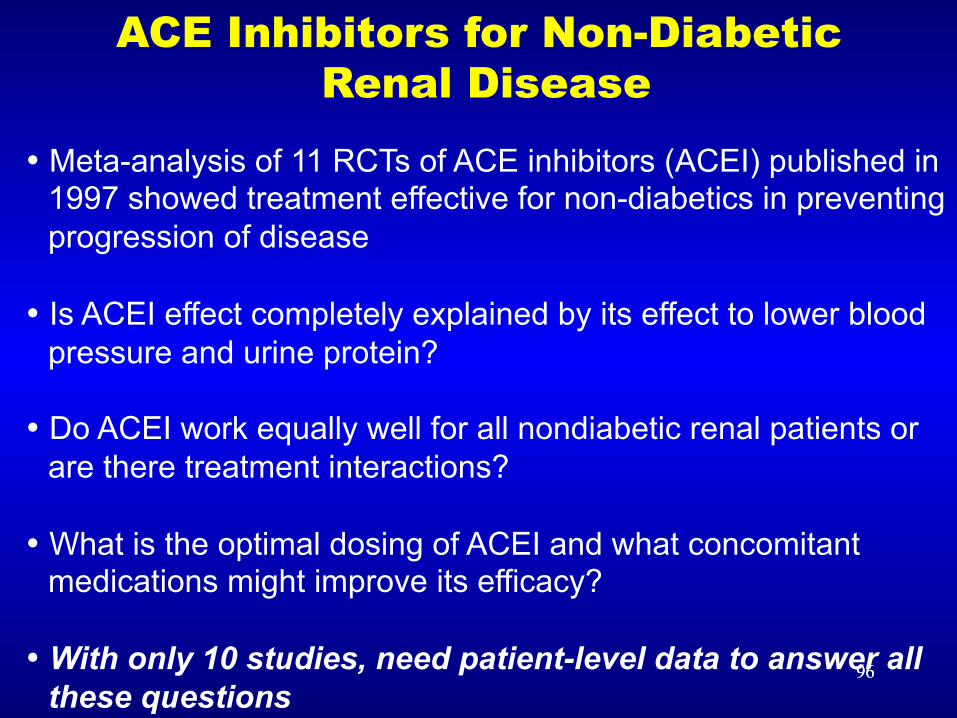
ACE Inhibitors for Non-Diabetic Renal Disease
• Meta-analysis of 11 RCTs of ACE inhibitors (ACEI) published in 1997 showed treatment effective for non-diabetics in preventing progression of disease
• Is ACEI effect completely explained by its effect to lower blood pressure and urine protein?
• Do ACEI work equally well for all nondiabetic renal patients or are there treatment interactions?
• What is the optimal dosing of ACEI and what concomitant medications might improve its efficacy?
• With only 10 studies, need patient-level data to answer all these questions
97 97
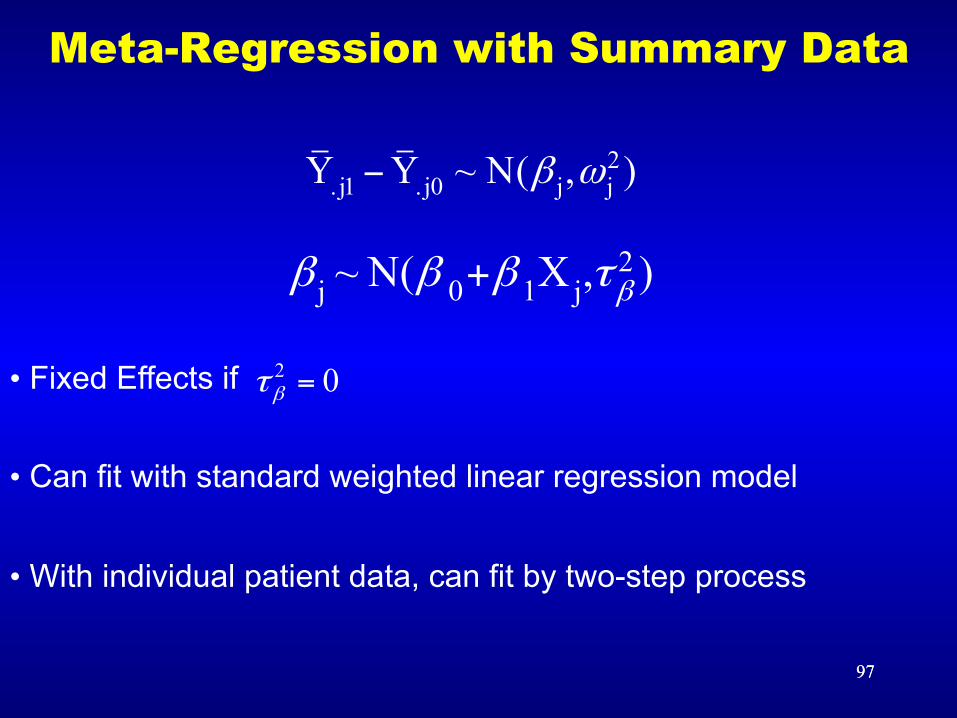
Meta-Regression with Summary Data
2.j1 . j0 j jY Y ~ N( , )β ω−
2
0 1j j~ N( X , )ββ β β τ+
• Fixed Effects if
• Can fit with standard weighted linear regression model
• With individual patient data, can fit by two-step process
2 0βτ =
98 98
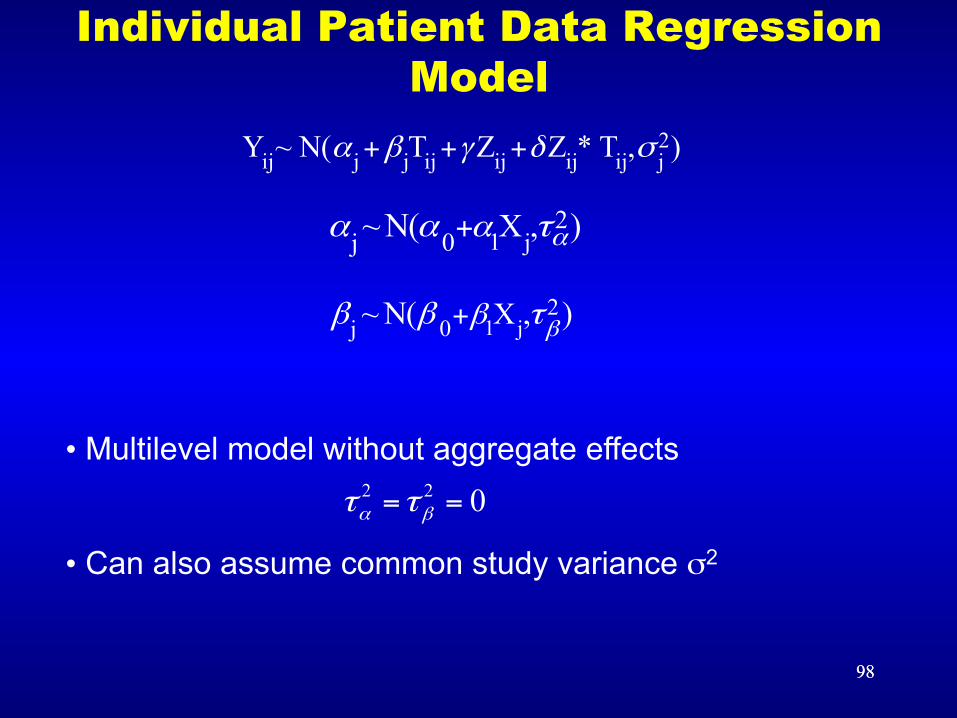
Individual Patient Data Regression Model
• Multilevel model without aggregate effects
• Can also assume common study variance σ2
2 2 0α βτ τ= =
1 j2
0j X~N( , )ααα α τ+
1 j2
0j X~N( , )βββ β τ+
2ij j j ij ij ij ij jY ~ N( T Z Z * T , )α β γ δ σ+ + +
99 99
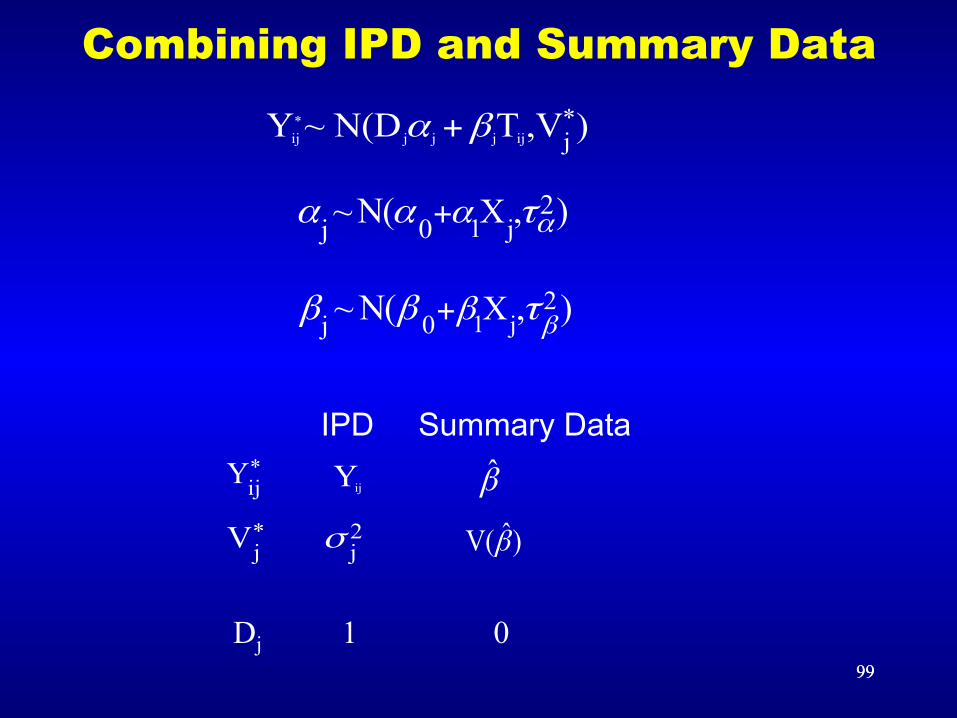
Combining IPD and Summary Data
1 j2
0j X~N( , )ααα α τ+
*ij j j j ij
*jY ~ N(D T ,V )α β+
*ijY
*jV
β̂
ˆV( )β
1 j2
0j X~N( , )βββ β τ+
IPD Summary Data
ijY
2jσ
Dj 1 0
100
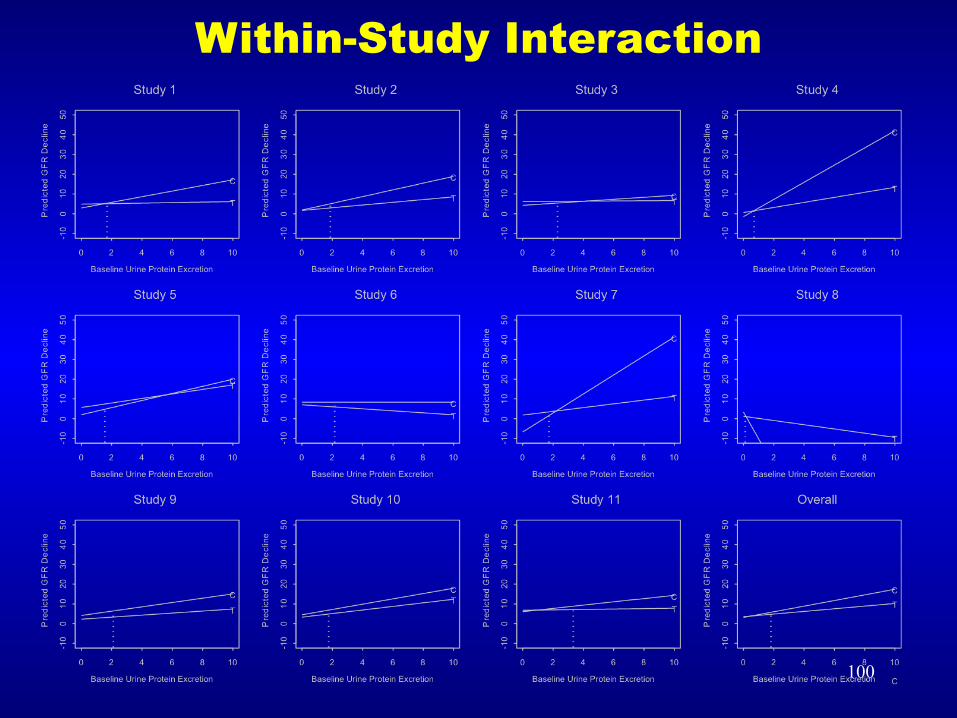
Within-Study Interaction
101
• Need to adjust for potential confounders
• Different studies may adjust for different confounders or may use different adjustment techniques
– Some variables uncollected in original studies
• May want data on individual participants
• Misclassification and measurement of exposure
• Selection of subjects for control group may differ
• Lack of knowledge of study design characteristics
Issues With Meta-Analysis of Observational Studies
102
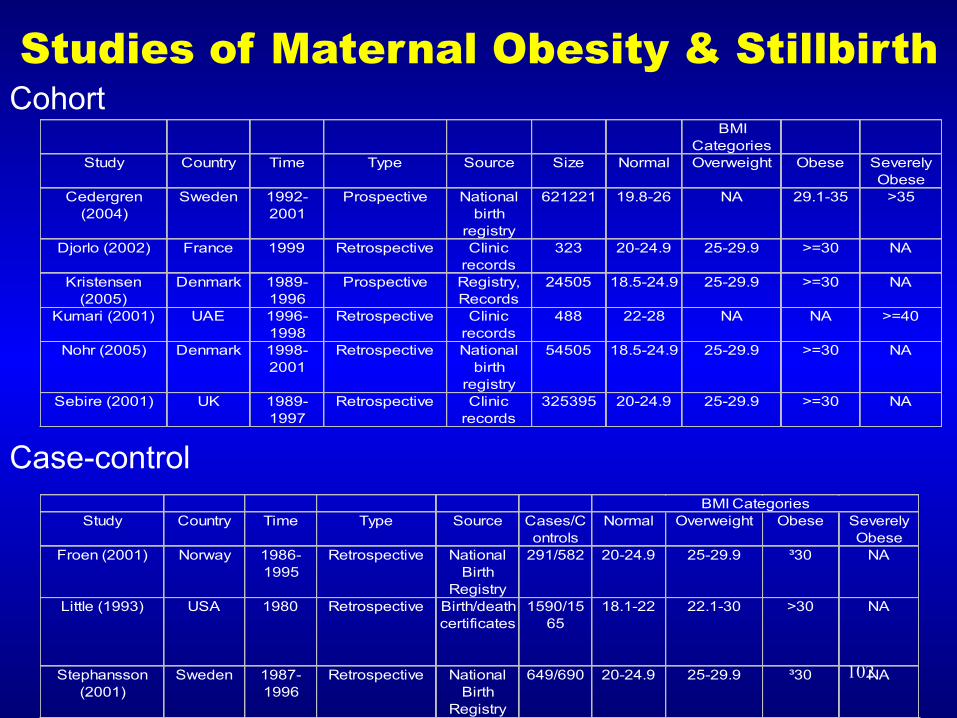
Cohort
Case-control
Studies of Maternal Obesity & Stillbirth BMI
CategoriesStudy Country Time Type Source Size Normal Overweight Obese Severely
ObeseCedergren
(2004)Sweden 1992-
2001Prospective National
birth registry
621221 19.8-26 NA 29.1-35 >35
Djorlo (2002) France 1999 Retrospective Clinic records
323 20-24.9 25-29.9 >=30 NA
Kristensen (2005)
Denmark 1989-1996
Prospective Registry, Records
24505 18.5-24.9 25-29.9 >=30 NA
Kumari (2001) UAE 1996-1998
Retrospective Clinic records
488 22-28 NA NA >=40
Nohr (2005) Denmark 1998-2001
Retrospective National birth
registry
54505 18.5-24.9 25-29.9 >=30 NA
Sebire (2001) UK 1989-1997
Retrospective Clinic records
325395 20-24.9 25-29.9 >=30 NA
Study Country Time Type Source Cases/Controls
Normal Overweight Obese Severely Obese
Froen (2001) Norway 1986-1995
Retrospective National Birth
Registry
291/582 20-24.9 25-29.9 ³30 NA
Little (1993) USA 1980 Retrospective Birth/death certificates
1590/1565
18.1-22 22.1-30 >30 NA
Stephansson (2001)
Sweden 1987-1996
Retrospective National Birth
Registry
649/690 20-24.9 25-29.9 ³30 NA
BMI Categories
103
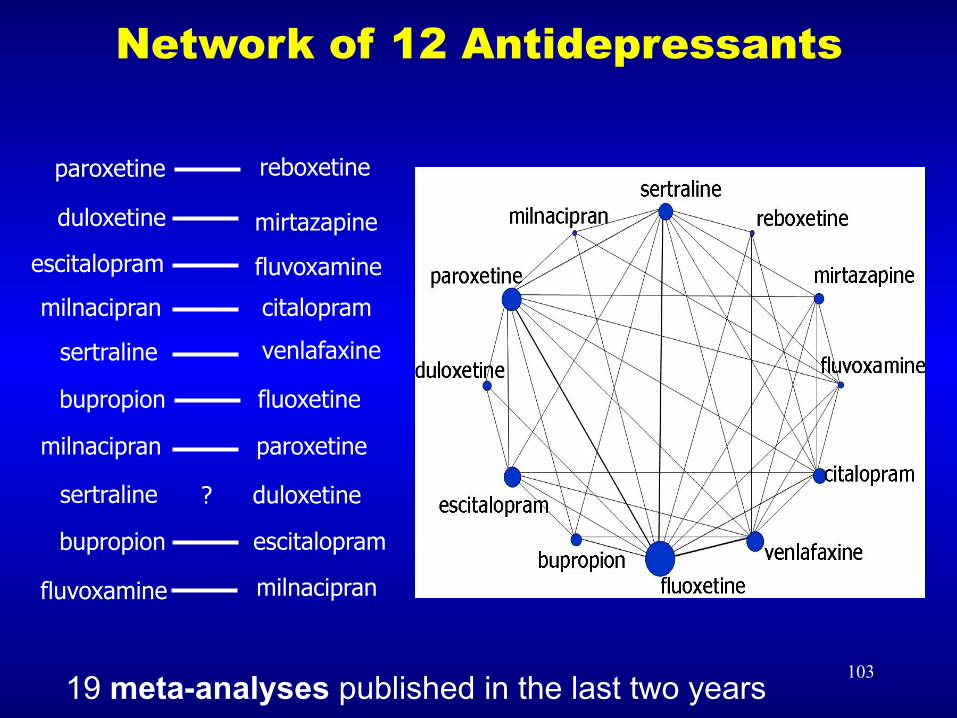
paroxetine
sertraline
citalopram
fluoxetine
fluvoxamine
milnacipran
venlafaxine
reboxetine
bupropion
mirtazapine duloxetine
escitalopram
sertraline
milnacipran
bupropion
paroxetine
milnacipran
duloxetine
escitalopram
fluvoxamine
?
Network of 12 Antidepressants
19 meta-analyses published in the last two years
104
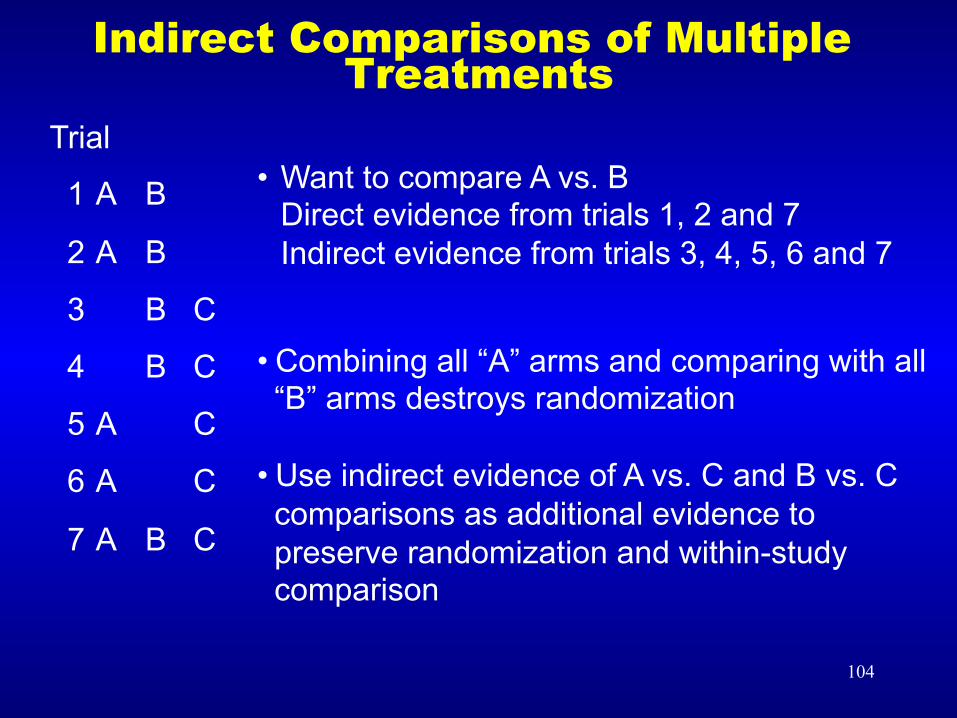
Indirect Comparisons of Multiple Treatments
Trial
1 A B
2 A B
3 B C
4 B C
5 A C
6 A C
7 A B C
• Want to compare A vs. B Direct evidence from trials 1, 2 and 7 Indirect evidence from trials 3, 4, 5, 6 and 7
• Combining all “A” arms and comparing with all “B” arms destroys randomization
• Use indirect evidence of A vs. C and B vs. C comparisons as additional evidence to preserve randomization and within-study comparison
105 105
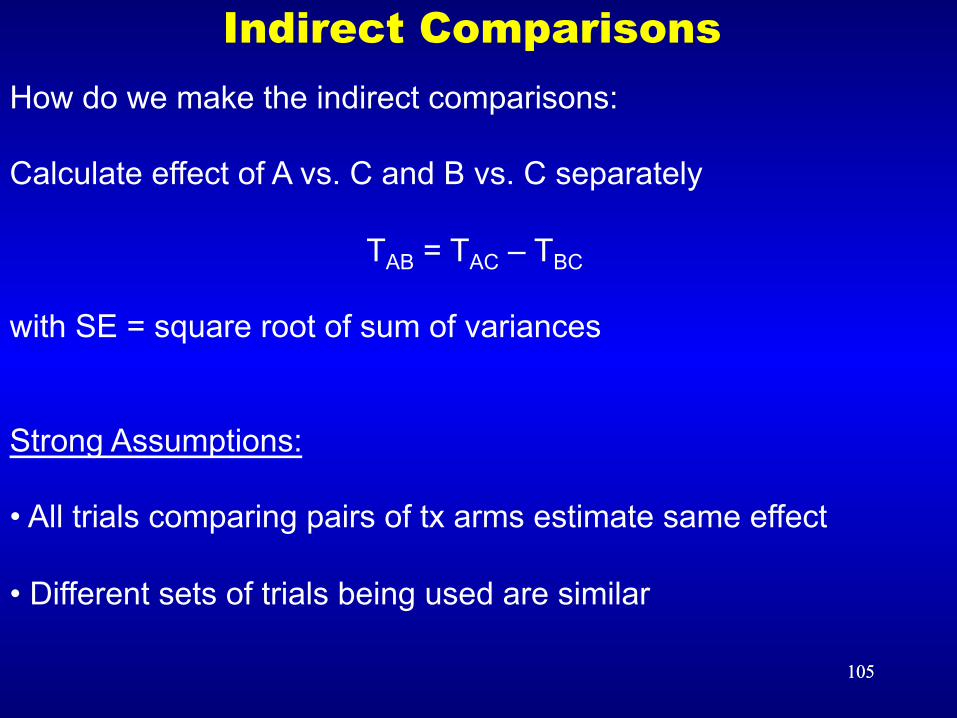
Indirect Comparisons How do we make the indirect comparisons: Calculate effect of A vs. C and B vs. C separately
TAB = TAC – TBC with SE = square root of sum of variances
Strong Assumptions: • All trials comparing pairs of tx arms estimate same effect
• Different sets of trials being used are similar
106
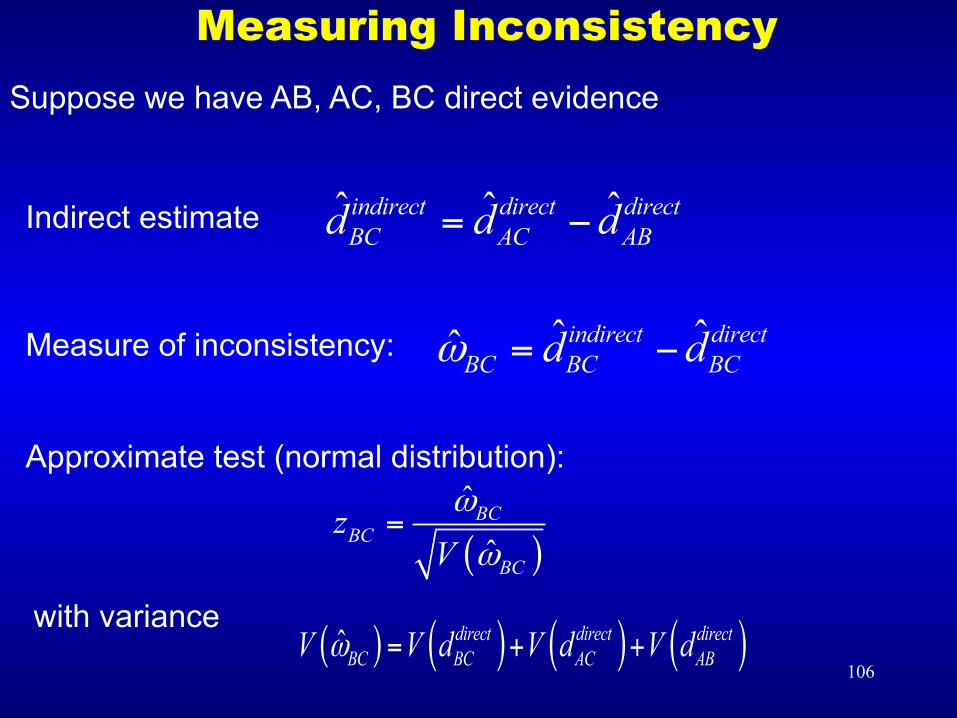
Measuring Inconsistency Suppose we have AB, AC, BC direct evidence
Indirect estimate ˆ ˆ ˆindirect direct directBC AC ABd d d= −
Measure of inconsistency: ˆ ˆˆ indirect directBC BC BCd dω = −
Approximate test (normal distribution):
( )ˆˆBC
BCBC
zVω
ω=
with variance ( ) ( ) ( ) ( )ˆ direct direct direct
BC BC AC ABV V d V d V dω = + +
107
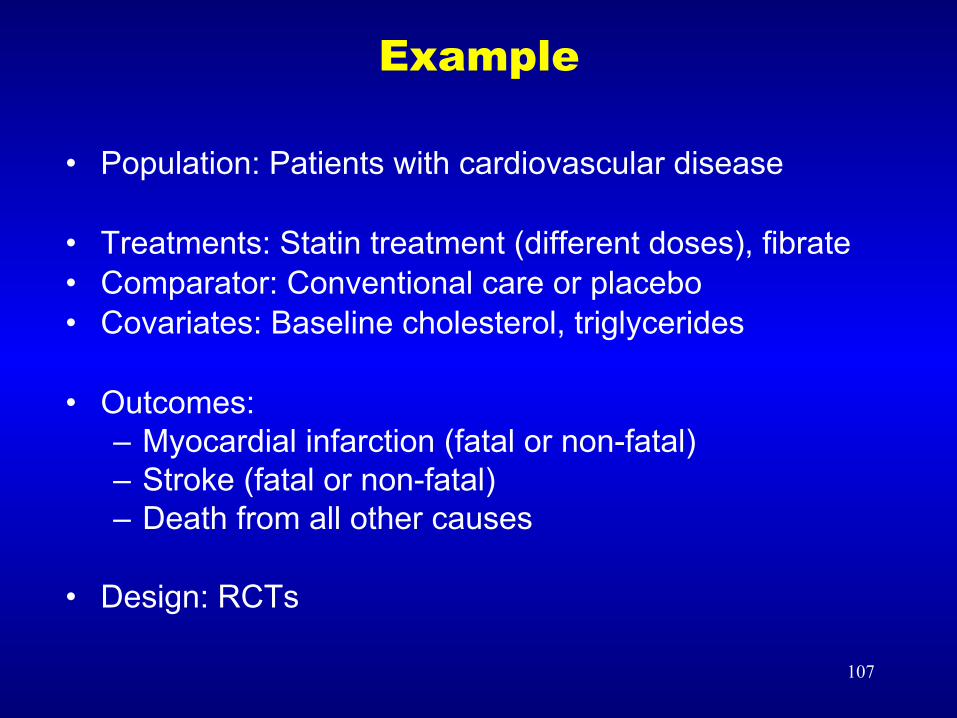
Example
• Population: Patients with cardiovascular disease • Treatments: Statin treatment (different doses), fibrate • Comparator: Conventional care or placebo • Covariates: Baseline cholesterol, triglycerides • Outcomes:
– Myocardial infarction (fatal or non-fatal) – Stroke (fatal or non-fatal) – Death from all other causes
• Design: RCTs
108
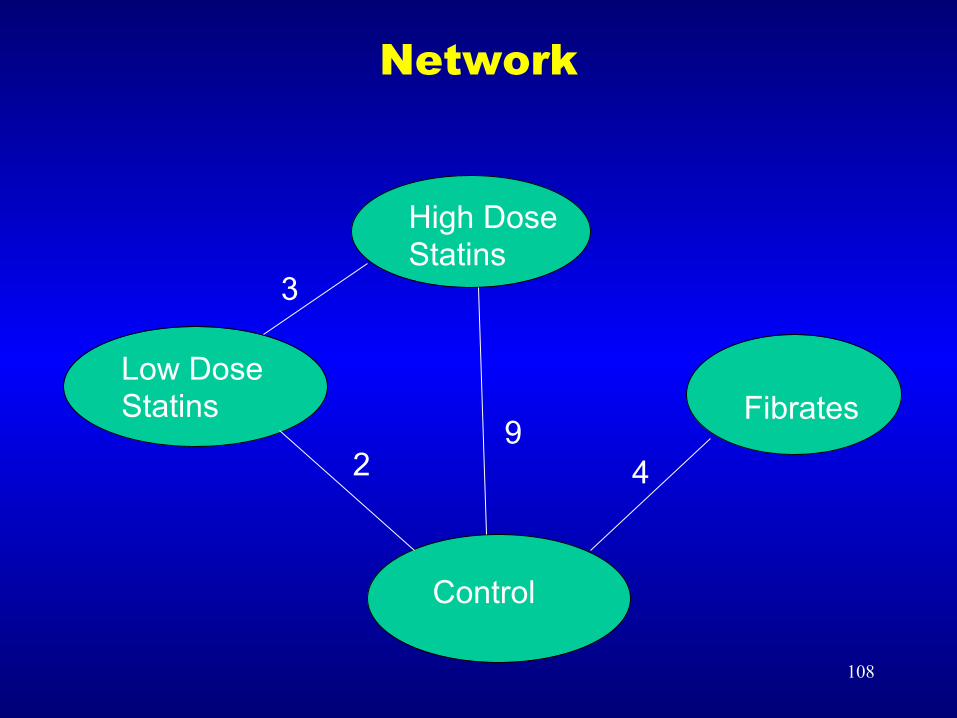
Network
High Dose Statins
Fibrates Low Dose Statins
Control
9 2 4
3
109
• Each study has 6 possible outcomes and 4 possible tx’s
• Not all tx’s carried out in each study
• Not all outcomes observed in each study
• Incomplete data with partial information from summary categories
• Can use available information to impute missing values • Can build into Bayesian algorithm using multinomial model
Data Setup
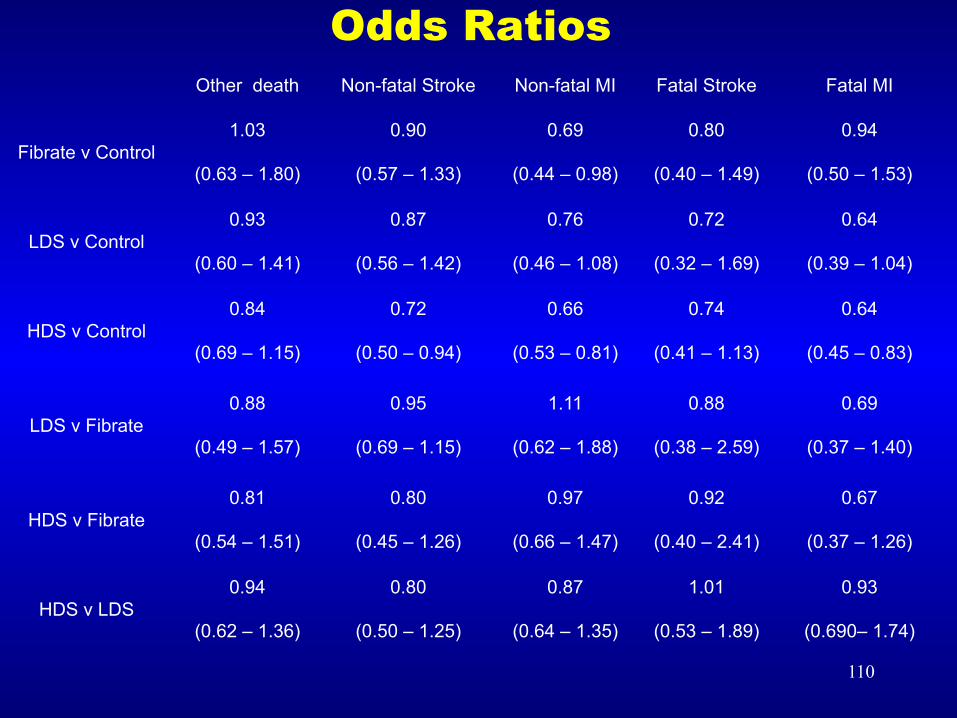
110
Odds Ratios Other death Non-fatal Stroke Non-fatal MI Fatal Stroke Fatal MI
Fibrate v Control 1.03
(0.63 – 1.80)
0.90
(0.57 – 1.33)
0.69
(0.44 – 0.98)
0.80
(0.40 – 1.49)
0.94
(0.50 – 1.53)
LDS v Control 0.93
(0.60 – 1.41)
0.87
(0.56 – 1.42)
0.76
(0.46 – 1.08)
0.72
(0.32 – 1.69)
0.64
(0.39 – 1.04)
HDS v Control 0.84
(0.69 – 1.15)
0.72
(0.50 – 0.94)
0.66
(0.53 – 0.81)
0.74
(0.41 – 1.13)
0.64
(0.45 – 0.83)
LDS v Fibrate 0.88
(0.49 – 1.57)
0.95
(0.69 – 1.15)
1.11
(0.62 – 1.88)
0.88
(0.38 – 2.59)
0.69
(0.37 – 1.40)
HDS v Fibrate 0.81
(0.54 – 1.51)
0.80
(0.45 – 1.26)
0.97
(0.66 – 1.47)
0.92
(0.40 – 2.41)
0.67
(0.37 – 1.26)
HDS v LDS 0.94
(0.62 – 1.36)
0.80
(0.50 – 1.25)
0.87
(0.64 – 1.35)
1.01
(0.53 – 1.89)
0.93
(0.690– 1.74)
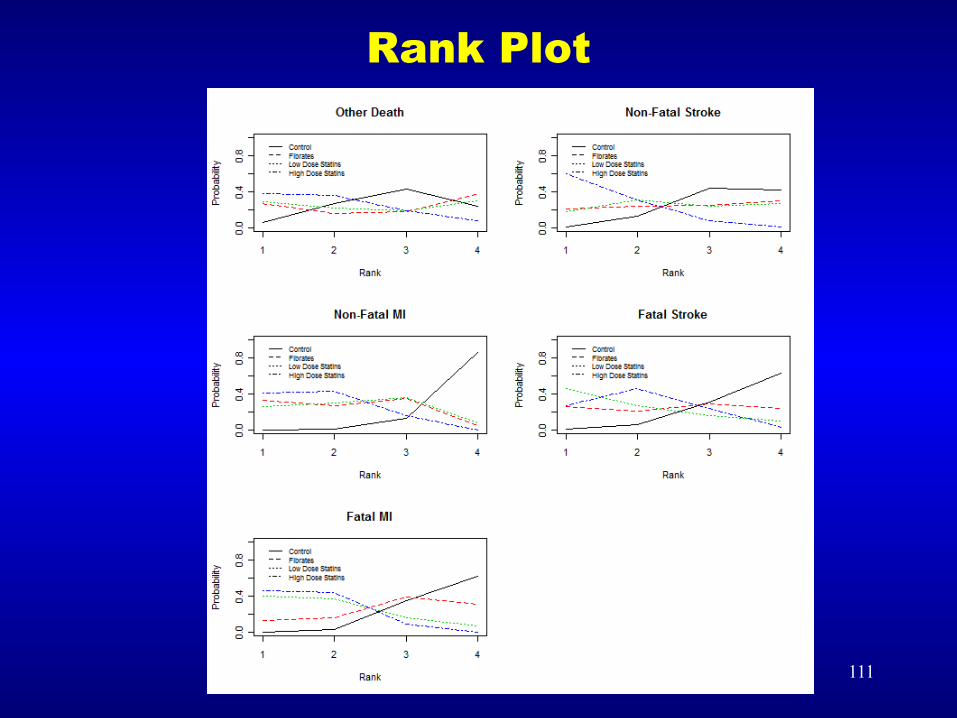
111
Rank Plot
112
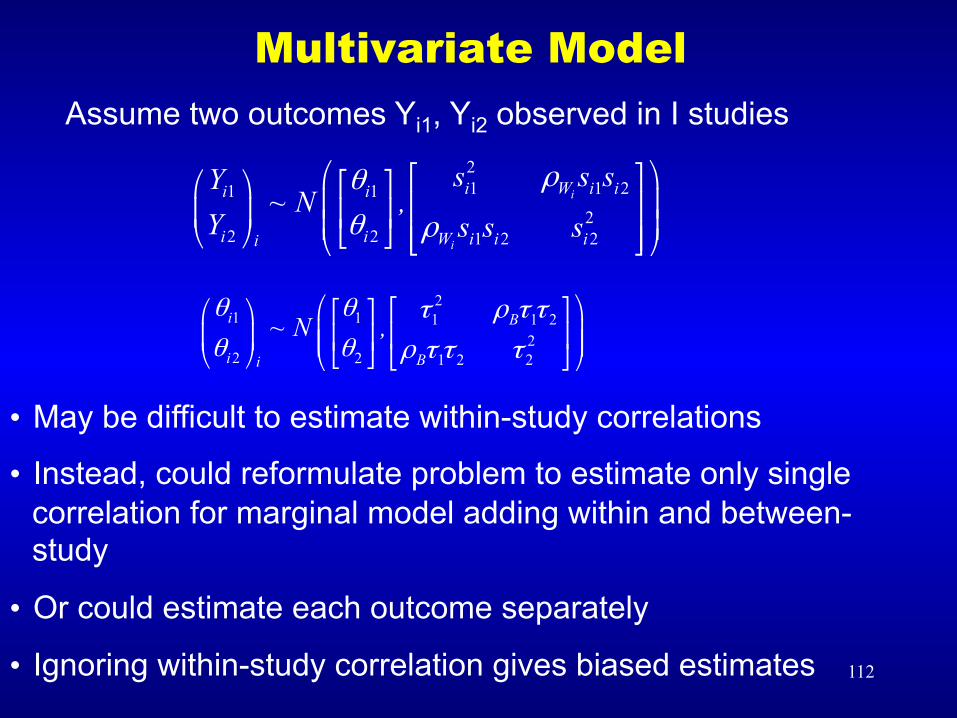
Multivariate Model
21 1 21 1
22 2 1 2 2
ρθ
θ ρ
⎛ ⎞⎡ ⎤⎛ ⎞ ⎡ ⎤⎜ ⎟⎢ ⎥⎜ ⎟ ⎢ ⎥⎜ ⎟⎝ ⎠ ⎣ ⎦ ⎢ ⎥⎣ ⎦⎝ ⎠
i
i
i W i ii i
i i W i i ii
s s sY~ N ,
Y s s s
Assume two outcomes Yi1, Yi2 observed in I studies
21 1 1 1 2
22 2 1 2 2
θ θ τ ρ τ τθ θ ρ τ τ τ
⎛ ⎞⎡ ⎤⎛ ⎞ ⎡ ⎤⎜ ⎟⎢ ⎥⎜ ⎟ ⎢ ⎥⎜ ⎟⎣ ⎦⎝ ⎠ ⎣ ⎦⎝ ⎠
i B
i Bi
~ N ,
• May be difficult to estimate within-study correlations
• Instead, could reformulate problem to estimate only single correlation for marginal model adding within and between-study
• Or could estimate each outcome separately
• Ignoring within-study correlation gives biased estimates
113
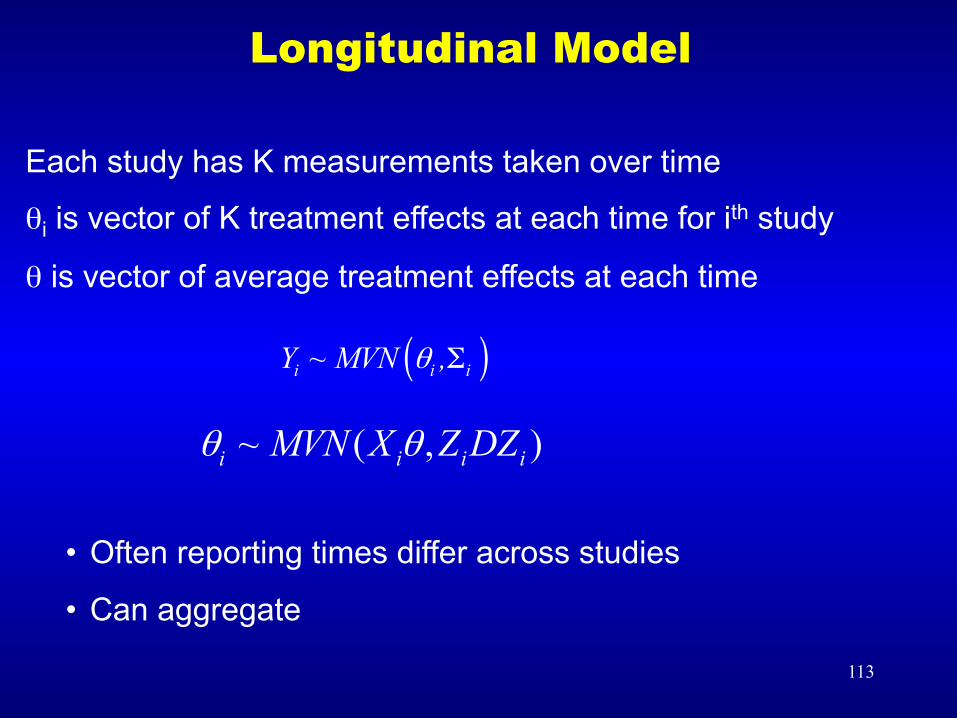
Longitudinal Model
( )θ Σi i iY ~ MVN ,
Each study has K measurements taken over time
θi is vector of K treatment effects at each time for ith study
θ is vector of average treatment effects at each time
~ ( , )θ θi i i iMVN X Z DZ
• Often reporting times differ across studies
• Can aggregate
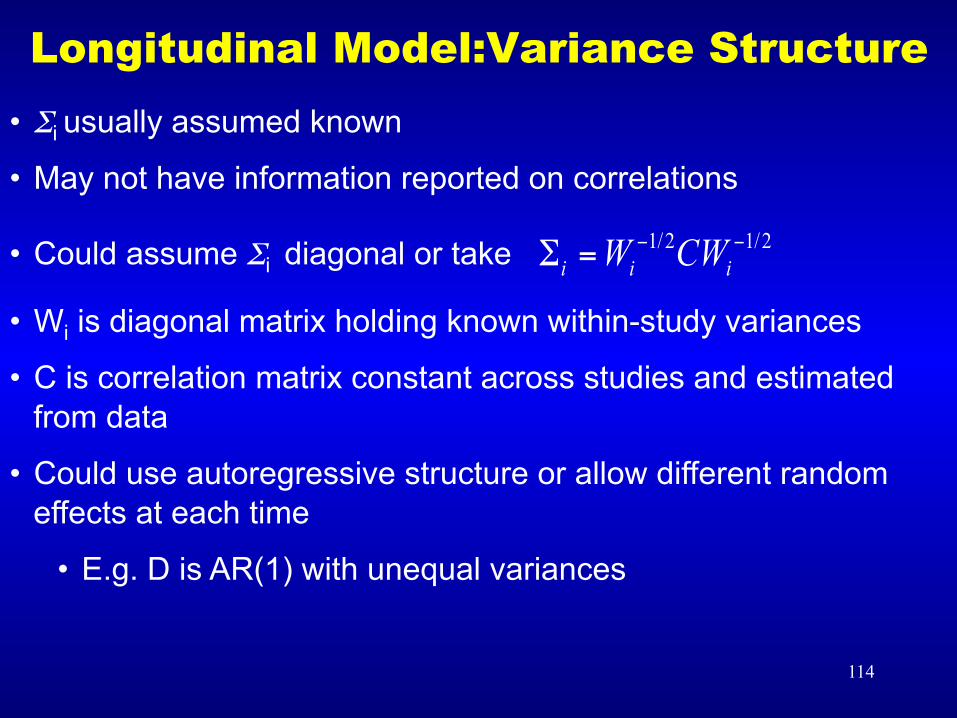
114
Longitudinal Model:Variance Structure • Σi usually assumed known
• May not have information reported on correlations
• Could assume Σi diagonal or take 1/2 1/2i i iW CW− −Σ =
• Wi is diagonal matrix holding known within-study variances
• C is correlation matrix constant across studies and estimated from data
• Could use autoregressive structure or allow different random effects at each time
• E.g. D is AR(1) with unequal variances
115
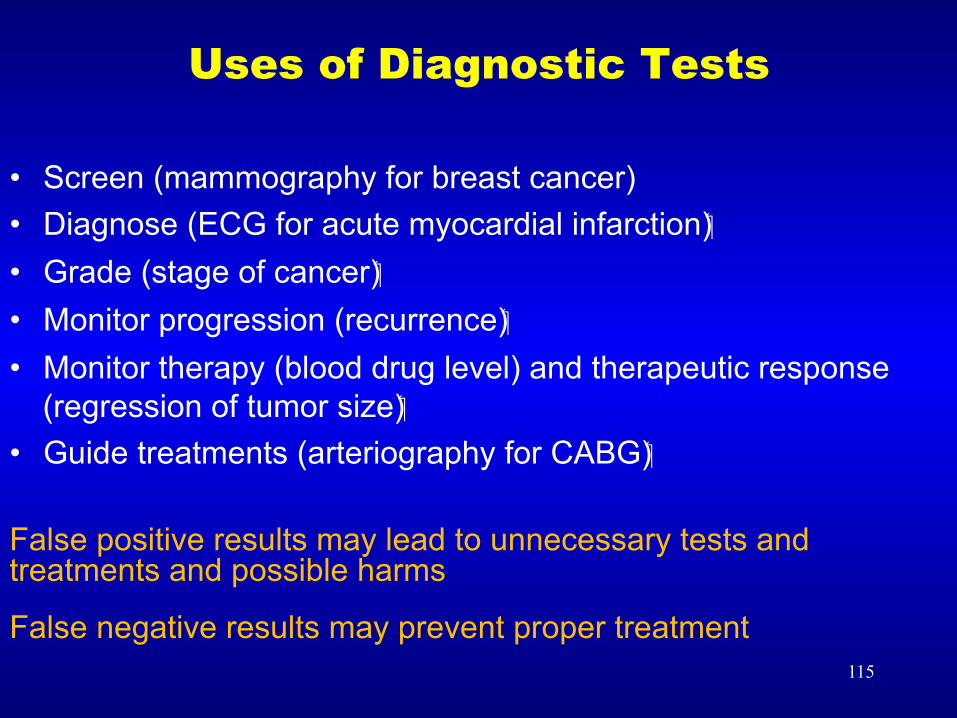
Uses of Diagnostic Tests
• Screen (mammography for breast cancer) • Diagnose (ECG for acute myocardial infarction) • Grade (stage of cancer) • Monitor progression (recurrence) • Monitor therapy (blood drug level) and therapeutic response
(regression of tumor size) • Guide treatments (arteriography for CABG)
False positive results may lead to unnecessary tests and treatments and possible harms
False negative results may prevent proper treatment
116
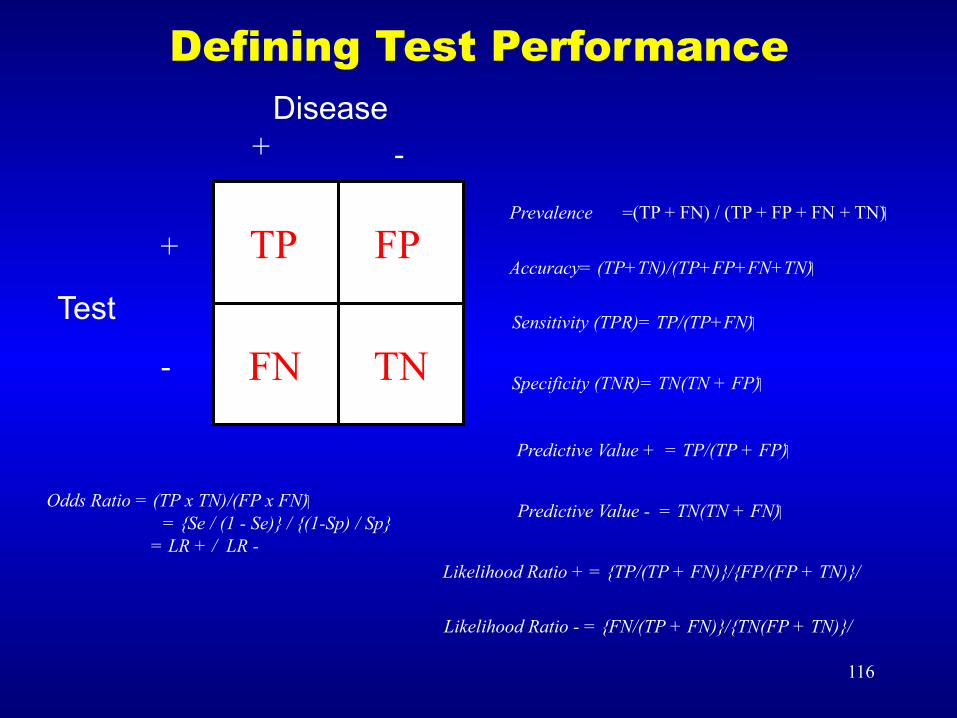
TP FP
FN TN
+ -
+
- Sensitivity (TPR)= TP/(TP+FN)
Specificity (TNR)= TN(TN + FP)
Accuracy= (TP+TN)/(TP+FP+FN+TN)
Prevalence = (TP + FN) / (TP + FP + FN + TN)
Predictive Value + = TP/(TP + FP)
Predictive Value - = TN(TN + FN)
Likelihood Ratio + = {TP/(TP + FN)}/{FP/(FP + TN)}/
Likelihood Ratio - = {FN/(TP + FN)}/{TN(FP + TN)}/
Odds Ratio = (TP x TN)/(FP x FN) = {Se / (1 - Se)} / {(1-Sp) / Sp}
= LR + / LR -
Defining Test Performance Disease
Test
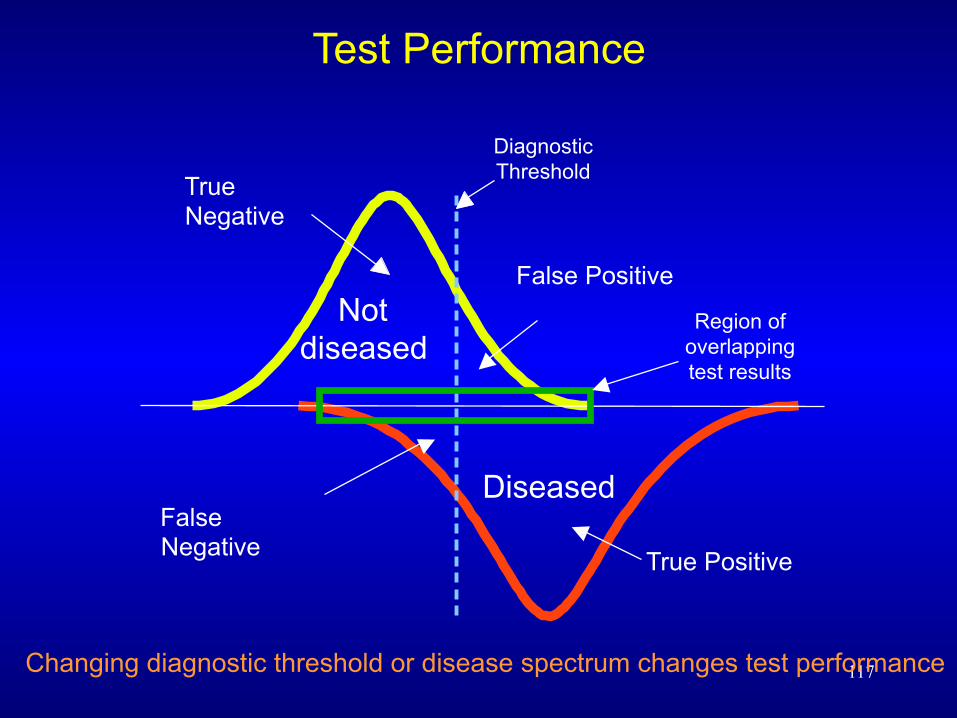
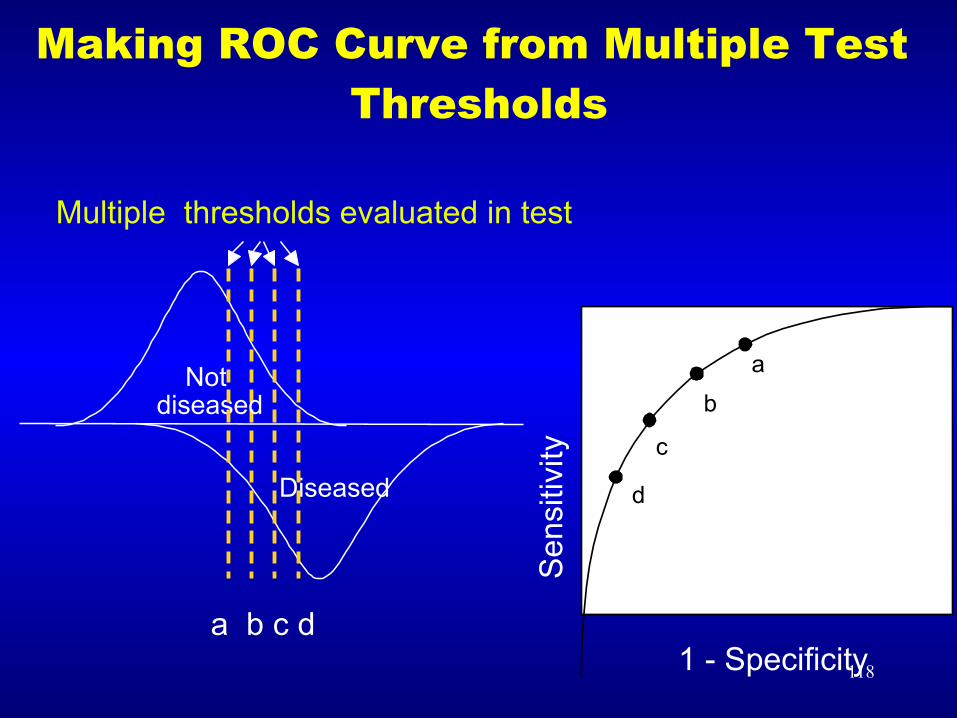
117 Changing diagnostic threshold or disease spectrum changes test performance
Diseased
Not diseased
False Positive
False Negative
Diagnostic Threshold
Region of overlapping test results
True Negative
True Positive
Test Performance
118
Making ROC Curve from Multiple Test Thresholds
1 - Specificity
a
b
d
c
Sen
sitiv
ity
a
b
d
c
Diseased
Not diseased
Multiple thresholds evaluated in test
c
ba
a b c d
119
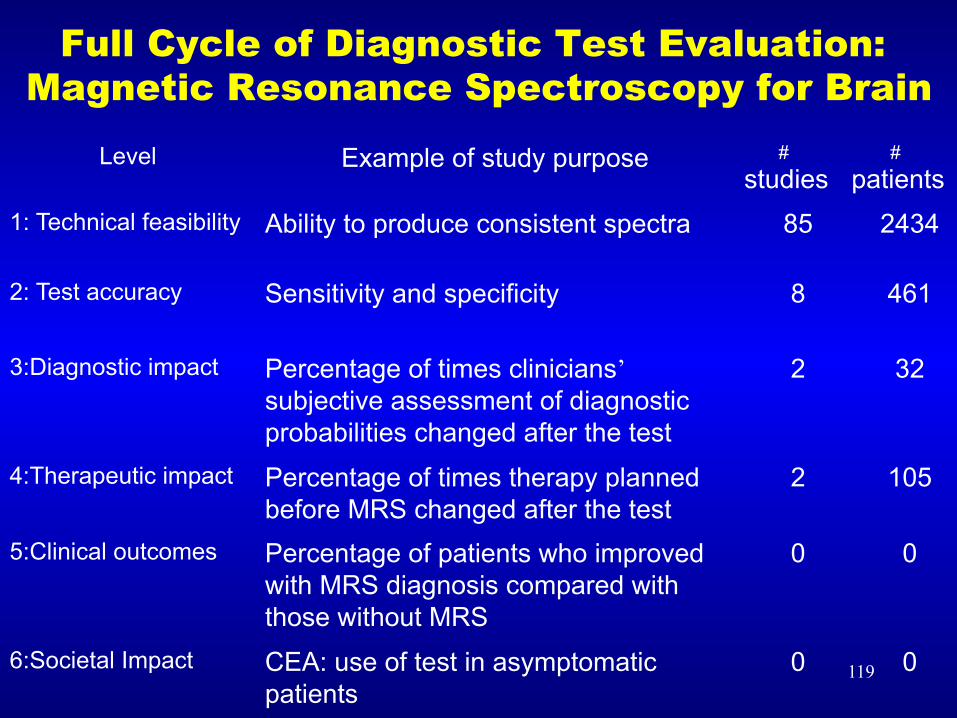
Full Cycle of Diagnostic Test Evaluation: Magnetic Resonance Spectroscopy for Brain
Level Example of study purpose # studies
# patients
1: Technical feasibility Ability to produce consistent spectra 85 2434
2: Test accuracy Sensitivity and specificity 8 461
3:Diagnostic impact
Percentage of times clinicians’ subjective assessment of diagnostic probabilities changed after the test
2 32
4:Therapeutic impact Percentage of times therapy planned before MRS changed after the test
2 105
5:Clinical outcomes Percentage of patients who improved with MRS diagnosis compared with those without MRS
0 0
6:Societal Impact CEA: use of test in asymptomatic patients
0 0
120
Diagnostic Technology Controversy: Screening Mammography RCTs
• 1999 study found no decrease in breast cancer mortality in Sweden, where screening has been recommended since 1985
• Reviewed methodological quality of mammography trials and repeated a meta-analysis
121
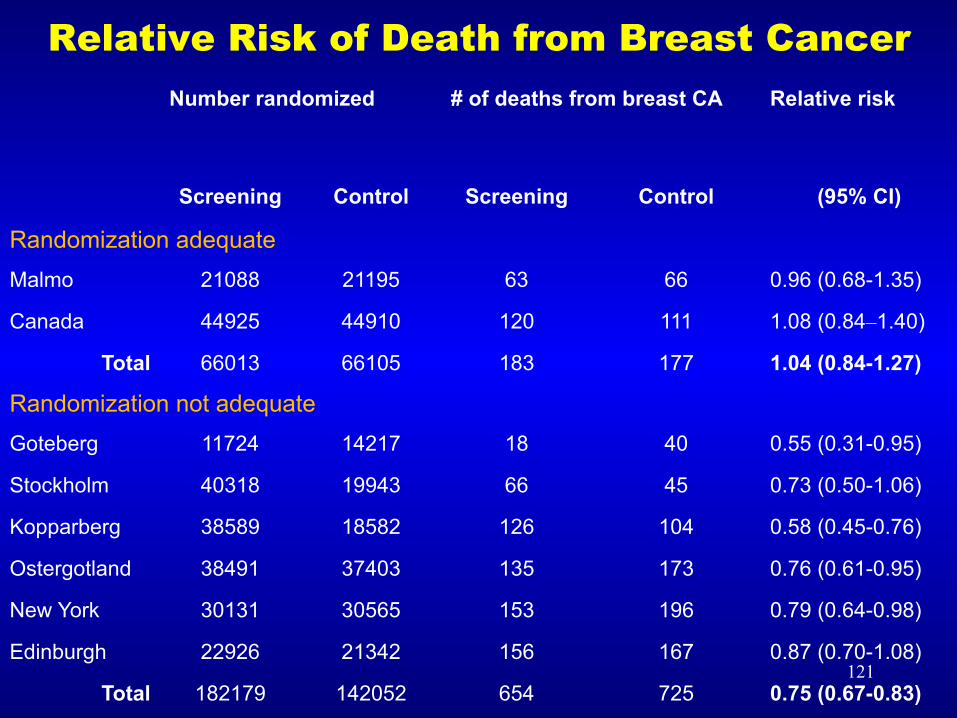
Relative Risk of Death from Breast Cancer Number randomized # of deaths from breast CA Relative risk
Screening Control Screening Control (95% CI)
Randomization adequate Malmo 21088 21195 63 66 0.96 (0.68-1.35)
Canada 44925 44910 120 111 1.08 (0.84–1.40)
Total 66013 66105 183 177 1.04 (0.84-1.27)
Randomization not adequate Goteberg 11724 14217 18 40 0.55 (0.31-0.95)
Stockholm 40318 19943 66 45 0.73 (0.50-1.06)
Kopparberg 38589 18582 126 104 0.58 (0.45-0.76)
Ostergotland 38491 37403 135 173 0.76 (0.61-0.95)
New York 30131 30565 153 196 0.79 (0.64-0.98)
Edinburgh 22926 21342 156 167 0.87 (0.70-1.08)
Total 182179 142052 654 725 0.75 (0.67-0.83)
122
Policy Results
• Switzerland decided to not cover screening mammography
• National Cancer Institute wavered on value of screening mammograms
• Women and doctors more confused about value of test
123 123 123
Conclusions
l Evidence-based medicine requires collaboration of doctors, statisticians, librarians, epidemiologists and other experts
l Goal is to provide scientific basis for clinical decisions
l Often requires sifting through extensive literature
l Systematic reviews more scientific than narrative reviews
l Determines validity of evidence and identifies research gaps
l Discovery of heterogeneity can improve interventions