Embed Size (px)
DESCRIPTION
Evidence for Policy and Practice Decision-making for Adult Skills Training in Canada. Satya Brink, Ph.D. [email protected] Presented at 2013 Annual General Conference: Opening Doors- Developing Partnerships for Basic Skills Training Beyond the Classroom. The European Basic Skills Network - PowerPoint PPT Presentation
Citation preview

Evidence for Policy and Practice Decision-making for Adult Skills Training in Canada
Satya Brink, Ph.D. [email protected]
Presented at 2013 Annual General Conference: Opening Doors- Developing Partnerships for Basic Skills Training Beyond the Classroom.
The European Basic Skills NetworkMadrid, May 23-25, 2013

Why is this an issue which requires government action?Because the issue is • of national importance for economic prosperity and well being. • impacts the whole population and other key issues such as
health or standard of living. • is larger than the citizen who cannot easily break out of the
problem without help. THEN
Evidence enables strategic and effective policy decisions for complex, multiple and persistent problems affecting the public good
To contribute to policy debate based on evidence rather than ideology.To determine need and target clientele
To choose between policy options based on evidence of cause and effectiveness of intervention.
To determine the best time for interventions. To increase the chances of successful results.
Policy research generates evidence for the democratic process of public policy
Two essentials:
• Public support for the creation of policy using tax payer money.
• Evidence that policies can make a difference.
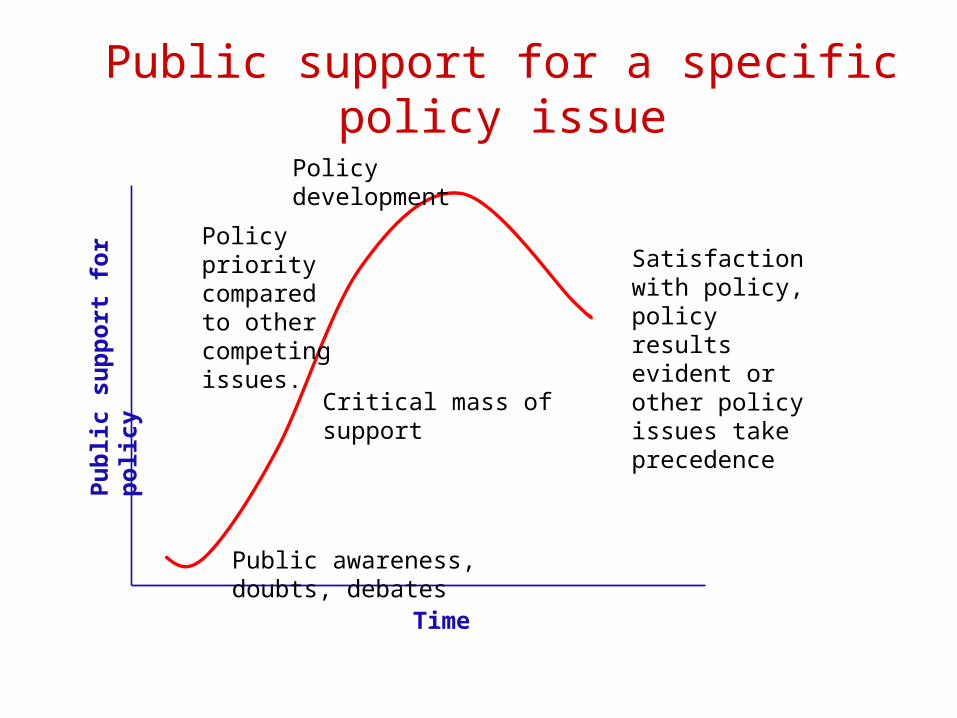
Public support for a specific policy issuePolicy development
Satisfaction with policy, policy results evident or other policy issues take precedence
Time
Publ
ic su
ppor
t for
pol
icy
Public awareness, doubts, debates
Critical mass of support
Policy priority compared to other competing issues.
Evidence that policies can make a differenceWhy ? How? Who? How many? When? Where? Which? • Why is the issue important today and in the future for
Canada? • How do we compare internationally? • How big is the issue?
•Will it worsen without policy action? •Can it be prevented? • Who needs it? • How many need it? • What kind of programming? How much of each?
• What do they need? • Where are they? How can we find them ? • How durable are the results?
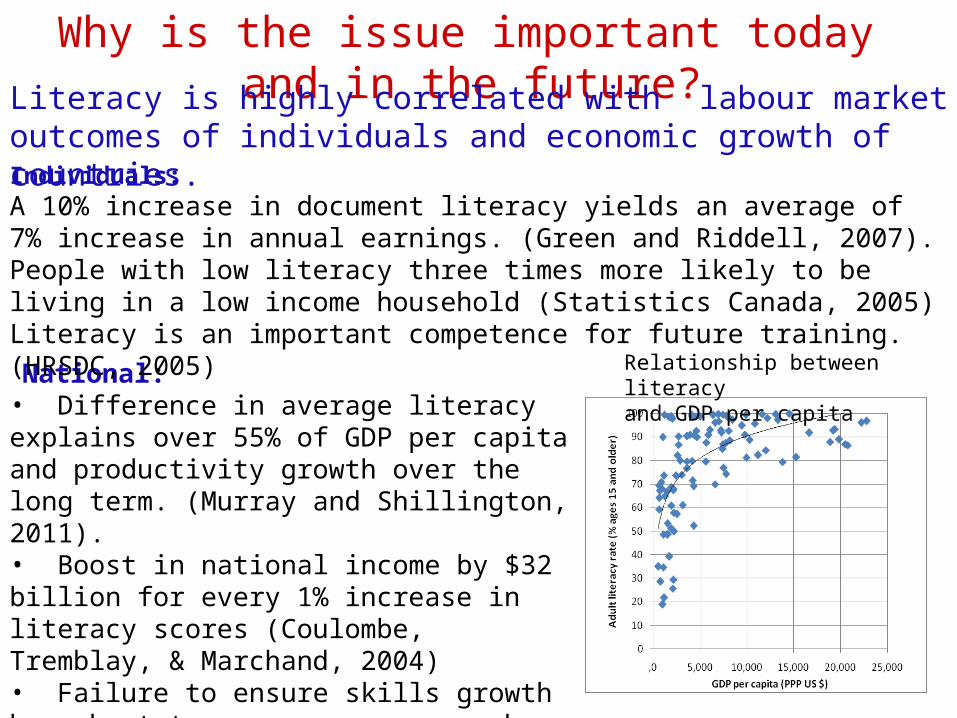
Why is the issue important today and in the future? Literacy is highly correlated with labour market outcomes of individuals and economic growth of countries.
National: • Difference in average literacy explains over 55% of GDP per capita and productivity growth over the long term. (Murray and Shillington, 2011).• Boost in national income by $32 billion for every 1% increase in literacy scores (Coulombe, Tremblay, & Marchand, 2004)• Failure to ensure skills growth has short term consequences such as skill shortages and long term ones such as lower economic growth and equality of opportunities. (OECD 2010).
Relationship between literacy and GDP per capita
Individuals:A 10% increase in document literacy yields an average of 7% increase in annual earnings. (Green and Riddell, 2007). People with low literacy three times more likely to be living in a low income household (Statistics Canada, 2005)Literacy is an important competence for future training. (HRSDC, 2005)
0%2%4%6%8%
10%12%14%
Prose Document Numeracy Problem solving
Literacy Years of schooling Years of experience
Source: ALL/ IALSS, 2003
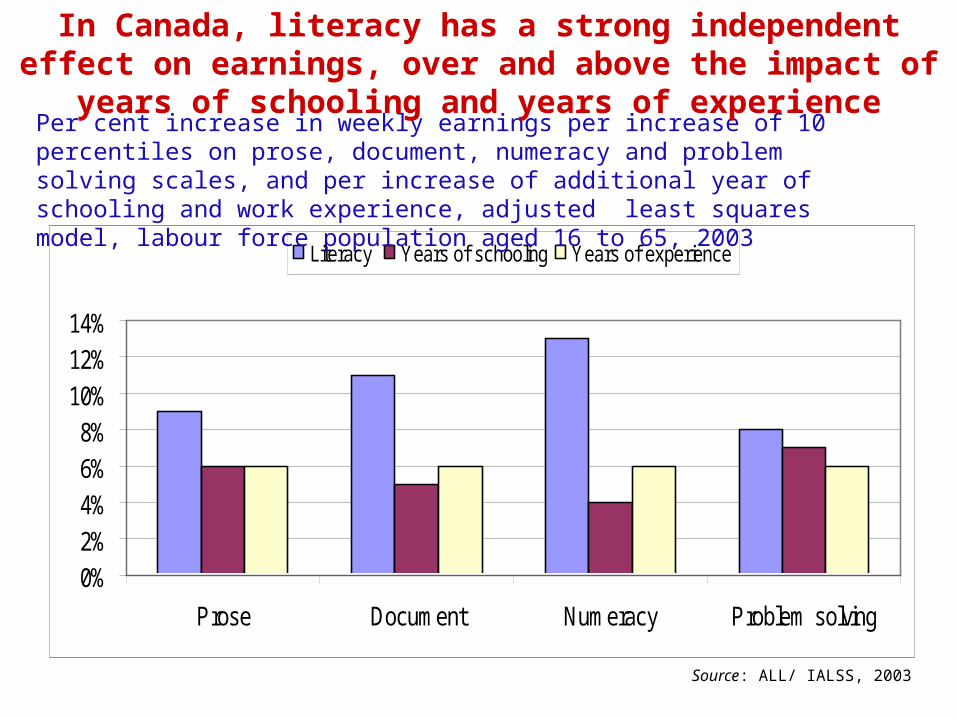
Per cent increase in weekly earnings per increase of 10 percentiles on prose, document, numeracy and problem solving scales, and per increase of additional year of schooling and work experience, adjusted least squares model, labour force population aged 16 to 65, 2003
In Canada, literacy has a strong independent effect on earnings, over and above the impact of years of schooling and years of experience
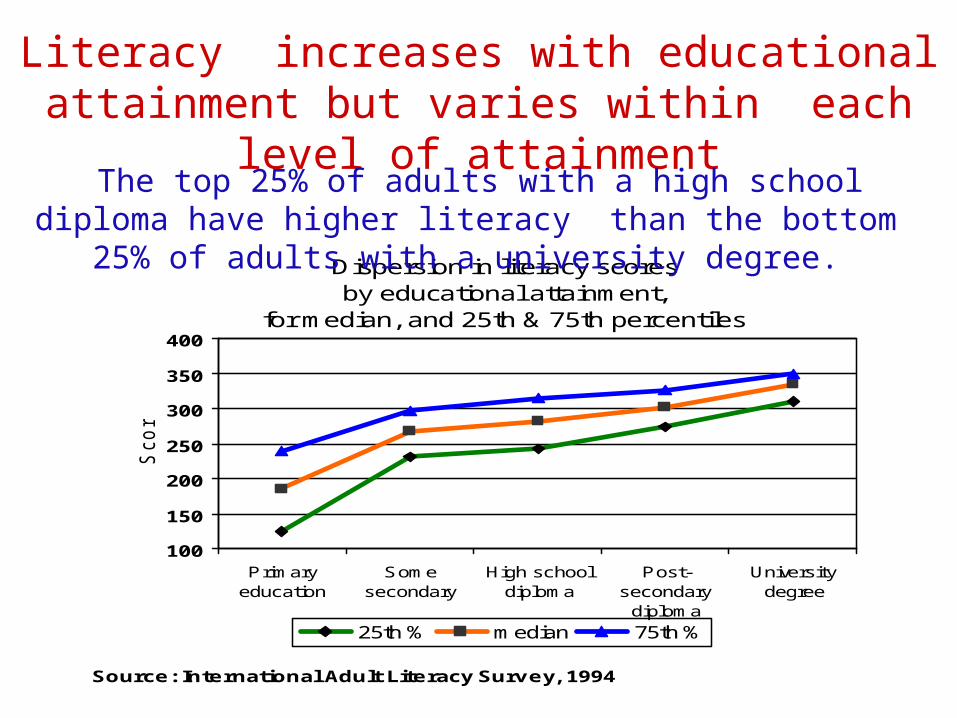
Dispersion in literacy scores by educational attainment,
for median, and 25th & 75th percentiles
100
150
200
250
300
350
400
Primaryeducation
Somesecondary
High schooldiploma
Post-secondary
diploma
Universitydegree
Source: International Adult Literacy Survey, 1994
Sco
re
25th % median 75th %
Literacy increases with educational attainment but varies within each level of attainment
The top 25% of adults with a high school diploma have higher literacy than the bottom 25% of adults with a university degree.
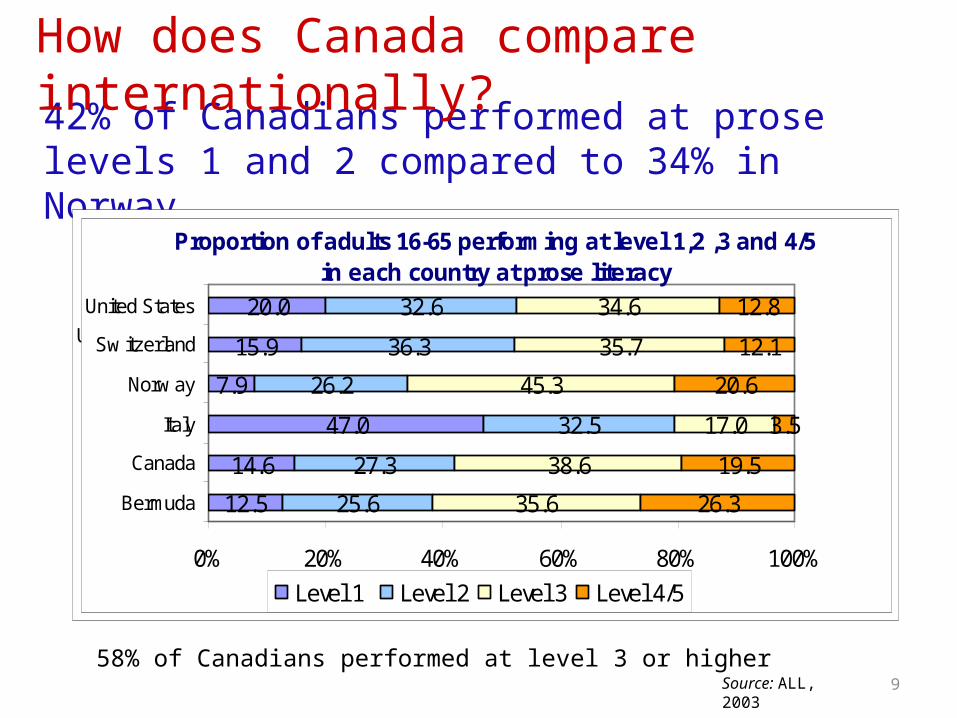
9Source: ALL, 200358% of Canadians performed at level 3 or higher
42% of Canadians performed at prose levels 1 and 2 compared to 34% in Norway
Proportion of adults (16-65) performing at level 1,2 ,3 and 4/5 in each country at prose literacy
7.9
12.5
15.9
20.0
47.0
14.6
25.6
32.5
26.2
36.3
32.6
27.3
35.6
45.3
35.7
34.6
17.0
38.6
3.5
26.3
20.6
12.1
12.8
19.5
0% 20% 40% 60% 80% 100%
Bermuda
Italy
Norw ay
Sw itzerland
United States
Canada
Proportion of adults 16-65 performing at level 1,2 ,3 and 4/5 in each country at prose literacy
12.5
47.0
7.9
15.9
20.0
25.6
32.5
26.2
36.3
32.6
35.6
17.0
45.3
35.7
34.6
26.3
3.5
20.6
12.1
12.8
14.6 27.3 38.6 19.5
0% 20% 40% 60% 80% 100%
Bermuda
Canada
Italy
Norw ay
Sw itzerland
United States
Level 1 Level 2 Level 3 Level 4/5
How does Canada compare internationally?
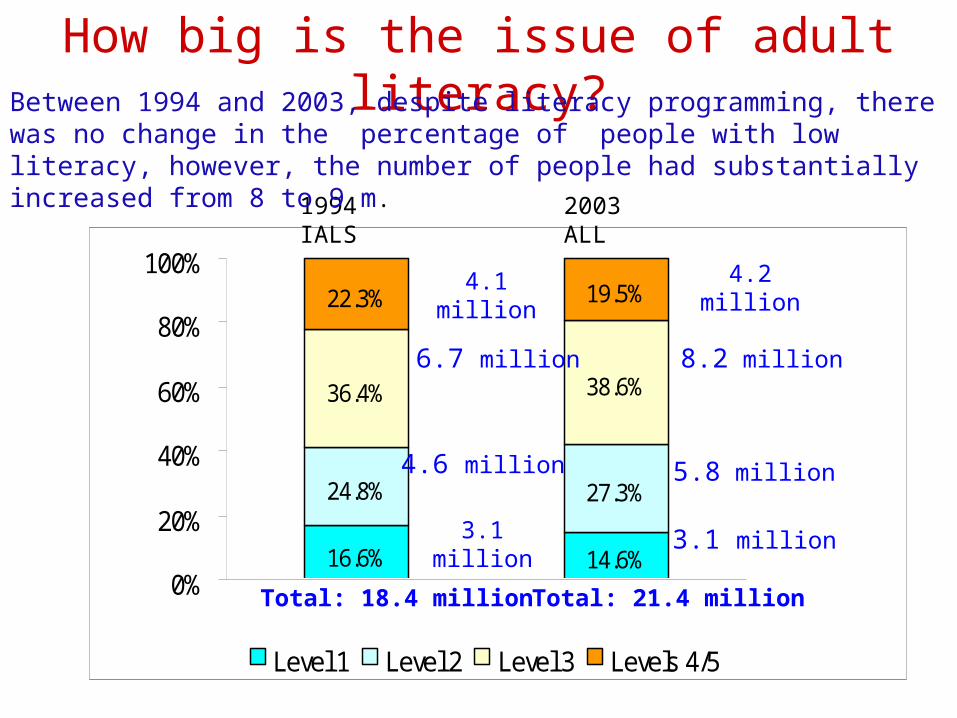
How big is the issue of adult literacy?
14.6%
24.8% 27.3%
36.4% 38.6%
22.3% 19.5%
16.6%0%
20%
40%
60%
80%
100%
Level 1 Level 2 Level 3 Levels 4/5
1994 IALS 2003 ALL
Between 1994 and 2003, despite literacy programming, there was no change in the percentage of people with low literacy, however, the number of people had substantially increased from 8 to 9 m.
4.1 million 4.2 million
8.2 million6.7 million
4.6 million 5.8 million
3.1 million 3.1 million
Total: 18.4 million Total: 21.4 million
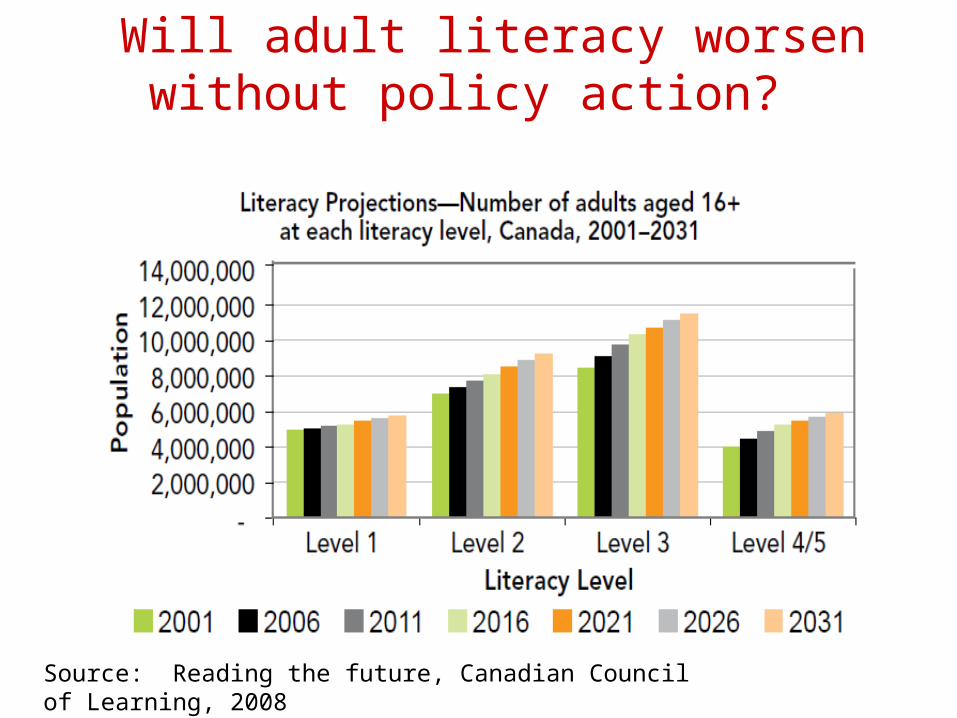
Source: Reading the future, Canadian Council of Learning, 2008
Will adult literacy worsen without policy action?
12
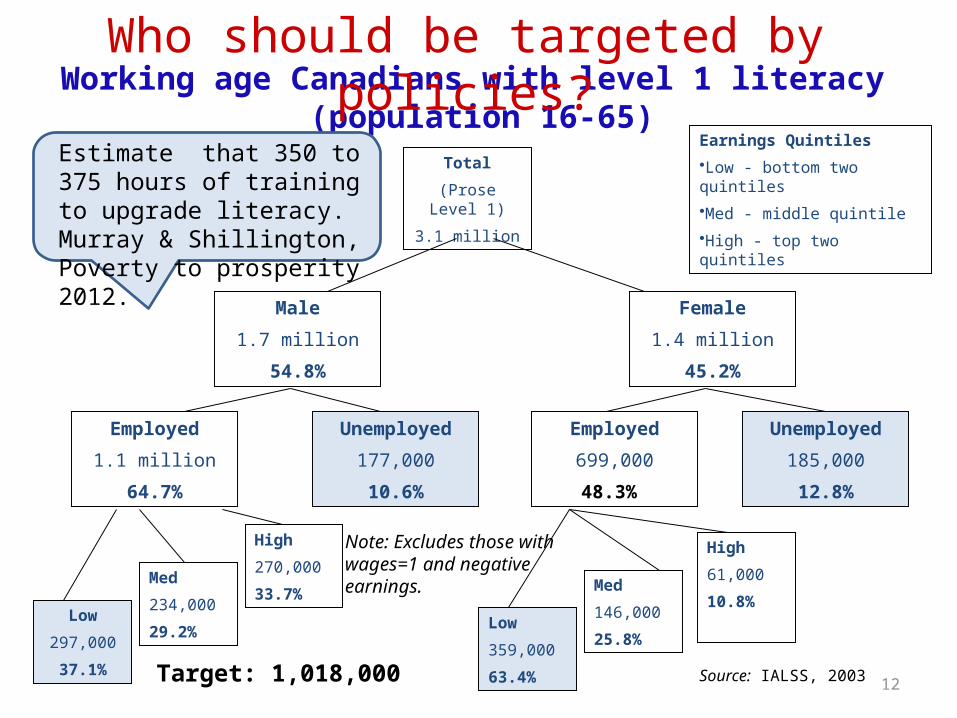
Working age Canadians with level 1 literacy (population 16-65)
Total
(Prose Level 1)
3.1 million
Male
1.7 million
54.8%
Female
1.4 million
45.2%
Employed
1.1 million
64.7%
Unemployed
177,000
10.6%
Low
297,000
37.1%
Med
234,000
29.2%
High
270,000
33.7%
Employed
699,000
48.3%
Unemployed
185,000
12.8%
Low
359,000
63.4%
Med
146,000
25.8%
High
61,000
10.8%
Source: IALSS, 2003
Earnings Quintiles•Low - bottom two quintiles•Med - middle quintile•High - top two quintiles
Target: 1,018,000
Note: Excludes those with wages=1 and negative earnings.
Who should be targeted by policies?
Estimate that 350 to 375 hours of training to upgrade literacy. Murray & Shillington, Poverty to prosperity 2012.
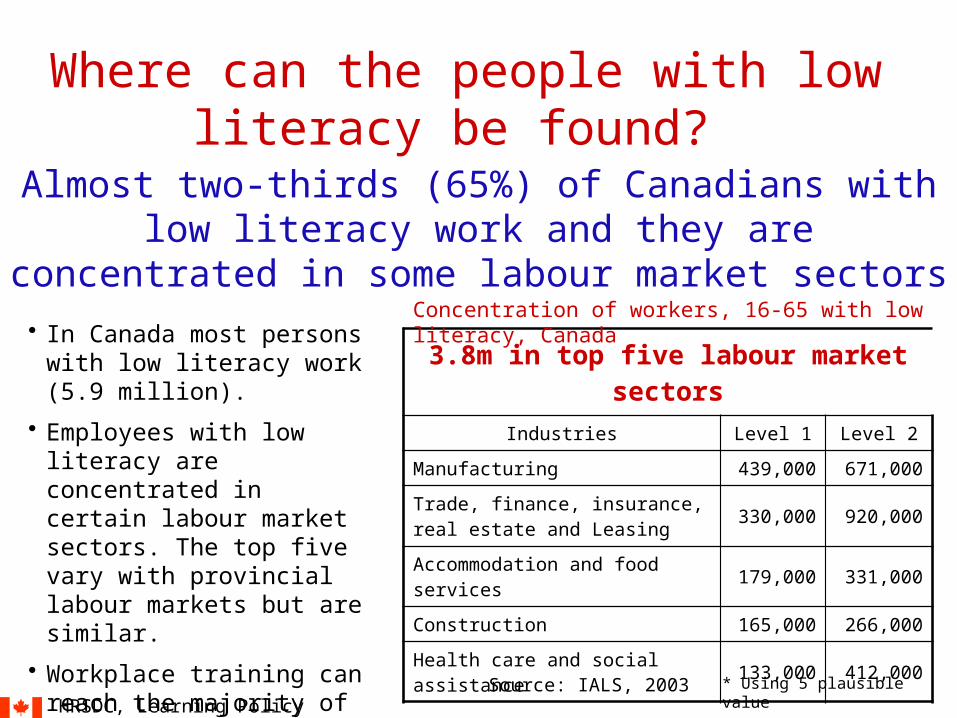
3.8m in top five labour market sectors
Industries Level 1 Level 2
Manufacturing 439,000 671,000
Trade, finance, insurance, real estate and Leasing 330,000 920,000
Accommodation and food services 179,000 331,000
Construction 165,000 266,000
Health care and social assistance 133,000 412,000
Almost two-thirds (65%) of Canadians with low literacy work and they are concentrated in some labour market sectors
* Using 5 plausible value
Concentration of workers, 16-65 with low literacy, Canada • In Canada most persons with low
literacy work (5.9 million).• Employees with low literacy are
concentrated in certain labour market sectors. The top five vary with provincial labour markets but are similar.
• Workplace training can reach the majority of workers with low literacy.
Source: IALS, 2003HRSDC, Learning Policy Directorate
Where can the people with low literacy be found?
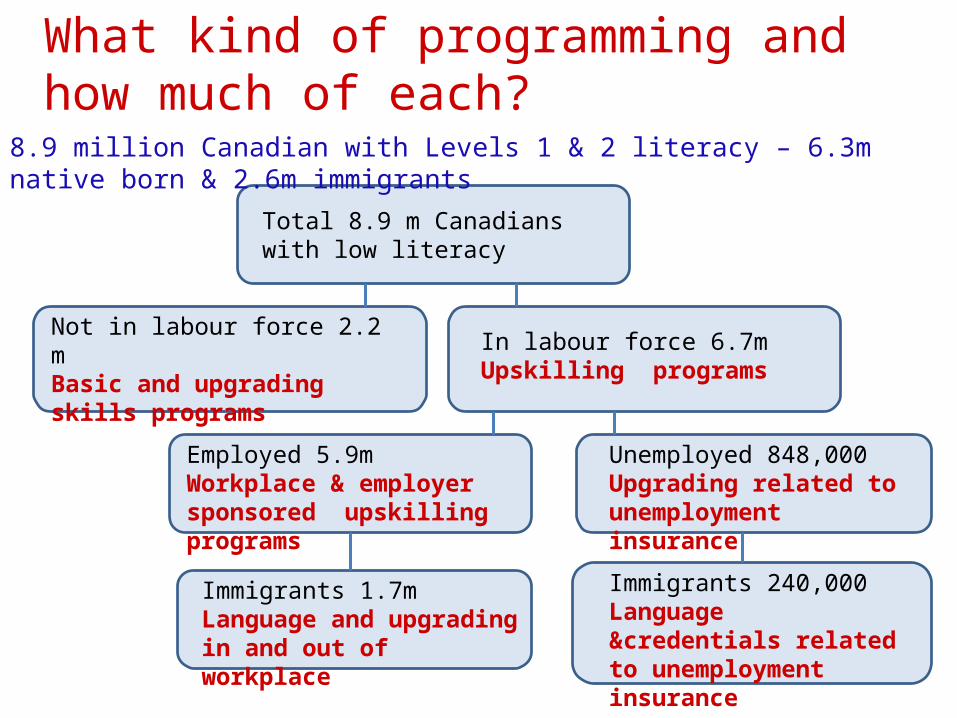
What kind of programming and how much of each?
8.9 million Canadian with Levels 1 & 2 literacy – 6.3m native born & 2.6m immigrants
Total 8.9 m Canadians with low literacy
Not in labour force 2.2 mBasic and upgrading skills programs
In labour force 6.7mUpskilling programs
Employed 5.9mWorkplace & employer sponsored upskilling programs
Unemployed 848,000Upgrading related to unemployment insurance
Immigrants 1.7m Language and upgrading in and out of workplace
Immigrants 240,000Language &credentials related to unemployment insurance
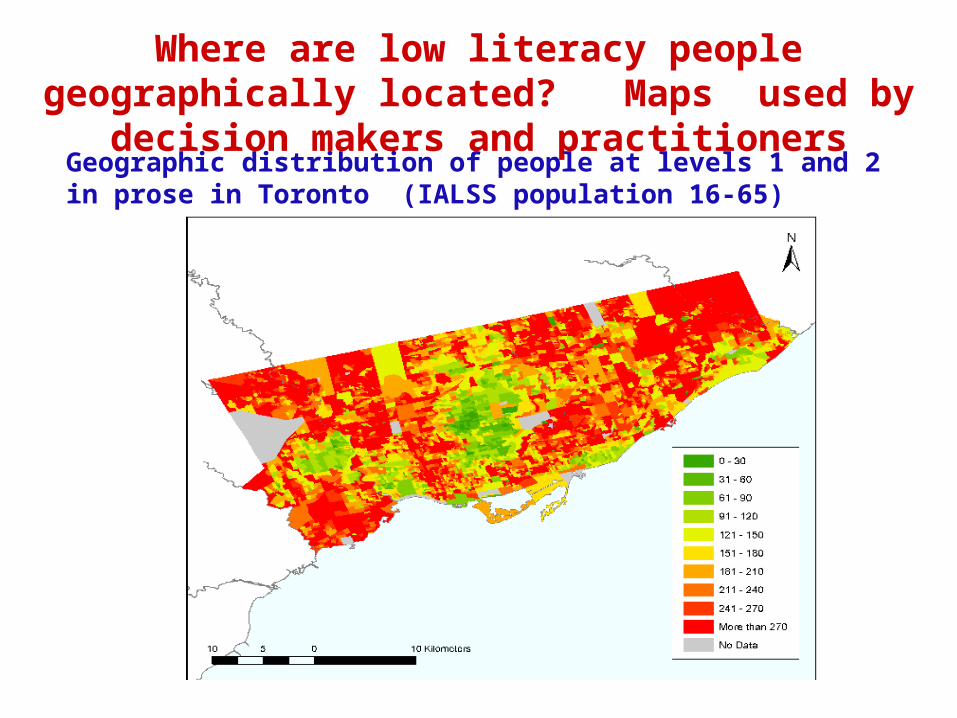
Where are low literacy people geographically located? Maps used by decision makers and practitioners
Geographic distribution of people at levels 1 and 2 in prose in Toronto (IALSS population 16-65)
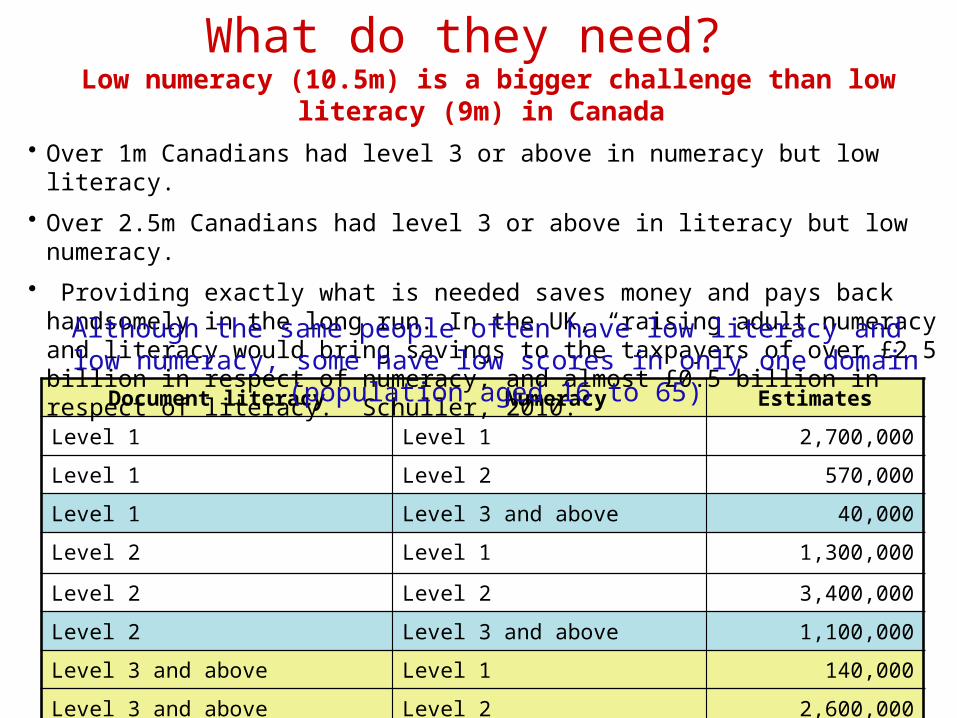
Document literacy Numeracy EstimatesLevel 1 Level 1 2,700,000Level 1 Level 2 570,000Level 1 Level 3 and above 40,000Level 2 Level 1 1,300,000
Level 2 Level 2 3,400,000Level 2 Level 3 and above 1,100,000Level 3 and above Level 1 140,000Level 3 and above Level 2 2,600,000
Low numeracy (10.5m) is a bigger challenge than low literacy (9m) in Canada • Over 1m Canadians had level 3 or above in numeracy but low literacy.• Over 2.5m Canadians had level 3 or above in literacy but low numeracy. • Providing exactly what is needed saves money and pays back handsomely in the long run. In
the UK, “raising adult numeracy and literacy would bring savings to the taxpayers of over £2.5 billion in respect of numeracy, and almost £0.5 billion in respect of literacy. Schuller, 2010.
What do they need?
Although the same people often have low literacy and low numeracy, some have low scores in only one domain (population aged 16 to 65)
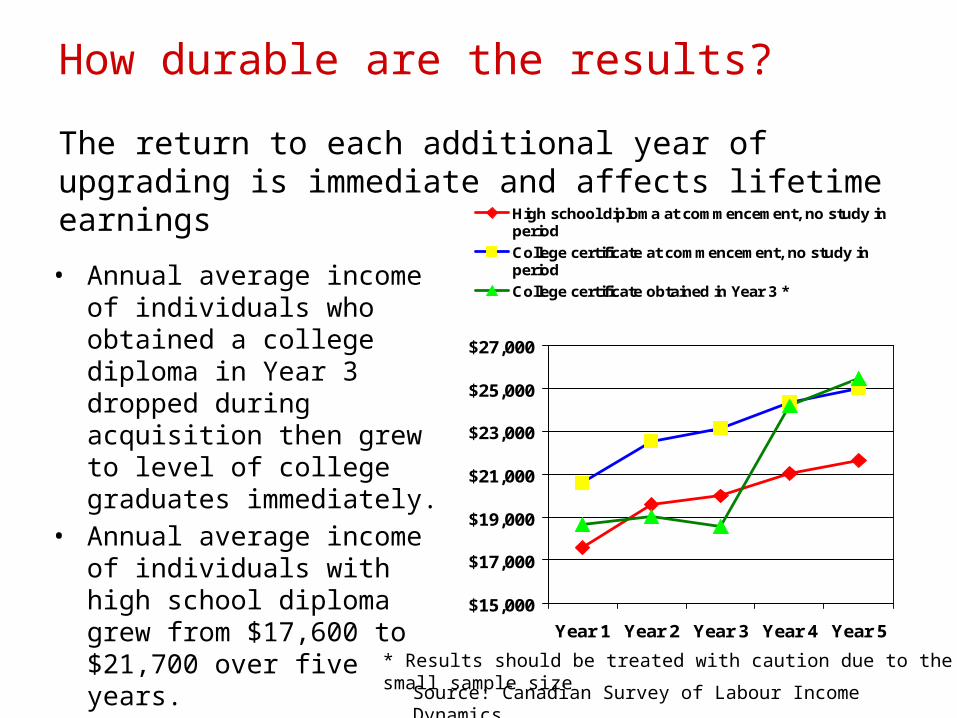
• Annual average income of individuals who obtained a college diploma in Year 3 dropped during acquisition then grew to level of college graduates immediately.
• Annual average income of individuals with high school diploma grew from $17,600 to $21,700 over five years.
$15,000
$17,000
$19,000
$21,000
$23,000
$25,000
$27,000
Year 1 Year 2 Year 3 Year 4 Year 5
High school diploma at commencement, no study inperiodCollege certificate at commencement, no study inperiodCollege certificate obtained in Year 3 *
Source: Canadian Survey of Labour Income Dynamics
How durable are the results?
The return to each additional year of upgrading is immediate and affects lifetime earnings
* Results should be treated with caution due to the small sample size
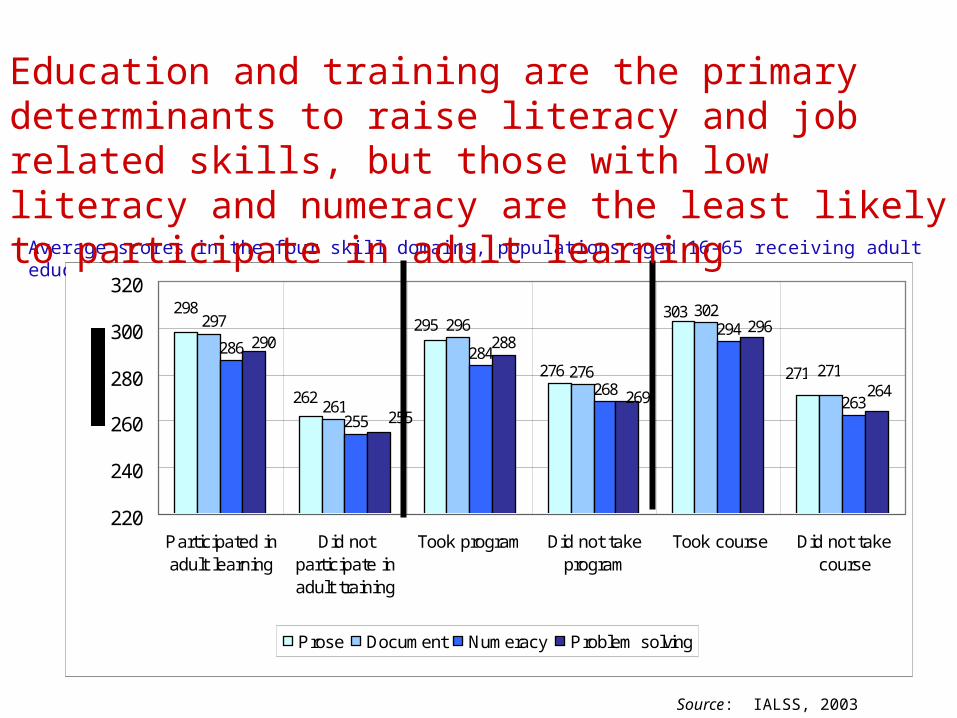
Average scores in the four skill domains, populations aged 16-65 receiving adult education and training, Canada, 2003
Source: IALSS, 2003
286
255
284
268
294288271
303
276
295
262
298
271
302
276
296
261
297
263264
296
269
290
255
220
240
260
280
300
320
Participated inadult learning
Did notparticipate inadult training
Took program Did not takeprogram
Took course Did not takecourse
Prose Document Numeracy Problem solving
Education and training are the primary determinants to raise literacy and job related skills, but those with low literacy and numeracy are the least likely to participate in adult learning
200
225
250
275
300
325
10 20 30 40 50 60 70
Age
Scale score
Canada Sw itzerland Italy Norw ay Bermuda United States
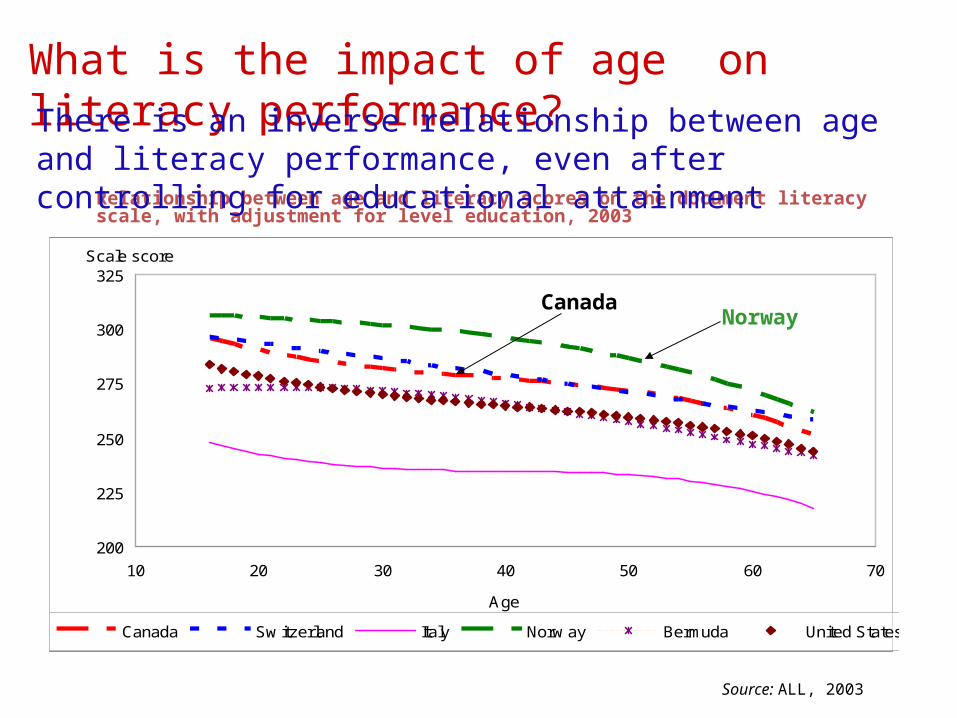
Relationship between age and literacy scores on the document literacy scale, with adjustment for level education, 2003
Source: ALL, 2003
CanadaNorway
What is the impact of age on literacy performance? There is an inverse relationship between age and literacy performance, even after controlling for educational attainment
Newfoundlan
d
Prince
Edward
Islan
d
Nova Sco
tia
New Brunsw
ick
Quebec
Ontario
Manito
ba
Saska
tchew
an
Alberta
British Columbia
Yuko
n
North /w
est Te
rritorie
s
Nunavut
Canad
a0
50
100
150
200
250
300
350
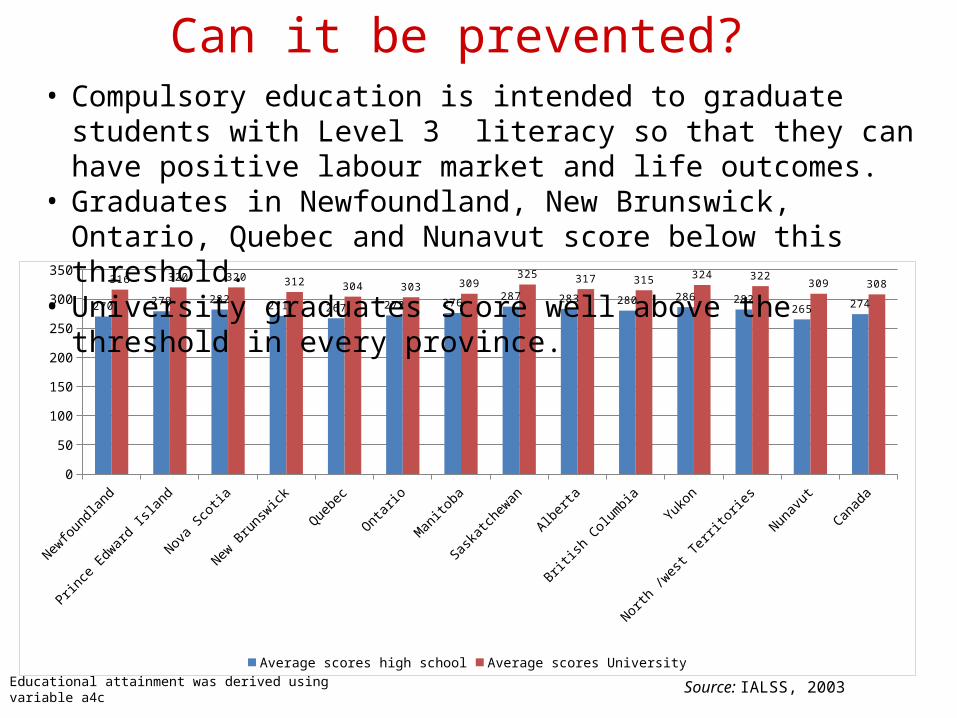
270279 282
271 267 272 276287 283 280 286 282
265 274
316 320 320 312 304 303 309325 317 315 324 322
309 308
Average scores high school Average scores UniversityEducational attainment was derived using variable a4c Source: IALSS, 2003
Can it be prevented? • Compulsory education is intended to graduate students with Level 3
literacy so that they can have positive labour market and life outcomes. • Graduates in Newfoundland, New Brunswick, Ontario, Quebec and
Nunavut score below this threshold. • University graduates score well above the threshold in every province.

Policy actions taken by governments• Federal Government Policy - Canada Job Grant:
Budget 2013. $500m per year. Goal is to match unemployed Canadians with more than 220,000 current job vacancies through skills training. Training upto $15,000 equally shared by provinces and employers. Applications are to be made by businesses to meet their needs and to train underemployed and unemployed workers and training provided by community colleges, trade union training centres, private career colleges and employers themselves.
• Provincial Government Policy - The Ontario Secondary School Literacy Test (OSSLT) Introduced in 2002, OSSLT is a compulsory standardized test for high school students in Ontario and must be passed to obtain the Ontario Secondary School Diploma. It is administered by the Education Quality and Accountability Office. In 2012, 82% were successful. Failed students can take the test again.

Policy actions taken by governmentsFederal Government research - Impact of literacy training on Business Success Indicators in the manufacturing small business sector: The goal is to provide evidence and tools for small business employers to make decisions for literacy and skill investments based on the potential improvement to their bottom line. The research will examine impacts for low literacy as well as high literacy enterprises with a view to future automation, expansion and modernization of equipment.
Federal and Provincial government Tools – PIAAC-on-line pre-test: OECD will publish the results of the Programme for International Assessment of Adult Competencies in late 2013. Following the results, a self administered tool will be created which will be pre-tested in Canada.

Thank you!Satya Brink