Embed Size (px)
Citation preview

Evolution of Secondary Aerosol in Polluted Air:
Case Studies for Tokyo and Beijing
Nobuyuki Takegawa
Takuma Miyakawa and Yutaka Kondo
RCAST, University of Tokyo
October 25, 2009
Acknowledgments
• M. Koike, H. Matsui, et al. (University of Tokyo)
• D. van Pinxteren, H. Herrmann (ifT)
• Y. Miyazaki (Hokkaido University)
• Y. Kanaya (JAMSTEC)
• A. Hofzumahaus, A. Wahner (FZJ)
• D. R. Blake (UC-Irvine)
• A. Takami, N. Sugimoto (NIES)
• T. Zhu, Y. H. Zhang (Peking University)
… and many other collaborators

Megacities, Pollution, and Climate
• Intensive campaigns in Tokyo (IMPACT) and Beijing (CAREBeijing) - the two largest megacities in Asia.
• Similarity and difference in the evolution of secondary aerosol between Tokyo and Beijing
Richter et al., Nature, 2005SCIAMACHY NO2 (Dec03-Nov04)
Beijing and many other cities
Tokyo
PRD
Seoul
Shanghai
• High concentrations of pollutants over Asia → Significant influence on regional air quality, radiation, and cloud formation.
• Megacities are “hot spots” of pollutants.
• Need to understand the physical/ chemical processes in megacities
• Formation of secondary aerosol is a key issue.

Vaporizer Filament
Turbo pumps
Chopper
TOF region
Aerodynamic lens
QMS
Excess flow (~9 L/min)
0.3 L/min 0.1 L/minSample flow (~9.4 L/min)
Isokineticmanifold
T-control module
CPC
DMA
Atomizer Calibration
PSL, NH4NO3, NaNO3, …
Critical orifice
Vaporizer Filament
Turbo pumps
Chopper
TOF region
Aerodynamic lens
QMS
Excess flow (~9 L/min)
0.3 L/min 0.1 L/minSample flow (~9.4 L/min)
Isokineticmanifold
T-control module
CPC
DMA
Atomizer Calibration
PSL, NH4NO3, NaNO3, …
Critical orifice
Aerodyne Aerosol Mass Spectrometer
• Real-time measurements of PM1 (< 1 µm) non-refractory aerosol (Jayne et al., 2000)
• Sizing by particle time-of-flight (calibrated by PSL)
• Chemical composition by EI-QMS (calibrated by NH4NO3)
• Performance of the AMS (Takegawa et al., AST, 2005, 2009)
Particle beam (aerodynamic lens)
Sizing (Particle-TOF)
Composition (QMS)
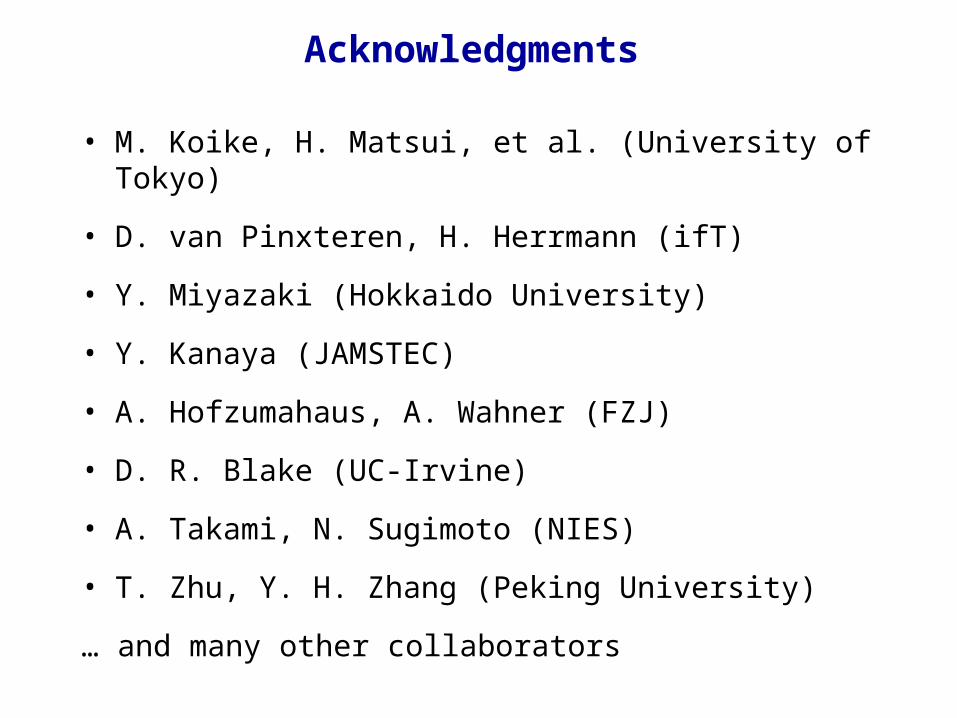
IMPACT Campaign (July-Aug 2004)
• Intensive measurements at an urban site and a rural site (50 km to the north).
• The airflow pattern was dominated by southerly (sea breeze) → the rural site was mostly downwind of the urban site.
• The Aerodyne AMS and many other instruments (SO2, NOx, NOy, CO, VOCs, OH/HO2, etc.) were deployed at both sites.
Sea breeze
Urban site
Export of polluted air (secondary aerosol formation)
Rural site (50 km north)
30 km

25
20
15
10
5
0
Su
lfat
e (
g m
-3)
0:008/9/2004
6:00 12:00 18:00 0:008/10/2004
Date and Time
Increase in Aerosol at the Downwind Site
Urban
Downwind
• Sulfate and organics were the major fractions of PM1.
• Large increase (and delay of peak appearance) in sulfate and organics was found at the downwind site compared to the urban site.
• Clearly illustrating photochemical production of secondary aerosol during transport.
SO2 + Oxidants (gas/aqueous) → Sulfate aerosol
VOCs + Oxidants (gas/aqueous) → OVOCs → Organic aerosol
Takegawa et al., GRL, 2006Miyakawa et al., JGR, 2008
30
25
20
15
10
5
0
Org
anic
s (
g m
-3)
0:008/9/2004
6:00 12:00 18:00 0:008/10/2004
Date and Time
OrganicsSulfate

Evolution of Aerosol Mass and Size
• Data were systematically classified by air mass age (estimated from NOx/NOy ratio).
• Large increase in the mass of sulfate and SOA in aged air (factors of ~2 and ~3)
• No significant changes in peak diameters (slight change in the width) with air mass aging
– Substantial amount of accumulation mode particles existed at age ~ 0 (← regional background)
Miyakawa et al., JGR, 2008
8
6
4
2
0
dM
/dlo
gD
va/
BC
102 3 4 5 6 7 8
1002 3 4 5 6 7 8
10002
Dva (nm)
Sulfate Age ~ 0 (urban) Age ~3 h (downwind) Age ~12 h (downwind)
1.6
1.4
1.2
1.0
0.8
0.6
0.4
0.2
0.0
dM
/dlo
gD
va/B
C
102 3 4 5 6 7 8
1002 3 4 5 6 7 8
10002
Dva (nm)
m/z 44 Age ~ 0 (urban) Age ~3 h (downwind) Age ~12 h (downwind)
Sulfate SOA marker (m/z 44)
~12-h aged
Fresh

Gas versus Aqueous Phase Processes
• The observed increase in sulfate: ~6 µg m-3 per 12 h
– Gas-phase oxidation of SO2 (~2 µg m-3 per 12 h) was substantial, but not sufficient
– Aqueous phase reaction in cloud droplets was also important
• Possible explanations for the small change in the mass peak diameters
– Sulfate or SOA formed in the gas phase were mostly condensed on the preexisting particles.
– Sulfate or SOA were produced in cloud droplets (the preexisting particles may act as CCN)
(A simple calculation suggests that only a small change in the peak diameter is expected in this case)
8
6
4
2
0
dM
/dlo
gD
va/
BC
102 3 4 5 6 7 8
1002 3 4 5 6 7 8
10002
Dva (nm)
Sulfate Age ~ 0 (urban) Age ~3 h (downwind) Age ~12 h (downwind)
The preexisting accumulation mode particles (especially condensation submode) may play an important role.
Condensation submode
Droplet submode

Characteristics of the Tokyo Outflow
• Study period: July-August 2004
• Temporal scale: < 1 day (diurnal variation dominated)
• Spatial scale: ~100 km
• Sulfate and SOA were the major fractions of PM1
• Large increases in the mass of sulfate and SOA with aging
– Factors of ~2 and ~3, respectively, after ~12 h
• No significant changes in the mass peak diameters with aging
– Possible influence from preexisting particles in regional background air even in Tokyo
– Origin of regional background air could be very much complicated (mixtures of various sources and processes in East Asia)
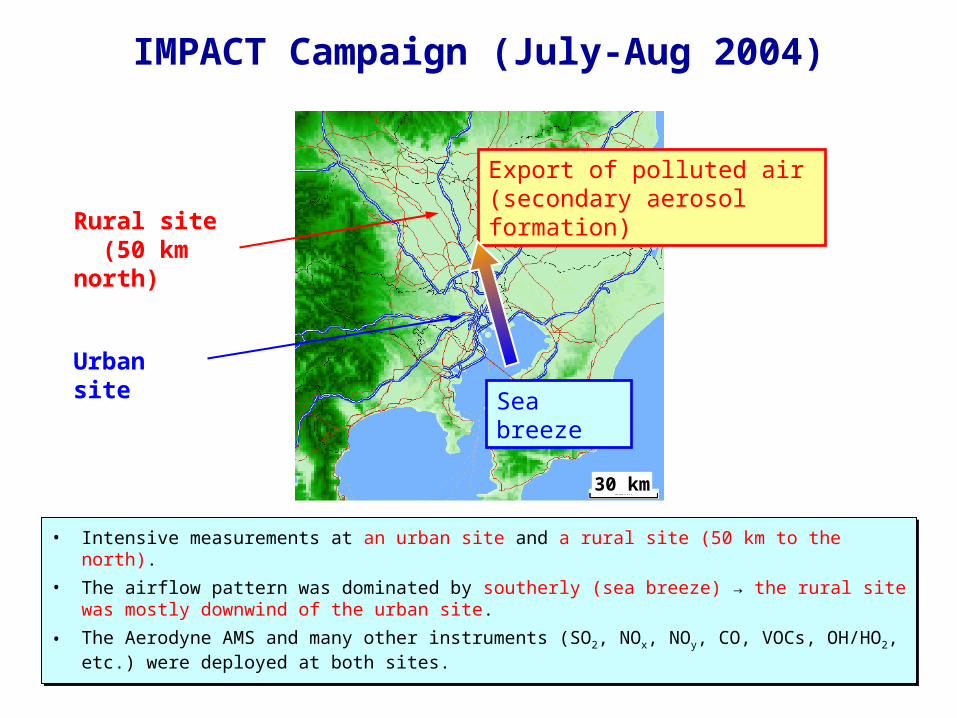
CAREBeijing Campaign (Aug-Sep 2006)
Yufa site
• Intensive measurements were made at an urban site and a rural site (~50 km south of the urban site)
• The AMS and many other advanced instruments were deployed at the rural site.
Google map
AMS at the Yufa site
Matsui et al., JGR, 2009
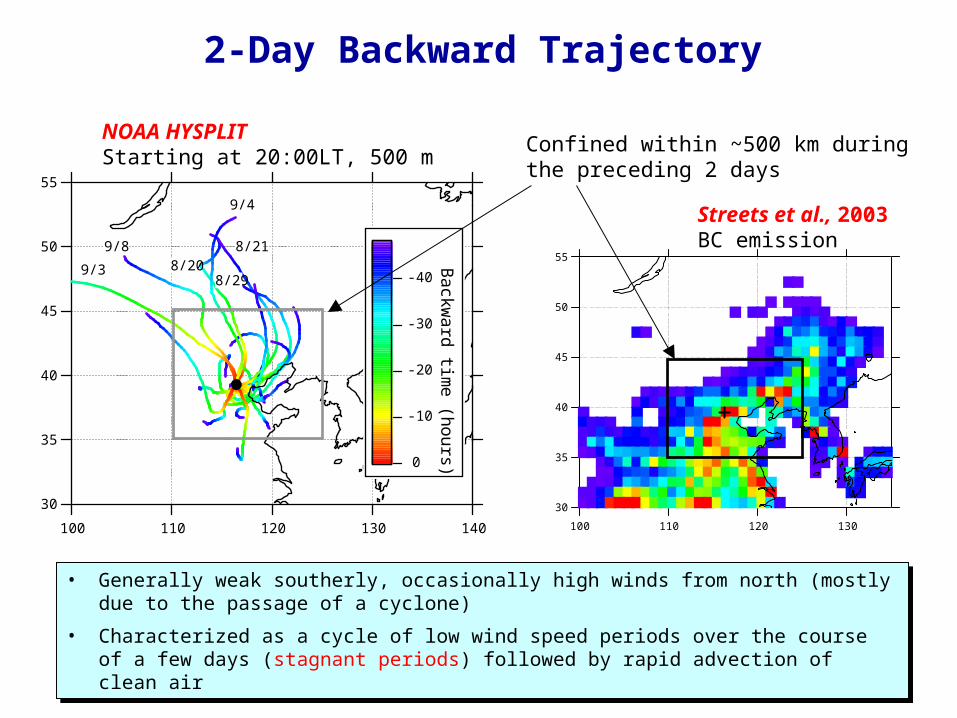
2-Day Backward Trajectory
NOAA HYSPLITStarting at 20:00LT, 500 m
• Generally weak southerly, occasionally high winds from north (mostly due to the passage of a cyclone)
• Characterized as a cycle of low wind speed periods over the course of a few days (stagnant periods) followed by rapid advection of clean air
• Generally weak southerly, occasionally high winds from north (mostly due to the passage of a cyclone)
• Characterized as a cycle of low wind speed periods over the course of a few days (stagnant periods) followed by rapid advection of clean air
55
50
45
40
35
30
140130120110100
-40
-30
-20
-10
0
Backw
ard time (hours)
8/208/21
9/4
9/8
9/38/29
Confined within ~500 km during the preceding 2 days
55
50
45
40
35
30
130120110100
Streets et al., 2003BC emission

8/18/2006 8/25/2006 9/1/2006 9/8/2006
Date and Time
50
40
30
20
10
0
Su
lfa
te (g
m-3
)
Sulfate Organics
Variability of Submicron Aerosol Mass
• Sulfate and organics were the major fractions of PM1 (similar to Tokyo and other cities).
• Variability of aerosol mass was observed to be associated with the cycle of stagnant period and clean air episode.
• Dominance of day-to-day variations over diurnal variations (regional scale).
• Sulfate and organics were the major fractions of PM1 (similar to Tokyo and other cities).
• Variability of aerosol mass was observed to be associated with the cycle of stagnant period and clean air episode.
• Dominance of day-to-day variations over diurnal variations (regional scale).
Clean air (cyclone)
Stagnant 1 Stagnant 2 Stagnant 3 Stagnant 4
Clean air Clean air (cyclone) Clean air (cyclone)
1 week
Takegawa et al., JGR, 2009
Takegawa et al., JGR, 2009
3.5
3.0
2.5
2.0
1.5
1.0
0.5
0.0
dM
/dlo
gD
va (g
m-3
)10
2 3 4 5 6 7 8100
2 3 4 5 6 7 81000
2
Dva (nm)
m/z 44 8/29 10:00-18:00 8/30 10:00-18:00 8/31 10:00-18:00 9/1 10:00-18:00
50
40
30
20
10
0
dM
/dlo
gD
va (g
m-3
)
102 3 4 5 6 7 8
1002 3 4 5 6 7 8
10002
Dva (nm)
Sulfate 8/29 10:00-18:00 8/30 10:00-18:00 8/31 10:00-18:00 9/1 10:00-18:00
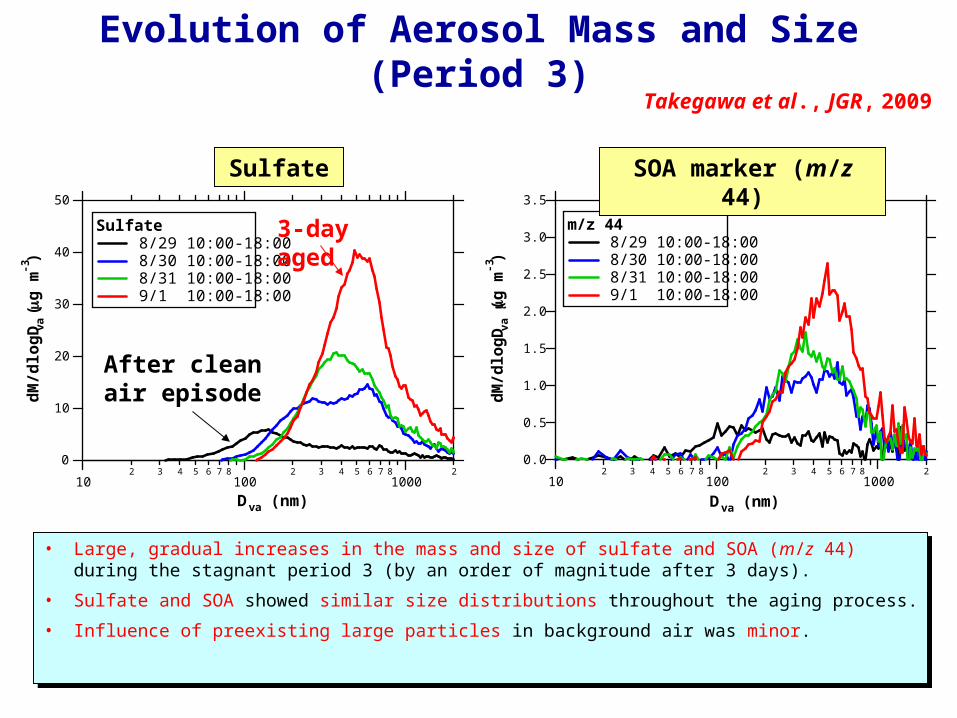
Evolution of Aerosol Mass and Size (Period 3)
• Large, gradual increases in the mass and size of sulfate and SOA (m/z 44) during the stagnant period 3 (by an order of magnitude after 3 days).
• Sulfate and SOA showed similar size distributions throughout the aging process.
• Influence of preexisting large particles in background air was minor.
• Large, gradual increases in the mass and size of sulfate and SOA (m/z 44) during the stagnant period 3 (by an order of magnitude after 3 days).
• Sulfate and SOA showed similar size distributions throughout the aging process.
• Influence of preexisting large particles in background air was minor.
Sulfate SOA marker (m/z 44)
3-day aged
After clean air episode

4
3
2
1
0
dM
/dlo
gD
va (g
m-3
)10
2 3 4 5 6 7 8100
2 3 4 5 6 7 81000
2
Dva (nm)
m/z 44 9/4 10:00-14:20 9/5 10:00-18:00 9/6 10:10-18:00 9/7 10:00-16:10
60
50
40
30
20
10
0
dM
/dlo
gD
va (g
m-3
)
102 3 4 5 6 7 8
1002 3 4 5 6 7 8
10002
Dva (nm)
2.0
1.5
1.0
0.5
0.0
Sulfate 9/4 10:00-14:20 (right axis)
9/5 10:00-18:00 9/6 10:10-18:00 9/7 10:00-16:10
Evolution of Aerosol Mass and Size (Period 4)
Sulfate SOA marker (m/z 44)
Similar features were found for the other periods
3-day aged

50
40
30
20
10
0
dM
/dlo
gD
va (g
m-3
)
102 3 4 5 6 7 8
1002 3 4 5 6 7 8
10002
Dva (nm)
Sulfate 8/29 10:00-18:00 8/30 10:00-18:00 8/31 10:00-18:00 9/1 10:00-18:00
Gas versus Aqueous Phase Processes
• The observed increase in sulfate (diurnal average): ~7 µg m-3 d-1
– Gas-phase oxidation of SO2 (diurnal average ~8 µg m-3 d-1) was sufficiently fast, but condensation alone cannot explain the observed feature.
• Gas and aqueous phase processes took place simultaneously and interactively
– New particle formation and fast growth by condensation supplied a large number of CCN in this region (Wiedensohler et al., JGR, 2009) → Enhance the cloud formation → …
– We may not be able to separate the importance of condensation and cloud process.
The rapid evolution of large (droplet mode) particles
An evidence for aqueous-phase reaction.
Growth of newly formed particles

Characteristics of the Beijing Regional Pollution
• Study period: August-September 2006
• Temporal scale: 3-4 days; Spatial scale: ~500 km– Much larger than the Tokyo case
• Sulfate and SOA showed similar size distributions throughout the aging process– Also found in Tokyo and other cities. Maybe a common feature in regions
of anthropogenic influence
• Large, gradual increases in the mass and size of sulfate and SOA during air mass stagnation (by an order of magnitude after 3-4 d)
• High concentrations of precursors, few preexisting particles, and stagnation of air masses may have resulted in complicated interaction of new particle formation, condensation, and cloud process– Significantly different from Tokyo. This is the most drastic evolution of
aerosol among those previously reported.

Future Directions
• More quantitative analysis of aerosol formation processes in/around megacities using a state-of-the-art 3D model
– Current models reproduce the mass of sulfate relatively well (a factor of ~2) but largely underestimate organics (a factor of ~5) (Matsui et al., JGR, 2009a, 2009b).
– Detailed size-resolved model should be incorporated because evolution of aerosol size is likely a key issue.
– Identification of important SOA precursors and their reaction pathways