Embed Size (px)
Citation preview

EVOLVING
A view from Len J. Krissa, Enbridge Pipelines Inc., Canada and Christophe Baeté, Elsyca n.v., Belgium, on CP and corrosion management of multiple pipeline right-of-ways.
External corrosion control becomes extremely challenging for multiple pipeline corridors that have been expanded over time with additional facilities. Effective cathodic protection (CP)
management relies on the correct analysis of accurate field data retrieved from each of the individual pipelines within the right-of-way (ROW). Conventional CP survey techniques often will not provide a sufficient level of distinction required to ascertain the adequacy of
Figure 1. Example of multiple pipeline ROW extension.
CP practices

CP. A more holistic and sophisticated approach is necessary to achieve efficient CP management of a multiple pipeline corridor.
Challenging unbalanced CP systemsCP of pipelines has demonstrated its value since the late 1940s. The effectiveness of the corrosion protection method is relatively well understood and straightforward for simple configurations, such as single pipelines or storage tanks. Newer grades of steel with less carbon and development of higher performance coating materials have generally improved the overall quality of the infrastructure, resulting in better resistance to external corrosion. However, the risk for external corrosion can increase when a pipeline network expansion is planned within an existing corridor. Each time a new pipeline is introduced within the corridor, significant changes in the electrical properties of the new network can occur and a shift in CP current distribution between lines is not unusual. This can create imbalance within the CP system, where back feeding of current can occur at rectifiers. Identifying the critical areas that cause the instability of the CP system is sometimes difficult to achieve with conventional CP evaluation techniques. The information collected on the pipelines are usually not discrete measurements that lead to inconsistent or unreliable results because:
) Measured ON potentials are rather mixed values.
) Cathodic/anodic current exchange may not stabilise within typical OFF cycle due to capacitive differences between the coatings.
) Measurements may be influenced by significant IR-drop because of residual currents flowing between the pipelines.
Additionally, high-voltage power lines may enter the ROW and cause alternating current (AC) induced corrosion. It has been established that control of AC corrosion must be done in conjunction with appropriate CP settings.
Enbridge operates the world’s longest and most complex crude oil and liquid hydrocarbon transportation system having close to 25 000 km (15 500 miles) of pipeline throughout North America. Areas of the mainline corridor contain up to seven parallel pipelines within the same ROW. The common practice with facility expansion has been to connect new pipelines into a CP system common with the existing lines. Upgrades are consequently made, which include installation of auxiliary systems to satisfy the increased current demand.
Presently, the ROW includes an assortment of pipeline vintages (1949 - 2008) with various diameters (12 - 48 in.) and coating types (coal tar, PE-taped, FBE and HPCC/HPPC), which has
consequently resulted in unbalanced CP levels. Variations in soil properties along the corridor, and the occurrence of inadvertent electrical shorting with grounding at motorised valve stations, have contributed to the complexity of the problem.
The holistic approachConsecutive inline inspection runs (MFL and US) have detected features with corrosion growth on both the legacy and expansion project pipelines within a mutual corridor. Consequently, Enbridge has adopted a more holistic approach for identifying the root cause of the corrosion attack and strategically implementing counter measures for stabilising the CP system.
Proper CP control requires knowledge on the coating condition, the soil properties and the current distribution along the pipeline, and the polarisation behaviour of the steel surface at coating defects. Conventional CP surveys do not reliably provide this information for such complex pipeline systems. Therefore, the following state-of-the-art technologies were applied:
) CP coupons with stationary reference cells and data loggers/RMUs.
) Soil resistivity surveys and soil maps.
) Remote monitoring of rectifier outputs.
) Inline cathodic current mapping inspection.
) Advanced computational modelling.
Figure 2. Holistic approach for CP managing of multiple pipeline corridors.
World Pipelines / REPRINTED FROM FEBRUARY 2016

The CP coupons provide native and ON/OFF potentials of the individual pipelines minimising the measurement error. They also provide information on the current demand of bare steel to achieve the desired protection level in soil surrounding the pipe. The soil resistivity survey and soil maps provide information on the type of soil and its corrosivity.
Predicting the corrosion and CP polarisation behaviour of the pipe is accomplished by combining the coupon data with soil information. The RMUs of the rectifiers monitor the total current output (current demand) of each individual pipeline in a specific region.
The inline cathodic current mapping inspection tool (smart pig) measures the voltage drop caused by the axial CP current that flows in the pipeline wall. The data set provides an appreciation of the coating condition, which is used to localise and quantify the current exchanged with other structures of influence (e.g. bonding between pipes, shorts to ground).
The field data, pipeline properties and the characteristics of the CP system are consolidated in a computational model that enables calculating true protection levels of the individual pipelines.
Connecting the dotsAdvances in electronics and portable power capacity over the past 20 years have now enabled unprecedented access to immense volumes of information that can be transmitted almost instantaneously from remote locations very economically. The ‘big data’ needs to be stored, visualised and, most importantly, analysed and evaluated in a practical and cost-efficient manner. Moreover, the abovementioned field data provides valuable information on individual parameters, but a correlation must be made between the data, which is not an easy task for such a complex system.
For example, the ON potential is determined by the coating resistance, soil resistivity and CP current distribution. The axial current is a result of the CP current distribution on the pipe, but does not provide information on whether or not the minimum pipe-to-soil potential of -850 mV or 100 mV polarisation shift is achieved at the pipe surface of a complex multiple pipeline corridor. An intelligent analysis tool is required to automatically treat the large set of data and unambiguously find correlations between the
pipeline and CP parameters to objectively draw the correct conclusions.
The Elsyca CatPro software is a BEM/FEM based computational tool that simulates the CP and corrosion behaviour of e.g. multiple pipeline corridors. The software connects the dots by integrating all the field data and system properties in a 3D physical model of the pipelines and CP components. All relevant parameters such as the exact pipeline routing based on GPS co-ordinates, location/geometry of anode beds, cabling to rectifiers, bonds between pipelines, drains to groundings etc. are assimilated. Such a model calculates the CP current distribution in the soil, and determines the polarisation level as a function of the coating resistance of the entire pipeline corridor.
Firstly, the coating resistance is estimated based on the coating type, pipeline vintage and local soil resistivity. The monitored current output of the rectifiers is applied in the model and an initial simulation is obtained that provides results on:
) Pipe-to-soil ON potential at grade level or at any depth.
) IR-free potential at pipeline surface.
) Current density leaving/entering the pipeline.
) Axial current through the pipe wall.
) Rectifier voltage and current output.
) Current through bonds and drains.
Parameters such as ON potential and current flow (axial current through the pipeline wall, rectifier output and current exchange through bonds and drains) are used to calibrate the model for the as-is condition. The simulation
Figure 3. 3D computational model of pipeline corridor with CP system (red line) and electrical shortings (green line).
REPRINTED FROM FEBRUARY 2016 / World Pipelines
results are again compared with the measured field data and if a discrepancy is identified further adjustments and refinement to the model is made.
Secondly, smaller pipeline sections are defined and the coating resistance of each section of the individual pipelines is adjusted until the simulation results are aligned with accurately measured field data. Persistent deviations are often explained by incorrect or missing field data and undocumented changes to the system. Typical examples are accidental drains, failed equipment or non-reported bonds or electrical shorting. Once clarified a baseline model with the correct distribution of the CP current is obtained. Multiple iterations and a continual integration of field data are required to obtain a realistic model of such a complex system. Some special algorithms are under development to automate this process.
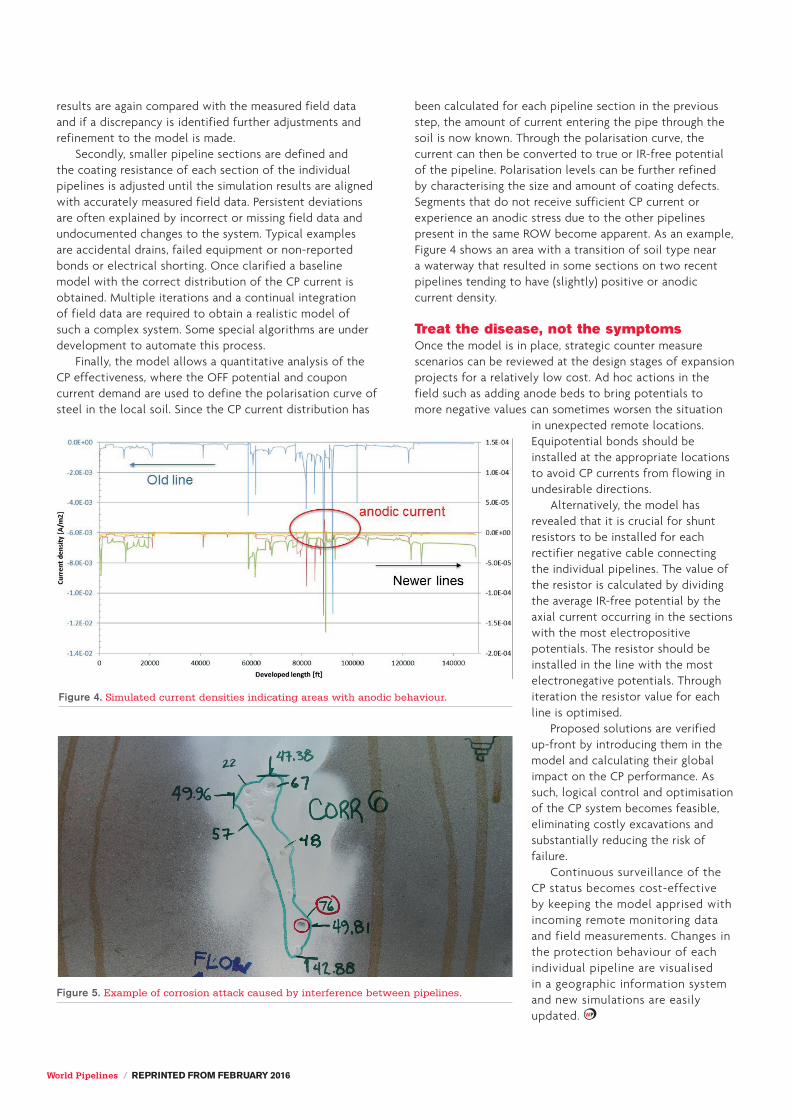
Finally, the model allows a quantitative analysis of the CP effectiveness, where the OFF potential and coupon current demand are used to define the polarisation curve of steel in the local soil. Since the CP current distribution has
been calculated for each pipeline section in the previous step, the amount of current entering the pipe through the soil is now known. Through the polarisation curve, the current can then be converted to true or IR-free potential of the pipeline. Polarisation levels can be further refined by characterising the size and amount of coating defects. Segments that do not receive sufficient CP current or experience an anodic stress due to the other pipelines present in the same ROW become apparent. As an example, Figure 4 shows an area with a transition of soil type near a waterway that resulted in some sections on two recent pipelines tending to have (slightly) positive or anodic current density.
Treat the disease, not the symptomsOnce the model is in place, strategic counter measure scenarios can be reviewed at the design stages of expansion projects for a relatively low cost. Ad hoc actions in the field such as adding anode beds to bring potentials to more negative values can sometimes worsen the situation
in unexpected remote locations. Equipotential bonds should be installed at the appropriate locations to avoid CP currents from flowing in undesirable directions.
Alternatively, the model has revealed that it is crucial for shunt resistors to be installed for each rectifier negative cable connecting the individual pipelines. The value of the resistor is calculated by dividing the average IR-free potential by the axial current occurring in the sections with the most electropositive potentials. The resistor should be installed in the line with the most electronegative potentials. Through iteration the resistor value for each line is optimised.
Proposed solutions are verified up-front by introducing them in the model and calculating their global impact on the CP performance. As such, logical control and optimisation of the CP system becomes feasible, eliminating costly excavations and substantially reducing the risk of failure.
Continuous surveillance of the CP status becomes cost-effective by keeping the model apprised with incoming remote monitoring data and field measurements. Changes in the protection behaviour of each individual pipeline are visualised in a geographic information system and new simulations are easily updated.
Figure 4. Simulated current densities indicating areas with anodic behaviour.
Figure 5. Example of corrosion attack caused by interference between pipelines.
World Pipelines / REPRINTED FROM FEBRUARY 2016