Embed Size (px)
Citation preview
Einzeilige HeadlineSubline unter einzeiliger Headline
Evonik Carbon Footprint 2014 Evonik Industries
2
Evonik Carbon Footprint
1 Summary ....................................................................................................................... 3
2 Methodology ................................................................................................................. 7
2.1 Organizational boundaries ..................................................................................... 7
2.2 Operational boundaries ......................................................................................... 8
3 Results .......................................................................................................................... 12
Greenhouse gas emission reductions from the use of products by Evonik
1 Summary ....................................................................................................................... 15
2 Methodology ................................................................................................................ 16
2.1 Greenhouse gas emission reductions from “green tire“ technology ......................... 18
2.2 Greenhouse gas emission reductions from amino acids in animal feed ...................... 19
2.3 Greenhouse gas emission savings from optimized insulation materials ..................... 21
2.4 Greenhouse gas emission savings from compact fluorescent lamps (CFLs) ............... 22
2.5 Greenhouse gas emission reductions from optimized hydraulic oils .......................... 23
3 Results ......................................................................................................................... 24
Appendix ...................................................................................................................... 25
Independent Assurance Report ................................................................................... 33
Content
3
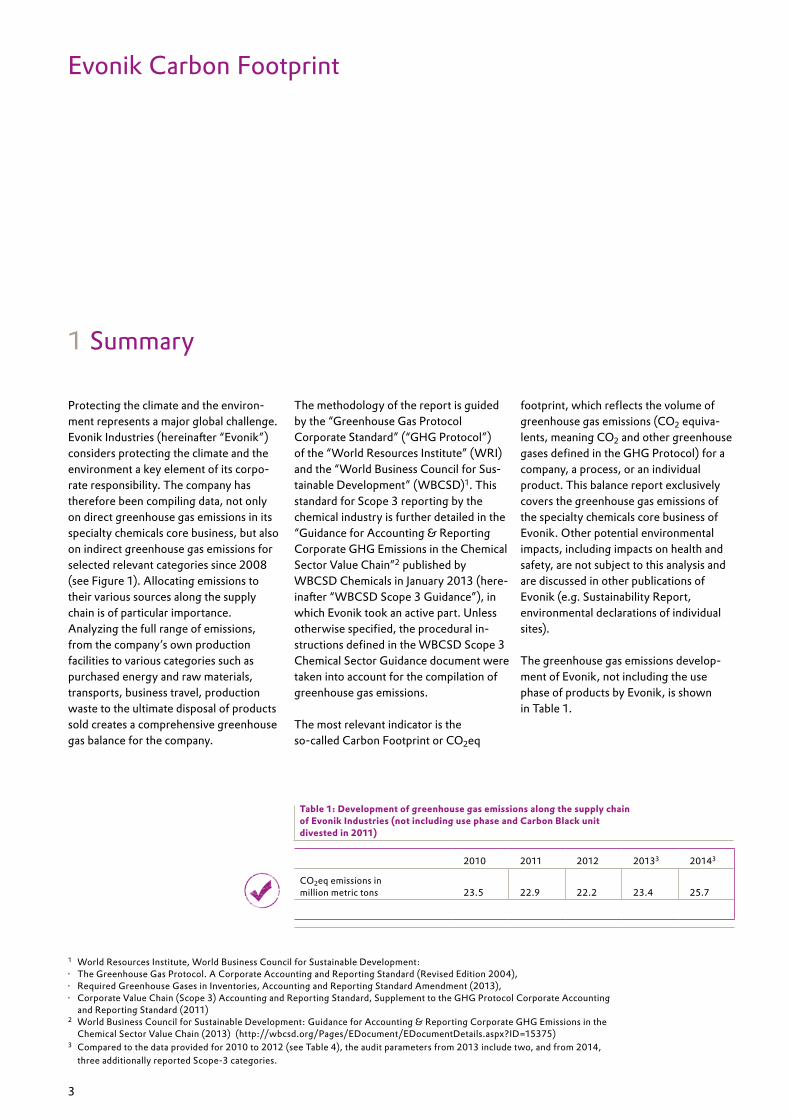
Protecting the climate and the environ-ment represents a major global challenge. Evonik Industries (hereinafter “Evonik”) considers protecting the climate and the environment a key element of its corpo-rate responsibility. The company has therefore been compiling data, not only on direct greenhouse gas emissions in its specialty chemicals core business, but also on indirect greenhouse gas emissions for selected relevant categories since 2008 (see Figure 1). Allocating emissions to their various sources along the supply chain is of particular importance. Analyzing the full range of emissions, from the company’s own production facilities to various categories such as purchased energy and raw materials, transports, business travel, production waste to the ultimate disposal of products sold creates a comprehensive greenhouse gas balance for the company.
The methodology of the report is guided by the “Greenhouse Gas Protocol Corporate Standard” (“GHG Protocol”) of the “World Resources Institute” (WRI) and the “World Business Council for Sus-tainable Development” (WBCSD)1. This standard for Scope 3 reporting by the chemical industry is further detailed in the “Guidance for Accounting & Reporting Corporate GHG Emissions in the Chemical Sector Value Chain”2 published by WBCSD Chemicals in January 2013 (here-inafter “WBCSD Scope 3 Guidance”), in which Evonik took an active part. Unless otherwise specified, the procedural in-structions defined in the WBCSD Scope 3 Chemical Sector Guidance document were taken into account for the compilation of greenhouse gas emissions.
The most relevant indicator is the so-called Carbon Footprint or CO2eq
footprint, which reflects the volume of greenhouse gas emissions (CO2 equiva-lents, meaning CO2 and other greenhouse gases defined in the GHG Protocol) for a company, a process, or an individual product. This balance report exclusively covers the greenhouse gas emissions of the specialty chemicals core business of Evonik. Other potential environmental impacts, including impacts on health and safety, are not subject to this analysis and are discussed in other publications of Evonik (e.g. Sustainability Report, environmental declarations of individual sites).
The greenhouse gas emissions develop-ment of Evonik, not including the use phase of products by Evonik, is shown in Table 1.
1 Summary
Evonik Carbon Footprint
1 World Resources Institute, World Business Council for Sustainable Development: · The Greenhouse Gas Protocol. A Corporate Accounting and Reporting Standard (Revised Edition 2004), · Required Greenhouse Gases in Inventories, Accounting and Reporting Standard Amendment (2013), · Corporate Value Chain (Scope 3) Accounting and Reporting Standard, Supplement to the GHG Protocol Corporate Accounting
and Reporting Standard (2011)2 World Business Council for Sustainable Development: Guidance for Accounting & Reporting Corporate GHG Emissions in the
Chemical Sector Value Chain (2013) (http://wbcsd.org/Pages/EDocument/EDocumentDetails.aspx?ID=15375)3 Compared to the data provided for 2010 to 2012 (see Table 4), the audit parameters from 2013 include two, and from 2014,
three additionally reported Scope-3 categories.
2010 2011 2012 20133 20143
CO2eq emissions in million metric tons 23.5 22.9 22.2 23.4 25.7
Table 1: Development of greenhouse gas emissions along the supply chain of Evonik Industries (not including use phase and Carbon Black unit divested in 2011)
4
Scope Category
Greenhouse gas emis-sions in 2014 [million metric tons CO2eq]
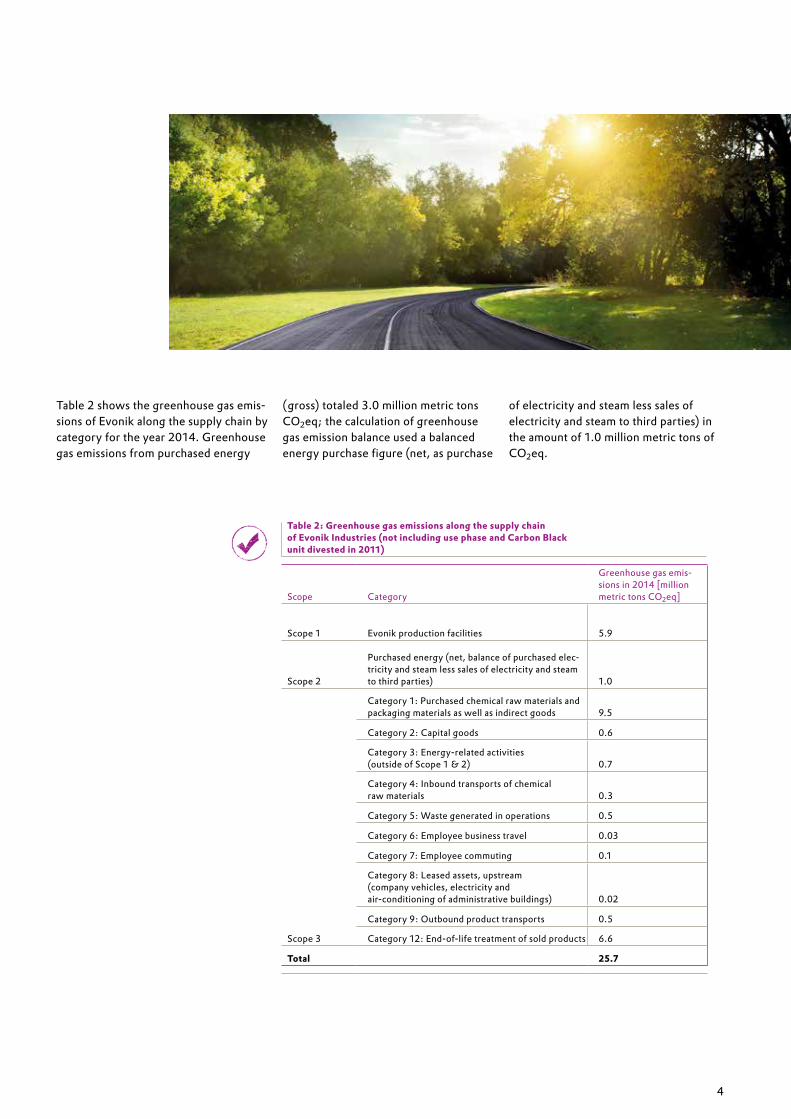
Scope 1 Evonik production facilities 5.9
Scope 2
Purchased energy (net, balance of purchased elec-tricity and steam less sales of electricity and steam to third parties) 1.0
Scope 3
Category 1: Purchased chemical raw materials and packaging materials as well as indirect goods 9.5
Category 2: Capital goods 0.6
Category 3: Energy-related activities (outside of Scope 1 & 2) 0.7
Category 4: Inbound transports of chemical raw materials 0.3
Category 5: Waste generated in operations 0.5
Category 6: Employee business travel 0.03
Category 7: Employee commuting 0.1
Category 8: Leased assets, upstream (company vehicles, electricity and air-conditioning of administrative buildings) 0.02
Category 9: Outbound product transports 0.5
Category 12: End-of-life treatment of sold products 6.6
Total 25.7
Table 2 shows the greenhouse gas emis-sions of Evonik along the supply chain by category for the year 2014. Greenhouse gas emissions from purchased energy
(gross) totaled 3.0 million metric tons CO2eq; the calculation of greenhouse gas emission balance used a balanced energy purchase figure (net, as purchase
of electricity and steam less sales of electricity and steam to third parties) in the amount of 1.0 million metric tons of CO2eq.
Table 2: Greenhouse gas emissions along the supply chain of Evonik Industries (not including use phase and Carbon Black unit divested in 2011)

5
The increase of greenhouse gas emis-sions in 2014 by 2.3 million metric tons CO2eq compared to the previous year is mainly attributable to the additional reporting categories for the purchase of indirect goods and packaging materials as well as capital goods that were not reported in previous years. The rise in reported Category 1 emissions is primarily associated with volume increases of purchased chemical raw materials and the addition of indirect goods and packaging materials. The increase of CO2eq emissions in the category “End-of-life treatment of sold products” is based on increased sales volumes. The other categories show no significant deviations from the figures of the previous year. According to the specifications of WBCSD Scope 3 Chemical Sector Guidance, Category 10,
“Processing of sold products” is not to be included in the balance. Due to the large number of products sold by Evonik, Category 11, “Use of sold products” is not balanced; in case of utilization by direct combustion (e.g. with fuel addi-tives), the emissions are considered in Category 12, “End-of-life treatment of sold products”.
Evonik’s participation in the Carbon Disclosure ProjectWith over 750 institutional investors, who jointly manage assets exceeding US$92 trillion, the Carbon Disclosure Project is currently the world’s largest and most important finance sector initia-tive to address climate change. The project collects data on all aspects of entrepreneurial action and their implementation in business activities
at an unprecedented level of detail. In 2014, Evonik as a publicly traded com-pany was invited to participate in the Investor CDP. With a grade of 91B, Evonik scored at a very high level, as the average grade across all participating companies from the DACH Region (Germany, Austria and Switzerland) is 69C.
The Group’s internal Life Cycle Manage-ment (LCM) team is responsible for the compilation of greenhouse gas emission data. It uses a variety of tools such as life cycle assessments to quantify sustainabil-ity and to establish the concept in busi-ness and decision-making processes. The LCM team is allocated to the Process Technology & Engineering Service Unit and closely cooperates with the strategic innovation unit, Creavis.

6
7
The Evonik Carbon Footprint was calculated in accordance with the full consolidation approach for the core business specialty chemicals, which was chosen to match the financial and envi-ronmental reporting of Evonik. Evonik is aware of the fact that this approach can lead to double-counting of greenhouse
gas emissions in cases when two or more companies holding shares of the same legal entity report their emissions.
Discontinued activities were not reported.
The GHG Protocol provides the methodological framework for calculating and reporting the Evonik Carbon Footprint.
2 Methodology
2.1 Organizational boundaries
4 Intergovernmental Panel on Climate Change (IPCC): Fourth Assessment Report (AR4): Climate Change 2007 - The Physical Science Basis, Chapter 2, Table 2.14
It contains a guideline for quantifying and reporting of greenhouse gases based on the following principles:• Relevance• Completeness• Consistency• Transparency and• Accuracy.
Greenhouse gases are converted with the help of specified CO2 equivalence factors4 and then summarized as CO2 equivalents (CO2eq). The WBCSD Scope 3 Chemical Sector Guidance published in January 2013 describes standard proce-dures for implementing the requirements of the GHG Protocol in Scope 3 reporting of the chemical industry.
8
2.2 Operational boundaries
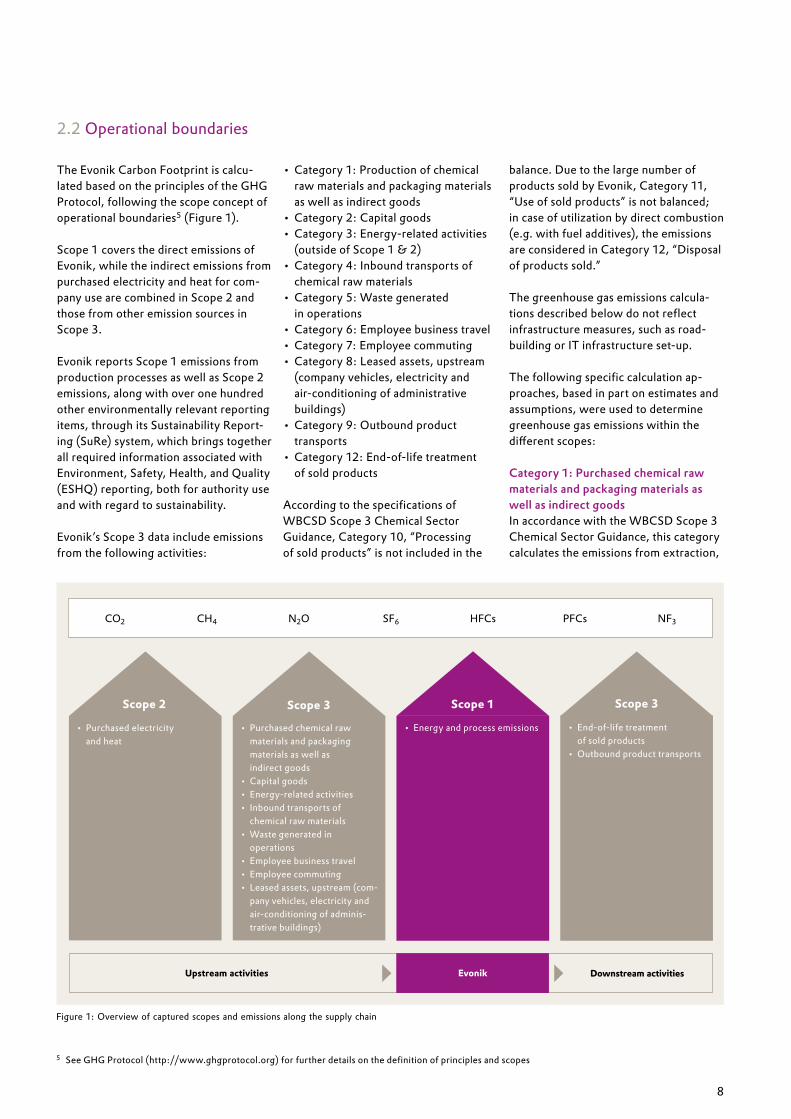
The Evonik Carbon Footprint is calcu-lated based on the principles of the GHG Protocol, following the scope concept of operational boundaries5 (Figure 1).
Scope 1 covers the direct emissions of Evonik, while the indirect emissions from purchased electricity and heat for com-pany use are combined in Scope 2 and those from other emission sources in Scope 3.
Evonik reports Scope 1 emissions from production processes as well as Scope 2 emissions, along with over one hundred other environmentally relevant reporting items, through its Sustainability Report-ing (SuRe) system, which brings together all required information associated with Environment, Safety, Health, and Quality (ESHQ) reporting, both for authority use and with regard to sustainability.
Evonik’s Scope 3 data include emissions from the following activities:
• Category 1: Production of chemical raw materials and packaging materials as well as indirect goods
• Category 2: Capital goods • Category 3: Energy-related activities
(outside of Scope 1 & 2) • Category 4: Inbound transports of
chemical raw materials• Category 5: Waste generated
in operations• Category 6: Employee business travel• Category 7: Employee commuting• Category 8: Leased assets, upstream
(company vehicles, electricity and air-conditioning of administrative buildings)
• Category 9: Outbound product transports
• Category 12: End-of-life treatment of sold products
According to the specifications of WBCSD Scope 3 Chemical Sector Guidance, Category 10, “Processing of sold products” is not included in the
balance. Due to the large number of products sold by Evonik, Category 11, “Use of sold products” is not balanced; in case of utilization by direct combustion (e.g. with fuel additives), the emissions are considered in Category 12, “Disposal of products sold.”
The greenhouse gas emissions calcula-tions described below do not reflect infrastructure measures, such as road-building or IT infrastructure set-up.
The following specific calculation ap-proaches, based in part on estimates and assumptions, were used to determine greenhouse gas emissions within the different scopes:
Category 1: Purchased chemical raw materials and packaging materials as well as indirect goodsIn accordance with the WBCSD Scope 3 Chemical Sector Guidance, this category calculates the emissions from extraction,
5 See GHG Protocol (http://www.ghgprotocol.org) for further details on the definition of principles and scopes
Figure 1: Overview of captured scopes and emissions along the supply chain
• Purchased electricity and heat
Scope 2
• Purchased chemical raw materials and packaging materials as well as indirect goods
• Capital goods• Energy-related activities• Inbound transports of
chemical raw materials• Waste generated in
operations• Employee business travel• Employee commuting• Leased assets, upstream (com-
pany vehicles, electricity and air-conditioning of adminis-trative buildings)
• Energy and process emissions • End-of-life treatment of sold products
• Outbound product transports
Scope 3 Scope 1 Scope 3
EvonikUpstream activities Downstream activities
CO2 CH4 N2O SF6 HFCs PFCs NF3
9
production and transports of chemical raw materials, packaging materials and indirect goods (except the transports to Evonik reported in Category 4). In deviation from the WBCSD Scope 3 Chemical Sector Guidance, the calcula-tion does not include emissions from services purchased.
Chemical raw materialsThe calculation of the CO2eq burden is based on a list of all chemical raw materi-als provided by Evonik Procurement, referencing the 100 most frequently purchased raw materials by volume. An extrapolation of greenhouse gas emissions was performed on the basis of raw material volumes. The 100 raw materials considered represent a significantly higher coverage than the 80% mandated by the WBCSD Scope 3 Chemical Sector Guidance.
thinkstep AG then identified the current emission factors for the raw materials from the GaBi 6 database (version dated 2013) that could be used to calculate the CO2eq burden with consideration for purchased volumes. The determination of emission factors relied on geographi-cally representative factors where available. Otherwise, average values of multiple countries (e.g. EU) were used, while country-specific individual data records only were consulted as a last resort. The purpose of this approach was to minimize potential uncertainties with regard to regional differences in produc-tion processes and energy generation. In cases where emission factors of specific substances were unknown, thinkstep AG estimated an emission factor based on similar products or applied an appropriate mean emission factor.
The relevance of the calculation approach based on purchased tonnage was confirmed in 2012. An alternative calculation using the specific cost of raw materials did not prove effective.
Indirect goods and packaging materials:Emissions from the production of indirect goods and packaging were reported for the first time for year 2014; however, this category does not include emissions from services purchased.
We are currently developing a method for the future reporting of emissions from services.
The calculation of emissions for the production of purchased goods, except chemical raw materials, is based on a categorized compilation of procurement volumes of indirect purchases and packaging materials. This data includes both purchases of consumable goods and capital goods. Procurement was respon-sible for dividing the individual catego-ries into the reporting categories 1 (raw materials purchased) and 2 (capital goods). Analog to the evaluation of chemical raw materials, the top 100 categories were analyzed by procure-ment volume. An extrapolation of green-house gas emissions was performed on the basis of procurement volumes. The 100 categories considered represent a coverage of 80%, as mandated by the WBCSD Scope 3 Chemical Sector Guid-ance.
The purchased material volumes were calculated based on procurement values, using mean average prices. Current emission factors were then identified from the GaBi 6 database (version dated 2014) to calculate emissions from the production of indirect goods.
Category 2: Capital goodsThe emissions calculation for capital goods is also based on the data of indi-rect purchasing. The purchase categories were divided into procurement of capital goods and procurement of additional in-direct goods. The latter are reported in Category 1, while emissions for capital goods are reported in Category 2. The top 100 categories were again analyzed by procurement volume. An extrapolation of greenhouse gas emissions was performed on the basis of procurement volumes. The 100 catego-ries considered represent a coverage of 80%, as mandated by the WBCSD Scope 3 Chemical Sector Guidance. As suggest-ed in the Guidance, the materials were divided by procurement category.
The quantities included in procurement volumes were determined with the help of mean average prices. Material-specif-ic, current emission factors were then
identified from the GaBi 6 database (ver-sion dated 2014) to calculate emissions from the production of capital goods.
Category 3: Energy-related activities (outside of Scope 1 & 2)Category 3 reports emissions from pro-ducing solid, liquid, and gaseous energy sources that are used in the power plants operated by Evonik. These are not taken into account in Scopes 1 & 2. Further-more, emissions from the provision of energy sources for purchased energy are included neither in Scope 2 nor in Scope 3. The calculation is based on the pro-duced energy volumes recorded in the SuRe system. The determination of greenhouse gas emissions for the pro-duction of solid, liquid, and gaseous en-ergy sources relied on emission factors from the GaBi 6 database (2013 version).
Category 4: Inbound transports of chemical raw materialsSince Evonik does not have exact infor-mation about transport distances and shipping means for inbound raw materials, a mean emission factor per metric ton of transported product was calculated to determine the emissions of inbound goods transports on the basis of data for outbound transports. It assumes a mean distribution of different means of transport and distances of outbound Evonik product transports. The use of this mean emission factor is based on the assumption that the averaged transport means and distances are applicable to both inbound and outbound transports of Evonik. The emission factors for the various transport methods came from the European Chemical Industry Council (CEFIC)6. Since these emission factors do account for the provision of fuels, an additional share was included. Transport emissions were determined for the ex-trapolated raw material volumes (see Category 1).
Category 5: Emissions from waste gen-erated in operationsThe emissions from production waste disposal were calculated on the basis of the SuRe system data on the waste vol-umes per disposal type. Emission factors for the specific disposal types were se-lected analog to the end-of-life calcula-tion in Category 12. The WBCSD Scope
6 McKinnon, Prof. Alan; Piecyk, Dr. Maja: “Measuring and Managing CO2 Emissions of European Chemical Transport,” Logistics Research Centre, Heriot-Watt University, EDINBURGH, UK, 2011
10
7 Department for Environment, Food and Rural Affairs, http://archive.defra.gov.uk/environment/business/reporting/pdf/110707-guidelines-ghg-conversion-factors.pdf
3 Chemical Sector Guidance specifies that waste used for internal energy pro-duction is to be balanced in Scope 1. For example, the Marl site uses energy from its special waste incineration plant. Since the data does not permit a separation of waste processed internally and external-ly, all emissions were balanced in Cat-egory 5 in deviation from the WBCSD Scope 3 Chemical Sector Guidance. This calculation also includes emissions from the disposal of construction and demoli-tion waste.
Category 6: Employee business travelThe CO2eq emissions caused by business travel were calculated on the basis of data about travelling distances provided by Travel Management, using the corre-sponding emission factors for all means of transport. The calculation of green-house gas emissions was performed in Germany and was extrapolated based on the global number of employees.
Category 7: Employee commutingThe emissions caused by commuting to and from work were calculated conserv-atively in accordance with the assump-tions from the WBCSD Scope 3 Chemi-cal Sector Guidance: All Evonik employees use a private vehicle to com-mute an estimated distance of 30 km one way (60 km round-trip per day) on 220 workdays. The emission factor per per-
son-kilometer was based on the data of DEFRA7 in accordance with the WBCSD Scope 3 Chemical Sector Guidance.
Category 8: Leased assets, upstreamCompany cars (w/o utility vehicles):The CO2eq emissions of Evonik company cars were calculated using data about the average distance travelled, the total num-ber of company cars, manufacturer data on CO2eq emissions (with 25% added) and additional allowances for car manu-facturing and the provision of fuel. Again, this calculation was performed for Germany and was extrapolated based on the global number of employees.
Electricity and air-conditioning needs of administrative buildings: CO2eq emissions from electricity and air-conditioning of administrative buildings are already included in the SuRe system and accordingly, in Scope 1 and Scope 2 emissions for production facilities that are subject to regulatory CO2eq report-ing requirements. At purely administra-tive sites, greenhouse gas emissions were determined based on the average electricity and air-conditioning needs per employee compiled at a few essential ad-ministrative sites. Using the employee numbers of the administrative sites thus allowed for calculating all CO2eq emis-sions of this category.
Category 9: Outbound product transportsThe CO2eq emissions of outbound chemical product transports were calculated with CEFIC emission factors as recommended in the WBCSD Scope 3 Chemical Sector Guidance. The calcula-tions were based on total outbound volumes, average transport distances, and the selected means of transport.
Category 12: End-of-life treatment of sold productsThe emissions caused by the disposal of products by Evonik were calculated with the steps outlined below. Since Evonik does not always know the final applica-tion of its products–particularly in case of intermediates–, end-of-life emissions were not calculated for the applications per se, but only for their share of prod-ucts by Evonik. That means end-of-life emissions were calculated only for the product volume sold by Evonik, not for the applications produced from them with the help of third-party raw materials. CO2eq emissions were calculated based on emission factors for the following disposal methods:
• Recycling, • Sanitary and open landfills, and• Incineration with and without energy
recovery.

11
Continent-specific percentage averages were calculated for every disposal meth-od, which were then applied to the rela-tive shares of all products sold by Evonik in 2014 on each continent.
CO2eq emissions for disposal were calcu-lated on the basis of the sales volume of each product line and the corresponding emission factors. Additionally, specific
calculations following the recommenda-tions of the WBCSD Scope 3 Chemical Sector Guidance were performed for numerous product lines in which prod-ucts are clearly not disposed in conven-tional ways: For example, emissions from the incineration of products were deter-mined with stoichiometric calculations and a separate analysis was applied to inert products.
12
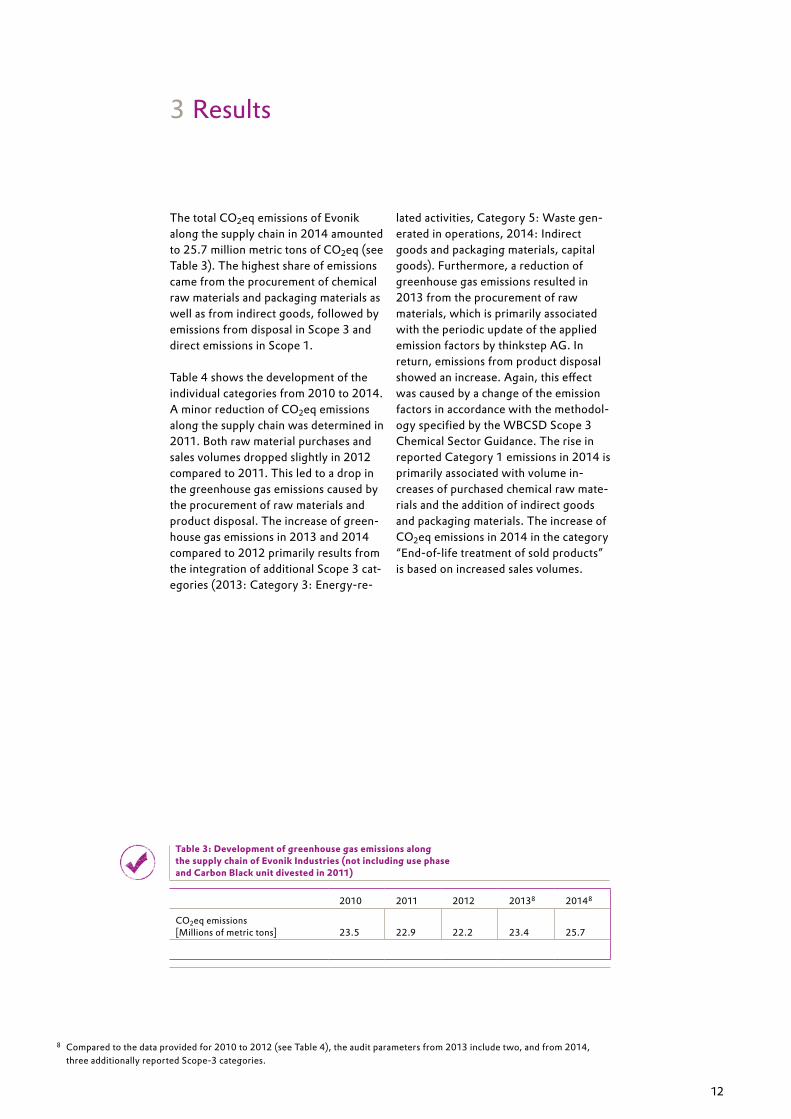
The total CO2eq emissions of Evonik along the supply chain in 2014 amounted to 25.7 million metric tons of CO2eq (see Table 3). The highest share of emissions came from the procurement of chemical raw materials and packaging materials as well as from indirect goods, followed by emissions from disposal in Scope 3 and direct emissions in Scope 1.
Table 4 shows the development of the individual categories from 2010 to 2014. A minor reduction of CO2eq emissions along the supply chain was determined in 2011. Both raw material purchases and sales volumes dropped slightly in 2012 compared to 2011. This led to a drop in the greenhouse gas emissions caused by the procurement of raw materials and product disposal. The increase of green-house gas emissions in 2013 and 2014 compared to 2012 primarily results from the integration of additional Scope 3 cat-egories (2013: Category 3: Energy-re-
lated activities, Category 5: Waste gen-erated in operations, 2014: Indirect goods and packaging materials, capital goods). Furthermore, a reduction of greenhouse gas emissions resulted in 2013 from the procurement of raw materials, which is primarily associated with the periodic update of the applied emission factors by thinkstep AG. In return, emissions from product disposal showed an increase. Again, this effect was caused by a change of the emission factors in accordance with the methodol-ogy specified by the WBCSD Scope 3 Chemical Sector Guidance. The rise in reported Category 1 emissions in 2014 is primarily associated with volume in-creases of purchased chemical raw mate-rials and the addition of indirect goods and packaging materials. The increase of CO2eq emissions in 2014 in the category “End-of-life treatment of sold products” is based on increased sales volumes.
3 Results
2010 2011 2012 20138 20148
CO2eq emissions [Millions of metric tons] 23.5 22.9 22.2 23.4 25.7
Table 3: Development of greenhouse gas emissions along the supply chain of Evonik Industries (not including use phase and Carbon Black unit divested in 2011)
8 Compared to the data provided for 2010 to 2012 (see Table 4), the audit parameters from 2013 include two, and from 2014, three additionally reported Scope-3 categories.
13
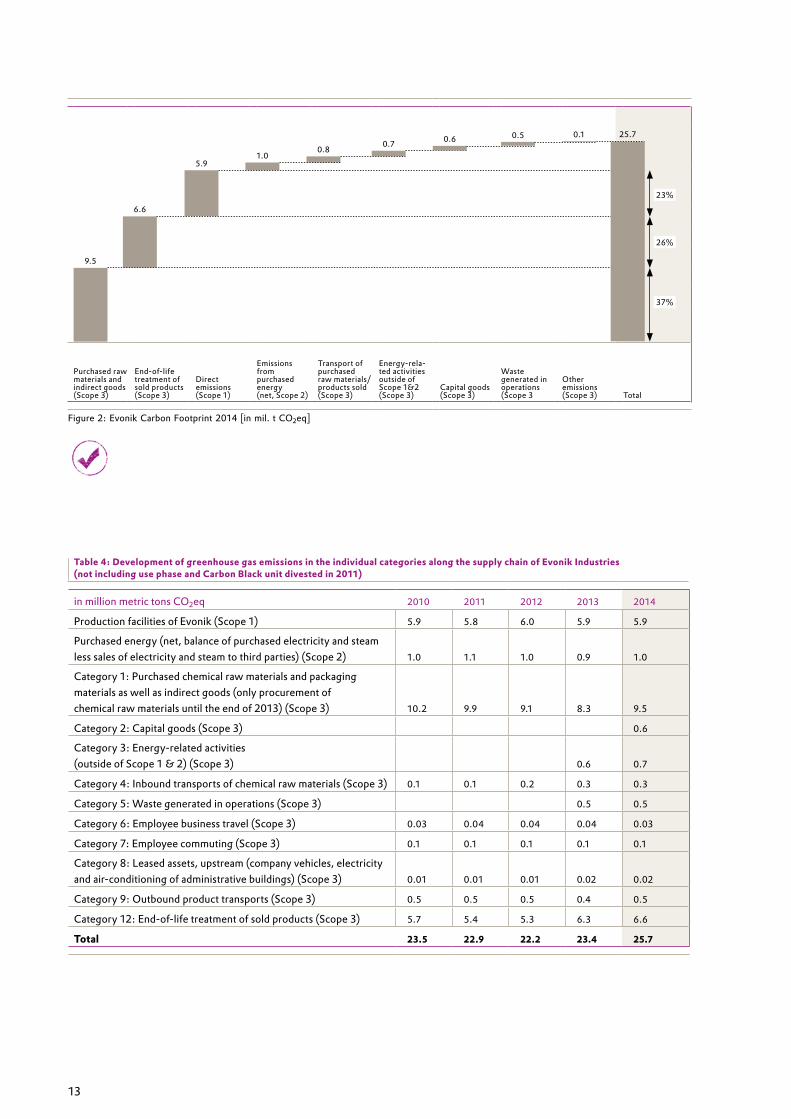
Table 4: Development of greenhouse gas emissions in the individual categories along the supply chain of Evonik Industries (not including use phase and Carbon Black unit divested in 2011)
in million metric tons CO2eq 2010 2011 2012 2013 2014
Production facilities of Evonik (Scope 1) 5.9 5.8 6.0 5.9 5.9
Purchased energy (net, balance of purchased electricity and steam less sales of electricity and steam to third parties) (Scope 2) 1.0 1.1 1.0 0.9 1.0
Category 1: Purchased chemical raw materials and packaging materials as well as indirect goods (only procurement of chemical raw materials until the end of 2013) (Scope 3) 10.2 9.9 9.1 8.3 9.5
Category 2: Capital goods (Scope 3) 0.6
Category 3: Energy-related activities (outside of Scope 1 & 2) (Scope 3) 0.6 0.7
Category 4: Inbound transports of chemical raw materials (Scope 3) 0.1 0.1 0.2 0.3 0.3
Category 5: Waste generated in operations (Scope 3) 0.5 0.5
Category 6: Employee business travel (Scope 3) 0.03 0.04 0.04 0.04 0.03
Category 7: Employee commuting (Scope 3) 0.1 0.1 0.1 0.1 0.1
Category 8: Leased assets, upstream (company vehicles, electricity and air-conditioning of administrative buildings) (Scope 3) 0.01 0.01 0.01 0.02 0.02
Category 9: Outbound product transports (Scope 3) 0.5 0.5 0.5 0.4 0.5
Category 12: End-of-life treatment of sold products (Scope 3) 5.7 5.4 5.3 6.3 6.6
Total 23.5 22.9 22.2 23.4 25.7
Purchased raw materials and indirect goods (Scope 3)
End-of-life treatment of sold products (Scope 3)
Direct emissions (Scope 1)
Emissions from purchased energy (net, Scope 2)
Transport of purchased raw materials/products sold (Scope 3)
Energy-rela-ted activities outside of Scope 1&2 (Scope 3)
Capital goods (Scope 3)
Waste generated in operations (Scope 3
Other emissions (Scope 3) Total
9.5
6.6
5.91.0
0.8 0.725.7
26%
37%
23%
0.6 0.5 0.1
Figure 2: Evonik Carbon Footprint 2014 [in mil. t CO2eq]

14
15
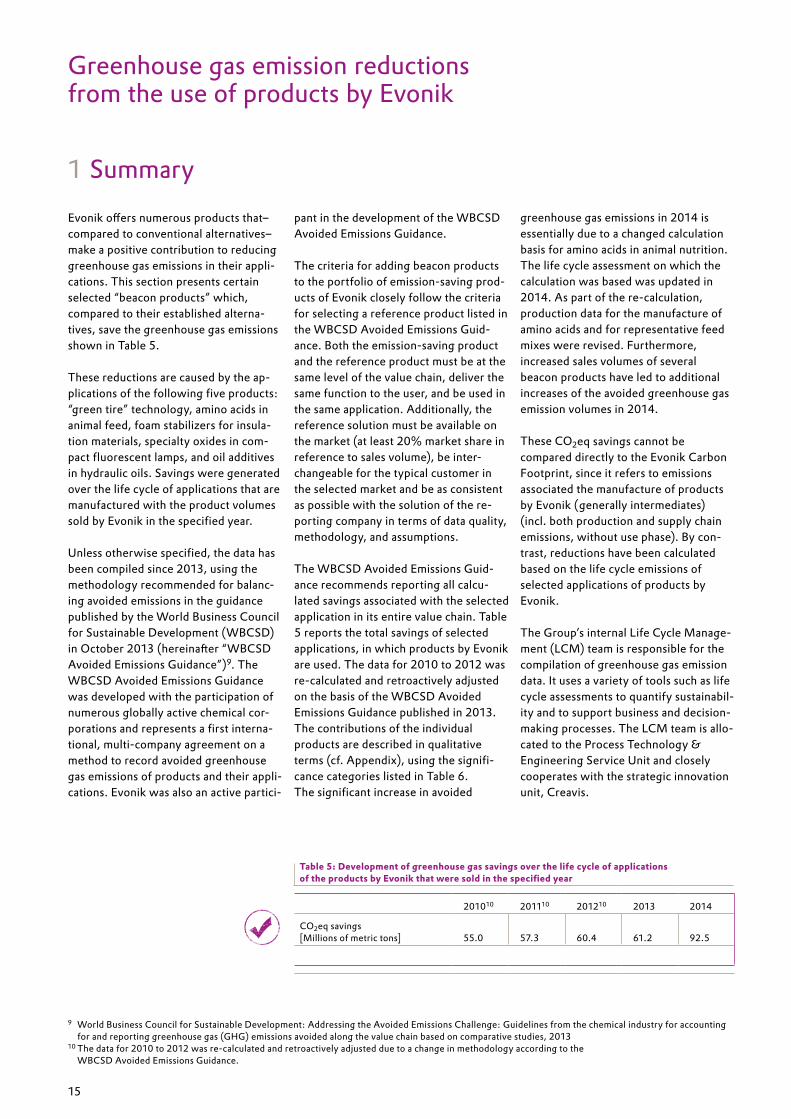
Evonik offers numerous products that–compared to conventional alternatives–make a positive contribution to reducing greenhouse gas emissions in their appli-cations. This section presents certain selected “beacon products” which, compared to their established alterna-tives, save the greenhouse gas emissions shown in Table 5.
These reductions are caused by the ap-plications of the following five products: “green tire” technology, amino acids in animal feed, foam stabilizers for insula-tion materials, specialty oxides in com-pact fluorescent lamps, and oil additives in hydraulic oils. Savings were generated over the life cycle of applications that are manufactured with the product volumes sold by Evonik in the specified year.
Unless otherwise specified, the data has been compiled since 2013, using the methodology recommended for balanc-ing avoided emissions in the guidance published by the World Business Council for Sustainable Development (WBCSD) in October 2013 (hereinafter “WBCSD Avoided Emissions Guidance”)9. The WBCSD Avoided Emissions Guidance was developed with the participation of numerous globally active chemical cor-porations and represents a first interna-tional, multi-company agreement on a method to record avoided greenhouse gas emissions of products and their appli-cations. Evonik was also an active partici-
pant in the development of the WBCSD Avoided Emissions Guidance.
The criteria for adding beacon products to the portfolio of emission-saving prod-ucts of Evonik closely follow the criteria for selecting a reference product listed in the WBCSD Avoided Emissions Guid-ance. Both the emission-saving product and the reference product must be at the same level of the value chain, deliver the same function to the user, and be used in the same application. Additionally, the reference solution must be available on the market (at least 20% market share in reference to sales volume), be inter-changeable for the typical customer in the selected market and be as consistent as possible with the solution of the re-porting company in terms of data quality, methodology, and assumptions.
The WBCSD Avoided Emissions Guid-ance recommends reporting all calcu-lated savings associated with the selected application in its entire value chain. Table 5 reports the total savings of selected applications, in which products by Evonik are used. The data for 2010 to 2012 was re-calculated and retroactively adjusted on the basis of the WBCSD Avoided Emissions Guidance published in 2013. The contributions of the individual products are described in qualitative terms (cf. Appendix), using the signifi-cance categories listed in Table 6. The significant increase in avoided
greenhouse gas emissions in 2014 is essentially due to a changed calculation basis for amino acids in animal nutrition. The life cycle assessment on which the calculation was based was updated in 2014. As part of the re-calculation, production data for the manufacture of amino acids and for representative feed mixes were revised. Furthermore, increased sales volumes of several beacon products have led to additional increases of the avoided greenhouse gas emission volumes in 2014.
These CO2eq savings cannot be compared directly to the Evonik Carbon Footprint, since it refers to emissions associated the manufacture of products by Evonik (generally intermediates) (incl. both production and supply chain emissions, without use phase). By con-trast, reductions have been calculated based on the life cycle emissions of selected applications of products by Evonik.
The Group’s internal Life Cycle Manage-ment (LCM) team is responsible for the compilation of greenhouse gas emission data. It uses a variety of tools such as life cycle assessments to quantify sustainabil-ity and to support business and decision-making processes. The LCM team is allo-cated to the Process Technology & Engineering Service Unit and closely cooperates with the strategic innovation unit, Creavis.
1 Summary
Greenhouse gas emission reductions from the use of products by Evonik
201010 201110 201210 2013 2014
CO2eq savings [Millions of metric tons] 55.0 57.3 60.4 61.2 92.5
Table 5: Development of greenhouse gas savings over the life cycle of applications of the products by Evonik that were sold in the specified year
9 World Business Council for Sustainable Development: Addressing the Avoided Emissions Challenge: Guidelines from the chemical industry for accounting for and reporting greenhouse gas (GHG) emissions avoided along the value chain based on comparative studies, 2013
10 The data for 2010 to 2012 was re-calculated and retroactively adjusted due to a change in methodology according to the WBCSD Avoided Emissions Guidance.
16
Life cycle emissions are typically calculat-ed with Life Cycle Assessments (LCA) according to DIN ISO 14040ff. The WBCSD Avoided Emissions Guidance specifies that comparative LCAs should be used to calculate greenhouse gas emission reductions. However, since LCAs are time and resource-intensive, they are not generated for all products by Evonik. If no LCA is available for a beacon product application, the calcula-tion of emissions and reductions is there-fore guided by the externally reviewed Carbon Footprint Estimation (CFE) method, primarily on the basis of emis-sion factors from the LCA software GaBi11 used by Evonik.
Evonik developed the CFE model as a method for evaluating early project and research ideas in terms of their green-house gas emissions as well as for calcu-lating CO2eq emissions and savings of products or processes. The methodology of a CFE resembles that of an LCA with some simplifications. However, com-pared to a full LCA, CFE only focuses on the greenhouse effects of products and processes. More detailed information
about the final CFE model can be found in the Evonik brochure “Carbon Foot-print Estimation – A model for the evalu-ation of potential climate impacts of new product ideas in early project stages.”
The “Simplified Calculation Methodolo-gy” listed in the WBCSD Avoided Emis-sions Guidance was used both for the reduction calculation on the basis of comparative LCAs and for comparisons based on CFEs. This method specifies the removal of identical parts from the reference and the Evonik solution, since they have no influence on the calculation of the greenhouse gas emissions that were saved. To give an example, the cal-culation of avoided greenhouse gas emis-sions for the “green tire” technology did not balance the entire vehicle over its value chain, but only for the actual tire surface that leads to the reduction. This approach has no impact on the absolute amount of the calculated greenhouse gas reduction. The section below introduces further details about the calculation method in the context of the respective reduction projects.
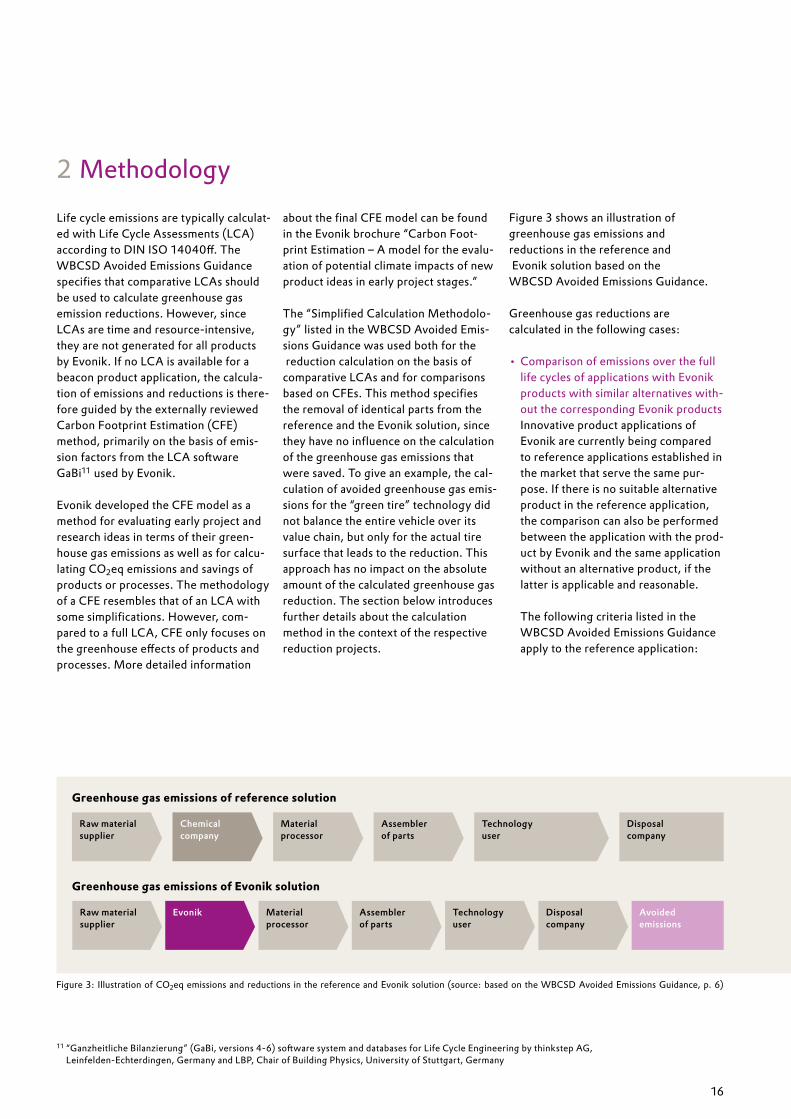
Figure 3 shows an illustration of greenhouse gas emissions and reductions in the reference and Evonik solution based on the WBCSD Avoided Emissions Guidance.
Greenhouse gas reductions are calculated in the following cases:
• Comparison of emissions over the full life cycles of applications with Evonik products with similar alternatives with-out the corresponding Evonik products Innovative product applications of Evonik are currently being compared to reference applications established in the market that serve the same pur-pose. If there is no suitable alternative product in the reference application, the comparison can also be performed between the application with the prod-uct by Evonik and the same application without an alternative product, if the latter is applicable and reasonable. The following criteria listed in the WBCSD Avoided Emissions Guidance apply to the reference application:
2 Methodology
11 “Ganzheitliche Bilanzierung” (GaBi, versions 4-6) software system and databases for Life Cycle Engineering by thinkstep AG, Leinfelden-Echterdingen, Germany and LBP, Chair of Building Physics, University of Stuttgart, Germany
Figure 3: Illustration of CO2eq emissions and reductions in the reference and Evonik solution (source: based on the WBCSD Avoided Emissions Guidance, p. 6)
Raw materialsupplier
Chemicalcompany
Material processor
Assembler of parts
Technology user
Disposalcompany
Evonik Material processor
Assembler of parts
Avoidedemissions
Disposalcompany
Technologyuser
Greenhouse gas emissions of reference solution
Greenhouse gas emissions of Evonik solution
Raw materialsupplier
17
– The reference application is at the same level in the value chain. – The reference application delivers the same function to the user. – The reference application is used in the same application. – The reference application is distributed on the market. – The reference application is interchangeable for the typical user in terms of quality criteria. – The reference application is as con- sistent as possible with the solution from Evonik in terms of data quality, methodology, assumptions, etc.
• Comparison of full life cycle emissions of applications with improved products by Evonik with the status of last year Products of Evonik are subject to continuous improvement processes. The greenhouse gas emissions of the resulting applications are compared to the status achieved in the previous year, and the calculated greenhouse gas reductions are included in the balance sheet.
In accordance with the WBCSD Avoid-ed Emissions Guidance, the results of the reduction calculations are indicated for the supply chain of the entire appli-cation, since the contribution of a single product to all savings in the supply chain is usually difficult to quantify and can therefore be based on assumptions. Table 6 shows the qualitative descrip-tion of the contributions made by indi-vidual products. In deviation from the specifications of WBCSD Avoided Emissions Guidance, greenhouse gas reductions are not dis-played individually, but as an aggregat-ed figure for Evonik.
The above-described approach to calcu-late CO2eq emissions and reductions is subject to certain limitations:
• Infrastructure measures such as construction of facilities, machinery, roads, and IT are not included.
• Due to the large number of products by Evonik, the carbon footprint was
only calculated for specific beacon applications that were identified in a screening process. Evonik does not claim to have a complete data invento-ry on the CO2eq emissions and savings of its full product range.
• Evonik is also aware that the CFEs performed are not comparative LCAs with an external review panel as de-fined in DIN ISO 14040ff.
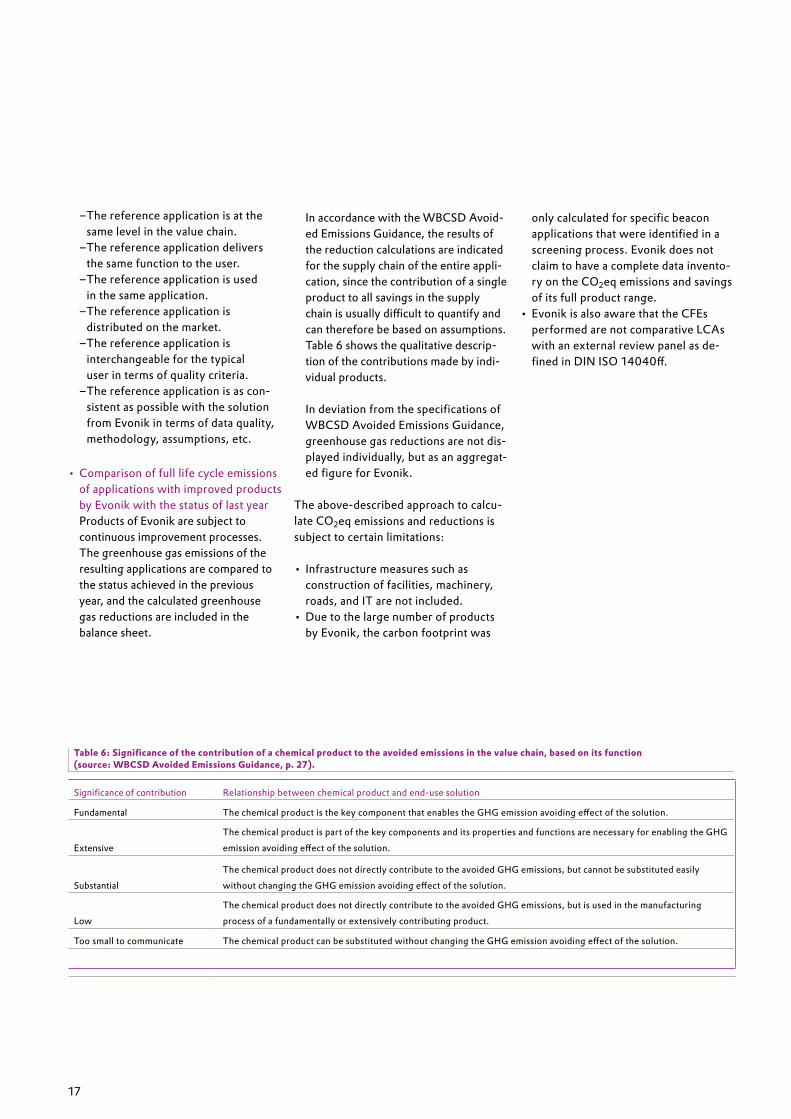
Table 6: Significance of the contribution of a chemical product to the avoided emissions in the value chain, based on its function (source: WBCSD Avoided Emissions Guidance, p. 27).
Significance of contribution Relationship between chemical product and end-use solution
Fundamental The chemical product is the key component that enables the GHG emission avoiding effect of the solution.
ExtensiveThe chemical product is part of the key components and its properties and functions are necessary for enabling the GHG emission avoiding effect of the solution.
SubstantialThe chemical product does not directly contribute to the avoided GHG emissions, but cannot be substituted easily without changing the GHG emission avoiding effect of the solution.
LowThe chemical product does not directly contribute to the avoided GHG emissions, but is used in the manufacturing process of a fundamentally or extensively contributing product.
Too small to communicate The chemical product can be substituted without changing the GHG emission avoiding effect of the solution.
18
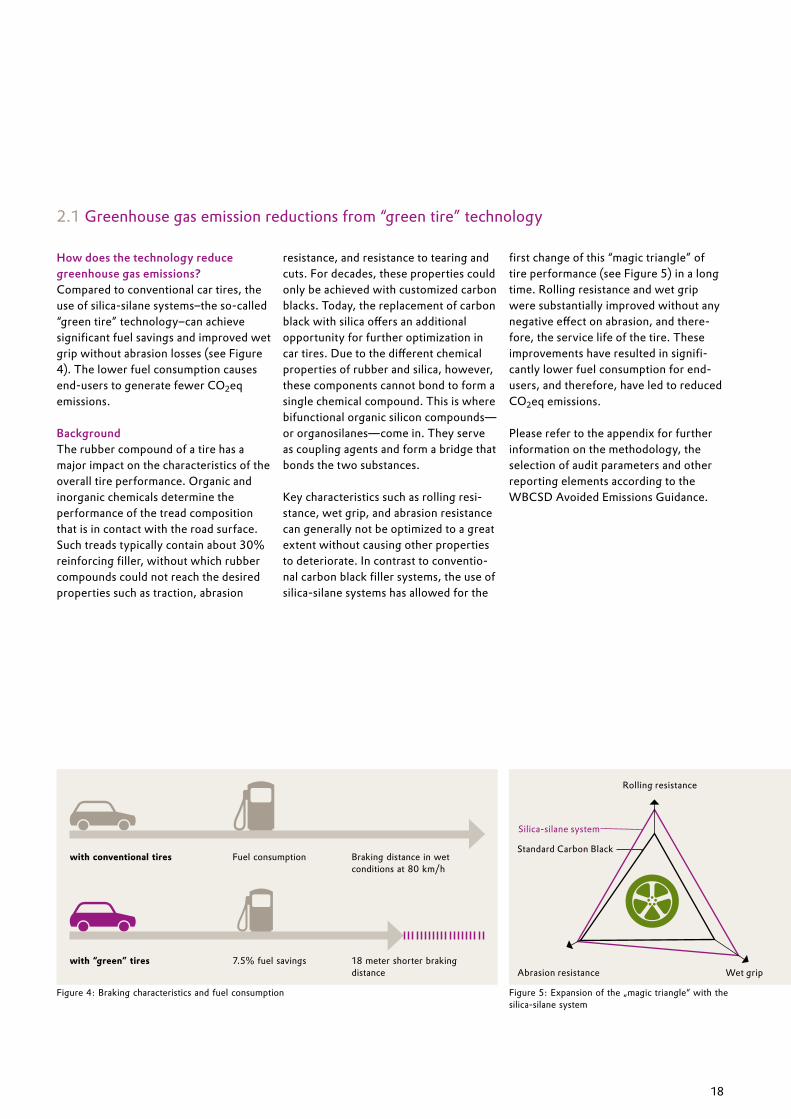
How does the technology reduce greenhouse gas emissions?Compared to conventional car tires, the use of silica-silane systems–the so-called “green tire” technology–can achieve significant fuel savings and improved wet grip without abrasion losses (see Figure 4). The lower fuel consumption causes end-users to generate fewer CO2eq emissions.
BackgroundThe rubber compound of a tire has a major impact on the characteristics of the overall tire performance. Organic and inorganic chemicals determine the performance of the tread composition that is in contact with the road surface. Such treads typically contain about 30% reinforcing filler, without which rubber compounds could not reach the desired properties such as traction, abrasion
resistance, and resistance to tearing and cuts. For decades, these properties could only be achieved with customized carbon blacks. Today, the replacement of carbon black with silica offers an additional opportunity for further optimization in car tires. Due to the different chemical properties of rubber and silica, however, these components cannot bond to form a single chemical compound. This is where bifunctional organic silicon compounds—or organosilanes—come in. They serve as coupling agents and form a bridge that bonds the two substances.
Key characteristics such as rolling resi-stance, wet grip, and abrasion resistance can generally not be optimized to a great extent without causing other properties to deteriorate. In contrast to conventio-nal carbon black filler systems, the use of silica-silane systems has allowed for the
first change of this “magic triangle” of tire performance (see Figure 5) in a long time. Rolling resistance and wet grip were substantially improved without any negative effect on abrasion, and there-fore, the service life of the tire. These improvements have resulted in signifi-cantly lower fuel consumption for end-users, and therefore, have led to reduced CO2eq emissions.
Please refer to the appendix for further information on the methodology, the selection of audit parameters and other reporting elements according to the WBCSD Avoided Emissions Guidance.
2.1 Greenhouse gas emission reductions from “green tire” technology
Figure 4: Braking characteristics and fuel consumption
with “green” tires
with conventional tires
7.5% fuel savings
Fuel consumption
18 meter shorter braking distance
Braking distance in wet conditions at 80 km/h
Rolling resistance
Abrasion resistance
Silica-silane system
Standard Carbon Black
Wet grip
Figure 5: Expansion of the „magic triangle“ with the silica-silane system
19
How does the technology reduce greenhouse gas emissions?Animal feed is specifically formulated to meet the physiological nutrition needs of animals, particularly the necessary shares of essential amino acids. Lack of certain amino acids in animal feed can be com-pensated either by adding a higher per-centage of protein-rich feed components such as oil seed, or by fortifying the feed with essential amino acids produced by Evonik for this purpose. Supplementing animal feed with essential amino acids can save significant amounts of feed raw materials, resulting in minimized use of arable land for crop production and thus, fewer CO2eq emissions. Furthermore, feed supplementation with these essen-tial amino acids reduces both nitrogen and greenhouse gas emissions resulting from feeding and excretion.
BackgroundMetAMINO® is an example of an amino acid containing sulfur. Unlike several other amino acids, it cannot be generated in the animal’s own body. Methionine is particularly important in poultry nutri-tion, as poultry has a much higher de-mand for this protein-forming amino acid than other species because of feather growth.
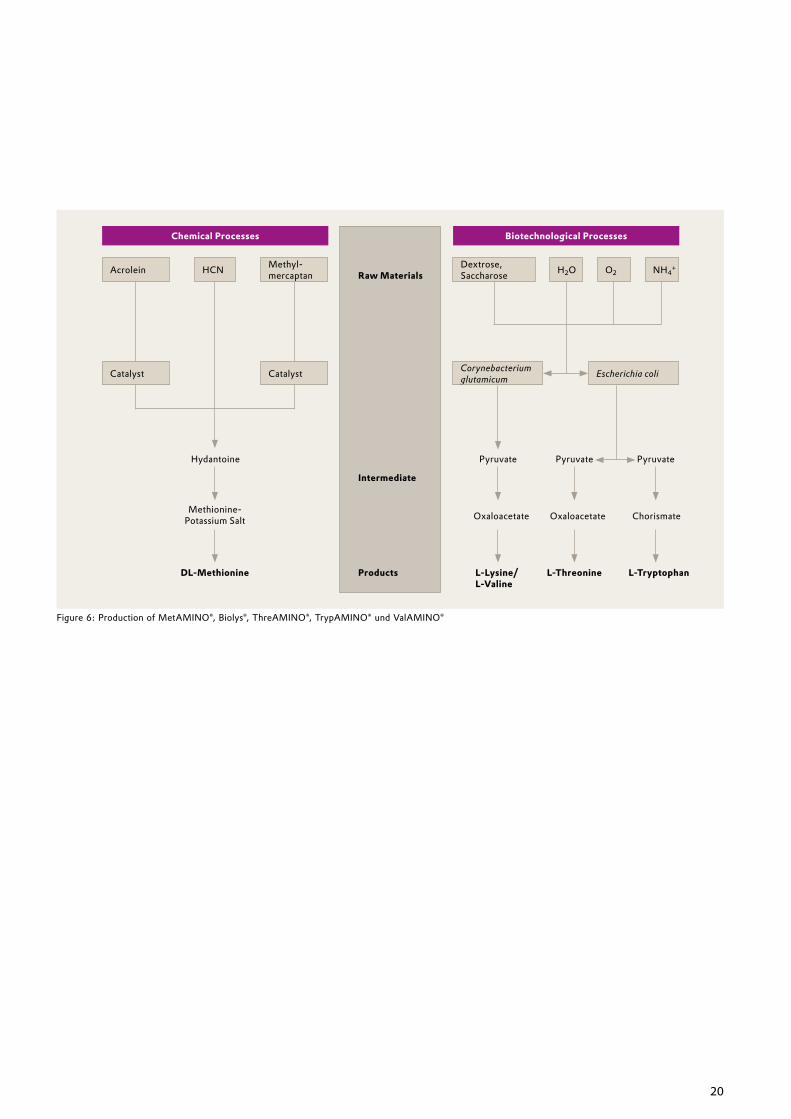
Evonik manufactures MetAMINO® in a chemical process called the “carbonate process” (see Figure 6). The company produces all important intermediates of the process such as acrolein, methyl mer-captan, and hydrocyanic acid in an inte-grated production at the same site. The
required raw materials such as crude oil and natural gas are provided by pipeline. All reaction steps are fully integrated into various cycles with maximum recycling of byproducts and waste streams, and byproducts and intermediates as well as energy streams can be used by other plants at the same integrated site.
Biolys® is the Evonik-specific brand of L-lysine (L-α, ε-diamino-n-caproic acid). It is an essential amino acid contained in almost all proteins, which is part of basic amino acids because of its basic side chain. L-lysine is the first limiting essen-tial amino acid in hog farming.
In contrast to MetAMINO®, Biolys®–along with all other amino acids of this study–is produced with the help of biotechnological fermentation processes aided by microorganisms. As a conse-quence, these amino acids automatically are available in the only biologically effective form of the L enantiomer. Evonik’s commercial L-lysine trade product is Biolys®, which contains L-lysine sulfate and biomass resulting from fermentation as an additional component. The active ingredient content is at least 54.6% L-lysine.
ThreAMINO® (L-threonine or L-α- amino-β-hydroxybutyric acid) is a neutral essential amino acid.
Alongside methionine and lysine in poultry farming and lysine and methionine in hog farming, threonine is the next limiting essential amino acid.
Evonik also uses biotechnology methods to produce ThreAMINO®. Because the amino acid is separated from the biomass at the end of the fermentation process, the product has a significantly higher active ingredient content of at least 98.5% free L-threonine.
TrypAMINO® (L-tryptophan or L-2-amino-3-(3’-indolyl)-propionic acid) is part of the structurally more complex aromatic amino acids.
Tryptophan is the next limiting amino acid after threonine in hog farming.
Evonik also manufactures TrypAMINO® in a fermentation process that is comparable to the process described for ThreAMINO® above.
ValAMINO® ((F)-2-amino-3-methylbu-tanoic acid) is an amino acid with a struc-ture resembling that of TrypAMINO®.
Valine is the next limiting amino acid after tryptophan in both poultry and hog farming.
ValAMINO® is also manufactured in a fermentation process. Evonik’s production is currently still in the engineering phase.
Please refer to the appendix for further information on the methodology, the selection of audit parameters and other reporting elements according to the WBCSD Avoided Emissions Guidance.
2.2 Greenhouse gas emission reductions from amino acids in animal feed
20
Figure 6: Production of MetAMINO®, Biolys®, ThreAMINO®, TrypAMINO® und ValAMINO®
Chemical Processes Biotechnological Processes
Acrolein
Corynebacterium glutamicum Escherichia coli
Methyl-mercaptan
Raw Materials
Dextrose, Saccharose H2OHCN O2 NH4
+
Catalyst Catalyst
Hydantoine Pyruvate Pyruvate
Methionine- Potassium Salt Oxaloacetate Chorismate
DL-Methionine L-Lysine/ L-Valine
Pyruvate
Oxaloacetate
L-Threonine L-Tryptophan
Intermediate
Products
21
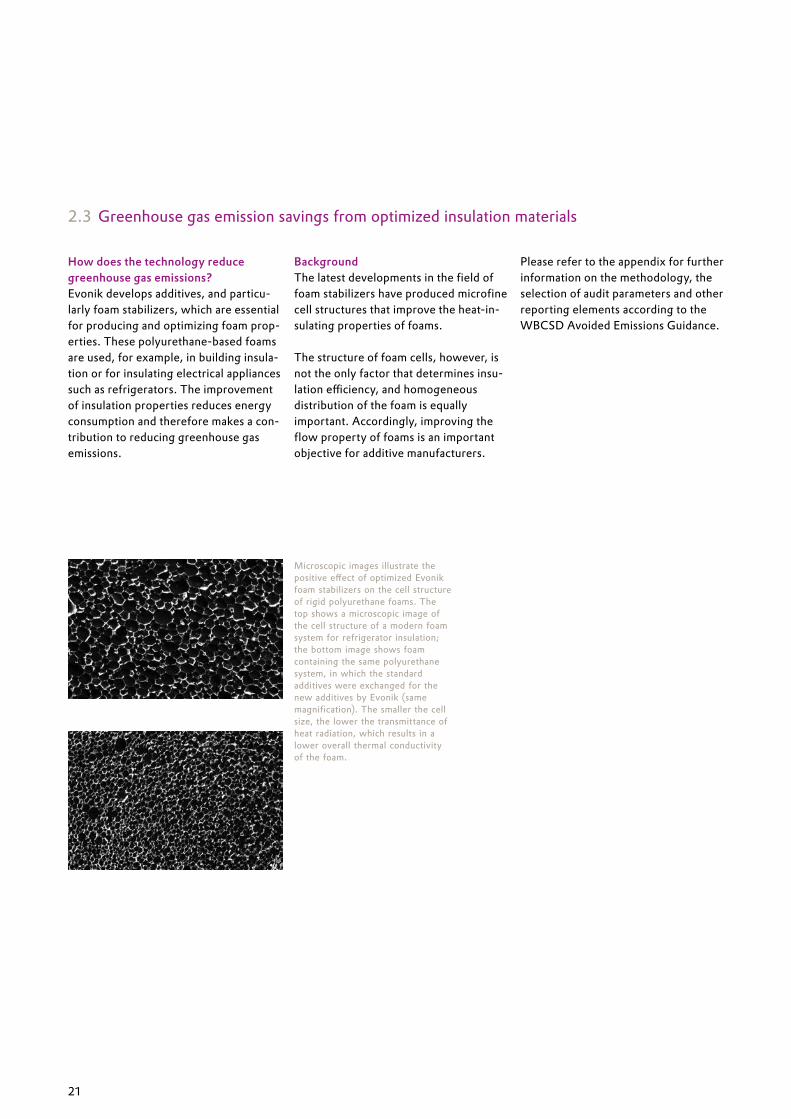
How does the technology reduce greenhouse gas emissions?Evonik develops additives, and particu-larly foam stabilizers, which are essential for producing and optimizing foam prop-erties. These polyurethane-based foams are used, for example, in building insula-tion or for insulating electrical appliances such as refrigerators. The improvement of insulation properties reduces energy consumption and therefore makes a con-tribution to reducing greenhouse gas emissions.
BackgroundThe latest developments in the field of foam stabilizers have produced microfine cell structures that improve the heat-in-sulating properties of foams.
The structure of foam cells, however, is not the only factor that determines insu-lation efficiency, and homogeneous distribution of the foam is equally important. Accordingly, improving the flow property of foams is an important objective for additive manufacturers.
Please refer to the appendix for further information on the methodology, the selection of audit parameters and other reporting elements according to the WBCSD Avoided Emissions Guidance.
Microscopic images illustrate the positive effect of optimized Evonik foam stabilizers on the cell structure of rigid polyurethane foams. The top shows a microscopic image of the cell structure of a modern foam system for refrigerator insulation; the bottom image shows foam containing the same polyurethane system, in which the standard additives were exchanged for the new additives by Evonik (same magnification). The smaller the cell size, the lower the transmittance of heat radiation, which results in a lower overall thermal conductivity of the foam.
2.3 Greenhouse gas emission savings from optimized insulation materials
22
How does the technology reduce greenhouse gas emissions?Modern compact fluorescent lamps (CFLs) with specialty oxides by Evonik consume less electricity than conven-tional CFLs that do not contain these spe-cialty oxides during their use phase. This reduced energy consumption results in fewer greenhouse gas emissions based on the use of CFLs. Furthermore, com-pared with CFLs without specialty oxides by Evonik, modern CFLs have almost twice the life expectancy which can lead to further reductions of CO2eq emissions.
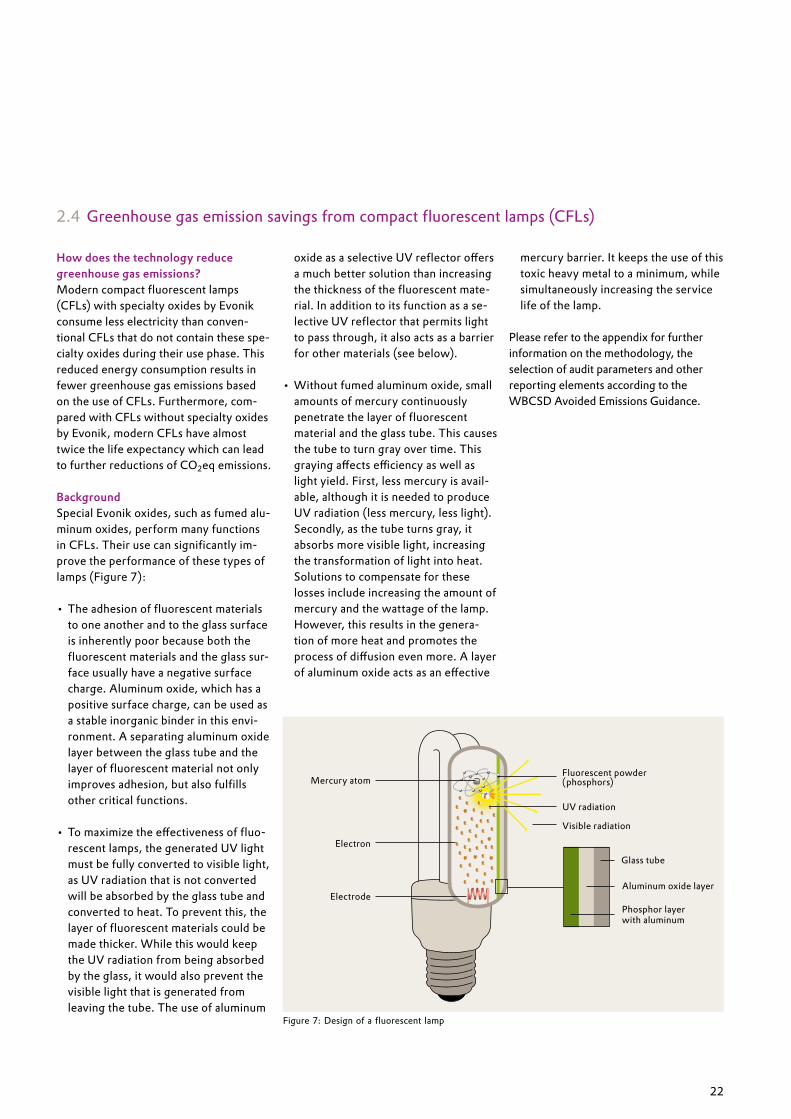
BackgroundSpecial Evonik oxides, such as fumed alu-minum oxides, perform many functions in CFLs. Their use can significantly im-prove the performance of these types of lamps (Figure 7):
• The adhesion of fluorescent materials to one another and to the glass surface is inherently poor because both the fluorescent materials and the glass sur-face usually have a negative surface charge. Aluminum oxide, which has a positive surface charge, can be used as a stable inorganic binder in this envi-ronment. A separating aluminum oxide layer between the glass tube and the layer of fluorescent material not only improves adhesion, but also fulfills other critical functions.
• To maximize the effectiveness of fluo-rescent lamps, the generated UV light must be fully converted to visible light, as UV radiation that is not converted will be absorbed by the glass tube and converted to heat. To prevent this, the layer of fluorescent materials could be made thicker. While this would keep the UV radiation from being absorbed by the glass, it would also prevent the visible light that is generated from leaving the tube. The use of aluminum
oxide as a selective UV reflector offers a much better solution than increasing the thickness of the fluorescent mate-rial. In addition to its function as a se-lective UV reflector that permits light to pass through, it also acts as a barrier for other materials (see below).
• Without fumed aluminum oxide, small amounts of mercury continuously penetrate the layer of fluorescent material and the glass tube. This causes the tube to turn gray over time. This graying affects efficiency as well as light yield. First, less mercury is avail-able, although it is needed to produce UV radiation (less mercury, less light). Secondly, as the tube turns gray, it absorbs more visible light, increasing the transformation of light into heat. Solutions to compensate for these losses include increasing the amount of mercury and the wattage of the lamp. However, this results in the genera-tion of more heat and promotes the process of diffusion even more. A layer of aluminum oxide acts as an effective
mercury barrier. It keeps the use of this toxic heavy metal to a minimum, while simultaneously increasing the service life of the lamp.
Please refer to the appendix for further information on the methodology, the selection of audit parameters and other reporting elements according to the WBCSD Avoided Emissions Guidance.
2.4 Greenhouse gas emission savings from compact fluorescent lamps (CFLs)
Figure 7: Design of a fluorescent lamp
Fluorescent powder (phosphors)
UV radiation
Electron
Electrode
Mercury atom
Glass tube
Aluminum oxide layer
Phosphor layer with aluminum
Visible radiation
23
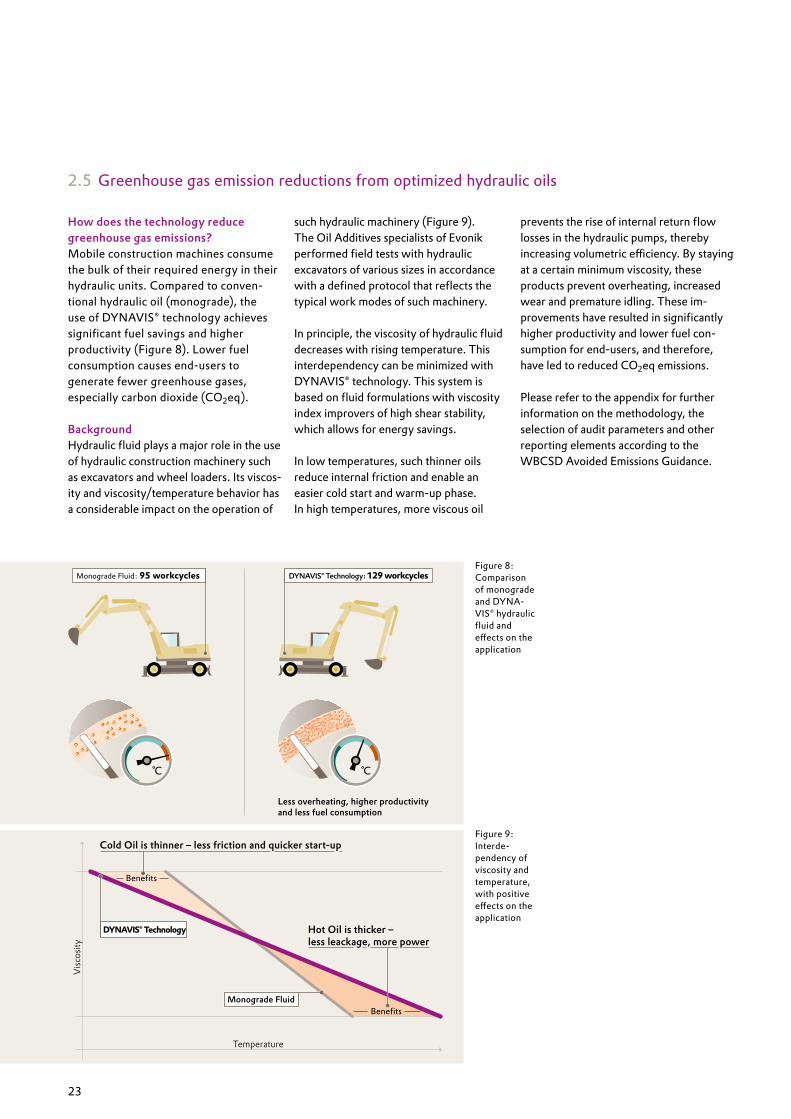
How does the technology reduce greenhouse gas emissions?Mobile construction machines consume the bulk of their required energy in their hydraulic units. Compared to conven-tional hydraulic oil (monograde), the use of DYNAVIS® technology achieves significant fuel savings and higher productivity (Figure 8). Lower fuel consumption causes end-users to generate fewer greenhouse gases, especially carbon dioxide (CO2eq).
BackgroundHydraulic fluid plays a major role in the use of hydraulic construction machinery such as excavators and wheel loaders. Its viscos-ity and viscosity/temperature behavior has a considerable impact on the operation of
such hydraulic machinery (Figure 9). The Oil Additives specialists of Evonik performed field tests with hydraulic excavators of various sizes in accordance with a defined protocol that reflects the typical work modes of such machinery.
In principle, the viscosity of hydraulic fluid decreases with rising temperature. This interdependency can be minimized with DYNAVIS® technology. This system is based on fluid formulations with viscosity index improvers of high shear stability, which allows for energy savings.
In low temperatures, such thinner oils reduce internal friction and enable an easier cold start and warm-up phase. In high temperatures, more viscous oil
prevents the rise of internal return flow losses in the hydraulic pumps, thereby increasing volumetric efficiency. By staying at a certain minimum viscosity, these products prevent overheating, increased wear and premature idling. These im-provements have resulted in significantly higher productivity and lower fuel con-sumption for end-users, and therefore, have led to reduced CO2eq emissions.
Please refer to the appendix for further information on the methodology, the selection of audit parameters and other reporting elements according to the WBCSD Avoided Emissions Guidance.
2.5 Greenhouse gas emission reductions from optimized hydraulic oils
Figure 9: Interde-pendency of viscosity and temperature, with positive effects on the application
Visc
osity
Temperature
Cold Oil is thinner – less friction and quicker start-up
Monograde Fluid
DYNAVIS® Technology
Benefits
Benefits
Hot Oil is thicker –less leackage, more power
Figure 8: Comparison of monograde and DYNA-VIS® hydraulic fluid and effects on the application
C̊C̊
Less overheating, higher productivityand less fuel consumption
Monograde Fluid: 95 workcycles DYNAVIS® Technology: 129 workcycles
24
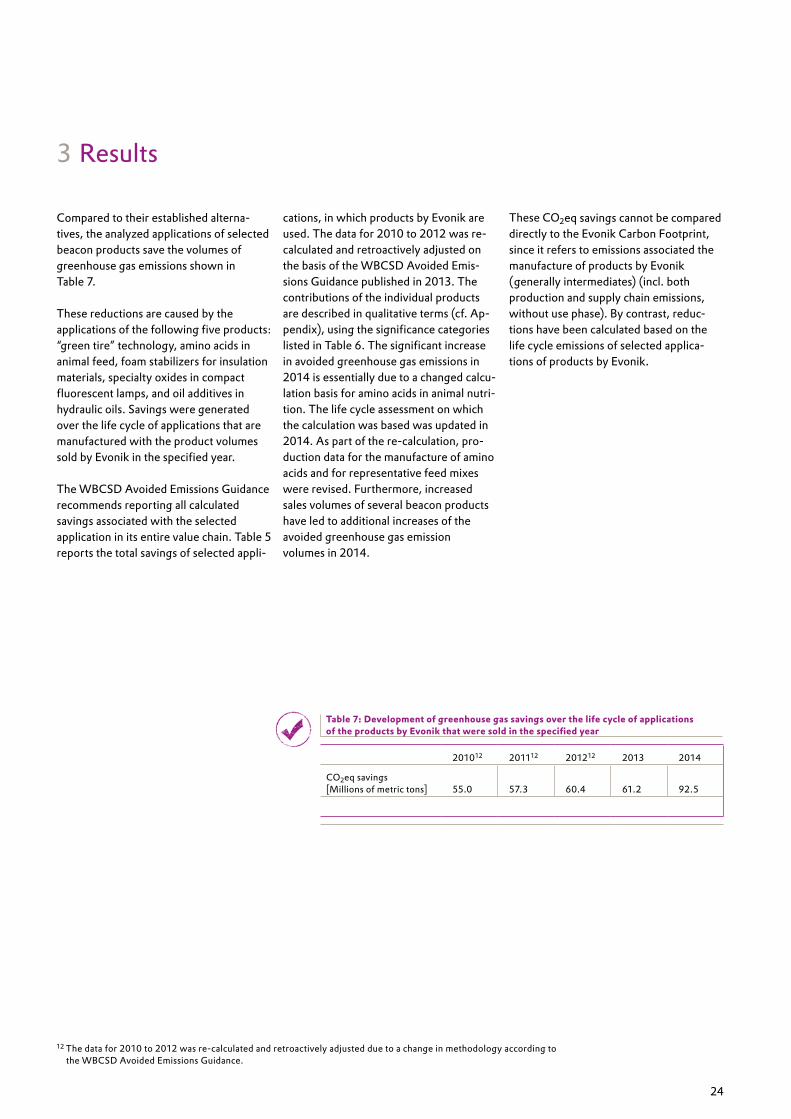
Compared to their established alterna-tives, the analyzed applications of selected beacon products save the volumes of greenhouse gas emissions shown in Table 7.
These reductions are caused by the applications of the following five products: “green tire” technology, amino acids in animal feed, foam stabilizers for insulation materials, specialty oxides in compact fluorescent lamps, and oil additives in hydraulic oils. Savings were generated over the life cycle of applications that are manufactured with the product volumes sold by Evonik in the specified year.
The WBCSD Avoided Emissions Guidance recommends reporting all calculated savings associated with the selected application in its entire value chain. Table 5 reports the total savings of selected appli-
cations, in which products by Evonik are used. The data for 2010 to 2012 was re-calculated and retroactively adjusted on the basis of the WBCSD Avoided Emis-sions Guidance published in 2013. The contributions of the individual products are described in qualitative terms (cf. Ap-pendix), using the significance categories listed in Table 6. The significant increase in avoided greenhouse gas emissions in 2014 is essentially due to a changed calcu-lation basis for amino acids in animal nutri-tion. The life cycle assessment on which the calculation was based was updated in 2014. As part of the re-calculation, pro-duction data for the manufacture of amino acids and for representative feed mixes were revised. Furthermore, increased sales volumes of several beacon products have led to additional increases of the avoided greenhouse gas emission volumes in 2014.
These CO2eq savings cannot be compared directly to the Evonik Carbon Footprint, since it refers to emissions associated the manufacture of products by Evonik (generally intermediates) (incl. both production and supply chain emissions, without use phase). By contrast, reduc-tions have been calculated based on the life cycle emissions of selected applica-tions of products by Evonik.
3 Results
201012 201112 201212 2013 2014
CO2eq savings [Millions of metric tons] 55.0 57.3 60.4 61.2 92.5
Table 7: Development of greenhouse gas savings over the life cycle of applications of the products by Evonik that were sold in the specified year
12 The data for 2010 to 2012 was re-calculated and retroactively adjusted due to a change in methodology according to the WBCSD Avoided Emissions Guidance.

25
Appendix
26
Greenhouse gas emission reductions from “green tire“ technology
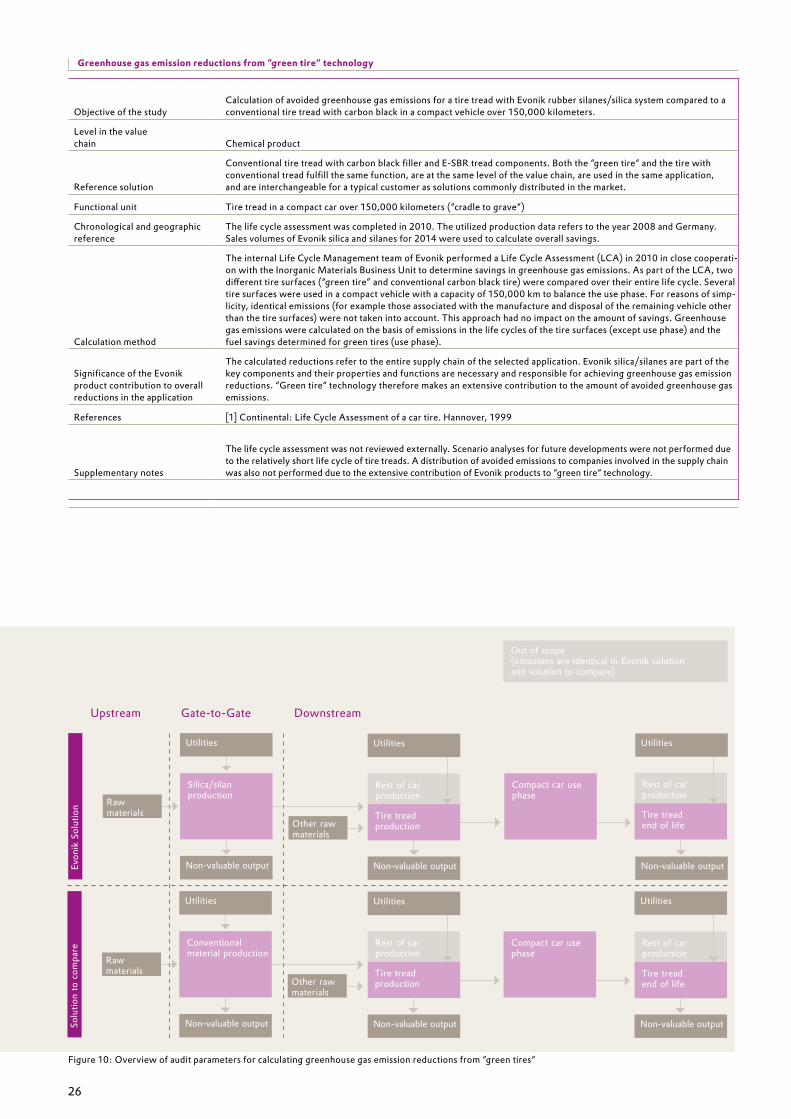
Objective of the studyCalculation of avoided greenhouse gas emissions for a tire tread with Evonik rubber silanes/silica system compared to a conventional tire tread with carbon black in a compact vehicle over 150,000 kilometers.
Level in the value chain Chemical product
Reference solution
Conventional tire tread with carbon black filler and E-SBR tread components. Both the “green tire“ and the tire with conventional tread fulfill the same function, are at the same level of the value chain, are used in the same application, and are interchangeable for a typical customer as solutions commonly distributed in the market.
Functional unit Tire tread in a compact car over 150,000 kilometers (“cradle to grave“)
Chronological and geographic reference
The life cycle assessment was completed in 2010. The utilized production data refers to the year 2008 and Germany. Sales volumes of Evonik silica and silanes for 2014 were used to calculate overall savings.
Calculation method
The internal Life Cycle Management team of Evonik performed a Life Cycle Assessment (LCA) in 2010 in close cooperati-on with the Inorganic Materials Business Unit to determine savings in greenhouse gas emissions. As part of the LCA, two different tire surfaces (“green tire” and conventional carbon black tire) were compared over their entire life cycle. Several tire surfaces were used in a compact vehicle with a capacity of 150,000 km to balance the use phase. For reasons of simp-licity, identical emissions (for example those associated with the manufacture and disposal of the remaining vehicle other than the tire surfaces) were not taken into account. This approach had no impact on the amount of savings. Greenhouse gas emissions were calculated on the basis of emissions in the life cycles of the tire surfaces (except use phase) and the fuel savings determined for green tires (use phase).
Significance of the Evonik product contribution to overall reductions in the application
The calculated reductions refer to the entire supply chain of the selected application. Evonik silica/silanes are part of the key components and their properties and functions are necessary and responsible for achieving greenhouse gas emission reductions. “Green tire“ technology therefore makes an extensive contribution to the amount of avoided greenhouse gas emissions.
References [1] Continental: Life Cycle Assessment of a car tire. Hannover, 1999
Supplementary notes
The life cycle assessment was not reviewed externally. Scenario analyses for future developments were not performed due to the relatively short life cycle of tire treads. A distribution of avoided emissions to companies involved in the supply chain was also not performed due to the extensive contribution of Evonik products to “green tire“ technology.
Figure 10: Overview of audit parameters for calculating greenhouse gas emission reductions from “green tires“
Upstream Gate-to-Gate Downstream
Evon
ik S
olut
ion Raw
materials
Utilities
Silica/silan production
Non-valuable output
Other raw materials
Utilities
Non-valuable output
Rest of car production
Compact car use phase
Utilities
Non-valuable output
Solu
tion
to c
ompa
re
Raw materials
Utilities
Conventional material production
Non-valuable output
Other raw materials
Utilities
Non-valuable output
Compact car use phase
Utilities
Non-valuable output
Tire tread production
Rest of car production
Tire tread production
Rest of car production
Tire tread end of life
Rest of car production
Tire tread end of life
Out of scope (emissions are identical in Evonik solution and solution to compare)
27
Greenhouse gas emission reductions from amino acids in animal feed
Objective of the study
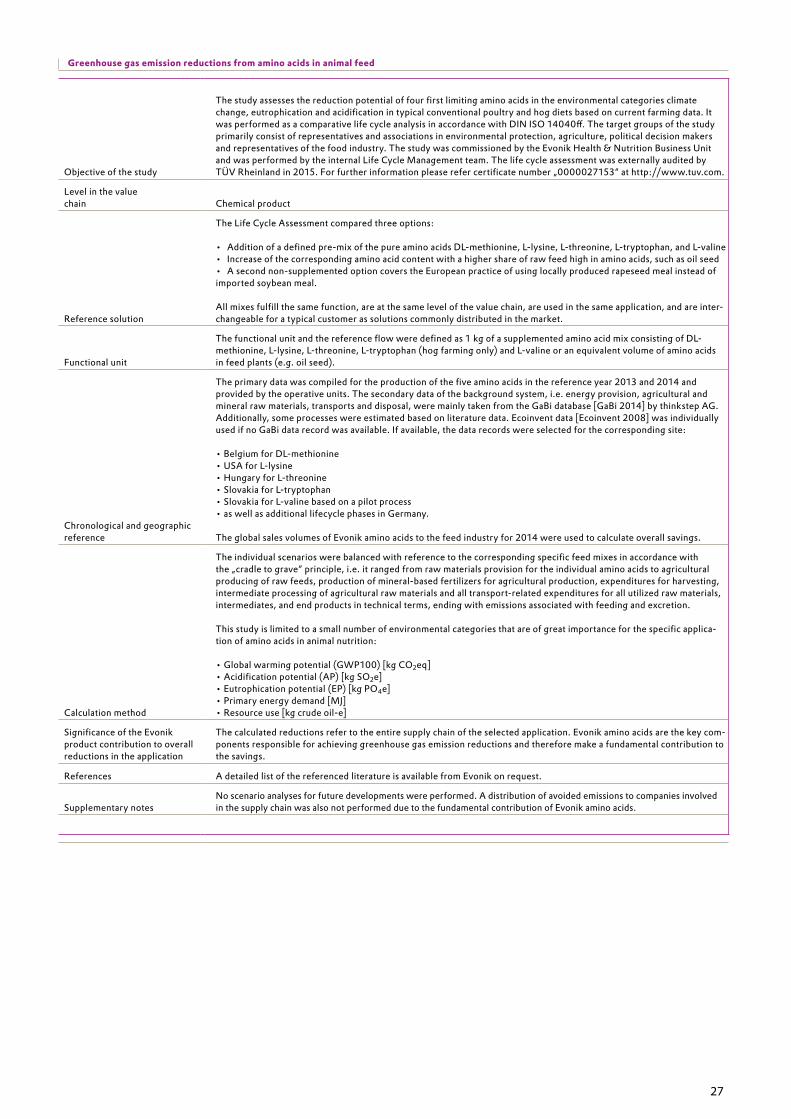
The study assesses the reduction potential of four first limiting amino acids in the environmental categories climate change, eutrophication and acidification in typical conventional poultry and hog diets based on current farming data. It was performed as a comparative life cycle analysis in accordance with DIN ISO 14040ff. The target groups of the study primarily consist of representatives and associations in environmental protection, agriculture, political decision makers and representatives of the food industry. The study was commissioned by the Evonik Health & Nutrition Business Unit and was performed by the internal Life Cycle Management team. The life cycle assessment was externally audited by TÜV Rheinland in 2015. For further information please refer certificate number „0000027153“ at http://www.tuv.com.
Level in the value chain Chemical product
Reference solution
The Life Cycle Assessment compared three options:
• Addition of a defined pre-mix of the pure amino acids DL-methionine, L-lysine, L-threonine, L-tryptophan, and L-valine• Increase of the corresponding amino acid content with a higher share of raw feed high in amino acids, such as oil seed• A second non-supplemented option covers the European practice of using locally produced rapeseed meal instead of imported soybean meal.
All mixes fulfill the same function, are at the same level of the value chain, are used in the same application, and are inter-changeable for a typical customer as solutions commonly distributed in the market.
Functional unit
The functional unit and the reference flow were defined as 1 kg of a supplemented amino acid mix consisting of DL-methionine, L-lysine, L-threonine, L-tryptophan (hog farming only) and L-valine or an equivalent volume of amino acids in feed plants (e.g. oil seed).
Chronological and geographic reference
The primary data was compiled for the production of the five amino acids in the reference year 2013 and 2014 and provided by the operative units. The secondary data of the background system, i.e. energy provision, agricultural and mineral raw materials, transports and disposal, were mainly taken from the GaBi database [GaBi 2014] by thinkstep AG. Additionally, some processes were estimated based on literature data. Ecoinvent data [Ecoinvent 2008] was individually used if no GaBi data record was available. If available, the data records were selected for the corresponding site:
• Belgium for DL-methionine• USA for L-lysine• Hungary for L-threonine• Slovakia for L-tryptophan• Slovakia for L-valine based on a pilot process• as well as additional lifecycle phases in Germany.
The global sales volumes of Evonik amino acids to the feed industry for 2014 were used to calculate overall savings.
Calculation method
The individual scenarios were balanced with reference to the corresponding specific feed mixes in accordance with the „cradle to grave“ principle, i.e. it ranged from raw materials provision for the individual amino acids to agricultural producing of raw feeds, production of mineral-based fertilizers for agricultural production, expenditures for harvesting, intermediate processing of agricultural raw materials and all transport-related expenditures for all utilized raw materials, intermediates, and end products in technical terms, ending with emissions associated with feeding and excretion.
This study is limited to a small number of environmental categories that are of great importance for the specific applica-tion of amino acids in animal nutrition:
• Global warming potential (GWP100) [kg CO2eq]• Acidification potential (AP) [kg SO2e]• Eutrophication potential (EP) [kg PO4e]• Primary energy demand [MJ]• Resource use [kg crude oil-e]
Significance of the Evonik product contribution to overall reductions in the application
The calculated reductions refer to the entire supply chain of the selected application. Evonik amino acids are the key com-ponents responsible for achieving greenhouse gas emission reductions and therefore make a fundamental contribution to the savings.
References A detailed list of the referenced literature is available from Evonik on request.
Supplementary notesNo scenario analyses for future developments were performed. A distribution of avoided emissions to companies involved in the supply chain was also not performed due to the fundamental contribution of Evonik amino acids.
28
Figure 11: Overview of audit parameters for calculating greenhouse gas emission reductions from amino acids in animal nutrition
Upstream Gate-to-Farm Gate
Evon
ik S
olut
ion Raw
materials
Utilities
DL-Methionine, L-Threonine, L-Tryptophan, L-Lysin, L-Valin production
Non-valuable output
Other raw materials
Utilities
Non-valuable output
Feed production Animal feeding (use phase)
Utilities
Non-valuable output
Spreading manure (end-of-life)
Solu
tion
to c
ompa
re
Raw materials
Utilities
Soybean and rape-seed meal produc-tion
Non-valuable output
Other raw materials
Utilities
Non-valuable output
Feed production Animal feeding (use phase)
Utilities
Non-valuable output
Spreading manure (end-of-life)
Out of scope (e.g. emissions are identical in Evonik solution and solution to compare)
29
Greenhouse gas emission savings from optimized insulation materials
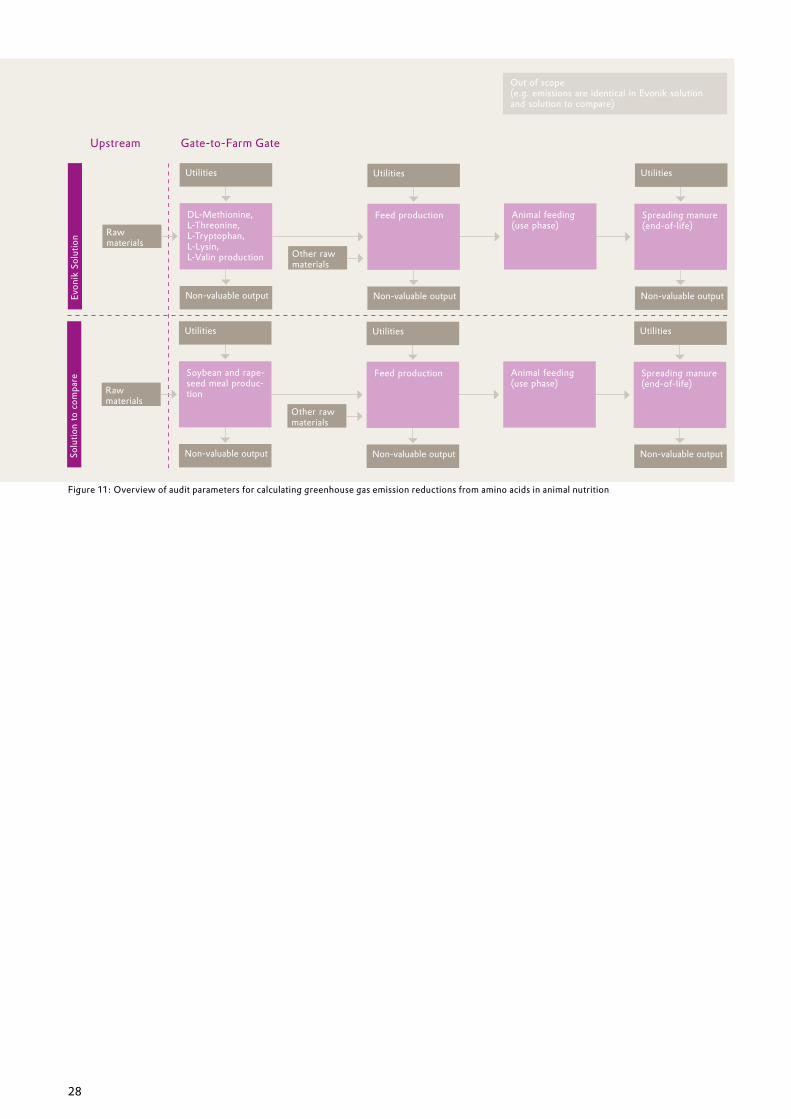
Objective of the studyCalculation of avoided greenhouse gas emissions from use of foam stabilizers in building insulation and in the insulation of refrigerators.
Level in the value chain Chemical product
Reference solution
Conventional, non-optimized foam stabilizers. The reference solution fulfills the same function, is at the same level of the value chain, is used in the same applications, and is interchangeable for a typical customer as a solution commonly distributed in the market.
Functional unitOne metric ton of foam stabilizers in PU foam with a service life of 12 years (refrigerator insulation) and 45 years (building insulation) (use phase only).
Chronological and geographic reference
The savings in the use phase of a refrigerator application were calculated based on a mathematical average power mix of a worldwide selection of industrialized countries supplied by GaBi data of thinkstep AG. The savings in the use phase of building insulation were calculated based on data for heat generation in three regions (EU, USA, China), also using information supplied by GaBi data of thinkstep AG. The global sales volumes of Evonik in the Construction and Appliance segments for 2014 were used to calculate overall savings.
Calculation method
To determine the greenhouse gas emissions reductions, the internal Evonik Life Cycle Management team analyzed two use cases in close cooperation with the Consumer Specialties Business Unit as part of a Carbon Footprint Estimation (CFE), use of foam stabilizers in building insulation and in the insulation of refrigerators. Foam stabilizers optimized by Evonik were compared with the effect of insulation materials manufactured with conventional foam stabilizers. In both cases, energy savings were determined on the basis of suitable assumptions and converted into greenhouse gas emission savings.For reasons of simplicity, identical emissions (for example those associated with the manufacture and disposal of foam stabilizers) were not taken into account. This approach had no impact on the amount of savings.
Significance of the Evonik product contribution to overall reductions in the application
The calculated reductions refer to the entire supply chain of the two selected applications. However, the optimized Evonik foam stabilizers are the key components responsible for achieving greenhouse gas emission reductions. Optimized foam stabilizers therefore make a fundamental contribution to the amount of avoided greenhouse gas emissions.
Supplementary notesNo scenario analyses for future developments were performed. A distribution of avoided emissions to companies involved in the supply chain was also not performed due to the fundamental contribution of Evonik products.
Figure 12: Overview of audit parameters for calculating greenhouse gas emission reductions from optimized insulation materials (refrigerator insulation)
Upstream Gate-to-Gate Downstream
Evon
ik S
olut
ion Raw
materials
Utilities
Surfactant production
Non-valuable output
Other raw materials
Utilities
Non-valuable output
Domestic refrigerator production
Domestic refrigerator use phase
Utilities
Non-valuable output
Domestic refrigerator end-of-life
Solu
tion
to c
ompa
re
Raw materials
Utilities
Conventional surfactant production
Non-valuable output
Other raw materials
Utilities
Non-valuable output
Domestic refrigerator production
Domestic refrigerator use phase
Utilities
Non-valuable output
Domestic refrigerator end-of-life
Out of scope (emissions are identical in Evonik solution and solution to compare)
30
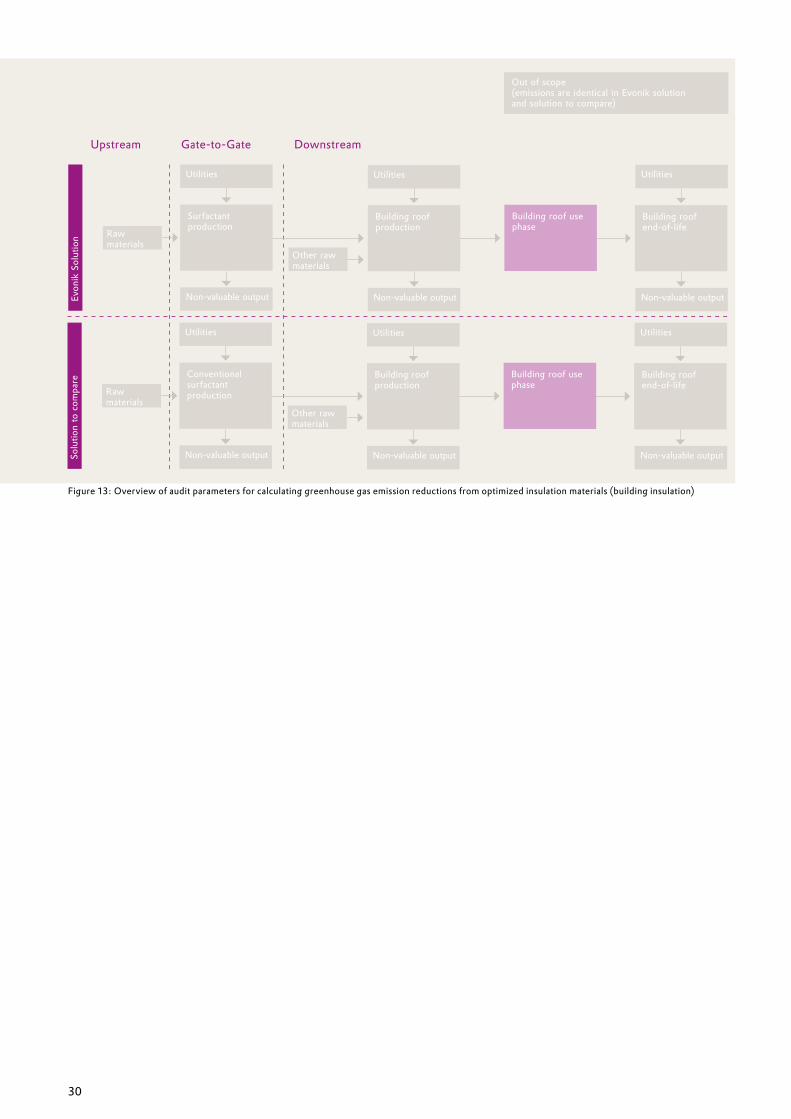
Figure 13: Overview of audit parameters for calculating greenhouse gas emission reductions from optimized insulation materials (building insulation)
Upstream Gate-to-Gate Downstream
Evon
ik S
olut
ion Raw
materials
Utilities
Surfactantproduction
Non-valuable output
Other raw materials
Utilities
Non-valuable output
Building roof production
Building roof use phase
Utilities
Non-valuable output
Building roof end-of-life
Solu
tion
to c
ompa
re
Raw materials
Utilities
Conventional surfactant production
Non-valuable output
Other raw materials
Utilities
Non-valuable output
Building roof production
Building roof use phase
Utilities
Non-valuable output
Building roof end-of-life
Out of scope (emissions are identical in Evonik solution and solution to compare)
31
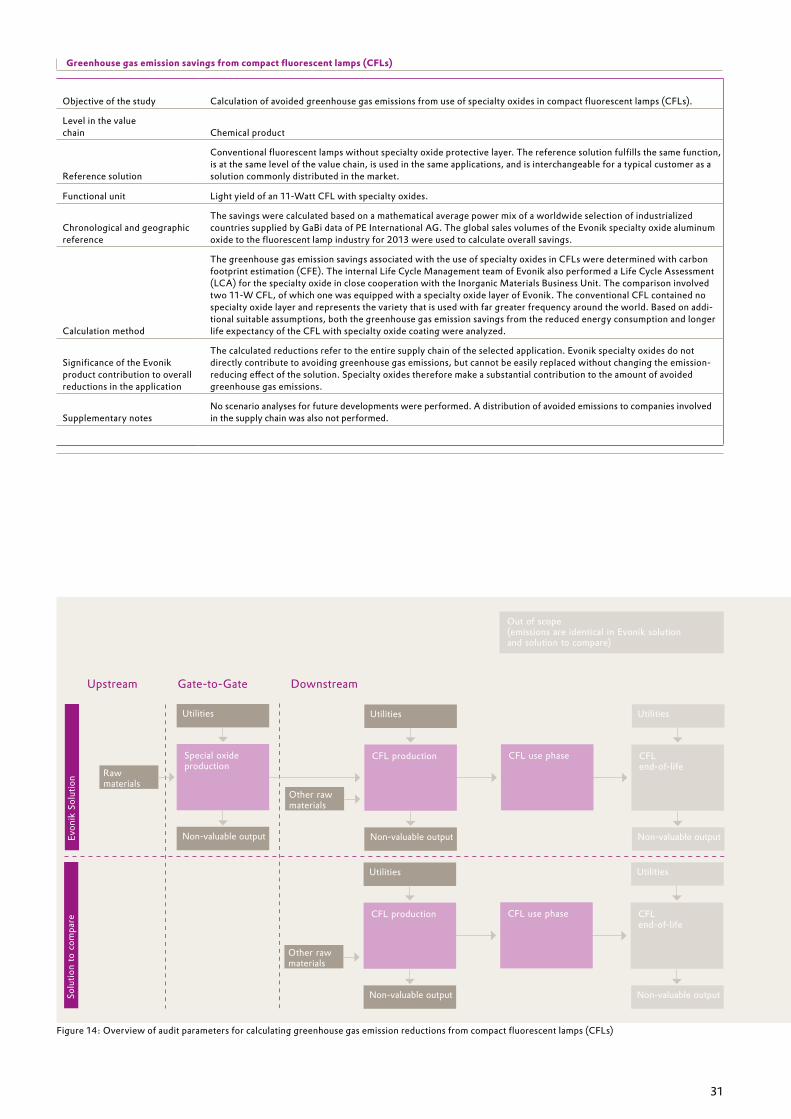
Greenhouse gas emission savings from compact fluorescent lamps (CFLs)
Objective of the study Calculation of avoided greenhouse gas emissions from use of specialty oxides in compact fluorescent lamps (CFLs).
Level in the value chain Chemical product
Reference solution
Conventional fluorescent lamps without specialty oxide protective layer. The reference solution fulfills the same function, is at the same level of the value chain, is used in the same applications, and is interchangeable for a typical customer as a solution commonly distributed in the market.
Functional unit Light yield of an 11-Watt CFL with specialty oxides.
Chronological and geographic reference
The savings were calculated based on a mathematical average power mix of a worldwide selection of industrialized countries supplied by GaBi data of PE International AG. The global sales volumes of the Evonik specialty oxide aluminum oxide to the fluorescent lamp industry for 2013 were used to calculate overall savings.
Calculation method
The greenhouse gas emission savings associated with the use of specialty oxides in CFLs were determined with carbon footprint estimation (CFE). The internal Life Cycle Management team of Evonik also performed a Life Cycle Assessment (LCA) for the specialty oxide in close cooperation with the Inorganic Materials Business Unit. The comparison involved two 11-W CFL, of which one was equipped with a specialty oxide layer of Evonik. The conventional CFL contained no specialty oxide layer and represents the variety that is used with far greater frequency around the world. Based on addi-tional suitable assumptions, both the greenhouse gas emission savings from the reduced energy consumption and longer life expectancy of the CFL with specialty oxide coating were analyzed.
Significance of the Evonik product contribution to overall reductions in the application
The calculated reductions refer to the entire supply chain of the selected application. Evonik specialty oxides do not directly contribute to avoiding greenhouse gas emissions, but cannot be easily replaced without changing the emission-reducing effect of the solution. Specialty oxides therefore make a substantial contribution to the amount of avoided greenhouse gas emissions.
Supplementary notesNo scenario analyses for future developments were performed. A distribution of avoided emissions to companies involved in the supply chain was also not performed.
Figure 14: Overview of audit parameters for calculating greenhouse gas emission reductions from compact fluorescent lamps (CFLs)
Upstream Gate-to-Gate Downstream
Evon
ik S
olut
ion Raw
materials
Utilities
Special oxide production
Non-valuable output
Other raw materials
Utilities
Non-valuable output
CFL production CFL use phase
Utilities
Non-valuable output
CFL end-of-life
Solu
tion
to c
ompa
re
Other raw materials
Utilities
Non-valuable output
CFL production CFL use phase
Utilities
Non-valuable output
CFL end-of-life
Out of scope (emissions are identical in Evonik solution and solution to compare)
32
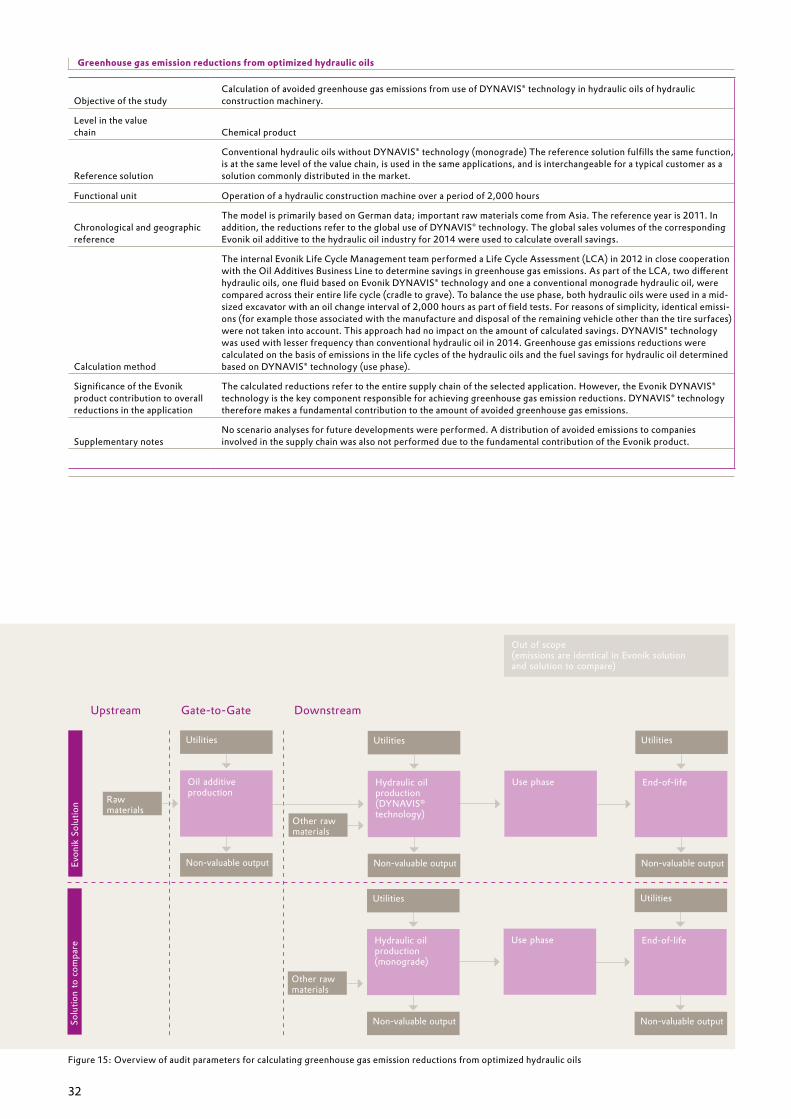
Greenhouse gas emission reductions from optimized hydraulic oils
Objective of the studyCalculation of avoided greenhouse gas emissions from use of DYNAVIS® technology in hydraulic oils of hydraulic construction machinery.
Level in the value chain Chemical product
Reference solution
Conventional hydraulic oils without DYNAVIS® technology (monograde) The reference solution fulfills the same function, is at the same level of the value chain, is used in the same applications, and is interchangeable for a typical customer as a solution commonly distributed in the market.
Functional unit Operation of a hydraulic construction machine over a period of 2,000 hours
Chronological and geographic reference
The model is primarily based on German data; important raw materials come from Asia. The reference year is 2011. In addition, the reductions refer to the global use of DYNAVIS® technology. The global sales volumes of the corresponding Evonik oil additive to the hydraulic oil industry for 2014 were used to calculate overall savings.
Calculation method
The internal Evonik Life Cycle Management team performed a Life Cycle Assessment (LCA) in 2012 in close cooperation with the Oil Additives Business Line to determine savings in greenhouse gas emissions. As part of the LCA, two different hydraulic oils, one fluid based on Evonik DYNAVIS® technology and one a conventional monograde hydraulic oil, were compared across their entire life cycle (cradle to grave). To balance the use phase, both hydraulic oils were used in a mid-sized excavator with an oil change interval of 2,000 hours as part of field tests. For reasons of simplicity, identical emissi-ons (for example those associated with the manufacture and disposal of the remaining vehicle other than the tire surfaces) were not taken into account. This approach had no impact on the amount of calculated savings. DYNAVIS® technology was used with lesser frequency than conventional hydraulic oil in 2014. Greenhouse gas emissions reductions were calculated on the basis of emissions in the life cycles of the hydraulic oils and the fuel savings for hydraulic oil determined based on DYNAVIS® technology (use phase).
Significance of the Evonik product contribution to overall reductions in the application
The calculated reductions refer to the entire supply chain of the selected application. However, the Evonik DYNAVIS® technology is the key component responsible for achieving greenhouse gas emission reductions. DYNAVIS® technology therefore makes a fundamental contribution to the amount of avoided greenhouse gas emissions.
Supplementary notesNo scenario analyses for future developments were performed. A distribution of avoided emissions to companies involved in the supply chain was also not performed due to the fundamental contribution of the Evonik product.
Figure 15: Overview of audit parameters for calculating greenhouse gas emission reductions from optimized hydraulic oils
Upstream Gate-to-Gate Downstream
Evon
ik S
olut
ion Raw
materials
Utilities
Oil additive production
Non-valuable output
Other raw materials
Utilities
Non-valuable output
Hydraulic oil production (DYNAVIS technology)
Use phase
Utilities
Non-valuable output
End-of-life
Solu
tion
to c
ompa
re
Other raw materials
Utilities
Non-valuable output
Hydraulic oil production (monograde)
Use phase
Utilities
Non-valuable output
End-of-life
Out of scope (emissions are identical in Evonik solution and solution to compare)
33
Independent Assurance ReportTo Evonik Industries AG, Essen
We have been engaged to perform a limited assurance engagement on selected greenhouse gas emissions data presented in Tables 1, 2, 3, 5, and 7 and in Figure 2 of the accompanying report “Evonik Carbon Footprint 2014” (hereafter “GHG emission data 2014”) of Evonik Industries AG, Essen (the “Company“) and issued an independent assurance report, authoritative in German language, which has been translated by Evonik Industries AG as follows:
Management‘s ResponsibilityCompany‘s Executive Board is responsible for the proper determination of GHG emissions data 2014 in accordance with the criteria set out in pages 8 and 9 of the publication “A Corporate Accounting and Reporting Standard – Revised Edition” of the Greenhouse Gas Protocol Initiative (World Business Council of Sustainable Development/World Resources Institute), namely
• relevance• completeness• consistency• transparency and• accuracy
(hereafter “GHG Protocol criteria“) with consideration for the supplementary principles included in the accompanying report. This responsibility includes the selection and application of suitable methods to compile the greenhouse gas emissions data, while also ar-riving at assumptions and estimates that are plausible under the given circumstances. At the same time, this responsibility includes the conceptual design, implementation and maintenance of systems and processes that are of relevance for reporting greenhouse gas emissions data.
Auditing Company‘s Independence and Quality AssuranceWe have complied with the independence and other ethical requirements of the Code of Ethics for Professional Accountants issued by the International Ethics Standards Board for Accountants (IESBA-Codex), which is founded on fundamental principles of integrity, objectivity, professional competence and due care, confidentiality and professional behavior.
The firm applies International Standard on Quality Control 1 and accordingly maintains a comprehensive system of quality control including documented policies and procedures regarding compliance with ethical requirements, professional standards and applicable legal and regulatory requirements.
Practitioner‘s ResponsibilityOur responsibility is to express a conclusion based on our work performed as to whether anything has come to our attention that causes us to believe that the GHG emission data 2014 presented in Tables 1, 2, 3, 5, and 7 and in Figure 2 of the accompanying re-port have not been prepared in accordance with the GHG Protocol criteria with consideration for the supplementary principles inclu-ded in the accompanying report in essential points. The GHG emission data 2014 selected by the Company and evaluated by us have been marked with a red checkmark.
Moreover, we have been engaged to express recommendations for further development of the processes to collect and report on GHG emission data based on the results of our limited assurance engagement.
We conducted our work in accordance with the International Standard on Assurance Engagements (ISAE) 3000. This Standard re-quires that we comply with ethical requirements and plan and perform the assurance engagement, under consideration of materia-lity, to provide our conclusion with limited assurance.
In a limited assurance engagement, the evidence-gathering procedures are more limited than for a reasonable assurance engage-ment, and therefore less assurance is obtained than in a reasonable assurance engagement. The procedures selected depend on the practitioner’s proper judgment.
34
Within the scope of our engagement we have performed the following procedures:
• Inspecting the documentation of the systems, processes and documents of the GHG emission data 2014.• Evaluation of the procedures and systems, which represent the basis for the determination of the baseline/reference values
regarding the emission avoiding products and solutions of the GHG emission data 2014.• Inquiries of the personnel responsible for the preparation of the GHG emission data 2014 from the departments “Process
Technology & Engineering” and “Procurement Strategy”.• Inquiries of the personnel of selected business units involved in performing the calculations of selected emission avoiding
products and solutions.• Understanding the individual calculation steps regarding both the sum of greenhouse gas emissions and emissions avoided
through the use of products and solutions of the product portfolio in the fiscal year 2014.• Checking the consistent application of the baseline and reference values of selected emission avoiding products and solutions.• Comparing selected activity data used in the calculations with information from company-internal systems.
ConclusionBased on our limited assurance engagement, nothing has come to our attention that causes us to believe that the GHG emission data 2014 presented in Tables 1, 2, 3, 5, and 7 and in Figure 2 of the accompanying report, „Evonik Carbon Footprint 2014” have not been prepared in accordance with the GHG Protocol criteria with consideration for the supplementary principles included in the ac-companying report in essential points.
Emphasis of matter – Use of estimates and assumptionsWithout qualifying our conclusion we refer to the fact pointed out by Company‘s Executive Board in the accompanying report in Sec-tion 2.2 that the calculation of the 2014 GHG emissions data is by nature partly based on estimates and assumptions.
Emphasis of matter – RecommendationsWithout qualifying our conclusion we recommend the following for the further development of the GHG emissions data:• That the further development of the GHG emissions data be more closely integrated in the development of the sustainability strat-
egy and program. • That the processes and documentation of the internal control system be further formalized.
General Terms of EngagementWe issue this report on the basis of the engagement agreed with the Company, which comprises the attached General Terms of En-gagement for Auditors and Auditing Companies (Wirtschaftsprüfer and Wirtschaftsprüfungsgesellschaften) as of 1 January 2002, which are also applicable to third parties.
Munich, June 4, 2015PricewaterhouseCoopersAktiengesellschaftAuditing Company (Wirtschaftsprüfungsgesellschaft)
Hendrik Fink ppa. Robert PrengelAuditor (Wirtschaftsprüfer)

Evonik Industries AG Paul-Baumann-Straße 1 45764 Marl [email protected] www.evonik.com