Embed Size (px)
Citation preview

EXAMINING HOPE, SELF-EFFICACY, AND OPTIMISM AS A MOTIVATIONAL
COGNITIVE SET PREDICTING ACADEMIC ACHIEVEMENT AND
GENERAL WELL-BEING IN A DIVERSE
EDUCATIONAL SETTING
by
MARCUS L. MCBRIDE
STEVE THOMA, CO-COMMITTEE CHAIR RANDALL SCHUMACHER, CO-COMMITTEE CHAIR
MICHAEL BROOKS JAMES MCLEAN
ELIZABETH WILSON
A DISSERTATION
Submitted in partial fulfillment of the requirements for the degree of Doctor of Philosophy
in the Department of Educational Studies in Psychology, Research Methodology, and Counseling
in the Graduate School of The University of Alabama
TUSCALOOSA, ALABAMA
2012

Copyright Marcus L. McBride 2012 ALL RIGHTS RESERVED

ii
ABSTRACT
Hope, self-efficacy, and optimism are concepts of motivational psychology that have
evidenced significant relationships with achieving goals and student achievement (Bandura,
1977; Snyder, 2004; Chang, 1998; Lin & Peterson, 1990). Research to test these measures across
diverse populations as a cognitive set and examine the constructs’ ability to predict student
achievement and general well-being are sparse (e.g., Schunk & Zimmerman, 2006). Cross-
cultural theoretical models investigating motivation in education fail to investigate constructs
within positive psychology (self-efficacy, hope and optimism) that are rigorously measured and
considered by Magletta and Oliver (1999) as “powerful, if not the strongest determinants of
human behavior” (p. 541). Investigating competence and control beliefs across diverse student
populations could yield important explanations for the disparity of scores in education among
African American and Caucasian students in academic settings.
This study specifically examined theoretically competing confirmatory factor models and
identified the best-fitting structural equation model dependent on variables of academic hope,
academic self-efficacy, and optimism in a diverse student population. The sample size (N = 466)
was made up of a diverse group of high school and college students. The results of the study
indicated that a system of competence and control adequately predicted student achievement and
general well-being. The results of the study also indicated that the structural model of a System of
Competence and Control did not differ according to age group, gender, and ethnicity in
predicting student achievement and general well-being.

iii
DEDICATION
I dedicate this work to my deceased father, Calvin McBride. Your early departure from
my life was quite untimely. However, to this very day I reminisce on many father-son memories
from my childhood and only wish that I could hear your laugh and see your smile. I hope that I
make you proud.
I dedicate this work to my mother, Mary Bell McBride. I am proud that you are a strong
woman of character and strength who, in spite of being a widow, raised two exceptionally gifted
young men. Your love, support, and guidance throughout my life has been phenomenal.
I dedicate this work to my brother, Terry McBride. At times when I did not believe in
myself, you believed in me. You have always been my biggest fan.
I dedicate this work to a woman who certainly makes my heart smile, my wife, Suzanne
M. McBride, M.D. When I felt like giving up, you held me up and when I wanted to run away in
defeat, you found the words to inspire my “wills” and “ways” to remain hopeful.

iv
LIST OF SYMBOLS AND ABBREVIATIONS
a Cronbach’s index of internal consistency
d Cohen’s measure of effect size
df Degrees of freedom: numbers of values free to vary after certain restrictions have been
placed on the data
F Fisher’s F ratio: A ration of two variances
M Mean: the sum of a set of measurements divided by the number of measurements in the
set
n Number of members in a limited portion of the total sample
N Number of members in a total sample
p Probability associated with the occurrence under the null hypothesis of a value as
extreme as or more extreme than the observed value
r Pearson product-moment correlation
R2 Measure of strength of relationship
SD Standard Deviation
t Computed value of t test
< Less than
= Equal to

v
ACKNOWLEDGMENTS
Without you, God, my journey to the Ph.D. would have completely halted. I am grateful
for your mercy, your love, and your favor in me. It is my faith and only my faith in you that
provided comfort in knowing that perseverance would one day pay off.
I am thankful for the ongoing support and encouragement from numerous mentors,
colleagues, and friends. Words of appreciation could not sum up the role you played in my
matriculation over the years--Drs. Liza Wilson, Kathy Wetzel, Annie Smith, Nirmalla Erevelles,
Hannah Gerber, and the late Kathleen Hughes.
I am forever grateful for my family and friends, who have offered compassion, support,
and laughter during the dissertation process. Thank you all for reminding me of the passion that I
began the race with towards the end; when at times I wanted to desperately pull up before the
finish line.
Lastly, I am appreciative for having an exceptionally skilled group of experts to serve on
my committee. Thank you all for your guidance and mentorship during the dissertating process.
Without you all, completing this journey would not have been possible. I am greatly indebted to
each of you--Drs. Steve Thoma, Michael Brooks, Liza Wilson, Randall Schumacher, and Dean
Jim McLean.

vi
CONTENTS
ABSTRACT .................................................................................................................................... ii
DEDICATION ............................................................................................................................... iii
LIST OF SYMBOLS AND ABBREVIATIONS .......................................................................... iv
ACKNOWLEDGMENTS ...............................................................................................................v
LIST OF TABLES ...........................................................................................................................x
LIST OF FIGURES ....................................................................................................................... xi
1 THE PROBLEM STATED........................................................................................................1
Introduction ..........................................................................................................................1
Background of the Study .....................................................................................................2
The Problem Statement ........................................................................................................5
Definitions............................................................................................................................6
Limitations ...........................................................................................................................8
Significance of the Study .....................................................................................................8
Research Questions ............................................................................................................12
Null Hypotheses .................................................................................................................13
Population ..........................................................................................................................13
Data Collection and Instrumentation .................................................................................14
Data Analysis .....................................................................................................................15
Organization of the Study ..................................................................................................16
2 LITERATURE REVIEW ........................................................................................................17

vii
Achievement Motivation Theory .......................................................................................18
Self-Determination Theory ................................................................................................19
Attribution Theory .............................................................................................................20
Goal Theory .......................................................................................................................21
Social Cognitive Theory ....................................................................................................23
Positive Personality Constructs, General Well-being and Academic Achievement ......................................................................................................................24
Hope Theory ......................................................................................................................27
Optimism............................................................................................................................28
Self-efficacy .......................................................................................................................29
Commonalities and Differences among Self-efficacy, Hope, and Optimism ....................30
Ethnicity, Gender, and Socioeconomic Class in Education ...............................................32
The Need for Future Research ...........................................................................................35
Summary ............................................................................................................................39
3 METHODS AND PROCEDURES .........................................................................................40
Rationale for Methodology ................................................................................................41
Site Selection .....................................................................................................................43
Sample Selection ................................................................................................................43
Participants ...................................................................................................................43
Procedures ....................................................................................................................44
Materials/Instruments ..................................................................................................45
Design ..........................................................................................................................49
Research Questions ............................................................................................................52
Null Hypotheses .................................................................................................................53

viii
Data Analysis .....................................................................................................................54
Analysis........................................................................................................................54
4 PRESENTATION AND ANALYSIS OF THE DATA ..........................................................62
Introduction ........................................................................................................................62
Null Hypotheses .................................................................................................................63
Stage 1: Pre-analysis Data Examinations and Data Preparation ........................................64
Missing Values.............................................................................................................64
Stage 2: Assessing Reliability and Validity of Constructs and Indicators .........................67
Stage 3: Development of the Measurement Models ..........................................................72
Stage 4: Structural Equation Models .................................................................................82
Multiple Group Structural Equation Models .....................................................................88
Gender Difference ........................................................................................................89
Multiple Group Comparison: Female versus Male ......................................................91
Summary ......................................................................................................................92
Ethnic Difference .........................................................................................................93
Multiple Group Comparison: Black versus White .......................................................94
Summary ......................................................................................................................95
High School versus College Difference .......................................................................96
Multiple Group Comparison: High School versus College .........................................98
Summary ......................................................................................................................99
Summary of the Results ...................................................................................................100
5 DISCUSSION ........................................................................................................................102
Structural Equation Models .............................................................................................109

ix
Relations among Variables ..............................................................................................111
Implications......................................................................................................................113
Conclusion .......................................................................................................................114
Limitations .......................................................................................................................116
Recommendations ............................................................................................................118
REFERENCES ............................................................................................................................119
APPENDICES:
A SUMMARY STATISTICS AND HISTOGRAMS .........................................................131
B RESEARCH INSTRUMENTS USED IN PRESENT STUDY ......................................163
C IRB APPROVAL .............................................................................................................169
D LISREL PROGRAM SYNTAX FOR MULTIPLE GROUP ANALYSES ....................172

x
LIST OF TABLES
1 Descriptives and Missing Values for Univariate Statistics ......................................................65
2 Reliability and Validity Estimates ...........................................................................................68
3 Correlations and Squared Correlations ....................................................................................70
4 Measurement Model 1: Student Achievement Confirmatory Factor Analysis ........................74
5 Measurement Model 2: Competence Belief System ................................................................75
6 Measurement Model 3: Control Belief System .......................................................................77
7 Measurement Model 4: General Well-being Confirmatory Analysis ......................................78
8 Confirmatory Factor Model 1: System of Competence and Control .......................................79
9 Proposed Confirmatory Factor Model 2: Competence and Control ........................................81
10 Correlation Matrix for Model of Competence and Control .....................................................81
11 Measurement Model Fit Statistics of Confirmatory Factor Models ........................................82
12 Comparison of Two Structural Equation Models ....................................................................87
13 Female versus Male SEM Model Comparison ........................................................................90
14 Multiple Group SEM Model Comparison: Female versus Male .............................................91
15 Black versus White SEM Model Comparison .........................................................................94
16 Multiple Group SEM Model Comparison: Black versus White ..............................................95
17 High School versus College SEM Model Comparison ...........................................................97
18 Multiple Group SEM Model Comparison: High School versus College ................................99
xi
LIST OF FIGURES
1 Measurement Model 1--Student Achievement ........................................................................50
2 Measurement Model 2--Competence Belief System ...............................................................50
3 Measurement Model 3--Control Belief System .......................................................................51
4 Measurement Model 4--General Well-being ...........................................................................51
5 All Measurement Models in Structural Model ........................................................................52
6 Proposed Confirmatory Factor Model 1 ..................................................................................56
7 Proposed Confirmatory Factor Model 2 ..................................................................................58
8 Proposed Structural Model 1 ...................................................................................................60
9 Proposed Structural Model 2 ...................................................................................................61
10 Measurement Model 1--Student Achievement ........................................................................73
11 Measurement Model 2--Competence Belief System ...............................................................75
12 Measurement Model 3--Control Belief System .......................................................................76
13 Measurement Model 4--General Well-being ...........................................................................77
14 Proposed Confirmatory Factor Model 1, System of Competence and Control .......................79
15 Proposed Confirmatory Factor Model 2, Competence and Control ........................................80
16 Proposed Structural Model 1 ...................................................................................................84
17 Proposed Structural Model 2 ...................................................................................................86
18 Female versus Male Hypothesized SEM Model ......................................................................90
19 Black versus White Hypothesized SEM Model .......................................................................93
20 High School versus College Hypothesized SEM Model .........................................................97

1
CHAPTER 1
THE PROBLEM STATED
Introduction
The research study presented here aimed at understanding how motivational constructs
operate to predict academic achievement and general well-being among diverse student
populations. Previous research suggests student motivation is just as powerful in predicting
student achievement as overall student intelligence (Côté & Levine, 2000). The first chapter of
the proposal introduced the study and explained the importance of examining student motivation
in diverse groups of students.
One goal of schooling and society in the United States is to develop students and citizens
who have high aspirations, believe in their capabilities, are hopeful they can realize their
aspirations and are optimistic about their future in general. Such characteristics are important
because each leads to overall well-being (Bandura, 1977; Scheier & Carver, 1985; Snyder,
Harris, Anderson, Holleran, et al., 1991), student achievement and graduation rates (Snyder,
Shorey, Cheavens, Pulvers, et al., 2002) through a personal sense of agency that allows them to
take control of their life, challenge themselves, persevere through difficulties and cope when
obstacles arise.
A personal sense of agency develops through an evolving system of competence and
control as individuals begin to discover who they are by identifying their capabilities and
realizing their potential to achieve goals (Little, Snyder, & Wehmeyer, 2006; Schunk &
Zimmerman, 2006). The term system of competence and control is used to highlight the

2
complexity of interacting beliefs, actions and outcomes. This system is based on the dual motive
theory that highlights the interactive and equal contributions of competence and control beliefs
(Schunk & Zimmerman, 2006; Snyder et al., 1991; Snyder et al., 2002). Competence beliefs are
the perceptions individuals have about their capabilities to achieve their goals. Control beliefs are
the perceptions that students have about the means, processes and odds in achieving their goals.
Both are necessary for goal attainment because a system of competence and control links actions
to outcomes.
A student with a well-developed sense of competence and control is more likely to study
for an examination when she or he believes they can learn algebra (competence) and can do well
on algebra tests (control). The student who believes he or she can learn algebra (competence) but
believes his/her teacher grades him/her unfairly (lack of control) is less likely to study because
actions (studying) are not linked to outcome (good test grade).
Previous research has established that competence and control beliefs are related, but
distinct constructs (Bryant & Cvengros, 2004; Magaletta & Oliver, 1999; Steed, 2002) that are
powerful predictors of student achievement (Onweugbuzie & Snyder, 2000; Snyder et al., 1991)
and coping and well-being (Chang, 1998; Pajares, 2002). However, most research highlights
single constructs that are focused on either competence or control beliefs; more research is
needed to examine how competence and control function in relationship to each other (Schunk &
Zimmerman, 2006).
Background of the Study
Student motivation is a fundamental component of academic success and/or failure.
Student motivation has been documented in previous literature as a deciding factor for poor

3
performing students’ decision to drop out of school (Bean, 1985; Ruberger, 1987; Tidwell, 1988;
Tinto, 1975). High school dropouts perceive that they are not as competent as other students are
(Horowitz, 1992) and do not feel in control of their academic pursuits in comparison to other
students (Dohn, 1992). Studying competence and control beliefs become extremely important for
educational research. Investigating student motivational systems will benefit educators with
information and tools to engage students and hopefully increase their desire to set educational
goals and drive for achieving goals set in the school setting.
A main focus of educational research should be centered on demonstrating best practices
and concepts that promote success in all students. Educational research should also aid school
districts in satisfying criteria to demonstrate adequate yearly progress (AYP). High school
graduation rates, student attendance and behavioral data are reviewed to determine the success of
school systems and resolve whether or not adequate yearly progress (AYP) has been met.
Research on motivation is critical in this regard because students who are not motivated
demonstrate boredom towards academics and are more likely to be disciplined more than
motivated students (Dohn, 1992). Students who are bored with school and displaying behavioral
problems are also more likely to miss school more often (Roeser & Eccles, 1998).
Students who fail to do well in school and who do not develop a resilient attitude about
educational goals and academic success are more likely to become high school dropouts. The
decision to drop out of high school causes a number of negative consequences. These
consequences are both detrimental to the individual student as well as other members of society.
High school dropouts are more likely to experience economic hardships, loss of self-esteem,
become drug users, and overall become a burden to society (Mensch & Kandel, 1988; Tidwell,
1988).

4
Developing a theoretical model for amotivated students would be incomplete without
first examining the relationship that competence and controls beliefs share with school success
and general well-being. This is an important area of research that not only extends to the domain
specific realm of academics, but competence and control beliefs also demonstrate a relationship
with students’ improved well-being (Deci & Ryan, 1991; Ryan & Connell, 1989). Students who
are intrinsically motivated display more competence and control for school achievement and are
more likely to stay in school, make better grades, and be well adjusted than students who are
amotivated (e.g., Connell & Wellborn, 1991).
Although the need to explore the role of student motivation in relation to competence and
control beliefs’ interaction with and predictability of student grades and well-being is well
demonstrated, there is limited research exploring the interplay of these constructs with relation to
ethnicity, socioeconomic status, and gender. If educators and researchers are to develop
successful interventions aimed at improving critical issues related to student achievement and
well-being--school dropout rates, future research is needed that explores students’ competence
and control beliefs. The limited availability of empirical studies examining the role of
competence and control beliefs across differing demographics is troubling given today’s
increasingly diverse classrooms along the lines of ethnicity, socioeconomic status, and gender.
Graham (1994) encourages researchers to explore motivational psychology in diverse
populations and argues that comparisons made between African Americans and Caucasian
Americans’ motivational systems must cautiously not contaminate socioeconomic class with
ethnicity. Other research has also acknowledged that competence and control belief research is
limited to White middle class populations and encourages future research to explore diverse
populations (Pintrich, 2003; Schunk & Zimmerman, 2006).

5
An additional commonality appearing in research related to motivation, ethnicity
comparative studies and academic achievement surrounds the differing achievement outcomes
for ethnic minority students. Moreover, African Americans and Hispanic students on average
earn lower grades than Caucasian American students do. This is noted as the gap in academic
achievement among ethnic groups and a number of theoretical works posit different remedies
and causes for the disparity of scores among African Americans and Caucasian American
students. Kao and Thompson (2003) state that most of the contemporary theories explaining
educational achievement differences among ethnic groups are dependent upon explanations of
cultural orientations that either promote/discourage academic achievement or assert that the
structural position that society places on the ethnic group is a factor affecting educational
attainment. Additionally, limited research exists informing educators and researchers on how
ethnicity intercedes with motivational belief systems ability to self-regulate academic goal
setting and the attainment of educational success.
The Problem Statement
Examining and understanding potential ethnic differences about motivational constructs,
performance and achievement are critical to establish whether these constructs can be
generalized across populations (Pintrich, 2003). Research exploring achievement motivation in
the past has focused much attention to the ethnicity comparative effects between African
Americans and Caucasian Americans (Graham, 1994). As such, focusing on ethnicity
comparative effects has neglected to provide factual empirical research on how motivational
psychology functions in achievement motivation for African American and Caucasian American
students (Graham, 1994). Another problem within ethnicity comparative studies of motivational
6
psychology research is that African Americans are overrepresented in lower socioeconomic
statuses when compared to middle class populations of predominately Caucasian Americans.
Therefore, previous cross-cultural motivational studies have neglected to separate ethnicity and
class. In efforts to shun the same mistakes of prior research examining motivational constructs in
race comparative studies, this study does not attempt to provide a classification of low versus
higher in achievement motivation in relation to student achievement. The homogeneity of social
class and diversity of ethnicity in the study also excludes overrepresentation of either ethnic
group. This study aimed to reveal a motivational cognitive set composed of interrelated
competence and control beliefs that are influential in the academic pursuits of students and
predict academic achievement and educational goals in African American and Caucasian
American students.
Definitions
Hope--Hope is a motivational cognitive set composed of agency and pathways
perceptions, two reciprocal components involved in goal-directed thinking and action (Snyder et
al., 1991). Combined, the two constructs, agency and pathways, interact to generate effort and
persistence to achieve goals; agency sustains one’s attention and energy and pathways redirects
attention and energy when obstacles arise. Although agency and pathways are reciprocal,
additive and positively related, both agency and pathways are separate and measurable as
evidenced by the Hope Scale (Snyder et al., 1991). Hope includes both competence and control
beliefs. Hope agency is a competence belief and hope pathways is a control belief.

7
Agency--Agency reflects perceptions about the will or determination that one has about
their ability to obtain a goal; it reflects a “can do” attitude (Snyder et al., 1991). Agency is a
competence belief.
Pathways--Pathways reflects perceptions about the ways or possible routes that one
envisions during goal pursuit (Snyder et al., 1991). Pathways is a control belief.
Optimism--Optimism is thought processes of associating positive thinking and
maintaining a positive attitude to life events and situations (Scheier & Carver, 1985, 1992;
Seligman, 1991) and is viewed as a cornerstone for general well-being across life domains
(Peterson, 2000). Optimism is a control belief.
Self-efficacy--Self-efficacy is a self-referencing thought process concerning the
perception that one has concerning their capability to exercise control over their functioning
(Bandura, 1977, 1986). There are multiple sources of self-efficacy beliefs, but mastery
experiences—how one interprets, evaluates, and judges their competence—is the most powerful
source (Bandura, 1997). Self-efficacy is an essential thought referencing process for students’
success in the academic environment (Bandura, 1997). Self-efficacy is a competence belief.
System of Competence and Control Beliefs--A term used to acknowledge that competence
and control beliefs are a part of a cognitive skill set. It is used to represent that the two beliefs are
intertwined components of goal directed behavior.
Motivational Cognitive Set--A term used to acknowledge hope, optimism, and self-
efficacy as a higher order thinking skill set.

8
Limitations
This study was in part limited to the cooperation of school districts, administrators, and
classroom teachers. Access to high school aged students and individual student data within
certain school districts is a difficult task. The participants in the study were recruited on a
voluntary basis, but even after receiving parental permission for access to student records the
school administrators were reluctant to release individual student data on the basis of the Family
Educational Rights Privacy Act (FERPA). Note that time also played a key factor is securing
accurate data from the high school aged population. The research was also limited because of
time restraints and school policies that prohibit research activities during instructional time. The
data collection phase of the research study was conducted in the least intrusive manner for the
school district regarding time and instructional activities. However, because of the time restraint
follow up qualitative data reports of students or teachers were not available.
The demographics of the study were not controlled. However, the study was conducted in
a manner to recruit diverse student populations at the high school and college aged levels.
Significance of the Study
Competence and control beliefs are central components within motivational psychology
demonstrating ability to predict goal setting and achievement (Schunk & Zimmerman, 2006). It
was particularly important to explore competence and control beliefs in a diverse school setting
with student groups who typically display success in academic achievement and those who
perform poorly in academics. Presently, there is limited research exploring how competence and
control beliefs operate as a system within African American and Caucasian American students
(Schunk & Zimmerman, 2006).

9
Achievement motivation literature iterates that competence and control beliefs are
positive psychological mechanisms that influence a person’s drive and desire to achieve goals.
Exploring competence and control beliefs within differing student settings will enable
researchers to expand the current achievement motivation literature to explain how competence
and control beliefs interact to form a motivational system that interplays with students’ ability to
set and achieve goals in the academic environment.
Competence and control beliefs, specifically those identified within this study—hope
(Snyder, Harris et al., 1991), optimism (Scheier & Carver, 1985) and self-efficacy (Bandura,
1977, 1997) are heavily ingrained within achievement motivation literature. These motivational
constructs (hope, optimism and self-efficacy) are linked with student educational achievement
and academic goal setting within positive psychology literature (McDermott & Snyder, 2000;
Snyder et al., 1997).
This study was particularly important because this investigation crosses the typical race
or ethnic boundary that occurs widespread within research in psychology, especially within the
study of motivational psychology and African American students (Graham, 1994). Investigating
competence and control beliefs across diverse student populations will yield important
explanations surrounding the disparity of scores in education among African American and
Caucasian students in academic settings.
Many of the studies that examine ethnicity and gender differences treat each as a
demographic control variable rather than a criterion variable used to establish the reliability and
validity of competence beliefs measures (Huan, Yeo, Ang, & Chong, 2006; McNeal, Handwerk,
& Field, et al., 2006). If ethnicity is used as a criterion variable in examining self-efficacy, hope,
and optimism it would examine the cultural competency in psychological components referenced

10
as the most influential determinants of human behavior (Magaletta & Oliver, 1999) in predicting
motivation across cultures.
The purpose of educational and motivational research is to provide knowledge to existing
fields of study and beneficial summaries that improve practices within the area researched.
Researchers have identified multiple factors surrounding ethnic group orientation or ethnic
identity when explaining the gap in academic achievement that exists across cultures, especially
between African American students and Caucasian American students (Arroyo & Zigler, 1995;
Fordham & Ogbu, 1986). However, the existing research is inconsistent and fails to examine
motivational components in academic settings as a possible determinant in differing achievement
outcomes.
Examining relationships that motivational constructs have in diverse settings may
identify the role of ethnicity in pedagogy and theoretically define how students rely on personal
interactions and observations to build and/or dissemble their motivation for success in school
environments. This study was set apart from other ethnic comparative studies because it did not
function to identify deficits in different ethnic groups, but it focused on the individual strengths
that possibly lead to increasing the students’ perception of personal and material resources in the
educational setting. This study contributes to the field by examining a motivational cognitive set
composed of interrelated competence and control beliefs that are influential in the academic
pursuits of all students and predict academic achievement and educational goals in both African
American and Caucasian American students.
This study intended to reveal an important motivational cognitive set by using a social
cognitive theory approach to identify how these concepts that are usually examined separately
operate in combination. Cross-culturally examining hope, optimism, and self-efficacy in

11
combination is one fundamental step in discovering how some cultures and student populations
differ from others in motivation for education. The academic environment is the primary setting
for “the cultivation and social validation of cognitive competencies” leading to intellectual
efficacy (Bandura, 1994, p 78). Thus, according to Bandura’s theory, the disparity of scores in
academic achievement represents differences among the intellectual efficacy among ethnic
groups, not intelligence. Bandura’s sources of strengthening and developing self-efficacy rely on
individual social experiences dependent upon one’s vicarious experiences provided by social
interactions (Bandura, 1994). The social experiences of the student in turn shape his/her ability
to perceive resources available for goal accomplishment. Positing that differences may exist
between cultures is not in an effort to identify a deficit among minority children. However,
examining self-efficacy, hope, and optimism as a cognitive set that is dependent on each other
will display the ways by which the perception of resources may vary within and between
cultures. The ability to perceive one’s capability to perform depends upon resources available,
and both in turn reflect how optimistic one is about attaining the goal.
Although it is necessary to establish the predictive nature of these constructs as a
cognitive set, it is not sufficient. It is also important to develop an understanding how a system of
competence and control functions (Schunk & Zimmerman, 2006). Therefore, the literature
review follows to identify how each construct contributes to academic achievement and general
well-being. To better understand the how the constructs interact to form a motivational system
of competence and control beliefs, the method section of this study outlined how comparisons
are made concerning the motivational systems of African American and Caucasian American
high school and college students. The comparison between the ethnic groups was made for two
reasons. First, competence and control belief research needs to be extended to a more diverse

12
population. Schunk and Zimmerman (2006) argue that most competence and control belief
research has used predominantly Caucasian Americans as research participants, and that “there is
a need to test the influence of competence and control beliefs with diverse student populations”
(p. 362). Second and just as important, comparing and contrasting different systems created a
better opportunity to understand how systems function.
Research Questions
This study examined the following research questions:
Research Question 1: Are the observed variable indicators for Measurement Model 1
statistically significant in a confirmatory factor analysis?
Research Question 2: Are the observed variable indicators for Measurement Model 2
statistically significant in a confirmatory factor analysis?
Research Question 3: Are the observed variable indicators for Measurement Model 3
statistically significant in a confirmatory factor analysis?
Research Question 4: Are the observed variable indicators for Measurement Model 4
statistically significant in a confirmatory factor analysis?
Research Question 5: What is the best-fitting confirmatory factor model for the measures
of academic hope, academic self-efficacy, and optimism?
This study further tested the following structural model research questions:
Research Question 6: Are the relations amongst the latent variables statistically
significant in the proposed structural models?
Research Question 7: Are there significant differences by group (ethnicity, gender, and
age group) for the structural model predicting Student Achievement and General Well-being?

13
Null Hypotheses
The following research hypotheses were formulated to study the research questions:
Hypothesis 1.1: There will be no differences between theoretically competing
confirmatory factor models on the proposed motivational system of competence and control
beliefs (academic self-efficacy, academic hope, and optimism).
Hypothesis 1.2: The observed variables (academic self-efficacy, academic hope, and
optimism) will load on a single factor with no distinction between competence and control
beliefs.
Hypothesis 2.1: The structural equation model indicating the system of competence and
control beliefs directly influences academic achievement and general well-being represents the
sample data variance-covariance matrix. The proposed system of competence and control beliefs
is more predictive than the separated measures of competence and control and produces a good
fit.
Hypothesis 2.2: There will be no differences found across the structural equation model
by ethnicity, gender, or age group.
Population
The population for the study was high school and college-aged students located in the
southeastern United States. The high school population was recruited from two school systems
representing urban and rural schools. The high school population numbered approximately 500
students. However, there were 197 student participants recruited from the high school included
in the results. The college age students were recruited from a large public university. There were

14
269 student participants recruited from the university included in the results. The intricate details
about the population in the study are explained in detail in the method section of the study.
Data Collection and Instrumentation
Student participants were asked to identify gender, ethnicity, age, year in school,
academic achievement, and educational goals. The academic achievement measure used was a
Likert-type self-report instrument that asked students to identify the types of grades that they
typically make in core subject areas. A Likert-type scale requiring student participants to rate the
importance of their classroom grades was used to assess educational goals. The student
participants were asked to complete the following Likert-type scales measuring academic hope,
academic self-efficacy, optimism, and general well-being:
Academic Hope Scale (AHS)--a domain specific 8-point Likert-type measure of academic
hope.
Academic Self-Efficacy Scale (ASES)--a domain specific 6-point Likert-type measure of
academic self-efficacy.
Life Orientation Test Revised (LOTR)--an instrument measuring dispositional optimism
on a 5-point Likert-type scale.
Self-Image Questionnaire for Young Adolescents (SIQYA)--three subscales of the
SIQYA was administered to measure general well-being. The subscales are 5-point Likert type
capturing emotional tone, peer relationships, and behavior control.
Each of the scales used in this study have demonstrated appropriate reliability and face
validity in previous studies. The pilot study also demonstrated face validity for the measures

15
used in the study. This aspect of the research study was further explained in the method section
of the proposal.
Data collection was conducted during the most opportune times for the schools identified
by administrators for the high school population. The research goal was to collect data in one
sitting for approximately 20 minutes by administering the Likert-type instruments and collecting
demographic information. Data collection for the college age population was very similar, but
the college aged students presented more flexibility in administering the Likert-type instruments.
The research plan was to sample undergraduate classes for student participants.
Data Analysis
The data were analyzed by two different procedures. The researcher hoped that the
proposed study would warrant the approximate number of student participants in order to
demonstrate appropriate power for structural equation modeling. The measurement models and
structural models posited are detailed in the method section and the models were assessed using
SPSS 16.0 and LISREL Version 8.80 computer programs. The measurement models and
structural models were analyzed by ethnicity, gender, and age group.
SPSS Version 16.0 was used to analyze the data in addition to LISREL Version 8.80
computer program to provide multivariate analysis of variance (MANOVA). The mean scores
were compared for each measure using a MANOVA for African-American and Caucasian
American students between ethnic groups, gender, and age group. Regression models for
African-American and Caucasian-American students were developed and tested to assess
whether the models account for a significant amount of the variance in predicting academic
achievement and general well-being.

16
Organization of the Study
Chapter 1 detailed: (a) a comprehensive introduction to explain the need for research
examining competence and control beliefs, student achievement and general well-being in
diverse student populations; (b) an overview of problems associated with poorer performing
students and amotivated students; (c) a statement of the problem; (d) definitions and
delimitations; and (e) research questions and hypothesis. Chapter 2 included the conceptual
framework and the review of the literature focusing on the: (a) theories of motivation, positive
personal traits, and general well-being; (b) recent research explaining the interrelationship among
competence and control beliefs; and (c) current research literature on competence and control
beliefs by ethnicity, gender, and socioeconomic status. Chapter 3 described the methods and
procedures used in the study including a selection of the sample data collection. Chapter 4
presented the data analysis and results as well as explains the statistical procedures performed.
To conclude, Chapter 5 revealed the final discussion, implications, and recommendations made
for future research.

17
CHAPTER 2
LITERATURE REVIEW
This study relied on the dual motive theory (Schunk & Zimmerman, 2006), which
highlights an interaction among an individual’s (a) perception of competence, (b) means and
processes to pursue and achieve goal(s), (c) perception of control and (d) the actual outcome or
end result. This study was further supported by Bandura’s (1986) social cognitive theory of
motivation, which emphasizes the impact of social experiences in shaping the way in which
students view and demonstrate motivation. Recognition of such social experiences is crucial
given that diversity in educational settings is rapidly increasing. In order to understand how
competence and control constructs operate, we must account for differing social experiences
along the boundaries of ethnicity, gender and socioeconomic status.
The main arguments for the investigation of the interaction among competence and
control beliefs predicting academic achievement and psychological well-being were related to
the shared assumptions and generalizations among several prominent theories of motivation:
achievement motivation theory, self-determination theory, attribution theory, goal theory and
social cognitive theory. These theories of motivation “postulate a key role for competence
and/or control beliefs in motivation and achievement” (Schunk & Zimmerman, 2006, p. 349). In
so doing, these theories of motivation substantiated the importance of conceptualizing the study
of motivation around competence and control beliefs across diverse ethnic groups,
socioeconomic status, and gender groups.

18
Achievement Motivation Theory
Achievement motivation is widespread component of daily interactions. It is best
summarized as a theory posited to explain the desire to be competent in activities that appear
important enough to expend effort towards accomplishing an outcome (Elliot & Church, 1997).
Contemporary achievement motivation theory expanded from Atkinson’s (1957) study of
expectancy value theory (Schunk & Zimmerman, 2006). Atkinson’s (1957) theory explained
achievement behavior as (a) a result of expectancy of certain outcomes from exhibiting some
behavior and (b) the associated value placed on the outcome (Schunk & Zimmerman, 2006).
Atkinson’s theory has since been modified within the achievement motivation literature and
contemporary theorists suggest that goal-directed behavior is not solely a result of expectancy or
outcomes.
Contemporary achievement motivation theorists acknowledge competence and control
beliefs have a major role in one’s goal directed behavior (Schunk & Zimmerman, 2006). The two
most familiar approaches emphasized in achievement motivation theory related to displaying
competent behavior in goal pursuit is (a) performance goal approach and (b) mastery goal
approach (Elliot & Harackiewicz 1996). A performance goal explains the desire to display
competence in comparison to others (e.g., selecting easy tasks to appear competent) and a
mastery goal approach highlights engaging in behaviors to master tasks for the development of
competence (e.g., perseverance during difficult tasks) (Elliot & Church, 1997). A mastery goal
approach outweighs the performance approach as the student who uses a mastery goal approach
wishes to fully understand and master the task at hand opposed to the student who performs for
favorable judgments of competence by others.

19
The achievement motivation theory aids in explaining a system of competence and
control beliefs. It confirms the interplay of both beliefs even though achievement motivation
theorists implicitly explain the control belief component as an aspect of expectancy or the focus
placed on the behavior for a certain desired result. The achievement motivation theory rests upon
an interaction among both competence and control beliefs. Competence beliefs are highlighted in
the achievement motivation theory as task-specific judgments about one’s capability and control
beliefs are emphasized in the theory as the idea that one’s actions will eventually lead to desired
outcomes (Schunk & Zimmerman, 2006).
Self-determination Theory
Unlike other theories of motivation, self-determination theory prefaces that people pursue
goals and display goal related behavior to satisfy a basic psychological need (Deci & Ryan,
2000). Ryan and Deci’s (2000a) self-determination theory has led to voluminous amounts of
research on human behavior that examines the need to have necessary skills to execute action,
the need to belong, and the need for independence (Seligman & Csikszentmihalyi, 2000). These
three areas proposed by Ryan and Deci (2000a): competence, relatedness, and autonomy are
cornerstone principles of the study of human motivation.
The self-determination theory (Ryan & Deci, 2000a) contributes to future research
examining the role of competence and control beliefs as it recognizes that basic human needs
drives motivation and positive human behavior. Ryan and Deci (2000a) claim that when the
basic biological needs are met, self-motivation is enhanced and improved mental health occurs.
This is important for understanding the role of competence and control beliefs in predicting both
academic achievement and general well-being. Research on self-determination theory serves as

20
an enabling route of empirical evidence that substantiates how the need to master one’s
environment (competence) and one’s desire to control environmental interactions (control)
influence human motivation. Self-determination theory links internal (intrinsic) and outside
external (extrinsic) sources as key motivating factors which determine how the competence and
control belief systems interact in combination to enhance self-motivation.
Self-determination theorists focus research with a comprehensive understanding of goal-
directed behavior and psychological development and well-being (Deci & Ryan, 2000). Self-
determination theory provides a foundation that supports research exploring interactions shared
among students’ psychological well-being and perceptions of competence and control of their
actions in academic goal pursuits.
Attribution Theory
Attribution theory emphasizes control beliefs over competence beliefs and states that an
individuals’ perception of competence or incompetence can be dependent upon attributions
(Weiner, 1979). The attribution theorists are more concerned with finding out the perception of
causality or determining why the particular incident occurred (Weiner, 1972). Attribution
theorists posit that attributions such as ability, effort, ease and task difficulty, and luck as well
other attributions are responsible for achievement successes and failures (Schunk & Zimmerman,
2006).
This theory is important in the aspect of both competence and control beliefs. However,
as previously mentioned, attribution theorists fail to give proper recognition for the sole
interaction of competence beliefs. Within the attribution theory of motivation dimensions are
parted among the attribution being either (a) internal or external, (b) relatively stable or unstable

21
over time (Weiner, Frieze, Kukla, Reed, Rest, & Rosenbaum, 1971) and (c) viewed as
controllable or uncontrollable (Weiner, 1979). According to the attribution theory, these
aforementioned attributions are responsible for the motivation that students display to strive to
learn and achieve academically. This aspect of attribution theory highlights those internal, stable,
and controllable attributions for outcomes cause a student to perceive that they have control over
their learning environment (Schunk & Zimmerman, 2006). Competence beliefs can operate in a
similar manner to influence motivation of students. The internal, stable, and controllable
attributions that function to increase student’s perception of control beliefs could also increase
the students’ perception of competence (Schunk & Zimmerman, 2006).
The attribution theory of motivation is an important theory to consider when examining
an interaction among competence and control beliefs. Schunk and Zimmerman (2006) argue that
an interaction of motivational beliefs research approach will more adequately capture the role of
competence and control beliefs. The separation among motivational theories acknowledging
only competence or control, or pitting the two beliefs against one another to determine its role in
motivation, has failed to demonstrate the role of motivational systems in predicting achievement
(Schunk & Zimmerman, 2006).
Goal Theory
Goal theory of motivation emphasizes the interaction among competence and control
beliefs. This theory of motivation encompasses a broad range of variables in motivation to
explain achievement motivation (Schunk & Zimmerman, 2006). Goal theory considers an
interaction among attributions, individuals’ goals, expectations, social comparisons of self with
others, and conceptions of ability (Linnenbrink & Pintrich, 2002; Pintrich, 2000). Goal

22
orientation, the key factor in goal theory, focuses on the goals and rationale that one perceives
for achievement related behavior instead of looking at a level of motivation (Middleton &
Midgely, 1997).
Goal theory identifies two achievement goals that receive much attention in the literature.
Mastery goal, the goal to improve or develop ability, and performance goal, the goal to look
more competent than others, are the two motivational approach type goals of goal theory (Dweck
& Leggett, 1988; Elliot & Dweck, 1988). The mastery goal approach directs attention to building
competence. When a student engages in mastery goal approaches, he or she develops more
strategies to improve their skills and raise their self-efficacy. The mastery goal approach centers
around building competence as a means to persisting through difficulty, pursuing tasks, and
remaining motivated (Schunk & Zimmerman, 2006). The performance goal approach relates to
control beliefs. Students who aim to look more competent than others or outperform peers focus
to control their successes and failures (Elliot & Harackiewicz, 1996).
Competence and control beliefs function to increase goal directed behavior, but in goal
theory the two beliefs are manipulated by the two differing approach goals. Goal theory provides
a foundation for a complete examination of how approach goals interact with student
engagement and motivation to either promote competence or control when involved in goal
pursuit. Both mastery goal approach and performance goal approach work in relationship with
competence and control beliefs. Self-efficacious students engage in mastery goal approaches,
their competence builds making them less likely to use peer ratings, and social comparisons that
could weaken their competence in goal directed behavior (Schunk & Zimmerman, 2006).

23
Social Cognitive Theory
Bandura’s (1986) social cognitive theory also supports the framing of motivation in
competence and control terms. Bandura highlights the interaction between competence and
control beliefs within the human agent as a necessary component of goal directed behavior and
motivation (Schunk & Zimmerman, 2006). The social cognitive theory implies that people are
social beings that formulate their actions based upon observations and social interactions. Social
cognitive theory declares that the environment and experiences of a person have an effect on
his/her behavior and efficacy beliefs that maintain motivational processes (Bandura, 1977). Self-
efficacy was defined by Bandura (1977, 1997) as the perception that one has concerning their
capability to exercise control over their functioning. Self-efficacy is informative of how
competence and control beliefs influence outcomes as well as how these beliefs serve as
powerful psychological strengths discussed throughout the achievement motivation literature.
Self-efficacy is the key competence belief and outcome expectancies is the control concept in the
social cognitive theory, which iterates that both beliefs are necessary sources for academic
motivation (Schunk & Zimmerman, 2006).
Bandura eloquently summarized his model as, “What people think, believe, and feel
affects how they behave. The natural and extrinsic effects of their actions, in turn, partly
determine their thought patterns and affective reactions” (1986, p. 25). In the Western world
where positive self-beliefs are linked with motivation and positive academic outcomes it is
understood that ways to manipulate positive feelings about oneself would in turn elevate
motivation and self-regulation behaviors influencing outcomes. According to Bandura’s social
cognitive theory, goal setting and actions that influence the ability to sustain efforts towards
attaining the goal involve “things that give them self-satisfaction and a sense of pride and self-

24
worth, and refrain from behaving in ways that give rise to self-dissatisfaction, self-devaluation,
and self-censure” (Bandura, 2001, p.8). This idea supports the study that competence and control
belief systems should therefore have a positive relationship with general well-being as well as
student achievement.
Positive Personality Constructs, General Well-being and Academic Achievement
Bandura explained that a person’s perception of efficacy was the foundation of
motivation and action (Bandura, 1986). Research conducted by Zimmerman, Bandura, &
Martinez-Pons (1992) confirms that students’ perception of their efficacy beliefs to control their
academics were highly predictive of their academic goal setting and achievement. This research
study in part established the foundation for future research studies detailing how influential
students’ beliefs about their means to control and direct their learning positively impacted their
educational experience. The study detailed that self-regulation of motivation was dependent upon
self-efficacy beliefs. The research also yielded important revelations that have transpired into the
study of positive psychological mechanisms that influence motivation (Pajares, 2001). In
addition to pointing out the role of self-beliefs on academic goal setting and achievement, it
evidences that the role that other social factors such as parental involvement and parental goals
set for students reveal a connection with the students’ academic achievement. The results
indicated that parents’ goals for students was balanced by the students’ belief in their academic
efficacy.
Within social cognitive theories of motivation, it is evident that the social environment
and experiences operate to shape the motivational level of individuals. Numerous research
studies have confirmed the impact of efficacy beliefs on achievement goals and goal directed

25
behavior (Marsh, 1990; Pajares, 1996; Schunk, 1991; Zimmerman, 1989). However, these
theories of motivation suggest relationships between academic motivation and positive
psychology constructs, but many of these constructs have not been included in studies of
academic motivation (Pajares, 2001). Research aimed at identifying positive personality traits
must not remain void of examining these positive psychology constructs and academic
motivation in diverse groups in order to: (a) identify the concept as culturally relevant, (b)
determine if reliable instruments for measuring concepts are developed, and (c) conclude if any
cross-cultural differences exist within the concept.
Positive personality constructs are regarded as important components in theories of
motivation that have evidenced important conclusions and implications concerning basic human
drives (Bandura, 1986; Deci & Ryan, 2000). Research on positive personal constructs existed
long before the recent convergence by the positive psychology movement (Seligman &
Csikzentmihalyi, 2000). Prior to recognition of the study of positive personality constructs as the
positive psychology movement, positive personal constructs had already been proven as
fundamental psychological components that influence human behavior and motivation. In
addition, positive psychology theorists posit that positive personality constructs have a
connection with student motivation (Purkey, 2000; Seligman & Csikzentmihalyi, 2000).
Bandura’s research on self-efficacy and efficacy beliefs (1977, 1997) was a forerunner of
the positive psychology movement. Empirical research on subjective well-being preceded the
positive psychology movement by nearly three decades (Diener, Emmons, Larsen, & Griffin,
1985). In addition, prior research evidencing the role of positive expectancies established
optimism as a key determinant in human behavior prior to the recent study of positive
26
psychology (Seligman et al., 1991). The aforementioned research studies are to illustrate how the
study of positive psychology has a long history and broad foundation.
Students who hold positive self-feelings (well-being), believe in their ability
(competence), use mastery goal approaches, and self-regulatory techniques (control) engage the
world with optimism (positive expectancies) and regard their accomplishments as well deserved
(Pajares, 2001). Other research supports these claims, suggesting that goals direct motivation
and a wide range of actions such as cognition and learning associated with psychological well-
being and self-evaluation (Kaplan & Maehr, 1999). Students who value educational domains will
outperform those who do not and their pursuit of educational goals, routes to achieve those goals,
and overall well-being when encountering difficulty is operationalized differently than students
who do not value education (Bandura, 1997; Eccles, 1983; Pajares, 2001). This confirms that
overall well-being, feelings of self-worth and competence and control beliefs share relationships
within the academic environment to aid in student achievement.
The interaction among competence and control beliefs is particularly important to
determine how student’s motivational systems function (Schunk & Zimmerman, 2006). For the
present study, three familiar motivational constructs have been identified for investigation: hope,
self-efficacy, and optimism. These constructs were chosen for several reasons: (1) each measures
different aspects of competence and control; (2) they are well-established within the research
literature; and (3) each is predictive student achievement and well-being. These motivational
constructs have also demonstrated relationships with student achievement (Bandura, 1977;
Snyder, 2004; Chang, 1998; Lin & Peterson, 1990) and psychological well-being (Kaplan &
Maehr, 1999). According to the dual motive theory, the constructs selected for investigation—

27
hope, optimism, and self-efficacy--should provide insight on motivational processes associated
with student achievement.
Hope Theory
Hope is defined as “a positive motivational state that is based on an interactively derived
sense of successful (a) agency (goal-directed energy) and (b) pathways (planning to meet goals)”
(Snyder et al., 1991, p. 571). Hope theory explains the motivational cognitive set composed of
agency and pathways perceptions, two reciprocal components involved in goal-directed thinking
and action (Snyder et al., 1991). Agency reflects perceptions about the will or determination that
one has about their ability to obtain a goal; it reflects a “can do” attitude (Snyder et al., 2002).
The “can do” attitude of hope agency reflects a perception of competence in one’s ability to
sustain towards goal completion. Pathways reflects perceptions about the ways or possible routes
that one envisions during goal pursuit. The envisioned routes to achieve the goals set are
perceptions of one’s sense of control during goal pursuit. Combined, the two constructs interact
to generate effort and persistence to achieve goals; agency sustains one’s attention and energy
and pathways redirects attention and energy when obstacles arise. Although agency and
pathways are reciprocal, additive and positively related, both agency and pathways are separate
and measurable (Chang & Banks, 2007; Magaletta & Oliver; 1999; Snyder et al., 1991).
Hope influences outcomes in achieving goals and higher grades (Snyder, Harris,
Anderson, et al., 1991); promoting healthy coping strategies with illness (Moon & Snyder,
2000); and better study skills (Onweugbuzie & Snyder, 2000). Further research on hope theory
has enabled instruments to measure hope in different domains of life. Recent research has
investigated the original dispositional hope measure and categorized specific life domains
28
(Campbell & Kwon, 2001; Kwon, 2002; Sympson, & Snyder, 1997). Campbell and Kwon
(2001) constructed the Domain-Specific Hope Scale (DSHS). Academic hope has been
recognized as part of the domain specific components of hope theory, but studies using the
domain specific measure of academic hope are limited. The DSHS was derived from the
Dispositional Hope Scale (DHS) and is composed of measures representing other domains such
as social, work, romantic, family, and leisure activities.
The Academic Hope Scale (AHS) has not been extensively researched across different
student demographics. However, the AHS has been validated and academic hope has been
established as a component of hopefulness (Campbell & Kwon, 2001), but research evidencing
academic hope robust across cultures is non-existent. This identifies the importance of this study
to further validate the domain specific hope scale’s component of academic hope by establishing
an empirical study examining different ethnic, gender, and class statuses.
Optimism
Optimists have a positive outlook on future events and pessimists have more negative
expectations. Optimists have a general expectancy of positive results which have been proven to
have a positive relationship with success in attaining goals (Shepperd, Maroto, & Pbert, 1996).
Scheier and Carver (1985) identify dispositional optimism as the degree to which a person has
positive expectancies about their future. Dispositional optimism refers to an individuals’ ability
to expect positive outcomes and “believe that good rather than bad things will happen,” (Scheier
& Carver, 1985 p. 219). Students who perceive positive expectancies in the pursuit of goals are
more likely to persevere in the face of difficulty and identify more ways to reach the goals set in
the event of obstacles that may arise.

29
Optimism is connected with positive outcomes in achievement, coping strategies, and
adjustment in college (Chang, 1996; Aspinwall and Taylor, 1992; Lin and Peterson, 1990).
Optimism focuses on expecting good results and not concentrating on adverse outcomes.
Optimism is a form of control belief because it is a general expectancy of a positive outcome.
This aspect of optimism expecting positive outcomes is derived from experiences within the
social environment. The study of optimism connects positive psychology to the social cognitive
theory of motivation.
Self-efficacy
Self-efficacy is essential in the conscious and unconscious efforts of the human self to
alter any of its own inner states or responses (Vohs & Baumeister, 2004). Bandura (1977, 1997)
defines self-efficacy as a self-referencing thought process concerning how people view their
capabilities. Self-efficacy is explicitly a competence measure, but the aspect of control is
implicitly associated with self-efficacy in theory. “It is no surprise that perceptions of self-
efficacy may be central to self-regulation; it is difficult to envision an organism that possesses
the capacity to reflect on its capabilities for action but does not incorporate those self reflections
into its decision-making calculus” (Cervone, Mor et al., 2004). Self-efficacy perceptions also
influence other concepts of the ability to perceive control that is interrelated with a person’s
ability to regulate his/her behavior (Cervone et al. 2004).
Self-efficacy is a self-referencing thought process concerning the perception that one has
concerning their capability to exercise control over their functioning (Bandura, 1977, 1986).
There are multiple sources of self-efficacy beliefs, but mastery experiences--how one interprets,
evaluates, and judges their competence--is the most powerful source (Bandura, 1997). Self-

30
efficacy is an essential thought referencing process for students’ success in the academic
environment (Bandura, 1997). Efficacy beliefs are highly predictive of academic goal setting and
achievement (Bandura, 1997; Bong, 2001; Zimmerman, 2000; Zimmerman et al., 1992), and
self-regulatory behaviors and effort (Pajares, 2002).
Commonalties and Differences among Self-efficacy, Hope, and Optimism
There has been a large amount research investigating the impact of motivational factors
on academic success and behavior (Anderman & Maehr, 1994; Stipek, 2002). Hope, optimism
and self-efficacy are concepts of positive psychology that have evidenced significant
relationships with goal directed behavior and student achievement (Bandura, 1977; Snyder,
2004; Chang, 1998; Lin & Peterson, 1990) and psychological well-being (Kaplan & Maehr,
1999). Research to test these measures across diverse populations as a cognitive set and examine
each constructs’ ability to predict student achievement along lines of ethnicity and gender is
sparse.
Bandura’s (1977, 1997) emphasis on self-efficacy as a critical element in directing
actions to achieve an end result would be dependent on Snyder et al.’s (1991) definition of hope.
For hope adds the element of control, perceiving the resources needed to aid one’s belief in their
ability to get the job done. Both self-efficacy and hope would in turn influence one’s ability to
have an optimistic demeanor or expect a positive result while attempting to reach a goal or
complete tasks.
Self-efficacy is the perception one has about their capability to perform certain tasks
(Bandura, 1977, 1986, 1997). Self-efficacy is a competence belief characterized by the statement
“I think I can.” Control beliefs are important within self-efficacy theory, but are conceptualized

31
as an outcome of competence beliefs (Bandura, 1986). Optimism is a general disposition to
expect positive, rather than negative, results in circumstances and situations (Scheier & Carver,
1985). Optimism is a control belief characterized by the statement “good things happen to me.”
Competence beliefs are important within optimism theory, but are conceptualized as an outcome
of control beliefs (Scheier & Carver, 1985). Hope is comprised agency and pathways, two
equally important interactive perceptions. Agency is the perception that one has the energy and
determination to pursue goals. Pathways is the perception that one can identify multiple routes
when obstacles arise (Snyder et al., 1991). Hope focuses equally on competence and control, but
in different ways than self-efficacy or optimism. Agency is a competence belief characterized by
the statement “I will achieve my goals.” Self-efficacy focuses on the belief that goals can be
achieved, but hope agency focuses on the belief that goals will be achieved. Pathways is a control
belief characterized by the statement “I can think of many ways to achieve my goals.” Optimism
focuses on the general positive outcome beliefs, but pathways identify specific routes to achieve
the outcomes. This study proposes that self-efficacy (Bandura, 1986), optimism (Scheier &
Carver, 1985), and hope (Snyder et al., 1991) form a system because each is an expectancy belief
that focuses on different aspects of competence and control. The aforementioned statement is
supported in previous research highlighting that the expectancy beliefs--self-efficacy, optimism,
and hope are distinct, but similar constructs that tap one overarching factor (Bryant & Cvengros,
2004; Magaletta & Oliver, 1999). Magaletta and Oliver (1999) identified that the factor structure
of each concept has overlap with the other constructs, but are distinct factors when instruments
measuring their existence are administered simultaneously. The separate factor structure of these
constructs has been substantiated in other studies as well (Bryant & Cvengros, 2004; Rose,
2007).

32
An important area of investigation among motivation research should be focused on
factors that promote students’ self-directed learning and other key determinants of student
behavior that influence high achieving students to strive for high achievement scores (Schunk &
Zimmerman, 1994). All three constructs identified in this study have revealed relationships with
motivation for goal attainment which is influenced by the reciprocal nature of social experiences
and positive thinking. Research evidences and theory suggests the constructs self-efficacy, hope,
and optimism are intricately related, guide human motivation and influence self-regulatory
behavior (Bryant & Cvengros, 2004).
The results revealed an important motivational cognitive skill set by using the dual
motive theory approach with a social cognitive theory lens to identify how these concepts that
are usually examined separately operate in combination. Cross-culturally examining academic
self-efficacy, academic hope, and optimism in combination is one fundamental step in
discovering how some cultures and student populations differ from others in motivation for
education.
Ethnicity, Gender, and Socioeconomic Class in Education
Education has been classified as a place of opportunity for all to students have the
possibility to flourish. It is also superficially thought of as a leveling ground, where every student
is equal and has a chance to reach the American dream (Kubota, 2004). However, no student
enters the classroom on an equal basis. Teachers deal with more differences among students than
similarities. There are many students who have different home demographics, as well as ethnic
and/or gender differences. No two students have the same motivational levels, intelligence, or
social environment and experiences. Even students who share the same ethnicity or gender
33
reared in different homes have two very different experiences that shape how that student views
motivation for school and goal directed behavior in the academic environment.
Understanding the role of social experiences in shaping student motivation provides
rationale for deciphering motivational systems by ethnicity, gender, and socioeconomic status. It
is evident in educational research that ethnicity, gender, and socioeconomic status share
relationships with students’ perception of themselves, their capabilities and their academic
environments (Berliner, 2005, Eccles & Harold, 1991; Graham & Taylor, 2002; Graham, Taylor,
& Hudley, 1998; Hill & Lynch, 1983).
The context of schooling rests heavily on socialization characteristics held by the
dominant group. Minority and African American children experience schooling in these
situations differently than their Caucasian American peers (Ladson-Billings, 1994). A long
history of the mistreatment of African Americans and negative social experiences throughout
history creates a sense of doubt in social institutions for some members of the group (Bowen &
Bok, 1998; Steele & Aronson, 1995). Some African American students may even have an
expectation of rejection that creates dissonance in environments that are socialized by majority
groups (Mendoza-Denton, Downey, Davis, Purdie, & Pietrzak, 2002). Research acknowledging
the vast differences in social experiences by stigmatized groups when compared to the majority
also highlights the relevance of understanding the social cognitive theory of motivation in the
context of motivation for education. However, most studies acknowledge that African American
students respect the institution of schooling and hold positive views of their self-worth in spite of
receiving poor grades (Dubois, 1973; Mickelson, 1990).
The role of ethnicity and socioeconomic status is usually confounded in research
(Graham, 1994; Nicholls, 1989). Most searches for relevant literature yield results that

34
corroborate African Americans, minorities, lower socioeconomic status, and/or inner city as all
one and the same. This is highly problematic and a major claim to the importance of this study
within motivational research. African American students are overrepresented in research studies
equating minority status with poverty.
The socially construed role for gender is highly publicized in the academic environment,
thus warranting different social experiences for girls and boys. Generally, girls are expected to
adhere to a rigid norm of societal expectations and are affected more by social comparisons than
males (Eccles, 1987; Giordano, 2003; Martin, 1996). In the academic world, it is clear that girls
and boys are expected to be of different academic mindsets. Therefore, the social experiences of
the two will shape different motivational patterns in goal directed behavior. Research has shown
that being labeled a good student is very important for females’ self-concept and not as important
for male students (Correll, 2001; Eccles & Wigfield, 2002). Females are more prone to judge
themselves critically and internalize academic feedback that makes them appear less appealing to
those that are important to them (e.g., parents, peers, and teachers) (Fagot, 1994; Huston &
Alvarez, 1990).
Students from middle class school systems outperform students from lower
socioeconomic status schools. Student in lower socioeconomic status schools show greater
academic loss over the summer period when compared with middle class students (Entwisle,
Alexander, & Olson, 1997). This could be a result of lower motivation levels or different
experiences outside of the educational setting that either promote educational attainment or the
contrary. Ethnicity could be associated with poorer preparation of schooling among younger
children, but it is probable that poverty mediates the effect (Berliner, 2005). Socioeconomic
class is social phenomenon found to affect students’ motivation for success in the classroom
35
(Kozol, 1992). Research demonstrated that students construct their personal affiliations along the
lines of socioeconomic class and that affiliations shape identities and interactions in schooling
(Willis, 1977/1981). Heath’s (1983) study of literacy patterns also corroborate that affiliations
with different subgroups afford very different experiences in the school environment and
participation in school activities differ by membership of certain subgroups. These research
studies provide support for examining academic motivational constructs by socioeconomic class.
Although the previous sections highlight the importance of ethnicity, gender and
socioeconomic status in education, motivational research has yielded inconclusive results (cf.
Graham, 1994; Kaplan & Maehr, 1996; Mickelson, 1990). Research that exists on goal theory
has found that goal directed behavior differs for males and females, with interactions among
ethnicity and gender on task goals (Middleton & Midgley, 1997). Motivational research has also
demonstrated African American students to have more positive attitudes than Caucasian
Americans (Graham, 1999).
The Need for Future Research
Cross-ethnic studies examining motivational variables such as hope, self-efficacy, and
optimism are thin and uneven in the research literature. The researcher used EBSCOhost
Research Databases with subject terms of hope, self-efficacy, optimism and cross-cultural or
ethnic search terms for additional scholarly publications, but the search yielded limited results.
When the researcher searcher for each construct separately no study was found that had
examined cross-cultural settings and diverse student populations. No empirical studies were
found to have focused on hope, self-efficacy, and optimism in deciphering the role of student
motivation accounting for different achievement outcomes that exists between African American

36
or Caucasian students or poorer performing students and high achieving students. The research
examining competence and control beliefs in diverse student populations are sparse and Schunk
and Zimmerman (2006) claim that cross-cultural research is needed to further investigate how
competence and control beliefs operate within diverse groups.
Cardemil, Reivich, and Seligman’s (2002) research study advanced research on
motivation by investigating positive psychology constructs in different ethnic groups in a
cognitive-based depression intervention called Peen Resiliency Program (PRP). While this study
did not focus on motivation in education, it provides rationale for future work examining
motivational variables in diverse groups in educational settings. Cardemil, et al., (2002)
examined the effects of an intervention that was aimed at improving depressive symptoms
among low-income, Latino and African American children. The PRP focused on aspects of
increasing motivation via use of positive psychology using psychological variables that have
been linked with depression such as explanatory style, self-esteem, and depression. The positive
psychology concepts revealed that culture has an impact on positive psychology variables that
influence motivation. Social cognitive theory provide rationale for the effects of PRP by its
design to explain social experiences and culture as key factors that influence one’s ability to self-
regulate emotions and motivation. Cardemil, et al., (2002) revealed that PRP evidenced fewer
hopeless thoughts, higher self-esteem, and fewer negative automatic thoughts in Latino
participants. While PRP was operated in the same manner for both groups, the intervention
strategy did not detail any significant improvements among African American children when
compared to the control group. The intervention effects for African American children support
the need to cross-culturally define and validate positive psychology variables that are linked with

37
motivation in order to design culturally competent intervention programs to increase positive
personality traits.
Chang and Banks (2007) examined the hope theory (Snyder, 1994) across four ethnic
groups in order to determine if hope operated the same across ethnic groups. The four racial
groups examined by Chang and Banks (2007) were Asian Americans, Latinos, African
Americans, and European Americans. This cross-cultural study of hope revealed that individual
levels of agentic thinking and pathways thinking varied along the lines of ethnicity and that
social problem solving, positive and negative affect, and life satisfaction revealed complex
variations due to ethnicity (Chang & Banks, 2007). Chang and Banks (2007) research is
groundbreaking in hope theory as it examined how agentic thinking and pathways thinking
predicted life satisfaction among the four ethnic/racial groups. This research is important for
positive psychology because it evidences the need to understand motivational variables in cross-
cultural contexts.
Although more cross-ethnic studies are needed, limited research exists that explores
African American students’ self-efficacy, student achievement and general well-being. Existing
research suggests that self-efficacy is a critical variable in educational research among African
American students (Jonson-Reid, Davis, Saunders, Williams, T. & Williams J., 2005). Self-
efficacy is associated with student individual achievement and general well-being within African
American student populations. Academic self-efficacy is associated with beliefs about the
importance of schooling and graduation among African American students (Jonson-Reid et al.,
2005). Further, Jonson-Reid et al. (2005) state that academic self-efficacy beliefs may be more
critical to academic functioning than racial identity and self-esteem in African American
students.

38
Two studies were found that focused on hope in African-Americans and academic
achievement. In one study, high hope African-American college students reported higher coping
efficacy and used more problem-focused coping when dealing with race related stress than low
hope students (Danoff-Burg, Prelow, & Swenson, 2004). Chang and Banks (2007) found that
agency and pathways thinking in college students varied by ethnicity and social problem solving,
positive and negative affect, and life satisfaction also revealed complex variations due to
ethnicity. To date, no published studies have examined the role of hope and academic
achievement in ethnically diverse non-college student populations.
As with hope and self-efficacy, more research is needed to understand the role of
optimistic thinking and African-Americans. However, existing research points to a positive
relationship between optimism and well-being. Optimistic African American college students
experience less stress (Baldwin et al., 2003), and optimism buffers the association between
depressive and physical symptoms for low-income, inner city African American women (Jones
et al., 2004).
As noted above, empirically driven and educationally relevant cross-cultural research is
limited. The studies by Chang and Banks (2007) and Cardemil, Reivich, and Seligman (2002)
confirm that motivational variables may operate differently along the lines of ethnicity to
influence positive personality constructs. It is evident that future research must emphasize the
importance of diversity in samples and theoretical concepts must be defined in culturally relevant
terms to determine if influential motivational constructs are operationalized in diverse groups of
people in the same manner.

39
Summary
The review of literature discussed: (a) theories of motivation, positive personality traits,
and general well-being; (b) recent research explaining the complex interrelationship among
competence and control beliefs; (c) a comprehensive overview of hope, optimism, and self-
efficacy; and (d) the role of ethnicity, gender, and socioeconomic status in education and
motivational research. The reviewed literature provided a broad spectrum of motivational
theories that impact student achievement and demonstrated how research in motivation is
currently shaping the field of education. The review of literature honed in on competence and
control beliefs’ power and robustness in predicting academic achievement. This review
highlighted why an investigation among diverse students along ethnicity, gender, and
socioeconomic status is needed to better understand how motivational systems operate to predict
student achievement and psychological well-being in diverse groups of students.

40
CHAPTER 3
METHODS AND PROCEDURES
The purpose of this study was three-fold. The first was to test the claim that competence
and control beliefs operate as a motivational cognitive set predicting academic achievement and
psychological well-being. The second purpose was to examine whether the proposed
motivational cognitive set of academic self-efficacy, academic hope, and optimism was more
predictive of academic achievement and psychological well-being than the individual constructs.
The third purpose of this study was to decipher the role of ethnicity, gender, and age group
(college and high school) in the predictability of the motivational cognitive set in diverse
educational settings. This study aimed to provide a better understanding of how a system of
competence and control functions in predicting academic achievement and general well-being.
The research plan was to examine if the individual constructs and the larger cognitive set
function in a similar manner across African-American and Caucasian American high school and
college students, male and female students, and the two differing age groups of college and high
school aged students.
Prior to the collection of any data in the school districts, approval was obtained from the
Institutional Review Board at The University of Alabama and the participating school districts.
The approval process involved detailing the intricate details of the research study and describing
its utility, risks and benefits, and purpose of the study for the participants and all constituencies
related to the school system. A copy of all instruments used in the study, informed parental
consent forms, and student assent forms were provided for the Institutional Review Board and

41
school administrators. Permission was granted by the Institutional Review Board at The
University of Alabama and the cooperating school district representatives also approved the
study regarding student motivation in the high school setting.
Rationale for Methodology
The following section addressed the method for data collection and analyses for the
proposed dissertation study. The method section to some extent resembled the pilot study
conducted prior to the dissertation study that provided preliminary findings that supported further
investigations on competence and control beliefs in diverse populations (McBride, Robinson,
Turner, & Rose, in preparation). The sample in the pilot study consisted of students aged from
14-18 years old in a predominately working class neighborhood. The working class population of
students was racially diverse, consisting of a proportionate number of African American and
Caucasian American students (n = 201). The results of the pilot study were best illustrated when
examining the motivational cognitive set among ethnic groups. Although each cognitive set was
predictive of academic achievement for African-American and Caucasian American students,
there were several striking differences across ethnicity. An examination of the individual
cognitive sets reveals that optimism accounted for a significantly greater proportion of the
variance in academic achievement than academic hope or self-efficacy (z ≥ 4.05, p < .001) for
African-American students, but academic hope was more predictive than optimism or self-
efficacy (z ≥ 3.60, p < .001) for Caucasian American students. This difference suggests that the
cognitive sets are differentially predictive across ethnicity.
Also in the pilot study, African-American students reported significantly higher academic
hope than Caucasian American students. Although there were differences in the reported scores,

42
academic hope was predictive for both groups of students. That is, the difference represents a
shift in the ways that the two groups responded to the data but the construct is still working
similarly across ethnicity (Chang & Banks, 2007).
The results of the pilot study suggested that competence and control beliefs influence
academic achievement most when considered as a motivational cognitive set. The motivational
cognitive set used within the pilot study was academic hope, academic self-efficacy, and
optimism to predict academic achievement among African American and Caucasian American
high school students. By examining the motivational cognitive set, the competence and control
beliefs of both groups of students could be fully investigated more than the use of a single
motivation measure would provide. Because most previous research uses single motivational
constructs that are focused on either competence or control beliefs, it is difficult to identify
potential differences in belief systems of ethnically diverse populations.
The pilot study only examined the cognitive set of academic self-efficacy, academic
hope, and optimism by ethnicity in a working class high school population, which may have
introduced a confounding factor between ethnicity and class. Further, the pilot study did not
examine the effects of gender at all. This study surpassed the pilot study by examining the
cognitive set of self-efficacy, hope and optimism by ethnicity, gender, and age group (high
school versus college aged students). Further, the method for the analysis of data in the pilot
study used regression as the primary analysis and used Pearson’s correlation coefficient for
correlation procedures. The present study methodologically exceeded the pilot study by
accounting for measurement error by using Structural Equation Modeling to depict relationships
among the variables, especially latent variable constructs.

43
Site Selection
The researcher collaborated with faculty members in The College of Education at The
University of Alabama in order to identify school districts that are ethnically diverse and
inclusive of broad socioeconomic statuses. After approval from the Institutional Review Board,
the researcher scheduled meetings with administrators of two school districts fitting the
previously stated criteria. Two high schools were identified that were ethnically diverse, but
only one of the schools was inclusive of a wide range of students from differing socioeconomic
statuses. The primary investigator scheduled meetings with the principal of one of the high
schools who found the research study to be beneficial for students and teachers in the school.
The primary investigator also contacted the principal of the second school identified in order to
broaden the scope of the study, but did not receive any further correspondence from the school’s
principal.
Sample Selection
Participants
Participants for this study were gathered from two samples. Sample A consisted of high
school students ranging in age from 14 to 18. The high school was ethnically diverse and
composed of a well-balanced socioeconomic status. There were marginally equal working-class
and middle class families enrolled in the public high school. The high school is located in the
southeastern United States. The sample size from the high school totaled 197. Sample B was
made up of undergraduate college students from a large southeastern state university. The
college students ranged from ages 18-24. This sample included 269 student participants. The
college student population served to aid in determining developmental differences among

44
students’ perception of competence and control beliefs. The diverse college population also
addressed a need for more research in competence and control beliefs research.
Procedure
Participants were recruited for sample A from a large public high school in the
Southeastern United States. In order to recruit participants at both locations, the researcher used
posters advertising the study to solicit participants, offered a chance to enter a $25.00 raffle, and
asked participants to encourage others students to participate in the study (snowballing).
Participants were recruited for sample B from a large public university in the Southeast. Both
samples were all informed that the study was strictly on a volunteer basis. Demographic
information was obtained from participants in both samples participating in the study.
The students were recruited by use of posters and snowballing. In sample A, the students
will be recruited at the high school by signs informing and encouraging the students to
participate. Teachers also served as a recruiting tool for participants in sample A. Sample A was
a diverse setting and the need for diverse students did not pose a problem. The students in sample
B were recruited at the university by use of posters and snowballing. The college population was
roughly 12% African American and predominately Caucasian American. The students in sample
B were recruited mainly by snowballing technique with participants. The researcher also made
connections with large groups of African American students to ensure a representative number of
African American participants from the university setting. Prior to participating in the study, the
parents of students in sample A provided a signed parental consent forms. The students in sample
A signed student assent forms to participate in the study. The students in sample B signed
consent forms. Students that agreed to participate were entered into a drawing for a $25 gift

45
certificate to a local mall for their participation in this study. Classroom teachers administered
the questionnaires during the school’s first period non-instructional time and the researcher was
present during data collection for sample A. Sample B participants were recruited during the fall
term 2008. The researcher spent one week in the student activity center during lunch hours to
recruit students. The questionnaires used in this study were administered during a 30 minute
period set aside to collect the data for sample A. The 30-minute period was sufficient for the
measures and minimized further intrusion during the academic day in the public school system
for sample A. The 30-minute period did not appear to burden the college students and it appeared
sensitive to their time needed for studies. All data was collected in one sitting. Permission form
for sample A was provided three weeks prior to the data collection. The researcher collected the
permission slips one week prior to collecting data. Obtaining the permission slips first gave the
researcher time to have adequate forms for participants in the study for sample A. Parental
permission was not required for sample B and the college students in this sample provided
his/her consents at the time of data collection after they were briefed about the research study.
Materials/Instruments
Demographics. Participants were asked to report gender, ethnicity, age, year in school,
academic achievement, and educational goals. Academic achievement was interpreted by
creating a latent variable using participants self reported grades in English, science, social
studies, and math. The scale used for academic achievement contained four items (e.g., “What
type of grades do you usually make in English?”) The four items focused on the four subject
areas that are common parts of the core curriculum for the student groups in both samples.
Participants in the study answered accordingly for the grades usually made in English class,

46
science class, social studies class, and math class. Participants responded to each item using a 7
point Likert type scale (1 = Mostly D’s to 7 = Mostly A’s). Student responses for the question(s),
“what type of grades you usually make in . . . ?” were used to create the latent variable called
academic achievement.
The self-reporting of grades was not the first choice of the researcher, but research
protocol at the educational institutions examined would not permit such access to the student
GPA data. However, the self-reporting of grades has been found positively correlated with actual
grades and determined as a valid research mechanism in prior research (e.g., Baird, 1976,
Crockett, Schulenberg, & Petersen, 1987). Prior studies with high school and college aged
students revealed that correlations between actual grades and self-reported grades exceeded .80
(Maxey & Ornsby, 1971). More recently, self-reported GPA of college students was found to be
slightly higher than the actual GPA, with no statistically significant differences for male and
female students. The study also reported that student’s self-reported GPA was positively
correlated .91 with actual GPA recorded in the university registrars’ office (Herman & Nelson,
2009).
Academic Hope Scale. The Academic Hope Scale (AHS) measures academic hope
components and is a sub-scale from the Domain Specific Hope Scale-Revised which measures
hope in life areas including social relationships, family life, physical health, psychological
health, work, romantic relationships, leisure activities, and religions/spiritual life (Campbell &
Kwon, 2001). The AHS contains six items with three pathway items (e.g., “I can think of many
ways to make good grades”) and three agency items (e.g., “I am motivated to do well in
school”). Participants responded to each item using an 8 point Likert scale (1 = definitely false to

47
8 = definitely true). The AHS has moderately high reliability with alpha coefficients of .89 and
above (Campbell & Kwon, 2001; Robinson & Rose, under review; Snyder, 1997).
Hope has evidenced its importance as a theoretical construct across several domains of
psychological research and as an instrument that can be applied to facilitate well-being. Prior
research demonstrates that hope serves as a buffer against depression (Snyder, 2004), relates to
decreases in negative symptoms reported by individuals in psychotherapy (Irving, Snyder,
Gravel, et al., 2004). McDermott & Snyder (2000) evidenced that hope predicts elementary
students’ achievement test scores. Snyder et al. (1997) demonstrated that grade school students
with high-hope achieved higher scores on the Iowa Test of Basic Skills in a research design
which controlled for locus of control and self-worth.
Academic Self-Efficacy Scale. The Academic Self-Efficacy Scale (ASES) consists of six
statements used to measure student beliefs about how they react to different academic tasks to
succeed in academic achievement. The ASES is an excerpt from Bandura’s Multidimensional
Self-Efficacy Scale (see Zimmerman et al., 1992). The scale asks students to identify how well
they could learn mathematics, science, reading skills, writing skills, social studies and computers
(“How well can you learn [subject]?”). The scale employs a 6-point Likert scale (1 = Not very
well at all to 7 = Very well), and has moderately high reliability ranging from .69 to .85 with
high school and college students (see, Zimmerman & Bandura, 1994; Zimmerman et al., 1992).
There have been extensive research studies that have linked academic self-efficacy with school
motivation and performance in school (Bandura, Barbarnelli, Caprara, & Pastorelli, 2001; Bong,
1999; Zimmerman, 2000; Zimmerman et al., 1992).

48
Life Orientation Test Revised. The Life Orientation Test Revised (LOTR) measures
dispositional optimism, or one’s expectancies that he or she will experience positive outcomes
(Scheier, Carver & Bridges, 1994). The LOTR consists of 10 items; 3 items are worded
positively and measures optimism; 3 items are worded negatively and measure pessimism; and
there are four filler items. Participants responded using a 5-point Likert scale ranging from 0 =
strongly disagree, 1 = disagree, 2 = neutral, 3 = agree, and 4 = strongly agree. Measures on the
LOTR are reliable (α ≈.78; Scheier, Carver, & Bridges, 1994). Previous studies exploring the
validity and reliability of the item scale-correlations ranged from .43 to .63 on the six items of
the LOTR (Scheier et al. 1994). The items measuring optimism are worded as, “In uncertain
times, I usually expect the best” and the items measuring pessimism are worded as, “If
something can go wrong for me, it will.” Optimism has been associated with student
achievement (Aspinwall, Richter, & Hoffman, 2000; Floyd, 1997; Kao & Tienda, 1995;
Peterson, 2000; Scheier & Carver, 1987) and psychological well-being (Dougall, Hyman,
Hayward, McFeeley, & Baum, 2001; Taylor & Brown, 1988).
General Well-being. General well-being was assessed by using scales adopted from the
Self-Image Questionnaire for Young Adolescents (SIQYA), developed by Petersen et al. (1984).
The SIQYA is composed of 9 scales, but only 3 of the 9 scales were appropriate for use in the
present study. The scales used in the study measured general emotional tone, perceptions of
relationships with peers, and general behavior control. The number of items for the combined 3
scales total 29. The 3 scales used were 5-point Likert-type scales ranging from 1 = not at all true
of me to 5 = very true of me. The emotional tone scale measures emotional disposition--typical
emotions experienced and is composed of items such as, “I feel relaxed under normal
49
circumstances.” The perceptions of relationships with peers scale measures quality of peer
relationships and has items such as, “Other kids find me a bore.” The general behavior control
scale measures impulse control and has items worded as, “I lose my head easily.”
The scales have demonstrated appropriate validity shown to tap school related affect and
behavior (Kaplan & Maehr, 1999 ) and general emotional tone, peer relationship, and impulse
control manifested internal consistency of .78, .79, and .79, respectively. This scale was chosen
because it has proven its validity and reliability in a setting of diverse middle school students
examining general well-being and achievement goals (Kaplan & Maehr, 1999). General well-
being has been linked with student achievement and competence and control beliefs have been
found to be related to improved well-being (Kaplan & Maehr, 1999; Deci & Ryan, 1991; Ryan &
Connell, 1989). The scale was inclusive of three important areas that relate to overall well-being
in the academic environment. The scale was also sensitive to time restraints within the academic
environment. The 29 items on the scale were not as troublesome as other lengthy scales
measuring general well-being. This was beneficial for participants and school administrators.
Design
The design of the study uses structural equation modeling; specifically it includes a test
of the measurement models for each latent variable and the structural models to test the relations
among the latent variables. Four measurement models will be tested: Model 1: Student
achievement (latent variable) is defined by English, Math, Science, and Social Studies average
grades. Model 2: Competence is defined by academic hope agency and academic self-efficacy;
Model 3: Control is defined by academic hope pathways and optimism; and finally Model 4:
General well-being is defined by behavioral control, emotion regulation, and peer relationships.

50
These four latent variable relations are then tested in a structural equation model. See Figures 1-4
below for clarification of measurement models 1-4. Figure 5 depicts all four measurement
models in the structural model.
Figure 1. Measurement Model 1--Student Achievement.
Hope Agency
Self-Efficacy
Competence
Figure 2. Measurement Model 2--Competence Belief System.
Student Achievement
English Math Science SocialSt

51
Hope Pathways
Optimism
Control
Figure 3. Model 3--Control Belief System.
General Well-being
Peer
Emotional Behavior
Figure 4. Measurement Model 4--General Well-being.

52
HopeAgency
Self-Efficacy
Hope Pathways
StudentAchievement
EnglishC MathClas ScienceC SocialSt
GeneralWell-being
PeerEmotionalBehavior
Optimism
Competence
Control
Figure 5. All Measurement Models in Structural Model.
Research Questions
This study tested the following measurement model research questions:
Research Question 1: Are the observed variable indicators for Measurement Model 1
statistically significant in a confirmatory factor analysis?
Research Question 2: Are the observed variable indicators for Measurement Model 2
statistically significant in a confirmatory factor analysis?
Research Question 3: Are the observed variable indicators for Measurement Model 3
statistically significant in a confirmatory factor analysis?
Model 1 Model 2
Model 3 Model 4

53
Research Question 4: Are the observed variable indicators for Measurement Model 4
statistically significant in a confirmatory factor analysis?
Research Question 5: What is the best-fitting confirmatory factor model for the measures
of academic hope, academic self-efficacy, and optimism?
This study further tested the following structural model research questions:
Research Question 6: Are the relations amongst the latent variables statistically
significant in the proposed structural models?
Research Question 7: Are there significant differences by group (ethnicity, gender, and
age group) for the structural model predicting Student Achievement and General Well-being?
Null Hypotheses
The following research hypotheses were formulated to study the research questions:
Hypothesis 1.1: There will be no differences between theoretically competing
confirmatory factor models on the proposed motivational system of competence and control
beliefs (academic self-efficacy, academic hope, and optimism).
Hypothesis 1.2: The observed variables (academic self-efficacy, academic hope, and
optimism) will load on a single factor with no distinction between competence and control
beliefs.
Hypothesis 2.1: The structural equation model indicating the system of competence and
control beliefs directly influence academic achievement and general well-being represents the
sample data variance-covariance matrix. The proposed system of competence and control beliefs
is more predictive than the separated measures of competence and control and produces a good
fit.

54
Hypothesis 2.2: There will be no differences found across the structural equation model
by ethnicity, gender, or age group.
Data Analysis
The measurement and structural models were assessed by using LISREL Version 8.80
computer program. The measurement models were proposed based on the literature review and
empirical studies suggesting that constructs of competence and control used in the study
(academic hope, academic self-efficacy, and optimism) are expectancy beliefs operating in a
similar pattern, yet distinct to produce outcomes (Schunk & Zimmerman, 2006).
Analysis
The following analyses were performed to answer RQ1- RQ5.
RQ1: Are the observed variable indicators for Model 1 statistically significant in a
confirmatory factor analysis?
RQ2: Are the observed variable indicators for Model 2 statistically significant in a
confirmatory factor analysis?
RQ3: Are the observed variable indicators for Model 3 statistically significant in a
confirmatory factor analysis?
RQ4: Are the observed variable indicators for Model 4 statistically significant in a
confirmatory factor analysis?
RQ5: What is the best-fitting confirmatory factor model for the measures of academic
hope, academic self-efficacy, and optimism?

55
The review of literature supported that the analysis of the data should include
confirmatory factor models as a means to tease apart the interactions among the identified
competence and control beliefs in predicting student achievement and well-being (Bryant &
Cvengros, 2004; Chang & Banks, 2007; Snyder et al., 1991; Steed, 2002). An analysis of the
confirmatory factor models using LISREL Version 8.80 was used to test the significance of the
hypothesized measurement model. This also served to confirm whether the sample data
collected was representative of the proposed measurement model of the system of competence
and control beliefs.
LISREL Version 8.80 was used to test the proposed confirmatory factor models
constructed according to the literature review. The best fitting confirmatory factor model of
competence and control beliefs was identified first based upon theoretical knowledge and second
by using model-testing analyses provided by LISREL Version 8.80. This process was followed
by model identification, estimation and testing to determine the best model fit for explaining
sample variance-covariance matrix for African American and Caucasian American students, as
well as male and female students. The model identification, estimation, and testing also provided
an opportunity for the researcher to put forward a theoretical explanation related to possible
developmental differences of competence and control beliefs between the differing age groups.
Examining the differences between the age groups provided some inclination of how time
exposed to the educational setting, years of schooling, could yield differences when the college
and high school aged students systems of competence and control were compared.
The following confirmatory models were used to determine the best fitting confirmatory
factor models:

56
Proposed confirmatory factor model 1: The observed variables--academic self-efficacy,
academic hope, and optimism were all correlated and used in combination to create a latent
variable labeled a system of competence and control. Model 1 was based on the principle that
each construct identified is distinct, but interacts in a similar manner that taps an overarching
factor (Magaletta & Oliver, 1999). In Model 1 the system of competence and control is
highlighted as one overarching factor. Confirmatory factor model 1 was representative of
theoretical arguments and empirical studies evidencing interplay among competence and control
beliefs (Schunk & Zimmerman, 2006). More particularly, confirmatory factor 1 was deemed as
an important factor model because the three variables identified have all demonstrated
relationships that possibly categorized the three motivational variables as striking one important
skill set (Bryant & Cvengros, 2004; Magaletta & Oliver, 1999).
Figure 6. Proposed Confirmatory Factor Model 1.
Academic Self-Efficacy
Academic Hope
Optimism
System of Competence and
Control

57
Proposed confirmatory factor model 2: The observed variables--academic self-efficacy
and academic hope agency were both correlated and suggested to produce a latent variable
labeled competence. The observed variables--academic hope pathways and optimism were
correlated and in combination suggested to produce a latent variable labeled control.
Competence and control beliefs were correlated in this model and both produce two latent
variables of competence and control. In this model academic self-efficacy and academic hope
agency were identified as competence beliefs and academic hope pathways and optimism were
identified as control beliefs.
Confirmatory factor model 2 represented the dual motive theory as posited by Schunk
and Zimmerman (2006). Aligned with the dual motive theory, the researcher implied that both
competence beliefs in this model (hope agency and self-efficacy) produce the latent variable
competence and both control beliefs in this model (hope pathways and optimism) produce the
latent variable control.

58
HopeAgency
Optimism
HopePathways
AcademicSelf-Efficacy
Competence
Control
Figure 7. Proposed Confirmatory Factor Model 2.
Using LISREL Version 8.80 the researcher tested the theoretical model to determine if
the model represents the sample variance-covariance matrix of the data collected. During this
process, the research compared several theoretically and empirically justified models to
determine the model with the best fit of the system of competence and control predicting
academic achievement and general well-being. The researcher did not alter the theoretical
models during the comparison and analyzing each model while attempting to determine the best
fitting model.
The following analyses were performed to answer RQ6 and RQ7:

59
Research Question 6: Are the relations amongst the latent variables statistically
significant in the proposed structural models?
Research Question 7: Are there significant differences by group (ethnicity, gender, and
age group) for the structural model predicting Student Achievement and General Well-being?
The following were the proposed models that were created and tested using LISREL
Version 8.80 to tease apart and identify the relationship among academic self-efficacy, academic
hope, optimism, academic achievement, general well-being and the system of competence and
control beliefs.
Proposed Structural Model 1: The observed variables--academic self-efficacy, academic
hope, and optimism form the latent variable labeled system of competence and control. The
researcher implied that the latent variable--system of competence and control directly influences
academic achievement (which is measured by students’ reported grades earned in English,
science, math, and social studies classes) and general well-being (which is measured by students’
general emotional tone, behavior control, and peer relationships). The observed variables--
academic self-efficacy, academic hope, and optimism shared correlations in the model and
measurement error was accounted for each variable in the model.

60
Figure 8. Proposed Structural Model 1.
Proposed Structural Model 2: The observed variables--academic self-efficacy and
academic hope (agency) form a latent variable labeled competence and the observed variables--
academic hope pathways and optimism form a latent variable labeled control. The researcher
implied that the two latent variables--competence and control hereby directly influence academic
achievement and general well-being. The observed variables--academic self-efficacy, academic
hope agency, academic hope pathways, and optimism share correlations in the model and
measurement error was also accounted for each variable in the model.
Academic Self-Efficacy
Academic Hope
Optimism
System of Competence and
Control
Student Achievement
EnglishC
MathClas ScienceC SocialSt
General Well-being
Peer
Emotional Behavior

61
HopeAgency
Self-Efficacy
Hope Pathways
StudentAchievement
EnglishC MathClas ScienceC SocialSt
GeneralWell-being
PeerEmotionalBehavior
Optimism
Competence
Control
Figure 9. Proposed Structural Model 2.

62
CHAPTER 4
PRESENTATION AND ANALYSIS OF THE DATA
Introduction
The three stages of data analysis included a pre-analysis data-examination and data
preparation stage (Stage 1), a validation of the measures stage (Stage 2), a correlation analysis of
the constructs (stage 3) and an assessment of the structural model and the path estimates stage
(Stage 4). The various analyses in the present study were undertaken using the SPSS 16.0 and
LISREL 8.80 computer programs. The following statistical analysis results were formulated to
answer the following research questions:
Research Question 1: Are the observed variable indicators for Measurement Model 1
statistically significant in a confirmatory factor analysis?
Research Question 2: Are the observed variable indicators for Measurement Model 2
statistically significant in a confirmatory factor analysis?
Research Question 3: Are the observed variable indicators for Measurement Model 3
statistically significant in a confirmatory factor analysis?
Research Question 4: Are the observed variable indicators for Measurement Model 4
statistically significant in a confirmatory factor analysis?
Research Question 5: What is the best-fitting confirmatory factor model for the measures
of academic hope, academic self-efficacy, and optimism?

63
This study further tested the following structural model research questions:
Research Question 6: Are the relations amongst the latent variables statistically
significant in the proposed structural models?
Research Question 7: Are there significant differences by group (ethnicity, gender, and
age group) for the structural model predicting Student Achievement and General Well-being?
Null Hypotheses
The following research hypotheses were formulated to study the research questions:
Hypothesis 1.1: There will be no differences between theoretically competing
confirmatory factor models on the proposed motivational system of competence and control
beliefs (academic self-efficacy, academic hope, and optimism).
Hypothesis 1.2: The observed variables (academic self-efficacy, academic hope, and
optimism) will load on a single factor with no distinction between competence and control
beliefs.
Hypothesis 2.1: The structural equation model indicating the system of competence and
control beliefs directly influence academic achievement and general well-being represents the
sample data variance-covariance matrix. The proposed system of competence and control beliefs
is more predictive than the separated measures of competence and control and produces a good
fit.
Hypothesis 2.2: There will be no differences found across the structural equation model
by ethnicity, gender, or age group.

64
Stage 1: Pre-analysis Data Examination and Data Preparation
Prior to the creation and testing of the structural equation model (SEM), data were
screened for missing values, outliers, univariate skewedness and kurtosis.
Missing Values
According to Tabachnick and Fidell (2001), “Missing data is one of the most pervasive
problems in data analysis “ (p. 58). Missing data can have serious effects on the reliability,
validity and generalizability of the data (Tabachnick & Fidell, 2001). Missing data can be
indicative of lack of knowledge, fatigue or sensitivity, or interpretation by the respondent of the
questionnaire relevance. When the number of missing cases is small (< 5%) it is common to
exclude the cases from the analysis (Tabachnick & Fidell, 2001). The student achievement and
general well-being data set has a few variables with large percentages (> 5%) of missing data
(see Table 1) ranging from 5.6% percent for Mother’s Education to 19.7% for Father’s
Education. Before exploratory factor analysis it must be determined if missing data is systematic
(represents bias) or can be ignored. Missing data also has other important ramifications,
especially in structural equation modeling. For instance, listwise deletion should not be
conducted unless the missing data is at least missing completely at random (MCAR). The results
of Little’s (Little & Rubin, 2002) MCAR test (χ2 = 320.575, df = 2222, p = 1.00) indicated that
the missing data is MCAR and the data loss pattern is not systematic.
The expectation-maximization (EM) algorithm for generation of imputed values was used
to fill in the missing data in the 466 case dataset (resulting in the EM-dataset) and is used later in
the CFA analysis phase for comparison purposes. Since the data is MCAR, listwise deletion is a
better alternative than pairwise deletion which may cause covariance matrix issues due to

65
unequal numbers of cases (Kline, 2005). Peters and Enders (2002) found that this method for
analyzing datasets with incomplete data “outperformed traditional (available case) methods”
(cited in Kline, 2005, p. 56). Tabachnick and Fidell (2001) suggest using both methods (with
and without missing data) but favor the EM imputation method and listwise methods (if data is
ignorable) over mean substitution or pairwise deletion. Tabachnick and Fidell (2001) state, “The
decision about to handle missing data is important. At best, the decision is among several bad
alternatives” (p. 59).
Table 1 Descriptives and Missing Values for Univariate Statistics
N M
SD
Missing No. of Extremes(a) Count % Low High
Age 465 18.13 2.81 1 .2 0 6 School Year 465 2.22 1.06 1 .2 0 0 Types of Grades 464 3.95 1.30 2 .4 0 0 English Class 464 4.94 1.64 2 .4 19 0 Math Class 464 4.64 1.58 2 .4 13 0 Science Class 464 4.71 1.39 2 .4 8 0 Social St. Class 464 5.02 1.53 2 .4 15 0 Parent Edu 466 2.53 1.48 0 .0 0 30 Mother Edu 440 5.14 1.28 26 5.6 0 0 Father Edu 374 4.98 1.33 92 19.7 1 0 Optimism 462 16.53 3.05 4 .9 8 0 Pessimism 463 7.95 1.69 3 .6 15 4 Academic Hope 465 38.65 6.41 1 .2 20 0 Hope Agency 465 18.38 3.88 1 .2 12 0 Hope Pathways 466 20.27 3.19 0 .0 19 0 Self-Reg. 460 31.29 6.07 6 1.3 2 0 Academic Self Efficacy 461 28.23 4.46 5 1.1 11 0 Emotional Tone 456 34.03 7.49 10 2.1 0 8 Peer Relationships 455 29.70 6.19 11 2.4 4 26 Behavior Control 455 27.71 5.65 11 2.4 5 5 General Well-Being 448 91.46 14.51 18 3.9 3 17 LOTR1 465 2.65 1.03 1 .2 16 0 LOTR2 466 2.66 1.00 0 .0 15 0 LOTR3 465 2.55 0.92 1 .2 31 0
(table continues)

66
Missing No. of Extremes(a) N M SD Count % Low High LOTR4 465 2.90 1.01 1 .2 0 0 LOTR5 466 3.49 0.73 0 .0 6 0 LOTR6 466 2.73 1.00 0 .0 11 0 LOTR7 464 2.62 0.94 2 .4 28 0 LOTR8 466 2.19 1.30 0 .0 0 0 LOTR9 466 2.76 1.00 0 .0 31 0 LOTR10 466 3.05 0.97 0 .0 0 0 AHS1 466 6.73 1.37 0 .0 14 0 AHS2 465 6.33 1.45 1 .2 10 0 AHS3 466 6.56 1.29 0 .0 12 0 AHS4 466 6.79 1.44 0 .0 13 0 AHS5 466 6.98 1.21 0 .0 8 0 AHS6 466 5.28 1.80 0 .0 0 0 ASES1 464 4.72 1.25 2 .4 12 0 ASES2 463 4.29 1.45 3 .6 0 0 ASES3 463 3.62 1.43 3 .6 0 0 ASES4 464 4.25 1.32 2 .4 0 0 ASES5 464 4.48 1.14 2 .4 33 0 ASES6 465 4.97 1.12 1 .2 5 0 ASES7 465 4.60 1.11 1 .2 23 0 ASES8 465 5.25 1.01 1 .2 37 0 ASES9 464 4.62 1.30 2 .4 11 0 ASES10 465 4.62 1.27 1 .2 12 0 ASES11 462 4.60 1.19 4 .9 8 0 ASES12 463 4.86 1.13 3 .6 5 0 ASES13 465 4.62 1.35 1 .2 16 0 GWB1 462 4.52 1.41 4 .9 14 0 GWB2 461 4.57 1.58 5 1.1 0 0 GWB3 462 4.85 1.20 4 .9 8 0 GWB4 462 4.26 1.64 4 .9 0 0 GWB5 461 4.78 1.33 5 1.1 13 0 GWB6 461 4.71 1.52 5 1.1 26 0 GWB7 461 4.92 1.46 5 1.1 21 0 GWB8 460 5.07 1.39 6 1.3 69 0 GWB9 461 5.31 1.20 5 1.1 43 0 GWB10 460 4.05 1.74 6 1.3 0 0 GWB11 461 4.87 1.41 5 1.1 19 0 GWB12 459 5.27 1.29 7 1.5 50 0 GWB13 459 4.95 1.46 7 1.5 23 0 GWB14 459 5.11 1.34 7 1.5 56 0 GWB15 459 4.89 1.56 7 1.5 27 0 GWB16 460 5.14 1.36 6 1.3 61 0 GWB17 460 5.04 1.50 6 1.3 29 0 GWB18 460 4.17 1.51 6 1.3 0 0
(table continues)

67
Missing No. of Extremes(a) N M SD Count % Low High GWB19 459 4.84 1.30 7 1.5 13 0 GWB20 459 4.44 1.61 7 1.5 40 0 GWB21 460 4.64 1.52 6 1.3 36 0 GWB22 461 4.42 1.68 5 1.1 0 0 GWB23 459 5.11 1.36 7 1.5 60 0 GWB24 459 3.95 1.58 7 1.5 0 0 GWB25 460 4.12 1.60 6 1.3 0 0 GWB26 459 4.32 1.54 7 1.5 0 0 GWB27 459 4.77 1.39 7 1.5 25 0 GWB28 458 3.88 1.93 8 1.7 0 0 GWB29 458 4.00 1.73 8 1.7 0 0 Gender 466 0 .0 Ethnicity 462 4 .9 Site 466 0 .0 Table Notes: Number of cases outside the range (Q1 - 1.5*IQR, Q3 + 1.5*IQR). Key for Table: Edu= Education; Optimism Scale Item= LOTR1-LOTR10; Academic Hope Scale Item = AHS1-AHS6; Academic Self-efficacy Scale Item= ASES1-ASES13; General Well-being Scale Item = GWB1-GWB29 The correlations are shown in Table 2. Not surprisingly, the correlation between academic hope
agency and academic hope was 0.92, p < 0.001. Similarly, the correlation between average
grades and the grades comprising the average (English, Math, Science, and Social Studies) were
around 0.80, p < 0.034.
Z-scores were computed to measure skewedness and kurtosis. These summary statistics
and histograms are shown in Appendix A.
Stage 2: Assessing Reliability and Validity of Constructs and Indicators
One of the most important advantages offered by latent-variable analyses is the
opportunity that is provided to assess the reliability and validity of the study’s variables. In
general, reliability refers to consistency of measurement; validity refers to the extent to which an
instrument measures what it is intended to measure. For example, a survey is reliable if it

68
provides essentially the same set of responses for a group of respondents upon repeated
administration. Similarly, if a scale is developed to measure general well-being and scores on
the scale do in fact reflect respondents’ underlying general well-being, then the scale is valid.
For both reliability and validity, there are a number of different ways that they may be measured.
Indicator reliability. The reliability of an indicator (observed variable) is defined as the
square of the correlation (squared multiple correlation or SMC) between a latent factor and that
indicator. For instance, looking at Table 3, the standardized loading for the path between
LOTR1 and Optimism is 0.712 and the reliability is 0.507. Looking at the range of indicator
reliabilities, most have relative low reliabilities (lower than 0.6). The highest reliability is 0.588
between ASES5 and Academic Self-Efficacy.
Table 2 Reliability and Validity Estimates Variance Construct and Standardized Indicator Extracted Composite Cronbach's Indicators Loading Error t* Reliability Estimate Reliability Alpha Optimism 0.318 0.636 0.572 LOTR1 0.712 0.493 9.201 0.507 LOTR4 0.587 0.656 8.021 0.344 LOTR10 0.516 0.734 12.942 0.266 Pessimism 0.278 0.243 0.094 LOTR3 0.397 0.842 5.001 0.158 LOTR7 0.467 0.782 7.882 0.218 LOTR9 0.676 0.543 12.942 0.457 Academic Hope 0.477 0.845 0.836 AHS1 0.701 0.508 16.165 0.492 AHS2 0.748 0.440 17.616 0.560 AHS3 0.617 0.619 13.712 0.381 AHS4 0.736 0.458 17.251 0.542 AHS5 0.716 0.487 16.614 0.513 AHS6 0.612 0.626 13.570 0.374
(table continues)

69
Variance Construct and Standardized Indicator Extracted Composite Cronbach’s Cronbach’s Indicators Loading Error t* Reliability Estimate Reliability Alpha Academic Self-Efficacy 0.328 0.857 0.847 ASES1 0.607 0.631 15.557 0.369 ASES2 0.253 0.936 5.195 0.064 ASES3 0.593 0.648 13.253 0.352 ASES4 0.401 0.839 8.466 0.161 ASES5 0.767 0.412 18.609 0.588 ASES6 0.649 0.579 14.849 0.421 ASES7 0.644 0.585 14.734 0.415 ASES8 0.339 0.885 7.080 0.115 ASES9 0.561 0.685 12.407 0.315 ASES10 0.535 0.714 11.735 0.286 ASES11 0.674 0.546 15.557 0.454 ASES12 0.644 0.585 14.690 0.415 ASES13 0.553 0.694 12.199 0.306 General Well-Being 0.245 0.896 0.894 GWB1 0.555 0.692 12.462 0.308 GWB2 0.487 0.763 10.684 0.237 GWB3 0.448 0.799 9.754 0.201 GWB4 0.327 0.893 6.923 0.107 GWB5 0.422 0.822 9.106 0.178 GWB6 0.551 0.696 12.364 0.304 GWB7 0.597 0.643 13.633 0.357 GWB8 0.656 0.570 15.311 0.430 GWB9 0.473 0.776 10.344 0.224 GWB10 0.525 0.724 11.674 0.276 GWB11 0.702 0.507 16.777 0.493 GWB12 0.521 0.729 11.545 0.271 GWB13 0.653 0.573 15.240 0.427 GWB14 0.688 0.526 16.308 0.474 GWB15 0.731 0.466 17.681 0.534 GWB16 0.718 0.484 17.295 0.516 GWB17 0.559 0.688 12.544 0.312 GWB18 0.249 0.938 5.216 0.062 GWB19 0.341 0.884 7.208 0.116 GWB20 0.335 0.888 7.060 0.112 GWB21 0.377 0.858 8.050 0.142 GWB22 0.454 0.794 9.867 0.206 GWB23 0.463 0.786 10.081 0.214 GWB24 0.279 0.922 5.834 0.078 GWB25 0.241 0.942 5.036 0.058 GWB26 0.308 0.905 6.466 0.095 GWB27 0.354 0.875 7.494 0.125 GWB28 0.307 0.906 6.445 0.094 GWB29 0.400 0.840 8.574 0.160 Key for Table: Optimism Scale Item= LOTR1-LOTR10; Academic Hope Scale Item = AHS1-AHS6; Academic Self-efficacy Scale Item = ASES1-ASES13; General Well-being Scale Item = GWB1-GWB29

70
Composite reliability has been computed for each latent factor included in the model.
This index is similar to coefficient alpha and reflects the internal consistency of the indicators
measuring a particular factor (Fornell & Larcker, 1981). Both the composite reliability and the
variance extracted estimates are shown in Table 3. Fornell and Larcker (1981) recommend a
minimum composite reliability of .60. An examination of the composite reliabilities revealed
that most, with the exception of pessimism and life orientation test, meet that minimum
acceptable level. The composite reliabilities for pessimism and life orientation test are 0.243 and
0.218, respectively.
Table 3 Correlations and Squared Correlations
Correlation Coefficients for Latent Constructs Variable GWB ASES AHS Optimism GWB 1.000 ASES 0.437 1.000 AHS 0.359 0.694 1.000 Optimism 0.470 0.505 0.498 1.000
Squared Correlation Coefficients for Latent Constructs Variable GWB ASES AHS Optimism GWB 1.000 ASES 0.191 1.000 AHS 0.129 0.482 1.000 Optimism 0.221 0.255 0.248 1.000 Table Key: GWB = General Well-being; ASES = Academic Self Efficacy; AHS= Academic Hope Scale
The variance extracted estimates assesses the amount of variance that is explained by an
underlying factor in relation to the amount of variance due to measurement error. For instance,
the variance extracted estimate for academic hope was 0.477, meaning that 47.7% of the
variance is explained by the academic hope construct, and 52.3% is due to measurement error.

71
Fornell and Larcker (1981) suggest that constructs should exhibit estimates of .50 or larger.
Estimates less than .50 indicate that variance due to measurement error is larger than the variance
captured by the factor. The variance extracted estimates do not meet this minimum threshold, so
the validity of the latent construct as well as the associated constructs may be questionable.
However, Hatcher (1994) cautions that the variances extracted estimate test is conservative;
reliabilities can be acceptable even if variances extracted estimates are less than 0.50.
Another measure of internal consistency of scales is Cronbach’s alpha (Cronbach &
Meehl, 1955). Values greater than or equal to 0.70 are considered to have good construct
reliability. In this study, Academic Hope, Academic Self-Efficacy, and General Well-being meet
these criteria (alpha values are 0.836, 0.847, and 0.894, respectively). The alpha coefficient for
Optimism is 0.572. Most likely, low indicator reliability for item LOTR10 most likely had an
impact on the final value. However, Cronbach’s alpha will also increase as the number of items
in the scale increase, so it is not unusual for a scale composed of three items to have a lower
alpha value than a scale of 10 items.
Convergent validity is present when different instruments are used to measure the same
construct and scores from these different instruments are strongly correlated. In contrast,
discriminant validity is present when different instruments are used to measure different
constructs and the measures of these different constructs are weakly correlated.
In the present study, convergent validity was assessed by reviewing the t-tests for the
factor loadings. If all the factor loadings for the indicators were greater than twice their standard
errors, the parameter estimates demonstrated convergent validity. The significant t-tests showed
that all indicators were effectively measuring the same construct (Anderson & Gerbing, 1988).
Consider the convergent validity of the 13 indicators that measure Academic Self-Efficacy. The

72
results show that the t values for these 13 indicators range from 5.195 to 18.609. These results
support the convergent validity of ASES1 through ASES13 as measures of Academic Self-
Efficacy.
Discriminant validity was assessed through the use of the variance extracted test (Fornell
& Larcker, 1981). The results are shown in Table 4. Constructs were evaluated by comparing
the variance extracted estimates for two factors on interest, and comparing these estimates to the
square of the correlation between the two factors. Discriminant validity is present if both
variance extracted estimates are greater than the squared correlation.
For this data set, the correlation between optimism and academic hope is 0.407, and the
square of this correlation is 0.166. The variance extracted estimate for optimism and academic
hope are 0.231 and 0.477, respectively. Because the variance extracted estimate for optimism
was less than the squared correlation (0.095 < 0.275), this test supports the discriminant validity
of the two factors. Examination of all factors revealed discriminant validity for most factors with
the exception of the relationships academic self-efficacy and academic hope.
Stage 3: Development of the Measurement Models
The steps followed in the analysis were dictated by the need first to establish the
measurement properties of the model, and only then to estimate and compare the structural
parameters of the model. The purpose of a measurement model is to describe how well the
observed indicators serve as a measurement instrument for the construct or latent variables
(Jöreskog & Sörbom, 2006). First, four measurement models were analyzed. Specifically, the
measurement properties of the variables used in the analyses were examined.

73
Research Question 1: Are the observed variable indicators for Model 1 statistically
significant in a confirmatory factor analysis?
The first model (First) is shown below. The first research question was whether, based
on a sample size of 466, the observed variable indicators for Model 1 were statistically defined
by their proposed latent variables in a confirmatory factor analysis. Specifically this question
examined if the indicators English Class, Math Class, Science Class and Social Studies Class
were significantly indicators of the latent construct Student Achievement. The proposed Model 1
is depicted below followed by a table of the measurement model.
Figure 10. Measurement Model 1--Student Achievement.
Student Achievement
English Math Science SocialSt

74
Table 4 Measurement Model 1: Student Achievement Confirmatory Factor Analysis Indicator Variable
Factor Loading
Standard Error
T value
P value
Standardized Loadings
English Class 2.07 0.75 Math Class 1.21 0.09 12.22 < .0001 0.66 Science Class 1.47 0.09 16.33 < .0001 0.77 Social St. Class 2.36 0.14 16.85 < .0001 0.82 Table 4 shows that the indicator variables that make up the latent variable student
achievement are all significant. The t value or critical value is computed by dividing the
parameter estimates by their respective standard errors. The t value is compared to the tabled t
value of 1.96 for significance at the .05 level of significance. The t values for the variables
English Class, Math Class, Science Class, and Social Studies Class all predict the latent variable
of student achievement.
Research Question 2: Are the observed variable indicators for Model 2 statistically
significant in a confirmatory factor analysis?
The purpose of the second research question was to examine if the observed variable
indicators for Model 2 significantly load on the hypothesized latent variable, competence, in a
confirmatory factor analysis. This second research question specifically examined if the
indicators academic hope agency and academic self-efficacy were significant in representing the
latent construct Competence. Model 2 is depicted below followed by a table of the measurement
model.

75
Figure 11. Measurement Model 2--Competence Belief System. Table 5 shows that the indicator variable academic hope agency and indicator variable academic
self-efficacy are both statistically significant in predicting the latent variable competence. The t
value or critical value is computed by dividing the parameter estimates by their respective
standard errors. The t value is compared to the tabled t value of 1.96 for significance at the .05
level of significance. The t values shown in Table 5 reveal the indicator variables are significant
in predicting the competence latent variable.
Table 5 Measurement Model 2: Competence Belief System Indicator Variable
Factor Loading
Standard Error
T Value
P Value
Standardized Loadings
Academic Hope Agency
2.85 0.18 16.83 < 0.0001 0.73
Academic Self-Efficacy 2.34 0.23 10.52 < 0.0001 0.53
Hope Agency
Self-Efficacy
Competence

76
Research Question 3: Are the observed variable indicators for Model 3 statistically
significant in a confirmatory factor analysis?
The purpose of the third research question was to examine if the observed variable
indicators for Model 3 statistically load on the proposed latent variable in a confirmatory factor
analysis. This question specifically examined if the indicators academic hope pathways and
optimism were significant in representing the latent construct Control. Model 3 is depicted below
followed by a table of the measurement model.
Figure 12. Measurement Model 3--Control Belief System. Table 6 shows that the indicator variable academic hope pathways and indicator variable
optimism are both statistically significant in predicting the latent variable control. The t value or
critical value is computed by dividing the parameter estimates by their respective standard errors.
The t value is compared to the tabled t value of 1.96 for significance at the .05 level of
Hope Pathways
Optimism
Control

77
significance. The t values shown in Table 5 reveal the indicator variables are significant in
predicting the competence latent variable.
Table 6
Measurement Model 3: Control Belief System
Indicator Variable
Factor Loading
Standard Error
t value
p value
Standardized Loadings
Academic Hope Pathways
2.29 0.17 13.47 < 0.0001 0.72
Optimism 1.43 0.23 9.53 < 0.0001 0.47
Research Question 4: Are the observed variable indicators for Model 4 statistically
significant in a confirmatory factor analysis?
The purpose of the fourth research question was to examine if the observed variable
indicators for the proposed Model 4 statistically load on the hypothesized latent variable in a
confirmatory factor analysis? This question specifically examined if the indicators behavior
control, emotion regulation, and peer relationships were significant in representing the latent
construct general well-being.
Figure 13. Measurement Model 4--General Well-being.
General
Well-being
Peer
Emotional Behavior

78
Table 7 shows that the indicator variables behavior control, emotional tone, and peer
relationships, are statistically significant in predicting the latent variable general well-being. The
t value or critical value is computed by dividing the parameter estimates by their respective
standard errors. The t value is compared to the tabled t value of 1.96 for significance at the .05
level of significance. The t values shown in Table 5 reveal the indicator variables are significant
in predicting the general well-being latent variable.
Table 7
Measurement Model 4: General Well-being Confirmatory Factor Analysis
Indicator Variable Factor Loading Standard Error t value p value Standardized Loadings Behavior Control 4.34 0.55 Emotional Tone 8.40 0.75 11.20 <.0001 0.88 Peer Relationships 6.65 0.60 11.08 <.0001 0.75
Research Question 5: What is the best-fitting confirmatory factor model for the measures
of academic hope, academic self-efficacy, and optimism?
The proposed confirmatory factor model is shown below. The model examines the
theoretical nature of the competence and control indicators. In this specific confirmatory factor
model was whether, based on a sample size of 466, the three measures can be used
interchangeably or whether scores on one or more of the measures of academic self-efficacy,
academic hope and optimism were reliable. Examination of the congeneric model revealed a
perfect fit (χ2 = 0, df = 0, p = 1.00).

79
Figure 14. Proposed Confirmatory Factor Model 1, System of Competence and Control.
The values in Table 8 reveal the loadings for the paths in confirmatory model one. The
model was saturated; the number of free parameters exactly equals the number of known values,
so there are zero degrees of freedom. There are no unique solutions; statistically these models
are often of little value. However, based on theory the model and will be considered further in
the analyses of structural models.
Table 8
Confirmatory Factor Model 1: System of Competence and Control
Indicator Variable Factor Loading Standard Error t value p value Standardized Loadings Academic Hope 4.70 0.34 13.82 ----- 0.74 Academic Self-efficacy 5.08 0.34 14.94 ----- 0.84 Optimism 1.46 0.15 9.73 ----- 0.48
A second confirmatory factor model was created to examine the relationship between
competence beliefs and control beliefs. The model is shown below in Figure 15. In
Academic Self-Efficacy
Academic Hope
Optimism
System of Competence and
Control

80
confirmatory factor model two, competence is dependent on academic self-efficacy and hope
agency; control is dependent on optimism and hope pathways.
HopeAgency
Optimism
HopePathways
AcademicSelf-Efficacy
Competence
Control
Figure 15. Proposed Confirmatory Factor Model 2, Competence and Control.
Table 9 shows that the indicator variables for confirmatory factor model two. This model
has two latent variables, competence and control. The t values in the table indicate that of the
indicator variables only academic hope agency and academic hope pathways were significant
predictors. The t value or critical value is computed by dividing the parameter estimates by their
respective standard errors. The t value is compared to the tabled t value of 1.96 for significance
at the .05 level of significance. Academic self-efficacy and academic hope pathways appear to be
approaching significance. The t values shown in Table 9 reveal that all indicator variables are not
significant in predicting the latent variables competence and control.

81
Table 9 Proposed Confirmatory Factor Model 2: Competence and Control Indicator Variable Factor Loading Standard Error t value p value Standardized Loadings Academic Hope Agency 3.09 0.20 15.45 0.04 0.79 Academic Self-Efficacy 2.21 0.22 10.04 0.06 0.50 Academic Hope Pathways 2.53 0.18 14.06 0.04 0.79 Optimism 1.28 0.15 8.53 0.07 0.42
Earlier evaluation of a model with the covariance between competence and control freed
resulted in a non positive definite model, evidence of collinearity. The correlation matrix is
shown below in Table 10. There are high correlations (0.924 and 0.885, respectively) between
academic hope and academic hope agency and academic hope and academic hope pathways.
These are not surprising, considering that data from academic hope agency and academic hope
pathways were included in the formation of the variable, academic hope.
Table 10 Correlation Matrix for Model of Competence and Control
Optimism Hope Agency Hope Pathways Academic Self-Efficacy Optimism 1.000 Academic Hope Agency 0.321 1.000 Academic Hope Pathways 0.333 0.640 1.000 Academic Self-Efficacy 0.259 0.395 0.386 1.000 Model results for the theoretical model are shown in Table 11. The model resulted with χ2 = 2.43
with 1 degree of freedom (p = 0.12), GFI = 1.00, CFI = 1.00, RMSEA = 0.055 with 90% CI
(0.041, 0.063).

82
Table 11
Measurement Model Fit Statistics of Confirmatory Factor Models
Model Χ2 df p RMSEA CI for RMSEA GFI CFI Confirmatory Factor Model 1 0.00 0 1.00 0.00 0.00 1.00 1.00 Confirmatory Factor Model 2 2.43 1 0.12 0.05 .00,.15 ---- 1.00 Table 11 provides fit criteria for the confirmatory factor model one and confirmatory
factor model two. It appears that the confirmatory factor model two has better fit indices.
However, the t values for the indicator variables for the model two indicated that not all indicator
variables predicted the latent variables for the confirmatory factor model. In addition,
confirmatory factor model one is favored highly in the established research regarding
competence and control beliefs. Confirmatory model one and confirmatory model two are
examined once more in the structural equation model section 4 that follows this section.
Stage 4: Structural Equation Models
Research Question 6: Are the relations amongst the latent variables statistically
significant in the structural model.
The proposed measurement model of competence and control has one latent construct
(system of competence and control) that is dependent on three exogenous variables – academic
hope, academic self-efficacy and optimism. Previously, the model was analyzed using the full
data set, then by gender, ethnicity, and school. Because of the sample size, 466, it was possible
to break the data into two groups for analysis, but not into multiple groups.
With regard to appropriate sample size, it is well-established in the literature that
structural equation modeling requires a large sample size, although recommendations of exactly
how large the sample should be are inconsistent. Conservative estimates generally indicate 15
83
cases per measured variable (Bentler & Chou, 1987; Tabachnick & Fidell, 2001), while Quintana
and Maxwell (1999) recommend a minimum of 200 participants. More liberal recommendations
(Anderson & Gerbing, 1984) report that a sample size of 150 is sufficient for obtaining a proper
solution for models with three or more indicators per factor. With a data set of 466, conservative
two-group analyses are plausible.
In the proposal, two different structural models were proposed. The first proposed
structural model includes the first measurement model (student achievement) and fourth
measurement model (general well-being) being predicted by the latent construct system of
competence and control which is confirmatory factor model one. Student achievement and
general well-being are dependent on a system of competence and control. Student achievement
(measurement model 1) is dependent on grades in English, math, science, social studies, and a
residual disturbance term that represents all of the variation in student achievement not explained
by the two latent, exogenous variables. General well-being (measurement model 2) is dependent
on behavior control, emotional regulation, peer relationships, and a residual disturbance term that
represents all of the variation in general well-being not explained by the two latent, exogenous
variables. The system of competence and control is dependent on academic hope, academic self-
efficacy, optimism and a residual disturbance term. See Figure 16. The description of the second
proposed structural model follows in the section of this chapter.

84
AcademicSelf-Efficacy
AcademicHope
Optimism
System of Competenceand
Control
StudentAchievement
EnglishC MathClas ScienceC SocialSt
GeneralWell-being
PeerEmotionalBehavior
Figure 16. Proposed Structural Model 1.
To create the first proposed structural model, Model 1, the first step in the analysis was to
establish a baseline model following the guidelines of Figure 4 in Chapter 3. The results of this
model indicated that the results were admissible. The chi-square statistic for this model was
100.64 with 33 degrees of freedom, p = 0.000; RMSEA = 0.067 CI (confidence interval) for
RMSEA (0.052; 0.082), GFI = 0.96 and CFI = 0.97. Chi-square is a measure of the compatibility
of the data with the hypothesis. A chi-square value this large relative to the degrees of freedom
indicates a poor fit between the estimated and actual covariance matrices. The comparative fit
index, CFI, compares the covariance matrix predicted by the model to the observed covariance
matrix, and compares the null model with the observed covariance matrix, to measure the percent
of lack of fit that is accounted for by going from the null model to the proposed SEM model. CFI

85
and RMSEA are among the measures least affected by sample size (Fan, Thompson, & Wang,
1999). CFI varies from 0 to 1. A CFI close to 1 indicates a very good fit.
The root mean square error of approximation (RMSEA) is a measure of the closeness of
fit, with values less than 0.05 indicating good model fit, and values up to 0.08 indicating
reasonable model fit (Browne & Cudeck 1993; Hu & Bentler 1999). Steiger (1990), Browne and
Cudeck (1993), and MacCallum, Browne, and Sugawara (1996) suggested that a confidence
interval (CI) be calculated which should include values between 0 and 0.05 to indicate the
possibility of good fit. The goodness-of-fit index (GFI) was developed by Jöreskog and Sörbom
(1984) and deals with error in reproducing the variance-covariance matrix. Values for the GFI
range from 0 to 1 with 1 being a perfect fit. Values greater than .90 are considered excellent
(Bentler & Chou, 1987). Model fit is good for those measures that are not affected by sample
size.
In the first proposed structural model, student achievement and general well-being are
dependent on the system of competence and control. Similarly, the latent construct system of
competence and control is dependent on academic hope, academic self-efficacy, optimism, and a
disturbance term. The model is shown above diagrammatically in Figure 16.
In the second proposed structural model, student achievement and general well-being are
dependent on the latent construct competence and latent construct control. Student achievement
(measurement model 1) is dependent on grades in English, math, science, social studies, and a
residual disturbance term that represents all of the variation in student achievement not explained
by the two latent, exogenous variables. General well-being (measurement model 4) is dependent
on behavior, emotional, peer, and a residual disturbance term that represents all of the variation
in general well-being not explained by the two latent, exogenous variables. Competence

86
(measurement Model 2) is dependent on academic hope agency, academic self-efficacy and a
residual disturbance term; control (measurement model 3) is dependent on academic hope
pathways, optimism and a residual disturbance term. The model was run using the full data set.
(χ2 = 133.69, df = 39, p = 0.00, RMSEA = 0.072. The 90% confidence interval for RMSEA =
0.06, 0.08, CFI = 0.97 and GFI = 0.95. The results also indicated that the model was not positive
definite. This is due to the evidence of collinearity that was previously discussed regarding
confirmatory factor model two, which consisted of the two latent constructs competence and
control. The rationale for using the proposed structural Model 1 over proposed structural Model
2 is further described in the discussion.
HopeAgency
Self-Efficacy
Hope Pathways
StudentAchievement
EnglishC MathClas ScienceC SocialSt
GeneralWell-being
PeerEmotionalBehavior
Optimism
Competence
Control
Figure 17. Proposed Structural Model 2.

87
Table 12
Comparison of Two Structural Equation Models
Structural Model 1 Structural Model 2
Student
Achievement
General Well-Being
Student
Achievement
General Well-Being
Latent Variable Factor Loading (SE) Factor Loading (SE) Competence 0.25 (0.22) 0.69 (0.34) Control 0.34 (0.21) - 0.19
(0.33) Combined Error
Variance 0.63 (0.08) 0.78 (0.15)
System of Competence and Control
0.64 (0.061) 0.60 (0.07)
Combined Error Variance
0.59 (0.08) 0.64 (0.11)
χ2 (df; p) 100.64 (33; 0.00) 133.69 (39; 0.00) Reliability Rho
(RFI) 0.95 0.94
RMSEA
0.067 0.072
NFI;CFI;GFI 0.96; 0.97; 0.96 0.96; 0.97; 0.95
Structural Model 1 is composed of the latent variable system of competence and control.
Structural model one was the better model when examined closely with structural model two.
The comparative fit index, CFI for both models are exact. A CFI close to 1 indicates a very good
fit. Structural model one has a reasonable fit according to RMSEA [0.06] when comparing to the
RMSEA value of structural model two [0.072]. RMSEA is a measure of the closeness of fit,
with values less than 0.05 indicating good model fit, and values up to 0.08 indicating reasonable
model fit (Browne & Cudeck, 1993; Hu & Bentler, 1999). The direction of the parameter
estimates for structural model one was theoretically meaningful. The latent variable control of

88
structural model two revealed a negative coefficient that was not theoretically meaningful.
Structural model one is furthered examined by gender, ethnicity and age group in the following
section.
Research Question 7: Are there significant differences by group (ethnicity, gender, and
age group) for the structural model predicting Student Achievement and General Well-being?
Multiple Group Structural Equation Models
Group comparisons in structural equation modeling are termed Multiple Group analysis.
Basically, the sample data is split by a categorical variable to create two separate variance-
covariance matrices, for example, a separate sample matrix for females and males. A theoretical
model is hypothesized and then tested for the group difference. The individual analysis for each
group and the multiple group analyses are presented. The t values (coefficient/error) indicate
whether the factor loadings and structure coefficients are statistically significant. The t values are
not exact due to rounding error in the program output.
The hypothesized theoretical model has an independent latent variable, System, predicting
two dependent latent variables, Achieve (student achievement) and GWB (general well-being).
The theoretical model does not indicate a reciprocal relation between Achieve and GWB, that is,
a path for GWB predicting Achieve and another path for Achieve predicting GWB. If these
reciprocal paths were included, the errors of prediction would also need to be correlated, so that
the reciprocal structure coefficients would be estimated correctly.
There were three separate Multiple Group SEM analyses conducted for this study:
Females versus Males, African Americans (Black) versus Caucasian Americans (White), and
High School age students versus College age students. For each multiple group analysis, a

89
stacked LISREL program was created that included the correlation matrix, means, standard
deviations, and model statements. The hypothesized SEM model was first run individually for
each group with tabled results, and then tested to determine if the factor loadings and structure
coefficients were the same between the two groups being compared. The multiple group
comparison produced tabled results with a common set of coefficients being tested for model fit.
Gender Difference
The theoretical hypothesized SEM model was the same for all three group comparisons,
for example, Figure 18 depicts the hypothesized SEM model used to compare Females versus
Males. See Appendix D for the separate LISREL analysis programs with the separate data sets
and common SEM model statements. Table 13 displays the results for these two separate
LISREL analyses. See Appendix D for the LISREL multiple group SEM program where the
individual programs are stacked. The first group, Female, contains the model statements. Notice
that these model statements are not repeated in the second group, Male. This is the procedure
LISREL uses to set the factor loadings and structure coefficients to a common value for model
testing. Also note, that the error covariances are set free in the second group, Male, so that the
error covariances can be different in the two groups, Females and Males. This is common
practice to allow the errors to be different (free) permitting fluctuation in any un-modeled
variables or random error. Table 14 displays the multiple group results with the common set of
coefficients being tested for equality between the groups.

90
Optim
Hope
ASET
System
Achieve
GWB
English
Math
Science
Social
Behvr
Emot
Peer
Figure 18. Female versus Male Hypothesized SEM Model. Table 13 Female versus Male SEM Model Comparison
Female SEM Model Fit Male SEM Model Fit SEM Paths Coefficient Error T P Coefficient Error t p ASET -> System 2.74 .31 8.89 .0001 2.90 .36 8.11 .0001 Hope -> System 3.31 .37 9.05 .0001 4.71 .55 8.56 .0001 Optim-> System 1.11 .22 5.05 .0001 1.53 .24 6.39 .0001 English-> Achieve 1.06 .12 8.55 .0001 1.07 .12 8.55 .0001 Math-> Achieve .94 .12 8.14 .0001 1.05 .12 8.55 .0001 Science->Achieve .91 .11 8.14 .0001 1.11 .11 10.34 .0001 Social-> Achieve 1.04 .12 8.97 .0001 1.32 .12 10.60 .0001 Peer-> GWB 4.66 .96 4.88 .0001 4.68 1.26 3.71 .0001 Behvr-> GWB 2.44 .81 3.01 .0001 2.31 .80 2.89 .0001 Emot-> GWB 5.46 1.11 4.94 .0001 3.99 .90 4.42 .0001 System-> Achieve .70 .09 7.23 .0001 .56 .09 6.12 .0001 System-> GWB -.25 .10 -2.46 .014 -.20 .11 -1.93 .054 χ2/df; p value 66.65/33 = 2.01 ; < .05 49.55/33 = 1.50 ; < .05 RMSEA ; GFI .07 ; .95 .05 ; 96

91
Multiple Group Comparison: Female versus Male
The multiple group comparison tested whether the factor loadings and structure
coefficients are different in the theoretical model between females and males. This is
accomplished by setting the constraint that the factor loadings and structure coefficients are set to
similar values in both groups. The error covariance in Group 2: Males are set free, which is
standard practice to allow error covariance of observed indicator variables to be different
between the groups. The error variance of both the Achieve and GWB dependent latent
variables required setting their respective error variances for model identification. In absence of
doing this, the theoretical model would require a reciprocal relation specified between them
along with a correlation between their predicted error terms. Results indicated that a common set
of factor loadings and structure coefficients are present that yield no difference between females
and males in the theoretical SEM model (minimum χ2 = 2.23, RMSEA = .07, and Comparative
Fit Index = .97).
Table 14 Multiple Group SEM Model Comparison: Female versus Male
Multiple Group Model Fit SEM Paths Coefficient Error t p ASET -> System 3.19 .25 12.64 .0001 Hope -> System 4.66 .34 13.68 .0001 Optim-> System 1.32 .20 6.66 .0001 English-> Achieve .52 .056 9.31 .0001 Math-> Achieve ..49 .055 8.96 .0001 Science->Achieve .44 .048 9.16 .0001 Social-> Achieve .53 .055 9.56 .0001 Peer-> GWB 5.26 .59 8.92 .0001 Behvr-> GWB 2.83 .47 5.99 .0001 Emot-> GWB 6.09 .69 8.81 .0001
(table continues)

92
Multiple Group Model Fit SEM Paths Coefficient Error t p System-> Achieve 1.66 .26 6.41 .0001 System-> GWB -.23 .078 -2.91 .004 χ2/ df ; p value 95.92/43 = 2.23 ; < .05 RMSEA; CFI .07 ; .97 Summary
The Female SEM model indicated that the factor loadings for the independent and
dependent latent variables were statistically significant. Therefore the observed indicator
variables defined their respective latent variables. Moreover, both structure coefficients (System
predicting Achieve; System predicting GWB) were statistically significant. The minimum chi-
square (χ2/df) was less than 3.94 at the .05 level, RMSEA was between .05 and .08, and GFI was
95% (95% of the variable variance-covariance was reproduced by the model) indicating a good
overall model fit to the data.
The Male SEM model also indicated that the factor loadings for the independent and
dependent latent variables were statistically significant. Therefore the observed indicator
variables defined their respective latent variables. However, the structure coefficient for System
predicting Achieve was statistically significant, but the structure coefficient for System
predicting GWB was not statistically significant (1.93 versus 1.96 at the .05 level). The
minimum chi-square (χ2/df) was less than 3.94 at the .05 level, RMSEA was between .05 and .08,
and GFI was 96% (96% of the variable variance-covariance was reproduced by the model),
indicating a good overall model fit to the data.
Overall, one can conclude that the separate variance-covariance amongst the indicator
variables for females and males supported the SEM theoretical model.

93
Multiple group differences show that Females and Males fit a common model, that is, the
theoretical SEM model with a set of common coefficients for the two groups, is tenable. A non-
significant chi-square indicates that the two groups do not differ overall in the hypothesized SEM
model. System did statistically significantly predict Achieve and GWB.
Ethnic Difference
The same hypothesized SEM model is indicated for model differences between Blacks
and Whites (Figure 19). The separate LISREL programs for Black and White students are found
in Appendix D. The LISREL programs were run to produce the results in Table 15. The
LISREL multiple group program is included in Appendix D. The multiple group results are
displayed in Table 16.
Optim
Hope
ASET
System
Achieve
GWB
English
Math
Science
Social
Behvr
Emot
Peer
Figure 19. Black versus White Hypothesized SEM Model.

94
Table 15 Black versus White SEM Model Comparison
Black SEM Model Fit White SEM Model Fit SEM Paths Coefficient Error t p Coefficient Error t p ASET -> System 2.58 .38 6.87 .0001 2.92 .29 9.97 .0001 Hope -> System 4.85 .58 8.34 .0001 4.04 .42 9.67 .0001 Optim-> System 1.17 .23 5.20 .0001 1.75 .23 7.77 .0001 English-> Achieve .95 .11 8.77 .0001 1.13 .10 11.01 .0001 Math-> Achieve .82 .13 6.44 .0001 1.11 .11 10.41 .0001 Science->Achieve 1.07 .12 8.77 .0001 1.05 .09 11.01 .0001 Social-> Achieve 1.14 .13 8.71 .0001 1.20 .10 11.92 .0001 Peer-> GWB 6.03 1.34 4.49 .0001 3.24 .97 3.34 .001 Behvr-> GWB .50 .11 4.49 .0001 .43 .13 3.34 .001 Emot-> GWB 5.02 .97 5.19 .0001 4.51 1.33 3.40 .001 System-> Achieve .53 .10 5.31 .0001 .82 .087 9.41 .0001 System-> GWB -.14 .09 -1.39 .17 -.31 .12 -2.55 .01 χ2; df; p value 24.10 ; 33 ; .87 93.50/33 = 2.83 ; < .05 RMSEA ; GFI .00 ; .98 .09; 92 Multiple Group Comparison: Black versus White
The multiple group comparison is testing whether the factor loadings and structure
coefficients are different in the theoretical model between Blacks and Whites. This is
accomplished by setting the constraint that the factor loadings and structure coefficients are set to
similar values in both groups. The error covariance in Group 2: Whites are set free, which is
standard practice to allow error covariance of observed indicator variables to be different
between the groups. The error variance of both the Achieve and GWB dependent latent
variables required setting their respective error variances for model identification. In absence of
doing this, the theoretical model would require a reciprocal relation specified between them
along with a correlation between their predicted error terms. Results indicated that a common set
of factor loadings and structure coefficients are present that yield no difference between blacks

95
and whites in the theoretical SEM model (minimum χ2 = 2.18, RMSEA = .07, and Comparative
Fit Index = .97).
Table 16 Multiple Group SEM Model Comparison: Black versus White
Multiple Group Model Fit SEM Paths Coefficient Error t p ASET -> System 2.43 .34 7.17 .0001 Hope -> System 4.57 .52 8.86 .0001 Optim-> System 1.31 .23 5.64 .0001 English-> Achieve .60 .06 10.07 .0001 Math-> Achieve .47 .06 7.59 .0001 Science->Achieve .63 .05 11.87 .0001 Social-> Achieve .66 .05 11.68 .0001 Peer-> GWB 5.71 .85 6.72 .0001 Behvr-> GWB 2.74 .56 4.92 .0001 Emot-> GWB 5.09 .85 6.72 .0001 System-> Achieve .90 .19 4.80 .0001 System-> GWB -.10 .08 -1.17 .24 χ2/df; p value 93.67/43 = 2.18 ; < .05 RMSEA ; CFI .07 ; .97 Summary
The Black SEM model indicated that the factor loadings for the independent and
dependent latent variables were statistically significant. Therefore the observed indicator
variables defined their respective latent variables. However, the structure coefficient for System
predicting Achieve was statistically significant while the structure coefficient for System
predicting GWB was not statistically significant. The Black SEM model chi-square was non-
significant (p = .87), RMSEA was 0.0, and GFI was 98% (98% of the variable variance-
covariance was reproduced by the model) indicating a good overall model fit to the data.

96
The White SEM model also indicated that the factor loadings for the independent and
dependent latent variables were statistically significant. The White SEM model however could
be improved slightly by adding the command: Let error covariances between Social and English
correlate, which was a suggested modification. Therefore the observed indicator variables
defined their respective latent variables. Both structure coefficients for System predicting
Achieve and System predicting GWB were statistically significant. The minimum chi-square
(χ2/df) of 2.83 was less than 3.94 at the .05 level, RMSEA was .09, and GFI was 92%, which is
below the usual 95% subjective fit criteria. The White SEM model therefore did not have as
good a fit to the theoretical model as the Black SEM model.
Overall, one can conclude that the separate variance-covariance amongst the indicator
variables for Blacks and Whites supported the SEM theoretical model, although data for Black
participants fit the theoretical model better.
The multiple group analysis results indicated that a common set of coefficients were
tenable, so the two groups overall did not differ, that is, the chi-square was not statistically
significant. Noticeably, GWB had a negative structure coefficient and was not statistically
significant. Therefore, System did not predict GWB in the multiple group model.
High School versus College Difference
The same hypothesized SEM model is indicated for model differences between high
school and college (see Figure 3). The separate LISREL programs for high school and college
students (see Appendix D) were run to produce the results in Table 17. The LISREL multiple
group program is included in Appendix D with the results in Table 18.

97
Optim
Hope
ASET
System
Achieve
GWB
English
Math
Science
Social
Behvr
Emot
Peer
Figure 20. High School versus College Hypothesized SEM Model Table 17 High School versus College SEM Model Comparison
High School SEM Model Fit College SEM Model Fit SEM Paths Coefficient Error t p Coefficient Error t p ASET -> System 1.84 .27 6.91 .0001 2.68 .28 9.52 .0001 Hope -> System 4.75 .52 9.17 .0001 3.83 .43 8.91 .0001 Optim-> System 1.84 .27 6.91 .0001 .75 .19 3.92 .0001 English-> Achieve 1.04 .08 12.17 .0001 .68 .10 6.82 .0001 Math-> Achieve 1.18 .11 10.39 .0001 .85 .14 6.15 .0001 Science->Achieve 1.29 .10 12.36 .0001 .83 .12 6.71 .0001 Social-> Achieve 1.36 .11 12.17 .0001 .93 .14 6.82 .0001 Peer-> GWB 4.75 1.12 4.24 .0001 5.18 1.54 3.36 .001 Behvr-> GWB .57 .13 4.24 .0001 .37 .11 3.36 .001 Emot-> GWB 5.64 1.31 4.31 .0001 3.48 .70 5.00 .0001 System-> Achieve .60 .08 6.80 .0001 .73 .12 6.10 .0001 System-> GWB -.19 .11 -1.79 .07 -.08 .08 -1.00 .30 χ2; df; p value 42.37 ; 33 ; .13 50.19/33 = 1.52 ; < .05 RMSEA ; GFI .04 ; .96 .04; 96

98
Multiple Group Comparison: High School versus College
The multiple group comparison is testing whether the factor loadings and structure
coefficients are different in the theoretical model between high school student and college
student groups. This is accomplished by setting the constraint that the factor loadings and
structure coefficients are set to similar values in both groups. The error covariance in Group 2:
College is set free, which is standard practice to allow error covariance of observed indicator
variables to be different between the groups. The error variance of both the Achieve and GWB
dependent latent variables required setting their respective error variances for model
identification. In absence of doing this, the theoretical model would require a reciprocal relation
specified between them along with a correlation between their predicted error terms. The initial
results also indicated that for Group 1: High School and Group 2: College model improvement
would occur by adding error covariance paths between Hope and Optimism as well as between
Peer and Emotion, which indicates the model fit is different than the other multiple group
comparisons for Female vs. Male and Black vs. White.
Results are reported however for the same model comparisons as the other multiple group
analysis for interpretation purposes. Findings indicated that a common set of factor loadings and
structure coefficients are present that yield no difference between high school and college in the
theoretical SEM model (minimum χ2 = 2.78, RMSEA = .09, and Comparative Fit Index = .94).
This model fit, however, could be improved by adding the error covariance paths suggested.

99
Table 18 Multiple Group SEM Model Comparison: High School versus College
Multiple Group Model Fit SEM Paths Coefficient Error t p ASET -> System 2.86 .34 8.39 .0001 Hope -> System 4.30 .49 8.80 .0001 Optim-> System 1.44 .23 6.24 .0001 English-> Achieve .66 .06 11.81 .0001 Math-> Achieve .58 .06 9.73 .0001 Science->Achieve .60 .05 11.56 .0001 Social-> Achieve .63 .05 11.38 .0001 Peer-> GWB 4.83 .78 6.21 .0001 Behvr-> GWB 2.78 .58 4.77 .0001 Emot-> GWB 5.61 .92 6.12 .0001 System-> Achieve .94 .19 4.87 .0001 System-> GWB -.14 .09 -1.52 .13 χ2/df; p value 119.76/43 = 2.78 ; < .05 RMSEA ; CFI .09 ; .94 Summary
The High School SEM model indicated that the factor loadings for the independent and
dependent latent variables were statistically significant. Therefore the observed indicator
variables defined their respective latent variables. However, the structure coefficient for System
predicting Achieve was statistically significant while the structure coefficient for System
predicting GWB was not statistically significant. The High School SEM model chi-square was
non-significant (p = .13), RMSEA was 0.04, and GFI was 96% (96% of the variable variance-
covariance was reproduced by the model) indicating a good overall model fit to the data.
The College SEM model also indicated that the factor loadings for the independent and
dependent latent variables were statistically significant. Therefore the observed indicator
variables defined their respective latent variables. The College SEM model also indicated a
statistically significant structure coefficient for System predicting Achieve, but not System

100
predicting GWB. The minimum chi-square (χ2/df) of 1.52 was less than 3.94 at the .05 level,
RMSEA was .04, and GFI was 96%, which indicated a good overall model fit to the data.
Overall, one can conclude that the separate variance-covariance amongst the indicator
variables for High School and College supported the SEM theoretical model, although System
did not predict GWB.
The multiple group analysis results indicated that a common set of coefficients were
tenable, so the two groups overall did not differ, that is, the chi-square was not statistically
significant. Noticeably, GWB had a negative structure coefficient and was not statistically
significant. Therefore, System did not predict GWB in the multiple group model.
Summary of the Results
The results showed that the indicator variables of the proposed measurement models were
adequate predictors of the latent variables in the structural equation models. The latent variables:
student achievement, general well-being, competence, control, and system of competence and
control were predicted by the indicator variables.
The results did not support Hypothesis 1.1, which stated, “There will be no differences
between theoretically competing confirmatory factor models on the proposed motivational
system of competence and control beliefs (academic self-efficacy, academic hope, and
optimism).” The results indicated the contrary. The confirmatory factor model one, a proposed
system of competence and control, produced a better fit than confirmatory factor model two,
competence and control. The results confirmed Hypothesis 1.2, which stated, “The observed
variables (academic self-efficacy, academic hope, and optimism) will load on a single factor with
no distinction between competence and control beliefs.” The observed variables academic self-

101
efficacy, academic hope, and optimism did load on a single factor and that produced the better fit
for the proposed structural models. The results confirmed Hypothesis 2.1, which stated, “The
structural equation model indicating the system of competence and control beliefs directly
influence academic achievement and general well-being represents the sample data variance-
covariance matrix.”
Regarding, Hypothesis 2.2, “there will be no differences found across the structural
equation model by ethnicity, gender, or age group,” the multiple group analyses revealed no
significant differences in the proposed structural model 1 for ethnicity, gender, or age groups.
The system of competence and control predicted achievement and general well-being for
Caucasian American and female groups. The system of competence and control structural
equation model did not differ across the gender groups. However, the high school and college
groups, and the African American and male groups’ comparisons revealed that the structure
coefficient for system predicting achievement was statistically significant, but system predicting
general well-being was not significant. In general, the overall structural model did not differ
among the groups, but the results indicated that the Black student data fit the model better when
compared to the White student data.

102
CHAPTER 5
DISCUSSION
The purpose of this study was to examine in detail the relationship(s) shared between the
motivational constructs of academic hope, academic self-efficacy, and optimism. More
importantly, the results reported in Chapter 4 specifically examined the relationship shared
between motivational constructs, general well-being, and student achievement in regards to
ethnicity, gender and age group (college and high school). The importance of the results reported
in Chapter 4 carry significant conclusions and implications for the field of educational
psychology and achievement motivation research. Prominent research studies have summoned
for such studies that examine motivational constructs across diverse populations to determine if
these constructs can be generalized across populations (Graham, 1994; Pintrich, 2003; Schunk &
Zimmerman, 2006).
In this chapter, the researcher discussed the findings, implications, and conclusions
related to the following research questions:
Research Question 1: Are the observed variable indicators for Measurement Model 1
statistically significant in a confirmatory factor analysis?
Research Question 2: Are the observed variable indicators for Measurement Model 2
statistically significant in a confirmatory factor analysis?
Research Question 3: Are the observed variable indicators for Measurement Model 3
statistically significant in a confirmatory factor analysis?

103
Research Question 4: Are the observed variable indicators for Measurement Model 4
statistically significant in a confirmatory factor analysis?
Research Question 5: What is the best-fitting confirmatory factor model for the measures
of academic hope, academic self-efficacy, and optimism?
This study further tested the following structural model research question:
Research Question 6: Are the relations amongst the latent variables statistically
significant in the proposed structural models?
Research Question 7: Are there significant differences by group (ethnicity, gender, and
age group) for the structural model predicting Student Achievement and General Well-being?
The analysis of this study examined the relationship shared among student achievement
and general well-being when presuming academic hope, academic self-efficacy, and optimism
serve as adequate predictors. The hypothesis gathered concerning the confirmatory factor model
of how the system of competence and control beliefs (academic hope, academic self-efficacy,
and optimism) operates was not supported by the results of the study. According to Hypothesis
1.1., the researcher presupposed “There will be no differences between theoretically competing
confirmatory factor models on the proposed motivational system of competence and control
beliefs (academic self-efficacy, academic hope, and optimism).” However, contrary to the
hypothesis, differences were found among the confirmatory factor models and those differences
found were in agreement with prior studies and theory regarding competence and control beliefs
which conclude that the motivational variables academic hope, academic self-efficacy, and
optimism operate in a similar manner (Bryant & Cvengros, 2004; Magaletta & Oliver, 1999;
Schunk & Zimmerman, 2006).

104
The findings of the study presented here provided empirical evidence for the relationship
shared among competence and control beliefs and the way in which these beliefs operate in
predicting student achievement and general well-being. According to the best fitting
confirmatory factor model, investigating academic hope, academic self-efficacy, and optimism
as a cognitive set used interchangeably in the system of competence and control beliefs proved
most reliable only when examined as a combined set of indicator variables. The findings which
suggest that the influence of the indicator variables (academic hope, academic self-efficacy, and
optimism) are agentically mediated through one another, operating as distinct constructs, yet
tapping into an overarching skill set are consistent with prior research studies (e.g., Bryant &
Cvengros, 2004; Magaletta & Oliver, 1999; Peterson, Gerhardt & Rode, 2006; Tennen, Affleck,
& Tennen, 2002).
The results established by the confirmatory factor model provide additional rationale for
an ongoing theoretical debate which claims self-efficacy has the most robust theoretical support
and empirical evidence in efficacy performance relationships. Bandura (1997) identified self-
efficacy as one of the most rigorous motivational variables impacting performance and other
outcome expectancies such as student achievement and general well-being (e.g., Marsh, 1990;
Pajares, 1996; Schunk, 1991; Zimmerman, 1989; Zimmerman et al., 1992). Self-efficacy beliefs
have also demonstrated a positive .38 relationship with work-related performance (Stajkovic &
Luthans, 1998). The results here indicated that academic hope served as a better indicator
variable for the system of competence and control. These results indicate caution for research
studies concerning student achievement that only identify self-efficacy as the better predictor
variable when examining motivational measures. Furthermore, the results of the study imply that
perceiving oneself to be efficacious does not, in itself, promote student achievement and general

105
well-being. However, self-efficacy has been extensively researched and has numerous studies
which identify self-efficacy as a powerful predictor of self regulation for learning and student
achievement (Bandura, 1997). Hope theory is currently becoming more present in motivational
psychology research and comparative studies of self-efficacy and hope’s relation to the operating
system of competence and control beliefs are sparse.
Although the results of the study did not support Hypothesis 1.1, the results supported the
second hypothesis stated by the researcher. Pertaining to Hypothesis 1.2, which stated, “The
observed variables (academic self-efficacy, academic hope, and optimism) will load on a single
factor with no distinction between competence and control beliefs” was supported by the results.
The best fitting confirmatory factor model detailed no distinction between the observed
variables. This provided confidence for examining the structural equation models and
presupposing that the motivational variables in combination serve as the best measurement
instrument for the latent construct which suggest the observed variables operating as a system of
competence and control beliefs would provide reasonable fit indices.
Examining the congeneric model of academic hope, academic self-efficacy, and
optimism loading on a single factor producing the system of competence and control beliefs
revealed a perfect fit (χ2 = 0, df = 0, p = 1.00). The squared multiple correlations for academic
hope, academic self-efficacy, and optimism were 0.60, 0.31, and 0.22, respectively. The
examination of the model also showed academic hope was the most reliable indicator in the
system of competence and control beliefs.
It also important to point out that for the best fitting structural model (proposed structural
equation model 1) across the sample size of 466 was consistently found to be the best fitting
model to explain the variance-covariance matrices of all groups examined. One of the primary

106
goals of the research study was to decipher the role of competence and control beliefs across
diverse populations. The results of the study suggest that for the population examined here
competence and control beliefs of academic hope, academic self-efficacy, and optimism with one
latent construct of “system of competence and control beliefs” operate in a similar manner. This
also identified the best confirmatory factor model, Figure 10, guaranteeing that it should also
serve as the measurement instrument in the structural equation model testing of all groups. When
examining the structural equation model by each group consisting of African American (Black)
and Caucasian American (White), female and male, and college and high school aged student
participants all revealed reasonable model fit.
The results regarding the analysis of the confirmatory factor model were essential to the
purpose of this study. Research studies inclusive of diverse student populations on competence
and control beliefs are largely nonexistent. According to Schunk and Zimmerman (2006), “there
is a need to test the influence of competence and control beliefs with diverse student
populations” (p. 363). Schunk and Zimmerman (2006) also discuss that while theory has posited
competence and control beliefs are universally important, clarification is needed to determine if
different ethnic backgrounds yield differences of individual and group achievement. The results
of the structural equation models were also necessary to understand the role in which
competence and control share in student achievement and motivation for diverse student
populations (e.g., Schunk & Zimmerman, 2006).
The results indicated using a system of competence and control as a latent variable
produced by the observed variables of academic hope, academic self-efficacy, and optimism was
the best confirmatory factor model across all groups and that separating competence and control
as two latent constructs, as well as separating academic hope into academic hope agency and

107
academic hope pathways did not yield the best model fit indices. Actually when competence and
control beliefs were separated as two latent constructs, the model was not viable. The group
comparisons also indicated that the motivational variables worked similarly across each group
examined and all groups demonstrated that academic hope was the best estimate of the system of
competence and control beliefs. These results are contrary to Chang and Banks (2007) and
Campbell and Kwon (2001), which suggested investigating academic hope’s two interrelated
components, agency and pathways, separately into the model of competence and control beliefs.
However, the separation of agency and pathways in the model did not produce this best
representation of the population examined in this study.
The fact that academic hope demonstrated an ability to be the best estimate of
competence and control beliefs throughout the population and among group comparisons signals
there is much strength in the theoretical as well as empirical rigorous nature of the hope concept.
Comparisons of hope, self-efficacy, and optimism have concluded that these three motivational
concepts are related, yet distinct (Bryant & Cvengros, 2004; Magaletta & Oliver, 1999; Scioli,
Chamberlin, Samor, LaPointe, et al., 1997). However, the results presented in Chapter 4 detail
that academic hope is a better indicator variable compared to the other two, optimism and
academic self-efficacy, when operating in a system. The outcome of the analysis has
substantiated much of the theorized tenets of motivational psychology in regards to hope, self-
efficacy, and optimism. This study goes on to support the notion that hope has unique theoretical
explanatory power (Luthans & Jensen, 2002).
The power of academic hope as the most reliable indicator in the system of competence
and control is discussed here and previous studies hypothesizing and concluding similar results
about hope’s power over the other motivational variables examined in this study are highlighted.

108
First, considering that academic hope succeeded in being the most reliable estimate of the system
of competence and control beliefs provides support to the debate acknowledging that Snyder et
al.’s (1991) hope theory has identified two interrelated concepts of motivation that optimism and
self-efficacy do not quite acknowledge. Secondly, academic hope is theoretically and empirically
observed to be distinct from self-efficacy and optimism.
As discussed in the literature review, Bandura’s (1997) explanation that self-efficacy is a
stronger predictor of behavior than the actual outcome expectancy differs from hope as Snyder’s
(1991) theory of hope illustrates hope as being composed of two equally essential components
that operate in combination of self-referencing thoughts of ability (agency) and the ability to
visualize plausible outcomes/routes (pathways). Hope also differs from optimism as Scheier and
Carver (1985) defined optimism as a generalized expectancy of a positive outcome. Hope is
more than the belief of positive outcomes; its agency component is conceptualized as willpower,
the ability to think positively about one’s capabilities which is similar to optimistic thinking.
However, optimists may very well lack the waypower component of hope which highlights the
way in which people link themselves and their capabilities to positive goals (Snyder, 2000).
Although the discussion of how the variables differ is definitely important, it must be
reiterated that the goal of the study here was not to pit one motivational variable against the
other. The study here continues to support the conclusions offered by prior studies suggesting
that each of the motivational variables strike an overarching skill set, somewhat interrelated, but
yet distinct in theory and explanatory ability (Magaletta & Oliver, 1999; Scioli et al., 1997). The
research design of this particular study was to examine how the competence and control beliefs
operate in connection to predict student achievement and general well-being across the diverse
population examined.

109
Structural Equation Models
The hypothesized structural equation models provided implications surrounding the
predictability of competence and control beliefs in the context of student achievement and
general well-being. In reference to the hypothesis stating, “The measurement model indicating
the system of competence and control beliefs directly influence academic achievement and
general well-being represents the sample data variance-covariance matrix” was confirmed by
results. The examination of the structural equation models yielded that the proposed structural
equation model with one latent construct (system of competence and control) that is dependent
on three exogenous variables--academic hope, academic self-efficacy, and optimism is viable
across all student groups. It is particularly important to highlight that the proposed model
produced reasonable fit indices for African American and Caucasian students, male and female
students, as well as high school and college aged students. The proposed structural equation
model produced reasonable fit indices across all groups and further supports Hypothesis 2.2,
“There will be no differences found across the measurement model by ethnicity, gender, or age
group.” The results indicating each of the student groups examined yielded reasonable fit indices
suggest that competence and control beliefs should be held in high regard to inform decisions
about the best curriculum practices for all students.
The structural model of the system of competence and control predicting student
achievement and general well-being fit reasonably across all groups examined. Although no
significant group differences were found, the results of the college group and high school group
analyses did point out that these two groups have a slightly different model fit than the other
groups (female and male groups; African American and Caucasian American groups) indicated
by the modification indices. Surprisingly, the system of competence and control did not predict

110
general well-being in the high school and college groups; and it did not do so in the male and
African American groups. This was a disappointment that this prediction was not confirmed in
the results. However, the restriction of range within the college student population could be a
factor in the outcome of the results. The college students are subgroup of the population noted
for their higher levels of well-being. Thus one would expect a restricted range on the associated
variables--particularly when compared to the high school sample.
Part of the problem identified by Schunk and Zimmerman (2006) indicated that questions
regarding competence and control beliefs’ generalizability and specificity have not been
extensively researched to provide answers to educators on ways to improve student perceptions
of competence and control beliefs. The results of the study suggest that student achievement is
predicted by the working system of competence and control, but predicted better when examined
using individual motivational measures of academic hope, academic self-efficacy, and optimism.
This is paramount in addressing low achieving students and promoting improvement in
academics and general well-being. The fact that general well-being is inclusive of behavior
control, perceptions of peer relationships, and general emotional tone implies that competence
and control beliefs actually operate to promote a more cohesive school environment and possibly
uphold a positive peer culture, as well as enhance more social models which in turn would
increase student’s competence (Schunk & Zimmerman, 2006). As prior research studies have
shown that teaching lower achieving students to focus on goal setting improves their sense of
efficacy, academic achievement, and improves their interest in the subject area (Bandura &
Schunk, 1981; Schunk, 1983).

111
Relations among Variables
The data analyses also revealed significant mean differences on the measures of academic
self-efficacy, academic hope, and optimism by ethnicity, gender, and age group in the population
examined. Consistent with prior findings, the results indicated African American students were
significantly more optimistic than Caucasian American students (e.g., Graham, 1999; Sydney,
Hadley, Allen, Palmer, et al., 2005). Graham (1994) suggested that African American students’
view of the self and judgments about one’s self are likely to be different from those of Caucasian
American students. Graham (1994) theorized that African American students maintain high self-
concept in settings and situations where Caucasian American students’ evaluations are likely to
decrease (e.g., Ogbu, 1981, 1992). Other studies have concluded that racial and ethnic group
affiliation suggests that members of the minority groups are more apt to encounter similar
socialization experiences and barriers to educational and career attainment (Hotchkiss & Barrow,
1996; Lent et al., 1996; Osipow & Fitzgerald, 1996). This supports the notion that African
American students may very well self report higher means of motivational measures which in
turn may actually serve as a healthy buffer against perceived barriers in the academic
environment.
The results also indicated college aged students were significantly more optimistic than
high school aged students. This finding was consistent with previous research regarding age
differences among optimism when younger individuals, college-aged students, were compared to
older individuals, parents of college students. Chang (2002) found that the older participants
reported significantly higher optimistic thinking than the younger individuals in the study. Other
research studies investigating younger children have concluded that as children age their
expectancy and competence beliefs become stronger (Nicholls, 1979; Parsons & Ruble, 1977;
112
Stipek, 1984). There are limited studies examining age differences related to optimistic and
pessimistic thinking across the life-span. Chang (2003) declared, “It is critical for researchers to
study adult as well as adolescent populations if we are to develop a more comprehensive
understanding of optimism–pessimism across the entire life-span” (p. 877). The results of this
study replicated similar findings in regards to age whereas the older group of college students
reported higher optimism than the younger group of high school students.
Gender differences also emerged in the results. The results indicated that female students
reported significantly more academic hope and academic self-efficacy than male students. The
results indicating statistically significant differences on motivation and achievement measures
relate to a number of studies (e.g., Eccles, Wigfield, Harold, & Blumenfeld, 1993; Marsh, 1989;
Wigfield, Eccles, Suk Yoon, Harold, et al., 1997). Gender differences have been documented in
a longitudinal study recognizing an early onset of gender-role stereotypes in competence beliefs.
Gender differences emerged in children’s competence beliefs and values as early as first grade
and remained consistent throughout grade 12 (Wigfield et al., 1997). Gender differences on
motivational measures are consistent with prior research as it has been evidenced that female
students express greater self-efficacy for self-regulation, greater confidence in their abilities to
finish assignments, and females are more confident in their strategies to remember information
presented in class and textbooks (Pajares et al., 2000; Pajares & Valiante, 2001). Several
researchers have theorized that gender differences may be a result of cultural, educational, home,
and mass media influences (e.g., Bandura, 1997; Junge & Dretzke, 1995; Meece & Courtney,
1992; Phillips & Zimmerman, 1990; Betz & Fitzgerald, 1987). According to the results of this
study, female students, both African American and Caucasian American female students

113
reported higher academic hope and academic self-efficacy beliefs when compared to their male
peers.
Implications
Within social cognitive theories of motivation, it is evident that the social environment
and experiences operate to shape the motivational level of individuals. The research study here
aimed at identifying positive personality traits by examining concepts in a diverse group of
students in order to (a) identify the motivational constructs as culturally relevant, (b) determine if
the instruments for measuring the motivational constructs are reliable, and (c) conclude if any
cross-cultural differences exist within the motivational constructs--academic hope, academic
self-efficacy, and optimism.
Examining the relationships that these positive psychology variables have in diverse
settings has provided some rationale for the role of race in pedagogy and helps to theoretically
define how perceptions of social interactions as a resource affect the students’ ability to identify
plausible routes to reach goals in academic settings. Unlike previous studies, this study
purposely did not systematically function to identify deficits in different ethnic groups, but
attempted focus on the individual strengths that may lead to increasing the students’ perception
of personal and material resources in the educational setting.
The results indicated that each of the motivational constructs examined in this study has
generalizabilty and operates to predict student achievement and general well-being in the diverse
population examined. Some studies have focused on identifying ethnic minorities as having an
oppositional attitude towards education (e.g., Ogbu, 1981); however, the results here suggested
that African American students and Caucasian American students’ motivational systems for

114
academic achievement and general well-being operate in very similar patterns. The results of this
study goes on to support theoretical assumptions concerning that African Americans place value
on obtaining an education and attempt to find a place among the privileged dominant culture
(e.g., Anderson, 1988; Billingsley, 1992; Harris, 1992; Johnson, 1936; Woodson, 1919).
Quantitative research methods are limited in their ability to cross lines of racial, cultural,
and ethnic differences because they are thoroughly entangled in methodology dependent upon
westernized philosophy to understand the origin and nature of human behavior (Akbar, 1989;
Gergen, Gulerce, Lock, & Misra, 1996). Research studies examining positive psychology
components of motivational behavior should aim to develop and evidence that research
instruments measuring motivational concepts are culturally competent and cross-culturally
validated. Future studies should aim to benefit teachers and educational psychologists by
focusing more on diversifying empirical studies so that they may be representative of the
growing diversity in classrooms.
Conclusion
Three strengths of the present study that separated it from prior studies examining
competence and control beliefs were (a) the use of the competence and control measures within a
high school and college population; (b) assessing competence and control beliefs as a cognitive
set and not attempting to solidify singular motivational constructs; and (c) having a relatively
ethnically diverse sample, as well as exploring the theoretically competing models of
competence and control beliefs within the diverse student populations. This research study
addressed a gap, but there is definitely more research needed to fully understand the role of

115
competence and control beliefs predictability of student motivation and general well-being in
diverse student populations.
Thinking in a commonsensical nature concerning the factors identified, self-efficacy,
hope, and optimism, is it possible to have one without the other? Is it not practical to think that
each construct relies on one another to influence one cognitive skill set for motivation? All three
constructs have revealed relationships with motivation for goal attainment which is influenced by
the reciprocal nature of social experiences and positive thinking. Magaletta and Oliver (1999)
identified that each constructs’ factor structure overlaps when instruments measuring their
existence are administered simultaneously. If the constructs self-efficacy, hope, and optimism
guide human motivation and influence self-regulatory behavior are intricately related, then
would it not appear evident that self-efficacy, hope, and optimism belong to one cognitive set? It
seems arduous to define one without overlapping with the other (e.g., Bryant & Cvengros, 2004).
Positive psychology serves as an umbrella term for a broad field focusing on positive
personality traits; and the three concepts identified are in need of the same. An umbrella term or
identification of a domain in research is needed that connects self-efficacy, hope, and optimism
to one positive-cognitive skill set operating to positively affect human motivation and positive
personality traits. An in-depth theoretical framework using social cognitive theory and an
empirical research focus on the cognitive ability of all three constructs would benefit education
and the field of positive psychology. Research aimed at identifying how self-efficacy, hope, and
optimism are interrelated will imply important instructions for which educators can attempt to
manipulate the constructs to motivate students to perform at optimal levels in academics.
Future research studies tapping into the cognitive set of self-efficacy, hope, and optimism
may yield important conclusions when examined in a cross-cultural setting which will provide a
116
better understanding of how the constructs operate in diverse student populations. Educational
psychology researchers may reveal an important motivational cognitive skill set when using a
social cognitive theory approach to identify how these concepts that are usually examined
separately operate in combination. Cross-culturally examining self-efficacy, hope, and optimism
in combination is one fundamental step in discovering if and how culture affects students’
motivation for education.
Positive psychology has created a convergence in the field of psychology to focus on
individual strengths as building blocks leading to overall life satisfaction. Positive psychology
components have further confirmed that people have individual strengths that are based on three
basic human needs: competence, relatedness, and autonomy (Deci and Ryan, 2000). The
influence that positive psychology research has across the fields of social sciences is
immeasurable (e.g., Seligman, Steen, Park, & Peterson, 2005). Further research exploring
constructs within positive psychology introduced by Seligman and Csikszentmihalyi (2000) will
enlighten educators and researchers in psychology of important manipulations needing to be
made in defining and examining positive psychology components due to variations in social
experiences and culture. Cross-cultural studies will reveal important conclusions for ways to
execute guidance for students that enable each student to perceive that they are capable
individuals with a plan of action to meet the expectations needed to attain goals and expect
positive results.
Limitations
This research study presented here was very beneficial to educational and motivational
psychology in deciphering the role of competence and control beliefs across a diverse student

117
population. However, there were several limitations to the study. First, the findings were specific
to students in a centralized area in the southeast. This limitation affected generalizability of the
results. The second dealt with the inability of the study to include socioeconomic status variables
and other demographics related to SES for the participants. Unmasking the role of SES in
educational research and providing assurance that ethnicity is not confounded with SES
demographics is paramount for motivational psychology research. In this study, there was no
way to gather data on SES from the student participants because of research protocol in the
school districts examined. The third limitation was related to the small sample size. The
population examined did not provide statistical power to analyze the data using SEM as
thoroughly desired for inter and intra group differences among the population examined.
Therefore, the method of analyses was limited in deciphering the role of competence and control
beliefs in greater detail among the population examined. The fourth and final limitation
identified was related to examining age and developmental differences. The results concerning
age differences on the measures of academic hope, academic self-efficacy, and optimism may
not be related to developmental differences due to the lack of longitudinal measures. This
limitation created a number of possibilities for the statistically significant difference found
between the age group. The difference found may not be related to age, but related to exposure to
school or prolonged exposure to academics and learning. The inability to use longitudinal
measures was due in part to the efficient data collection method that was required to collect the
data in the least obtrusive manner to students and not greatly interrupt the instructional time
provided for the curriculum.

118
Recommendations
Based on this investigation, the following are recommended:
1. Future research designs should include multiple motivational measures that represent
competence and control beliefs in order to identify the role of these beliefs in predicting student
achievement and general well-being.
2. It would be beneficial to investigate whether the availability or lack of material
resources and personal resources in the educational setting shares relationships with the students’
perception of academic hope, academic self-efficacy, and optimism.
3. Future research studies should be conducted in diverse educational settings with
diverse students. Studies should also examine the role of SES alongside other psychosocial
factors that affect college and high school students’ success. For example, how does parental
involvement compare with motivational measures for its role in predicting of student
achievement?
4. Future research studies examining motivational psychology variables should also be
inclusive of measures to collect teachers’ perceptions as well as parents’ perceptions of students’
competence and control beliefs. The cultivation of competence and control beliefs are built upon
feedback and social experiences of failure and success.
5. This study assumed that student participants provided accurate self-reports of GPA and
motivational measures. Future research studies should focus on obtaining GPA from the
educational institution and not carry the assumption of having accurate reports of student
achievement.

119
REFERENCES
Anderson, J. C., & Gerbing, D. W. (1988). Structural equation modeling in practice: A review and recommended two-step approach. Psychological Bulletin, 103, 411-423.
Anderson, J., & Gerbing, D. W. (1984). The effects of sampling error on convergence, improper solutions, and good-of-fit indices for maximum likelihood confirmatory factor analyses. Psychometrika, 49, 155-173.
Aspinwall, L. G., Richter, L., & Hoffman, R. R. (2000). Understanding how optimism works. In E. C. Chang (Ed.), Optimism and pessimism: Implications for theory, research, and practice (pp. 217-238). Washington, DC: American Psychological Association.
Aspinwall, L. G. & Taylor, S. E. (1992). Modeling cognitive adaptation: A longitudinal investigation of the impact of individual differences and coping on college adjustment and performance. Journal of Personality and Social Psychology, 63, 989-1003.
Atkinson, J. W. (1957). Motivational determinants of risk-taking behavior. Psychological Review, 15, 1-37.
Baldwin, D. R., Chambliss, L. N., & Towler, K. (2003). Optimism and stress: An African-American college student perspective. College Student Journal, 37, 276-286.
Baird, L. L. (1996). Using self-reports to predict student performance. Research Monograph Number 7. New York: College Entrance Examination Board.
Bandura, A. (1977) Self-efficacy: Toward a unifying theory of behavioral change. Psychological Review, 64, 359-372.
Bandura, A. (1986). Social foundations of thought and action: A social cognitive theory. Englewood Cliffs, NJ: Prentice-Hall.
Bandura, A. (1997). Self-efficacy: The exercise of self-control. New York: Freeman.
Bandura, A. Barbaranelli, C., Caprara, G., & Pastorelli, C. (2001). Self-efficacy beliefs as shapers of children’s aspirations and career trajectories. Child Development, 72, 187-207.
Bandura, A., & Schunk, D. H. (1981). Cultivating competence, self-efficacy, and intrinsic interest through proximal self-motivation. Journal of Personality and Social Psychology, 41, 586-598.
Bean, J. P. (1985). Interaction effects based on class level in an explanatory model of college student dropout syndrome. American Educational Research Journal, 24, 521-540.

120
Bentler, P. M., & Chou, C. P. (1987). Practical issues in structural modeling. Sociological Methods and Research, 16(1), 78-117.
Berliner, D. (2006). Our impoverished view of educational reform. Teachers College Record, 108, 949-995.
Bertz, N. E., & Fitzgerald, L. F. (1987). The career psychology of women. Orlando: Academic Press.
Bollen, K. A. (1989). Structural equations with latent variables. New York: John Wiley & Sons.
Bong, M. (1999). Personal factors affecting the generality of academic self-efficacy judgments: Gender, ethnicity, and relative expertise. Journal of Experimental Education, 67, 31-51.
Bong, M. (2001). Role of self-efficacy and task-value in predicting college students’ course performance and future enrollment intentions. Contemporary Educational Psychology, 26, 553-570.
Bowen, W. G., & Bok, D. (1998). The shape of the river: Long-term consequences of considering race in college and university admissions. NJ: Princeton University Press.
Browne, M. W., & Cudeck, R. (1993) Single sample cross-validation indices for covariance structures. Multivariate Behavioral Research, 24, 445-455.
Bryant F. B., & Cvengros J. A., (2004). Distinguishing hope and optimism: Two sides of a coin, or two separate coins? Journal of Social and Clinical Psychology, 23(2), 273-302
Campbell, D. G., & Kwon, P. (2001). Domain-specific hope and personal style: Toward an integrative understanding of dysphoria. Journal of Social and Clinical Psychology, 20(4), 498-520.
Cardemil, E. V., Reivich, K. J., & Seligman, M. E. P. (2002). The prevention of depressive symptoms in low-income minority middle school students. Prevention & Treatment, 5(1), 8.
Cervone, D., Mor, N., Orom, H., Shadel, W. G., & Scott, W. D. (2004). Self-efficacy beliefs on the architecture of personality: On knowledge, appraisal, and self- regulation. In R. Baumeister & K. Vohs (Eds.), Handbook of self-regulation (pp. 188-210) New York: The Gulliford Press
Chang, E. (1996). Cultural differences in optimism, pessimism, and coping: Predictors of subsequent adjustment in Asian American and Caucasian American college students. Journal of Counseling Psychology, 43, 113-123
Chang, E. (1998). Hope, problem-solving ability, and coping in a college student population: Some implications for theory and practice. Journal of Clinical Psychology, 54(7), 953-962.

121
Chang, E. (2002). Optimism-pessimism and stress appraisal: testing a cognitive interactive model of psychological adjustment in adults. Cognitive Therapy and Research, 26, 675-690.
Chang, E. C., & Banks, K. H. (2007). The color and texture of hope: Some preliminary findings and implications for hope theory and counseling among diverse racial/ethnic groups. Cultural Diversity & Ethnic Minority Psychology, 13(2), 94-103.
Chang, E. C., & Sanna, L. J. (2003). Experience of life hassles and psychological adjustment among adolescents: does it make a difference if one is optimistic or pessimistic? Personality and Individual Differences, 34, 867-879.
Connell, J. P., & Wellborn, J. G. (1991). Competence, autonomy, and relatedness: A motivational analysis of self-system processes. In M. Gunnar & A. Sroufe (Eds.), Minnesota symposium on child psychology (pp. 43-77). Chicago: University of Chicago Press.
Correll, S. J. (2001). Gender and the career choice process: The role of biased self-assessments. American Journal of Sociology, 106, 1691-1730.
Crockett, L. J., Schulenberg, J. E., & Petersen, A. C. (1987). Congruence between objective and self-report data in a sample of young adolescents. Journal of Adolescent Research, 2, 383-392.
Cronbach, L. J. (1951). Coefficient alpha and the internal structure of tests. Psychometrika, 16, 297-334.
Cronbach, L. J., & Meehl, P. E. (1955). Construct validity in psychological tests. Psychological Bulletin, 52, 281-302.
Côté, J. E., & Levine, C. G. (2000). Attitude versus aptitude: Is intelligence or motivation more important for positive higher-educational outcomes. Journal of Adolescent Research, 15, 58-80.
Curry, L. A., Maniar, S. D., Sondag, K. A., & Sandstedt, S. (1999). An optimal performance academic course for university students and student-athletes. Unpublished manuscript, University of Montana, Missoula, Montana.
Curry, L. A., Snyder, C. R., Cook, D. L., Ruby, B. C., & Rehm, M. (1997). Role of hope in academic and sport achievement. Journal of Personality and Social Psychology, 73(6), 1257-1267.
Danoff-Burg, S., Prelow, H. M., & Swenson, R. R., (2004). Hope and life satisfaction in Black college students coping with race-related stress. Journal of Black Psychology, 30(2), 208-228.

122
Deci, E. L., & Ryan, R. M. (1991). A motivational approach to self: Integration in personality. In R. Denstbier (Ed.), Nebraska symposium on motivation: vol. 38. Perspectives on motivation (pp. 237-288). Lincoln, NE: University of Nebraska Press.
Diener, E., Emmons, R. A., Larsen, R. J., & Griffin, S. (1985). The satisfaction with life scale. Journal of Personality Assessment, 49, 71-75.
Dombusch, S. M., Ritter, P., Leiderman, P., Roberts, D., & Fraleigh, M. (1987). The relation of parenting styles to adolescent school performance. Child Development, 58, 1244-1257.
Dohn, H. (1992). “Drop-out” in the Danish high school (gymnasium): An investigation of psychological, sociological, and pedagogical factors. International Review of Education, 37, 415-428.
Dougall, A. L., Hyman, K. B., Hayward, M. C., McFeeley, S., & Baum, A. (2001). Optimism and traumatic stress: The importance of social support and coping. Journal of Applied Social Psychology, 31, 223-245.
Dubois, W. E. B. (1973). The education of Black people. New York: Monthly Review Press.
Dweck, C. S., & Leggett, E. L. (1988). A social-cognitive approach to motivation and personality. Psychological Review, 95, 256-273.
Eccles, J. S. (1983). Expectancies, values, and academic behavior. In J. R. Spencer (Ed.) Achievement and achievement motivation: Psychological and sociological approaches (pp. 75-146). San Francisco: Freeman.
Eccles, J. S. (1987). Gender roles and women’s achievement-related decisions. Psychology of Women Quarterly, 11, 135-172.
Eccles, J. S., & Harold, R. D. (1983) Parent-school involvement during the early adolescent years. Teachers’ College Record, 94, 568-587.
Eccles, J. S., & Wigfield, A. (2002). Motivational beliefs, values, and goals. Annual Review of Psychology, 53, 109-132.
Elliot, A. J., & Church, M. (1997). A hierarchical model of approach and avoidance achievement motivation. Journal of Personality and Social Psychology, 72, 218-232.
Elliot, A. J., & Harackiewicz, J. M. (1996). Approach and avoidance goals and intrinsic motivation: A meditational analysis. Journal of Personality and Social Psychology, 70, 461-475.
Elliot, E. S., & Dweck, C. S. (1988). Goals: An approach to motivation and achievement. Journal of Personality and Social Psychology, 54, 5-12.
Entwisle, D. R., Alexander, K. L., & Olson, L.S. (1997). Children, schools, inequality. Boulder, CO: Westview.

123
Fagot, B. (1994). Peer relations and the development of competence in boys and girls. New Directions in Child Development, 65, 53-65.
Fan, X., Thompson, B., & Wang, L. (1999). Effects of sample size, estimation method, and model specification on structural equation modeling fit indexes. Structural Equation Modeling (6), 56-83.
Floyd, C. (1997). Achieving despite the odds: A study of resilience among a group of African American high school seniors. Journal of Negro Education, 65, 181-188.
Giordano, P. C. (1003). Relationships in adolescence. Annual Review of Sociology, 29, 257-281.
Graham, S. (1994). Motivation in African Americans. Review of Educational Research, 64, 55-117.
Graham, S., & Taylor, A. Z. (2002). Ethnicity, gender, and the development of achievement values. In A. Wigfield & J.S. Eccles (Eds.), Development of achievement motivation (pp. 121-146). San Diego, CA: Academic Press.
Graham, S., Taylor, A. Z., & Hudley, C. (1998). Exploring achievement values among ethnic minority early adolescents. Journal of Educational Psychology, 90, 606-620.
Hatcher, L. (1994) A step-by-step approach to using SAS for factor analysis and structural equation modeling. Cary, NC: SAS Institute.
Heath, S. B. (1983). Ways with words: Language, life and work in communities and classrooms. Cambridge, England: Cambridge University Press.
Hill, J. P., & Lynch, M. E. (1983). The intensification of gender-related role expectations during early adolescence. In J. Brooks-Gunn & A. C. Petersen (Eds.), Girls at puberty (pp. 201-228). New York: Plenum.
Hotchkiss, L., & Borrow, H. (1996). Sociological perspectives on work and career development. In D. Brown & L. Brooks (Eds.), Career choice and development (3rd ed., pp. 281-334). San Francisco: Jossey-Bass.
Horowitz, T. R. (1992). Drop-out: Mertonian or reproduction scheme? Adolescence, 27, 451-459.
Hu, L., & Bentler, P. M. (1999). Cut-off criteria for fit indexes in covariance structure analysis: Conventional criteria versus new alternatives,” Structural Equation Modeling, 6, 1-55.
Huston, A., & Alvarez, M. (1990). The socialization context of gender role development in early adolescence. In R. Montemayor & G. Adams (Eds.), From childhood to adolescence: A transitional period? (pp. 156-179). Thousand Oaks, CA: Sage Publications.

124
Irving, L. M., Snyder, C. R., & Cheavens, J. (2004). The relationships between hope and outcomes at the pretreatment, beginning, and later phases of psychotherapy. Journal of Psychotherapy Integration, 14(4), 419-443.
Jones, D. J., O’Connell, C., Gound, M., Heller, L., & Forehand, R. (2004). Predictors of self-reported physical symptoms in low-income, inner-city, African American women: The role of optimism, depressive symptoms, and chronic illness. Psychology of Women Quarterly, 28, 112-121.
Jonson-Reid, M., Davis, L., Saunders, J., Williams, T., & Williams, J. H., (2005). Academic self-efficacy among African American youths: Implications for school social work practice. Children and Schools, 27, 5-14.
Jöreskog, K. G., & Sörbom, D. (1989). LISREL 7: A guide to the program and application (2nd ed.). Chicago: SPSS.
Jöreskog, K. G., & Sörbom, D. (2006). LISREL 8.8. Chicago: Scientific Software International.
Junge, M. E., & Dretzke, B. J. (1995). Mathematical self-efficacy gender differences in gifted/talented adolescents. Gifted Child Quarterly, 39, 22-26.
Kaplan, A., & Maehr, M. L. (1999). Achievement goals and student well-being. Contemporary Educational Psychology, 24, 330-358.
Kao, G., & Thompson, J. S. (2003). Racial and ethnic stratification in educational achievement and attainment. Annual Review of Sociology, 29, 417-42.
Kao, G., & Tienda, M. (1995). Optimism and achievement: The educational performance of immigrant youth. Social Science Quarterly, 76, 1-19.
Kline, R. B. (2005). Principles and practice of structural equation modeling (2nd ed.). New York: The Guilford Press.
Kozol, J. (1992). Savage inequalities. New York: Harper Perennial.
Kubota, R. (2004). Critical multiculturalism and second language education. In B. Norton and K. Toohey (Eds.). Critical pedagogies and language learning (pp. 30-49). New York: Cambridge University Press.
Ladson-Billings, G. (1994). The dreamkeepers. San Francisco: Jossey-Bass.
Lent, R. W., Brown, S. D., & Hackett, G. (1996). Career development from a social cognitive perspective. In D. Brown & L. Brooks (Eds.), Career choice and development (3rd ed., pp. 423-475). San Francisco: Jossey-Bass.
Lin, E. H., & Peterson, C. (1990). Pessimistic explanatory style and response to illness. Behavior Research and Therapy, 28, 243-248.

125
Linnenbrink, E. A., & Pintrich, P. R. (2002). Achievement goal theory and affect: An asymmetrical bi-directional model. Educational Psychologist, 37, 69-78.
Little, R. J. A., & Rubin, D. B. (2002). Statistical analysis with missing data (2nd ed.). New York: Wiley.
Little, T., Snyder, C., & Wehmeyer, M. (2006). The agentic self: On the nature and origins of personal agency across the life span. In D. K. Mroczek & T. D. Little (Eds.), Handbook of personality development (pp. 61-79). Saddle River, NJ: Lawrence Erlbaum Associates.
Lopez, S. J., Bouwkamp, J., Edwards, L. E., & Teramoto Pedrotti, J. (2000). Making hope happen via brief interventions. Paper presented at the 2nd Positive Psychology Summit in Washington, DC.
Luthans, F., & Jensen, S. M. (2002). Hope: A positive strength for human resource development. Human Resource Development, 1, 304-322.
MacCallum, R .C. Browne, M. W., & Sugwara, H. M. (1996). Power analysis and determination of sample size for covariance structure modeling. Psychological Methods, 1, 130-149.
Magaletta, P. R., Oliver, J. M. (1999). The hope construct, will, and ways: Their relations with self-efficacy, optimism, and general well-being. Journal of Clinical Psychology, 55, 539-551.
Martin, K. (1996). Puberty, sexuality, and the self: Boys and girls at adolescence. New York: Routledge.
Marsh, H. W. (1989). Age and sex effects in multiple dimensions of self-concept: Preadolescence to early adulthood. Journal of Educational Psychology, 81, 417-430.
Marsh, H. W. (1990). The structure of academic self-concept: The Marsh-Shavelson Model. Journal of Educational Psychology, 82, 623-636.
Maxey, E. J., & Ormsby, V. S. (1971). The accuracy of self-report information collected on the ACT Test Battery: High school grades and items of non-academic achievement. ACT Research Report No. 45. Iowa City, IA: Author.
McDermott, D., & Snyder, C. R. (2000). The great big book of hope. Oakland, CA: New Harbinger Publications.
Meece, J. L., & Courtney, D. P. (1992). Gender differences in students’ perceptions: Consequences for achievement-related choices. In D. H. Schunk & J. L. Meece (Eds.), Student perceptions in the classroom (pp.209-228). Hillsdale, NJ: Erlbaum.
Mendoza-Denton, R., Downey, G., Purdie, V. J., Davis, A., & Pietrzak, J. (2002). Sensitivity to status-based rejection: Implications for African American students’ college experience. Journal of Personality and Social Psychology, 84, 896-918.

126
Mensch, B. S., & Kandel, D. B. (1988). Dropping out of high school and drug involvement. Sociology of Education, 61, 95-113.
Mickelson, R. (1990). The attitude-achievement paradox among Black adolescents. Sociology of Education, 63, 44-61.
Middleton, M., & Midgley, C. (1997). Avoiding the demonstration of lack of ability: An underexplored aspect of goal theory. Journal of Educational Psychology, 89, 710-718.
Moon, C., & Snyder, C. (2000). Hope and the journey with AIDS. Handbook of hope: Theory, measures, and applications (pp. 341-353). Academic Press.
Nicholls, J. G. (1979). Development of perception of own attainment and causal attributions for success and failure in reading. Journal of Educational Psychology, 71, 94-99.
Nicholls, J. G. (1989). The competitive ethos and democratic education. Cambridge, MA: Harvard University Press.
Ogbu, J. (1981). Black education. A cultural-ecological perspective. In H. P. McAdoo (Ed.), Black families (pp. 139-154). Beverly Hills: Sage.
Ogbu, J. (1992). Understanding cultural diversity and learning. Educational Researcher, 21, 5-14.
Onweugbuzie, A. J., & Snyder, C. R. (2000). Relations between hope and graduate students’ coping strategies for studying and examination taking. Psychological Reports, 86, 803-06.
Osipow, S. H., & Fitzgerald, L. F. (1996). Theories of career development (4th ed.) Boston: Allyn & Bacon.
Pajares, F. (1996). Self-efficacy beliefs in academic settings. Review of Educational Research, 66, 543-578.
Pajares, F. (2001). Toward a positive psychology of academic motivation. The Journal of Educational Research, 95, 27-35.
Pajares, F. (2002). Gender and perceived self-efficacy in self-regulated learning. Theory Into Practice, 41, 116-225.
Pajares, F., Britner, S., & Valiante, G. (2000). Writing and science achievement goals of middle school students. Contemporary Educational Psychology, 24, 124-139.
Pajares, F., & Valiante, G. (2001). Gender differences in writing motivation and achievement of middle school students: A function of gender orientation? Contemporary Educational Psychology, 26, 366-381.

127
Parsons, J. E., & Ruble, D. N. (1977). The development of achievement-related expectancies. Child Development, 48, 1075-1079.
Peters, C. L. O., & Enders, C. (2002). A primer for the estimation of structural equation models in the presence of missing data. Journal of Targeting, Measurement and Analysis for Marketing, 11, 81-95.
Peterson, C. (2000). The future of optimism. American Psychologist, 55, 44-55.
Peterson, S. J., Gerhardt, M. W., & Rode, J. C. (2006). Hope, learning goals and task performance. Personality and Individual Differences, 40, 1099-1109.
Phillips, D. A., & Zimmerman, M. (1990). The developmental course of perceived competence among competent children. In R. J. Sternberg & J. Kolligian, Jr. (Eds.), Competence considered (pp. 41-66). New Haven, CT: Yale University Press.
Pintrich, P. R. (2000). The role of goal orientation in self-regulated learning. In M. Boekaerts, P. R. Pintrich, & M. Aeidner (Eds.), Handbook of self-regulation (pp. 451-502). San Diego: Academic Press.
Pintrich, P. R. (2003). A motivational science perspective on the role of student motivation in learning and teaching contexts. Journal of Educational Psychology, 95, 667-686.
Purkey, W. W. (2000). What students say to themselves: Internal dialogue and school success. Thousand Oaks, CA: Corwin.
Quintana, S. M., & Maxwell, S. Z. (1999). Implications of recent developments in structural equation modeling for counseling psychology. The Counseling Psychologist, 27, 485-527.
Robinson, C., & Rose, S. E. (under review). Domain-specific measures of hope and academic achievement. Unpublished manuscript. University of Alabama.
Roeser, R. W., & Eccles, J. S. (1998). Adolescents’ perceptions of middle school: Relation of longitudinal changes in academic and psychological adjustment. Journal of Research on Adolescence, 8¸ 123-158.
Ryan, R. M., & Deci, E. L. (2000a). Self-determination theory and the facilitation of intrinsic motivation, social development, and well-being. American Psychologist, 55, 68-78.
Ryan, R. M., & Deci, E. L. (2000b). Intrinsic and extrinsic motivations: Classic definitions and new directions. Contemporary Educational Psychology, 25, 54-67.
Ryan, R. M., & Connell, J. P. (1989). Perceived locus of causality and internalization: Examining reasons for acting in two domains. Journal of Personality and Social Psychology, 57, 749-761.

128
Rumberger, R. W. (1987). High school dropout: A review of issues and evidence. Review of Educational Research, 57, 101-121.
Scheier, M. F., & Carver, C. S. (1985). Optimism, coping, and health: Assessment and implications of generalized outcome expectancies. Health Psychology, 4, 219-247.
Scheier, M. F., & Carver, C. S. (1987). Dispositional optimism and physical well-being: The influence of generalized outcome expectancies on health. Journal of Personality, 55, 169-210.
Scheier, M. F., & Carver, C. S. (1988). A model of behavioral self-regulation: Translating intention into action. Advances in Experimental and Social Psychology, 21, 303-346.
Scheier, M. F., & Carver, C. S. (1992). Effects of optimism or psychological and physical well-being: Theoretical overview and empirical update. Cognitive Therapy and Research, 16, 201-228
Schunk, D. H. (1983). Goal difficulty and attainment information: Effects on children’s behaviors. Human Learning, 25, 107-117.
Schunk, D. H. (1991). Self-efficacy and academic motivation. Educational Psychologist, 26, 207-231.
Schunk, D. H., & Zimmerman, B. (2006). Competence and control beliefs: Distinguishing the means and ends. In P. A. Alexander & P. H. Winne (Ed.), Handbook of educational psychology (pp. 349-367). Saddle River, NJ: Lawrence Erlbaum Associates.
Scioli, A., Chamberlin, C., Samor, C. M., LaPointe, A. B., Campbell, T. L., MacLeod, A. R., et al. (1997). A prospective study of hope, optimism, and health. Psychological Reports, 81, 723-733.
Seligman, M. E. P. (1991). Learned optimism. New York: Knopf.
Shepperd, J. A., Maroto, J. J., & Pbert, L. A. (1996). Dispositional optimism as a predictor of health changes among cardiac patients. Journal of Research in Personality, 30, 517-534.
Snyder, C. R. (1995). Conceptualizing, measuring, and nurturing hope. Journal of Counseling & Development, 73, 355-360.
Snyder, C. R. (2004). Hope and depression: A light in the darkness. Journal of Social & Clinical Psychology, 23(3), 347-351
Snyder, C. R., Harris, C., Anderson, J. R., Holleran, S. A., Irving, L. M., Sigmon, S. T., Yoshinobu, L., Gibb, J., Langelle, C., & Harney, P. (1991). The will and the ways: Development and validation of an individual-differences measure of hope. Journal of Personality and Social Psychology, 60(4), 570-585.

129
Snyder, C. R., Hoza, B., Pelham, W. E., Rapoff, M., Ware, L., Danovsky, M., Highberger, L., Rubinstein, H., & Stahl, K. J. (1997). The development and validation of the children’s hope scale. Journal of Pediatric Psychology, 22, 399-421.
Snyder, C. R., Shorey, H. S., Cheavens, J., Pulvers, K. M., Adams III, V. H., & Wiklund, C. (2002). Hope and academic success in college. Journal of Educational Psychology, 94(4), 820-826.
Steed, L. G. (2002). A psychometric comparison of four measures of hope and optimism. Educational and Psychological Measurement, 62, 466-482.
Steele, C. M., & Aronson, J. (1995). Stereotype threat and the intellectual performance of African Americans. Journal of Personality and Social Psychology, 69, 797-811.
Steiger, J. H. (1990), Structural model evaluation and modifications: An interval estimation approach, Multivariate Behavioral Research, 25, 173-180.
Stipek, D. J. (1984). Young children’s performance expectations: Logical analysis or wishful thinking? In J. G. Nicholls (Ed.), Advances in motivation and achievement (Vol. 3): The development of achievement motivation. Greenwich, CT: JAI Press.
Sydney, E., Hadley, W., Allen, D. N., Palmer, S., Klosky, J., et al., (2005). A new measure of children’s optimism and pessimism: The youth life orientation test. Journal of Child Psychology and Psychiatry, 46, 548-558.
Sympson, S. C., & Snyder, C. R. (1997). Development and initial validation of the Domain Specific Hope Scale. Unpublished manuscript, University of Kansas, Department of Psychology, Lawrence.
Tabachnick, B. G., & Fidell, L. S. (2001). Using multivariate statistics (4th ed.). New York: Allyn & Bacon.
Taylor, S. E., & Brown, J. D. (1988). Illusion and well-being: A social psychological perspective on mental health. Psychological Bulletin, 103, 193-210.
Tennen, H., Affleck, G., & Tennen, R. (2002). Clipped feathers: The theory and measurement of hope. Psychological Inquiry, 13(4), 311-317.
Tidwell, R. (1988). Dropouts speak out: Qualitative data on early school departures. Adolescence, 23, 939-954.
Tinto, V. (1975). Dropout from higher education: A theoretical synthesis of recent research. Review of Educational Research, 45, 89-125.
Vohs, K. D., & Baumeister, R. F. (2004). Understanding self-regulation: An introduction. In R. Baumeister & K. Vohs (Eds.), Handbook of self-regulation (pp. 188-210). New York: The Gulliford Press.
130
Weiner, B. (1979). A theory of motivation for some classroom experiences. Journal of Educational Psychology, 71, 3-25.
Weiner, B., Frieze, I. H., Kukla, A., Reed, L., Rest, S., & Rosenbaum, R. M. (1971). Perceiving the causes of success and failure. Morristown, NJ: General Learning Press.
Wigfield, A. Eccles, J. S., Suk Yoon, K., Harold, R. D., Arbreton, A. J., et al. (1997). Change in children’s competence beliefs and subjective task values across the elementary school years: A 3-year study. Journal of Educational Psychology, 89, 451-469.
Willis, P. (1977/1981). Learning to labor. How working class kids get working class jobs. New York: University Press.
Zimmerman, B. J. (2000). Attaining self-regulation: A social-cognitive perspective. In M. Boekaerts, P. R. Pintrich, & M. Zeidner (Eds.), Handbook of self-regulation: Theory, research, and applications (pp. 13-39). San Diego, CA: Academic Press.
Zimmerman, B., & Bandura, A. (1994). Impact of self-regulatory influences on writing course attainment. American Education Research Journal, 31, 845-862.
Zimmerman, B., Bandura, A., & Martinez-Pons, M. (1992). Self-motivation for academic attainment: The role of self-efficacy beliefs and personal goal setting. American Educational Research Journal, 29, 663-676.

131
APPENDIX A
SUMMARY STATISTICS AND HISTOGRAMS

132
Univariate Summary Statistics for Continuous Variables
Variable Mean St. Dev. t Value Skewness Kurtosis Minimum Freq. Maximum Freq.
Age 18.134 2.815 138.449 1.286 6.182 14.000 42 37.000 1 SchoolYe 2.221 1.064 44.880 0.267 -1.172 1.000 156 5.000 1
TypesGra 3.949 1.297 65.461 -0.313 -0.535 1.000 22 6.000 48 EnglishC 4.945 1.632 65.151 -0.589 -0.406 1.000 18 7.000 89
MathClas 4.657 1.575 63.563 -0.215 -0.692 1.000 13 7.000 68 ScienceC 4.729 1.381 73.629 -0.270 -0.245 1.000 8 7.000 50 SocialSt 5.018 1.518 71.046 -0.633 -0.083 1.000 14 7.000 82
Parent 2.543 1.482 36.884 1.230 2.129 1.000 161 7.000 24 MotherEd 5.119 1.266 86.924 -0.134 -0.762 2.000 7 7.053 1 FatherEd 4.920 1.267 83.475 -0.037 -0.549 1.000 1 7.000 59
LOTRTota 16.533 3.047 116.645 -0.512 0.565 5.000 2 24.000 2 Pessimis 7.952 1.670 102.326 -0.412 0.484 2.000 2 12.000 4
AHSTotal 38.636 6.405 129.667 -1.072 1.471 14.000 3 48.000 18 AHSAgenc 18.368 3.880 101.762 -0.899 0.793 4.000 1 24.000 28 AHSPathw 20.268 3.188 136.633 -1.269 2.315 6.000 2 24.000 75
SESRL 31.197 6.086 110.171 -0.651 0.230 9.000 1 42.000 4 ASETotal 28.235 4.438 136.746 -0.605 0.539 12.000 2 36.000 17 Emotiona 33.959 7.416 98.427 0.788 0.512 14.000 1 61.000 1 PeerRela 29.702 6.197 103.026 1.238 3.786 10.000 2 60.000 1 Behavior 27.664 5.605 106.089 0.006 1.389 8.000 4 48.000 2
GWBTotal 134.770 21.679 133.620 -0.454 -0.478 68.000 1 174.000 1 LOTR1 2.636 1.023 55.366 -0.469 -0.166 0.000 16 4.000 102 LOTR2 2.658 1.003 56.949 -0.543 -0.030 0.000 15 4.000 97 LOTR3 2.563 0.902 61.056 -1.089 1.831 0.000 29 4.000 44 LOTR4 2.893 1.008 61.653 -0.664 -0.097 0.000 10 4.000 153 LOTR5 3.491 0.730 102.842 -1.366 1.517 0.000 1 4.000 284 LOTR6 2.725 0.999 58.632 -0.555 -0.150 0.000 11 4.000 109 LOTR7 2.623 0.930 60.586 -0.938 1.486 0.000 27 4.000 64 LOTR8 2.177 1.294 36.181 -0.176 -1.026 0.000 61 4.000 87 LOTR9 2.766 0.998 59.603 -1.098 1.473 0.000 30 4.000 98
LOTR10 3.052 0.967 67.863 -0.799 0.036 0.000 6 4.000 186 AHS1 6.732 1.373 105.402 -1.458 2.660 1.000 3 8.000 164 AHS2 6.327 1.447 93.961 -0.924 0.801 1.000 2 8.000 110 AHS3 6.554 1.296 108.711 -1.159 1.933 1.000 2 8.000 117 AHS4 6.781 1.444 100.959 -1.525 2.670 1.000 6 8.000 188 AHS5 6.983 1.207 124.324 -1.638 3.576 1.000 1 8.000 194 AHS6 5.260 1.799 62.835 -0.595 -0.176 1.000 22 8.000 40
ASES1 4.711 1.247 81.219 -0.949 0.532 1.000 12 6.000 150 ASES2 4.299 1.442 64.083 -0.490 -0.644 1.000 20 6.000 126 ASES3 3.608 1.421 54.591 -0.133 -0.765 1.000 42 6.000 45 ASES4 4.247 1.320 69.179 -0.494 -0.359 1.000 17 6.000 89 ASES5 4.475 1.129 85.166 -0.746 0.360 1.000 6 6.000 79 ASES6 4.966 1.115 95.694 -1.064 0.896 1.000 5 6.000 189 ASES7 4.601 1.096 90.240 -0.898 0.966 1.000 8 6.000 92 ASES8 5.245 1.015 111.034 -1.456 1.810 1.000 2 6.000 247 ASES9 4.610 1.300 76.208 -0.770 -0.034 1.000 11 6.000 146
ASES10 4.618 1.269 78.198 -0.807 0.161 1.000 12 6.000 139

133
ASES11 4.583 1.194 82.490 -0.736 0.223 1.000 8 6.000 118 ASES12 4.860 1.133 92.187 -0.882 0.432 1.000 5 6.000 169 ASES13 4.610 1.353 73.260 -0.835 0.028 1.000 16 6.000 154
GWB1 4.508 1.407 68.863 -0.693 -0.444 1.000 14 6.000 147 GWB2 4.572 1.555 63.178 -0.880 -0.376 1.000 27 6.000 180 GWB3 4.839 1.201 86.604 -1.002 0.545 1.000 8 6.000 170 GWB4 4.254 1.633 55.973 -0.647 -0.743 1.000 44 6.000 137 GWB5 4.768 1.326 77.271 -0.988 0.264 1.000 13 6.000 181 GWB6 4.708 1.506 67.201 -1.043 0.052 1.000 25 6.193 1 GWB7 4.915 1.456 72.548 -1.320 0.712 1.000 21 6.073 1 GWB8 5.068 1.378 79.076 -1.493 1.284 1.000 16 6.000 265 GWB9 5.311 1.198 95.281 -2.008 3.582 1.000 12 6.000 301
GWB10 4.063 1.719 50.792 -0.379 -1.156 1.000 49 6.000 140 GWB11 4.871 1.399 74.856 -1.208 0.580 1.000 18 6.000 215 GWB12 5.260 1.286 87.893 -1.962 3.100 1.000 16 6.000 297 GWB13 4.929 1.459 72.632 -1.343 0.805 1.000 23 6.000 241 GWB14 5.110 1.338 82.060 -1.639 1.949 1.000 18 6.000 264 GWB15 4.874 1.554 67.412 -1.254 0.332 1.000 27 6.000 247 GWB16 5.130 1.364 80.872 -1.645 1.815 1.000 18 6.000 278 GWB17 5.035 1.496 72.335 -1.520 1.216 1.000 29 6.000 280 GWB18 4.152 1.499 59.530 -0.482 -0.670 1.000 32 6.000 107 GWB19 4.840 1.296 80.243 -1.141 0.722 1.000 13 6.147 1 GWB20 4.436 1.593 59.844 -0.850 -0.391 1.000 39 6.000 154 GWB21 4.621 1.519 65.390 -1.073 0.232 1.000 36 6.000 174 GWB22 4.425 1.667 57.069 -0.759 -0.697 1.000 39 6.000 176 GWB23 5.114 1.348 81.548 -1.597 1.702 1.000 16 6.000 270 GWB24 3.932 1.573 53.725 -0.247 -1.031 1.000 38 6.000 98 GWB25 4.101 1.587 55.523 -0.434 -0.869 1.000 41 6.000 118 GWB26 4.303 1.536 60.193 -0.550 -0.702 1.000 31 6.000 141 GWB27 4.750 1.394 73.239 -1.150 0.693 1.000 25 6.000 182 GWB28 3.888 1.916 43.619 -0.343 -1.391 1.000 93 6.000 143 GWB29 3.994 1.719 49.930 -0.408 -1.101 1.000 59 6.000 122
AveGrade 4.838 1.226 84.781 -0.534 0.499 1.000 7 7.000 17

134
Test of Univariate Normality for Continuous Variables
Skewness Kurtosis Skewness and Kurtosis Variable Z-Score P-Value Z-Score P-Value χ2 P-Value
Age 9.039 0.000 8.238 0.000 149.564 0.000 SchoolYe 2.336 0.019 -15.394 0.000 242.426 0.000
TypesGra -2.723 0.006 -3.172 0.002 17.474 0.000 EnglishC -4.877 0.000 -2.174 0.030 28.513 0.000
MathClas -1.891 0.059 -4.689 0.000 25.567 0.000 ScienceC -2.355 0.019 -1.142 0.253 6.851 0.033 SocialSt -5.193 0.000 -0.283 0.777 27.043 0.000
Parent 8.765 0.000 5.112 0.000 102.947 0.000 MotherEd -1.185 0.236 -5.528 0.000 31.961 0.000 FatherEd -0.326 0.744 -3.290 0.001 10.932 0.004
LOTRTota -4.304 0.000 2.121 0.034 23.021 0.000 Pessimis -3.528 0.000 1.883 0.060 15.993 0.000
AHSTotal -7.933 0.000 4.122 0.000 79.932 0.000 AHSAgenc -6.939 0.000 2.727 0.006 55.585 0.000 AHSPathw -8.954 0.000 5.348 0.000 108.773 0.000
SESRL -5.319 0.000 1.038 0.299 29.374 0.000 ASETotal -4.990 0.000 2.046 0.041 29.085 0.000 Emotiona 6.242 0.000 1.966 0.049 42.829 0.000 PeerRela 8.801 0.000 6.784 0.000 123.484 0.000 Behavior 0.052 0.958 3.979 0.000 15.838 0.000
GWBTotal -3.856 0.000 -2.708 0.007 22.203 0.000 LOTR1 -3.978 0.000 -0.704 0.482 16.318 0.000 LOTR2 -4.536 0.000 -0.029 0.977 20.573 0.000 LOTR3 -8.026 0.000 4.698 0.000 86.481 0.000 LOTR4 -5.408 0.000 -0.352 0.725 29.369 0.000 LOTR5 -9.419 0.000 4.202 0.000 106.386 0.000 LOTR6 -4.627 0.000 -0.621 0.535 21.794 0.000 LOTR7 -7.175 0.000 4.149 0.000 68.689 0.000 LOTR8 -1.556 0.120 -10.257 0.000 107.631 0.000 LOTR9 -8.078 0.000 4.126 0.000 82.278 0.000
LOTR10 -6.314 0.000 0.264 0.792 39.934 0.000 AHS1 -9.838 0.000 5.745 0.000 129.798 0.000 AHS2 -7.090 0.000 2.747 0.006 57.817 0.000 AHS3 -8.400 0.000 4.845 0.000 94.031 0.000 AHS4 -10.127 0.000 5.756 0.000 135.687 0.000 AHS5 -10.600 0.000 6.615 0.000 156.128 0.000 AHS6 -4.919 0.000 -0.755 0.450 24.766 0.000
ASES1 -7.240 0.000 2.025 0.043 56.516 0.000 ASES2 -4.133 0.000 -4.184 0.000 34.591 0.000 ASES3 -1.175 0.240 -5.563 0.000 32.327 0.000 ASES4 -4.171 0.000 -1.849 0.064 20.818 0.000 ASES5 -5.970 0.000 1.492 0.136 37.872 0.000 ASES6 -7.891 0.000 2.973 0.003 71.104 0.000 ASES7 -6.932 0.000 3.134 0.002 57.869 0.000 ASES8 -9.828 0.000 4.666 0.000 118.360 0.000 ASES9 -6.128 0.000 -0.049 0.961 37.555 0.000
ASES10 -6.364 0.000 0.777 0.437 41.101 0.000

135
ASES11 -5.905 0.000 1.014 0.311 35.897 0.000 ASES12 -6.833 0.000 1.723 0.085 49.666 0.000 ASES13 -6.543 0.000 0.232 0.817 42.869 0.000
GWB1 -5.609 0.000 -2.450 0.014 37.464 0.000 GWB2 -6.825 0.000 -1.964 0.050 50.432 0.000 GWB3 -7.544 0.000 2.064 0.039 61.170 0.000 GWB4 -5.294 0.000 -5.282 0.000 55.925 0.000 GWB5 -7.462 0.000 1.163 0.245 57.030 0.000 GWB6 -7.774 0.000 0.335 0.738 60.550 0.000 GWB7 -9.201 0.000 2.520 0.012 91.016 0.000 GWB8 -9.988 0.000 3.785 0.000 114.094 0.000 GWB9 -11.976 0.000 6.620 0.000 187.247 0.000
GWB10 -3.266 0.001 -14.643 0.000 225.089 0.000 GWB11 -8.651 0.000 2.163 0.031 79.522 0.000 GWB12 -11.817 0.000 6.192 0.000 177.986 0.000 GWB13 -9.311 0.000 2.756 0.006 94.292 0.000 GWB14 -10.603 0.000 4.867 0.000 136.115 0.000 GWB15 -8.883 0.000 1.396 0.163 80.861 0.000 GWB16 -10.628 0.000 4.673 0.000 134.782 0.000 GWB17 -10.108 0.000 3.656 0.000 115.538 0.000 GWB18 -4.076 0.000 -4.456 0.000 36.468 0.000 GWB19 -8.304 0.000 2.549 0.011 75.448 0.000 GWB20 -6.638 0.000 -2.063 0.039 48.312 0.000 GWB21 -7.941 0.000 1.046 0.295 64.158 0.000 GWB22 -6.057 0.000 -4.746 0.000 59.210 0.000 GWB23 -10.433 0.000 4.503 0.000 129.124 0.000 GWB24 -2.164 0.030 -10.384 0.000 112.519 0.000 GWB25 -3.702 0.000 -7.053 0.000 63.446 0.000 GWB26 -4.591 0.000 -4.800 0.000 44.113 0.000 GWB27 -8.356 0.000 2.472 0.013 75.933 0.000 GWB28 -2.964 0.003 -68.869 0.000 4751.712 0.000 GWB29 -3.497 0.000 -12.501 0.000 168.500 0.000
AveGrade -4.473 0.000 1.929 0.054 23.731 0.000

136
Histograms for Continuous Variables Variable: Age
FREQUENCY PERCENTAGE LOWER CLASS LIMIT 134 29.0 14.000 121 26.2 16.300 142 30.7 18.600
54 11.7 20.900 5 1.1 23.200 3 0.6 25.500 0 0.0 27.800 1 0.2 30.100 1 0.2 32.400 1 0.2 34.700
Variable: SchoolYeAR
FREQUENCY PERCENTAGE LOWER CLASS LIMIT 156 33.8 1.000
0 0.0 1.400 112 24.2 1.800
0 0.0 2.200 131 28.4 2.600
0 0.0 3.000 0 0.0 3.400
62 13.4 3.800 0 0.0 4.200 1 0.2 4.600
Variable: TypesGra
FREQUENCY PERCENTAGE LOWER CLASS LIMIT 22 4.8 1.000 28 6.1 1.500
0 0.0 2.000 136 29.4 2.500
0 0.0 3.000 89 19.3 3.500
0 0.0 4.000 139 30.1 4.500
0 0.0 5.000 48 10.4 5.500

137
Variable: EnglishC
FREQUENCY PERCENTAGE LOWER CLASS LIMIT 18 3.9 1.000 20 4.3 1.600
0 0.0 2.200 54 11.7 2.800 76 16.5 3.400
0 0.0 4.000 92 19.9 4.600
1 0.2 5.200 112 24.2 5.800
89 19.3 6.400 Variable: MathClas
FREQUENCY PERCENTAGE LOWER CLASS LIMIT 13 2.8 1.000 26 5.6 1.600
0 0.0 2.200 71 15.4 2.800
111 24.0 3.400 0 0.0 4.000
84 18.2 4.600 1 0.2 5.200
88 19.0 5.800 68 14.7 6.400
Variable: ScienceC
FREQUENCY PERCENTAGE LOWER CLASS LIMIT 8 1.7 1.000
17 3.7 1.600 0 0.0 2.200
56 12.1 2.800 118 25.5 3.400
2 0.4 4.000 122 26.4 4.600
0 0.0 5.200 89 19.3 5.800 50 10.8 6.400

138
Variable: SocialSt
FREQUENCY PERCENTAGE LOWER CLASS LIMIT 14 3.0 1.000 16 3.5 1.600
0 0.0 2.200 39 8.4 2.800 92 19.9 3.400
0 0.0 4.000 100 21.6 4.600
1 0.2 5.200 118 25.5 5.800
82 17.7 6.400 Variable: Parent
FREQUENCY PERCENTAGE LOWER CLASS LIMIT 161 34.8 1.000
15 3.2 1.600 0 0.0 2.200
244 52.8 2.800 12 2.6 3.400
0 0.0 4.000 0 0.0 4.600 0 0.0 5.200 6 1.3 5.800
24 5.2 6.400 Variable: MotherEd
FREQUENCY PERCENTAGE LOWER CLASS LIMIT 7 1.5 2.000
35 7.6 2.505 4 0.9 3.011
108 23.4 3.516 3 0.6 4.021
114 24.7 4.526 8 1.7 5.032
103 22.3 5.537 1 0.2 6.042
79 17.1 6.547
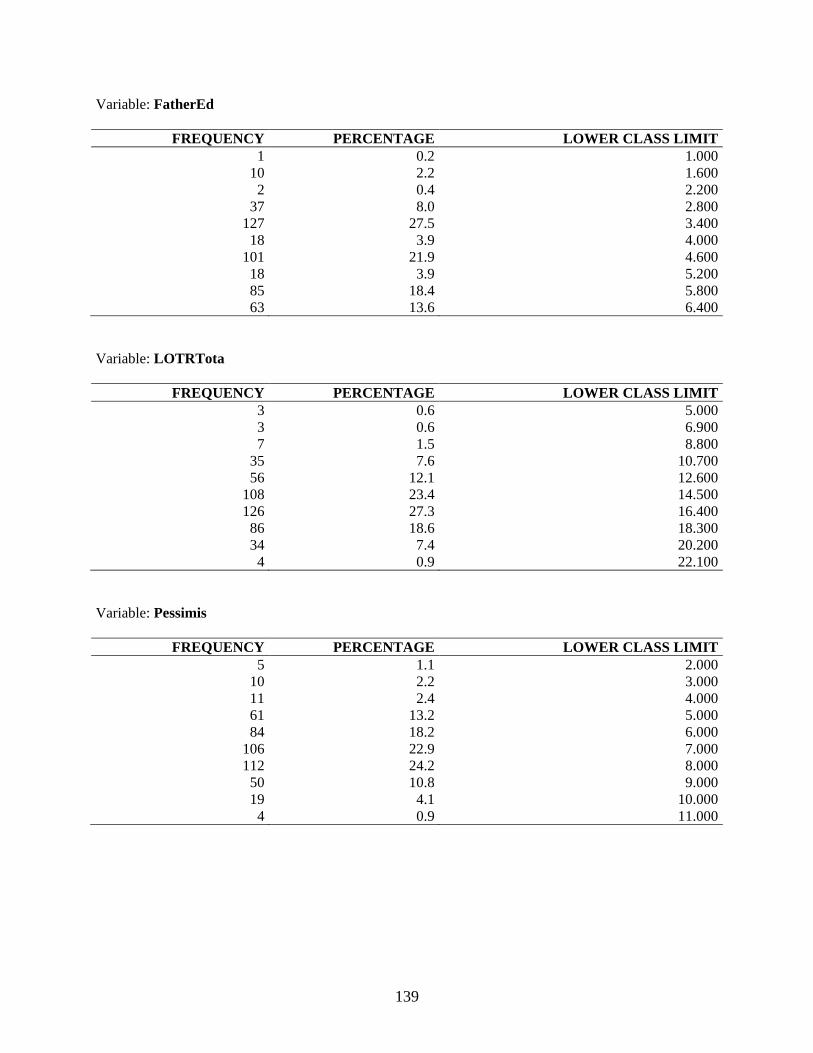
139
Variable: FatherEd
FREQUENCY PERCENTAGE LOWER CLASS LIMIT 1 0.2 1.000
10 2.2 1.600 2 0.4 2.200
37 8.0 2.800 127 27.5 3.400
18 3.9 4.000 101 21.9 4.600
18 3.9 5.200 85 18.4 5.800 63 13.6 6.400
Variable: LOTRTota
FREQUENCY PERCENTAGE LOWER CLASS LIMIT 3 0.6 5.000 3 0.6 6.900 7 1.5 8.800
35 7.6 10.700 56 12.1 12.600
108 23.4 14.500 126 27.3 16.400
86 18.6 18.300 34 7.4 20.200
4 0.9 22.100 Variable: Pessimis
FREQUENCY PERCENTAGE LOWER CLASS LIMIT 5 1.1 2.000
10 2.2 3.000 11 2.4 4.000 61 13.2 5.000 84 18.2 6.000
106 22.9 7.000 112 24.2 8.000
50 10.8 9.000 19 4.1 10.000
4 0.9 11.000

140
Variable: AHSTotal
FREQUENCY PERCENTAGE LOWER CLASS LIMIT 5 1.1 14.000 2 0.4 17.400 7 1.5 20.800
19 4.1 24.200 27 5.8 27.600 32 6.9 31.000 69 14.9 34.400
131 28.4 37.800 85 18.4 41.200 85 18.4 44.600
Variable: AHSAgenc
FREQUENCY PERCENTAGE LOWER CLASS LIMIT 3 0.6 4.000 3 0.6 6.000 9 1.9 8.000
15 3.2 10.000 22 4.8 12.000 41 8.9 14.000 64 13.9 16.000
110 23.8 18.000 91 19.7 20.000
104 22.5 22.000 Variable: AHSPathw
FREQUENCY PERCENTAGE LOWER CLASS LIMIT 2 0.4 6.000 3 0.6 7.800 4 0.9 9.600
10 2.2 11.400 17 3.7 13.200 11 2.4 15.000 68 14.7 16.800 85 18.4 18.600
139 30.1 20.400 123 26.6 22.200

141
Variable: SESRL
FREQUENCY PERCENTAGE LOWER CLASS LIMIT 3 0.6 9.000 2 0.4 12.300
12 2.6 15.600 29 6.3 18.900 33 7.1 22.200 65 14.1 25.500
100 21.6 28.800 97 21.0 32.100 69 14.9 35.400 52 11.3 38.700
Variable: ASETotal
FREQUENCY PERCENTAGE LOWER CLASS LIMIT 2 0.4 12.000 6 1.3 14.400 6 1.3 16.800
22 4.8 19.200 52 11.3 21.600 59 12.8 24.000 77 16.7 26.400
128 27.7 28.800 55 11.9 31.200 55 11.9 33.600
Variable: Emotiona
FREQUENCY PERCENTAGE LOWER CLASS LIMIT 1 0.2 14.000
14 3.0 18.700 100 21.6 23.400 112 24.2 28.100 111 24.0 32.800
64 13.9 37.500 24 5.2 42.200 24 5.2 46.900 10 2.2 51.600
2 0.4 56.300

142
Variable: PeerRela
FREQUENCY PERCENTAGE LOWER CLASS LIMIT 3 0.6 10.000
12 2.6 15.000 75 16.2 20.000
220 47.6 25.000 94 20.3 30.000 31 6.7 35.000 15 3.2 40.000
7 1.5 45.000 2 0.4 50.000 3 0.6 55.000
Variable: Behavior
FREQUENCY PERCENTAGE LOWER CLASS LIMIT 4 0.9 8.000 4 0.9 12.000
32 6.9 16.000 89 19.3 20.000
136 29.4 24.000 118 25.5 28.000
54 11.7 32.000 18 3.9 36.000
4 0.9 40.000 3 0.6 44.000
Variable: GWBTotal
FREQUENCY PERCENTAGE LOWER CLASS LIMIT 4 0.9 68.000 6 1.3 78.600
20 4.3 89.200 46 10.0 99.800 55 11.9 110.400 62 13.4 121.000 75 16.2 131.600 82 17.7 142.200 75 16.2 152.800 37 8.0 163.400

143
Variable: LOTR1
FREQUENCY PERCENTAGE LOWER CLASS LIMIT 16 3.5 0.000
0 0.0 0.400 38 8.2 0.800
0 0.0 1.200 0 0.0 1.600
146 31.6 2.000 0 0.0 2.400
160 34.6 2.800 0 0.0 3.200
102 22.1 3.600 Variable: LOTR2
FREQUENCY PERCENTAGE LOWER CLASS LIMIT 15 3.2 0.000
0 0.0 0.400 38 8.2 0.800
0 0.0 1.200 134 29.0 1.600
0 0.0 2.000 0 0.0 2.400
178 38.5 2.800 0 0.0 3.200
97 21.0 3.600 Variable: LOTR3
FREQUENCY PERCENTAGE LOWER CLASS LIMIT 29 6.3 0.000
0 0.0 0.400 0 0.0 0.800 0 0.0 1.200
158 34.2 1.600 1 0.2 2.000 0 0.0 2.400
230 49.8 2.800 0 0.0 3.200
44 9.5 3.600

144
Variable: LOTR4
FREQUENCY PERCENTAGE LOWER CLASS LIMIT 10 2.2 0.000
0 0.0 0.400 29 6.3 0.800
0 0.0 1.200 115 24.9 1.600
0 0.0 2.000 0 0.0 2.400
154 33.3 2.800 1 0.2 3.200
153 33.1 3.600 Variable: LOTR5
FREQUENCY PERCENTAGE LOWER CLASS LIMIT 1 0.2 0.000 0 0.0 0.400 5 1.1 0.800 0 0.0 1.200 0 0.0 1.600
44 9.5 2.000 0 0.0 2.400
128 27.7 2.800 0 0.0 3.200
284 61.5 3.600 Variable: LOTR6
FREQUENCY PERCENTAGE LOWER CLASS LIMIT 11 2.4 0.000
0 0.0 0.400 42 9.1 0.800
0 0.0 1.200 119 25.8 1.600
0 0.0 2.000 0 0.0 2.400
181 39.2 2.800 0 0.0 3.200
109 23.6 3.600

145
Variable: LOTR7
FREQUENCY PERCENTAGE LOWER CLASS LIMIT 27 5.8 0.000
0 0.0 0.400 0 0.0 0.800 0 0.0 1.200 1 0.2 1.600
156 33.8 2.000 0 0.0 2.400
214 46.3 2.800 0 0.0 3.200
64 13.9 3.600 Variable: LOTR8
FREQUENCY PERCENTAGE LOWER CLASS LIMIT 61 13.2 0.000
0 0.0 0.400 82 17.7 0.800
0 0.0 1.200 0 0.0 1.600
120 26.0 2.000 0 0.0 2.400
112 24.2 2.800 0 0.0 3.200
87 18.8 3.600 Variable: LOTR9
FREQUENCY PERCENTAGE LOWER CLASS LIMIT 30 6.5 0.000
0 0.0 0.400 0 0.0 0.800 0 0.0 1.200
116 25.1 1.600 0 0.0 2.000 0 0.0 2.400
218 47.2 2.800 0 0.0 3.200
98 21.2 3.600

146
Variable: LOTR10
FREQUENCY PERCENTAGE LOWER CLASS LIMIT 6 1.3 0.000 0 0.0 0.400
24 5.2 0.800 0 0.0 1.200
96 20.8 1.600 0 0.0 2.000 0 0.0 2.400
150 32.5 2.800 0 0.0 3.200
186 40.3 3.600 Variable: AHS1
FREQUENCY PERCENTAGE LOWER CLASS LIMIT 3 0.6 1.000 7 1.5 1.700 4 0.9 2.400 0 0.0 3.100
15 3.2 3.800 41 8.9 4.500
0 0.0 5.200 92 19.9 5.900
136 29.4 6.600 164 35.5 7.300
Variable: AHS2
FREQUENCY PERCENTAGE LOWER CLASS LIMIT 2 0.4 1.000 8 1.7 1.700
12 2.6 2.400 0 0.0 3.100
21 4.5 3.800 77 16.7 4.500
0 0.0 5.200 104 22.5 5.900 128 27.7 6.600 110 23.8 7.300

147
Variable: AHS3
FREQUENCY PERCENTAGE LOWER CLASS LIMIT 2 0.4 1.000 5 1.1 1.700 5 1.1 2.400 0 0.0 3.100
15 3.2 3.800 58 12.6 4.500
0 0.0 5.200 105 22.7 5.900 155 33.5 6.600 117 25.3 7.300
Variable: AHS4
FREQUENCY PERCENTAGE LOWER CLASS LIMIT 6 1.3 1.000 3 0.6 1.700 4 0.9 2.400 0 0.0 3.100
21 4.5 3.800 46 10.0 4.500
0 0.0 5.200 67 14.5 5.900
127 27.5 6.600 188 40.7 7.300
Variable: AHS5
FREQUENCY PERCENTAGE LOWER CLASS LIMIT 1 0.2 1.000 5 1.1 1.700 2 0.4 2.400 0 0.0 3.100 9 1.9 3.800
34 7.4 4.500 0 0.0 5.200
68 14.7 5.900 149 32.3 6.600 194 42.0 7.300

148
Variable: AHS6
FREQUENCY PERCENTAGE LOWER CLASS LIMIT 22 4.8 1.000 19 4.1 1.700 38 8.2 2.400
0 0.0 3.100 49 10.6 3.800
107 23.2 4.500 0 0.0 5.200
103 22.3 5.900 84 18.2 6.600 40 8.7 7.300
Variable: ASES1
FREQUENCY PERCENTAGE LOWER CLASS LIMIT 12 2.6 1.000 15 3.2 1.500
0 0.0 2.000 44 9.5 2.500
0 0.0 3.000 101 21.9 3.500
2 0.4 4.000 138 29.9 4.500
0 0.0 5.000 150 32.5 5.500
Variable: ASES2
FREQUENCY PERCENTAGE LOWER CLASS LIMIT 20 4.3 1.000 36 7.8 1.500
0 0.0 2.000 77 16.7 2.500
0 0.0 3.000 107 23.2 3.500
1 0.2 4.000 95 20.6 4.500
0 0.0 5.000 126 27.3 5.500

149
Variable: ASES3
FREQUENCY PERCENTAGE LOWER CLASS LIMIT 42 9.1 1.000
0 0.0 1.500 63 13.6 2.000
0 0.0 2.500 106 22.9 3.000
0 0.0 3.500 120 26.0 4.000
0 0.0 4.500 86 18.6 5.000 45 9.7 5.500
Variable: ASES4
FREQUENCY PERCENTAGE LOWER CLASS LIMIT 17 3.7 1.000
0 0.0 1.500 27 5.8 2.000
0 0.0 2.500 86 18.6 3.000
0 0.0 3.500 116 25.1 4.000
1 0.2 4.500 125 27.1 5.000
90 19.5 5.500 Variable: ASES5
FREQUENCY PERCENTAGE LOWER CLASS LIMIT 6 1.3 1.000
26 5.6 1.500 0 0.0 2.000
43 9.3 2.500 1 0.2 3.000
132 28.6 3.500 0 0.0 4.000
174 37.7 4.500 1 0.2 5.000
79 17.1 5.500

150
Variable: ASES6
FREQUENCY PERCENTAGE LOWER CLASS LIMIT 5 1.1 1.000
10 2.2 1.500 0 0.0 2.000
30 6.5 2.500 0 0.0 3.000
95 20.6 3.500 0 0.0 4.000
132 28.6 4.500 1 0.2 5.000
189 40.9 5.500 Variable: ASES7
FREQUENCY PERCENTAGE LOWER CLASS LIMIT 8 1.7 1.000
14 3.0 1.500 0 0.0 2.000
39 8.4 2.500 0 0.0 3.000
125 27.1 3.500 0 0.0 4.000
183 39.6 4.500 0 0.0 5.000
93 20.1 5.500 Variable: ASES8
FREQUENCY PERCENTAGE LOWER CLASS LIMIT 2 0.4 1.000 0 0.0 1.500 7 1.5 2.000 0 0.0 2.500
28 6.1 3.000 0 0.0 3.500
49 10.6 4.000 0 0.0 4.500
129 27.9 5.000 247 53.5 5.500

151
Variable: ASES9
FREQUENCY PERCENTAGE LOWER CLASS LIMIT 11 2.4 1.000 24 5.2 1.500
0 0.0 2.000 50 10.8 2.500
0 0.0 3.000 111 24.0 3.500
0 0.0 4.000 119 25.8 4.500
0 0.0 5.000 147 31.8 5.500
Variable: ASES10
FREQUENCY PERCENTAGE LOWER CLASS LIMIT 12 2.6 1.000
0 0.0 1.500 17 3.7 2.000
0 0.0 2.500 55 11.9 3.000
0 0.0 3.500 106 22.9 4.000
1 0.2 4.500 132 28.6 5.000 139 30.1 5.500
Variable: ASES11
FREQUENCY PERCENTAGE LOWER CLASS LIMIT 8 1.7 1.000 1 0.2 1.500
19 4.1 2.000 0 0.0 2.500
46 10.0 3.000 1 0.2 3.500
126 27.3 4.000 0 0.0 4.500
143 31.0 5.000 118 25.5 5.500

152
Variable: ASES12
FREQUENCY PERCENTAGE LOWER CLASS LIMIT 5 1.1 1.000 0 0.0 1.500
10 2.2 2.000 0 0.0 2.500
39 8.4 3.000 1 0.2 3.500
105 22.7 4.000 0 0.0 4.500
133 28.8 5.000 169 36.6 5.500
Variable: ASES13
FREQUENCY PERCENTAGE LOWER CLASS LIMIT 16 3.5 1.000
0 0.0 1.500 21 4.5 2.000
0 0.0 2.500 53 11.5 3.000
0 0.0 3.500 102 22.1 4.000
0 0.0 4.500 115 24.9 5.000 155 33.5 5.500
Variable: GWB1
FREQUENCY PERCENTAGE LOWER CLASS LIMIT 14 3.0 1.000 36 7.8 1.500
0 0.0 2.000 59 12.8 2.500
1 0.2 3.000 89 19.3 3.500
2 0.4 4.000 114 24.7 4.500
0 0.0 5.000 147 31.8 5.500

153
Variable: GWB2
FREQUENCY PERCENTAGE LOWER CLASS LIMIT 27 5.8 1.000
0 0.0 1.500 36 7.8 2.000
0 0.0 2.500 51 11.0 3.000
3 0.6 3.500 56 12.1 4.000
1 0.2 4.500 108 23.4 5.000 180 39.0 5.500
Variable: GWB3
FREQUENCY PERCENTAGE LOWER CLASS LIMIT 8 1.7 1.000
11 2.4 1.500 0 0.0 2.000
50 10.8 2.500 1 0.2 3.000
76 16.5 3.500 2 0.4 4.000
144 31.2 4.500 0 0.0 5.000
170 36.8 5.500 Variable: GWB4
FREQUENCY PERCENTAGE LOWER CLASS LIMIT 44 9.5 1.000 39 8.4 1.500
0 0.0 2.000 53 11.5 2.500
1 0.2 3.000 79 17.1 3.500
3 0.6 4.000 106 22.9 4.500
0 0.0 5.000 137 29.7 5.500

154
Variable: GWB5
FREQUENCY PERCENTAGE LOWER CLASS LIMIT 13 2.8 1.000
0 0.0 1.500 18 3.9 2.000
0 0.0 2.500 52 11.3 3.000
0 0.0 3.500 79 17.1 4.000
1 0.2 4.500 118 25.5 5.000 181 39.2 5.500
Variable: GWB6
FREQUENCY PERCENTAGE LOWER CLASS LIMIT 25 5.4 1.000 29 6.3 1.519
0 0.0 2.039 38 8.2 2.558
2 0.4 3.077 68 14.7 3.597
0 0.0 4.116 101 21.9 4.635
0 0.0 5.155 199 43.1 5.674
Variable: GWB7
FREQUENCY PERCENTAGE LOWER CLASS LIMIT 21 4.5 1.000 27 5.8 1.507
0 0.0 2.015 29 6.3 2.522
0 0.0 3.029 50 10.8 3.537
2 0.4 4.044 98 21.2 4.551
0 0.0 5.059 235 50.9 5.566

155
Variable: GWB8
FREQUENCY PERCENTAGE LOWER CLASS LIMIT 16 3.5 1.000
0 0.0 1.500 21 4.5 2.000
0 0.0 2.500 30 6.5 3.000
1 0.2 3.500 46 10.0 4.000
2 0.4 4.500 80 17.3 5.000
266 57.6 5.500 Variable: GWB9
FREQUENCY PERCENTAGE LOWER CLASS LIMIT 12 2.6 1.000
0 0.0 1.500 11 2.4 2.000
0 0.0 2.500 19 4.1 3.000
0 0.0 3.500 38 8.2 4.000
3 0.6 4.500 78 16.9 5.000
301 65.2 5.500 Variable: GWB10
FREQUENCY PERCENTAGE LOWER CLASS LIMIT 49 10.6 1.000 54 11.7 1.500
0 0.0 2.000 70 15.2 2.500
3 0.6 3.000 70 15.2 3.500
0 0.0 4.000 75 16.2 4.500
1 0.2 5.000 140 30.3 5.500

156
Variable: GWB11
FREQUENCY PERCENTAGE LOWER CLASS LIMIT 18 3.9 1.000 19 4.1 1.500
0 0.0 2.000 45 9.7 2.500
0 0.0 3.000 54 11.7 3.500
1 0.2 4.000 110 23.8 4.500
0 0.0 5.000 215 46.5 5.500
Variable: GWB12
FREQUENCY PERCENTAGE LOWER CLASS LIMIT 16 3.5 1.000 15 3.2 1.500
0 0.0 2.000 19 4.1 2.500
0 0.0 3.000 29 6.3 3.500
1 0.2 4.000 82 17.7 4.500
3 0.6 5.000 297 64.3 5.500
Variable: GWB13
FREQUENCY PERCENTAGE LOWER CLASS LIMIT 23 5.0 1.000 22 4.8 1.500
0 0.0 2.000 30 6.5 2.500
1 0.2 3.000 52 11.3 3.500
3 0.6 4.000 90 19.5 4.500
0 0.0 5.000 241 52.2 5.500

157
Variable: GWB14
FREQUENCY PERCENTAGE LOWER CLASS LIMIT 18 3.9 1.000 15 3.2 1.500
0 0.0 2.000 23 5.0 2.500
0 0.0 3.000 49 10.6 3.500
3 0.6 4.000 88 19.0 4.500
1 0.2 5.000 265 57.4 5.500
Variable: GWB15
FREQUENCY PERCENTAGE LOWER CLASS LIMIT 27 5.8 1.000 28 6.1 1.500
1 0.2 2.000 36 7.8 2.500
0 0.0 3.000 37 8.0 3.500
2 0.4 4.000 83 18.0 4.500
1 0.2 5.000 247 53.5 5.500
Variable: GWB16
FREQUENCY PERCENTAGE LOWER CLASS LIMIT 18 3.9 1.000 16 3.5 1.500
1 0.2 2.000 27 5.8 2.500
0 0.0 3.000 40 8.7 3.500
1 0.2 4.000 81 17.5 4.500
0 0.0 5.000 278 60.2 5.500

158
Variable: GWB17
FREQUENCY PERCENTAGE LOWER CLASS LIMIT 29 6.3 1.000
0 0.0 1.500 14 3.0 2.000
0 0.0 2.500 28 6.1 3.000
3 0.6 3.500 46 10.0 4.000
2 0.4 4.500 60 13.0 5.000
280 60.6 5.500 Variable: GWB18
FREQUENCY PERCENTAGE LOWER CLASS LIMIT 32 6.9 1.000
0 0.0 1.500 37 8.0 2.000
0 0.0 2.500 77 16.7 3.000
4 0.9 3.500 102 22.1 4.000
1 0.2 4.500 101 21.9 5.000 108 23.4 5.500
Variable: GWB19
FREQUENCY PERCENTAGE LOWER CLASS LIMIT 13 2.8 1.000 18 3.9 1.515
0 0.0 2.029 38 8.2 2.544
0 0.0 3.059 77 16.7 3.574
1 0.2 4.088 128 27.7 4.603
1 0.2 5.118 186 40.3 5.633

159
Variable: GWB20
FREQUENCY PERCENTAGE LOWER CLASS LIMIT 39 8.4 1.000
0 0.0 1.500 33 7.1 2.000
0 0.0 2.500 42 9.1 3.000
0 0.0 3.500 77 16.7 4.000
0 0.0 4.500 117 25.3 5.000 154 33.3 5.500
Variable: GWB21
FREQUENCY PERCENTAGE LOWER CLASS LIMIT 36 7.8 1.000 16 3.5 1.500
1 0.2 2.000 37 8.0 2.500
0 0.0 3.000 78 16.9 3.500
2 0.4 4.000 118 25.5 4.500
0 0.0 5.000 174 37.7 5.500
Variable: GWB22
FREQUENCY PERCENTAGE LOWER CLASS LIMIT 39 8.4 1.000
0 0.0 1.500 44 9.5 2.000
0 0.0 2.500 41 8.9 3.000
2 0.4 3.500 70 15.2 4.000
0 0.0 4.500 90 19.5 5.000
176 38.1 5.500

160
Variable: GWB23
FREQUENCY PERCENTAGE LOWER CLASS LIMIT 16 3.5 1.000
0 0.0 1.500 19 4.1 2.000
0 0.0 2.500 24 5.2 3.000
1 0.2 3.500 49 10.6 4.000
1 0.2 4.500 80 17.3 5.000
272 58.9 5.500 Variable: GWB24
FREQUENCY PERCENTAGE LOWER CLASS LIMIT 38 8.2 1.000
1 0.2 1.500 52 11.3 2.000
1 0.2 2.500 101 21.9 3.000
1 0.2 3.500 75 16.2 4.000
1 0.2 4.500 94 20.3 5.000 98 21.2 5.500
Variable: GWB25
FREQUENCY PERCENTAGE LOWER CLASS LIMIT 41 8.9 1.000 36 7.8 1.500
0 0.0 2.000 87 18.8 2.500
2 0.4 3.000 82 17.7 3.500
3 0.6 4.000 93 20.1 4.500
0 0.0 5.000 118 25.5 5.500

161
Variable: GWB26
FREQUENCY PERCENTAGE LOWER CLASS LIMIT 31 6.7 1.000
0 0.0 1.500 27 5.8 2.000
0 0.0 2.500 88 19.0 3.000
2 0.4 3.500 81 17.5 4.000
0 0.0 4.500 92 19.9 5.000
141 30.5 5.500 Variable: GWB27
FREQUENCY PERCENTAGE LOWER CLASS LIMIT 25 5.4 1.000
9 1.9 1.500 0 0.0 2.000
45 9.7 2.500 0 0.0 3.000
79 17.1 3.500 0 0.0 4.000
121 26.2 4.500 1 0.2 5.000
182 39.4 5.500 Variable: GWB28
FREQUENCY PERCENTAGE LOWER CLASS LIMIT 93 20.1 1.000
0 0.0 1.500 42 9.1 2.000
1 0.2 2.500 47 10.2 3.000
3 0.6 3.500 59 12.8 4.000
1 0.2 4.500 73 15.8 5.000
143 31.0 5.500

162
Variable: GWB29
FREQUENCY PERCENTAGE LOWER CLASS LIMIT 59 12.8 1.000
0 0.0 1.500 50 10.8 2.000
0 0.0 2.500 59 12.8 3.000
2 0.4 3.500 81 17.5 4.000
1 0.2 4.500 88 19.0 5.000
122 26.4 5.500 Variable: AveGrade
FREQUENCY PERCENTAGE LOWER CLASS LIMIT 10 2.2 1.000
5 1.1 1.600 7 1.5 2.200
24 5.2 2.800 76 16.5 3.400 76 16.5 4.000 64 13.9 4.600 98 21.2 5.200 55 11.9 5.800 47 10.2 6.400

163
APPENDIX B
RESEARCH INSTRUMENTS USED IN PRESENT STUDY

164
Directions: Please print your name if you would like to be entered into a raffle to win prizes. Name:_______________________________________ Date:___________________________
Directions: Please check the following responses that best describe you. 1.) What is your gender? Female____ Male____ 2.) What is your age? ____ 3.) What year in school are you?
Freshman ____ Sophomore____ Junior____ Senior____ 4.) What type of grades do you usually make: ____Mostly A’s ____About half A’s and half B’s ____Mostly B’s ____ About half B’s and half C’s ____Mostly C’s ____About half C’s and lower Mostly
D’s About
half C’s and
lower
Mostly C’s
About half B’s and half
C’s
Mostly B’s
About half A’s and half
B’s
Mostly A’s
What types of grades do you usually make in …
English Classes 1 2 3 4 5 6 7 Math Classes 1 2 3 4 5 6 7 Science Classes 1 2 3 4 5 6 7 Social Studies Classes
1 2 3 4 5 6 7

165
6.) What is your ethnicity? ____American Indian/ Native American ____Asian or Asian American, including Chinese, Japanese, and others ____Black or African American ____Hispanic or Latino, including Mexican American, Central American, and others ____More than one ethnic group; parents from two different groups ____White, Caucasian, Anglo, European American ____Other, please specify _____________________ 7.) Who do you live with at home? Mother_____ Grandmother_____ Other (please specify):_____________ Father_____ Grandfather_____ Mother & Father_____ Grandparents_____ 8.) For the answer above, what level of education do they have? Mother (Grandmother, Other) Father (Grandfather, Other)
____ ____ Graduate professional (graduate degree) ____ ____ College or university graduate (completed 4 year college) ____ ____ Partial college or technical training (at least 1 year of
college) ____ ____ High school graduate ____ ____ Partial high school (completed 10th or 11th grade) ____ ____ Junior high school (completed 7th, 8th, or 9th grade) ____ ____ Less than 7 years of school (had not completed the 7th grade)
9.) For the answer above (#8), please list their job/occupation(s): Mother (Grandmother, Other): __________________________________________________________________ Father (Grandfather, Other): ____________________________________________________________________

166
Directions: Read each item carefully. Using the same scale provided, please select the number that best describes you and put that number in the blank provided.
1 2 3 4 5 6 7 8 Definitely Mostly Somewhat Slightly Slightly Somewhat Mostly Definitely False False False False True True True True
____ 1. I can think of many ways to make good grades. ____ 2. I actively pursue my school work. ____ 3. There are several ways to meet the challenges of any class. ____ 4. I am motivated to do well in school. ____ 5. I can think of ways to do well in classes that are important to me. ____ 6. I am energized when it comes to my school work.
Directions: Read each statement below very carefully and use the scale below to determine the number that best describes you. Remember that you can circle any number from 1 to 6.
1 2 3 4 5 6 Not very well at all Very well
1. How well can you finish your homework on time? 1 2 3 4 5 6 2. How well can you learn mathematics? 1 2 3 4 5 6 3. How well can you study when there are other interesting
things to do? 1 2 3 4 5 6
4. How well can you learn science? 1 2 3 4 5 6 5. How well can you concentrate on your school work? 1 2 3 4 5 6 6. How well can you learn reading skills? 1 2 3 4 5 6 7. How well can you remember information presented in class
and in your school books? 1 2 3 4 5 6
8. How well can you learn to use computers? 1 2 3 4 5 6 9. How well can you arrange a place to study at home where
you won’t get distracted? 1 2 3 4 5 6
10. How well can you learn social studies? 1 2 3 4 5 6 11. How well can you motivate yourself to do schoolwork? 1 2 3 4 5 6 12. How well can you learn writing skills? 1 2 3 4 5 6 13. How well can you participate in class discussions? 1 2 3 4 5 6

167
Directions: Read each statement below very carefully. Use the scale below to indicate how well the statements describe you. Write your response in the blank provided. You can use any number from 1 to 6.
1 2 3 4 5 6 Not very well at all Very well
__________1. I feel nervous most of the time. __________2. I feel that I am not as good as most people I know. __________3. Most of the time I am happy. __________4. My feelings are easily hurt. __________5. I feel relaxed under normal circumstances. __________6. I feel empty emotionally most of the time. __________7. I am so very nervous. __________8. I feel so very lonely. __________9. I enjoy life. __________10. Very often I think that I am not at all the person I would like to be. __________11. I frequently feel sad. __________12. Other kids find me a bore. __________13. I usually feel out of place at picnics and parties. __________14. I think that other people just do not like me. __________15. I find it very difficult to establish new friendships. __________16. I find it extremely hard to make friends. __________17. I would rather be alone than with kids my age. __________18. I think that other kids find me attractive. __________19. Being together with other people gives me a good feeling. __________20. I do not have a particularly difficult time making friends. __________21. I enjoy most parties I go to. __________22. I ‘‘lose my head’’ easily. __________23. I become violent if I don’t get my way. __________24. Even under pressure I manage to remain calm. __________25. I keep an even temper most of the time. __________26. I am a calm person. __________27. Usually I control myself. __________28. There are people that I will never forgive for things they have done. __________29. Sometimes I do things that I know I shouldn’t but I can’t stop myself.

168
Directions: Indicate the extent to which you agree or disagree with each of the following statements using the response scale below.
__________1. In uncertain times, I usually expect the best. __________2. It's easy for me to relax. __________3. If something can go wrong for me, it will. __________4. I'm always optimistic about my future. __________5. I enjoy my friends a lot. __________6. It's important for me to keep busy. __________7. I hardly ever expect things to go my way. __________8. I don't get upset too easily. __________9. I rarely count on good things happening to me. __________10. Overall, I expect more good things to happen to me than bad.
0 1 2 3 4 Strongly Disagree Disagree Neutral Agree Strongly Agree

169
APPENDIX C
IRB APPROVAL

170

171

172
APPENDIX D
LISREL PROGRAM SYNTAX FOR MULTIPLE GROUP ANALYSES

173
Female SEM Model Female SEM Model Observed Variables English Math Science Social Optim Hope ASET Behvr Emot Peer Sample Size 233 Correlation Matrix 1.000 .447 1.000 .426 .489 1.000 .551 .407 .512 1.000 .159 .126 .186 .121 1.000 .298 .359 .258 .283 .315 1.000 .310 .306 .341 .392 .211 .452 1.000 -.190 -.091 -.052 -.159 .010 .047 .053 1.000 -.286 -.154 -.148 -.194 -.240 -.152 -.077 .289 1.000 -.250 -.077 -.065 -.133 -.115 -.087 .027 .346 .521 1.000 Means 5.42 4.87 4.98 5.30 16.88 40.59 28.77 27.31 34.80 29.60 Standard Deviation 1.515 1.465 1.333 1.416 2.911 4.934 4.170 5.653 7.633 6.358 Latent Variables Achieve System GWB Relationships English Math Science Social = Achieve Optim Hope ASET = System Behvr Emot Peer = GWB Achieve GWB = System !LISREL OUTPUT SS SC Path Diagram End of Problem Male SEM Model
Male SEM Model Observed Variables English Math Science Social Optim Hope ASET Behvr Emot Peer Sample Size 233 Correlation Matrix 1.000 .411 1.000 .521 .551 1.000 .602 .508 .673 1.000 .259 .173 .124 .221 1.000 .273 .208 .263 .281 .368 1.000 .248 .306 .348 .306 .280 .402 1.000 -.014 -.027 .023 .053 .154 -.049 .041 1.000 -.100 -.166 -.077 -.092 -.163 -.140 -.102 .219 1.000 -.101 -.053 -.078 -.128 -.008 -.112 -.087 .330 .425 1.000 Means 4.47 4.42 4.44 4.73 16.18 36.74 27.72 28.15 33.19 29.85

174
Standard Deviation 1.629 1.651 1.391 1.578 3.142 7.111 4.651 5.664 7.20 6.022 Latent Variables Achieve System GWB Relationships English Math Science Social = Achieve Optim Hope ASET = System Behvr Emot Peer = GWB Achieve GWB = System !LISREL OUTPUT SS SC Path Diagram End of Problem Female versus Male Multiple Group SEM Analysis Female versus Male multiple group SEM analysis Group 1: Female Observed Variables English Math Science Social Optim Hope ASET Behvr Emot Peer Sample Size 233 Correlation Matrix 1.000 .447 1.000 .426 .489 1.000 .551 .407 .512 1.000 .159 .126 .186 .121 1.000 .298 .359 .258 .283 .315 1.000 .310 .306 .341 .392 .211 .452 1.000 -.190 -.091 -.052 -.159 .010 .047 .053 1.000 -.286 -.154 -.148 -.194 -.240 -.152 -.077 .289 1.000 -.250 -.077 -.065 -.133 -.115 -.087 .027 .346 .521 1.000 Means 5.42 4.87 4.98 5.30 16.88 40.59 28.77 27.31 34.80 29.60 Standard Deviation 1.515 1.465 1.333 1.416 2.911 4.934 4.170 5.653 7.633 6.358 Latent Variables Achieve System GWB Relationships English Math Science Social = Achieve Optim Hope ASET = System Behvr Emot Peer = GWB Achieve GWB = System Set error variance Achieve = 2.14 Set error variance GWB = .68 Group 2: Male Observed Variables English Math Science Social Optim Hope ASET Behvr Emot Peer Sample Size 233

175
Correlation Matrix 1.000 .411 1.000 .521 .551 1.000 .602 .508 .673 1.000 .259 .173 .124 .221 1.000 .273 .208 .263 .281 .368 1.000 .248 .306 .348 .306 .280 .402 1.000 -.014 -.027 .023 .053 .154 -.049 .041 1.000 -.100 -.166 -.077 -.092 -.163 -.140 -.102 .219 1.000 -.101 -.053 -.078 -.128 -.008 -.112 -.087 .330 .425 1.000 Means 4.47 4.42 4.44 4.73 16.18 36.74 27.72 28.15 33.19 29.85 Standard Deviation 1.629 1.651 1.391 1.578 3.142 7.111 4.651 5.664 7.20 6.022 Set error covariance of English - Peer free !LISREL OUTPUT SS SC Path Diagram End of Problem Black SEM Model Black SEM Model Observed Variables English Math Science Social Optim Hope ASET Behvr Emot Peer Sample Size 219 Correlation Matrix 1.000 .361 1.000 .507 .417 1.000 .494 .378 .622 1.000 .200 .045 .109 .116 1.000 .302 .216 .267 .319 .315 1.000 .188 .141 .249 .246 .260 .397 1.000 -.123 -.024 .007 -.014 .101 -.041 .013 1.000 -.144 -.061 -.060 -.048 -.035 -.049 -.088 .286 1.000 -.163 -.041 -.068 -.095 -.008 -.083 -.045 .376 .496 1.000 Means 4.62 4.46 4.53 4.66 17.12 38.76 28.03 28.21 34.38 30.93 Standard Deviation 1.551 1.585 1.358 1.475 2.796 6.669 4.601 6.486 8.169 7.447 Latent Variables Achieve System GWB Relationships English Math Science Social = Achieve Optim Hope ASET = System Behvr Emot Peer = GWB Achieve GWB = System !LISREL OUTPUT SS SC

176
Path Diagram End of Problem White SEM Model White SEM Model Observed Variables English Math Science Social Optim Hope ASET Behvr Emot Peer Sample Size 218 Correlation Matrix 1.000 .516 1.000 .531 .611 1.000 .679 .570 .646 1.000 .377 .323 .277 .396 1.000 .424 .406 .402 .376 .400 1.000 .393 .507 .501 .478 .308 .478 1.000 -.087 -.121 -.055 -.081 -.044 -.036 .112 1.000 -.153 -.200 -.089 -.178 -.405 -.172 -.046 .185 1.000 -.185 -.081 -.008 -.130 -.243 -.174 -.034 .255 .482 1.000 Means 5.35 4.84 4.92 5.43 15.97 38.48 28.39 27.05 33.59 28.54 Standard Deviation 1.571 1.526 1.371 1.437 3.174 6.068 4.262 4.550 6.612 4.555 Latent Variables Achieve System GWB Relationships English Math Science Social = Achieve Optim Hope ASET = System Behvr Emot Peer = GWB Achieve GWB = System !LISREL OUTPUT SS SC Path Diagram End of Problem

177
Black versus White Multiple Group Analysis Black versus White Multiple Group Analysis Group 1: Black Observed Variables English Math Science Social Optim Hope ASET Behvr Emot Peer Sample Size 219 Correlation Matrix 1.000 .361 1.000 .507 .417 1.000 .494 .378 .622 1.000 .200 .045 .109 .116 1.000 .302 .216 .267 .319 .315 1.000 .188 .141 .249 .246 .260 .397 1.000 -.123 -.024 .007 -.014 .101 -.041 .013 1.000 -.144 -.061 -.060 -.048 -.035 -.049 -.088 .286 1.000 -.163 -.041 -.068 -.095 -.008 -.083 -.045 .376 .496 1.000 Means 4.62 4.46 4.53 4.66 17.12 38.76 28.03 28.21 34.38 30.93 Standard Deviation 1.551 1.585 1.358 1.475 2.796 6.669 4.601 6.486 8.169 7.447 Latent Variables Achieve System GWB Relationships English Math Social Science = Achieve Optim Hope ASET = System Behvr Emot Peer = GWB Achieve GWB = System Set error variance Achieve = 2.14 Set error variance GWB = .68 Group 2: White Observed Variables English Math Science Social Optim Hope ASET Behvr Emot Peer Sample Size 218 Correlation Matrix 1.000 .516 1.000 .531 .611 1.000 .679 .570 .646 1.000 .377 .323 .277 .396 1.000 .424 .406 .402 .376 .400 1.000 .393 .507 .501 .478 .308 .478 1.000 -.087 -.121 -.055 -.081 -.044 -.036 .112 1.000 -.153 -.200 -.089 -.178 -.405 -.172 -.046 .185 1.000 -.185 -.081 -.008 -.130 -.243 -.174 -.034 .255 .482 1.000 Means 5.35 4.84 4.92 5.43 15.97 38.48 28.39 27.05 33.59 28.54 Standard Deviation 1.571 1.526 1.371 1.437 3.174 6.068 4.262 4.550 6.612 4.555

178
Set error covariance of English - Peer free !LISREL OUTPUT SS SC Path Diagram End of Problem High School SEM Model High School SEM Model Observed Variables English Math Science Social Optim Hope ASET Behvr Emot Peer Sample Size 197 Correlation Matrix 1.000 .575 1.000 .660 .595 1.000 .680 .533 .659 1.000 .242 .232 .227 .203 1.000 .317 .330 .270 .270 .449 1.000 .403 .367 .383 .368 .312 .474 1.000 .014 .001 .076 -.012 .124 .018 .059 1.000 -.196 -.186 -.122 -.164 -.197 -.093 -.049 .306 1.000 -.137 -.053 -.112 -.158 -.064 -.112 -.073 .324 .454 1.000 Means 4.12 4.42 4.48 4.49 15.87 37.74 28.39 28.51 34.47 30.42 Standard Deviation 1.708 1.677 1.592 1.703 3.411 6.699 5.048 6.027 8.433 6.871 Latent Variables Achieve System GWB Relationships English Math Science Social = Achieve Optim Hope ASET = System Behvr Emot Peer = GWB Achieve GWB = System !LISREL OUTPUT SS SC Path Diagram End of Problem

179
College SEM Model College SEM Model Observed Variables English Math Science Social Optim Hope ASET Behvr Emot Peer Sample Size 269 Correlation Matrix 1.000 .294 1.000 .279 .454 1.000 .374 .394 .529 1.000 .091 .056 .051 .076 1.000 .331 .236 .308 .333 .241 1.000 .266 .278 .346 .402 .217 .404 1.000 -.167 -.104 -.108 -.045 .075 -.049 .009 1.000 -.076 -.083 -.032 -.033 -.158 -.100 -.111 .172 1.000 -.157 -.058 .000 -.048 -.024 -.069 .005 .339 .485 1.000 Means 5.55 4.81 4.88 5.40 17.02 39.34 28.14 27.16 33.64 29.21 Standard Deviation 1.294 1.478 1.190 1.253 2.650 6.113 3.948 5.329 6.647 5.593 Latent Variables Achieve System GWB Relationships English Math Science Social = Achieve Optim Hope ASET = System Behvr Emot Peer = GWB Achieve GWB = System !LISREL OUTPUT SS SC Path Diagram End of Problem

180
High School versus College Multiple Group Analysis High School versus College SEM Model Group 1: High School Observed Variables English Math Science Social Optim Hope ASET Behvr Emot Peer Sample Size 197 Correlation Matrix 1.000 .575 1.000 .660 .595 1.000 .680 .533 .659 1.000 .242 .232 .227 .203 1.000 .317 .330 .270 .270 .449 1.000 .403 .367 .383 .368 .312 .474 1.000 .014 .001 .076 -.012 .124 .018 .059 1.000 -.196 -.186 -.122 -.164 -.197 -.093 -.049 .306 1.000 -.137 -.053 -.112 -.158 -.064 -.112 -.073 .324 .454 1.000 Means 4.12 4.42 4.48 4.49 15.87 37.74 28.39 28.51 34.47 30.42 Standard Deviation 1.708 1.677 1.592 1.703 3.411 6.699 5.048 6.027 8.433 6.871 Latent Variables Achieve System GWB Relationships English Math Science Social = Achieve Optim Hope ASET = System Behvr Emot Peer = GWB Achieve GWB = System Set error variance Achieve = 2.14 Set error variance GWB = .68 Group 2: College Observed Variables English Math Science Social Optim Hope ASET Behvr Emot Peer Sample Size 269 Correlation Matrix 1.000 .294 1.000 .279 .454 1.000 .374 .394 .529 1.000 .091 .056 .051 .076 1.000 .331 .236 .308 .333 .241 1.000 .266 .278 .346 .402 .217 .404 1.000 -.167 -.104 -.108 -.045 .075 -.049 .009 1.000 -.076 -.083 -.032 -.033 -.158 -.100 -.111 .172 1.000 -.157 -.058 .000 -.048 -.024 -.069 .005 .339 .485 1.000 Means 5.55 4.81 4.88 5.40 17.02 39.34 28.14 27.16 33.64 29.21 Standard Deviation 1.294 1.478 1.190 1.253 2.650 6.113 3.948 5.329 6.647 5.593

181
Set error covariance of English - Peer free !LISREL OUTPUT SS SC Path Diagram End of Problem