Embed Size (px)
Citation preview
Example listed public financial statements
Grant Thornton CLEARR Example Ltd For the year ended 31 December 2018
Example listed public financial statements For the year ended 31 December 2018
© 2019 Grant Thornton Australia Limited. All rights reserved i
Welcome to the December 2018 edition of the example listed public
financial statements. This set of illustrative financial
statements is one of many prepared by Grant Thornton to
assist you in preparing your own financial statements.
This publication is designed to illustrate the financial statements for a listed public
company in line with Australian financial reporting and regulatory requirements. It is
based on the activities and results of a fictitious ASX listed IT entity, Grant Thornton
CLEARR Example Ltd, which prepares Australian general purpose financial statements.
The full year and half-year periods ending 31 December 2018 represent a major change for many
Australian businesses due to the first time application of new revenue and financial instruments
requirements. AASB 15 Revenue from Contracts with Customers (for-profit entities) and AASB 9
Financial Instruments (for-profit and not-for-profit entities) apply for the first time this reporting period.
More significant changes are on their way with AASB 15 and AASB 1058 Income of Not-for-Profit
Entities (not-for-profit entities) and AASB 16 Leases (for-profit and not-for-profit entities) coming into
effect from 1 January 2019.
ASIC is also ramping up its surveillance activities with increased focus on the first time application of
new major standards and quantification of the expected impact of accounting standards issued but not
yet effective. Adding to the complexity in financial reporting, there is uncertainty as to when and how the
Australian government will respond to the recommendations arising from the legislative review of the
Australian Charities and Not-for-profits Commission (ACNC), particularly with respect to recommended
changes to reporting thresholds for not-for-profit entities. In addition, the Australian government has
recently introduced proposals to double the financial reporting thresholds for large proprietary
companies effective from 1 July 2019.
Furthermore, the AASB continues to make progress on its project to reform the Australian financial
reporting framework which proposes to remove the current definition of ‘reporting entity’ from Australian
Accounting requirements, effectively removing the option to prepare special purpose financial
statements if entities are required by legislation or otherwise to comply with Australian Accounting
Standards. To navigate through all these complexities and uncertainties, it is important that Australian
entities remain focused and proactive with their implementation projects and work closely with their
advisors and auditors.
Our objective in preparing the example financial statements was to illustrate one possible approach to
financial reporting by an entity engaging in transactions that are ‘typical’ across a range of non-specialist
sectors. However, as with any example, this illustration does not envisage every possible transaction
and cannot therefore be regarded as comprehensive.
Likewise, as a reference tool, this publication illustrates disclosures for many common scenarios without
removing disclosures based on materiality. We strongly encourage businesses to get rid of immaterial
disclosures and tailor disclosures to their specific circumstances.
We have reviewed and updated these financial statements to reflect changes in Australian Accounting
Standards that are effective for the year ending 31 December 2018. However, no account has been
taken of any new developments published after 7 January 2019. The Grant Thornton website contains
any updates that are relevant for 31 December 2018 financial statements, including our Technical
Accounting Alert on “What’s new for December 2018”.
Foreword
Example listed public financial statements For the year ended 31 December 2018
© 2019 Grant Thornton Australia Limited. All rights reserved ii
We trust this publication will help you work through the December 2018 reporting season. We welcome
your feedback on the format and content of this publication. Please contact us on
[email protected] or get in touch with your local Grant Thornton representative to
let us know your thoughts.
Andrew Rigele
National Head of Audit and Assurance
Grant Thornton Australia Limited
January 2019
Example listed public financial statements For the year ended 31 December 2018
© 2019 Grant Thornton Australia Limited. All rights reserved iii
Contents
Foreword i
Directors Report 1
Auditor’s Independence Declaration 20
Consolidated Statement of Profit or Loss and Other Comprehensive Income 23
Notes to the Consolidated Financial Statements 35
1 Nature of operations 35
2 General Information and statement of compliance 35
3 Changes in significant accounting policies 35
4 Summary of accounting policies 44
5 Revenue 68
6 Segment Reporting 71
7 Finance costs and finance income 76
8 Other financial items 77
9 Income tax expense 77
10 Assets and disposal groups classified as held for sale and discontinued operations 78
11 Cash and cash equivalents 80
12 Trade and other receivables 80
13 Financial assets and liabilities 82
14 Inventories 91
15 Investments accounted for using the equity method 91
16 Property, plant and equipment 93
17 Investment property 95
18 Deferred tax assets and liabilities 96
19 Goodwill 98
20 Other intangible assets 100
21 Trade and other payables 102
22 Provisions 102
23 Employee remuneration 103
24 Contract and other liabilities 112
26 Earnings per share and dividends 116
27 Reconciliation of cash flows 117
28 Auditor remuneration 118
29 Related party transactions 119
30 Contingent liabilitiesa 120

Example listed public financial statements For the year ended 31 December 2018
© 2019 Grant Thornton Australia Limited. All rights reserved iv
Contents
31 Capital commitments 121
32 Acquisitions and disposals 121
33 Interests in subsidiaries 124
34 Leases 127
35 Financial instrument risk 128
36 Fair value measurement 137
37 Capital management policies and procedures 142
38 Parent entity information 143
39 Post-reporting date events 144
Directors’ Declaration 145
Independent Auditor’s Report 146
ASX Additional Information 147
Appendix A: Organising the Statement of Profit and Loss by Function of Expenses 149
Appendix B: Statement of Profit or Loss and Other Comprehensive Income Presented in Two
Statements 152
Consolidated Statement of Profit or Loss 153
Consolidated Statement of Comprehensive Income 155
Appendix C: Statement of Cash Flows Presented Using the Indirect Method 156
Consolidated Statement of Cash Flows 157
Appendix D: Additional Disclosures for Mining Exploration Companies 159
Independent Auditor’s Report 173
Example listed public financial statements For the year ended 31 December 2018
© 2019 Grant Thornton Australia Limited. All rights reserved. 1
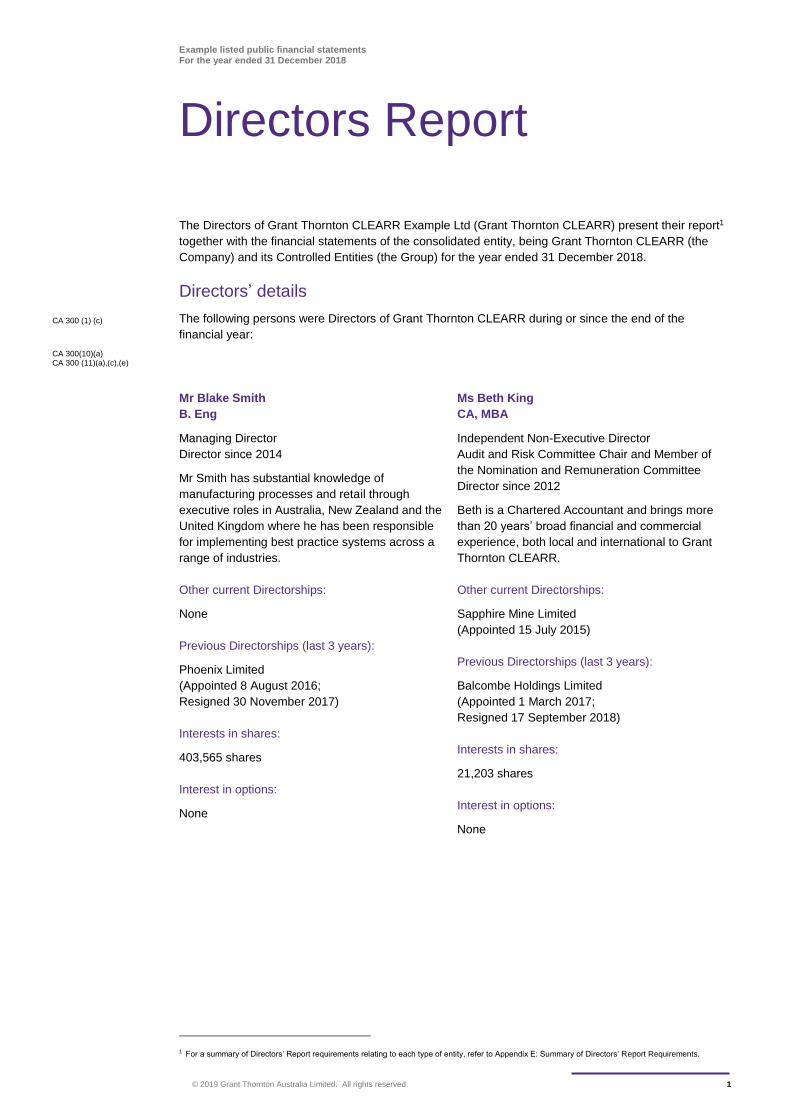
The Directors of Grant Thornton CLEARR Example Ltd (Grant Thornton CLEARR) present their report1
together with the financial statements of the consolidated entity, being Grant Thornton CLEARR (the
Company) and its Controlled Entities (the Group) for the year ended 31 December 2018.
Directors’ details
The following persons were Directors of Grant Thornton CLEARR during or since the end of the
financial year:
Mr Blake Smith
B. Eng
Managing Director
Director since 2014
Mr Smith has substantial knowledge of
manufacturing processes and retail through
executive roles in Australia, New Zealand and the
United Kingdom where he has been responsible
for implementing best practice systems across a
range of industries.
Other current Directorships:
None
Previous Directorships (last 3 years):
Phoenix Limited
(Appointed 8 August 2016;
Resigned 30 November 2017)
Interests in shares:
403,565 shares
Interest in options:
None
Ms Beth King
CA, MBA
Independent Non-Executive Director
Audit and Risk Committee Chair and Member of
the Nomination and Remuneration Committee
Director since 2012
Beth is a Chartered Accountant and brings more
than 20 years’ broad financial and commercial
experience, both local and international to Grant
Thornton CLEARR.
Other current Directorships:
Sapphire Mine Limited
(Appointed 15 July 2015)
Previous Directorships (last 3 years):
Balcombe Holdings Limited
(Appointed 1 March 2017;
Resigned 17 September 2018)
Interests in shares:
21,203 shares
Interest in options:
None
1 For a summary of Directors’ Report requirements relating to each type of entity, refer to Appendix E: Summary of Directors’ Report Requirements.
Directors Report
CA 300 (1) (c)
CA 300(10)(a) CA 300 (11)(a),(c),(e)
Example listed public financial statements For the year ended 31 December 2018
© 2019 Grant Thornton Australia Limited. All rights reserved. 2
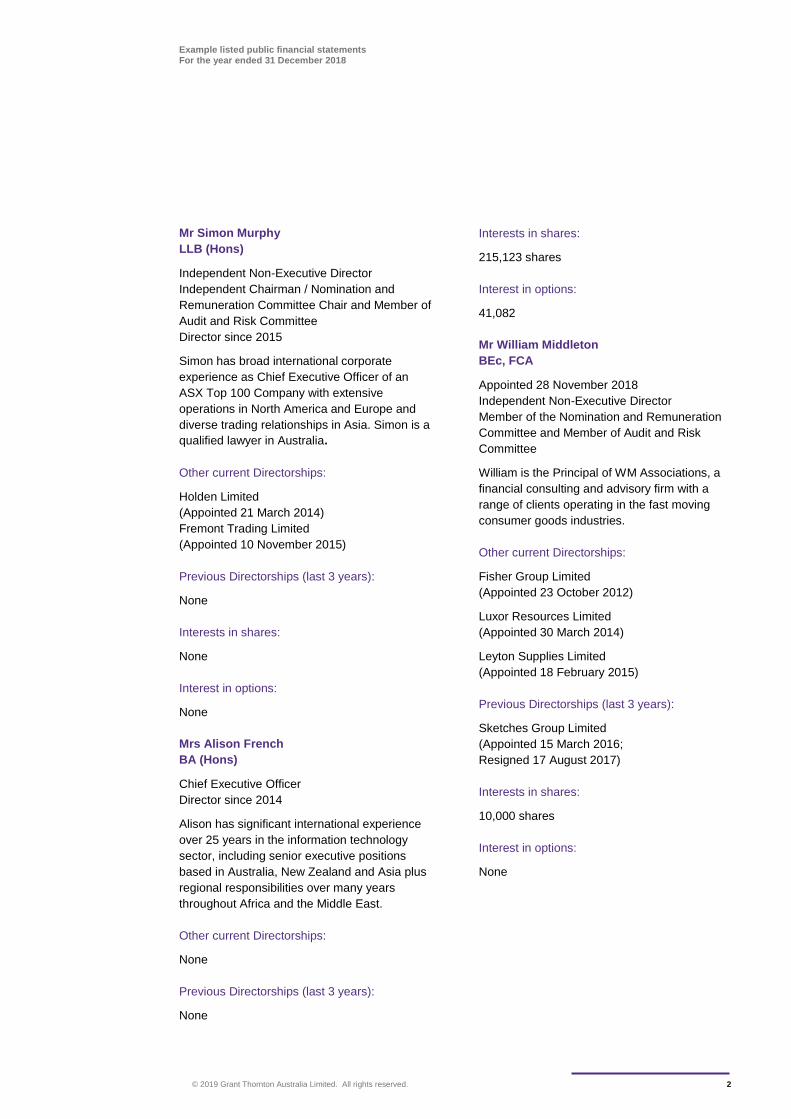
Mr Simon Murphy
LLB (Hons)
Independent Non-Executive Director
Independent Chairman / Nomination and
Remuneration Committee Chair and Member of
Audit and Risk Committee
Director since 2015
Simon has broad international corporate
experience as Chief Executive Officer of an
ASX Top 100 Company with extensive
operations in North America and Europe and
diverse trading relationships in Asia. Simon is a
qualified lawyer in Australia.
Other current Directorships:
Holden Limited
(Appointed 21 March 2014)
Fremont Trading Limited
(Appointed 10 November 2015)
Previous Directorships (last 3 years):
None
Interests in shares:
None
Interest in options:
None
Mrs Alison French
BA (Hons)
Chief Executive Officer
Director since 2014
Alison has significant international experience
over 25 years in the information technology
sector, including senior executive positions
based in Australia, New Zealand and Asia plus
regional responsibilities over many years
throughout Africa and the Middle East.
Other current Directorships:
None
Previous Directorships (last 3 years):
None
Interests in shares:
215,123 shares
Interest in options:
41,082
Mr William Middleton
BEc, FCA
Appointed 28 November 2018
Independent Non-Executive Director
Member of the Nomination and Remuneration
Committee and Member of Audit and Risk
Committee
William is the Principal of WM Associations, a
financial consulting and advisory firm with a
range of clients operating in the fast moving
consumer goods industries.
Other current Directorships:
Fisher Group Limited
(Appointed 23 October 2012)
Luxor Resources Limited
(Appointed 30 March 2014)
Leyton Supplies Limited
(Appointed 18 February 2015)
Previous Directorships (last 3 years):
Sketches Group Limited
(Appointed 15 March 2016;
Resigned 17 August 2017)
Interests in shares:
10,000 shares
Interest in options:
None
Example listed public financial statements For the year ended 31 December 2018
© 2019 Grant Thornton Australia Limited. All rights reserved. 3
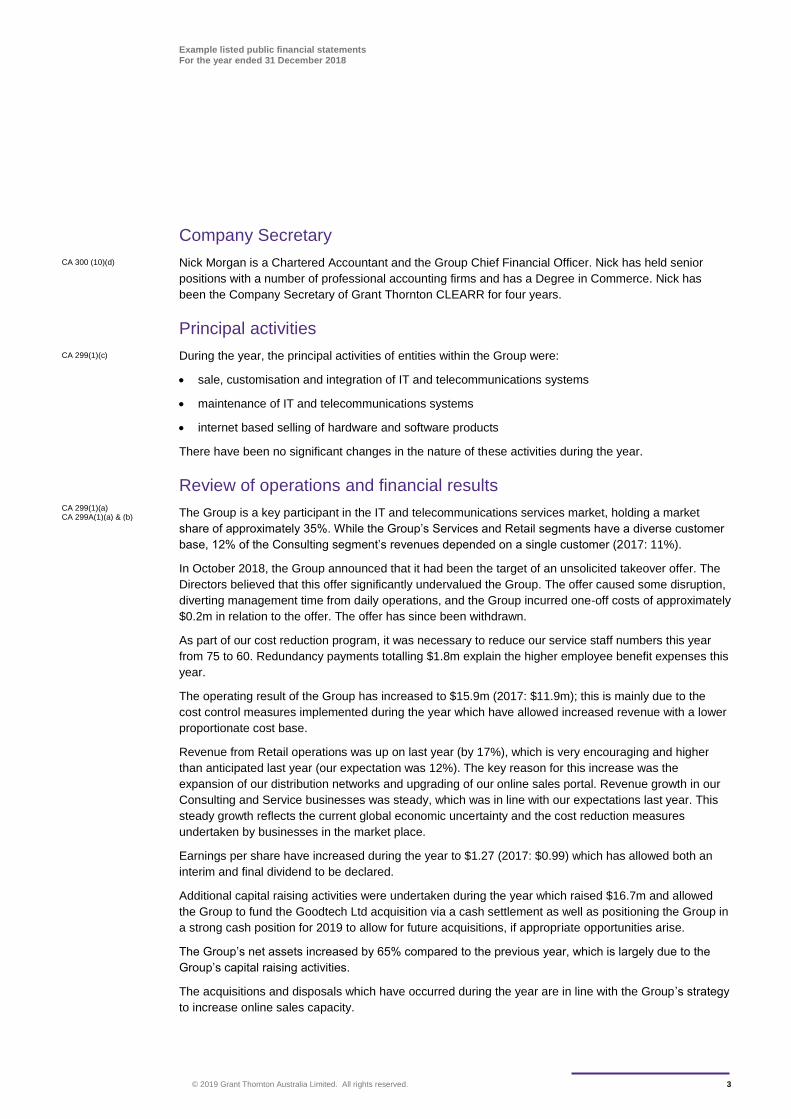
Company Secretary
Nick Morgan is a Chartered Accountant and the Group Chief Financial Officer. Nick has held senior
positions with a number of professional accounting firms and has a Degree in Commerce. Nick has
been the Company Secretary of Grant Thornton CLEARR for four years.
Principal activities
During the year, the principal activities of entities within the Group were:
sale, customisation and integration of IT and telecommunications systems
maintenance of IT and telecommunications systems
internet based selling of hardware and software products
There have been no significant changes in the nature of these activities during the year.
Review of operations and financial results
The Group is a key participant in the IT and telecommunications services market, holding a market
share of approximately 35%. While the Group’s Services and Retail segments have a diverse customer
base, 12% of the Consulting segment’s revenues depended on a single customer (2017: 11%).
In October 2018, the Group announced that it had been the target of an unsolicited takeover offer. The
Directors believed that this offer significantly undervalued the Group. The offer caused some disruption,
diverting management time from daily operations, and the Group incurred one-off costs of approximately
$0.2m in relation to the offer. The offer has since been withdrawn.
As part of our cost reduction program, it was necessary to reduce our service staff numbers this year
from 75 to 60. Redundancy payments totalling $1.8m explain the higher employee benefit expenses this
year.
The operating result of the Group has increased to $15.9m (2017: $11.9m); this is mainly due to the
cost control measures implemented during the year which have allowed increased revenue with a lower
proportionate cost base.
Revenue from Retail operations was up on last year (by 17%), which is very encouraging and higher
than anticipated last year (our expectation was 12%). The key reason for this increase was the
expansion of our distribution networks and upgrading of our online sales portal. Revenue growth in our
Consulting and Service businesses was steady, which was in line with our expectations last year. This
steady growth reflects the current global economic uncertainty and the cost reduction measures
undertaken by businesses in the market place.
Earnings per share have increased during the year to $1.27 (2017: $0.99) which has allowed both an
interim and final dividend to be declared.
Additional capital raising activities were undertaken during the year which raised $16.7m and allowed
the Group to fund the Goodtech Ltd acquisition via a cash settlement as well as positioning the Group in
a strong cash position for 2019 to allow for future acquisitions, if appropriate opportunities arise.
The Group’s net assets increased by 65% compared to the previous year, which is largely due to the
Group’s capital raising activities.
The acquisitions and disposals which have occurred during the year are in line with the Group’s strategy
to increase online sales capacity.
CA 300 (10)(d)
CA 299(1)(c)
CA 299(1)(a) CA 299A(1)(a) & (b)
Example listed public financial statements For the year ended 31 December 2018
© 2019 Grant Thornton Australia Limited. All rights reserved. 4
Goodwill of $2.4m arising on acquisition of Goodtech (as described below) is primarily related to growth
expectations, expected future profitability, the substantial skill and expertise of Goodtech’s workforce
and expected cost synergies.
The Chairman’s report contains further information on the detailed operations of the Group during the
year.
Significant changes in the state of affairs
During the year, the following changes occurred within the Group:
1 Acquisition of Goodtech Ltd:
on 31 March 2018, the Group acquired 100% of the equity instruments of Goodtech Ltd
(Goodtech), a Brisbane based business, thereby obtaining control. The acquisition was made to
enhance the Group’s position in the retail market for computer and telecommunications hardware
in Australia. Goodtech is a significant business in Australia in the Group’s targeted market. The
cost of the acquisition was $16.06m which was settled in cash
2 disposal of Highstreet Limited:
on 30 September 2018, the Group disposed of its 100% equity interest in its subsidiary,
Highstreet Limited. The subsidiary was classified as held for sale in the 2016 financial
statements. There was a loss on disposal of $29,000
3 issue of share capital:
on 30 September 2018, the Group issued 1,500,000 shares as part of its capital raising program
which resulted in proceeds of $16.7m, each share has the same terms and conditions as the
existing ordinary shares
Dividends
In respect of the current year, a fully franked interim dividend of $3,000,000 (25 cents per share) was
paid on 30 September 2018 (2017: $Nil).
In addition to the interim dividend and since the end of the financial year, Directors have declared a fully
franked final dividend of $6,885,000 (50 cents per share) to be paid on 15 April 2019 (2017: $Nil).
Events arising since the end of the reporting period
Apart from the final dividend declared, there are no other matters or circumstances that have arisen
since the end of the year that has significantly affected or may significantly affect either:
the entity’s operations in future financial years
the results of those operations in future financial years; or
the entity’s state of affairs in future financial years.
Likely developments, business strategies and prospects
Based on the expected growth in online sales, as predicted by a number of prominent economic
commentators, and the demand from customers for the latest technology, we expect significant increase
in online sales for next few years. We have a number of strategies to benefit from this growth, including:
upgrading our online sales portal
further expanding our distribution networks
CA 299(1)(b)
CA 300(1)(a)
CA 300(1)(b)
CA 299(1)(d)
CA 299(1)(d) CA 299(1)(c)
Example listed public financial statements For the year ended 31 December 2018
© 2019 Grant Thornton Australia Limited. All rights reserved. 5
further reducing manufacturing costs; and
a strong marketing campaign.
We have instigated an urgent upgrade of the Group’s website and online sales portal. We have
allocated $3.8m for this upgrade, which will mostly be funded from retained earnings. We expect the
upgrade to be completed in the next 12 months, to be followed by a strong marketing campaign.
We are continually considering ways of reducing the Group’s cost of manufacturing. The Directors are
giving consideration to a major upgrade of production-line technology to improve efficiency. The
Directors expect to receive the results of a feasibility study within the next six months, and the various
options will be considered at that time.
Looking ahead, the Group is currently engaged in a competitive tender process to supply the Australian
government $100m IT and telecommunication systems and offer integration and maintenance services
over the next 10 years. If successful, manufacture and supply are expected to commence next year,
significantly affecting future revenues. Given both the competitive nature of the tender, and the fact that
the process is ongoing, we have utilised the exemption in s299A(3) and have not disclosed further
details about the possible impact of the potential contract on the Group’s business strategy and future
prospects. We are relying on the exemption on the basis that disclosure of the potential financial impact
on the Group arising from the outcome of the tender process is premature, and would be likely to result
in other tender competitors gaining a commercial advantage, which would jeopardise the Group’s
prospects.
The material business risks faced by the Group that are likely to have an effect on the financial
prospects of the Group, and how the Group manages these risks include:
1 Reduction in demand from overseas markets: given our reliance on the United Kingdom, USA
and other overseas markets, this could have a significant impact on our financial results. Based on
the views of prominent economic commentators, we do not anticipate any significant slowdown in
these overseas economies for the next few years, but are currently investigating the option of
expanding our sales into other emerging economies, such as China and India; and
2 Technological obsolescence: given the rapidly changing environment in which the Group
operates, this could have a very significant impact on our financial results. We address this risk
through investment in research and development and by constantly monitoring the market. With
competitors constantly seeking to enter our market with improved designs, we see this risk
increasing in the future.
Directors’ meetings
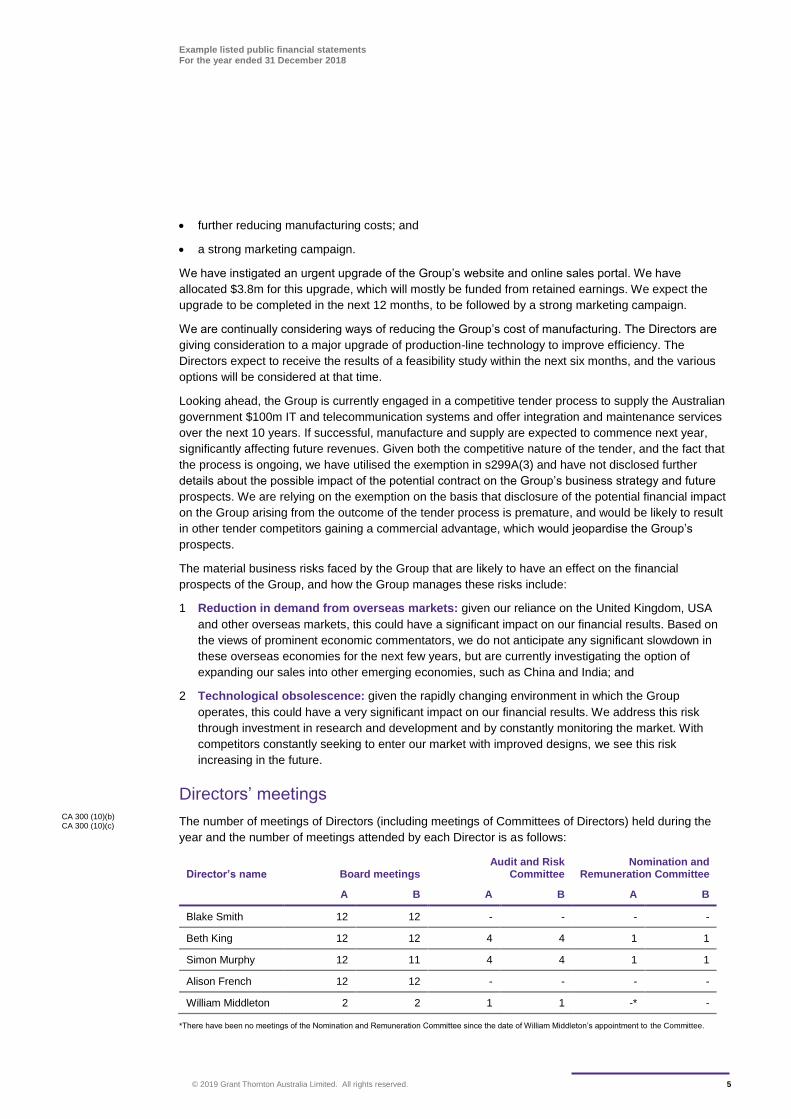
The number of meetings of Directors (including meetings of Committees of Directors) held during the
year and the number of meetings attended by each Director is as follows:
Director’s name Board meetings Audit and Risk
Committee Nomination and
Remuneration Committee
A B A B A B
Blake Smith 12 12 - - - -
Beth King 12 12 4 4 1 1
Simon Murphy 12 11 4 4 1 1
Alison French 12 12 - - - -
William Middleton 2 2 1 1 -* -
*There have been no meetings of the Nomination and Remuneration Committee since the date of William Middleton’s appointment to the Committee.
CA 300 (10)(b) CA 300 (10)(c)

Example listed public financial statements For the year ended 31 December 2018
© 2019 Grant Thornton Australia Limited. All rights reserved. 6
Where:
column A: is the number of meetings the Director was entitled to attend
column B: is the number of meetings the Director attended
Unissued shares under option
Unissued ordinary shares of Grant Thornton CLEARR under option at the date of this report are:
Date options granted Expiry date Exercise price of shares ($) Number under option
5 January 2014 4 January 2019 5.74 90,749
1 January 2015 31 December 2019 6.24 29,175
1 February 2018 31 December 2022 7.61 100,000
219,924
All options expire on the earlier of their expiry date or termination of the employee’s employment. These
options were issued under either the Star or Stay Program (described in Note 23.2 to the financial
statements) and have been allotted to individuals on condition that they serve specified time periods as
an employee of the Group before becoming entitled to exercise the options. These options do not entitle
the holder to participate in any share issue of the Company.
Shares issued during or since the end of the year as a result of exercise
During or since the end of the financial year, the Company issued ordinary shares as a result of the
exercise of options as follows (there were no amounts unpaid on the shares issued):
Date options granted Issue price of shares ($) Number of shares issued
1 January 2016 6.24 270,000
Remuneration Report (audited)
The Directors of Grant Thornton CLEARR Example Ltd (the Group) present the Remuneration Report
for Non-Executive Directors, Executive Directors and other Key Management Personnel, prepared in
accordance with the Corporations Act 2001 and the Corporations Regulations 2001.
The Remuneration Report is set out under the following main headings:
a Principles used to determine the nature and amount of remuneration
b Details of remuneration
c Service agreements
d Share-based remuneration; and
e Other information
a Principles used to determine the nature and amount of remuneration
The principles of the Group’s executive strategy and supporting incentive programs and frameworks
are:
to align rewards to business outcomes that deliver value to shareholders
CA 300 (1)(d) CA 300 (1)(e)
CA 300(1)(f)
CA 300(1)
CA 300(1)(a)
Example listed public financial statements For the year ended 31 December 2018
© 2019 Grant Thornton Australia Limited. All rights reserved. 7
to drive a high performance culture by setting challenging objectives and rewarding high performing
individuals; and
to ensure remuneration is competitive in the relevant employment market place to support the
attraction, motivation and retention of executive talent
Grant Thornton CLEARR has structured a remuneration framework that is market competitive and
complementary to the reward strategy of the Group.
The Board has established a Nomination and Remuneration Committee which operates in accordance
with its charter as approved by the Board and is responsible for determining and reviewing
compensation arrangements for the Directors and the Executive Team.
The Committee has engaged independent remuneration consultants to provide any necessary
information to assist in the discharge of its responsibilities (refer to the disclosures below).
The remuneration structure that has been adopted by the Group consists of the following components:
fixed remuneration being annual salary; and
short term incentives, being employee share schemes and bonuses
The Nomination and Remuneration Committee assess the appropriateness of the nature and amount of
remuneration on a periodic basis by reference to recent employment market conditions with the overall
objective of ensuring maximum stakeholder benefit from the retention of a high quality Board and
Executive Team.
The payment of bonuses, share options and other incentive payments are reviewed by the Nomination
and Remuneration Committee annually as part of the review of executive remuneration and a
recommendation is put to the Board for approval. All bonuses, options and incentives must be linked to
pre-determined performance criteria.
Short Term Incentive (STI)
Grant Thornton CLEARR performance measures involve the use of annual performance objectives,
metrics, performance appraisals and continuing emphasis on living the Company values.
The performance measures are set annually after consultation with the Directors and executives and
are specifically tailored to the areas where each executive has a level of control. The measures target
areas the Board believes hold the greatest potential for expansion and profit and cover financial and
non-financial measures.
The Key Performance Indicators (KPIs) for the Executive Team are summarised as follows:
Performance areas
financial: operating profit and earnings per share; and
non-financial: strategic goals set by each individual business unit based on job descriptions
The STI Program incorporates both cash and share-based components for the Executive Team and
other employees.
The Board may, at its discretion, award bonuses for exceptional performance in relation to each
person’s pre-agreed KPIs.
Use of remuneration consultants
Grant Thornton CLEARR Example Ltd Nomination and Remuneration Committee employed the
services of ABC Remuneration Consulting Pty Ltd to review and to provide recommendations in respect
CA 300A(1)(ba) Corp Regs 2M 3.03(1)(Item 12(c))
CA 300(1)(h)
Example listed public financial statements For the year ended 31 December 2018
© 2019 Grant Thornton Australia Limited. All rights reserved. 8
of the amount and elements of executive remuneration, including short-term and long-term incentive
plan design.
Under the terms of the engagement, ABC Remuneration Consulting Pty Ltd provided remuneration
recommendations as defined in section 9B of the Corporations Act 2001 and was paid $43,400 for these
services.
ABC Remuneration Consulting Pty Ltd has confirmed that the above recommendations have been
made free from undue influence by members of the Group’s key management personnel.
ABC Remuneration Consulting Pty Ltd was engaged by, and reported directly to, the Chair of the
Nomination and Remuneration Committee. The agreement for the provision of remuneration consulting
services was executed by the Chair of the Nomination and Remuneration Committee under delegated
authority on behalf of the Board.
The report containing the remuneration recommendations was provided by ABC Remuneration
Consulting Pty Ltd directly to the chair of the Nomination and Remuneration Committee.
ABC Remuneration Consulting Pty Ltd was permitted to speak to management throughout the
engagement to understand Company processes, practices and other business issues and obtain
management perspectives. However, ABC Remuneration Consulting Pty Ltd was not permitted to
provide any advice or recommendations to members of management before advice or
recommendations was given to members of the Nomination and Remuneration Committee and not
unless ABC Remuneration Consulting Pty Ltd had approval to do so from members of the Nomination
and Remuneration Committee.
As a consequence, the Board is satisfied that the recommendations were made free from undue
influence from any members of the key management personnel.
In addition to providing remuneration recommendations, ABC Remuneration Consulting Pty Ltd also
provided advice on other aspects of the remuneration of the Group’s employees. For these services
ABC Remuneration Consulting Pty Ltd was paid a total of $26,200.
Voting and comments made at the Company’s last Annual General Meeting
Grant Thornton CLEARR Example Ltd received 92% of ‘yes’ votes on its Remuneration Report for the
financial year ending 31 December 2017. The Company received no specific feedback on its
Remuneration Report at the Annual General Meeting.
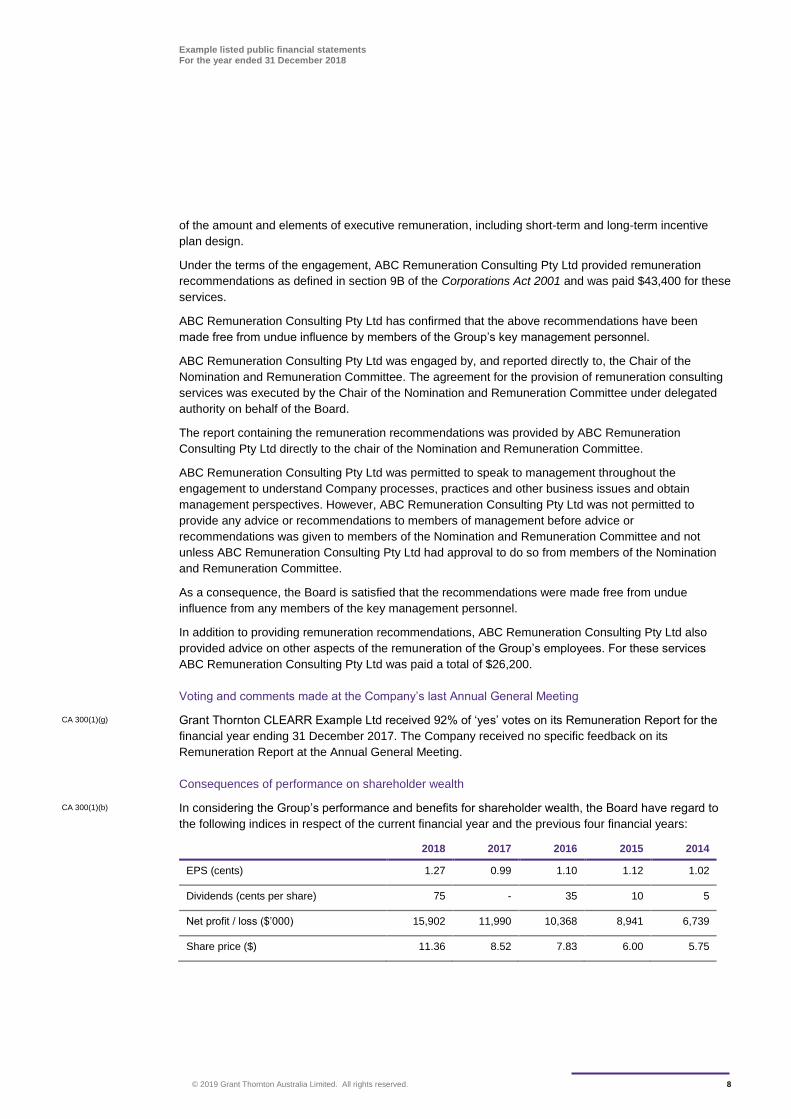
Consequences of performance on shareholder wealth
In considering the Group’s performance and benefits for shareholder wealth, the Board have regard to
the following indices in respect of the current financial year and the previous four financial years:
2018 2017 2016 2015 2014
EPS (cents) 1.27 0.99 1.10 1.12 1.02
Dividends (cents per share) 75 - 35 10 5
Net profit / loss ($’000) 15,902 11,990 10,368 8,941 6,739
Share price ($) 11.36 8.52 7.83 6.00 5.75
CA 300(1)(g)
CA 300(1)(b)
Example listed public financial statements For the year ended 31 December 2018
© 2019 Grant Thornton Australia Limited. All rights reserved. 9
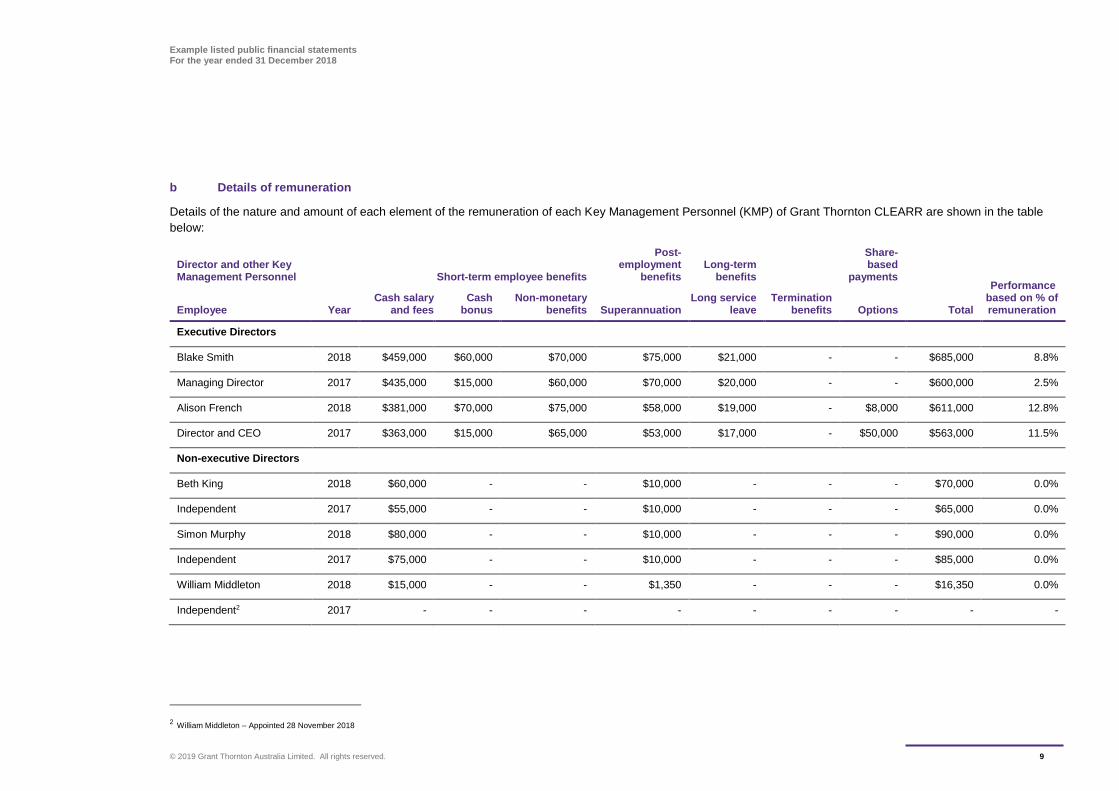
b Details of remuneration
Details of the nature and amount of each element of the remuneration of each Key Management Personnel (KMP) of Grant Thornton CLEARR are shown in the table
below:
Director and other Key Management Personnel
Short-term employee benefits
Post-employment
benefits
Long-term
benefits
Share-based
payments
Performance based on % of remuneration Employee Year
Cash salary and fees
Cash bonus
Non-monetary benefits Superannuation
Long service leave
Termination benefits Options Total
Executive Directors
Blake Smith 2018 $459,000 $60,000 $70,000 $75,000 $21,000 - - $685,000 8.8%
Managing Director 2017 $435,000 $15,000 $60,000 $70,000 $20,000 - - $600,000 2.5%
Alison French 2018 $381,000 $70,000 $75,000 $58,000 $19,000 - $8,000 $611,000 12.8%
Director and CEO 2017 $363,000 $15,000 $65,000 $53,000 $17,000 - $50,000 $563,000 11.5%
Non-executive Directors
Beth King 2018 $60,000 - - $10,000 - - - $70,000 0.0%
Independent 2017 $55,000 - - $10,000 - - - $65,000 0.0%
Simon Murphy 2018 $80,000 - - $10,000 - - - $90,000 0.0%
Independent 2017 $75,000 - - $10,000 - - - $85,000 0.0%
William Middleton 2018 $15,000 - - $1,350 - - - $16,350 0.0%
Independent2 2017 - - - - - - - - -
2 William Middleton – Appointed 28 November 2018
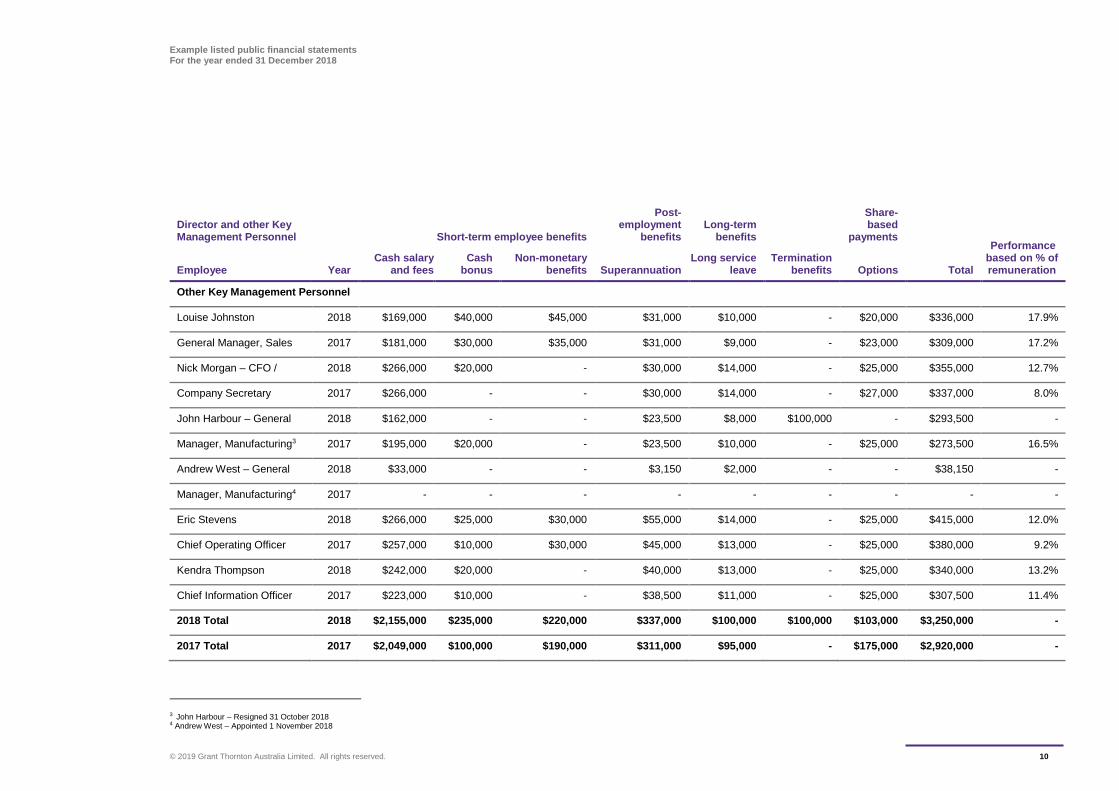
Example listed public financial statements For the year ended 31 December 2018
© 2019 Grant Thornton Australia Limited. All rights reserved. 10
Director and other Key Management Personnel
Short-term employee benefits
Post-employment
benefits Long-term
benefits
Share-based
payments Performance
based on % of remuneration Employee Year
Cash salary and fees
Cash bonus
Non-monetary benefits Superannuation
Long service leave
Termination benefits Options Total
Other Key Management Personnel
Louise Johnston 2018 $169,000 $40,000 $45,000 $31,000 $10,000 - $20,000 $336,000 17.9%
General Manager, Sales 2017 $181,000 $30,000 $35,000 $31,000 $9,000 - $23,000 $309,000 17.2%
Nick Morgan – CFO / 2018 $266,000 $20,000 - $30,000 $14,000 - $25,000 $355,000 12.7%
Company Secretary 2017 $266,000 - - $30,000 $14,000 - $27,000 $337,000 8.0%
John Harbour – General 2018 $162,000 - - $23,500 $8,000 $100,000 - $293,500 -
Manager, Manufacturing3 2017 $195,000 $20,000 - $23,500 $10,000 - $25,000 $273,500 16.5%
Andrew West – General 2018 $33,000 - - $3,150 $2,000 - - $38,150 -
Manager, Manufacturing4 2017 - - - - - - - - -
Eric Stevens 2018 $266,000 $25,000 $30,000 $55,000 $14,000 - $25,000 $415,000 12.0%
Chief Operating Officer 2017 $257,000 $10,000 $30,000 $45,000 $13,000 - $25,000 $380,000 9.2%
Kendra Thompson 2018 $242,000 $20,000 - $40,000 $13,000 - $25,000 $340,000 13.2%
Chief Information Officer 2017 $223,000 $10,000 - $38,500 $11,000 - $25,000 $307,500 11.4%
2018 Total 2018 $2,155,000 $235,000 $220,000 $337,000 $100,000 $100,000 $103,000 $3,250,000 -
2017 Total 2017 $2,049,000 $100,000 $190,000 $311,000 $95,000 - $175,000 $2,920,000 -
3 John Harbour – Resigned 31 October 2018 4 Andrew West – Appointed 1 November 2018
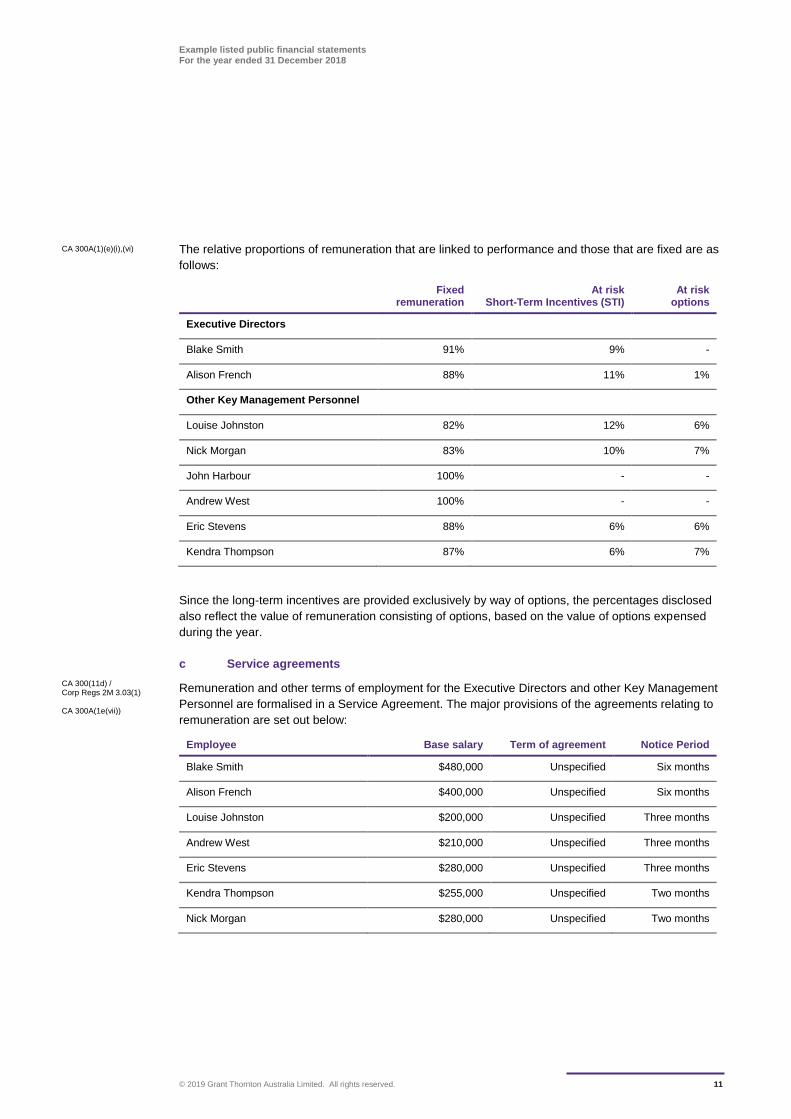
Example listed public financial statements For the year ended 31 December 2018
© 2019 Grant Thornton Australia Limited. All rights reserved. 11
The relative proportions of remuneration that are linked to performance and those that are fixed are as
follows:
Fixed remuneration
At risk Short-Term Incentives (STI)
At risk options
Executive Directors
Blake Smith 91% 9% -
Alison French 88% 11% 1%
Other Key Management Personnel
Louise Johnston 82% 12% 6%
Nick Morgan 83% 10% 7%
John Harbour 100% - -
Andrew West 100% - -
Eric Stevens 88% 6% 6%
Kendra Thompson 87% 6% 7%
Since the long-term incentives are provided exclusively by way of options, the percentages disclosed
also reflect the value of remuneration consisting of options, based on the value of options expensed
during the year.
c Service agreements
Remuneration and other terms of employment for the Executive Directors and other Key Management
Personnel are formalised in a Service Agreement. The major provisions of the agreements relating to
remuneration are set out below:
Employee Base salary Term of agreement Notice Period
Blake Smith $480,000 Unspecified Six months
Alison French $400,000 Unspecified Six months
Louise Johnston $200,000 Unspecified Three months
Andrew West $210,000 Unspecified Three months
Eric Stevens $280,000 Unspecified Three months
Kendra Thompson $255,000 Unspecified Two months
Nick Morgan $280,000 Unspecified Two months
CA 300A(1)(e)(i),(vi)
CA 300(11d) / Corp Regs 2M 3.03(1) CA 300A(1e(vii))
Example listed public financial statements For the year ended 31 December 2018
© 2019 Grant Thornton Australia Limited. All rights reserved. 12
d Share-based remuneration
All options refer to options over ordinary shares of the Company, which are exercisable on a one-for-
one basis under the terms of the agreements.
Options granted to the Executive Team are under the Star Program. Options will vest subject to the
achievement of the following total shareholder return performance condition.
If the Company’s total shareholder return (representing dividend per share plus increase in the share
price) is in the top quartile of companies in the ASX 200 Index (the Index) over the vesting period, the
full number of options will vest.
For performance between median and upper quartile, vesting will occur on a straight-line basis so that
25% of the options vest for median performance and full vesting occurs for top quartile performance.
No options will vest if the total shareholder return is below the median in the Index. In addition, persons
eligible to participate in this programme have to be employed until the end of the arranged vesting
period.
Upon vesting, each option allows the holder to purchase one ordinary share at a discount of 20-25% of
the market price determined at grant date.
Options granted under the Star Program carry no dividends or voting rights and when exercisable.
Each option is convertible into one ordinary share.
CA 300A(1ba) Corp Regs 2M 3.03(1)(item 12(c))
Example listed public financial statements For the year ended 31 December 2018
© 2019 Grant Thornton Australia Limited. All rights reserved. 13
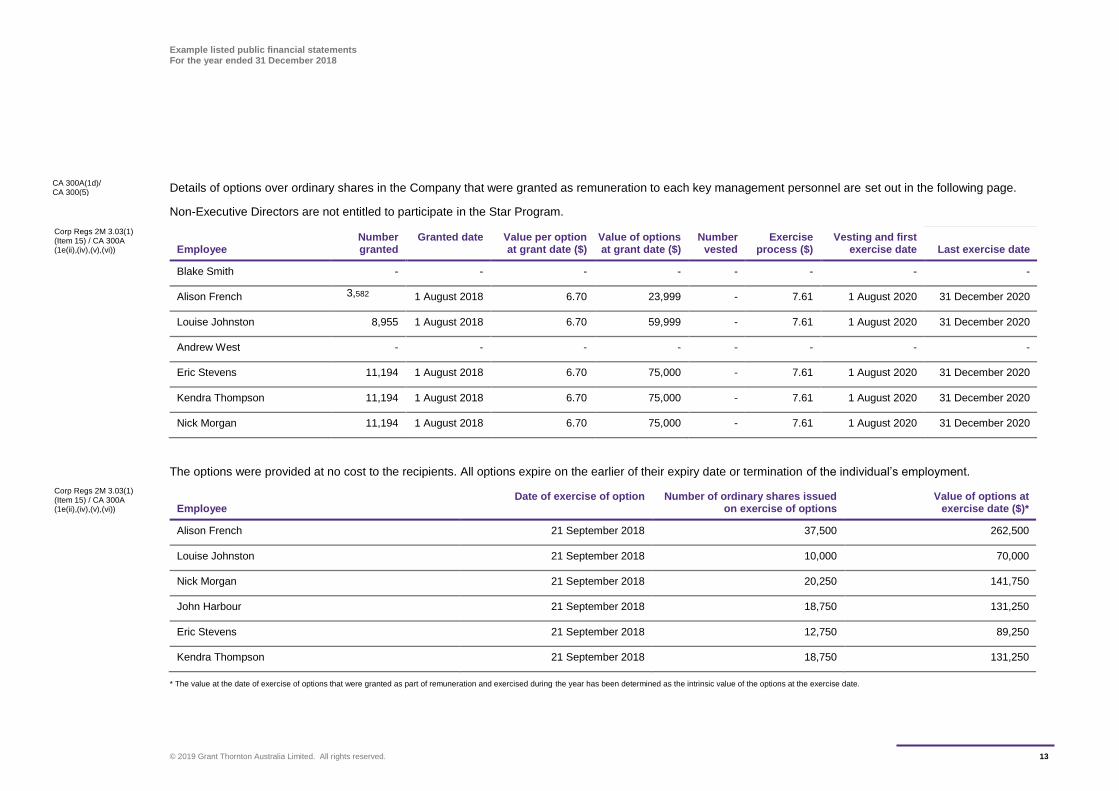
Details of options over ordinary shares in the Company that were granted as remuneration to each key management personnel are set out in the following page.
Non-Executive Directors are not entitled to participate in the Star Program.
Corp Regs 2M 3.03(1) (Item 15) / CA 300A (1e(ii),(iv),(v),(vi)) Employee
Number granted
Granted date Value per option at grant date ($)
Value of options at grant date ($)
Number vested
Exercise process ($)
Vesting and first exercise date
Last exercise date
Blake Smith - - - - - - - -
Alison French 3,582 1 August 2018 6.70 23,999 - 7.61 1 August 2020 31 December 2020
Louise Johnston 8,955 1 August 2018 6.70 59,999 - 7.61 1 August 2020 31 December 2020
Andrew West - - - - - - - -
Eric Stevens 11,194 1 August 2018 6.70 75,000 - 7.61 1 August 2020 31 December 2020
Kendra Thompson 11,194 1 August 2018 6.70 75,000 - 7.61 1 August 2020 31 December 2020
Nick Morgan 11,194 1 August 2018 6.70 75,000 - 7.61 1 August 2020 31 December 2020
The options were provided at no cost to the recipients. All options expire on the earlier of their expiry date or termination of the individual’s employment.
Corp Regs 2M 3.03(1) (Item 15) / CA 300A (1e(ii),(iv),(v),(vi)) Employee
Date of exercise of option Number of ordinary shares issued on exercise of options
Value of options at exercise date ($)*
Alison French 21 September 2018 37,500 262,500
Louise Johnston 21 September 2018 10,000 70,000
Nick Morgan 21 September 2018 20,250 141,750
John Harbour 21 September 2018 18,750 131,250
Eric Stevens 21 September 2018 12,750 89,250
Kendra Thompson 21 September 2018 18,750 131,250
* The value at the date of exercise of options that were granted as part of remuneration and exercised during the year has been determined as the intrinsic value of the options at the exercise date.
CA 300A(1d)/ CA 300(5)
Example listed public financial statements For the year ended 31 December 2018
© 2019 Grant Thornton Australia Limited. All rights reserved. 14
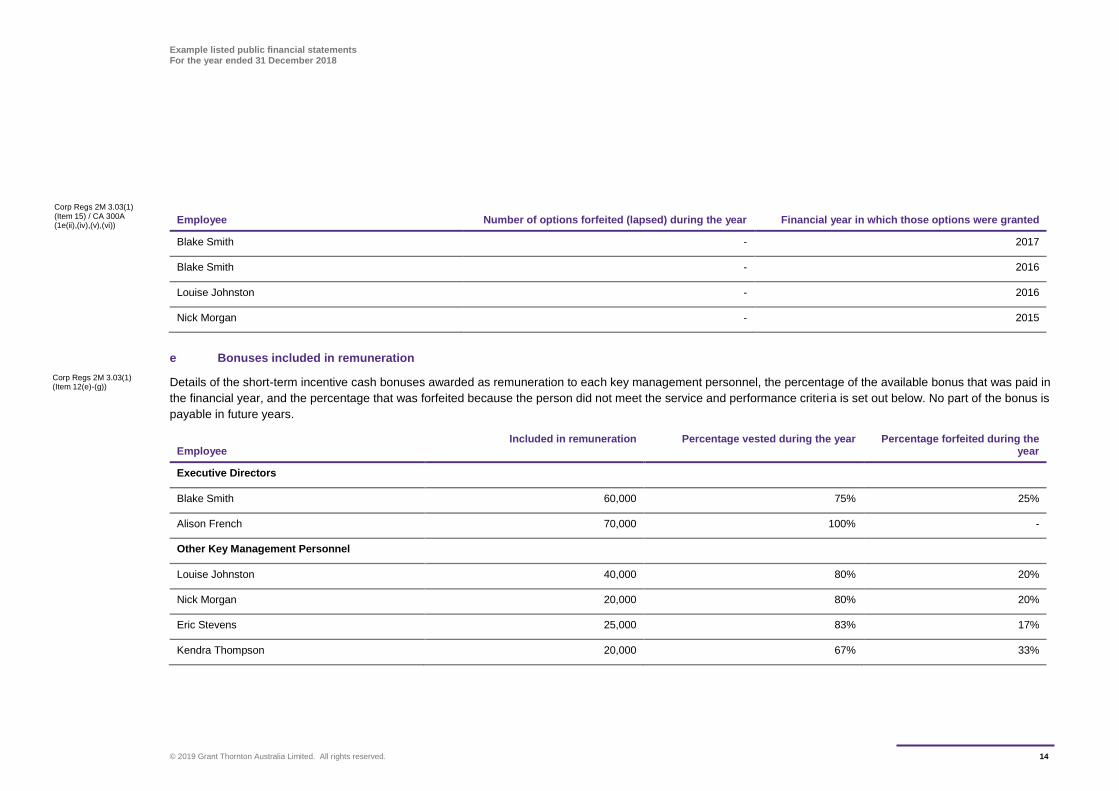
Corp Regs 2M 3.03(1) (Item 15) / CA 300A (1e(ii),(iv),(v),(vi)) Employee Number of options forfeited (lapsed) during the year Financial year in which those options were granted
Blake Smith - 2017
Blake Smith - 2016
Louise Johnston - 2016
Nick Morgan - 2015
e Bonuses included in remuneration
Details of the short-term incentive cash bonuses awarded as remuneration to each key management personnel, the percentage of the available bonus that was paid in
the financial year, and the percentage that was forfeited because the person did not meet the service and performance criteria is set out below. No part of the bonus is
payable in future years.
Employee Included in remuneration Percentage vested during the year Percentage forfeited during the
year
Executive Directors
Blake Smith 60,000 75% 25%
Alison French 70,000 100% -
Other Key Management Personnel
Louise Johnston 40,000 80% 20%
Nick Morgan 20,000 80% 20%
Eric Stevens 25,000 83% 17%
Kendra Thompson 20,000 67% 33%
Corp Regs 2M 3.03(1) (Item 12(e)-(g))
Example listed public financial statements For the year ended 31 December 2018
© 2019 Grant Thornton Australia Limited. All rights reserved. 15
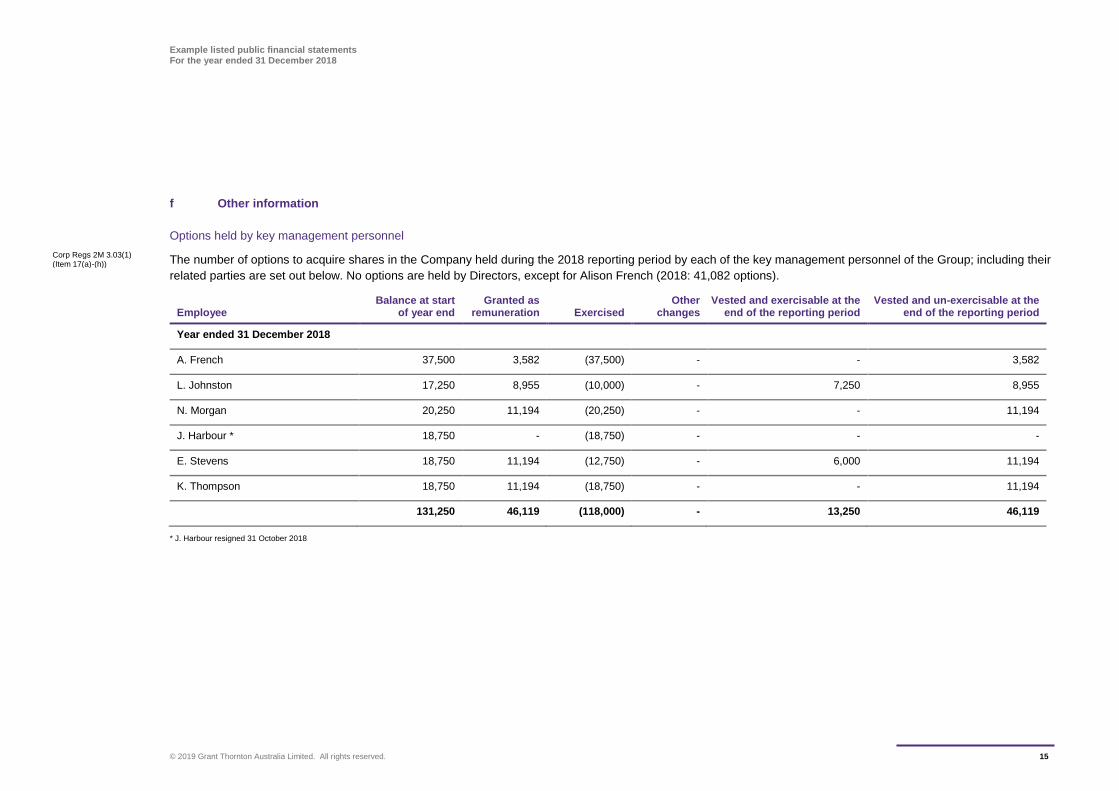
f Other information
Options held by key management personnel
The number of options to acquire shares in the Company held during the 2018 reporting period by each of the key management personnel of the Group; including their
related parties are set out below. No options are held by Directors, except for Alison French (2018: 41,082 options).
Employee Balance at start
of year end Granted as
remuneration Exercised Other
changes Vested and exercisable at the
end of the reporting period Vested and un-exercisable at the
end of the reporting period
Year ended 31 December 2018
A. French 37,500 3,582 (37,500) - - 3,582
L. Johnston 17,250 8,955 (10,000) - 7,250 8,955
N. Morgan 20,250 11,194 (20,250) - - 11,194
J. Harbour * 18,750 - (18,750) - - -
E. Stevens 18,750 11,194 (12,750) - 6,000 11,194
K. Thompson 18,750 11,194 (18,750) - - 11,194
131,250 46,119 (118,000) - 13,250 46,119
* J. Harbour resigned 31 October 2018
Corp Regs 2M 3.03(1) (Item 17(a)-(h))
Example listed public financial statements For the year ended 31 December 2018
© 2019 Grant Thornton Australia Limited. All rights reserved. 16
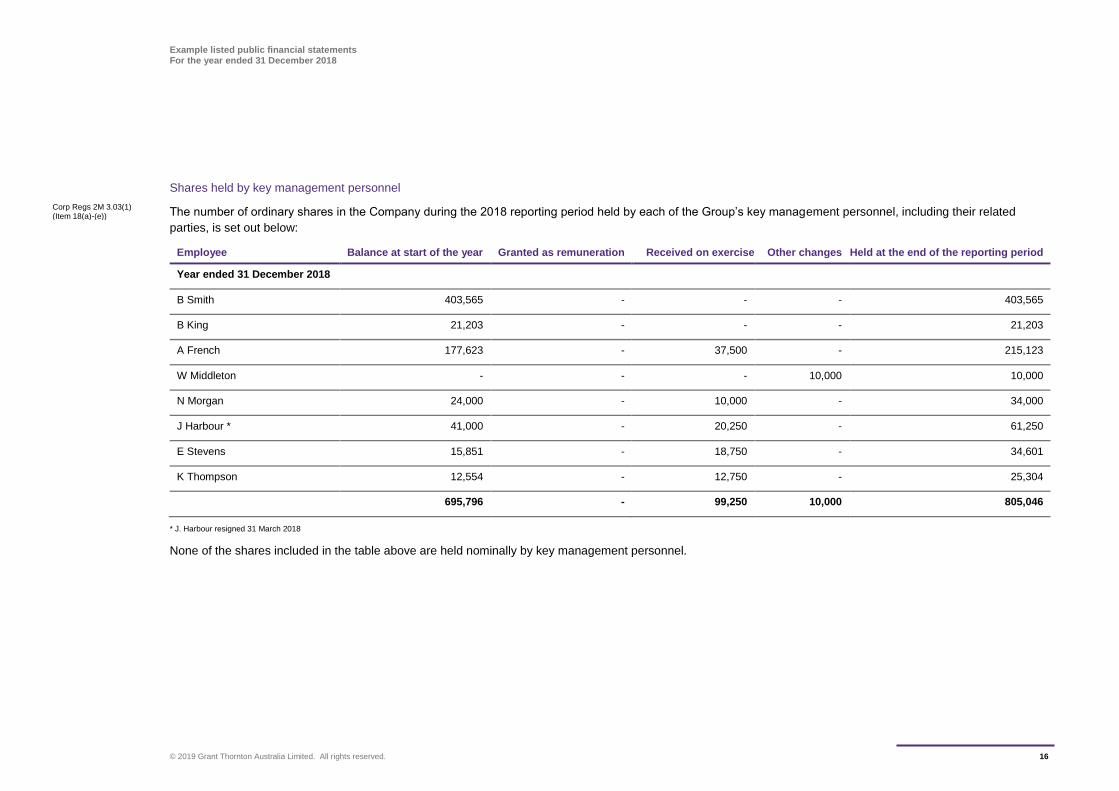
Shares held by key management personnel
The number of ordinary shares in the Company during the 2018 reporting period held by each of the Group’s key management personnel, including their related
parties, is set out below:
Employee Balance at start of the year Granted as remuneration Received on exercise Other changes Held at the end of the reporting period
Year ended 31 December 2018
B Smith 403,565 - - - 403,565
B King 21,203 - - - 21,203
A French 177,623 - 37,500 - 215,123
W Middleton - - - 10,000 10,000
N Morgan 24,000 - 10,000 - 34,000
J Harbour * 41,000 - 20,250 - 61,250
E Stevens 15,851 - 18,750 - 34,601
K Thompson 12,554 - 12,750 - 25,304
695,796 - 99,250 10,000 805,046
* J. Harbour resigned 31 March 2018
None of the shares included in the table above are held nominally by key management personnel.
Corp Regs 2M 3.03(1) (Item 18(a)-(e))
Example listed public financial statements For the year ended 31 December 2018
© 2019 Grant Thornton Australia Limited. All rights reserved. 17
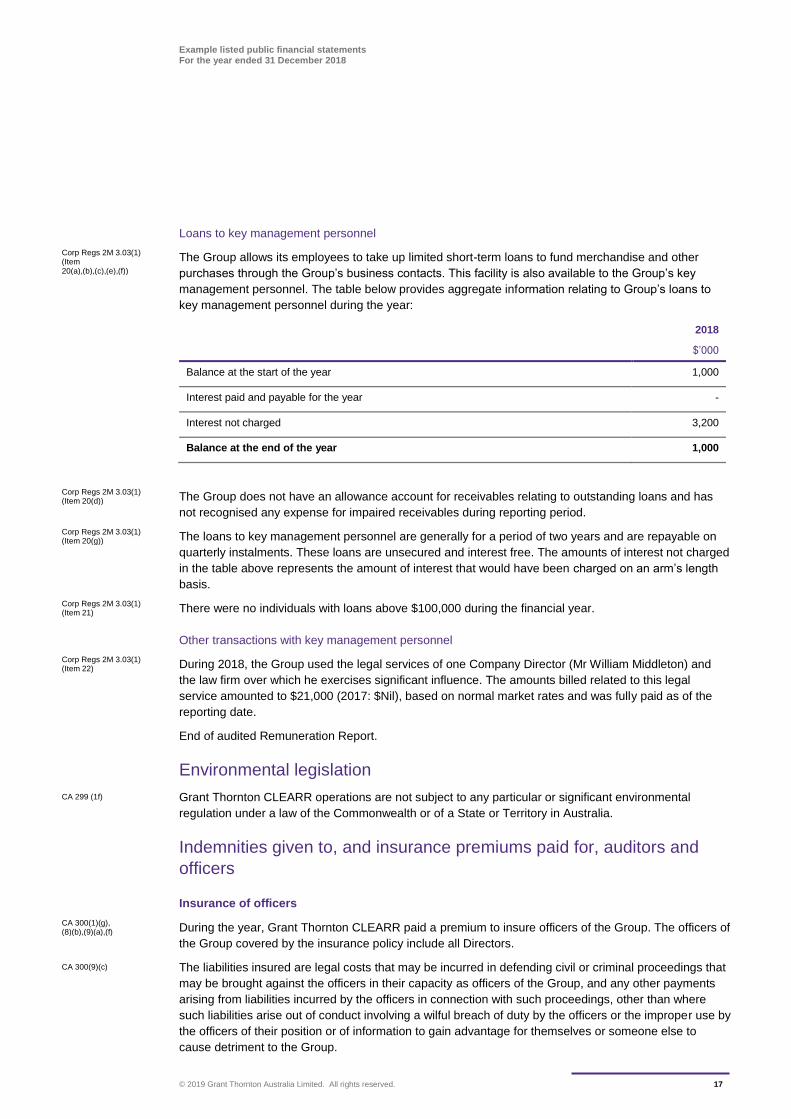
Loans to key management personnel
The Group allows its employees to take up limited short-term loans to fund merchandise and other
purchases through the Group’s business contacts. This facility is also available to the Group’s key
management personnel. The table below provides aggregate information relating to Group’s loans to
key management personnel during the year:
2018
$’000
Balance at the start of the year 1,000
Interest paid and payable for the year -
Interest not charged 3,200
Balance at the end of the year 1,000
The Group does not have an allowance account for receivables relating to outstanding loans and has
not recognised any expense for impaired receivables during reporting period.
The loans to key management personnel are generally for a period of two years and are repayable on
quarterly instalments. These loans are unsecured and interest free. The amounts of interest not charged
in the table above represents the amount of interest that would have been charged on an arm’s length
basis.
There were no individuals with loans above $100,000 during the financial year.
Other transactions with key management personnel
During 2018, the Group used the legal services of one Company Director (Mr William Middleton) and
the law firm over which he exercises significant influence. The amounts billed related to this legal
service amounted to $21,000 (2017: $Nil), based on normal market rates and was fully paid as of the
reporting date.
End of audited Remuneration Report.
Environmental legislation
Grant Thornton CLEARR operations are not subject to any particular or significant environmental
regulation under a law of the Commonwealth or of a State or Territory in Australia.
Indemnities given to, and insurance premiums paid for, auditors and
officers
Insurance of officers
During the year, Grant Thornton CLEARR paid a premium to insure officers of the Group. The officers of
the Group covered by the insurance policy include all Directors.
The liabilities insured are legal costs that may be incurred in defending civil or criminal proceedings that
may be brought against the officers in their capacity as officers of the Group, and any other payments
arising from liabilities incurred by the officers in connection with such proceedings, other than where
such liabilities arise out of conduct involving a wilful breach of duty by the officers or the improper use by
the officers of their position or of information to gain advantage for themselves or someone else to
cause detriment to the Group.
Corp Regs 2M 3.03(1) (Item 20(a),(b),(c),(e),(f))
Corp Regs 2M 3.03(1) (Item 20(d))
Corp Regs 2M 3.03(1) (Item 20(g))
Corp Regs 2M 3.03(1) (Item 21)
Corp Regs 2M 3.03(1) (Item 22)
CA 299 (1f)
CA 300(1)(g), (8)(b),(9)(a),(f)
CA 300(9)(c)
Example listed public financial statements For the year ended 31 December 2018
© 2019 Grant Thornton Australia Limited. All rights reserved. 18
Details of the amount of the premium paid in respect of insurance policies are not disclosed as such
disclosure is prohibited under the terms of the contract.
The Group has not otherwise, during or since the end of the financial year, except to the extent
permitted by law, indemnified or agreed to indemnify any current or former officer of the Group against a
liability incurred as such by an officer.
Indemnity of auditors
The Group has agreed to indemnify its auditors, Grant Thornton, to the extent permitted by law, against
any claim by a third party arising from the Group’s breach of its agreement. The indemnity requires the
Group to meet the full amount of any such liabilities including a reasonable amount of legal costs.
Non-audit services
During the year, Grant Thornton, the Company’s auditors, performed certain other services in addition to
their statutory audit duties.
The Board has considered the non-audit services provided during the year by the auditor and, in
accordance with written advice provided by resolution of the Audit and Risk Committee, is satisfied that
the provision of those non-audit services during the year is compatible with, and did not compromise,
the auditor independence requirements of the Corporations Act 2001 for the following reasons:
all non-audit services were subject to the corporate governance procedures adopted by the
Company and have been reviewed by the Audit and Risk Committee to ensure they do not impact
upon the impartiality and objectivity of the auditor
the non-audit services do not undermine the general principles relating to auditor independence as
set out in APES 110 Code of Ethics for Professional Accountants, as they did not involve reviewing
or auditing the auditor’s own work, acting in a management or decision-making capacity for the
Company, acting as an advocate for the Company or jointly sharing risks and rewards
Details of the amounts paid to the auditors of the Company, Grant Thornton, and its related practices for
audit and non-audit services provided during the year are set out in Note 27 to the financial statements.
Proceedings of behalf of the Company
No person has applied to the Court under section 237 of the Corporations Act 2001 for leave to bring
proceedings on behalf of the Company, or to intervene in any proceedings to which the Company is a
party, for the purpose of taking responsibility on behalf of the Company for all or part of those
proceedings.
CA 300(1)(g),(8)(b), (9)(a),(f)
CA 300(11B)/(11C)
CA 300(14) / (15)
Example listed public financial statements For the year ended 31 December 2018
© 2019 Grant Thornton Australia Limited. All rights reserved. 19
Rounding of amounts
Grant Thornton CLEARR is a type of Company referred to in ASIC Corporations (Rounding in
Financial/Directors’ Reports) Instrument 2016/191 and therefore the amounts contained in this report
and in the financial report have been rounded to the nearest $1,000, or in certain cases, to the nearest
dollar.
Auditors Independence Declaration
A copy of the Auditor’s Independence Declaration as required under s307C of the Corporations Act
2001 is included on page 20 of this financial report and forms part of this Directors’ Report.
Signed in accordance with a resolution of the Directors.
Blake Smith
Director
28 February 2019
ASIC Corporations (Rounding in Financial/ Directors’ Reports) Instrument 2016/191
CA 307C
CA 298 (2a)
CA 298 (2c)
CA 298 (2b)
Grant Thornton Audit Pty Ltd
Level 17 383 Kent Street Sydney, NSW 2000
T +61 2 8297 2400 F +61 2 9299 4445
Example listed public financial statements For the year ended 31 December 2018
© 2019 Grant Thornton Australia Limited. All rights reserved. 20
Grant Thornton Audit Pty Ltd ACN 130 913 594 a subsidiary or related entity of Grant Thornton Australia Ltd ABN 41 127 556 389 ‘Grant Thornton’ refers to the brand under which the Grant Thornton member firms provide assurance, tax and advisory services to their clients and/or refers to one or more member firms, as the context requires. Grant Thornton Australia Ltd is a member firm of Grant Thornton International Ltd (GTIL). GTIL and the member firms are not a worldwide partnership. GTIL and each member firm is a separate legal entity. Services are delivered by the member firms. GTIL does not provide services to clients. GTIL and its member firms are not agents of, and do not obligate one another and are not liable for one another’s acts or omissions. In the Australian context only, the use of the term ‘Grant Thornton’ may refer to Grant Thornton Australia Limited ABN 41 127 556 389 and its Australian subsidiaries and related entities. GTIL is not an Australian related entity to Grant Thornton Australia Limited.
Liability limited by a scheme approved under Professional Standards Legislation.
www.grantthornton.com.au
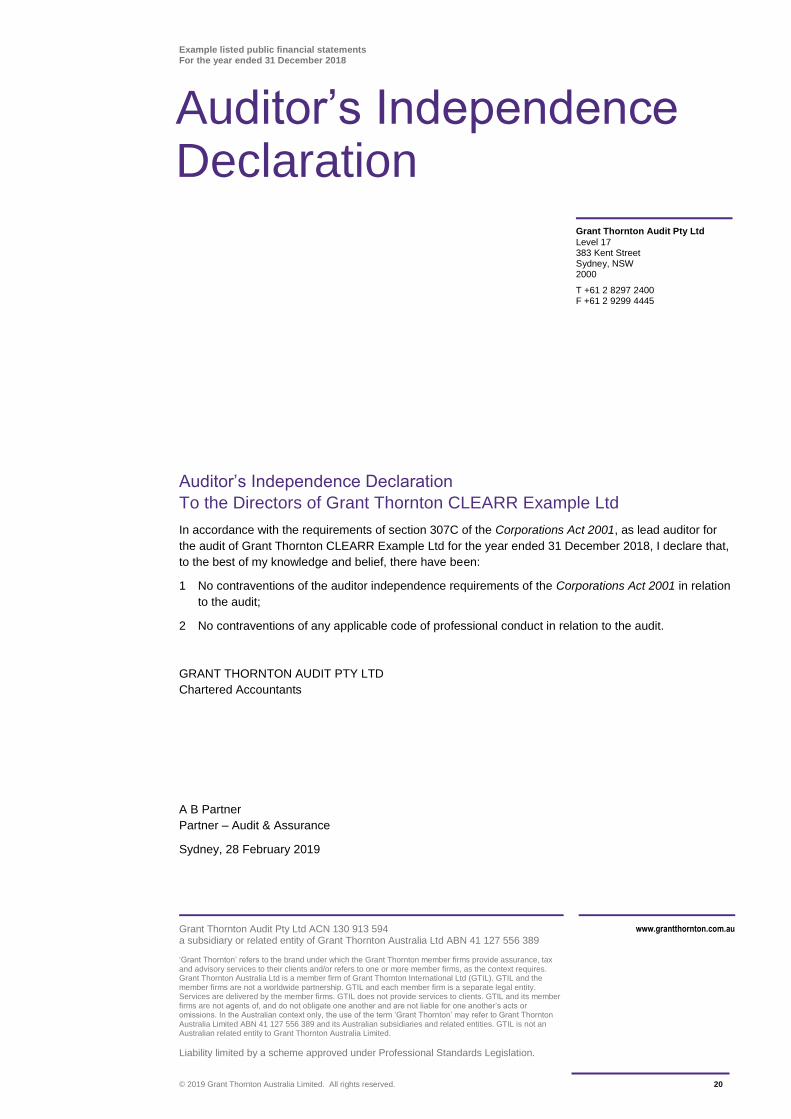
Auditor’s Independence Declaration
To the Directors of Grant Thornton CLEARR Example Ltd
In accordance with the requirements of section 307C of the Corporations Act 2001, as lead auditor for
the audit of Grant Thornton CLEARR Example Ltd for the year ended 31 December 2018, I declare that,
to the best of my knowledge and belief, there have been:
1 No contraventions of the auditor independence requirements of the Corporations Act 2001 in relation
to the audit;
2 No contraventions of any applicable code of professional conduct in relation to the audit.
GRANT THORNTON AUDIT PTY LTD
Chartered Accountants
A B Partner
Partner – Audit & Assurance
Sydney, 28 February 2019
Auditor’s Independence Declaration
Example listed public financial statements For the year ended 31 December 2018
© 2019 Grant Thornton Australia Limited. All rights reserved. 21
Corporate Governance Statement The Board is committed to achieving and demonstrating the highest standards of corporate governance.
As such, Grant Thornton CLEARR Example Ltd and its Controlled Entities (the Group) have adopted the
third edition of the Corporate Governance Principles and Recommendations5.
The Group’s Corporate Governance Statement for the financial year ending 31 December 2018 is dated
as at 31 December 2018 and was approved by the Board on 15 January 2019. The Corporate
Governance Statement is available on Grant Thornton CLEARR’s website at
www.gtclearr.com.au/corporategovernance.
5 The third edition of ASX Corporate Governance Principles and Recommendations requires an entity’s Corporate Governance Statement (CGS) to state
the date it is current (which must be the entity’s balance date or later) and state that it has been approved by the Board. The third edition also allows an entity to include its CGS either on its website or in the annual report. Where the website presentation is chosen, the annual report needs to include the website address of where the CGS can be found, and a copy of CGS needs to be lodged with the ASX at the same time the annual report is lodged. In the interest of streamlining the annual report, we have chosen the website presentation of CGS in this annual report.
Example listed public financial statements For the year ended 31 December 2018
© 2019 Grant Thornton Australia Limited. All rights reserved. 22
Guidance Note: Consolidated Statement of Profit or Loss and Other
Comprehensive Income
AASB 101 Presentation of Financial Statements permits the statement of profit or loss and other
comprehensive income to be presented:
in a single statement: of profit or loss and other comprehensive income, or
in two statements: a statement of profit or loss and a statement of comprehensive income.
The Example Financial Statements illustrate a statement of profit or loss and other comprehensive
(i.e. a single statement). A two statement presentation is shown in Appendix B.
This statement of profit or loss and other comprehensive income format illustrates an example of
the ‘nature of expense method’. See Appendix A for a format illustrating the ‘function of expense’ or
‘cost of sales’ method.
AASB 101 requires the entity to disclose reclassification adjustments and related tax effects relating
to components of other comprehensive income either on the face of the statement or in the notes.
In this example, the entity presents reclassification adjustments and current year gains and losses
relating to other comprehensive income on the face of the statement of profit or loss and other
comprehensive income (AASB 101.92). An entity may instead present reclassification adjustments
in the notes, in which case the components of other comprehensive income are presented after any
related reclassification adjustments (AASB 101.94).
According to AASB 101.90, an entity shall disclose the amount of income tax relating to each
component of other comprehensive income either on the face of the statement of profit or loss and
other comprehensive income or in the notes. In this example, the entity presents components of
other comprehensive income before tax, with one amount shown for the aggregate amount of
income tax relating to all components of other comprehensive income (AASB 101.91(b)).
Alternatively, the entity may present each component of other comprehensive income net of related
tax effects (AASB 101.91(a)). If the tax effects of each component of other comprehensive income
are not presented on the face of the statement, this information shall be presented in the notes (see
Note 25.2).
New reporting guidance for AASB 9: As a result of corresponding amendments arising from
AASB 9 Financial Instruments now require separate presentation of the following line items in the
statement of profit and loss:
interest revenue calculated using the effective interest rate method, separately from other
revenue (AASB 101.82(a)*
gains and losses from the derecognition of financial assets measured at amortised cost (AASB
101.82(aa)*
impairment losses determined in accordance with section 5.5 of AASB 9, including reversals of
impairment losses or impairment gains (AASB 101.82(ba)
gains and losses recognised as a result of a reclassification of financial assets from
measurement at amortised cost to fair value through profit or loss*
gains and losses reclassified from OCI as a result of a reclassification of financial assets from
the fair value through OCI measurement category to fair value through profit or loss.
*not illustrated as not material/not applicable to Grant Thornton CLEARR Example Ltd though
interest is recognised under effective interest rate method, it is not considered to be revenue as
earning of interest is not part of the entity’s ordinary activity but incidental benefit.
Example listed public financial statements For the year ended 31 December 2018
© 2019 Grant Thornton Australia Limited. All rights reserved. 23
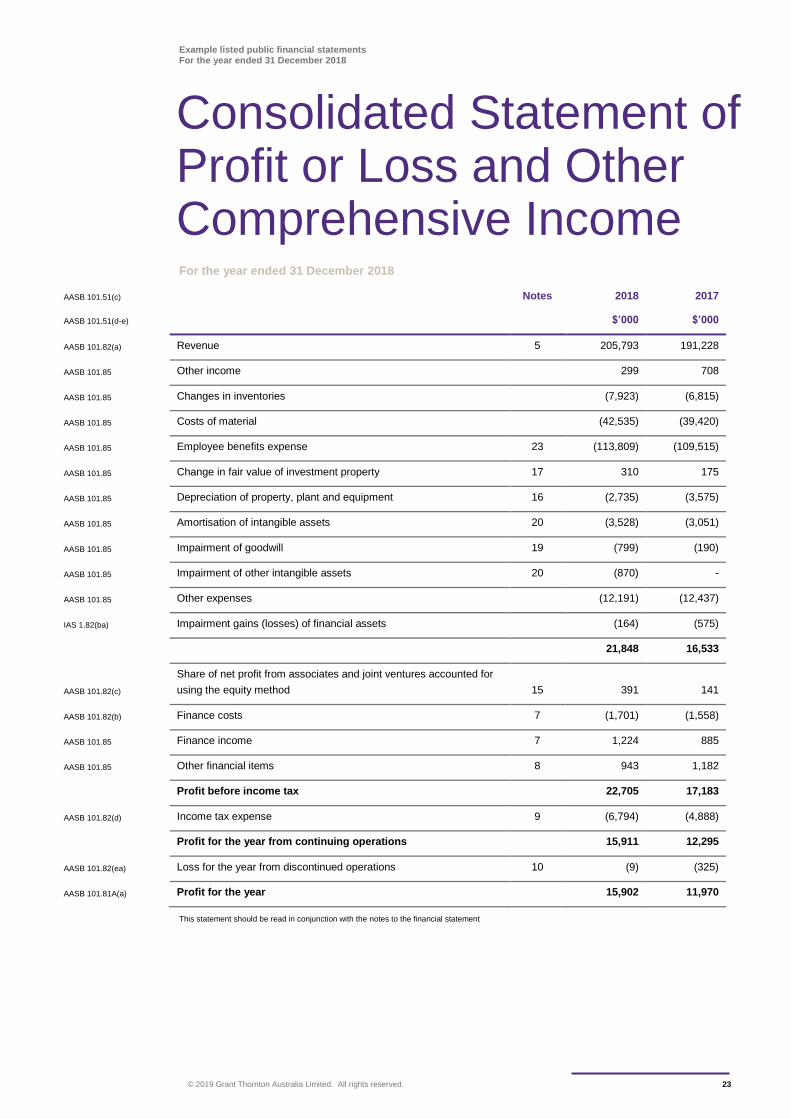
For the year ended 31 December 2018
AASB 101.51(c) Notes 2018 2017
AASB 101.51(d-e) $’000 $’000
AASB 101.82(a) Revenue 5 205,793 191,228
AASB 101.85 Other income 299 708
AASB 101.85 Changes in inventories (7,923) (6,815)
AASB 101.85 Costs of material (42,535) (39,420)
AASB 101.85 Employee benefits expense 23 (113,809) (109,515)
AASB 101.85 Change in fair value of investment property 17 310 175
AASB 101.85 Depreciation of property, plant and equipment 16 (2,735) (3,575)
AASB 101.85 Amortisation of intangible assets 20 (3,528) (3,051)
AASB 101.85 Impairment of goodwill 19 (799) (190)
AASB 101.85 Impairment of other intangible assets 20 (870) -
AASB 101.85 Other expenses (12,191) (12,437)
IAS 1.82(ba) Impairment gains (losses) of financial assets (164) (575)
21,848 16,533
AASB 101.82(c)
Share of net profit from associates and joint ventures accounted for
using the equity method 15 391 141
AASB 101.82(b) Finance costs 7 (1,701) (1,558)
AASB 101.85 Finance income 7 1,224 885
AASB 101.85 Other financial items 8 943 1,182
Profit before income tax 22,705 17,183
AASB 101.82(d) Income tax expense 9 (6,794) (4,888)
Profit for the year from continuing operations 15,911 12,295
AASB 101.82(ea) Loss for the year from discontinued operations 10 (9) (325)
AASB 101.81A(a) Profit for the year 15,902 11,970
This statement should be read in conjunction with the notes to the financial statement
Consolidated Statement of Profit or Loss and Other Comprehensive Income
Example listed public financial statements For the year ended 31 December 2018
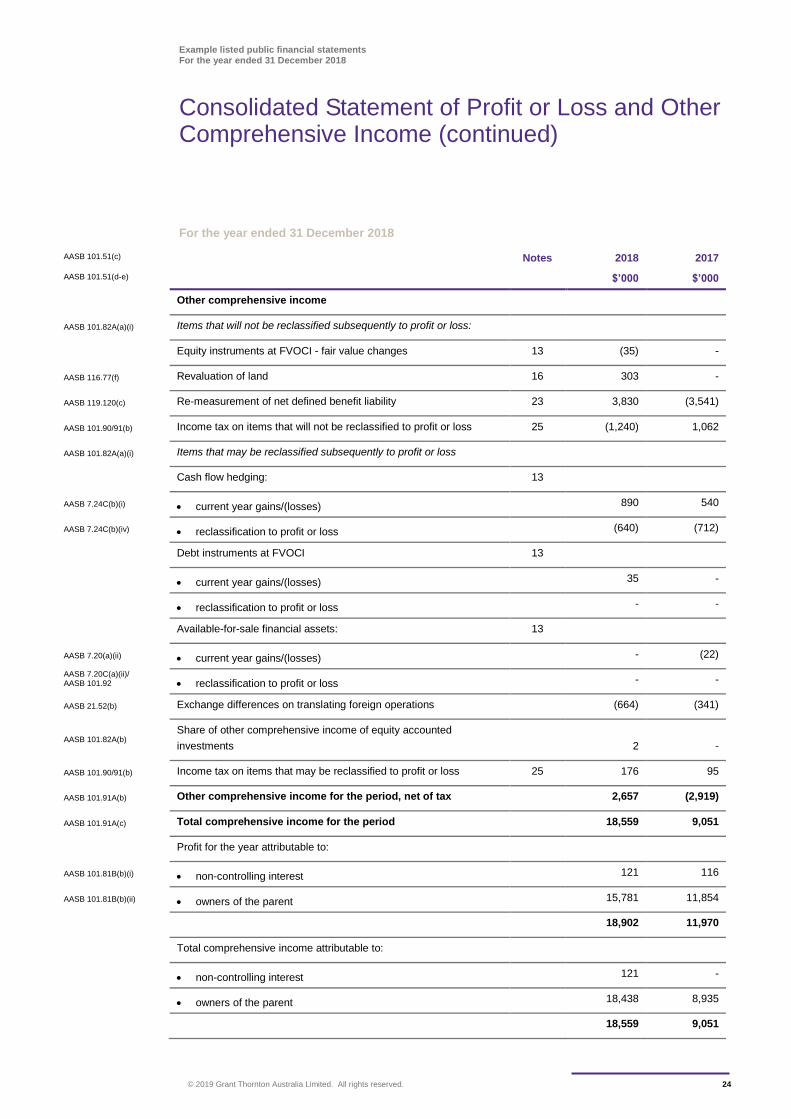
Consolidated Statement of Profit or Loss and Other Comprehensive Income (continued)
© 2019 Grant Thornton Australia Limited. All rights reserved. 24
For the year ended 31 December 2018
AASB 101.51(c) Notes 2018 2017
AASB 101.51(d-e) $’000 $’000
Other comprehensive income
AASB 101.82A(a)(i) Items that will not be reclassified subsequently to profit or loss:
Equity instruments at FVOCI - fair value changes 13 (35) -
AASB 116.77(f) Revaluation of land 16 303 -
AASB 119.120(c) Re-measurement of net defined benefit liability 23 3,830 (3,541)
AASB 101.90/91(b) Income tax on items that will not be reclassified to profit or loss 25 (1,240) 1,062
AASB 101.82A(a)(i) Items that may be reclassified subsequently to profit or loss
Cash flow hedging: 13
AASB 7.24C(b)(i) current year gains/(losses) 890 540
AASB 7.24C(b)(iv) reclassification to profit or loss (640) (712)
Debt instruments at FVOCI 13
current year gains/(losses) 35 -
reclassification to profit or loss - -
Available-for-sale financial assets: 13
AASB 7.20(a)(ii) current year gains/(losses) - (22)
AASB 7.20C(a)(ii)/ AASB 101.92 reclassification to profit or loss - -
AASB 21.52(b) Exchange differences on translating foreign operations (664) (341)
AASB 101.82A(b) Share of other comprehensive income of equity accounted
investments
2 -
AASB 101.90/91(b) Income tax on items that may be reclassified to profit or loss 25 176 95
AASB 101.91A(b) Other comprehensive income for the period, net of tax 2,657 (2,919)
AASB 101.91A(c) Total comprehensive income for the period 18,559 9,051
Profit for the year attributable to:
AASB 101.81B(b)(i) non-controlling interest 121 116
AASB 101.81B(b)(ii) owners of the parent 15,781 11,854
18,902 11,970
Total comprehensive income attributable to:
non-controlling interest 121 -
owners of the parent 18,438 8,935
18,559 9,051
Example listed public financial statements For the year ended 31 December 2018
Consolidated Statement of Profit or Loss and Other Comprehensive Income (continued)
© 2019 Grant Thornton Australia Limited. All rights reserved. 25
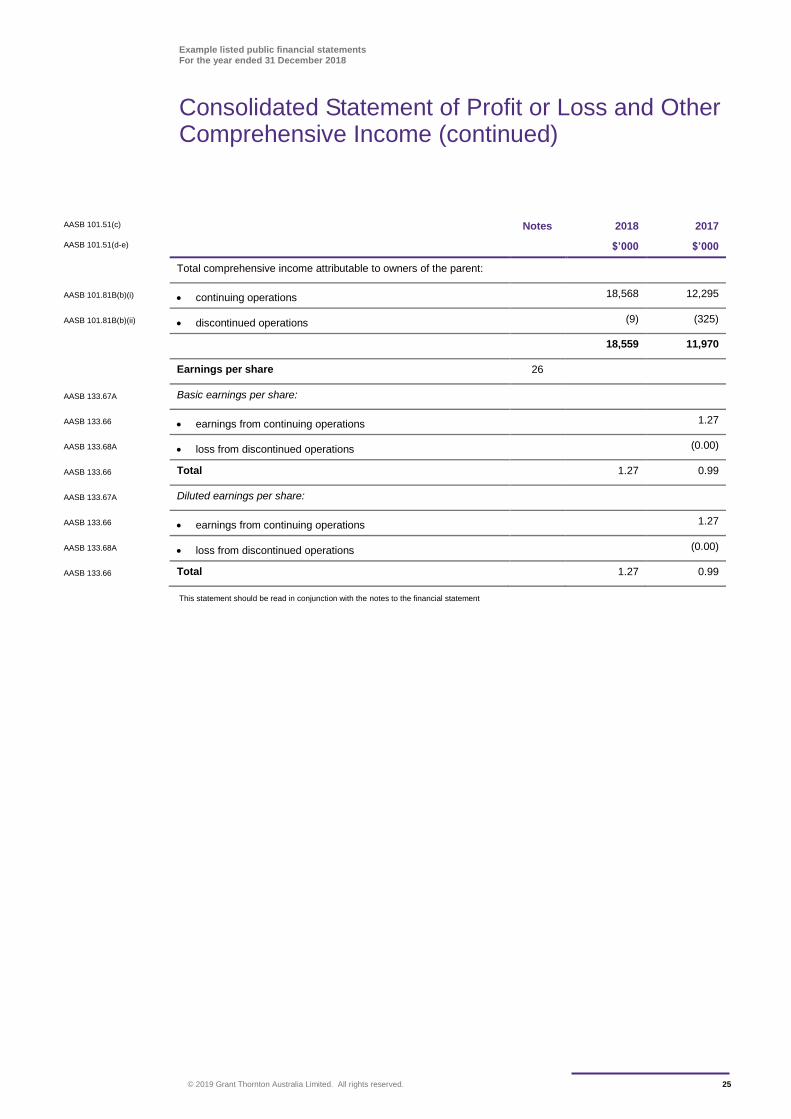
AASB 101.51(c) Notes 2018 2017
AASB 101.51(d-e) $’000 $’000
Total comprehensive income attributable to owners of the parent:
AASB 101.81B(b)(i) continuing operations 18,568 12,295
AASB 101.81B(b)(ii) discontinued operations (9) (325)
18,559 11,970
Earnings per share 26
AASB 133.67A Basic earnings per share:
AASB 133.66 earnings from continuing operations 1.27
AASB 133.68A loss from discontinued operations (0.00)
AASB 133.66 Total 1.27 0.99
AASB 133.67A Diluted earnings per share:
AASB 133.66 earnings from continuing operations 1.27
AASB 133.68A loss from discontinued operations (0.00)
AASB 133.66 Total 1.27 0.99
This statement should be read in conjunction with the notes to the financial statement
Example listed public financial statements For the year ended 31 December 2018
© 2019 Grant Thornton Australia Limited. All rights reserved. 26
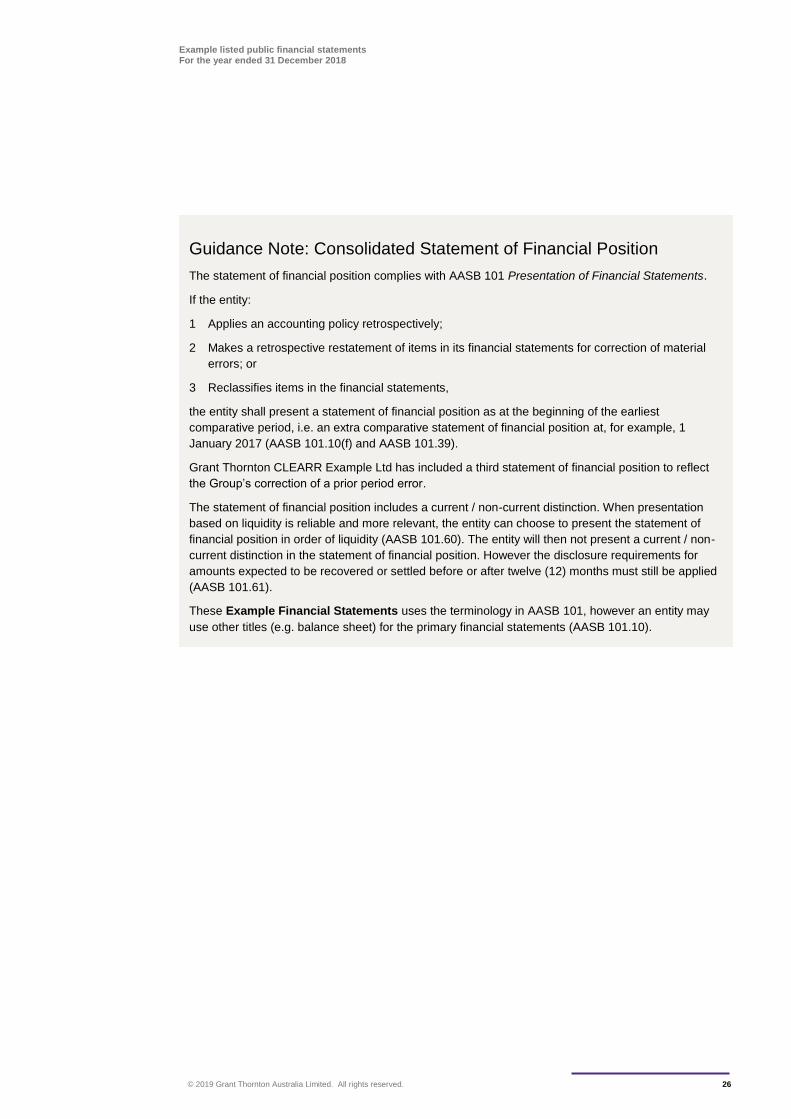
Guidance Note: Consolidated Statement of Financial Position
The statement of financial position complies with AASB 101 Presentation of Financial Statements.
If the entity:
1 Applies an accounting policy retrospectively;
2 Makes a retrospective restatement of items in its financial statements for correction of material
errors; or
3 Reclassifies items in the financial statements,
the entity shall present a statement of financial position as at the beginning of the earliest
comparative period, i.e. an extra comparative statement of financial position at, for example, 1
January 2017 (AASB 101.10(f) and AASB 101.39).
Grant Thornton CLEARR Example Ltd has included a third statement of financial position to reflect
the Group’s correction of a prior period error.
The statement of financial position includes a current / non-current distinction. When presentation
based on liquidity is reliable and more relevant, the entity can choose to present the statement of
financial position in order of liquidity (AASB 101.60). The entity will then not present a current / non-
current distinction in the statement of financial position. However the disclosure requirements for
amounts expected to be recovered or settled before or after twelve (12) months must still be applied
(AASB 101.61).
These Example Financial Statements uses the terminology in AASB 101, however an entity may
use other titles (e.g. balance sheet) for the primary financial statements (AASB 101.10).
Example listed public financial statements For the year ended 31 December 2018
© 2019 Grant Thornton Australia Limited. All rights reserved. 27
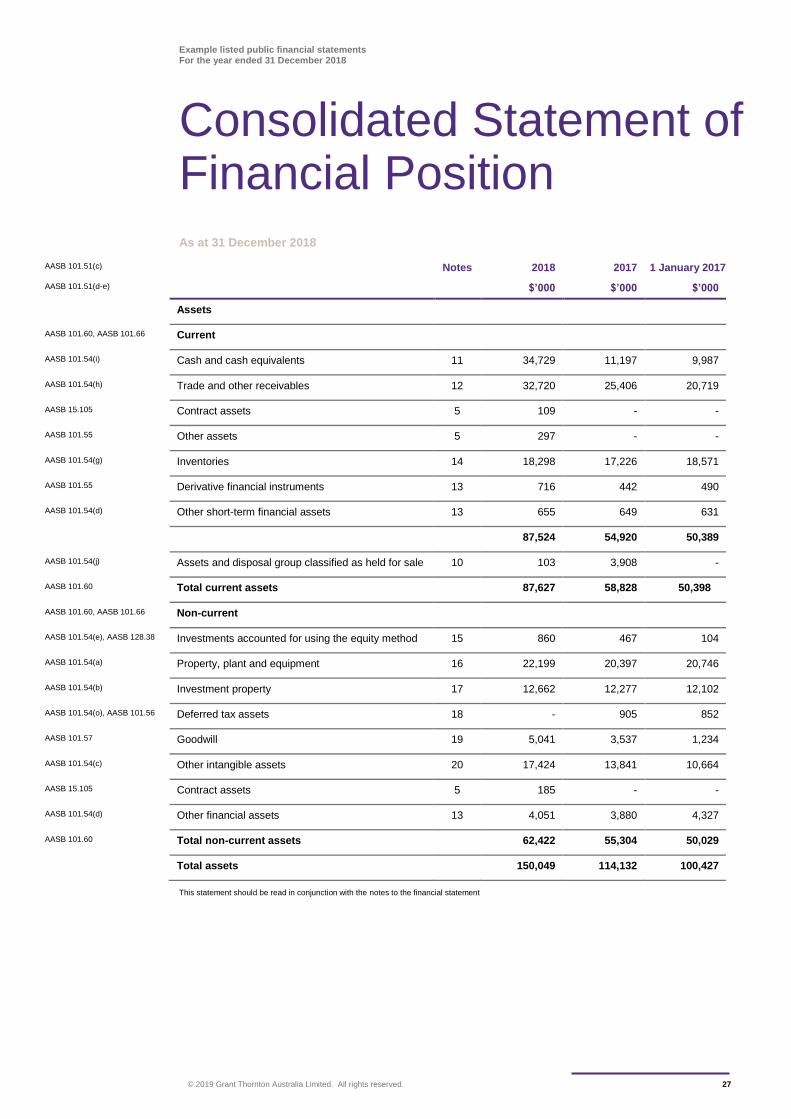
Consolidated Statement of Financial Position
As at 31 December 2018
AASB 101.51(c) Notes 2018 2017 1 January 2017
AASB 101.51(d-e) $’000 $’000 $’000
Assets
AASB 101.60, AASB 101.66 Current
AASB 101.54(i) Cash and cash equivalents 11 34,729 11,197 9,987
AASB 101.54(h) Trade and other receivables 12 32,720 25,406 20,719
AASB 15.105 Contract assets 5 109 - -
AASB 101.55 Other assets 5 297 - -
AASB 101.54(g) Inventories 14 18,298 17,226 18,571
AASB 101.55 Derivative financial instruments 13 716 442 490
AASB 101.54(d) Other short-term financial assets 13 655 649 631
87,524 54,920 50,389
AASB 101.54(j) Assets and disposal group classified as held for sale 10 103 3,908 -
AASB 101.60 Total current assets 87,627 58,828 50,398
AASB 101.60, AASB 101.66 Non-current
AASB 101.54(e), AASB 128.38 Investments accounted for using the equity method 15 860 467 104
AASB 101.54(a) Property, plant and equipment 16 22,199 20,397 20,746
AASB 101.54(b) Investment property 17 12,662 12,277 12,102
AASB 101.54(o), AASB 101.56 Deferred tax assets 18 - 905 852
AASB 101.57 Goodwill 19 5,041 3,537 1,234
AASB 101.54(c) Other intangible assets 20 17,424 13,841 10,664
AASB 15.105 Contract assets 5 185 - -
AASB 101.54(d) Other financial assets 13 4,051 3,880 4,327
AASB 101.60 Total non-current assets 62,422 55,304 50,029
Total assets 150,049 114,132 100,427
This statement should be read in conjunction with the notes to the financial statement
Example listed public financial statements For the year ended 31 December 2018
Consolidated Statement of Financial Position (continued)
© 2019 Grant Thornton Australia Limited. All rights reserved. 28
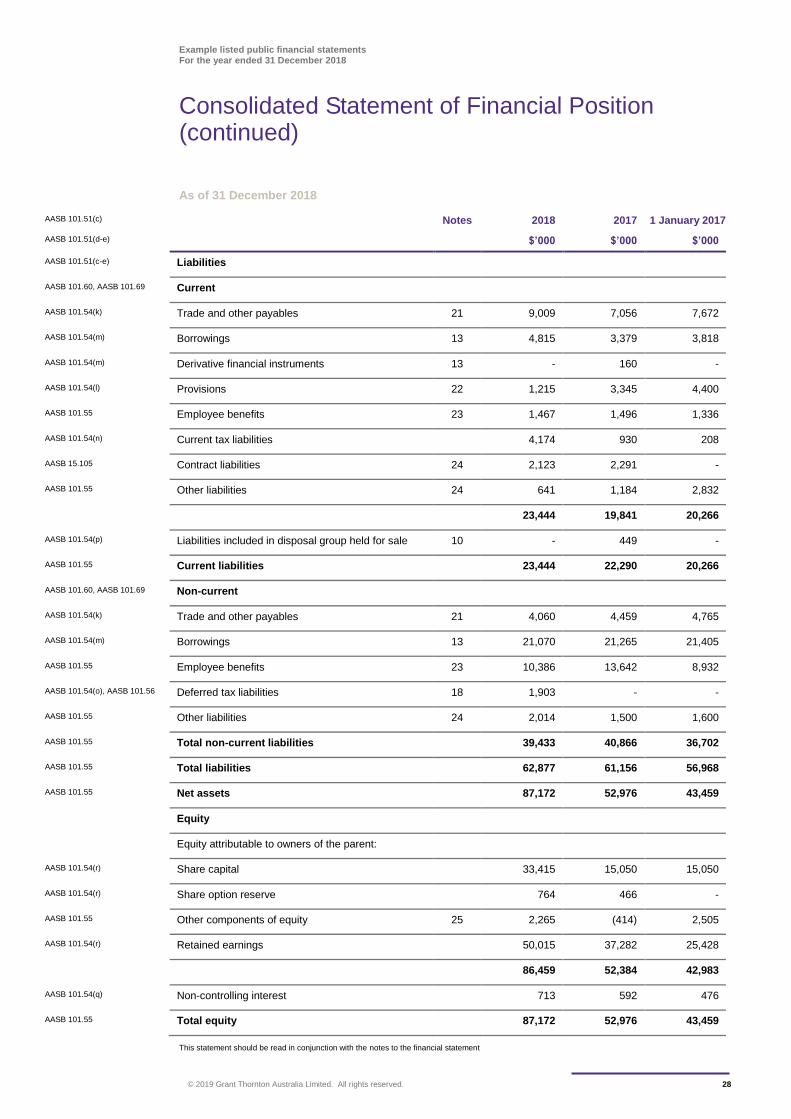
As of 31 December 2018
AASB 101.51(c) Notes 2018 2017 1 January 2017
AASB 101.51(d-e) $’000 $’000 $’000
AASB 101.51(c-e) Liabilities
AASB 101.60, AASB 101.69 Current
AASB 101.54(k) Trade and other payables 21 9,009 7,056 7,672
AASB 101.54(m) Borrowings 13 4,815 3,379 3,818
AASB 101.54(m) Derivative financial instruments 13 - 160 -
AASB 101.54(l) Provisions 22 1,215 3,345 4,400
AASB 101.55 Employee benefits 23 1,467 1,496 1,336
AASB 101.54(n) Current tax liabilities 4,174 930 208
AASB 15.105 Contract liabilities 24 2,123 2,291 -
AASB 101.55 Other liabilities 24 641 1,184 2,832
23,444 19,841 20,266
AASB 101.54(p) Liabilities included in disposal group held for sale 10 - 449 -
AASB 101.55 Current liabilities 23,444 22,290 20,266
AASB 101.60, AASB 101.69 Non-current
AASB 101.54(k) Trade and other payables 21 4,060 4,459 4,765
AASB 101.54(m) Borrowings 13 21,070 21,265 21,405
AASB 101.55 Employee benefits 23 10,386 13,642 8,932
AASB 101.54(o), AASB 101.56 Deferred tax liabilities 18 1,903 - -
AASB 101.55 Other liabilities 24 2,014 1,500 1,600
AASB 101.55 Total non-current liabilities 39,433 40,866 36,702
AASB 101.55 Total liabilities 62,877 61,156 56,968
AASB 101.55 Net assets 87,172 52,976 43,459
Equity
Equity attributable to owners of the parent:
AASB 101.54(r) Share capital 33,415 15,050 15,050
AASB 101.54(r) Share option reserve 764 466 -
AASB 101.55 Other components of equity 25 2,265 (414) 2,505
AASB 101.54(r) Retained earnings 50,015 37,282 25,428
86,459 52,384 42,983
AASB 101.54(q) Non-controlling interest 713 592 476
AASB 101.55 Total equity 87,172 52,976 43,459
This statement should be read in conjunction with the notes to the financial statement
Example listed public financial statements For the year ended 31 December 2018
© 2019 Grant Thornton Australia Limited. All rights reserved. 29
Guidance Note: Consolidated Statement of Changes in Equity
Entities may present the required reconciliations for each component of other comprehensive
income either in the statement of changes in equity or in the notes to the financial statements (AASB
101.106(d)(ii) and AASB 101.106A). These Example Financial Statements present the
reconciliations for each component of other comprehensive income in the notes to the financial
statements (see Note 25.2). This reduces duplicated disclosures and presents a clearer picture of
the overall changes in equity.
AASB 2 Share-based Payment requires an entity to recognise equity-settled share-based payment
transactions as changes in equity but does not specify how this is presented, e.g. in a separate
reserve within equity or within retained earnings. In our view, either approach would be allowed
under Australian Accounting Standards. Share option reserve has been credited with an increase in
equity in this example (see also Note 4.23).
Example listed public financial statements For the year ended 31 December 2018
© 2019 Grant Thornton Australia Limited. All rights reserved. 30
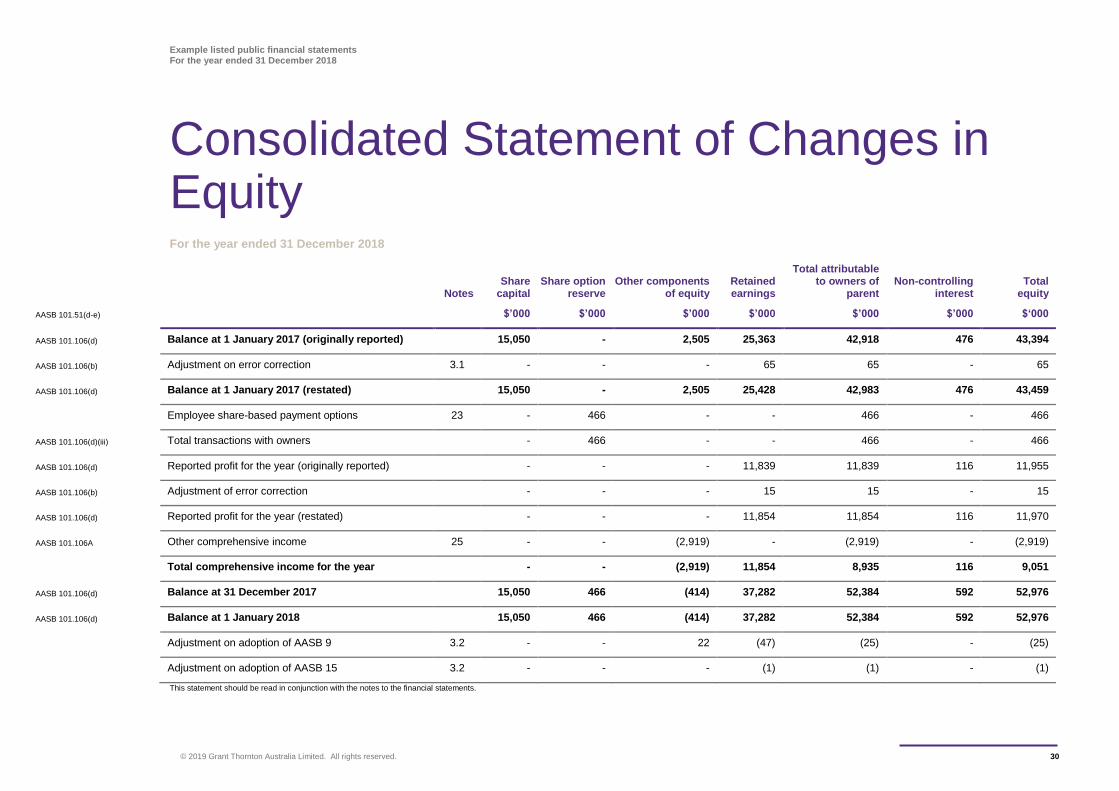
For the year ended 31 December 2018
Notes Share
capital Share option
reserve Other components
of equity Retained earnings
Total attributable to owners of
parent Non-controlling
interest Total
equity
AASB 101.51(d-e) $’000 $’000 $’000 $’000 $’000 $’000 $‘000
AASB 101.106(d) Balance at 1 January 2017 (originally reported) 15,050 - 2,505 25,363 42,918 476 43,394
AASB 101.106(b) Adjustment on error correction 3.1 - - - 65 65 - 65
AASB 101.106(d) Balance at 1 January 2017 (restated) 15,050 - 2,505 25,428 42,983 476 43,459
Employee share-based payment options 23 - 466 - - 466 - 466
AASB 101.106(d)(iii) Total transactions with owners - 466 - - 466 - 466
AASB 101.106(d) Reported profit for the year (originally reported) - - - 11,839 11,839 116 11,955
AASB 101.106(b) Adjustment of error correction - - - 15 15 - 15
AASB 101.106(d) Reported profit for the year (restated) - - - 11,854 11,854 116 11,970
AASB 101.106A Other comprehensive income 25 - - (2,919) - (2,919) - (2,919)
Total comprehensive income for the year - - (2,919) 11,854 8,935 116 9,051
AASB 101.106(d) Balance at 31 December 2017 15,050 466 (414) 37,282 52,384 592 52,976
AASB 101.106(d) Balance at 1 January 2018 15,050 466 (414) 37,282 52,384 592 52,976
Adjustment on adoption of AASB 9 3.2 - - 22 (47) (25) - (25)
Adjustment on adoption of AASB 15 3.2 - - - (1) (1) - (1)
This statement should be read in conjunction with the notes to the financial statements.
Consolidated Statement of Changes in Equity
Example listed public financial statements For the year ended 31 December 2018
© 2019 Grant Thornton Australia Limited. All rights reserved. 31
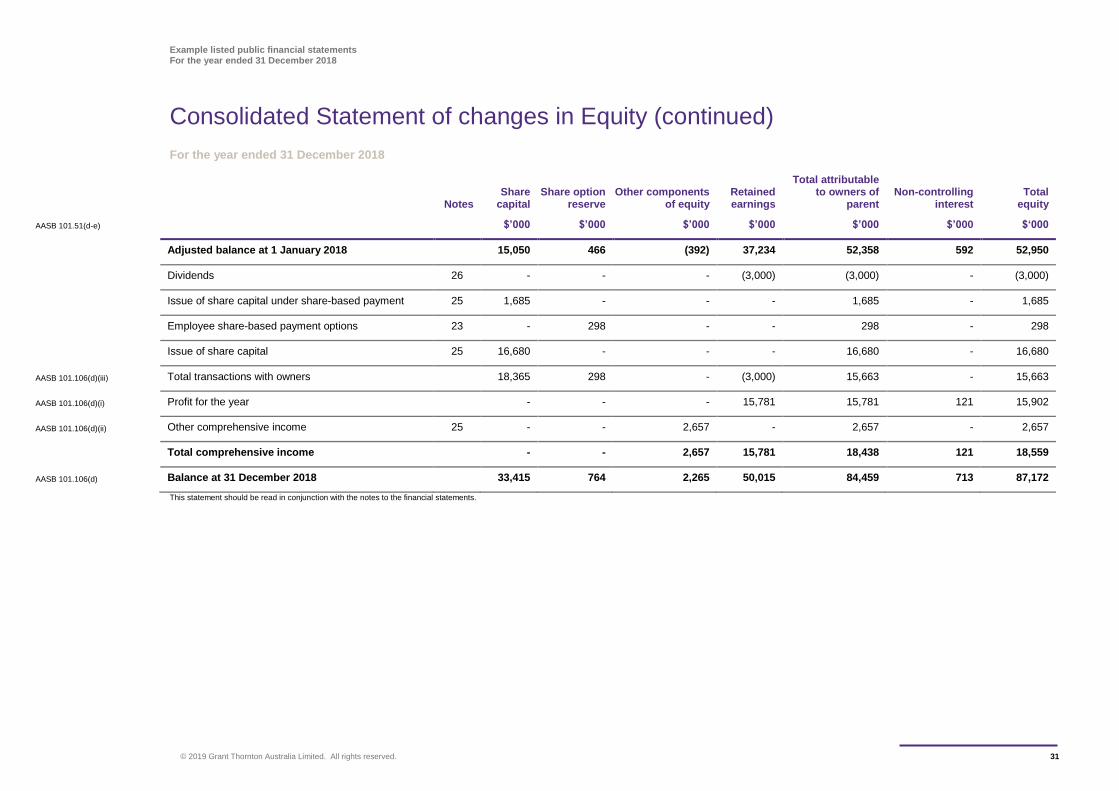
Consolidated Statement of changes in Equity (continued)
For the year ended 31 December 2018
Notes Share
capital Share option
reserve Other components
of equity Retained earnings
Total attributable to owners of
parent Non-controlling
interest Total
equity
AASB 101.51(d-e) $’000 $’000 $’000 $’000 $’000 $’000 $‘000
Adjusted balance at 1 January 2018 15,050 466 (392) 37,234 52,358 592 52,950
Dividends 26 - - - (3,000) (3,000) - (3,000)
Issue of share capital under share-based payment 25 1,685 - - - 1,685 - 1,685
Employee share-based payment options 23 - 298 - - 298 - 298
Issue of share capital 25 16,680 - - - 16,680 - 16,680
AASB 101.106(d)(iii) Total transactions with owners 18,365 298 - (3,000) 15,663 - 15,663
AASB 101.106(d)(i) Profit for the year - - - 15,781 15,781 121 15,902
AASB 101.106(d)(ii) Other comprehensive income 25 - - 2,657 - 2,657 - 2,657
Total comprehensive income - - 2,657 15,781 18,438 121 18,559
AASB 101.106(d) Balance at 31 December 2018 33,415 764 2,265 50,015 84,459 713 87,172
This statement should be read in conjunction with the notes to the financial statements.
Example listed public financial statements For the year ended 31 December 2018
© 2019 Grant Thornton Australia Limited. All rights reserved. 32
Guidance Note: Consolidated Statement of Cash Flows
This format illustrates the direct method of determining operating cash flows (AASB 107.18(a)).
An entity may also determine the operating cash flows using the indirect method (AASB 107.18(b)).
Example listed public financial statements For the year ended 31 December 2018
© 2019 Grant Thornton Australia Limited. All rights reserved. 33
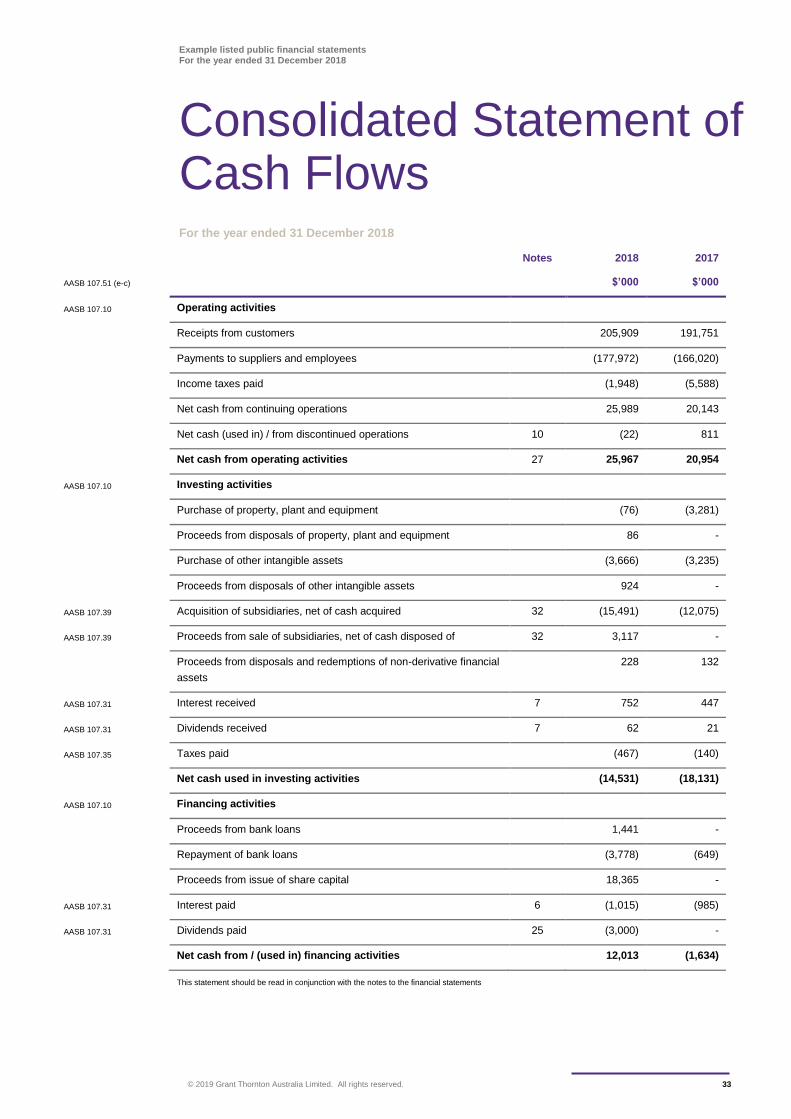
Consolidated Statement of Cash Flows For the year ended 31 December 2018
Notes 2018 2017
AASB 107.51 (e-c) $’000 $’000
AASB 107.10 Operating activities
Receipts from customers 205,909 191,751
Payments to suppliers and employees (177,972) (166,020)
Income taxes paid (1,948) (5,588)
Net cash from continuing operations 25,989 20,143
Net cash (used in) / from discontinued operations 10 (22) 811
Net cash from operating activities 27 25,967 20,954
AASB 107.10 Investing activities
Purchase of property, plant and equipment (76) (3,281)
Proceeds from disposals of property, plant and equipment 86 -
Purchase of other intangible assets (3,666) (3,235)
Proceeds from disposals of other intangible assets 924 -
AASB 107.39 Acquisition of subsidiaries, net of cash acquired 32 (15,491) (12,075)
AASB 107.39 Proceeds from sale of subsidiaries, net of cash disposed of 32 3,117 -
Proceeds from disposals and redemptions of non-derivative financial
assets
228 132
AASB 107.31 Interest received 7 752 447
AASB 107.31 Dividends received 7 62 21
AASB 107.35 Taxes paid (467) (140)
Net cash used in investing activities (14,531) (18,131)
AASB 107.10 Financing activities
Proceeds from bank loans 1,441 -
Repayment of bank loans (3,778) (649)
Proceeds from issue of share capital 18,365 -
AASB 107.31 Interest paid 6 (1,015) (985)
AASB 107.31 Dividends paid 25 (3,000) -
Net cash from / (used in) financing activities 12,013 (1,634)
This statement should be read in conjunction with the notes to the financial statements
Example listed public financial statements For the year ended 31 December 2018
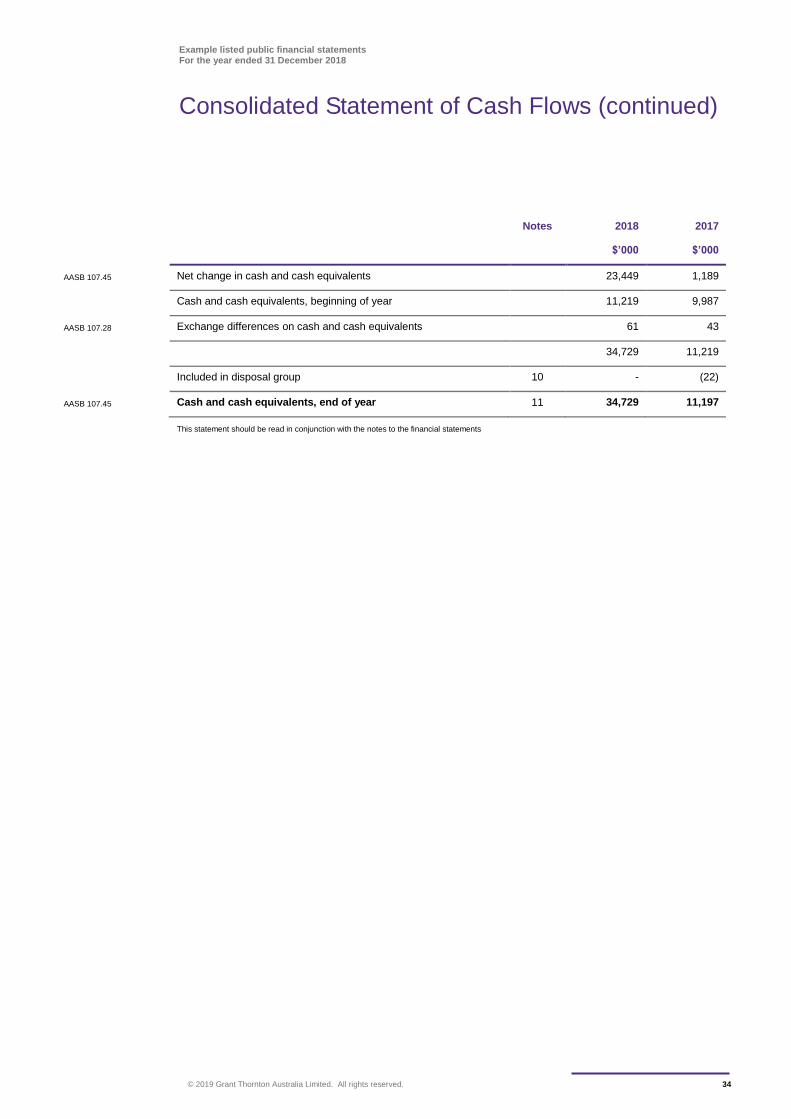
Consolidated Statement of Cash Flows (continued)
© 2019 Grant Thornton Australia Limited. All rights reserved. 34
Notes 2018 2017
$’000 $’000
AASB 107.45 Net change in cash and cash equivalents 23,449 1,189
Cash and cash equivalents, beginning of year 11,219 9,987
AASB 107.28 Exchange differences on cash and cash equivalents 61 43
34,729 11,219
Included in disposal group 10 - (22)
AASB 107.45 Cash and cash equivalents, end of year 11 34,729 11,197
This statement should be read in conjunction with the notes to the financial statements
Example listed public financial statements For the year ended 31 December 2018
© 2019 Grant Thornton Australia Limited. All rights reserved. 35
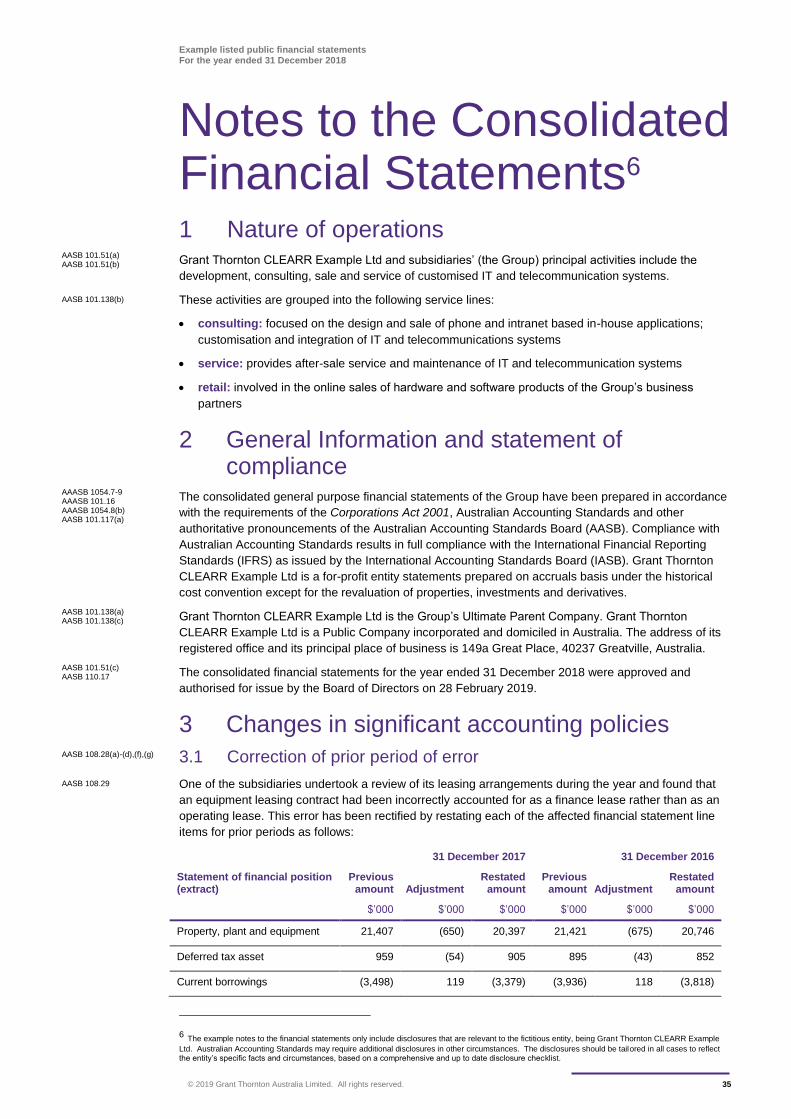
1 Nature of operations Grant Thornton CLEARR Example Ltd and subsidiaries’ (the Group) principal activities include the
development, consulting, sale and service of customised IT and telecommunication systems.
These activities are grouped into the following service lines:
consulting: focused on the design and sale of phone and intranet based in-house applications;
customisation and integration of IT and telecommunications systems
service: provides after-sale service and maintenance of IT and telecommunication systems
retail: involved in the online sales of hardware and software products of the Group’s business
partners
2 General Information and statement of compliance
The consolidated general purpose financial statements of the Group have been prepared in accordance
with the requirements of the Corporations Act 2001, Australian Accounting Standards and other
authoritative pronouncements of the Australian Accounting Standards Board (AASB). Compliance with
Australian Accounting Standards results in full compliance with the International Financial Reporting
Standards (IFRS) as issued by the International Accounting Standards Board (IASB). Grant Thornton
CLEARR Example Ltd is a for-profit entity statements prepared on accruals basis under the historical
cost convention except for the revaluation of properties, investments and derivatives.
Grant Thornton CLEARR Example Ltd is the Group’s Ultimate Parent Company. Grant Thornton
CLEARR Example Ltd is a Public Company incorporated and domiciled in Australia. The address of its
registered office and its principal place of business is 149a Great Place, 40237 Greatville, Australia.
The consolidated financial statements for the year ended 31 December 2018 were approved and
authorised for issue by the Board of Directors on 28 February 2019.
3 Changes in significant accounting policies
3.1 Correction of prior period of error
One of the subsidiaries undertook a review of its leasing arrangements during the year and found that
an equipment leasing contract had been incorrectly accounted for as a finance lease rather than as an
operating lease. This error has been rectified by restating each of the affected financial statement line
items for prior periods as follows:
31 December 2017 31 December 2016
Statement of financial position (extract)
Previous amount Adjustment
Restated amount
Previous amount Adjustment
Restated amount
$’000 $’000 $’000 $’000 $’000 $’000
Property, plant and equipment 21,407 (650) 20,397 21,421 (675) 20,746
Deferred tax asset 959 (54) 905 895 (43) 852
Current borrowings (3,498) 119 (3,379) (3,936) 118 (3,818)
6 The example notes to the financial statements only include disclosures that are relevant to the fictitious entity, being Grant Thornton CLEARR Example
Ltd. Australian Accounting Standards may require additional disclosures in other circumstances. The disclosures should be tailored in all cases to reflect the entity’s specific facts and circumstances, based on a comprehensive and up to date disclosure checklist.
Notes to the Consolidated Financial Statements6
AASB 101.51(a) AASB 101.51(b)
AASB 101.138(b)
AAASB 1054.7-9 AAASB 101.16 AAASB 1054.8(b) AASB 101.117(a)
AASB 101.138(a) AASB 101.138(c)
AASB 101.51(c) AASB 110.17
AASB 108.28(a)-(d),(f),(g)
AASB 108.29
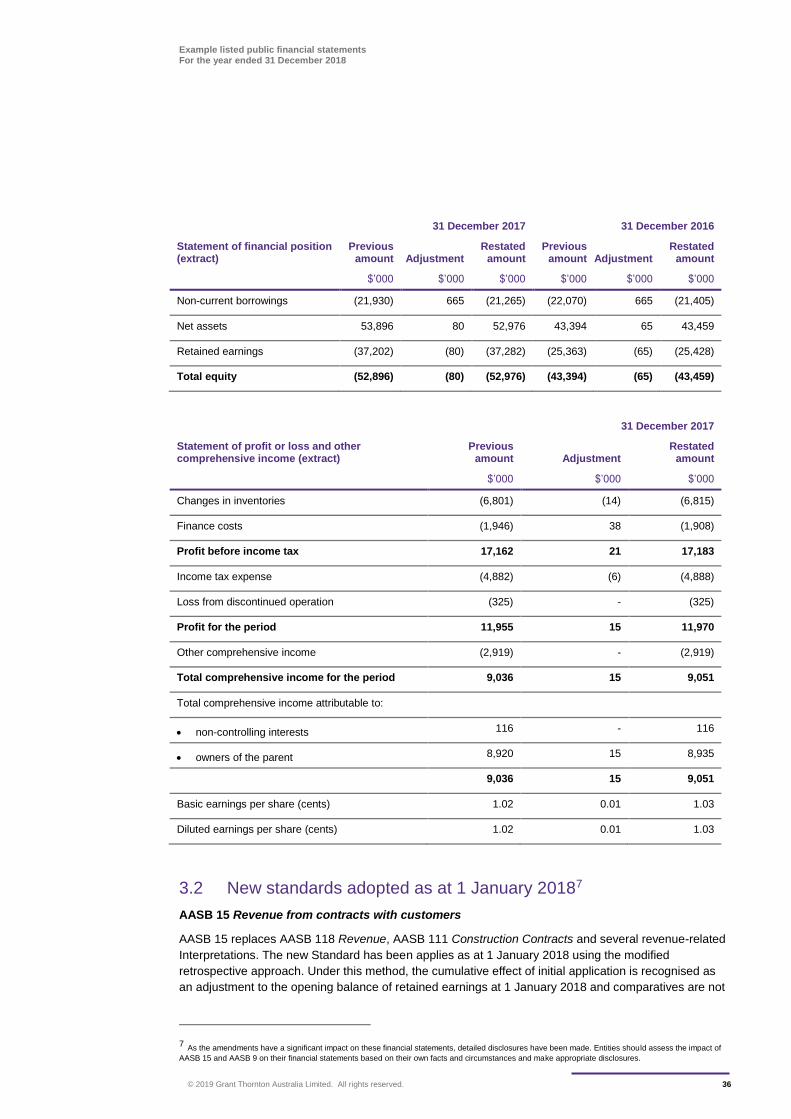
Example listed public financial statements For the year ended 31 December 2018
© 2019 Grant Thornton Australia Limited. All rights reserved. 36
31 December 2017 31 December 2016
Statement of financial position (extract)
Previous amount Adjustment
Restated amount
Previous amount Adjustment
Restated amount
$’000 $’000 $’000 $’000 $’000 $’000
Non-current borrowings (21,930) 665 (21,265) (22,070) 665 (21,405)
Net assets 53,896 80 52,976 43,394 65 43,459
Retained earnings (37,202) (80) (37,282) (25,363) (65) (25,428)
Total equity (52,896) (80) (52,976) (43,394) (65) (43,459)
31 December 2017
Statement of profit or loss and other comprehensive income (extract)
Previous amount Adjustment
Restated amount
$’000 $’000 $’000
Changes in inventories (6,801) (14) (6,815)
Finance costs (1,946) 38 (1,908)
Profit before income tax 17,162 21 17,183
Income tax expense (4,882) (6) (4,888)
Loss from discontinued operation (325) - (325)
Profit for the period 11,955 15 11,970
Other comprehensive income (2,919) - (2,919)
Total comprehensive income for the period 9,036 15 9,051
Total comprehensive income attributable to:
non-controlling interests 116 - 116
owners of the parent 8,920 15 8,935
9,036 15 9,051
Basic earnings per share (cents) 1.02 0.01 1.03
Diluted earnings per share (cents) 1.02 0.01 1.03
3.2 New standards adopted as at 1 January 20187
AASB 15 Revenue from contracts with customers
AASB 15 replaces AASB 118 Revenue, AASB 111 Construction Contracts and several revenue-related
Interpretations. The new Standard has been applies as at 1 January 2018 using the modified
retrospective approach. Under this method, the cumulative effect of initial application is recognised as
an adjustment to the opening balance of retained earnings at 1 January 2018 and comparatives are not
7 As the amendments have a significant impact on these financial statements, detailed disclosures have been made. Entities should assess the impact of
AASB 15 and AASB 9 on their financial statements based on their own facts and circumstances and make appropriate disclosures.
Example listed public financial statements For the year ended 31 December 2018
© 2019 Grant Thornton Australia Limited. All rights reserved. 37
restated. In accordance with the transition guidance, AASB 15 has only been applied to contracts that
are incomplete as at 1 January 2018.
The adoption of AASB 15 has mainly affected the following areas:
IT services set-up costs
Loss contracts
IT services set-up costs
In preparing to perform under an IT outsourcing contract the Group incurs initial set-up costs replicating
client databases and establishing communication linkages with the customer’s information systems. On
average, these costs represent between 1% and 2% of the total labour and materials costs incurred.
As these costs arise from activities that the Group must undertake to fulfil a contract but do not
themselves transfer a good or service to a customer, AASB 15 does not consider them to be
performance obligations. Accordingly, these costs are excluded from the measure of performance under
the contract. Instead, such costs are evaluated for possible capitalisation using the specific criteria in the
Standard. If capitalised, the resulting asset is subsequently amortised on a straight-line basis over the
estimated period of benefit which includes both the existing contract and any reasonably anticipated
renewals based on the company’s historical experience with similar arrangements. Under AASB 118,
these costs were expensed as incurred.
This change of accounting for set-up costs had no impact on the total amount of services revenue
recognised under each contract, although the date upon which services revenue is first recognised has
been delayed by an average of 6 to 8 days. The total adjustment to the opening balance of retained
earnings arising from the initial application of AASB 15 to set-up costs is $267.
Loss contracts
AASB 15 does not include any guidance on how to account for loss contracts. Accordingly, such
contracts are accounted for using the guidance in AASB 137 Provisions, Contingent Liabilities and
Contingent Assets.
Under AASB 137, the assessment of whether a provision needs to be recognised takes place at the
contract level and there are no segmentation criteria to apply. As a result, there are some instances
where loss provisions recognised in the past have not been recognised under AASB 15 because the
contract as a whole is profitable. In addition, when two or more contracts entered into at or near the
same time are required to be combined for accounting purposes, AASB 15 requires the Group to
perform the assessment of whether the contract is onerous at the level of the combined contracts. The
Group also notes that the amount of loss accrued in respect of a loss contract under AASB 111 takes
into account an appropriate allocation of construction overheads. This contrasts with AASB 137 where
loss accruals may be lower as they are based on the identification of ‘unavoidable costs’.
As at 1 January 2018, the Group has identified only two loss provisions totaling to $585. These
provisions have been re-measured under AASB 137 at $185.
Contracts with multiple performance obligations
Many of the Group’s contracts comprise a variety of performance obligations including, but not limited
to, hardware, software, elements of design and customisation, after-sales services, and installation.
Under AASB 15, the Group must evaluate the separability of the promised goods or services based on
whether they are ‘distinct’. A promised good or service is ‘distinct’ if both:
the customer benefits from the item either on its own or together with other readily available
resources; and
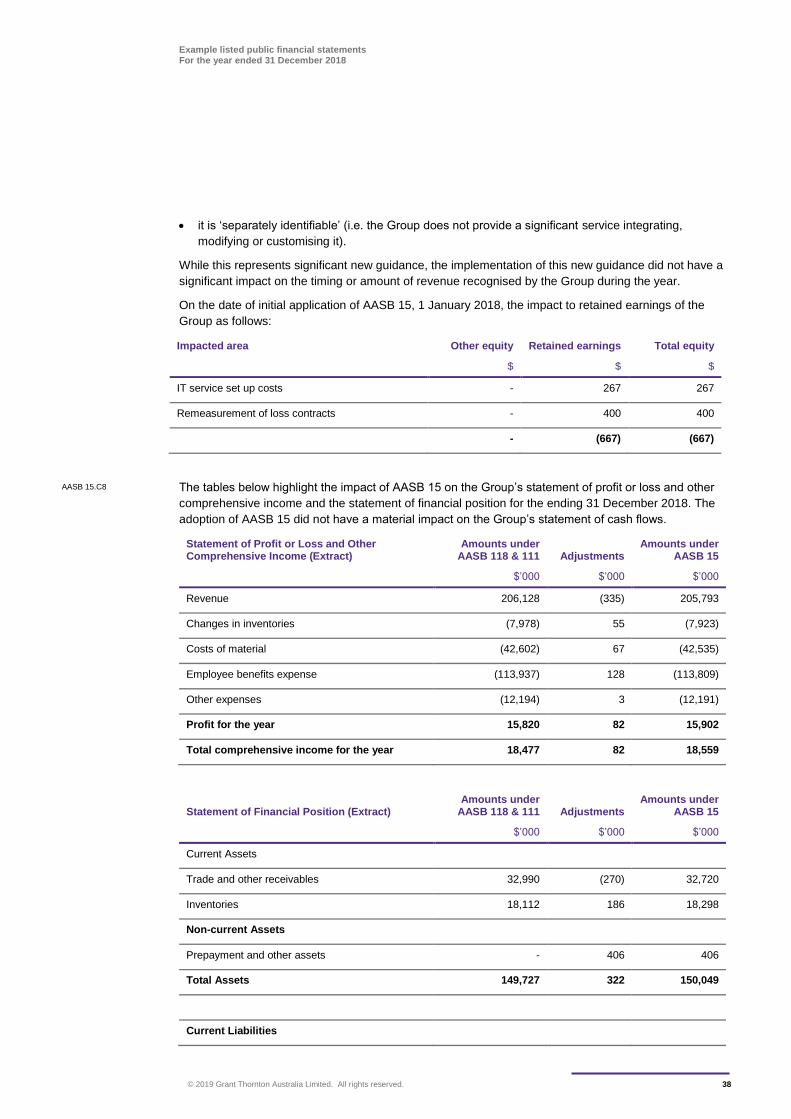
Example listed public financial statements For the year ended 31 December 2018
© 2019 Grant Thornton Australia Limited. All rights reserved. 38
it is ‘separately identifiable’ (i.e. the Group does not provide a significant service integrating,
modifying or customising it).
While this represents significant new guidance, the implementation of this new guidance did not have a
significant impact on the timing or amount of revenue recognised by the Group during the year.
On the date of initial application of AASB 15, 1 January 2018, the impact to retained earnings of the
Group as follows:
Impacted area Other equity Retained earnings Total equity
$ $ $
IT service set up costs - 267 267
Remeasurement of loss contracts - 400 400
- (667) (667)
The tables below highlight the impact of AASB 15 on the Group’s statement of profit or loss and other
comprehensive income and the statement of financial position for the ending 31 December 2018. The
adoption of AASB 15 did not have a material impact on the Group’s statement of cash flows.
Statement of Profit or Loss and Other Comprehensive Income (Extract)
Amounts under AASB 118 & 111 Adjustments
Amounts under AASB 15
$’000 $’000 $’000
Revenue 206,128 (335) 205,793
Changes in inventories (7,978) 55 (7,923)
Costs of material (42,602) 67 (42,535)
Employee benefits expense (113,937) 128 (113,809)
Other expenses (12,194) 3 (12,191)
Profit for the year 15,820 82 15,902
Total comprehensive income for the year 18,477 82 18,559
Statement of Financial Position (Extract) Amounts under
AASB 118 & 111 Adjustments Amounts under
AASB 15
$’000 $’000 $’000
Current Assets
Trade and other receivables 32,990 (270) 32,720
Inventories 18,112 186 18,298
Non-current Assets
Prepayment and other assets - 406 406
Total Assets 149,727 322 150,049
Current Liabilities
AASB 15.C8
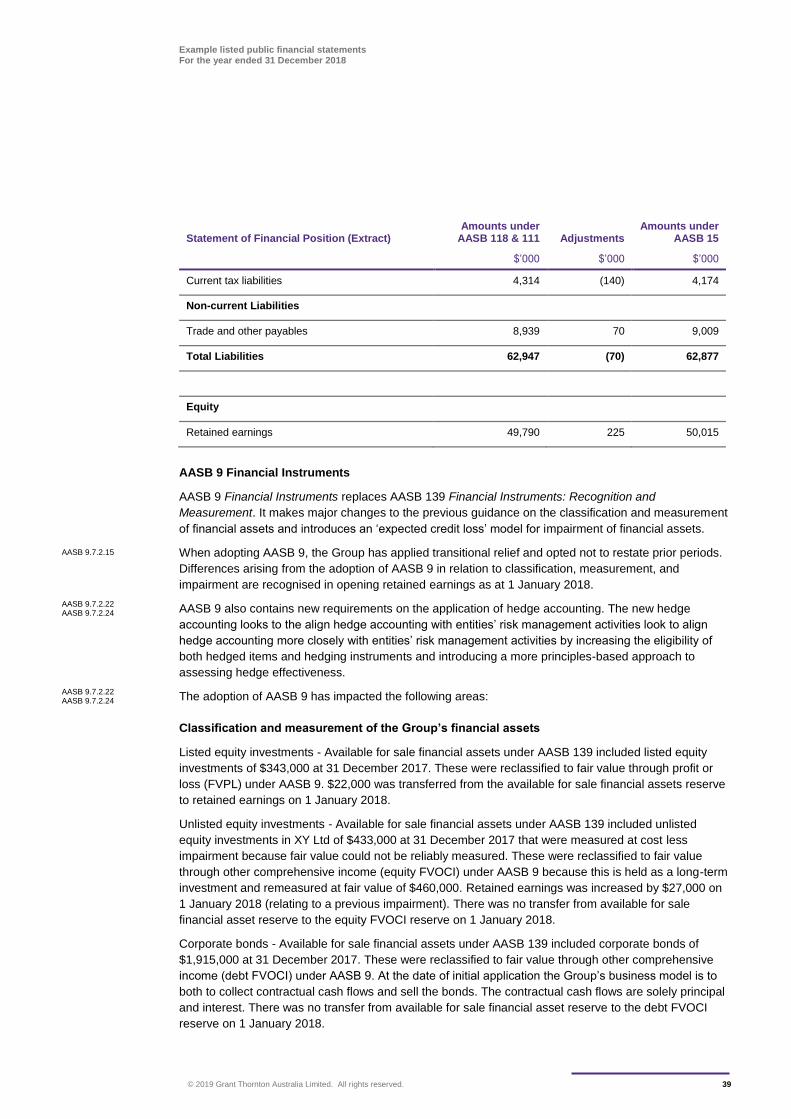
Example listed public financial statements For the year ended 31 December 2018
© 2019 Grant Thornton Australia Limited. All rights reserved. 39
Statement of Financial Position (Extract) Amounts under
AASB 118 & 111 Adjustments Amounts under
AASB 15
$’000 $’000 $’000
Current tax liabilities 4,314 (140) 4,174
Non-current Liabilities
Trade and other payables 8,939 70 9,009
Total Liabilities 62,947 (70) 62,877
Equity
Retained earnings 49,790 225 50,015
AASB 9 Financial Instruments
AASB 9 Financial Instruments replaces AASB 139 Financial Instruments: Recognition and
Measurement. It makes major changes to the previous guidance on the classification and measurement
of financial assets and introduces an ‘expected credit loss’ model for impairment of financial assets.
When adopting AASB 9, the Group has applied transitional relief and opted not to restate prior periods.
Differences arising from the adoption of AASB 9 in relation to classification, measurement, and
impairment are recognised in opening retained earnings as at 1 January 2018.
AASB 9 also contains new requirements on the application of hedge accounting. The new hedge
accounting looks to the align hedge accounting with entities’ risk management activities look to align
hedge accounting more closely with entities’ risk management activities by increasing the eligibility of
both hedged items and hedging instruments and introducing a more principles-based approach to
assessing hedge effectiveness.
The adoption of AASB 9 has impacted the following areas:
Classification and measurement of the Group’s financial assets
Listed equity investments - Available for sale financial assets under AASB 139 included listed equity
investments of $343,000 at 31 December 2017. These were reclassified to fair value through profit or
loss (FVPL) under AASB 9. $22,000 was transferred from the available for sale financial assets reserve
to retained earnings on 1 January 2018.
Unlisted equity investments - Available for sale financial assets under AASB 139 included unlisted
equity investments in XY Ltd of $433,000 at 31 December 2017 that were measured at cost less
impairment because fair value could not be reliably measured. These were reclassified to fair value
through other comprehensive income (equity FVOCI) under AASB 9 because this is held as a long-term
investment and remeasured at fair value of $460,000. Retained earnings was increased by $27,000 on
1 January 2018 (relating to a previous impairment). There was no transfer from available for sale
financial asset reserve to the equity FVOCI reserve on 1 January 2018.
Corporate bonds - Available for sale financial assets under AASB 139 included corporate bonds of
$1,915,000 at 31 December 2017. These were reclassified to fair value through other comprehensive
income (debt FVOCI) under AASB 9. At the date of initial application the Group’s business model is to
both to collect contractual cash flows and sell the bonds. The contractual cash flows are solely principal
and interest. There was no transfer from available for sale financial asset reserve to the debt FVOCI
reserve on 1 January 2018.
AASB 9.7.2.15
AASB 9.7.2.22 AASB 9.7.2.24
AASB 9.7.2.22 AASB 9.7.2.24
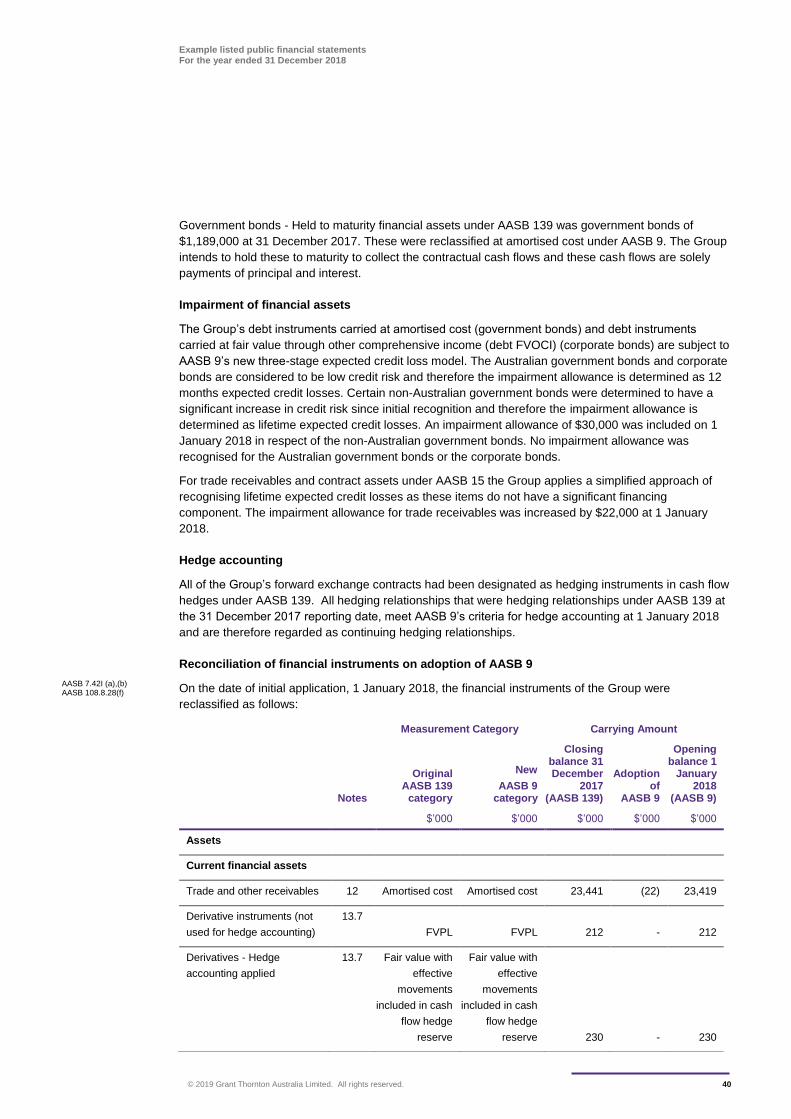
Example listed public financial statements For the year ended 31 December 2018
© 2019 Grant Thornton Australia Limited. All rights reserved. 40
Government bonds - Held to maturity financial assets under AASB 139 was government bonds of
$1,189,000 at 31 December 2017. These were reclassified at amortised cost under AASB 9. The Group
intends to hold these to maturity to collect the contractual cash flows and these cash flows are solely
payments of principal and interest.
Impairment of financial assets
The Group’s debt instruments carried at amortised cost (government bonds) and debt instruments
carried at fair value through other comprehensive income (debt FVOCI) (corporate bonds) are subject to
AASB 9’s new three-stage expected credit loss model. The Australian government bonds and corporate
bonds are considered to be low credit risk and therefore the impairment allowance is determined as 12
months expected credit losses. Certain non-Australian government bonds were determined to have a
significant increase in credit risk since initial recognition and therefore the impairment allowance is
determined as lifetime expected credit losses. An impairment allowance of $30,000 was included on 1
January 2018 in respect of the non-Australian government bonds. No impairment allowance was
recognised for the Australian government bonds or the corporate bonds.
For trade receivables and contract assets under AASB 15 the Group applies a simplified approach of
recognising lifetime expected credit losses as these items do not have a significant financing
component. The impairment allowance for trade receivables was increased by $22,000 at 1 January
2018.
Hedge accounting
All of the Group’s forward exchange contracts had been designated as hedging instruments in cash flow
hedges under AASB 139. All hedging relationships that were hedging relationships under AASB 139 at
the 31 December 2017 reporting date, meet AASB 9’s criteria for hedge accounting at 1 January 2018
and are therefore regarded as continuing hedging relationships.
Reconciliation of financial instruments on adoption of AASB 9
On the date of initial application, 1 January 2018, the financial instruments of the Group were
reclassified as follows:
AASB 7.42I (a),(b) AASB 108.8.28(f)
Measurement Category Carrying Amount
Notes
Original AASB 139
category
New
AASB 9 category
Closing balance 31 December
2017 (AASB 139)
Adoption of
AASB 9
Opening balance 1
January 2018
(AASB 9)
$’000 $’000 $’000 $’000 $’000
Assets
Current financial assets
Trade and other receivables 12 Amortised cost Amortised cost 23,441 (22) 23,419
Derivative instruments (not
used for hedge accounting)
13.7
FVPL FVPL 212 - 212
Derivatives - Hedge
accounting applied
13.7 Fair value with
effective
movements
included in cash
flow hedge
reserve
Fair value with
effective
movements
included in cash
flow hedge
reserve 230 - 230
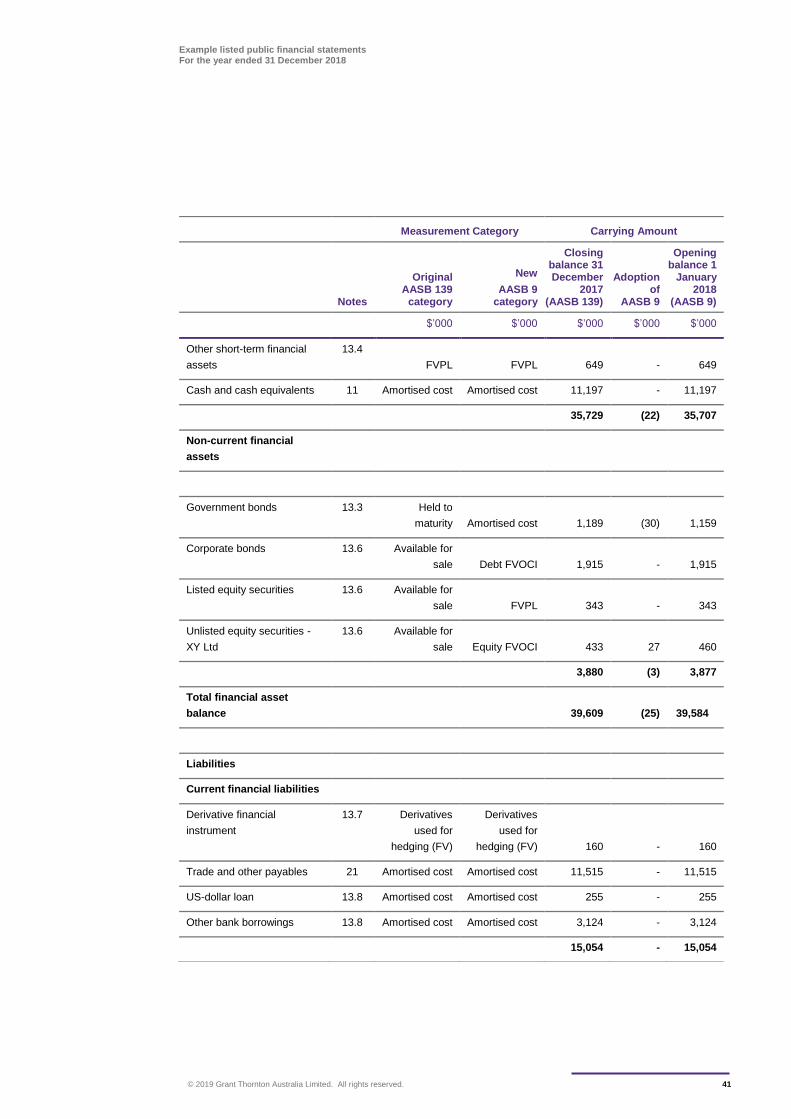
Example listed public financial statements For the year ended 31 December 2018
© 2019 Grant Thornton Australia Limited. All rights reserved. 41
Measurement Category Carrying Amount
Notes
Original AASB 139
category
New
AASB 9 category
Closing balance 31 December
2017 (AASB 139)
Adoption of
AASB 9
Opening balance 1
January 2018
(AASB 9)
$’000 $’000 $’000 $’000 $’000
Other short-term financial
assets
13.4
FVPL FVPL 649 - 649
Cash and cash equivalents 11 Amortised cost Amortised cost 11,197 - 11,197
35,729 (22) 35,707
Non-current financial
assets
Government bonds 13.3 Held to
maturity Amortised cost 1,189 (30) 1,159
Corporate bonds 13.6 Available for
sale Debt FVOCI 1,915 - 1,915
Listed equity securities 13.6 Available for
sale FVPL 343 - 343
Unlisted equity securities -
XY Ltd
13.6 Available for
sale Equity FVOCI 433 27 460
3,880 (3) 3,877
Total financial asset
balance 39,609 (25) 39,584
Liabilities
Current financial liabilities
Derivative financial
instrument
13.7 Derivatives
used for
hedging (FV)
Derivatives
used for
hedging (FV) 160 - 160
Trade and other payables 21 Amortised cost Amortised cost 11,515 - 11,515
US-dollar loan 13.8 Amortised cost Amortised cost 255 - 255
Other bank borrowings 13.8 Amortised cost Amortised cost 3,124 - 3,124
15,054 - 15,054
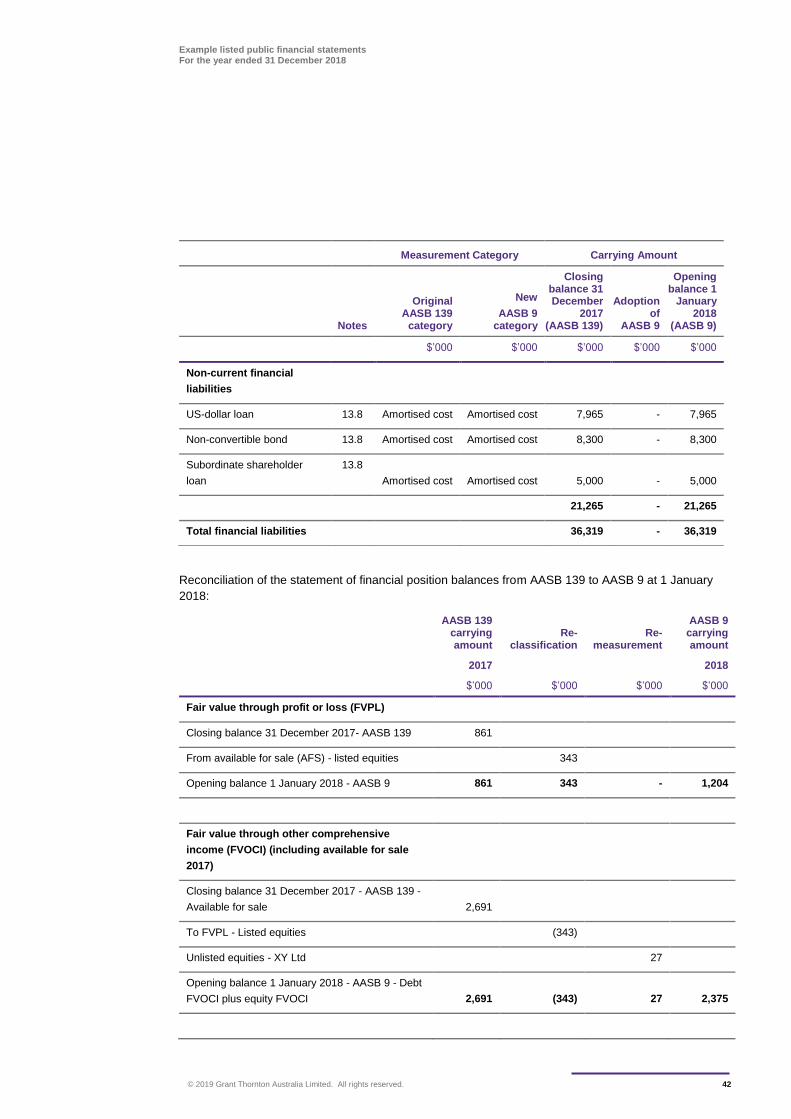
Example listed public financial statements For the year ended 31 December 2018
© 2019 Grant Thornton Australia Limited. All rights reserved. 42
Reconciliation of the statement of financial position balances from AASB 139 to AASB 9 at 1 January
2018:
AASB 139 carrying amount
Re-classification
Re-measurement
AASB 9 carrying amount
2017 2018
$’000 $’000 $’000 $’000
Fair value through profit or loss (FVPL)
Closing balance 31 December 2017- AASB 139 861
From available for sale (AFS) - listed equities 343
Opening balance 1 January 2018 - AASB 9 861 343 - 1,204
Fair value through other comprehensive
income (FVOCI) (including available for sale
2017)
Closing balance 31 December 2017 - AASB 139 -
Available for sale 2,691
To FVPL - Listed equities (343)
Unlisted equities - XY Ltd 27
Opening balance 1 January 2018 - AASB 9 - Debt
FVOCI plus equity FVOCI 2,691 (343) 27 2,375
Measurement Category Carrying Amount
Notes
Original AASB 139
category
New
AASB 9 category
Closing balance 31 December
2017 (AASB 139)
Adoption of
AASB 9
Opening balance 1
January 2018
(AASB 9)
$’000 $’000 $’000 $’000 $’000
Non-current financial
liabilities
US-dollar loan 13.8 Amortised cost Amortised cost 7,965 - 7,965
Non-convertible bond 13.8 Amortised cost Amortised cost 8,300 - 8,300
Subordinate shareholder
loan
13.8
Amortised cost Amortised cost 5,000 - 5,000
21,265 - 21,265
Total financial liabilities 36,319 - 36,319
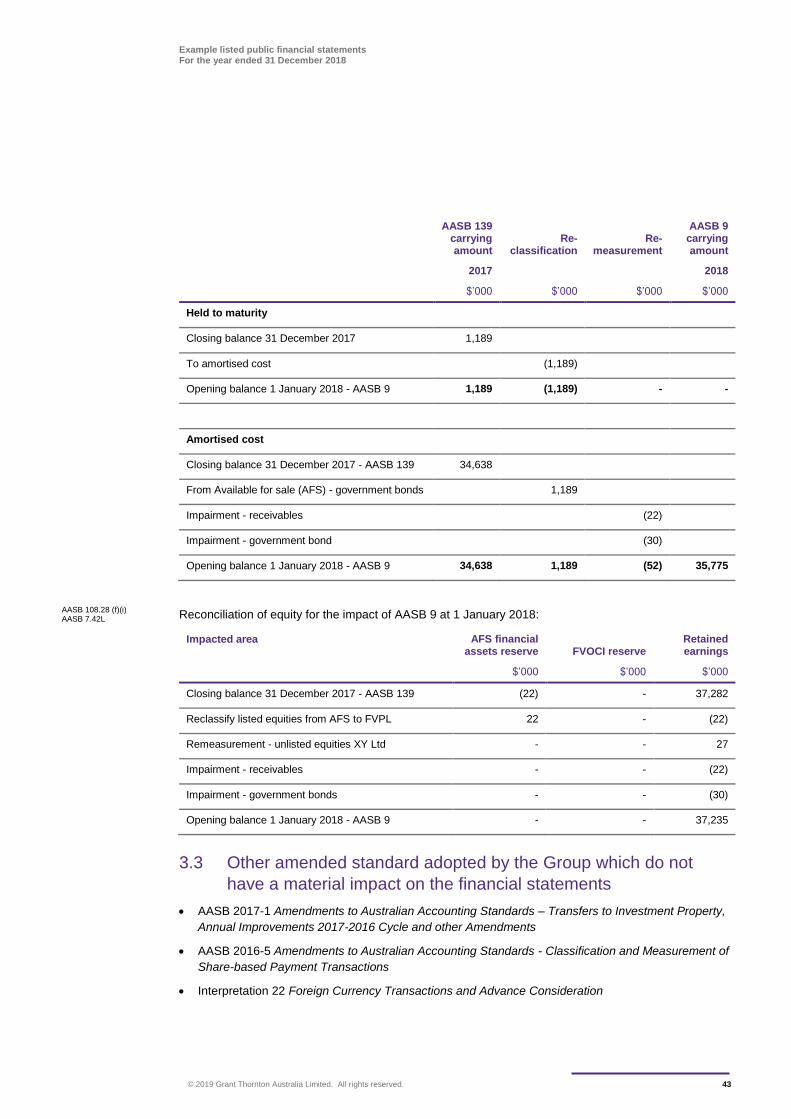
Example listed public financial statements For the year ended 31 December 2018
© 2019 Grant Thornton Australia Limited. All rights reserved. 43
AASB 139 carrying amount
Re-classification
Re-measurement
AASB 9 carrying amount
2017 2018
$’000 $’000 $’000 $’000
Held to maturity
Closing balance 31 December 2017 1,189
To amortised cost (1,189)
Opening balance 1 January 2018 - AASB 9 1,189 (1,189) - -
Amortised cost
Closing balance 31 December 2017 - AASB 139 34,638
From Available for sale (AFS) - government bonds 1,189
Impairment - receivables (22)
Impairment - government bond (30)
Opening balance 1 January 2018 - AASB 9 34,638 1,189 (52) 35,775
Reconciliation of equity for the impact of AASB 9 at 1 January 2018:
Impacted area AFS financial assets reserve FVOCI reserve
Retained earnings
$’000 $’000 $’000
Closing balance 31 December 2017 - AASB 139 (22) - 37,282
Reclassify listed equities from AFS to FVPL 22 - (22)
Remeasurement - unlisted equities XY Ltd - - 27
Impairment - receivables - - (22)
Impairment - government bonds - - (30)
Opening balance 1 January 2018 - AASB 9 - - 37,235
3.3 Other amended standard adopted by the Group which do not
have a material impact on the financial statements
AASB 2017-1 Amendments to Australian Accounting Standards – Transfers to Investment Property,
Annual Improvements 2017-2016 Cycle and other Amendments
AASB 2016-5 Amendments to Australian Accounting Standards - Classification and Measurement of
Share-based Payment Transactions
Interpretation 22 Foreign Currency Transactions and Advance Consideration
AASB 108.28 (f)(i) AASB 7.42L
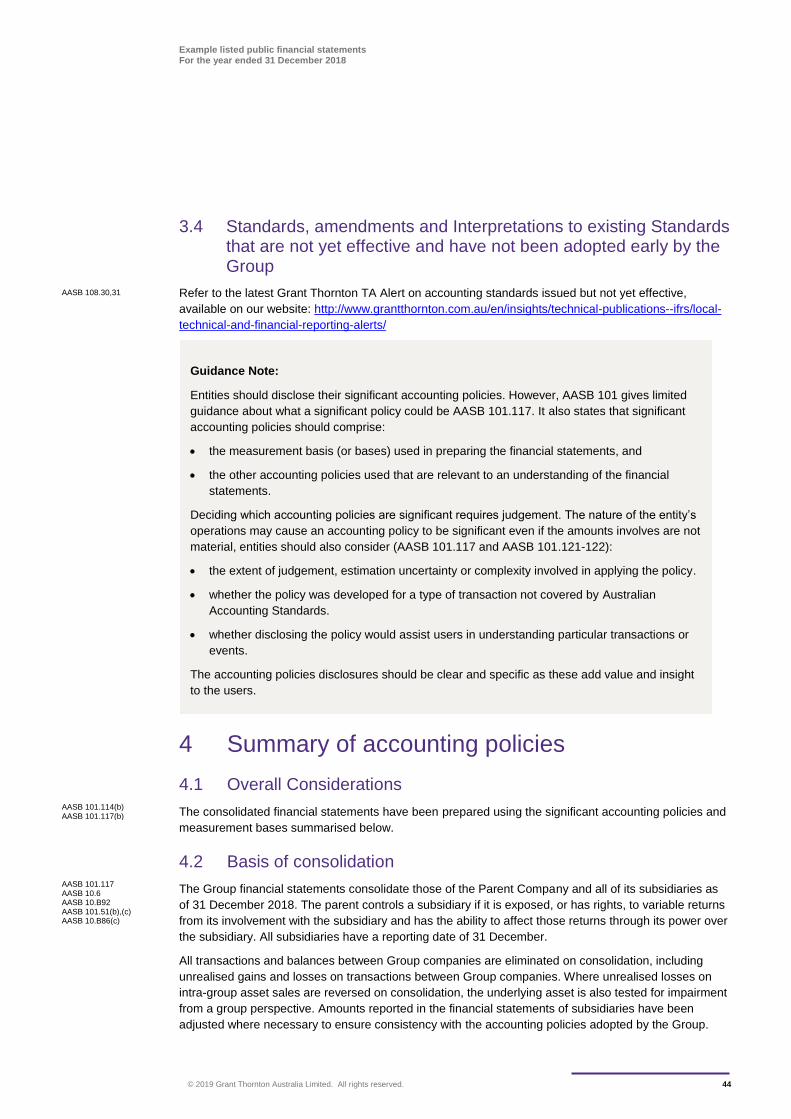
Example listed public financial statements For the year ended 31 December 2018
© 2019 Grant Thornton Australia Limited. All rights reserved. 44
3.4 Standards, amendments and Interpretations to existing Standards that are not yet effective and have not been adopted early by the Group
Refer to the latest Grant Thornton TA Alert on accounting standards issued but not yet effective,
available on our website: http://www.grantthornton.com.au/en/insights/technical-publications--ifrs/local-
technical-and-financial-reporting-alerts/
4 Summary of accounting policies
4.1 Overall Considerations
The consolidated financial statements have been prepared using the significant accounting policies and
measurement bases summarised below.
4.2 Basis of consolidation
The Group financial statements consolidate those of the Parent Company and all of its subsidiaries as
of 31 December 2018. The parent controls a subsidiary if it is exposed, or has rights, to variable returns
from its involvement with the subsidiary and has the ability to affect those returns through its power over
the subsidiary. All subsidiaries have a reporting date of 31 December.
All transactions and balances between Group companies are eliminated on consolidation, including
unrealised gains and losses on transactions between Group companies. Where unrealised losses on
intra-group asset sales are reversed on consolidation, the underlying asset is also tested for impairment
from a group perspective. Amounts reported in the financial statements of subsidiaries have been
adjusted where necessary to ensure consistency with the accounting policies adopted by the Group.
AASB 108.30,31
AASB 101.114(b) AASB 101.117(b)
AASB 101.117 AASB 10.6 AASB 10.B92 AASB 101.51(b),(c) AASB 10.B86(c)
Guidance Note:
Entities should disclose their significant accounting policies. However, AASB 101 gives limited
guidance about what a significant policy could be AASB 101.117. It also states that significant
accounting policies should comprise:
the measurement basis (or bases) used in preparing the financial statements, and
the other accounting policies used that are relevant to an understanding of the financial
statements.
Deciding which accounting policies are significant requires judgement. The nature of the entity’s
operations may cause an accounting policy to be significant even if the amounts involves are not
material, entities should also consider (AASB 101.117 and AASB 101.121-122):
the extent of judgement, estimation uncertainty or complexity involved in applying the policy.
whether the policy was developed for a type of transaction not covered by Australian
Accounting Standards.
whether disclosing the policy would assist users in understanding particular transactions or
events.
The accounting policies disclosures should be clear and specific as these add value and insight
to the users.
Example listed public financial statements For the year ended 31 December 2018
© 2019 Grant Thornton Australia Limited. All rights reserved. 45
Profit or loss and other comprehensive income of subsidiaries acquired or disposed of during the year
are recognised from the effective date of acquisition, or up to the effective date of disposal, as
applicable.
Non-controlling interests, presented as part of equity, represent the portion of a subsidiary’s profit or
loss and net assets that is not held by the Group. The Group attributes total comprehensive income or
loss of subsidiaries between the owners of the parent and the non-controlling interests based on their
respective ownership interests.
4.3 Business combination
The Group applies the acquisition method in accounting for business combinations. The consideration
transferred by the Group to obtain control of a subsidiary is calculated as the sum of the acquisition-date
fair values of assets transferred, liabilities incurred and the equity interests issued by the Group, which
includes the fair value of any asset or liability arising from a contingent consideration arrangement.
Acquisition costs are expensed as incurred.
The Group recognises identifiable assets acquired and liabilities assumed in a business combination
regardless of whether they have been previously recognised in the acquiree’s financial statements prior
to the acquisition. Assets acquired and liabilities assumed are generally measured at their acquisition-
date fair values.
Goodwill is stated after separate recognition of identifiable intangible assets. It is calculated as the
excess of the sum of: (a) fair value of consideration transferred, (b) the recognised amount of any non-
controlling interest in the acquire, and (c) acquisition-date fair value of any existing equity interest in the
acquiree, over the acquisition-date fair values of identifiable net assets. If the fair values of identifiable
net assets exceed the sum calculated above, the excess amount (i.e. gain on a bargain purchase) is
recognised in profit or loss immediately.
4.4 Investments in associates and joint arrangements
Associates are those entities over which the Group is able to exert significant influence but which are
not subsidiaries.
A joint venture is an arrangement that the Group controls jointly with one or more other investors, and
over which the Group has rights to a share of the arrangement’s net assets rather than direct rights to
underlying assets and obligations for underlying liabilities. A joint arrangement in which the Group has
direct rights to underlying assets and obligations for underlying liabilities is classified as a joint
operation.
Investments in associates and joint ventures are accounted for using the equity method. Interests in
joint operations are accounted for by recognising the Group’s assets (including its share of any assets
held jointly), its liabilities (including its share of any liabilities incurred jointly), its revenue from the sale of
its share of the output arising from the joint operation, its share of the revenue from the sale of the
output by the joint operation and its expenses (including its share of any expenses incurred jointly).
Any goodwill or fair value adjustment attributable to the Group’s share in the associate or joint venture is
not recognised separately and is included in the amount recognised as investment.
The carrying amount of the investment in associates and joint ventures is increased or decreased to
recognise the Group’s share of the profit or loss and other comprehensive income of the associate and
joint venture, adjusted where necessary to ensure consistency with the accounting policies of the
Group.
Unrealised gains and losses on transactions between the Group and its associates and joint ventures
are eliminated to the extent of the Group’s interest in those entities. Where unrealised losses are
eliminated, the underlying asset is also tested for impairment.
AASB 10B88
AASB 10.22 AASB 10.B94
AASB 101.117(a) AASB 101.117(b) AASB 3.4 AASB 3.37 AASB 3.18
AASB 11.15-16
AASB 128.10
AASB 11.24
Example listed public financial statements For the year ended 31 December 2018
© 2019 Grant Thornton Australia Limited. All rights reserved. 46
4.5 Foreign currency translation
Functional and presentation currency
The consolidated financial statements are presented in Australian Dollars ($AUD), which is also the
functional currency of the Parent Company.
Foreign currency transactions and balances
Foreign currency transactions are translated into the functional currency of the respective Group entity,
using the exchange rates prevailing at the dates of the transactions (spot exchange rate). Foreign
exchange gains and losses resulting from the settlement of such transactions and from the re-
measurement of monetary items at year end exchange rates are recognised in profit or loss.
Non-monetary items are not retranslated at year-end and are measured at historical cost (translated
using the exchange rates at the date of the transaction), except for non-monetary items measured at fair
value which are translated using the exchange rates at the date when fair value was determined.
Foreign operations
In the Group’s financial statements, all assets, liabilities and transactions of Group entities with a
functional currency other than the Australian-Dollar ($AUD) are translated into $AUD upon
consolidation. The functional currency of the entities in the Group has remained unchanged during the
reporting period.
On consolidation, assets and liabilities have been translated into $AUD at the closing rate at the
reporting date. Goodwill and fair value adjustments arising on the acquisition of a foreign entity have
been treated as assets and liabilities of the foreign entity and translated into $AUD at the closing rate.
Income and expenses have been translated into $AUD at the average rate over the reporting period.
Exchange differences are charged or credited to other comprehensive income and recognised in the
currency translation reserve in equity.
On disposal of a foreign operation the cumulative translation differences recognised in equity are
reclassified to profit or loss and recognised as part of the gain or loss on disposal.
4.6 Segment reporting
The Group has three operating segments: consulting, service and retain segments. In identifying its
operating segments, management generally follows the Group’s service lines, which represent the main
products and services provided by the Group.
The activities undertaken by the consulting segment includes the sale, customisation and integration of
IT and telecommunication systems. Maintenance of these systems is undertaken by the service
segment. The retail segment includes the entire Group’s internet-based selling activities of hardware
and software products.
Each of these operating segments is managed separately as each of these service lines requires
different technologies and other resources as well as marketing approaches. All inter-segment transfers
are carried out at arm's length prices.
The measurement policies the Group uses for segment reporting under AASB 8 are the same as those
used in its financial statements, except that:
post-employment benefit expenses
expenses relating to share-based payments
research costs relating to new business activities; and
AASB 121.53 AASB 101.51(d)
AASB 101.117(a) AASB 101.117(b)
AASB 121.47
AASB 121.,48
AASB 8.22(a)
AASB 8.22(b)
AASB 8.27(a)
AASB 8.27(b-d)
Example listed public financial statements For the year ended 31 December 2018
© 2019 Grant Thornton Australia Limited. All rights reserved. 47
revenue, costs and fair value gains from investment property
are not included in arriving at the operating profit of the operating segments. In addition, corporate
assets which are not directly attributable to the business activities of any operating segment are not
allocated to a segment. In the financial periods under review, this primarily applies to the Group’s
headquarters and the Illustrative Research Lab in Greatville.
There have been no changes from prior periods in the measurement methods used to determine
reported segment profit or loss.
4.7 Revenue
Revenue arises mainly from the sale of telecommunications hardware and software, after-sales
maintenance and extended warranty services, consulting and IT services, and contracts for the
construction of telecommunication systems.
To determine whether to recognise revenue, the Group follows a 5-step process:
1 Identifying the contract with a customer
2 Identifying the performance obligations
3 Determining the transaction price
4 Allocating the transaction price to the performance obligations
5 Recognising revenue when/as performance obligation(s) are satisfied.
The Group often enters into transactions involving a range of the Group’s products and services, for
example for the delivery of telecommunications hardware, software and related after-sales service. In all
cases, the total transaction price for a contract is allocated amongst the various performance obligations
based on their relative stand-alone selling prices. The transaction price for a contract excludes any
amounts collected on behalf of third parties.
Revenue is recognised either at a point in time or over time, when (or as) the Group satisfies
performance obligations by transferring the promised goods or services to its customers.
The Group recognises contract liabilities for consideration received in respect of unsatisfied
performance obligations and reports these amounts as other liabilities in the statement of financial
position. Similarly, if the Group satisfies a performance obligation before it receives the consideration,
the Group recognises either a contract asset or a receivable in its statement of financial position,
depending on whether something other than the passage of time is required before the consideration is
due.
Hardware and software
Revenue from sale of hardware or software for a fixed fee with no significant service obligation is
recognised when or as the Group has transferred control of the assets to the customer. Invoices for
goods or services transferred are due upon receipt of customer.
AASB 8.27(e)
AASB 101.117(b)
AASB 15.9-12 AASB 15.22 AASB 15.47 AASB 15.73 AASB 15.31 AASB 15.49 AASB 15.74 AASB 15.47
AASB 15.106 AASB 15.107 AASB 15.108
AASB 101.117(b) AASB 15.31 AASB 15.119(a)
Guidance Note:
Revenue is one of the most important line items for most entities, and therefore a policy is
almost always disclosed. Entities with multiple revenue streams should always remember to
address each significant revenue stream separately.
Example listed public financial statements For the year ended 31 December 2018
© 2019 Grant Thornton Australia Limited. All rights reserved. 48
For stand-alone sales of telecommunications hardware and/or software that are neither customised by
the Group nor subject to significant integration services, control transfers at the point in time the
customer takes undisputed delivery of the goods. When such items are either customised or sold
together with significant integration services, the goods and services represent a single combined
performance obligation over which control is considered to transfer over time. This is because the
combined product is unique to each customer (has no alternative use) and the Group has an
enforceable right to payment for the work completed to date. Revenue for these performance obligations
is recognised over time as the customisation or integration work is performed, using the cost-to-cost
method to estimate progress towards completion. As costs are generally incurred uniformly as the work
progresses and are considered to be proportionate to the entity’s performance, the cost-to-cost method
provides a faithful depiction of the transfer of goods and services to the customer.
For sales of software that are neither customised by the Group nor subject to significant integration
services, the licence period commences upon delivery. For sales of software subject to significant
customisation or integration services, the licence period begins upon commencement of the related
services.
The Group’s retail division operates a customer loyalty incentive programme. For each $100 spent,
customers obtain one loyalty point which they can redeem to receive discounts on future purchases.
Loyalty points are considered to be a separate performance obligation as they provide customers with a
material right they would not have received otherwise. Unused points will expire if not used within two
years. The Group allocates the transaction price between the material right and other performance
obligations identified in a contract on a relative stand-alone selling price basis. Revenue from the
material right is recognised on the earlier of the date the points are redeemed by the customer and the
date on which they expire.
The Group provides a basic 1-year product warranty on its telecommunications hardware whether sold
on a stand-alone basis or as part of an integrated telecommunications system. Under the terms of this
warranty customers can return product for repair or replacement if it fails to perform in accordance with
published specifications. These warranties are accounted for under AASB 137 Provisions, Contingent
Liabilities and Contingent Assets.
After-Sales Services
The Group enters into fixed price maintenance and extended warranty contracts with its customers for
terms between one and three years in length. Customers are required to pay in advance for each
twelve-month service period and the relevant payment due dates are specified in each contract.
Maintenance contracts – The Group enters into agreements with its customers to perform regularly
scheduled maintenance services on telecommunications hardware purchased from the Group.
Revenue is recognised over time based on the ratio between the number of hours of maintenance
services provided in the current period and the total number of such hours expected to be provided
under each contract. This method best depicts the transfer of services to the customer because: (a)
details of the services to be provided are specified by management in advance as part of its
published maintenance program, and (b) the Group has a long history of providing these services to
its customers, allowing it to make reliable estimates of the total number of hours involved in
providing the service.
Extended warranty program – The Group enters into agreements with purchasers of its
telecommunications hardware to perform necessary repairs falling outside the Group’s standard
warranty period. As this service involves an indeterminate number of acts, the Group is required to
‘stand ready’ to perform whenever a request falling within the scope of the program is made by a
customer. Revenue is recognised on a straight-line basis over the term of the contract. This method
best depicts the transfer of services to the customer as (a) the company’s historical experience
demonstrates no statistically significant variation in the quantum of services provided in each year of
a multi-year contract, and (b) no reliable prediction can be made as to if and when any individual
customer will require service.
AASB 15.35(c) AASB 15.B40 AASB 15.74
AASB 15.124(b) AASB 15.35(a) AASB 15.124 (a)
AASB 15.124(b)
Example listed public financial statements For the year ended 31 December 2018
© 2019 Grant Thornton Australia Limited. All rights reserved. 49
Consulting and IT Services
The Group provides consulting services relating to the design of telecommunications systems strategies
and IT security. Revenue from those services is recognised on a time-and-material basis as services
are provided. Customers are invoices weekly as work progresses. Any amounts remaining unbilled at
the end of the reporting period are presented in the statement of financial position as accounts
receivables.
The Group also provides IT outsourcing services including payroll and accounts payable transaction
processing to customers in exchange for a fixed monthly fee. Revenue is recognised on a straight-line
basis over the term of each contract. As the amount of work required to perform under these contracts
does not vary significantly from month-to-month, the straight-line method provides a faithful depiction of
the transfer of goods or services.
Construction of telecommunication systems
The Group enters into contracts for the design, development and installation of telecommunication
systems in exchange for a fixed fee and recognises the related revenue over time. Due to the high
degree of interdependence between the various elements of these projects, they are accounted for as a
single performance obligation. When a contract also includes promises to perform after-sales services,
the total transaction price is allocated to each of the distinct performance obligations identifiable under
the contract on the basis of its relative stand-alone selling price.
To depict the progress by which the Group transfers control of the systems to the customer, and to
establish when and to what extent revenue can be recognised, the Group measures its progress
towards complete satisfaction of the performance obligation by comparing actual hours spent to date
with the total estimated hours required to design, develop, and install each system. The hours-to-hours
basis provides the most faithful depiction of the transfer of goods and services to each customer due to
the Group’s ability to make reliable estimates of the total number of hours required to perform, arising
from its significant historical experience constructing similar systems.
In addition to the fixed fee, some contracts include bonus payments which the Group can earn by
completing a project in advance of a targeted delivery date. At inception of each contract the Group
begins by estimating the amount of the bonus to be received using the “most likely amount” approach.
This amount is then included in the Group’s estimate of the transaction price only if it is highly probable
that a significant reversal of revenue will not occur once any uncertainty surrounding the bonus is
resolved. In making this assessment, the Group considers its historical record of performance on
similar contracts, whether the Group has access to the labour and materials resources needed to
exceed the agreed-upon completion date, and the potential impact of other reasonably foreseen
constraints
AASB 15.35(c) AASB 15.124(a) AASB 15.107
AASB 15.35(b) AASB 15.74
AASB 15.39 AASB 15.41 AASB 15.124 (a)
AASB 15.106 AASB 15.63
Guidance Note:
The Group provides both standard-type warranties accounted for under AASB 137 and
extended-type warranties treated as separate performance obligations in AASB 15. When
determining the nature of warranty-related promises, an entity considers:
Whether the customer has the options to separately purchase the warranty
Whether all or part of the warranty provides the customer with an additional service beyond
the basic assurance that it will perform in accordance with published specifications.
Example listed public financial statements For the year ended 31 December 2018
© 2019 Grant Thornton Australia Limited. All rights reserved. 50
Most such arrangements include detailed customer payment schedules. When payments received from
customers exceed revenue recognised to date on a particular contract, any excess (a contract liability)
is reported in the statement of financial position under other liabilities.
The construction of telecommunication systems normally takes 10–12 months from commencement of
design through to completion of installation. As the period of time between customer payment and
performance will always be one year or less, the Group applies the practical expedient in AASB 15.63
and does not adjust the promised amount of consideration for the effects of financing.
In obtaining these contracts, the Group incurs a number of incremental costs, such as commissions paid
to sales staff. The Group recognises such incremental costs as a contract asset if it expects to recover
those costs from the customer. The contract asset is then amortised on a systematic basis consistent
with the transfer to the customer of the good or service to which the contract asset relates. Where the
amortisation period of these costs, if capitalised, would be less than one year, the Group makes use of
the practical expedient in AASB 15.94 and expenses them as they are incurred.
Accounting policy applicable to comparative period (31 December 2017)
Revenue arises from the sale of goods and the rendering of services plus the Group’s share of revenue
of its joint ventures. It is measured by reference to the fair value of consideration received or receivable,
excluding sales taxes, rebates, and trade discounts.
The Group often enters into sales transactions involving a range of the Group’s products and services,
for example for the delivery of hardware, software and related after-sales service. The Group applies the
revenue recognition criteria set out below to each separately identifiable component of the sales
transaction in order to reflect the substance of the transaction. The consideration received from these
multiple-component transactions are allocated to the separately identifiable component in proportion to
its relative fair value.
Sale of goods (hardware or software)
Sale of goods is recognised when the Group has transferred to the buyer the significant risks and
rewards of ownership, generally when the customer has taken undisputed delivery of the goods.
Revenue from the sale of goods with no significant service obligation is recognised on delivery. Where
significant tailoring, modification or integration is required, revenue is recognised in the same way as
construction contracts for telecommunication systems described below.
When goods are sold together with customer loyalty incentives, the consideration receivable is allocated
between the sale of goods and sale of incentives based on their fair values. Revenue from sales of
incentives is recognised when incentives are redeemed by customers in exchange for products supplied
by the Group. Rendering of services.
The Group generates revenues from after-sales service and maintenance, consulting, and construction
contracts for telecommunication solutions. Consideration received for those services is initially deferred,
included in other liabilities and is recognised as revenue in the period when the service is performed.
In recognising after-sales service and maintenance revenues, the Group considers the nature of the
services and the customer’s use of the related products, based on historical experience. Revenue from
consulting services is recognised when the services are provided by reference to the contract’s stage of
completion at the reporting date in the same way as construction contracts for telecommunication
systems described below.
The Group also earns rental income from operating leases of its investment properties. Rental income is
recognised on a straight-line basis over the term of the lease.
AASB 15.91 AASB 15.94
AASB 101.117(b)
AASB 101.117(b)
Example listed public financial statements For the year ended 31 December 2018
© 2019 Grant Thornton Australia Limited. All rights reserved. 51
Construction contracts for telecommunication solutions
Construction contracts for telecommunication systems specify a fixed price for the development and
installation of IT and telecommunication systems.
When the outcome can be assessed reliably, contract revenue and associated costs are recognised by
reference to the stage of completion of the contract activity at the reporting date. Revenue is measured
at the fair value of consideration received or receivable in relation to that activity.
When the Group cannot measure the outcome of a contract reliably, revenue is recognised only to the
extent of contract costs that have been incurred and are recoverable. Contract costs are recognised in
the period in which they are incurred.
In either situation, when it is probable that total contract costs will exceed total contract revenue, the
expected loss is recognised immediately in profit or loss.
A construction contracts’ stage of completion is assessed by management based on milestones (usually
defined in the contract) for the activities to be carried out under the contract and other available relevant
information at the reporting date. The maximum amount of revenue to be recognised for each milestone
is determined by estimating relative contract fair values of each project phase (i.e. by comparing the
Group’s overall contract revenue with the expected profit for each corresponding milestone). Progress
and related contract revenue in-between milestones is determined by comparing costs incurred to date
with the total estimated costs for that particular milestone (a procedure sometimes referred to as the
cost-to-cost method).
The gross amount due from customers for contract work is presented within trade and other receivables
for all contracts in progress for which costs incurred plus recognised profits (less recognised losses)
exceed progress billings. The gross amount due to customers for contract work is presented within other
liabilities for all contracts in progress for which progress billings exceed costs incurred plus recognised
profits (less recognised losses).
Interest and dividend income
Interest income and expenses are reported on an accrual basis using the effective interest method.
Dividends, other than those from investments in associates, are recognised at the time the right to
receive payment is established.
4.8 Operating expenses
Operating expenses are recognised in profit or loss upon utilisation of the service or at the date of their
origin. Expenditure for warranties is recognised and charged against the associated provision when the
related revenue is recognised.
4.9 Borrowing costs
Borrowing costs directly attributable to the acquisition, construction or production of a qualifying asset
are capitalised during the period of time that is necessary to complete and prepare the asset for its
intended use or sale. Other borrowing costs are expensed in the period in which they are incurred and
reported in finance costs.
AASB 101.117(b)
AASB 111.39(b) AASB 118.35(a)
AASB 101.117(a) AASB 111.39(c) AASB 101.122
AASB 118.30
AASB 101.117(b) AASB 137.14
AASB 101.117(b) AASB 123.8
Example listed public financial statements For the year ended 31 December 2018
© 2019 Grant Thornton Australia Limited. All rights reserved. 52
4.10 Profit or loss from discontinued operations
A discontinued operation is a component of the entity that either has been disposed of, or is classified
as held for sale, and:
represents a separate major line of business or geographical area of operations
is part of a single coordinated plan to dispose of a separate major line of business or geographical
area of operations; or
is a subsidiary acquired exclusively with a view to resale
Profit or loss from discontinued operations, including prior year components of profit or loss, are
presented in a single amount in the statement of profit or loss and other comprehensive income. This
amount, which comprises the post-tax profit or loss of discontinued operations and the post-tax gain or
loss resulting from the measurement and disposal of assets classified as held for sale.
The disclosures for discontinued operations in the prior year relate to all operations that have been
discontinued by the reporting date for the latest period presented.
4.11 Goodwill
Goodwill represents the future economic benefits arising from a business combination that are not
individually identified and separately recognised. Goodwill is carried at cost less accumulated
impairment losses.
4.12 Other intangible assets
Recognition of other intangible assets
Brand names and customer list
Brand names and customer lists acquired in a business combination that qualify for separate recognition
are recognised as intangible assets at their fair values (see Note 4.3).
Internally developed software
Expenditure on the research phase of projects to develop new customised software for IT and
telecommunication systems is recognised as an expense as incurred.
Costs that are directly attributable to a project’s development phase are recognised as intangible assets,
provided they meet the following recognition requirements:
the development costs can be measured reliably
the project is technically and commercially feasible
the Group intends to and has sufficient resources to complete the project
the Group has the ability to use or sell the software; and
the software will generate probable future economic benefits
Development costs not meeting these criteria for capitalisation are expensed as incurred.
Costs that are directly attributable include employees’ (other than Directors’) costs incurred on software
development, along with an appropriate portion of relevant overheads and borrowing costs.
AASB 5.32
AASB 5.33
AASB 5.34
AASB 3 - Appendix A
AASB 138.118(a) AASB 138.118(b) AASB 101.117(b)
AASB 138.57 AASB 101.117(b)
Example listed public financial statements For the year ended 31 December 2018
© 2019 Grant Thornton Australia Limited. All rights reserved. 53
Subsequent measurement
All finite-lived intangible assets, including capitalised internally developed software, are accounted for
using the cost model whereby capitalised costs are amortised on a straight-line basis over their
estimated useful lives. Residual values and useful lives are reviewed at each reporting date. In addition,
they are subject to impairment testing as described in Note 4.15.
The following useful lives are applied:
software: 3-5 years
brand names: 15-20 years
customer lists: 4-6 years
Any capitalised internally developed software that is not yet complete is not amortised but is subject to
impairment testing as described in Note 4.15.
Amortisation has been included within depreciation, amortisation and impairment of non-financial
assets.
Subsequent expenditures on the maintenance of computer software and brand names are expensed as
incurred.
When an intangible asset is disposed of, the gain or loss on disposal is determined as the difference
between the proceeds and the carrying amount of the asset, and is recognised in profit or loss within
other income or other expenses.
4.13 Property, plant and equipment
Land
Land held for use in production or administration is stated at revalued amounts. Revalued amounts are
fair market values based on appraisals prepared by external professional valuers once every two years
or more frequently if market factors indicate a material change in fair value. Any revaluation surplus
arising upon appraisal of land is recognised in other comprehensive income and credited to the
revaluation reserve in equity. To the extent that any revaluation decrease or impairment loss has
previously been recognised in profit or loss, a revaluation increase is credited to profit or loss with the
remaining part of the increase recognised in other comprehensive income. Downward revaluations of
land are recognised upon appraisal or impairment testing, with the decrease being charged to other
comprehensive income to the extent of any revaluation surplus in equity relating to this asset and any
remaining decrease recognised in profit or loss. Any revaluation surplus remaining in equity on disposal
of the asset is transferred to retained earnings.
As no finite useful life for land can be determined, related carrying amounts are not depreciated.
Buildings, IT equipment and other equipment
Buildings, IT equipment and other equipment (comprising fittings and furniture) are initially recognised at
acquisition cost or manufacturing cost, including any costs directly attributable to bringing the assets to
the location and condition necessary for it to be capable of operating in the manner intended by the
Group’s management. Buildings and IT equipment also include leasehold property held under a finance
lease .Buildings, IT equipment and other equipment are subsequently measured using the cost model,
cost less subsequent depreciation and impairment losses.
Depreciation is recognised on a straight-line basis to write down the cost less estimated residual value
of buildings, IT equipment and other equipment. The following useful lives are applied:
buildings: 25-50 years
AASB 138.72 AASB 138.74 AASB 138.118(a) AASB 138.118(b)
AASB 138.118(d)
AASB 138.20
AASB 116.73(a) AASB 116.73(c) AASB 101.117
AASB 116.73(b)
AASB 116.73(a) AASB 101.117(a)
AASB 116.43 AASB 116.73(b) AASB 116.73(c)
Example listed public financial statements For the year ended 31 December 2018
© 2019 Grant Thornton Australia Limited. All rights reserved. 54
IT equipment: 2-5 years
other equipment: 3-12 years
In the case of leasehold property, expected useful lives are determined by reference to comparable
owned assets or over the term of the lease, if shorter. Material residual value estimates and estimates of
useful life are updated as required, but at least annually
Gains or losses arising on the disposal of property, plant and equipment are determined as the
difference between the disposal proceeds and the carrying amount of the assets and are recognised in
profit or loss within other income or other expenses.
4.14 Leased assets
Finance leases
The economic ownership of a leased asset is transferred to the lessee if the lessee bears substantially
all the risks and rewards of ownership of the leased asset. Where the Group is a lessee in this type of
arrangement, the related asset is recognised at the inception of the lease at the fair value of the leased
asset or, if lower, the present value of the lease payments plus incidental payments, if any. A
corresponding amount is recognised as a finance lease liability. Leases of land and buildings are
classified separately and are split into a land and a building element, in accordance with the relative fair
values of the leasehold interests at the date the asset is recognised initially.
The corresponding finance lease liability is reduced by lease payments net of finance charges. The
interest element of lease payments represents a constant proportion of the outstanding capital balance
and is charged to profit or loss, as finance costs over the period of the lease.
Operating leases
All other leases are treated as operating leases. Where the Group is a lessee, payments on operating
lease agreements are recognised as an expense on a straight-line basis over the lease term.
Associated costs, such as maintenance and insurance, are expensed as incurred.
The Group as a lessor
The Group also earns rental income from operating leases of its investment properties. Rental income is
recognised on a straight-line basis over the term of the lease.
4.15 Impairment testing of goodwill, other intangible assets and
property, plant and equipment
For impairment assessment purposes, assets are grouped at the lowest levels for which there are
largely independent cash inflows (cash-generating units). As a result, some assets are tested
individually for impairment and some are tested at cash-generating unit level. Goodwill is allocated to
those cash-generating units that are expected to benefit from synergies of the related business
combination and represent the lowest level within the Group at which management monitors goodwill.
Cash-generating units to which goodwill has been allocated (determined by the Group’s management
as equivalent to its operating segments) are tested for impairment at least annually. All other individual
assets or cash-generating units are tested for impairment whenever events or changes in circumstances
indicate that the carrying amount may not be recoverable.
An impairment loss is recognised for the amount by which the asset’s or cash-generating unit’s carrying
amount exceeds its recoverable amount, which is the higher of fair value less costs to sell and value-in-
use. To determine the value-in-use, management estimates expected future cash flows from each cash-
generating unit and determines a suitable interest rate in order to calculate the present value of those
AASB 117.27
AASB 116.43 AASB 116.73(b) AASB 116.73(c)
AASB 117.8 AASB 117.10 AASB 117.15A AASB 117.16
AASB 117.33
AASB 101.117(b) AASB 136.66 AASB 136.80
AASB 136.90 AASB 136.15 AASB 136.10 (b) AASB 136.9
AASB 101.122 AASB 101.117(a) AASB 136.59 AASB 136.18 AASB 136.30-31
Example listed public financial statements For the year ended 31 December 2018
© 2019 Grant Thornton Australia Limited. All rights reserved. 55
cash flows. The data used for impairment testing procedures are directly linked to the Group’s latest
approved budget, adjusted as necessary to exclude the effects of future reorganisations and asset
enhancements. Discount factors are determined individually for each cash-generating unit and reflect
management’s assessment of respective risk profiles, such as market and asset-specific risks factors.
Impairment losses for cash-generating units reduce first the carrying amount of any goodwill allocated to
that cash-generating unit. Any remaining impairment loss is charged pro rata to the other assets in the
cash-generating unit. With the exception of goodwill, all assets are subsequently reassessed for
indications that an impairment loss previously recognised may no longer exist. An impairment charge is
reversed if the cash-generating unit’s recoverable amount exceeds its carrying amount.
4.16 Investment property
Investment properties are properties held to earn rentals and/or for capital appreciation, and are
accounted for using the fair value model.
Investment properties are revalued annually and are included in the statement of financial position at
their open market value. These values are supported by market evidence and are determined by
external professional valuers with sufficient experience with respect to both the location and the nature
of the investment property.
Any gain or loss resulting from either a change in the fair value or the sale of an investment property is
immediately recognised in profit or loss within change in fair value of investment property.
Rental income and operating expenses from investment property are reported within revenue and other
expenses respectively, and are recognised as described in Notes 4.6 and 4.7.
4.17 Financial instruments
Recognition, initial measurement and derecognition
Financial assets and financial liabilities are recognised when the Group becomes a party to the
contractual provisions of the financial instrument, and are measured initially at fair value adjusted by
transactions costs, except for those carried at fair value through profit or loss, which are measured
initially at fair value. Subsequent measurement of financial assets and financial liabilities are described
below.
Financial assets are derecognised when the contractual rights to the cash flows from the financial asset
expire, or when the financial asset and all substantial risks and rewards are transferred. A financial
liability is derecognised when it is extinguished, discharged, cancelled or expires.
Classification and subsequent measurement of financial assets
Except for those trade receivables that do not contain a significant financing component and are
measured at the transaction price in accordance with AASB 15, all financial assets are initially
measured at fair value adjusted for transaction costs (where applicable)
For the purpose of subsequent measurement, financial assets other than those designated and effective
as hedging instruments are classified into the following categories upon initial recognition:
amortised cost
fair value through profit or loss (FVPL)
equity instruments at fair value through other comprehensive income (FVOCI)
debt instruments at fair value through other comprehensive income (FVOCI)
AASB 140.5 AASB 140.75(a)
AASB 140.75(a) AASB 140.75(d) AASB 140.75(e)
AASB 101.117(b) AASB 140.33 AASB 140.35
AASB 7.21 AASB 9.3.1.1 AASB 101.117(b)
AASB 101.117(b) AASB 9.3.2.3 AASB 9.3.3.1
AASB 101.117(a) AASB 9.5.11 AASB 9.5.1.3
AASB 9.5.2.1
Example listed public financial statements For the year ended 31 December 2018
© 2019 Grant Thornton Australia Limited. All rights reserved. 56
All income and expenses relating to financial assets that are recognised in profit or loss are presented
within finance costs, finance income or other financial items, except for impairment of trade receivables
which is presented within other expenses.
Classifications are determined by both:
The entities business model for managing the financial asset
The contractual cash flow characteristics of the financial assets
All income and expenses relating to financial assets that are recognised in profit or loss are presented
within finance costs, finance income or other financial items, except for impairment of trade receivables,
which is presented within other expenses.
Subsequent measurement financial assets
Financial assets at amortised cost
Financial assets are measured at amortised cost if the assets meet the following conditions (and are not
designated as FVPL):
they are held within a business model whose objective is to hold the financial assets and collect its
contractual cash flows
the contractual terms of the financial assets give rise to cash flows that are solely payments of
principal and interest on the principal amount outstanding
After initial recognition, these are measured at amortised cost using the effective interest method.
Discounting is omitted where the effect of discounting is immaterial. The Group’s cash and cash
equivalents, trade and most other receivables fall into this category of financial instruments as well as
government bonds that were previously classified as held-to-maturity under AASB 139.
Financial assets at fair value through profit or loss (FVPL)
Financial assets that are held within a different business model other than ‘hold to collect’ or ‘hold to
collect and sell’ are categorised at fair value through profit and loss. Further, irrespective of business
model financial assets whose contractual cash flows are not solely payments of principal and interest
are accounted for at FVPL. All derivative financial instruments fall into this category, except for those
designated and effective as hedging instruments, for which the hedge accounting requirements apply
(see below).
Equity instruments at fair value through other comprehensive income (Equity FVOCI)
Investments in equity instruments that are not held for trading are eligible for an irrevocable election at
inception to be measured at FVOCI. Under Equity FVOCI, subsequent movements in fair value are
recognised in other comprehensive income and are never reclassified to profit or loss. Dividend from
these investments continue to be recorded as other income within the profit or loss unless the dividend
clearly represents return of capital. This category includes unlisted equity securities - XY ltd that were
previously classified as ‘available-for-sale’ under AASB 139.
Debt instruments at fair value through other comprehensive income (Debt FVOCI)
Financial assets with contractual cash flows representing solely payments of principal and interest and
held within a business model of collecting the contractual cash flows and selling the assets are
accounted for at debt FVOCI.
AASB 9.4.11
AASB 7.20(a)
AASB 9.4.12
AASB 9.4.14
Example listed public financial statements For the year ended 31 December 2018
© 2019 Grant Thornton Australia Limited. All rights reserved. 57
Any gains or losses recognised in OCI will be reclassified to profit or loss upon derecognition of the
asset. This category includes corporate bonds that were previously classified as ‘available-for-sale’
under AASB 139.
Impairment of Financial assets
AASB 9’s impairment requirements use more forward looking information to recognize expected credit
losses – the ‘expected credit losses (ECL) model’. Instruments within the scope of the new requirements
included loans and other debt-type financial assets measured at amortised cost and FVOCI, trade
receivables, contract assets recognised and measured under AASB 15 and loan commitments and
some financial guarantee contracts (for the issuer) that are not measured at fair value through profit or
loss.
The Group considers a broader range of information when assessing credit risk and measuring
expected credit losses, including past events, current conditions, reasonable and supportable forecasts
that affect the expected collectability of the future cash flows of the instrument.
In applying this forward-looking approach, a distinction is made between:
financial instruments that have not deteriorated significantly in credit quality since initial recognition
or that have low credit risk (‘Stage 1’) and
financial instruments that have deteriorated significantly in credit quality since initial recognition and
whose credit risk is not low (‘Stage 2’).
‘Stage 3’ would cover financial assets that have objective evidence of impairment at the reporting date.
‘12-month expected credit losses’ are recognised for the first category while ‘lifetime expected credit
losses’ are recognised for the second category.
Measurement of the expected credit losses is determined by a probability-weighted estimate of credit
losses over the expected life of the financial instrument.
Trade and other receivables and contract assets
The Group makes use of a simplified approach in accounting for trade and other receivables as well as
contract assets and records the loss allowance at the amount equal to the expected lifetime credit
losses. In using this practical expedient, the Group uses its historical experience, external indicators and
forward-looking information to calculate the expected credit losses using a provision matrix.
The Group assess impairment of trade receivables on a collective basis as they possess credit risk
characteristics based on the days past due. The Group allows 1% for amounts that are 30 to 60 days
past due, 1.5% for amounts that are between 60 and 90 days past due and writes off fully any amounts
that are more than 90 days past due.
AASB 9.5.5.1
AASB 9.5.5.15 AASB 9.B5.5.35
Guidance Note:
Credit losses are defined as the difference between all the contractual cash flows that are due to
an entity and the cash flows that it actually expects to receive (‘cash shortfalls’). This difference
is discounted at original effective interest rate (or credit-adjusted effective interest rate for
purchased or originated credit-impaired financial assets).
Example listed public financial statements For the year ended 31 December 2018
© 2019 Grant Thornton Australia Limited. All rights reserved. 58
Classification and measurement of financial liabilities
As the accounting for financial liabilities remains largely unchanged from AASB 139, the Group’s
financial liabilities were not impacted by the adoption of AASB 9. However, for completeness, the
accounting policy is disclosed below.
The Group’s financial liabilities include borrowings, trade and other payables and derivative financial
instruments.
Financial liabilities are initially measured at fair value, and, where applicable, adjusted for transaction
costs unless the Group designated a financial liability at fair value through profit or loss.
Subsequently, financial liabilities are measured at amortised cost using the effective interest method
except for derivatives and financial liabilities designated at FVPL, which are carried subsequently at fair
value with gains or losses recognised in profit or loss (other than derivative financial instruments that are
designated and effective as hedging instruments).
All interest-related charges and, if applicable, changes in an instrument’s fair value that are reported in
profit or loss are included within finance costs or finance income.
Derivative financial instruments and hedge accounting
The Group applies new hedge accounting requirements of AASB 9 prospectively. All hedging
relationships that were hedging relationships under AASB 139 at the 31 December 2017 reporting date
meet the AASB 9’s criteria for hedge accounting at 1 January 2018 and are therefore regarded as
continuing hedging relationships.
Derivative financial instruments are accounted for at FVPL except for derivatives designated as hedging
instruments in cash flow hedge relationships, which requires a specific accounting treatment. To qualify
for hedge accounting, the hedging relationship must meet all of the following requirements:
there is an economic relationship between the hedged item and the hedging instrument
the effect of credit risk does not dominate the value changes that result from that economic
relationship
the hedge ratio of the hedging relationship is the same as that resulting from the quantity of the
hedged item that the entity actually hedges and the quantity of the hedging instrument that the entity
actually uses to hedge that quantity of hedged item.
For the reporting periods under review, the Group has designated certain forward currency contracts as
hedging instruments in cash flow hedge relationships. These arrangements have been entered into to
mitigate currency exchange risk arising from certain legally binding sales and purchase orders
denominated in foreign currency.
All derivative financial instruments used for hedge accounting are recognised initially at fair value and
reported subsequently at fair value in the statement of financial position.
To the extent that the hedge is effective, changes in the fair value of derivatives designated as hedging
instruments in cash flow hedges are recognised in other comprehensive income and included within the
AASB 9.5.5.15 AASB 9.B5.5.35
AASB 9.5.3.1 AASB 9.4.2.1 AASB 9.5.3.2
AASB 9.7.2.22
AASB 9.6.4.1
AASB 7.21A
AASB 9.6.5.11
Guidance Note:
The assessment of impairment for trade receivables can either be individually or collectively and
is based on how an entity manages its credit risk. If an entity has a small number of receivables
with large value and these receivables are managed on an account basis (i.e. individually) it may
not be appropriate in that case to base the impairment on a provision matrix as such a matrix
would unlikely be in line with the expected credit loss of the individual receivable.
Example listed public financial statements For the year ended 31 December 2018
© 2019 Grant Thornton Australia Limited. All rights reserved. 59
cash flow hedge reserve in equity. Any ineffectiveness in the hedge relationship is recognised
immediately in profit or loss.
At the time the hedged item affects profit or loss, any gain or loss previously recognised in other
comprehensive income is reclassified from equity to profit or loss and presented as a reclassification
adjustment within other comprehensive income. However, if a non-financial asset or liability is
recognised as a result of the hedged transaction, the gains and losses previously recognised in other
comprehensive income are included in the initial measurement of the hedged item.
If a forecast transaction is no longer expected to occur, any related gain or loss recognised in other
comprehensive income is transferred immediately to profit or loss. If the hedging relationship ceases to
meet the effectiveness conditions, hedge accounting is discontinued and the related gain or loss is held
in the equity reserve until the forecast transaction occurs.
Accounting policies applicable to comparative period (31 December 2017)
Classification and subsequent measurement of financial assets
Until 31 December 2017, the group classified its financial assets in the following categories:
loans and receivables
financial assets at fair value through profit or loss (FVPL)
Held-to-maturity (HTM) investments; or
Available-for-sale (AFS) financial assets
All financial assets except for those at fair value through profit or loss (FVPL) are subject to review for
impairment at least at each reporting date to identify whether there is any objective evidence that a
financial asset or a group of financial assets is impaired. Different criteria to determine impairment are
applied for each category of financial assets, which are described below.
All income and expenses relating to financial assets that are recognised in profit or loss are presented
within finance costs, finance income or other financial items, except for impairment of trade receivables
which is presented within other expenses.
Loans and receivables
Loans and receivables are non-derivative financial assets with fixed or determinable payments that are
not quoted in an active market. After initial recognition, these are measured at amortised cost using the
effective interest method, less provision for impairment. Discounting is omitted where the effect of
discounting is immaterial. The Group’s trade and most other receivables fall into this category of
financial instruments.
Individually significant receivables are considered for impairment when they are past due or when other
objective evidence is received that a specific counterparty will default. Receivables that are not
considered to be individually impaired are reviewed for impairment in groups, which are determined by
reference to the industry and region of a counterparty and other shared credit risk characteristics. The
impairment loss estimate is then based on recent historical counterparty default rates for each identified
group.
Financial assets at fair value through profit or loss (FVPL)
Financial assets at fair value through profit or loss (FVPL) include financial assets that are either
classified as held for trading or that meet certain conditions and are designated at FVPL upon initial
recognition. All derivative financial instruments fall into this category, except for those designated and
effective as hedging instruments, for which the hedge accounting requirements apply (see below).
AASB 9.6.5.11 (d)
AASB 9.6.5.12
AASB 7.B5(f)
AASB 101.117(a) AASB 101.117(b)
AASB 7.B5(f)
AASB 101.117(a) AASB 101.117(b) AASB 7.B5(a)
Example listed public financial statements For the year ended 31 December 2018
© 2019 Grant Thornton Australia Limited. All rights reserved. 60
Assets in this category are measured at fair value with gains or losses recognised in profit or loss. The
fair values of financial assets in this category are determined by reference to active market transactions
or using a valuation technique where no active market exists.
Held-to-maturity (HTM) investments
Held-to-maturity (HTM) investments are non-derivative financial assets with fixed or determinable
payments and fixed maturity other than loans and receivables. Investments are classified as HTM if the
Group has the intention and ability to hold them until maturity. The Group currently holds listed bonds
designated into this category.
Held-to-maturity (HTM) investments are measured subsequently at amortised cost using the effective
interest method. If there is objective evidence that the investment is impaired, determined by reference
to external credit ratings, the financial asset is measured at the present value of estimated future cash
flows. Any changes to the carrying amount of the investment, including impairment losses, are
recognised in profit or loss.
Available-for-sale (AFS) financial assets
Available-for-sale (AFS) financial assets are non-derivative financial assets that are either designated to
this category or do not qualify for inclusion in any of the other categories of financial assets. The
Group’s AFS financial assets include listed securities and debentures, and the equity investment in XY
Ltd.
The equity investment in XY Ltd is measured at cost less any impairment charges, as its fair value
cannot currently be estimated reliably. Impairment charges are recognised in profit or loss.
All other Available-for-sale (AFS) financial assets are measured at fair value. Gains and losses are
recognised in other comprehensive income and reported within the AFS reserve within equity, except for
impairment losses and foreign exchange differences on monetary assets, which are recognised in profit
or loss. When the asset is disposed of or is determined to be impaired the cumulative gain or loss
recognised in other comprehensive income is reclassified from the equity reserve to profit or loss and
presented as a reclassification adjustment within other comprehensive income. Interest calculated using
the effective interest method and dividends are recognised in profit or loss within ‘finance income’.
Reversals of impairment losses for AFS debt securities are recognised in profit or loss if the reversal
can be objectively related to an event occurring after the impairment loss was recognised. For AFS
equity investments impairment reversals are not recognised in profit loss and any subsequent increase
in fair value is recognised in other comprehensive income.
Classification and subsequent measurement of financial liabilities
The Group’s financial liabilities include borrowings, trade and other payables and derivative financial
instruments.
Financial liabilities are measured subsequently at amortised cost using the effective interest method,
except for financial liabilities held for trading or designated at FVPL, that are carried subsequently at fair
value with gains or losses recognised in profit or loss. All derivative financial instruments that are not
designated and effective as hedging instruments are accounted for at FVPL.
All interest-related charges and, if applicable, changes in an instrument’s fair value that are reported in
profit or loss are included within finance costs or finance income.
Derivative financial instruments and hedge accounting
Derivative financial instruments are accounted for at FVPL except for derivatives designated as hedging
instruments in cash flow hedge relationships, which requires a specific accounting treatment. To qualify
AASB 7.B5(e)
AASB 101.117(a) AASB 101.117(b)
AASB 7.B5(f)
AASB 101.117(a) AASB 101.117(b) AASB 7.B5(b)
AASB 101.117(a) AASB 101.117(b)
AASB 101.117(b)
AASB 101.117(a)
AASB 101.117(b)
AASB 101.117(b)
Example listed public financial statements For the year ended 31 December 2018
© 2019 Grant Thornton Australia Limited. All rights reserved. 61
for hedge accounting, the hedging relationship must meet several strict conditions with respect to
documentation, probability of occurrence of the hedged transaction and hedge effectiveness.
For the reporting periods under review, the Group has designated certain forward currency contracts as
hedging instruments in cash flow hedge relationships. These arrangements have been entered into to
mitigate currency exchange risk arising from certain legally binding sales and purchase orders
denominated in foreign currency.
All derivative financial instruments used for hedge accounting are recognised initially at fair value and
reported subsequently at fair value in the statement of financial position.
To the extent that the hedge is effective, changes in the fair value of derivatives designated as hedging
instruments in cash flow hedges are recognised in other comprehensive income and included within the
cash flow hedge reserve in equity. Any ineffectiveness in the hedge relationship is recognised
immediately in profit or loss.
At the time the hedged item affects profit or loss, any gain or loss previously recognised in other
comprehensive income is reclassified from equity to profit or loss and presented as a reclassification
adjustment within other comprehensive income. However, if a non-financial asset or liability is
recognised as a result of the hedged transaction, the gains and losses previously recognised in other
comprehensive income are included in the initial measurement of the hedged item.
If a forecast transaction is no longer expected to occur any related gain or loss recognised in other
comprehensive income is transferred immediately to profit or loss. If the hedging relationship ceases to
meet the effectiveness conditions, hedge accounting is discontinued and the related gain or loss is held
in the equity reserve until the forecast transaction occurs.
4.18 Inventories
Inventories are stated at the lower of cost and net realisable value. Cost includes all expenses directly
attributable to the manufacturing process as well as suitable portions of related production overheads,
based on normal operating capacity. Costs of ordinarily interchangeable items are assigned using the
first in, first out cost formula. Net realisable value is the estimated selling price in the ordinary course of
business less any applicable selling expenses.
4.19 Income taxes
Tax expense recognised in profit or loss comprises the sum of deferred tax and current tax not
recognised in other comprehensive income or directly in equity.
Current income tax assets and / or liabilities comprise those obligations to, or claims from, the Australian
Taxation Office (ATO) and other fiscal authorities relating to the current or prior reporting periods that
are unpaid at the reporting date. Current tax is payable on taxable profit, which differs from profit or loss
in the financial statements. Calculation of current tax is based on tax rates and tax laws that have been
enacted or substantively enacted by the end of the reporting period.
Deferred income taxes are calculated using the liability method on temporary differences between the
carrying amounts of assets and liabilities and their tax bases. However, deferred tax is not provided on
the initial recognition of goodwill or on the initial recognition of an asset or liability unless the related
transaction is a business combination or affects tax or accounting profit. Deferred tax on temporary
differences associated with investments in subsidiaries and joint ventures is not provided if reversal of
these temporary differences can be controlled by the Group and it is probable that reversal will not occur
in the foreseeable future.
Deferred tax assets and liabilities are calculated, without discounting, at tax rates that are expected to
apply to their respective period of realisation, provided they are enacted or substantively enacted by the
end of the reporting period.
AASB 7.22(a) AASB 7.22(c)
AASB 101.117(a)
AASB 101.117(b)
AASB 102.36(a) AASB 102.9 AASB 102.10-15 AASB 102.25 AASB 102.6
AASB 112.5 AASB 101.117(a) AASB 101.117(b)
AASB 101.117(a)
Example listed public financial statements For the year ended 31 December 2018
© 2019 Grant Thornton Australia Limited. All rights reserved. 62
Deferred tax assets are recognised to the extent that it is probable that they will be able to be utilised
against future taxable income, based on the Group’s forecast of future operating results which is
adjusted for significant non-taxable income and expenses and specific limits to the use of any unused
tax loss or credit. Deferred tax liabilities are always provided for in full.
Deferred tax assets and liabilities are offset only when the Group has a right and intention to set off
current tax assets and liabilities from the same taxation authority.
Changes in deferred tax assets or liabilities are recognised as a component of tax income or expense in
profit or loss, except where they relate to items that are recognised in other comprehensive income
(such as the revaluation of land) or directly in equity, in which case the related deferred tax is also
recognised in other comprehensive income or equity, respectively.
Grant Thornton CLEARR Example Ltd and its wholly-owned Australian controlled entities have
implemented the tax consolidation legislation. As a consequence, these entities are taxed as a single
entity and the deferred tax assets and liabilities of these entities are set off in the consolidated financial
statements.
4.20 Cash and cash equivalents
Cash and cash equivalents comprise cash on hand and demand deposits, together with other short-
term, highly liquid investments that are readily convertible into known amounts of cash and which are
subject to an insignificant risk of changes in value.
4.21 Non-current assets and liabilities classified as held for sale and
discontinued operations
When the Group intends to sell a non-current asset or a group of assets (a disposal group), and if sale
within 12 months is highly probable, the asset or disposal group is classified as ‘held for sale’ and
presented separately in the statement of financial position. Liabilities are classified as ‘held for sale’ and
presented as such in the statement of financial position if they are directly associated with a disposal
group.
Assets classified as ‘held for sale’ are measured at the lower of their carrying amounts immediately prior
to their classification as held for sale and their fair value less costs to sell. However, some ‘held for sale’
assets such as financial assets or deferred tax assets, continue to be measured in accordance with the
Group's accounting policy for those assets. Once classified as ‘held for sale’, the assets are not subject
to depreciation or amortisation.
Any profit or loss arising from the sale or re-measurement of discontinued operations is presented as
part of a single line item, profit or loss from discontinued operations.
4.22 Equity, reserves and dividend payments
Share capital represents the fair value of shares that have been issued. Any transaction costs
associated with the issuing of shares are deducted from share capital, net of any related income tax
benefits.
Other components of equity include the following:
revaluation reserve: comprises gains and losses from the revaluation of land
net defined benefit liability: comprises the actuarial losses from changed in demographic and
financial assumptions and the return on plan assets
foreign currency translation reserve: comprises foreign currency translation differences arising on
the translation of financial statements of the Group’s foreign entities into $AUD
AASB 101.122 AASB 112.24,34
AASB 112.71-74
AASB 101.117(b)
UIG1052(16)(a)
AASB 107.46
AASB 101.117(a)
AASB 101.117(b) AASB 7.46
AASB 5.15 AASB 5.5
AASB 101.79(b)
Example listed public financial statements For the year ended 31 December 2018
© 2019 Grant Thornton Australia Limited. All rights reserved. 63
reserves and cash flow hedges: comprises gains and losses relating to these types of financial
instruments
debt FVOCI: comprises gains and losses relating to corporate bonds
equity FVOCI: comprises gains and losses relating to unlisted equity securities - XY Ltd
AFS financial assets and cash-flow hedge reserves (2017): comprises gains and losses relating
to these types of financial instruments
Retained earnings include all current and prior period retained profits.
Dividend distributions payable to equity shareholders are included in other liabilities when the dividends
have been approved in a general meeting prior to the reporting date.
All transactions with owners of the parent are recorded separately within equity.
4.23 Employee benefits
Short-term employee benefits
Short-term employee benefits are benefits, other than termination benefits, that are expected to be
settled wholly within 12 months after the end of the period in which the employees render the related
service. Examples of such benefits include wages and salaries, non-monetary benefits and
accumulating sick leave. Short-term employee benefits are measured at the undiscounted amounts
expected to be paid when the liabilities are settled.
Other long-term employee benefits
The Group’s liabilities for annual leave and long service leave are included in other long term benefits as
they are not expected to be settled wholly within 12 months after the end of the period in which the
employees render the related service. They are measured at the present value of the expected future
payments to be made to employees. The expected future payments incorporate anticipated future wage
and salary levels, experience of employee departures and periods of service, and are discounted at
rates determined by reference to market yields at the end of the reporting period on high quality
corporate bonds that have maturity dates that approximate the timing of the estimated future cash
outflows. Any re-measurements arising from experience adjustments and changes in assumptions are
recognised in profit or loss in the periods in which the changes occur.
The Group presents employee benefit obligations as current liabilities in the statement of financial
position if the Group does not have an unconditional right to defer settlement for at least 12 months after
the reporting period, irrespective of when the actual settlement is expected to take place.
Post-employment benefit plans
The Group provides post-employment benefits through various defined contribution and defined benefit
plans.
Defined contribution plans
The Group pays fixed contributions into independent entities in relation to several state plans and
insurance for individual employees. The Group has no legal or constructive obligations to pay
contributions in addition to its fixed contributions, which are recognised as an expense in the period that
relevant employee services are received.
AASB 124.3
AASB 119.11
AASB 119.8, 155, 156
AASB 101.69(d)
Example listed public financial statements For the year ended 31 December 2018
© 2019 Grant Thornton Australia Limited. All rights reserved. 64
Defined benefit plans
Under the Group’s defined benefit plans, the amount of pension benefit that an employee will receive on
retirement is defined by reference to the employee’s length of service and final salary. The legal
obligation for any benefits remains with the Group, even if plan assets for funding the Defined Benefit
Plan have been set aside. Plan assets may include assets specifically designated to a long-term benefit
fund as well as qualifying insurance policies.
The liability recognised in the statement of financial position for Defined Benefit Plans is the present
value of the Defined Benefit Obligation (DBO) at the reporting date less the fair value of plan assets.
Management estimates the DBO annually with the assistance of independent actuaries. This is based
on standard rates of inflation, salary growth and mortality. Discount rates are determined by reference to
market yields at the end of the reporting periods on high quality corporate bonds that have terms to
maturity approximating to the terms of the related pension liability.
Re-measurement gains and losses arising from experience adjustments and changes in actuarial
assumptions are recognised directly in other comprehensive income. They are included as a separate
component of equity in the statement of financial position and in the statement of changes in equity.
Service cost on the net defined benefit liability is included in employee benefits expense. Net interest
expense on the net defined benefit liability is included in finance costs.
4.24 Share-based employee remuneration
The Group operates equity-settled share-based remuneration plans for its employees. None of the
Group’s plans feature any options for a cash settlement.
All goods and services received in exchange for the grant of any share-based payment are measured at
their fair values. Where employees are rewarded using share-based payments, the fair values of
employees’ services are determined indirectly by reference to the fair value of the equity instruments
granted. This fair value is appraised at the grant date and excludes the impact of non-market vesting
conditions (for example profitability and sales growth targets and performance conditions).
All share-based remuneration is ultimately recognised as an expense in profit or loss with a
corresponding credit to share option reserve. If vesting periods or other vesting conditions apply, the
expense is allocated over the vesting period, based on the best available estimate of the number of
share options expected to vest.
Non-market vesting conditions are included in assumptions about the number of options that are
expected to become exercisable. Estimates are subsequently revised if there is any indication that the
number of share options expected to vest differs from previous estimates. Any cumulative adjustment
prior to vesting is recognised in the current period. No adjustment is made to any expense recognised in
prior periods if share options ultimately exercised are different to that estimated on vesting.
Upon exercise of share options, the proceeds received net of any directly attributable transaction costs
are allocated to share capital up to the nominal (or par) value of the shares issued with any excess
being recorded as share premium.
4.25 Provisions, contingent liabilities and contingent assets
Provisions for product warranties, legal disputes, onerous contracts or other claims are recognised
when the Group has a present legal or constructive obligation as a result of a past event, it is probable
that an outflow of economic resources will be required from the Group and amounts can be estimated
reliably. Timing or amount of the outflow may still be uncertain.
AASB 19.135(a)
AASB 19.135(b)
AASB 119.76
AASB 119.57(d)
AASB 119.103
AASB 101.117(b)
AASB 101.117(a) AASB 2.10 AASB 2.11
AASB 2.8 AASB 2.20 AASN 2.19
AASB 2.20 AASB 2.23
AASB 101.117(b) AASB 137.14
AASB 137.72
Example listed public financial statements For the year ended 31 December 2018
© 2019 Grant Thornton Australia Limited. All rights reserved. 65
Restructuring provisions are recognised only if a detailed formal plan for the restructuring has been
developed and implemented, or management has at least announced the plan’s main features to those
affected by it. Provisions are not recognised for future operating losses.
Provisions are measured at the estimated expenditure required to settle the present obligation, based
on the most reliable evidence available at the reporting date, including the risks and uncertainties
associated with the present obligation. Where there are a number of similar obligations, the likelihood
that an outflow will be required in settlement is determined by considering the class of obligations as a
whole. Provisions are discounted to their present values, where the time value of money is material.
Any reimbursement that the Group can be virtually certain to collect from a third party with respect to the
obligation is recognised as a separate asset. However, this asset may not exceed the amount of the
related provision.
No liability is recognised if an outflow of economic resources as a result of present obligation is not
probable. Such situations are disclosed as contingent liabilities, unless the outflow of resources is
remote in which case no liability is recognised.
4.26 Goods and Services Tax (GST)
Revenues, expenses and assets are recognised net of the amount of GST, except where the amount of
GST incurred is not recoverable from the Tax Office. In these circumstances the GST is recognised as
part of the cost of acquisition of the asset or as part of an item of the expense. Receivables and
payables in the statement of financial position are shown inclusive of GST.
Cash flows are presented in the statement of cash flows on a gross basis, except for the GST
components of investing and financing activities, which are disclosed as operating cash flows.
4.27 Rounding of amounts
The Parent Entity has applied the relief available to it under ASIC Corporations (Rounding in
Financial/Directors’ Reports) Instrument 2016/191 and accordingly, amounts in the financial statements
and directors’ report have been rounded off to the nearest $1,000, or in certain cases, the nearest
dollar.
4.28 Significant management judgement in applying accounting
policies
When preparing the financial statements, management undertakes a number of judgements, estimates
and assumptions about the recognition and measurement of assets, liabilities, income and expenses.
AASB 101.117(a) AASB 37.36 AASB 37.45
AASB 137.33
AASB 37.27-28
UIG 1031.6-7
ASIC Corporations (Rounding in Financial/ Directors’ Reports) Instrument 2016/191 AASB 101.51(e)
AASB 101.122
Guidance Note:
AASB 101 provides general guidance on disclosures about judgements. Other standards, such
as AASB 7, AASB 12 Disclosure of Interests in Other Entities and AASB 15 supplement AASB
101 by reporting disclosures about particular judgements.
The following are examples of disclosures for management judgement under AASB 101.122.
Entities should disclose judgements that have the most significant effect on the amounts
recognized in the financial statements. These can be disclosed in either the accounting policies
or the other noted to the financial statements.
\
Example listed public financial statements For the year ended 31 December 2018
© 2019 Grant Thornton Australia Limited. All rights reserved. 66
Significant management judgement
The following are significant management judgements in applying the accounting policies of the Group
that have the most significant effect on the financial statements.
Recognition of service and construction contract revenue
Determining when to recognise revenues from after-sales maintenance agreements and construction
contracts services is recognised over time, the amounts of revenue recognised in the reporting period
depends on the extent to which the performance obligations has been satisfied. For after-sales
maintenance agreements this requires an understanding of the customer’s use of the related products,
historical experience and knowledge of the market. Recognising construction contract revenue also
requires significant judgement in determining milestones, actual work performed and the estimated
costs to complete the work (see Note 4.7).
Capitalisation of internally developed software
Distinguishing the research and development phases of a new customised software project and
determining whether the recognition requirements for the capitalisation of development costs are met
requires judgement. After capitalisation, management monitors whether the recognition requirements
continue to be met and whether there are any indicators that capitalised costs may be impaired (see
Note 4.12).
Recognition of deferred tax assets
The extent to which deferred tax assets can be recognised is based on an assessment of the probability
of the Group’s future taxable income against which the deferred tax assets can be utilised. In addition,
significant judgement is required in assessing the impact of any legal or economic limits or uncertainties
in various tax jurisdictions.
Control assessment
See Note 33.1.
AASB 101.122
Example listed public financial statements For the year ended 31 December 2018
© 2019 Grant Thornton Australia Limited. All rights reserved. 67
Estimation uncertainty
Information about estimates and assumptions that have the most significant effect on recognition and
measurement of assets, liabilities, income and expenses is provided below. Actual results may be
substantially different.
Impairment
In assessing impairment, management estimates the recoverable amount of each asset or cash-
generating unit based on expected future cash flows and uses an interest rate to discount them.
Estimation uncertainty relates to assumptions about future operating results and the determination of a
suitable discount rate. In 2018, the Group recognised an impairment loss on goodwill and internally
generated software.
Useful lives of depreciable assets
Management reviews its estimate of the useful lives of depreciable assets at each reporting date, based
on the expected utility of the assets. Uncertainties in these estimates relate to technical obsolescence
that may change the utility of certain software and IT equipment.
Inventories
Management estimates the net realisable values of inventories, taking into account the most reliable
evidence available at each reporting date. The future realisation of these inventories may be affected by
future technology or other market-driven changes that may reduce future selling prices.
AASB 101.125
Guidance Note:
AASB 101 explains the overall requirements for disclosure about estimates. The focus is on
assumptions the entity makes about the future, and the major sources of estimation uncertainty
at the end of the reporting period when there is a significant risk of material adjustment within
the next financial year.
AASB requires disclosure about the assumptions made and the nature and carrying amounts of
the assets and liabilities affected. It does not prescribe the exact information an entity should
disclose about these assumptions but gives examples including:
the nature of the assumptions
sensitivity of carrying amounts
expected resolution/range of reasonably possible outcomes changes made to possible
outcomes
changes made to past assumptions.
Some Standards also include disclosure requirements about particular estimates. For example:
AASB 136 Impairment of Assets specifies disclosures about impairment testing
AASB 137 Provisions, Contingent Liabilities and Contingent Assets requires disclosures
about uncertainties and major assumptions affecting provisions
AASB 13 Fair Value Measurement requires information about how fair values have been
estimated.
Example listed public financial statements For the year ended 31 December 2018
© 2019 Grant Thornton Australia Limited. All rights reserved. 68
Business combinations
Management uses valuation techniques in determining the fair values of the various elements of a
business combination. Particularly, the fair value of contingent consideration is dependent on the
outcome of many variables that affect future profitability.
Construction contract revenue
Recognised amounts of construction contract revenues and related receivables reflect management’s
best estimate of each contract’s outcome and stage of completion. This includes the assessment of the
profitability of ongoing construction contracts and the order backlog. For more complex contracts in
particular, costs to complete and contract profitability are subject to significant estimation uncertainty.
Defined benefit liability (DBO)
Management’s estimate of the DBO is based on a number of critical underlying assumptions such as
standard rates of inflation, medical cost trends, mortality, discount rate and anticipation of future salary
increases. Estimation uncertainties exist particularly with regard to the assumed medical cost trends.
Variation in these assumptions may significantly impact the DBO amount and the annual defined benefit
expenses.
Fair value of financial instruments
Management uses valuation techniques to determine the fair value of financial instruments (where
active market quotes are not available) and non-financial assets. This involves developing estimates
and assumptions consistent with how market participants would price the instrument. Management
bases its assumptions on observable data as far as possible but this is not always available. In that
case management uses the best information available. Estimated fair values may vary from the actual
prices that would be achieved in an arm’s length transaction at the reporting date.
5 Revenue For 2018, revenue includes $2,718,000 (2017: $2,534,000) included in the contract liability balance at
the beginning of the period, and $134,000 (2017: $125,000) from performance obligations satisfied (or
partially satisfied) in previous periods due to changes in transaction price.
AASB 156.116
Guidance Note:
As the Group does not enter into contracts with its customer where, once performance has
occurred, the Group’s right to consideration is dependent on anything other than the passage of
time, the Group does not presently have any contract assets.
For the purpose of these CLEARR financial statements, it is assumed that changes to the
Group’s contract liability (i.e. deferred revenue) are attributed solely to the satisfaction of
performance obligations. For other entities, where contract liability balances are affected by
other significant factors, AASB 15.118 requires these changes to be explained. For example,
changes due to business combinations or a change in the period required for a performance
obligation to be satisfied.
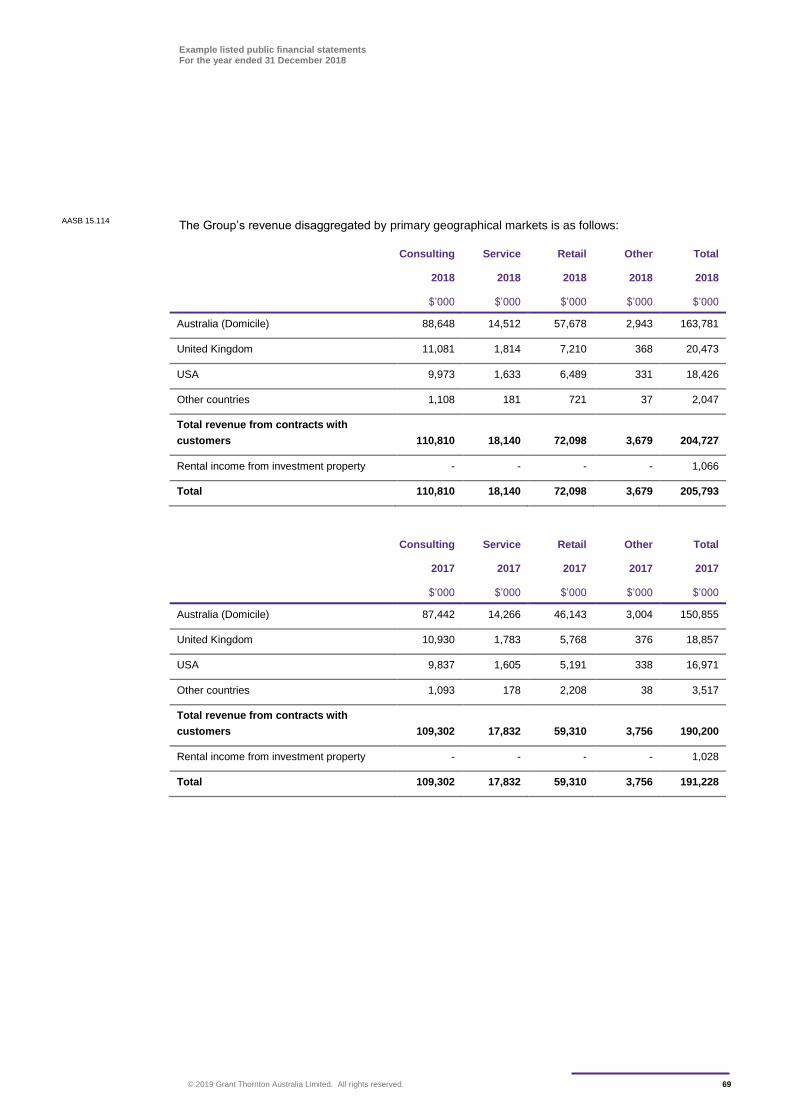
Example listed public financial statements For the year ended 31 December 2018
© 2019 Grant Thornton Australia Limited. All rights reserved. 69
The Group’s revenue disaggregated by primary geographical markets is as follows:
Consulting Service Retail Other Total
2018 2018 2018 2018 2018
$’000 $’000 $’000 $’000 $’000
Australia (Domicile) 88,648 14,512 57,678 2,943 163,781
United Kingdom 11,081 1,814 7,210 368 20,473
USA 9,973 1,633 6,489 331 18,426
Other countries 1,108 181 721 37 2,047
Total revenue from contracts with
customers 110,810 18,140 72,098 3,679 204,727
Rental income from investment property - - - - 1,066
Total 110,810 18,140 72,098 3,679 205,793
Consulting Service Retail Other Total
2017 2017 2017 2017 2017
$’000 $’000 $’000 $’000 $’000
Australia (Domicile) 87,442 14,266 46,143 3,004 150,855
United Kingdom 10,930 1,783 5,768 376 18,857
USA 9,837 1,605 5,191 338 16,971
Other countries 1,093 178 2,208 38 3,517
Total revenue from contracts with
customers 109,302 17,832 59,310 3,756 190,200
Rental income from investment property - - - - 1,028
Total 109,302 17,832 59,310 3,756 191,228
AASB 15.114
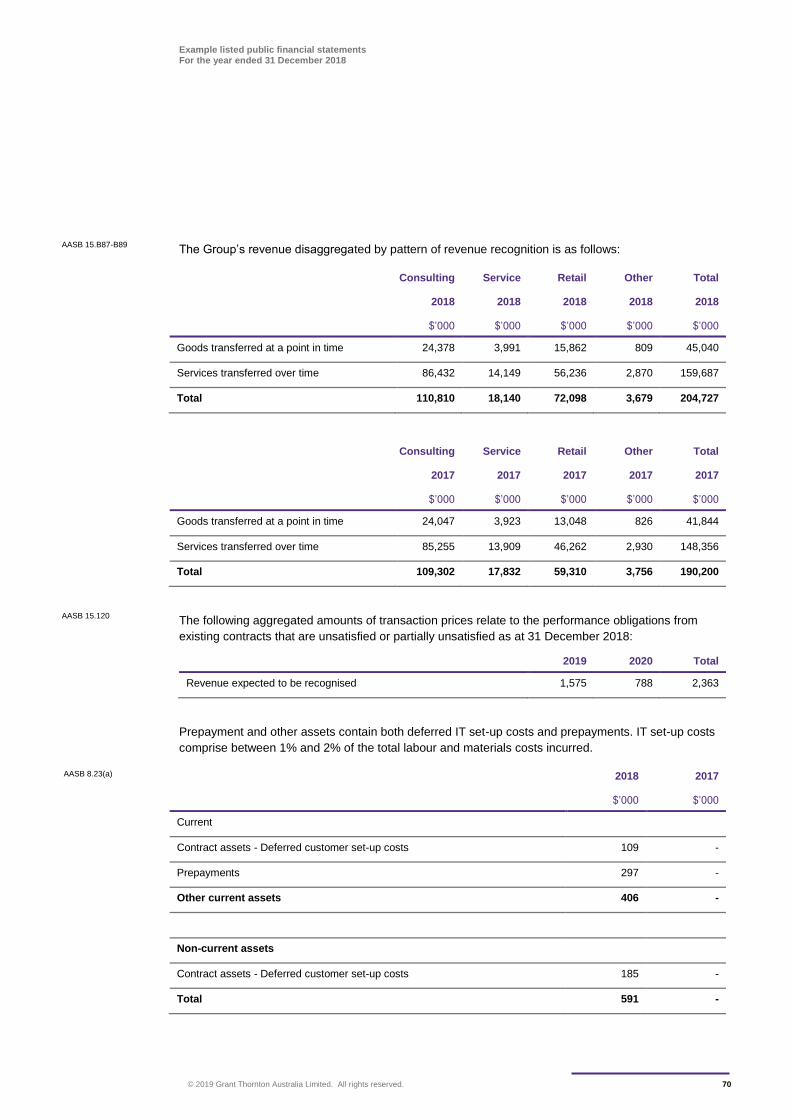
Example listed public financial statements For the year ended 31 December 2018
© 2019 Grant Thornton Australia Limited. All rights reserved. 70
The Group’s revenue disaggregated by pattern of revenue recognition is as follows:
Consulting Service Retail Other Total
2018 2018 2018 2018 2018
$’000 $’000 $’000 $’000 $’000
Goods transferred at a point in time 24,378 3,991 15,862 809 45,040
Services transferred over time 86,432 14,149 56,236 2,870 159,687
Total 110,810 18,140 72,098 3,679 204,727
Consulting Service Retail Other Total
2017 2017 2017 2017 2017
$’000 $’000 $’000 $’000 $’000
Goods transferred at a point in time 24,047 3,923 13,048 826 41,844
Services transferred over time 85,255 13,909 46,262 2,930 148,356
Total 109,302 17,832 59,310 3,756 190,200
The following aggregated amounts of transaction prices relate to the performance obligations from
existing contracts that are unsatisfied or partially unsatisfied as at 31 December 2018:
2019 2020 Total
Revenue expected to be recognised 1,575 788 2,363
Prepayment and other assets contain both deferred IT set-up costs and prepayments. IT set-up costs
comprise between 1% and 2% of the total labour and materials costs incurred.
AASB 8.23(a) 2018 2017
$’000 $’000
Current
Contract assets - Deferred customer set-up costs 109 -
Prepayments 297 -
Other current assets 406 -
Non-current assets
Contract assets - Deferred customer set-up costs 185 -
Total 591 -
AASB 15.B87-B89
AASB 15.120
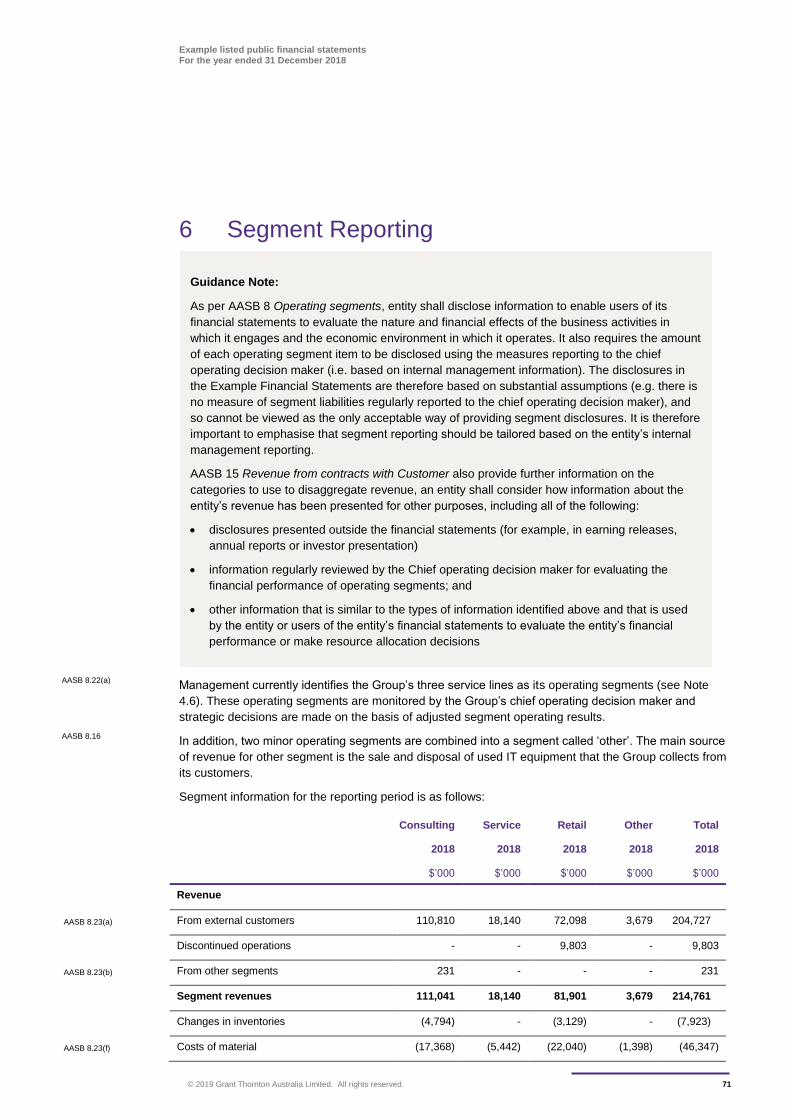
Example listed public financial statements For the year ended 31 December 2018
© 2019 Grant Thornton Australia Limited. All rights reserved. 71
6 Segment Reporting
Management currently identifies the Group’s three service lines as its operating segments (see Note
4.6). These operating segments are monitored by the Group’s chief operating decision maker and
strategic decisions are made on the basis of adjusted segment operating results.
In addition, two minor operating segments are combined into a segment called ‘other’. The main source
of revenue for other segment is the sale and disposal of used IT equipment that the Group collects from
its customers.
Segment information for the reporting period is as follows:
Consulting Service Retail Other Total
2018 2018 2018 2018 2018
$’000 $’000 $’000 $’000 $’000
Revenue
AASB 8.23(a) From external customers 110,810 18,140 72,098 3,679 204,727
Discontinued operations - - 9,803 - 9,803
AASB 8.23(b) From other segments 231 - - - 231
Segment revenues 111,041 18,140 81,901 3,679 214,761
Changes in inventories (4,794) - (3,129) - (7,923)
AASB 8.23(f) Costs of material (17,368) (5,442) (22,040) (1,398) (46,347)
AASB 8.22(a)
AASB 8.16
Guidance Note:
As per AASB 8 Operating segments, entity shall disclose information to enable users of its
financial statements to evaluate the nature and financial effects of the business activities in
which it engages and the economic environment in which it operates. It also requires the amount
of each operating segment item to be disclosed using the measures reporting to the chief
operating decision maker (i.e. based on internal management information). The disclosures in
the Example Financial Statements are therefore based on substantial assumptions (e.g. there is
no measure of segment liabilities regularly reported to the chief operating decision maker), and
so cannot be viewed as the only acceptable way of providing segment disclosures. It is therefore
important to emphasise that segment reporting should be tailored based on the entity’s internal
management reporting.
AASB 15 Revenue from contracts with Customer also provide further information on the
categories to use to disaggregate revenue, an entity shall consider how information about the
entity’s revenue has been presented for other purposes, including all of the following:
disclosures presented outside the financial statements (for example, in earning releases,
annual reports or investor presentation)
information regularly reviewed by the Chief operating decision maker for evaluating the
financial performance of operating segments; and
other information that is similar to the types of information identified above and that is used
by the entity or users of the entity’s financial statements to evaluate the entity’s financial
performance or make resource allocation decisions
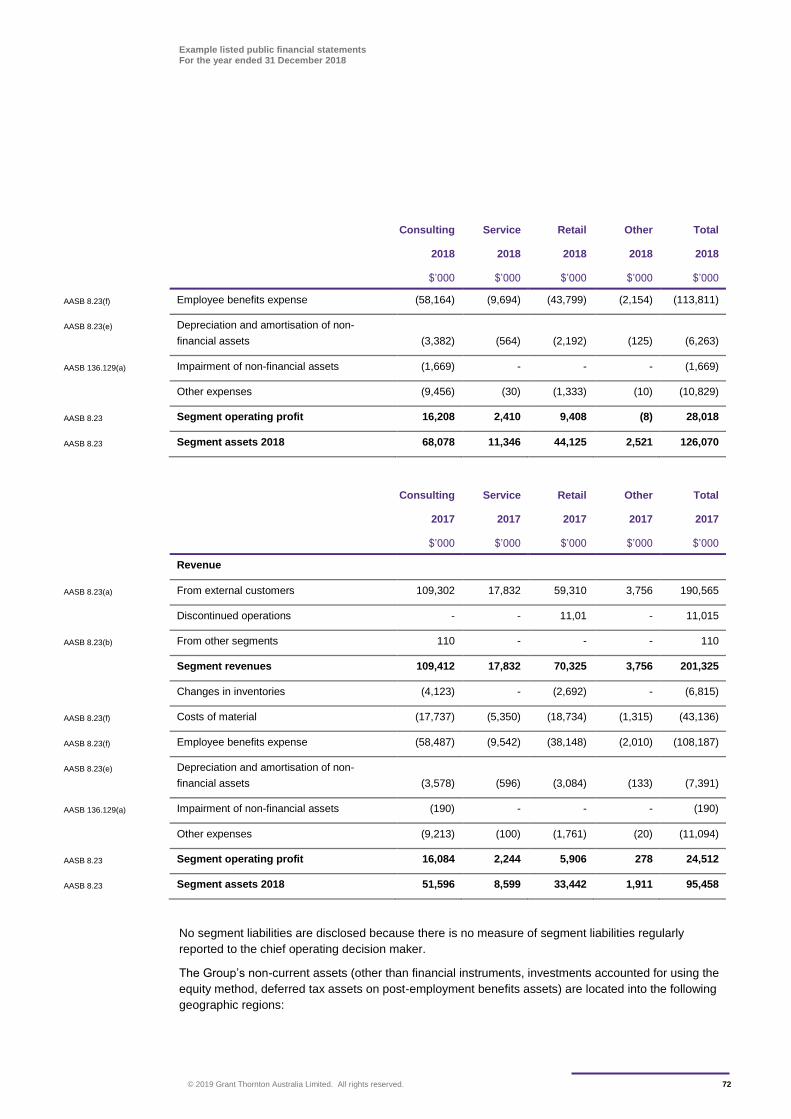
Example listed public financial statements For the year ended 31 December 2018
© 2019 Grant Thornton Australia Limited. All rights reserved. 72
Consulting Service Retail Other Total
2018 2018 2018 2018 2018
$’000 $’000 $’000 $’000 $’000
AASB 8.23(f) Employee benefits expense (58,164) (9,694) (43,799) (2,154) (113,811)
AASB 8.23(e) Depreciation and amortisation of non-
financial assets (3,382) (564) (2,192) (125) (6,263)
AASB 136.129(a) Impairment of non-financial assets (1,669) - - - (1,669)
Other expenses (9,456) (30) (1,333) (10) (10,829)
AASB 8.23 Segment operating profit 16,208 2,410 9,408 (8) 28,018
AASB 8.23 Segment assets 2018 68,078 11,346 44,125 2,521 126,070
Consulting Service Retail Other Total
2017 2017 2017 2017 2017
$’000 $’000 $’000 $’000 $’000
Revenue
AASB 8.23(a) From external customers 109,302 17,832 59,310 3,756 190,565
Discontinued operations - - 11,01 - 11,015
AASB 8.23(b) From other segments 110 - - - 110
Segment revenues 109,412 17,832 70,325 3,756 201,325
Changes in inventories (4,123) - (2,692) - (6,815)
AASB 8.23(f) Costs of material (17,737) (5,350) (18,734) (1,315) (43,136)
AASB 8.23(f) Employee benefits expense (58,487) (9,542) (38,148) (2,010) (108,187)
AASB 8.23(e) Depreciation and amortisation of non-
financial assets (3,578) (596) (3,084) (133) (7,391)
AASB 136.129(a) Impairment of non-financial assets (190) - - - (190)
Other expenses (9,213) (100) (1,761) (20) (11,094)
AASB 8.23 Segment operating profit 16,084 2,244 5,906 278 24,512
AASB 8.23 Segment assets 2018 51,596 8,599 33,442 1,911 95,458
No segment liabilities are disclosed because there is no measure of segment liabilities regularly
reported to the chief operating decision maker.
The Group’s non-current assets (other than financial instruments, investments accounted for using the
equity method, deferred tax assets on post-employment benefits assets) are located into the following
geographic regions:
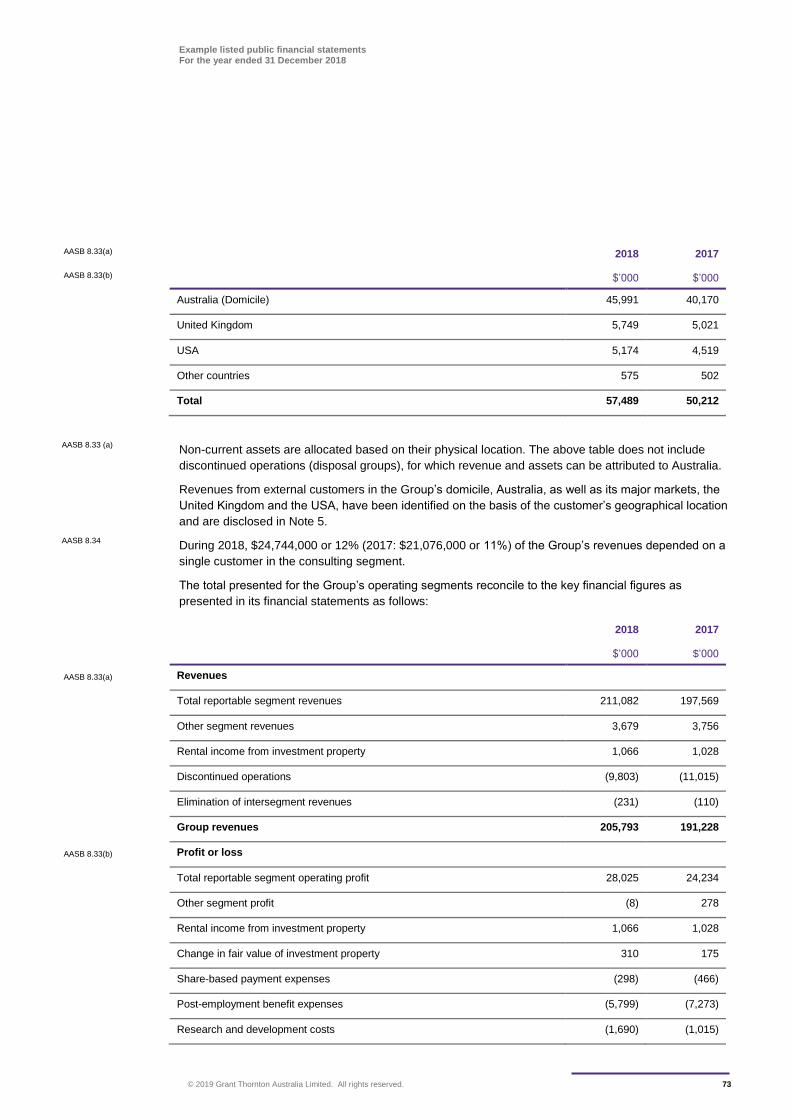
Example listed public financial statements For the year ended 31 December 2018
© 2019 Grant Thornton Australia Limited. All rights reserved. 73
AASB 8.33(a) 2018 2017
AASB 8.33(b) $’000 $’000
Australia (Domicile) 45,991 40,170
United Kingdom 5,749 5,021
USA 5,174 4,519
Other countries 575 502
Total 57,489 50,212
Non-current assets are allocated based on their physical location. The above table does not include
discontinued operations (disposal groups), for which revenue and assets can be attributed to Australia.
Revenues from external customers in the Group’s domicile, Australia, as well as its major markets, the
United Kingdom and the USA, have been identified on the basis of the customer’s geographical location
and are disclosed in Note 5.
During 2018, $24,744,000 or 12% (2017: $21,076,000 or 11%) of the Group’s revenues depended on a
single customer in the consulting segment.
The total presented for the Group’s operating segments reconcile to the key financial figures as
presented in its financial statements as follows:
2018 2017
$’000 $’000
AASB 8.33(a) Revenues
Total reportable segment revenues 211,082 197,569
Other segment revenues 3,679 3,756
Rental income from investment property 1,066 1,028
Discontinued operations (9,803) (11,015)
Elimination of intersegment revenues (231) (110)
Group revenues 205,793 191,228
AASB 8.33(b) Profit or loss
Total reportable segment operating profit 28,025 24,234
Other segment profit (8) 278
Rental income from investment property 1,066 1,028
Change in fair value of investment property 310 175
Share-based payment expenses (298) (466)
Post-employment benefit expenses (5,799) (7,273)
Research and development costs (1,690) (1,015)
AASB 8.33 (a)
AASB 8.34
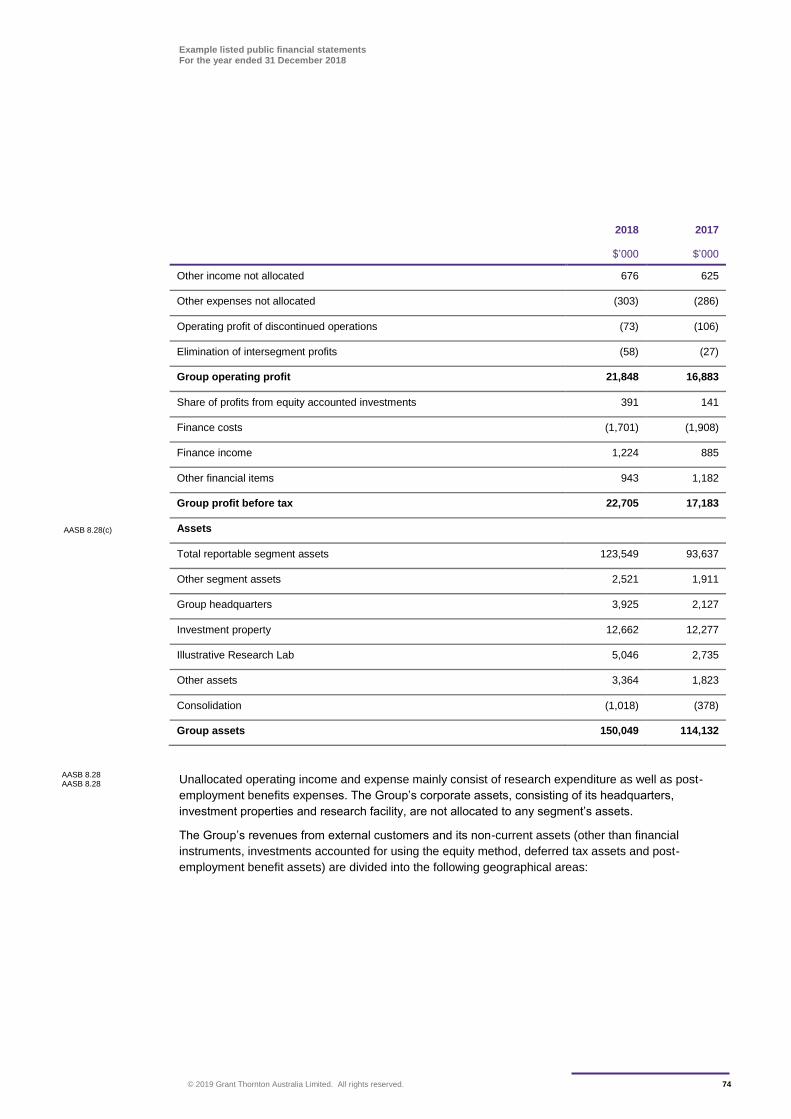
Example listed public financial statements For the year ended 31 December 2018
© 2019 Grant Thornton Australia Limited. All rights reserved. 74
2018 2017
$’000 $’000
Other income not allocated 676 625
Other expenses not allocated (303) (286)
Operating profit of discontinued operations (73) (106)
Elimination of intersegment profits (58) (27)
Group operating profit 21,848 16,883
Share of profits from equity accounted investments 391 141
Finance costs (1,701) (1,908)
Finance income 1,224 885
Other financial items 943 1,182
Group profit before tax 22,705 17,183
AASB 8.28(c) Assets
Total reportable segment assets 123,549 93,637
Other segment assets 2,521 1,911
Group headquarters 3,925 2,127
Investment property 12,662 12,277
Illustrative Research Lab 5,046 2,735
Other assets 3,364 1,823
Consolidation (1,018) (378)
Group assets 150,049 114,132
Unallocated operating income and expense mainly consist of research expenditure as well as post-
employment benefits expenses. The Group’s corporate assets, consisting of its headquarters,
investment properties and research facility, are not allocated to any segment’s assets.
The Group’s revenues from external customers and its non-current assets (other than financial
instruments, investments accounted for using the equity method, deferred tax assets and post-
employment benefit assets) are divided into the following geographical areas:
AASB 8.28 AASB 8.28
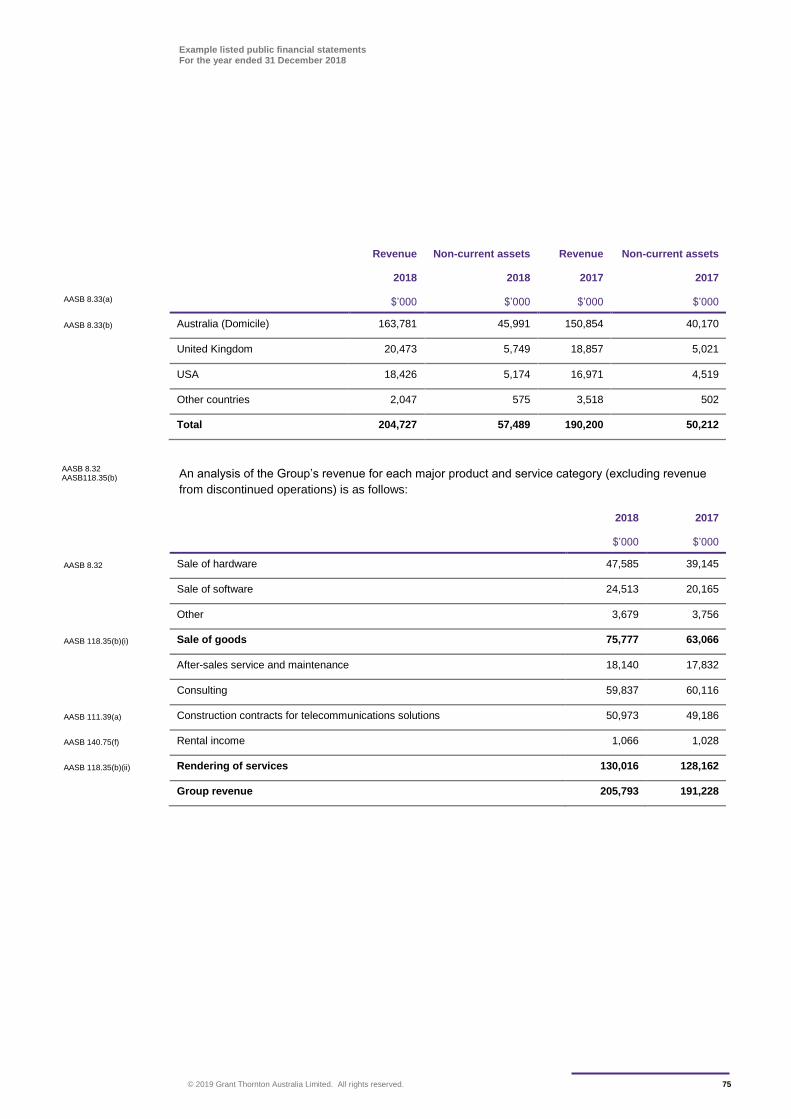
Example listed public financial statements For the year ended 31 December 2018
© 2019 Grant Thornton Australia Limited. All rights reserved. 75
Revenue Non-current assets Revenue Non-current assets
2018 2018 2017 2017
AASB 8.33(a) $’000 $’000 $’000 $’000
AASB 8.33(b) Australia (Domicile) 163,781 45,991 150,854 40,170
United Kingdom 20,473 5,749 18,857 5,021
USA 18,426 5,174 16,971 4,519
Other countries 2,047 575 3,518 502
Total 204,727 57,489 190,200 50,212
An analysis of the Group’s revenue for each major product and service category (excluding revenue
from discontinued operations) is as follows:
2018 2017
$’000 $’000
AASB 8.32 Sale of hardware 47,585 39,145
Sale of software 24,513 20,165
Other 3,679 3,756
AASB 118.35(b)(i) Sale of goods 75,777 63,066
After-sales service and maintenance 18,140 17,832
Consulting 59,837 60,116
AASB 111.39(a) Construction contracts for telecommunications solutions 50,973 49,186
AASB 140.75(f) Rental income 1,066 1,028
AASB 118.35(b)(ii) Rendering of services 130,016 128,162
Group revenue 205,793 191,228
AASB 8.32 AASB118.35(b)
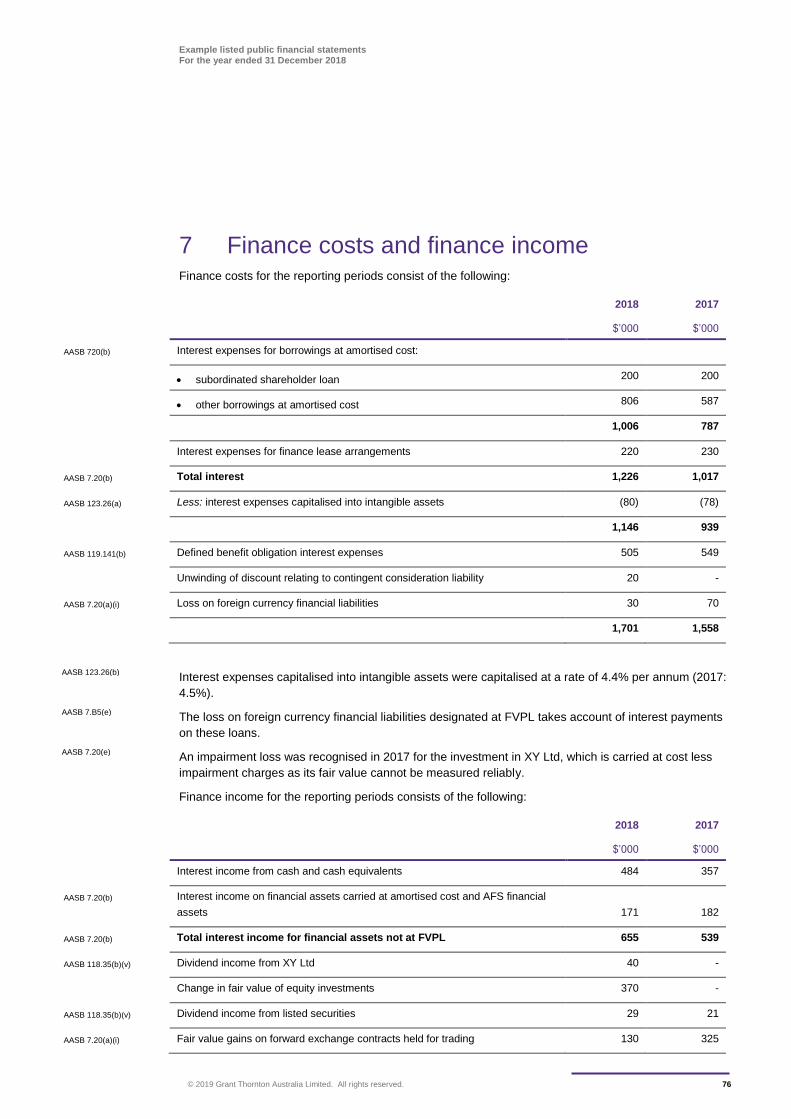
Example listed public financial statements For the year ended 31 December 2018
© 2019 Grant Thornton Australia Limited. All rights reserved. 76
7 Finance costs and finance income Finance costs for the reporting periods consist of the following:
2018 2017
$’000 $’000
AASB 720(b) Interest expenses for borrowings at amortised cost:
subordinated shareholder loan 200 200
other borrowings at amortised cost 806 587
1,006 787
Interest expenses for finance lease arrangements 220 230
AASB 7.20(b) Total interest 1,226 1,017
AASB 123.26(a) Less: interest expenses capitalised into intangible assets (80) (78)
1,146 939
AASB 119.141(b) Defined benefit obligation interest expenses 505 549
Unwinding of discount relating to contingent consideration liability 20 -
AASB 7.20(a)(i) Loss on foreign currency financial liabilities 30 70
1,701 1,558
Interest expenses capitalised into intangible assets were capitalised at a rate of 4.4% per annum (2017:
4.5%).
The loss on foreign currency financial liabilities designated at FVPL takes account of interest payments
on these loans.
An impairment loss was recognised in 2017 for the investment in XY Ltd, which is carried at cost less
impairment charges as its fair value cannot be measured reliably.
Finance income for the reporting periods consists of the following:
2018 2017
$’000 $’000
Interest income from cash and cash equivalents 484 357
AASB 7.20(b) Interest income on financial assets carried at amortised cost and AFS financial
assets 171 182
AASB 7.20(b) Total interest income for financial assets not at FVPL 655 539
AASB 118.35(b)(v) Dividend income from XY Ltd 40 -
Change in fair value of equity investments 370 -
AASB 118.35(b)(v) Dividend income from listed securities 29 21
AASB 7.20(a)(i) Fair value gains on forward exchange contracts held for trading 130 325
AASB 123.26(b)
AASB 7.B5(e)
AASB 7.20(e)
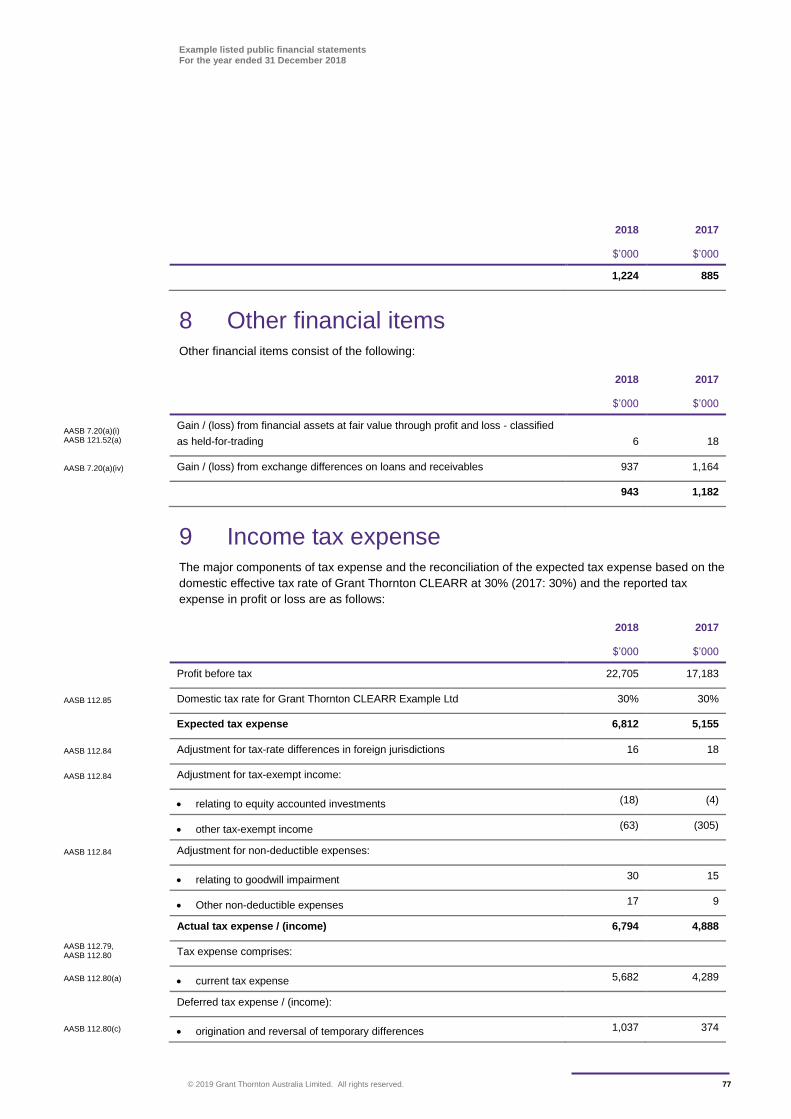
Example listed public financial statements For the year ended 31 December 2018
© 2019 Grant Thornton Australia Limited. All rights reserved. 77
2018 2017
$’000 $’000
1,224 885
8 Other financial items Other financial items consist of the following:
2018 2017
$’000 $’000
AASB 7.20(a)(i) AASB 121.52(a)
Gain / (loss) from financial assets at fair value through profit and loss - classified
as held-for-trading 6 18
AASB 7.20(a)(iv) Gain / (loss) from exchange differences on loans and receivables 937 1,164
943 1,182
9 Income tax expense The major components of tax expense and the reconciliation of the expected tax expense based on the
domestic effective tax rate of Grant Thornton CLEARR at 30% (2017: 30%) and the reported tax
expense in profit or loss are as follows:
2018 2017
$’000 $’000
Profit before tax 22,705 17,183
AASB 112.85 Domestic tax rate for Grant Thornton CLEARR Example Ltd 30% 30%
Expected tax expense 6,812 5,155
AASB 112.84 Adjustment for tax-rate differences in foreign jurisdictions 16 18
AASB 112.84 Adjustment for tax-exempt income:
relating to equity accounted investments (18) (4)
other tax-exempt income (63) (305)
AASB 112.84 Adjustment for non-deductible expenses:
relating to goodwill impairment 30 15
Other non-deductible expenses 17 9
Actual tax expense / (income) 6,794 4,888
AASB 112.79, AASB 112.80 Tax expense comprises:
AASB 112.80(a) current tax expense 5,682 4,289
Deferred tax expense / (income):
AASB 112.80(c) origination and reversal of temporary differences 1,037 374
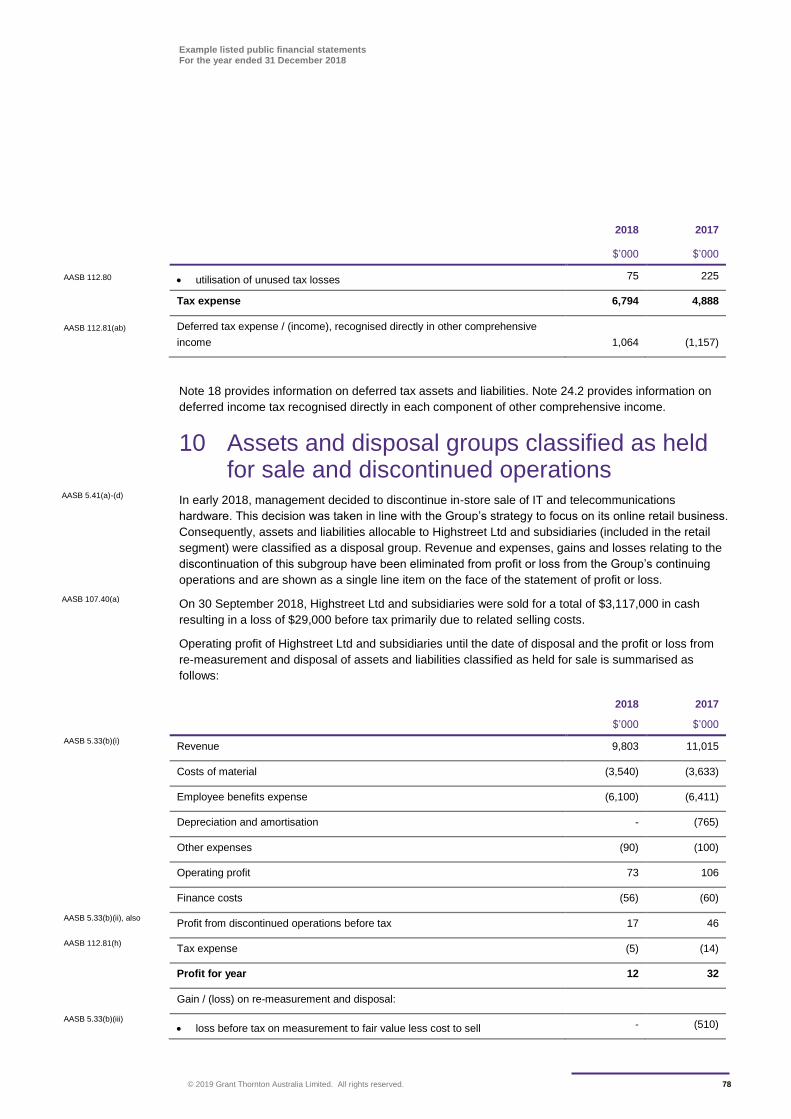
Example listed public financial statements For the year ended 31 December 2018
© 2019 Grant Thornton Australia Limited. All rights reserved. 78
2018 2017
$’000 $’000
AASB 112.80 utilisation of unused tax losses 75 225
Tax expense 6,794 4,888
AASB 112.81(ab) Deferred tax expense / (income), recognised directly in other comprehensive
income 1,064 (1,157)
Note 18 provides information on deferred tax assets and liabilities. Note 24.2 provides information on
deferred income tax recognised directly in each component of other comprehensive income.
10 Assets and disposal groups classified as held for sale and discontinued operations
In early 2018, management decided to discontinue in-store sale of IT and telecommunications
hardware. This decision was taken in line with the Group’s strategy to focus on its online retail business.
Consequently, assets and liabilities allocable to Highstreet Ltd and subsidiaries (included in the retail
segment) were classified as a disposal group. Revenue and expenses, gains and losses relating to the
discontinuation of this subgroup have been eliminated from profit or loss from the Group’s continuing
operations and are shown as a single line item on the face of the statement of profit or loss.
On 30 September 2018, Highstreet Ltd and subsidiaries were sold for a total of $3,117,000 in cash
resulting in a loss of $29,000 before tax primarily due to related selling costs.
Operating profit of Highstreet Ltd and subsidiaries until the date of disposal and the profit or loss from
re-measurement and disposal of assets and liabilities classified as held for sale is summarised as
follows:
2018 2017
$’000 $’000
AASB 5.33(b)(i) Revenue 9,803 11,015
Costs of material (3,540) (3,633)
Employee benefits expense (6,100) (6,411)
Depreciation and amortisation - (765)
Other expenses (90) (100)
Operating profit 73 106
Finance costs (56) (60)
AASB 5.33(b)(ii), also Profit from discontinued operations before tax 17 46
AASB 112.81(h) Tax expense (5) (14)
Profit for year 12 32
Gain / (loss) on re-measurement and disposal:
AASB 5.33(b)(iii)
loss before tax on measurement to fair value less cost to sell - (510)
AASB 5.41(a)-(d)
AASB 107.40(a)
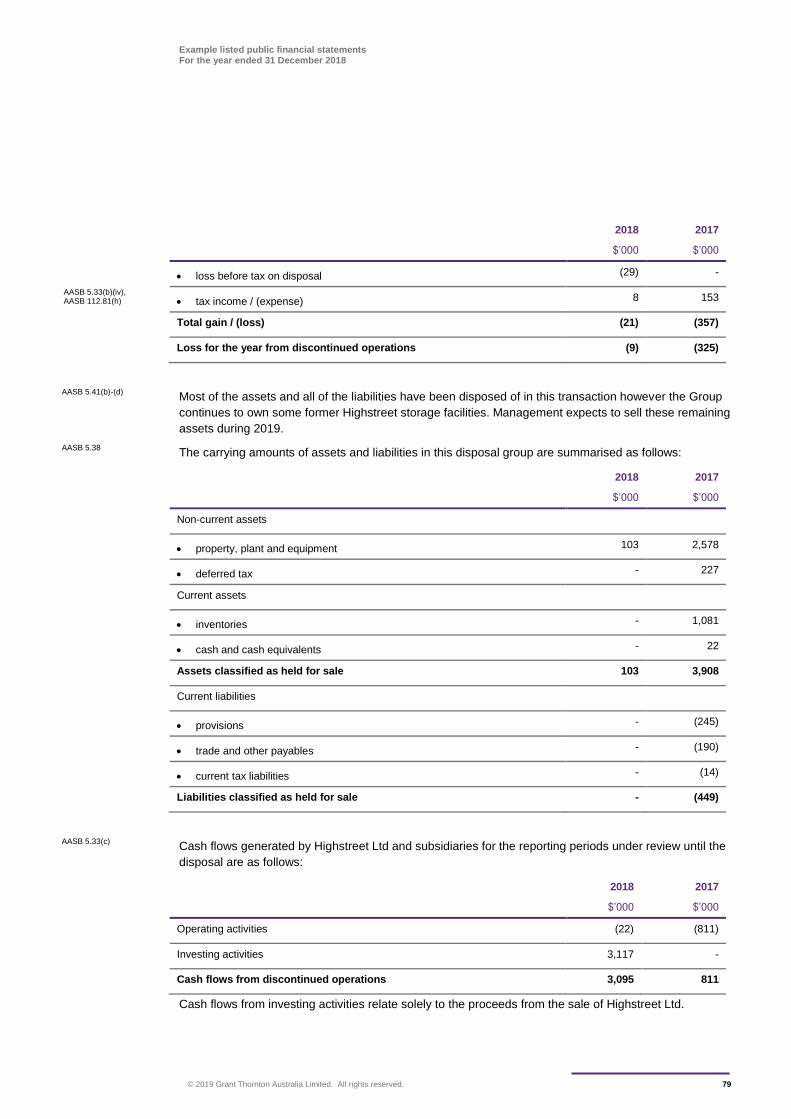
Example listed public financial statements For the year ended 31 December 2018
© 2019 Grant Thornton Australia Limited. All rights reserved. 79
2018 2017
$’000 $’000
loss before tax on disposal (29) -
AASB 5.33(b)(iv), AASB 112.81(h) tax income / (expense) 8 153
Total gain / (loss) (21) (357)
Loss for the year from discontinued operations (9) (325)
Most of the assets and all of the liabilities have been disposed of in this transaction however the Group
continues to own some former Highstreet storage facilities. Management expects to sell these remaining
assets during 2019.
The carrying amounts of assets and liabilities in this disposal group are summarised as follows:
2018 2017
$’000 $’000
Non-current assets
property, plant and equipment 103 2,578
deferred tax - 227
Current assets
inventories - 1,081
cash and cash equivalents - 22
Assets classified as held for sale 103 3,908
Current liabilities
provisions - (245)
trade and other payables - (190)
current tax liabilities - (14)
Liabilities classified as held for sale - (449)
Cash flows generated by Highstreet Ltd and subsidiaries for the reporting periods under review until the
disposal are as follows:
2018 2017
$’000 $’000
Operating activities (22) (811)
Investing activities 3,117 -
Cash flows from discontinued operations 3,095 811
Cash flows from investing activities relate solely to the proceeds from the sale of Highstreet Ltd.
AASB 5.41(b)-(d)
AASB 5.38
AASB 5.33(c)
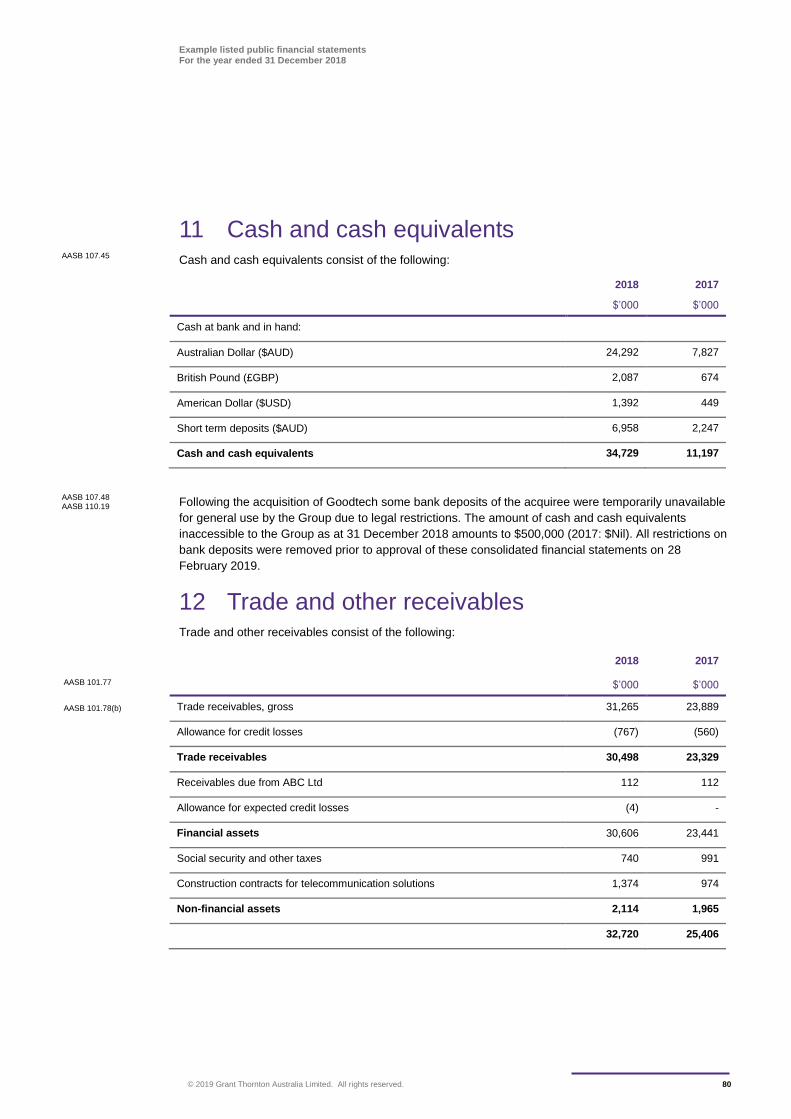
Example listed public financial statements For the year ended 31 December 2018
© 2019 Grant Thornton Australia Limited. All rights reserved. 80
11 Cash and cash equivalents Cash and cash equivalents consist of the following:
2018 2017
$’000 $’000
Cash at bank and in hand:
Australian Dollar ($AUD) 24,292 7,827
British Pound (£GBP) 2,087 674
American Dollar ($USD) 1,392 449
Short term deposits ($AUD) 6,958 2,247
Cash and cash equivalents 34,729 11,197
Following the acquisition of Goodtech some bank deposits of the acquiree were temporarily unavailable
for general use by the Group due to legal restrictions. The amount of cash and cash equivalents
inaccessible to the Group as at 31 December 2018 amounts to $500,000 (2017: $Nil). All restrictions on
bank deposits were removed prior to approval of these consolidated financial statements on 28
February 2019.
12 Trade and other receivables Trade and other receivables consist of the following:
2018 2017
AASB 101.77 $’000 $’000
AASB 101.78(b) Trade receivables, gross 31,265 23,889
Allowance for credit losses (767) (560)
Trade receivables 30,498 23,329
Receivables due from ABC Ltd 112 112
Allowance for expected credit losses (4) -
Financial assets 30,606 23,441
Social security and other taxes 740 991
Construction contracts for telecommunication solutions 1,374 974
Non-financial assets 2,114 1,965
32,720 25,406
AASB 107.45
AASB 107.48 AASB 110.19
Example listed public financial statements For the year ended 31 December 2018
© 2019 Grant Thornton Australia Limited. All rights reserved. 81
All amounts are short-term. The net carrying value of trade receivables is considered a reasonable
approximation of fair value.
The receivable due from ABC Associates relates to the remaining consideration due on the sale of a
former subsidiary in 2017. The carrying amount of the receivable is considered a reasonable
approximation of fair value as this financial asset (which is measured at amortised cost) is expected to
be paid within six months, such that the time value of money is not significant.
All of the Group’s trade and other receivables have been reviewed for indicators of impairment. Certain
trade receivables were found to be impaired and an allowance for credit losses of $72,000 (2017:
$514,000) has been recorded accordingly within other expenses. The impaired trade receivables are
mostly due from customers in the business-to-business market that are experiencing financial
difficulties.
An analysis of unimpaired trade receivables that are past due is given in Note 35.2.
AASB 7.25 AASB 7.29
AASB 101.60
AASB 7.37(b)
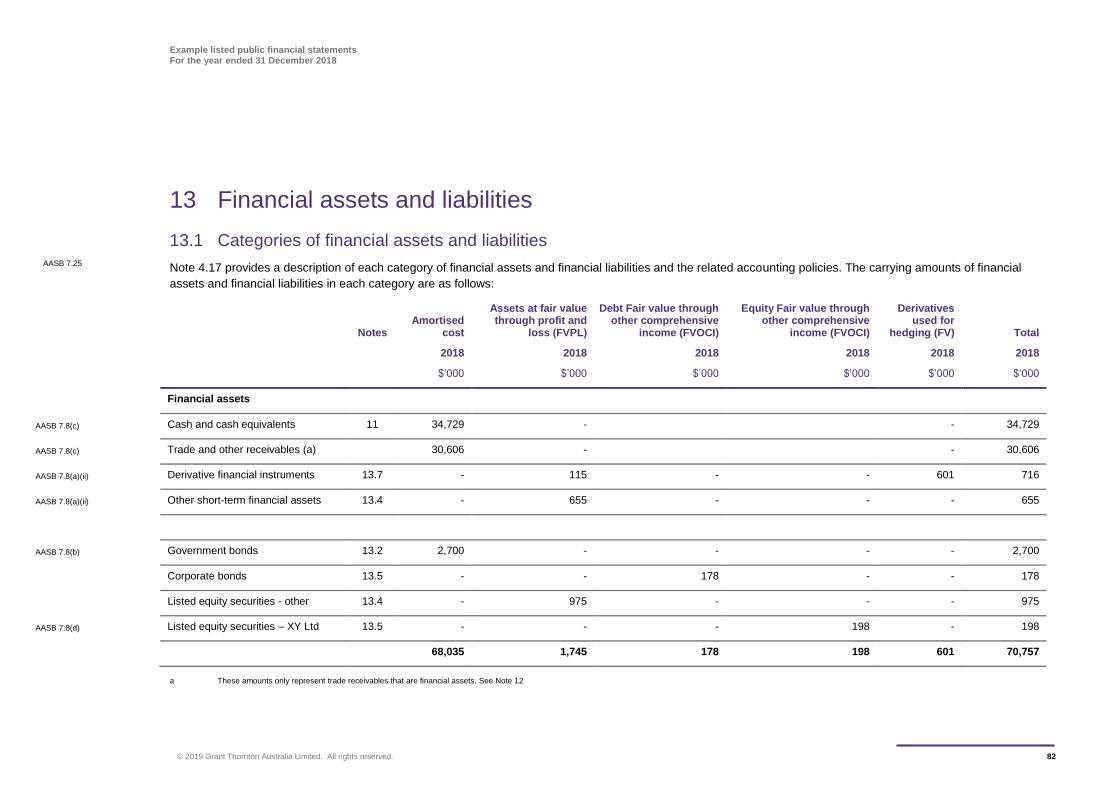
Example listed public financial statements For the year ended 31 December 2018
© 2019 Grant Thornton Australia Limited. All rights reserved. 82
13 Financial assets and liabilities
13.1 Categories of financial assets and liabilities
Note 4.17 provides a description of each category of financial assets and financial liabilities and the related accounting policies. The carrying amounts of financial
assets and financial liabilities in each category are as follows:
Notes Amortised
cost
Assets at fair value through profit and
loss (FVPL)
Debt Fair value through other comprehensive
income (FVOCI)
Equity Fair value through other comprehensive
income (FVOCI)
Derivatives used for
hedging (FV) Total
2018 2018 2018 2018 2018 2018
$’000 $’000 $’000 $’000 $’000 $‘000
Financial assets
AASB 7.8(c) Cash and cash equivalents 11 34,729 - - 34,729
AASB 7.8(c) Trade and other receivables (a) 30,606 - - 30,606
AASB 7.8(a)(ii) Derivative financial instruments 13.7 - 115 - - 601 716
AASB 7.8(a)(ii) Other short-term financial assets 13.4 - 655 - - - 655
AASB 7.8(b) Government bonds 13.2 2,700 - - - - 2,700
Corporate bonds 13.5 - - 178 - - 178
Listed equity securities - other 13.4 - 975 - - - 975
AASB 7.8(d) Listed equity securities – XY Ltd 13.5 - - - 198 - 198
68,035 1,745 178 198 601 70,757
a These amounts only represent trade receivables that are financial assets. See Note 12
AASB 7.25
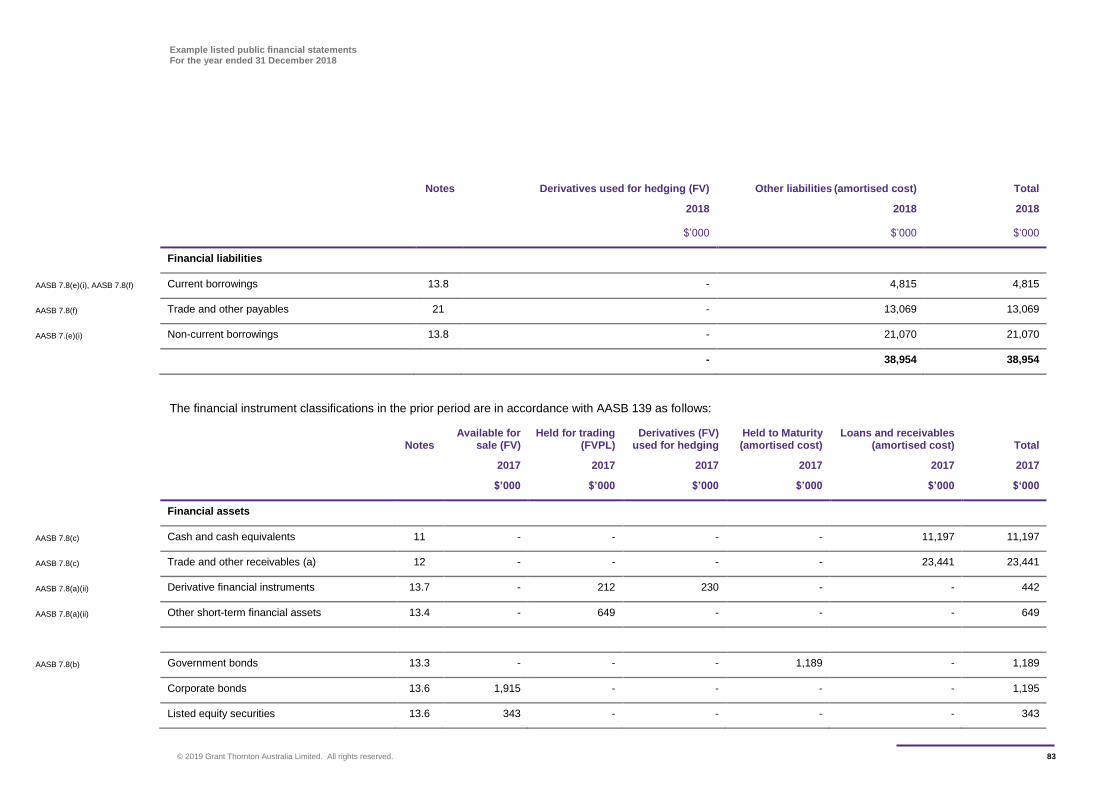
Example listed public financial statements For the year ended 31 December 2018
© 2019 Grant Thornton Australia Limited. All rights reserved. 83
Notes Derivatives used for hedging (FV) Other liabilities (amortised cost) Total
2018 2018 2018
$’000 $’000 $‘000
Financial liabilities
AASB 7.8(e)(i), AASB 7.8(f) Current borrowings 13.8 - 4,815 4,815
AASB 7.8(f) Trade and other payables 21 - 13,069 13,069
AASB 7.(e)(i) Non-current borrowings 13.8 - 21,070 21,070
- 38,954 38,954
The financial instrument classifications in the prior period are in accordance with AASB 139 as follows:
Notes
Available for sale (FV)
Held for trading (FVPL)
Derivatives (FV) used for hedging
Held to Maturity (amortised cost)
Loans and receivables (amortised cost) Total
2017 2017 2017 2017 2017 2017
$’000 $’000 $’000 $’000 $’000 $‘000
Financial assets
AASB 7.8(c) Cash and cash equivalents 11 - - - - 11,197 11,197
AASB 7.8(c) Trade and other receivables (a) 12 - - - - 23,441 23,441
AASB 7.8(a)(ii) Derivative financial instruments 13.7 - 212 230 - - 442
AASB 7.8(a)(ii) Other short-term financial assets 13.4 - 649 - - - 649
AASB 7.8(b) Government bonds 13.3 - - - 1,189 - 1,189
Corporate bonds 13.6 1,915 - - - - 1,195
Listed equity securities 13.6 343 - - - - 343
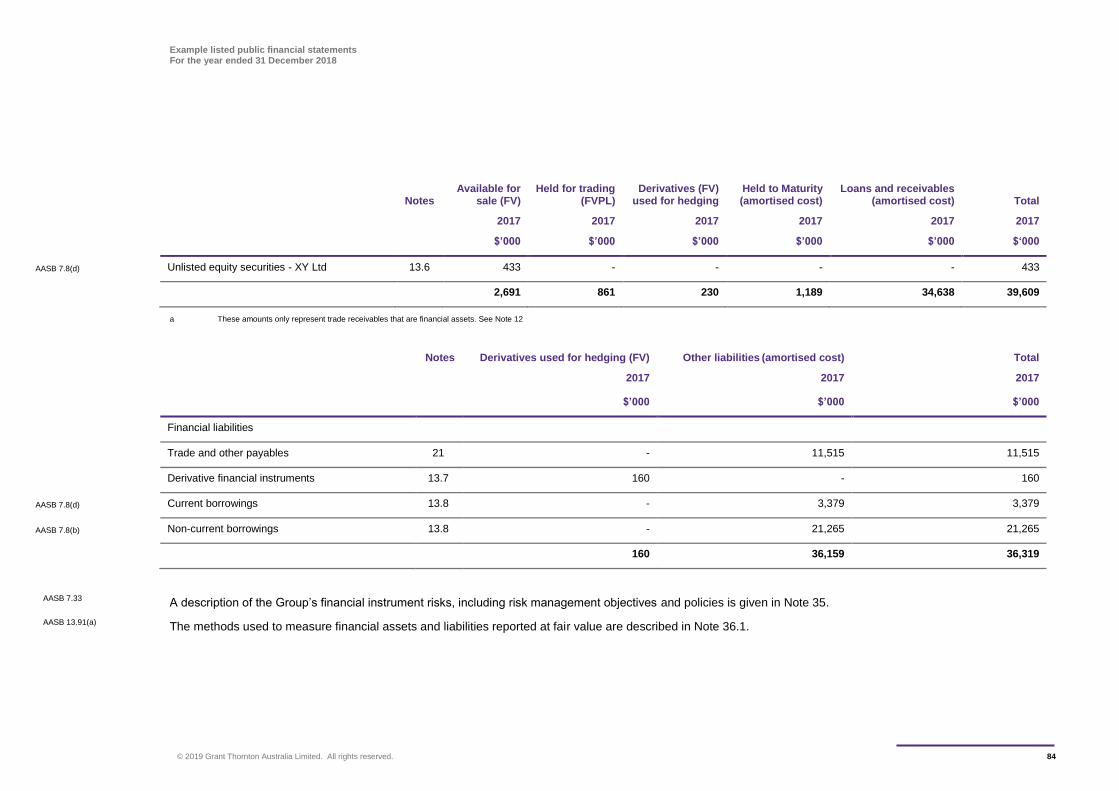
Example listed public financial statements For the year ended 31 December 2018
© 2019 Grant Thornton Australia Limited. All rights reserved. 84
Notes
Available for sale (FV)
Held for trading (FVPL)
Derivatives (FV) used for hedging
Held to Maturity (amortised cost)
Loans and receivables (amortised cost) Total
2017 2017 2017 2017 2017 2017
$’000 $’000 $’000 $’000 $’000 $‘000
AASB 7.8(d) Unlisted equity securities - XY Ltd 13.6 433 - - - - 433
2,691 861 230 1,189 34,638 39,609
a These amounts only represent trade receivables that are financial assets. See Note 12
Notes Derivatives used for hedging (FV) Other liabilities (amortised cost) Total
2017 2017 2017
$’000 $’000 $’000
Financial liabilities
Trade and other payables 21 - 11,515 11,515
Derivative financial instruments 13.7 160 - 160
AASB 7.8(d) Current borrowings 13.8 - 3,379 3,379
AASB 7.8(b) Non-current borrowings 13.8 - 21,265 21,265
160 36,159 36,319
A description of the Group’s financial instrument risks, including risk management objectives and policies is given in Note 35.
The methods used to measure financial assets and liabilities reported at fair value are described in Note 36.1.
AASB 7.33
AASB 13.91(a)
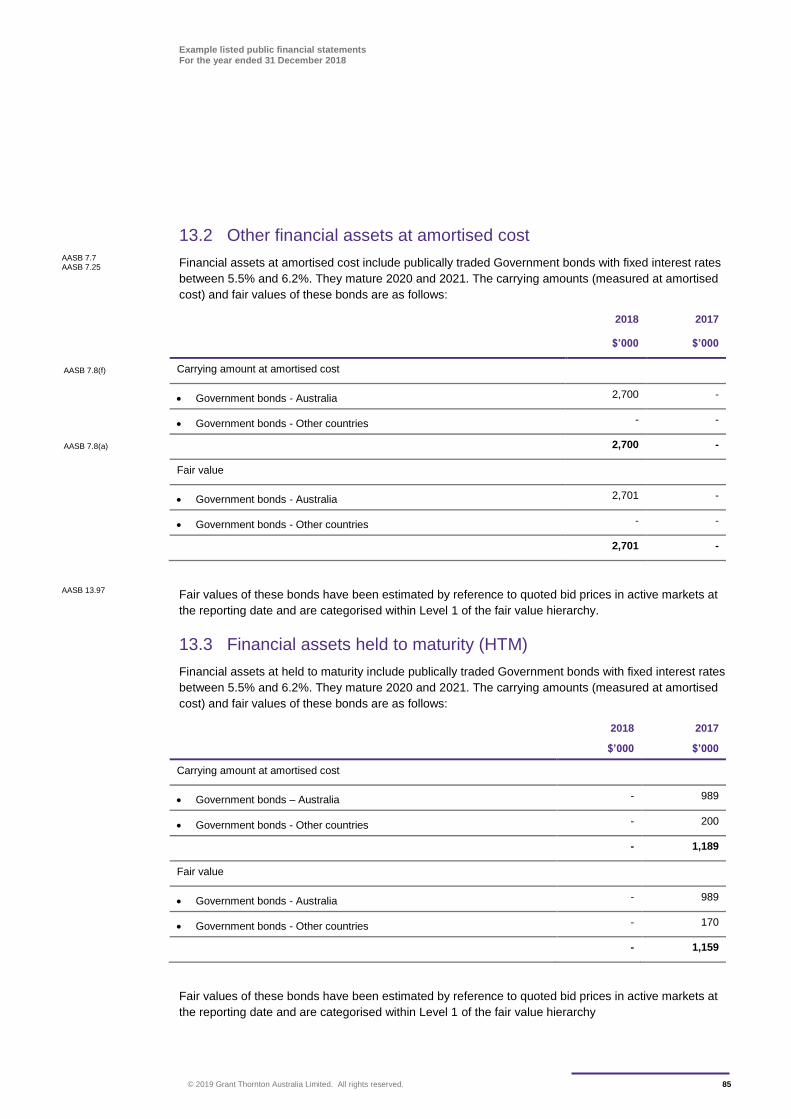
Example listed public financial statements For the year ended 31 December 2018
© 2019 Grant Thornton Australia Limited. All rights reserved. 85
13.2 Other financial assets at amortised cost
Financial assets at amortised cost include publically traded Government bonds with fixed interest rates
between 5.5% and 6.2%. They mature 2020 and 2021. The carrying amounts (measured at amortised
cost) and fair values of these bonds are as follows:
2018 2017
$’000 $’000
AASB 7.8(f) Carrying amount at amortised cost
Government bonds - Australia 2,700 -
Government bonds - Other countries - -
AASB 7.8(a) 2,700 -
Fair value
Government bonds - Australia 2,701 -
Government bonds - Other countries - -
2,701 -
Fair values of these bonds have been estimated by reference to quoted bid prices in active markets at
the reporting date and are categorised within Level 1 of the fair value hierarchy.
13.3 Financial assets held to maturity (HTM)
Financial assets at held to maturity include publically traded Government bonds with fixed interest rates
between 5.5% and 6.2%. They mature 2020 and 2021. The carrying amounts (measured at amortised
cost) and fair values of these bonds are as follows:
2018 2017
$’000 $’000
Carrying amount at amortised cost
Government bonds – Australia - 989
Government bonds - Other countries - 200
- 1,189
Fair value
Government bonds - Australia - 989
Government bonds - Other countries - 170
- 1,159
Fair values of these bonds have been estimated by reference to quoted bid prices in active markets at
the reporting date and are categorised within Level 1 of the fair value hierarchy
AASB 7.7 AASB 7.25
AASB 13.97
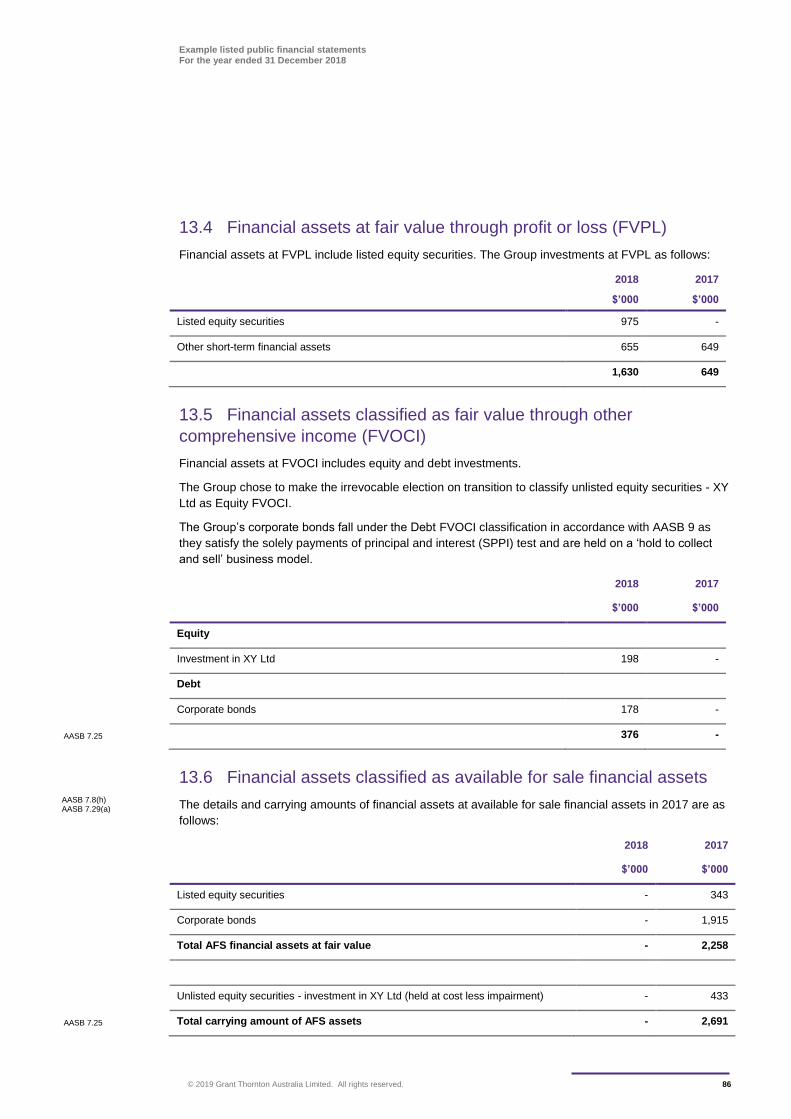
Example listed public financial statements For the year ended 31 December 2018
© 2019 Grant Thornton Australia Limited. All rights reserved. 86
13.4 Financial assets at fair value through profit or loss (FVPL)
Financial assets at FVPL include listed equity securities. The Group investments at FVPL as follows:
2018 2017
$’000 $’000
Listed equity securities 975 -
Other short-term financial assets 655 649
1,630 649
13.5 Financial assets classified as fair value through other
comprehensive income (FVOCI)
Financial assets at FVOCI includes equity and debt investments.
The Group chose to make the irrevocable election on transition to classify unlisted equity securities - XY
Ltd as Equity FVOCI.
The Group’s corporate bonds fall under the Debt FVOCI classification in accordance with AASB 9 as
they satisfy the solely payments of principal and interest (SPPI) test and are held on a ‘hold to collect
and sell’ business model.
2018 2017
$’000 $’000
Equity
Investment in XY Ltd 198 -
Debt
Corporate bonds 178 -
AASB 7.25 376 -
13.6 Financial assets classified as available for sale financial assets
The details and carrying amounts of financial assets at available for sale financial assets in 2017 are as
follows:
2018 2017
$’000 $’000
Listed equity securities - 343
Corporate bonds - 1,915
Total AFS financial assets at fair value - 2,258
Unlisted equity securities - investment in XY Ltd (held at cost less impairment) - 433
AASB 7.25 Total carrying amount of AFS assets - 2,691
AASB 7.8(h) AASB 7.29(a)
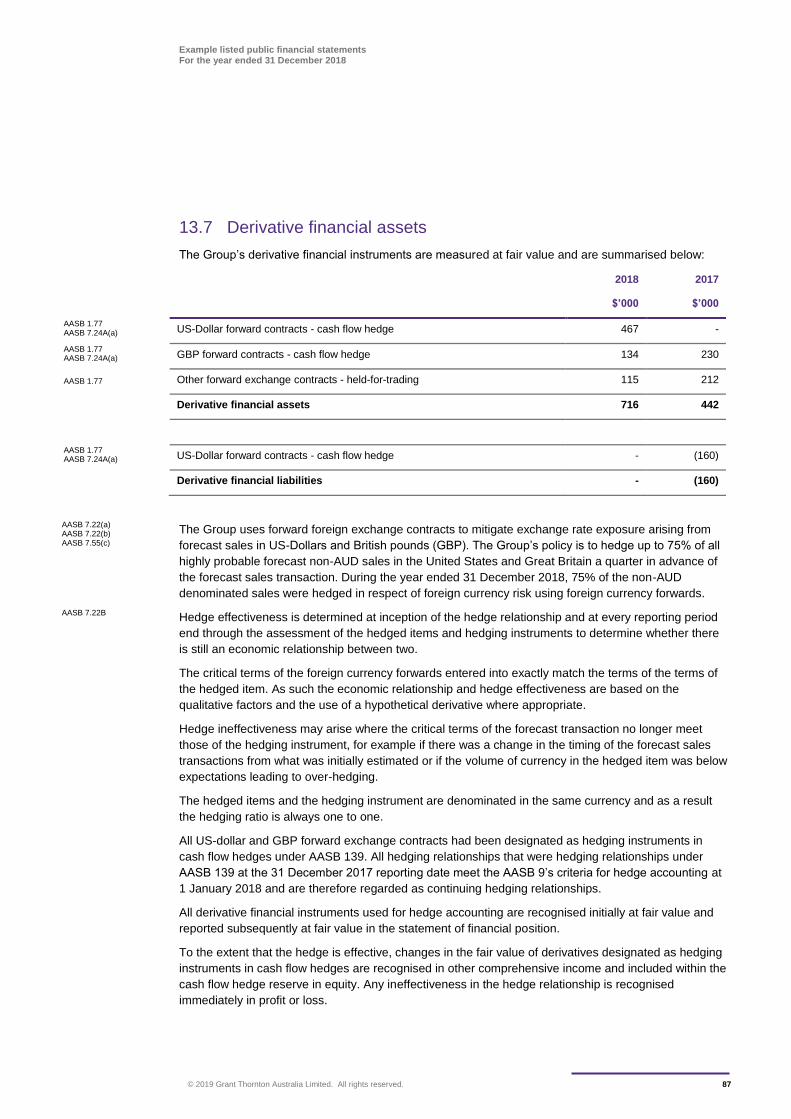
Example listed public financial statements For the year ended 31 December 2018
© 2019 Grant Thornton Australia Limited. All rights reserved. 87
13.7 Derivative financial assets
The Group’s derivative financial instruments are measured at fair value and are summarised below:
2018 2017
$’000 $’000
AASB 1.77 AASB 7.24A(a) US-Dollar forward contracts - cash flow hedge 467 -
AASB 1.77 AASB 7.24A(a) GBP forward contracts - cash flow hedge 134 230
AASB 1.77 Other forward exchange contracts - held-for-trading 115 212
Derivative financial assets 716 442
AASB 1.77 AASB 7.24A(a) US-Dollar forward contracts - cash flow hedge - (160)
Derivative financial liabilities - (160)
The Group uses forward foreign exchange contracts to mitigate exchange rate exposure arising from
forecast sales in US-Dollars and British pounds (GBP). The Group’s policy is to hedge up to 75% of all
highly probable forecast non-AUD sales in the United States and Great Britain a quarter in advance of
the forecast sales transaction. During the year ended 31 December 2018, 75% of the non-AUD
denominated sales were hedged in respect of foreign currency risk using foreign currency forwards.
Hedge effectiveness is determined at inception of the hedge relationship and at every reporting period
end through the assessment of the hedged items and hedging instruments to determine whether there
is still an economic relationship between two.
The critical terms of the foreign currency forwards entered into exactly match the terms of the terms of
the hedged item. As such the economic relationship and hedge effectiveness are based on the
qualitative factors and the use of a hypothetical derivative where appropriate.
Hedge ineffectiveness may arise where the critical terms of the forecast transaction no longer meet
those of the hedging instrument, for example if there was a change in the timing of the forecast sales
transactions from what was initially estimated or if the volume of currency in the hedged item was below
expectations leading to over-hedging.
The hedged items and the hedging instrument are denominated in the same currency and as a result
the hedging ratio is always one to one.
All US-dollar and GBP forward exchange contracts had been designated as hedging instruments in
cash flow hedges under AASB 139. All hedging relationships that were hedging relationships under
AASB 139 at the 31 December 2017 reporting date meet the AASB 9’s criteria for hedge accounting at
1 January 2018 and are therefore regarded as continuing hedging relationships.
All derivative financial instruments used for hedge accounting are recognised initially at fair value and
reported subsequently at fair value in the statement of financial position.
To the extent that the hedge is effective, changes in the fair value of derivatives designated as hedging
instruments in cash flow hedges are recognised in other comprehensive income and included within the
cash flow hedge reserve in equity. Any ineffectiveness in the hedge relationship is recognised
immediately in profit or loss.
AASB 7.22(a) AASB 7.22(b) AASB 7.55(c)
AASB 7.22B
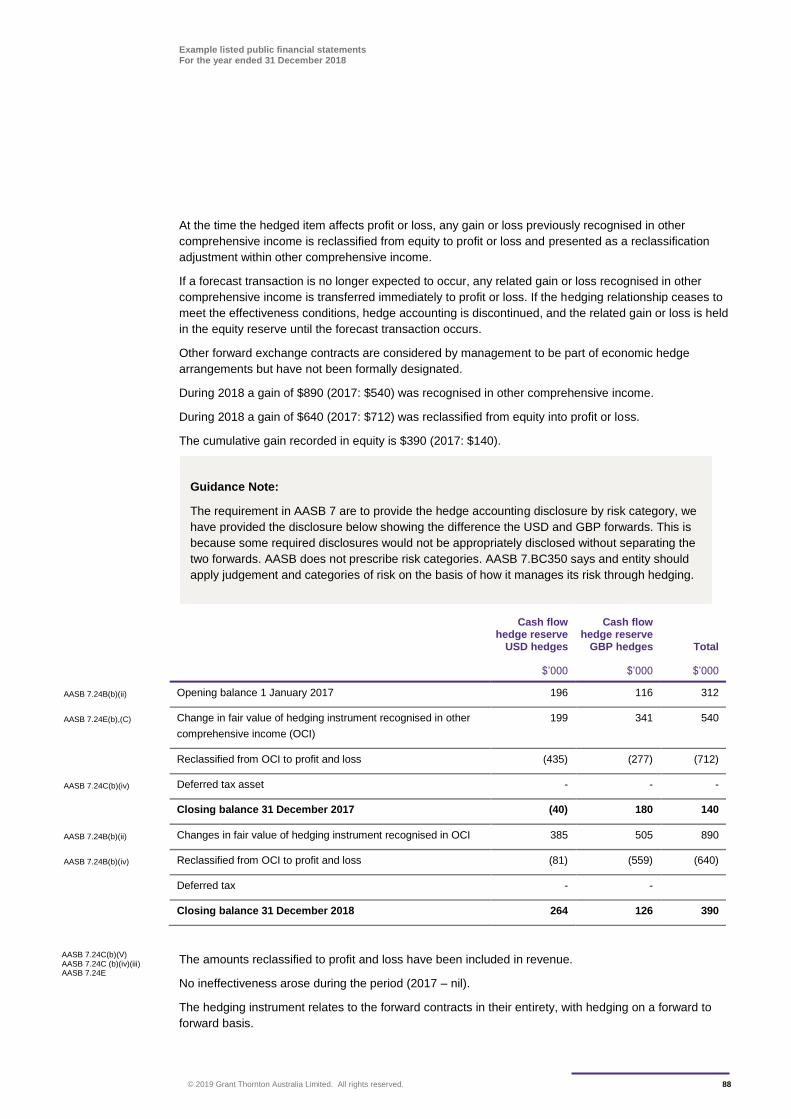
Example listed public financial statements For the year ended 31 December 2018
© 2019 Grant Thornton Australia Limited. All rights reserved. 88
At the time the hedged item affects profit or loss, any gain or loss previously recognised in other
comprehensive income is reclassified from equity to profit or loss and presented as a reclassification
adjustment within other comprehensive income.
If a forecast transaction is no longer expected to occur, any related gain or loss recognised in other
comprehensive income is transferred immediately to profit or loss. If the hedging relationship ceases to
meet the effectiveness conditions, hedge accounting is discontinued, and the related gain or loss is held
in the equity reserve until the forecast transaction occurs.
Other forward exchange contracts are considered by management to be part of economic hedge
arrangements but have not been formally designated.
During 2018 a gain of $890 (2017: $540) was recognised in other comprehensive income.
During 2018 a gain of $640 (2017: $712) was reclassified from equity into profit or loss.
The cumulative gain recorded in equity is $390 (2017: $140).
Cash flow hedge reserve
USD hedges
Cash flow hedge reserve
GBP hedges Total
$’000 $’000 $’000
AASB 7.24B(b)(ii) Opening balance 1 January 2017 196 116 312
AASB 7.24E(b),(C) Change in fair value of hedging instrument recognised in other
comprehensive income (OCI)
199 341 540
Reclassified from OCI to profit and loss (435) (277) (712)
AASB 7.24C(b)(iv) Deferred tax asset - - -
Closing balance 31 December 2017 (40) 180 140
AASB 7.24B(b)(ii) Changes in fair value of hedging instrument recognised in OCI 385 505 890
AASB 7.24B(b)(iv) Reclassified from OCI to profit and loss (81) (559) (640)
Deferred tax - -
Closing balance 31 December 2018 264 126 390
The amounts reclassified to profit and loss have been included in revenue.
No ineffectiveness arose during the period (2017 – nil).
The hedging instrument relates to the forward contracts in their entirety, with hedging on a forward to
forward basis.
AASB 7.24C(b)(V) AASB 7.24C (b)(iv)(iii) AASB 7.24E
Guidance Note:
The requirement in AASB 7 are to provide the hedge accounting disclosure by risk category, we
have provided the disclosure below showing the difference the USD and GBP forwards. This is
because some required disclosures would not be appropriately disclosed without separating the
two forwards. AASB does not prescribe risk categories. AASB 7.BC350 says and entity should
apply judgement and categories of risk on the basis of how it manages its risk through hedging.
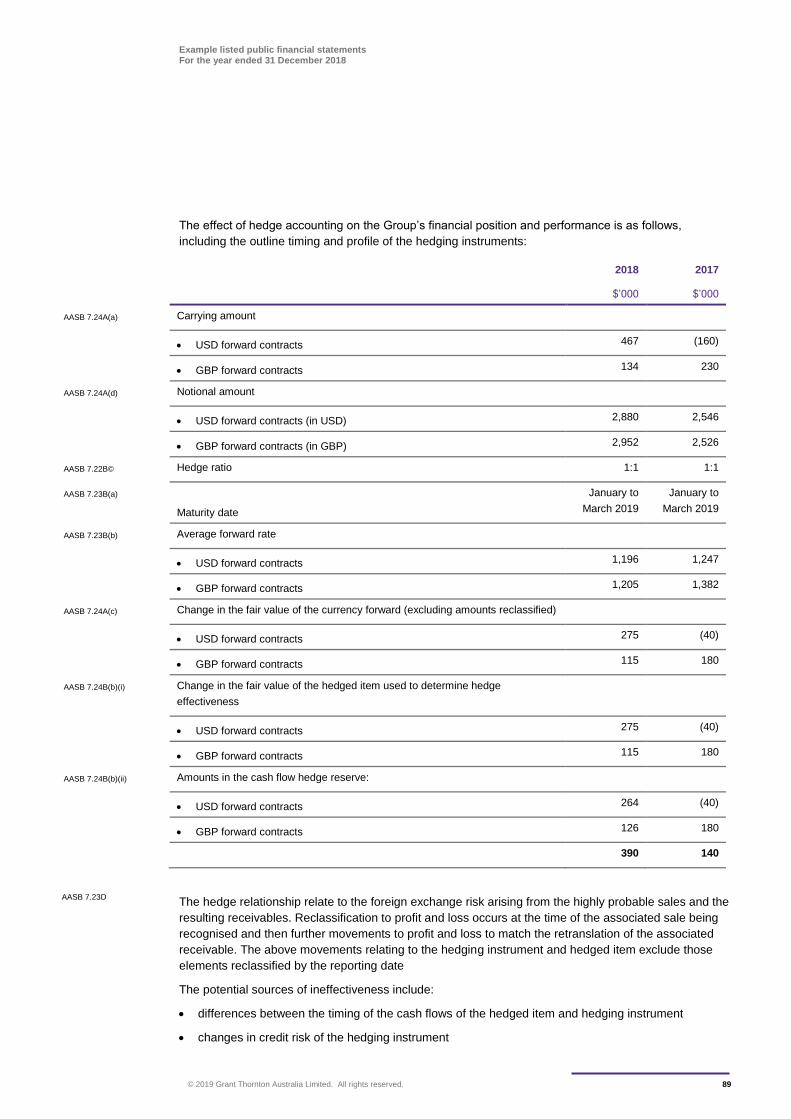
Example listed public financial statements For the year ended 31 December 2018
© 2019 Grant Thornton Australia Limited. All rights reserved. 89
The effect of hedge accounting on the Group’s financial position and performance is as follows,
including the outline timing and profile of the hedging instruments:
2018 2017
$’000 $’000
AASB 7.24A(a) Carrying amount
USD forward contracts 467 (160)
GBP forward contracts 134 230
AASB 7.24A(d) Notional amount
USD forward contracts (in USD) 2,880 2,546
GBP forward contracts (in GBP) 2,952 2,526
AASB 7.22B© Hedge ratio 1:1 1:1
AASB 7.23B(a)
Maturity date
January to
March 2019
January to
March 2019
AASB 7.23B(b) Average forward rate
USD forward contracts 1,196 1,247
GBP forward contracts 1,205 1,382
AASB 7.24A(c) Change in the fair value of the currency forward (excluding amounts reclassified)
USD forward contracts 275 (40)
GBP forward contracts 115 180
AASB 7.24B(b)(i) Change in the fair value of the hedged item used to determine hedge
effectiveness
USD forward contracts 275 (40)
GBP forward contracts 115 180
AASB 7.24B(b)(ii) Amounts in the cash flow hedge reserve:
USD forward contracts 264 (40)
GBP forward contracts 126 180
390 140
The hedge relationship relate to the foreign exchange risk arising from the highly probable sales and the
resulting receivables. Reclassification to profit and loss occurs at the time of the associated sale being
recognised and then further movements to profit and loss to match the retranslation of the associated
receivable. The above movements relating to the hedging instrument and hedged item exclude those
elements reclassified by the reporting date
The potential sources of ineffectiveness include:
differences between the timing of the cash flows of the hedged item and hedging instrument
changes in credit risk of the hedging instrument
AASB 7.23D
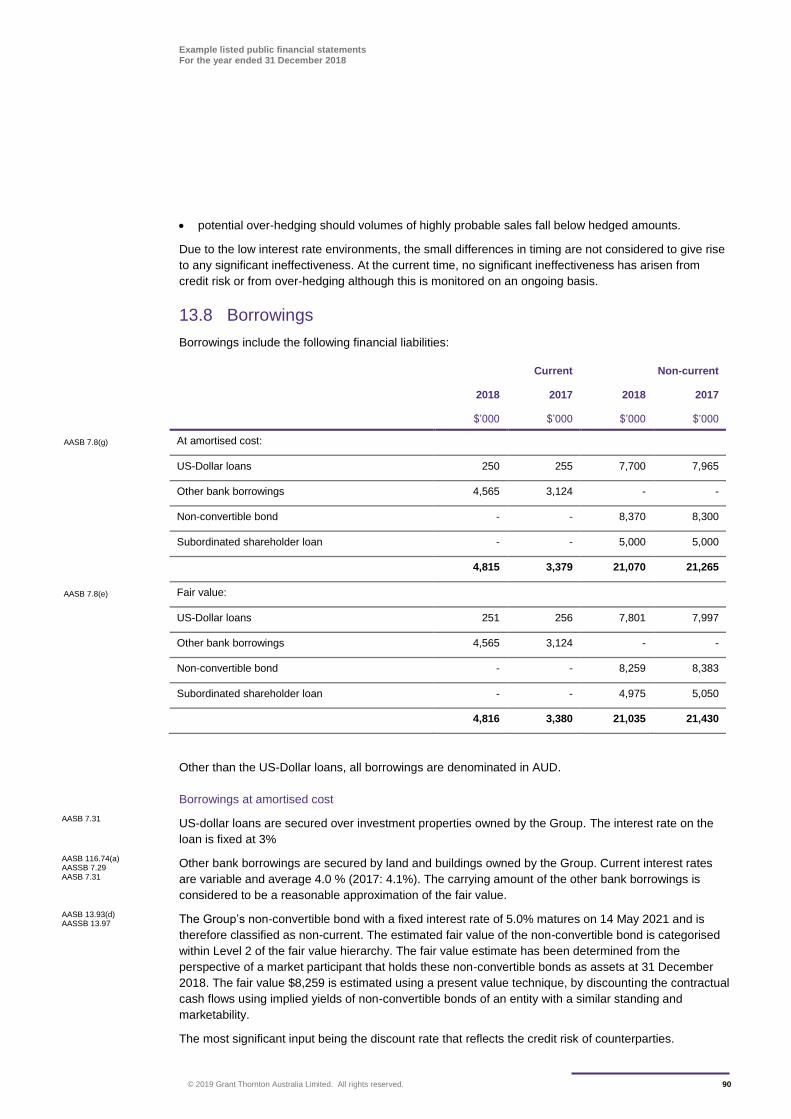
Example listed public financial statements For the year ended 31 December 2018
© 2019 Grant Thornton Australia Limited. All rights reserved. 90
potential over-hedging should volumes of highly probable sales fall below hedged amounts.
Due to the low interest rate environments, the small differences in timing are not considered to give rise
to any significant ineffectiveness. At the current time, no significant ineffectiveness has arisen from
credit risk or from over-hedging although this is monitored on an ongoing basis.
13.8 Borrowings
Borrowings include the following financial liabilities:
Current Non-current
2018 2017 2018 2017
$’000 $’000 $’000 $’000
AASB 7.8(g) At amortised cost:
US-Dollar loans 250 255 7,700 7,965
Other bank borrowings 4,565 3,124 - -
Non-convertible bond - - 8,370 8,300
Subordinated shareholder loan - - 5,000 5,000
4,815 3,379 21,070 21,265
AASB 7.8(e) Fair value:
US-Dollar loans 251 256 7,801 7,997
Other bank borrowings 4,565 3,124 - -
Non-convertible bond - - 8,259 8,383
Subordinated shareholder loan - - 4,975 5,050
4,816 3,380 21,035 21,430
Other than the US-Dollar loans, all borrowings are denominated in AUD.
Borrowings at amortised cost
US-dollar loans are secured over investment properties owned by the Group. The interest rate on the
loan is fixed at 3%
Other bank borrowings are secured by land and buildings owned by the Group. Current interest rates
are variable and average 4.0 % (2017: 4.1%). The carrying amount of the other bank borrowings is
considered to be a reasonable approximation of the fair value.
The Group’s non-convertible bond with a fixed interest rate of 5.0% matures on 14 May 2021 and is
therefore classified as non-current. The estimated fair value of the non-convertible bond is categorised
within Level 2 of the fair value hierarchy. The fair value estimate has been determined from the
perspective of a market participant that holds these non-convertible bonds as assets at 31 December
2018. The fair value $8,259 is estimated using a present value technique, by discounting the contractual
cash flows using implied yields of non-convertible bonds of an entity with a similar standing and
marketability.
The most significant input being the discount rate that reflects the credit risk of counterparties.
AASB 7.31
AASB 116.74(a) AASSB 7.29 AASB 7.31
AASB 13.93(d) AASSB 13.97
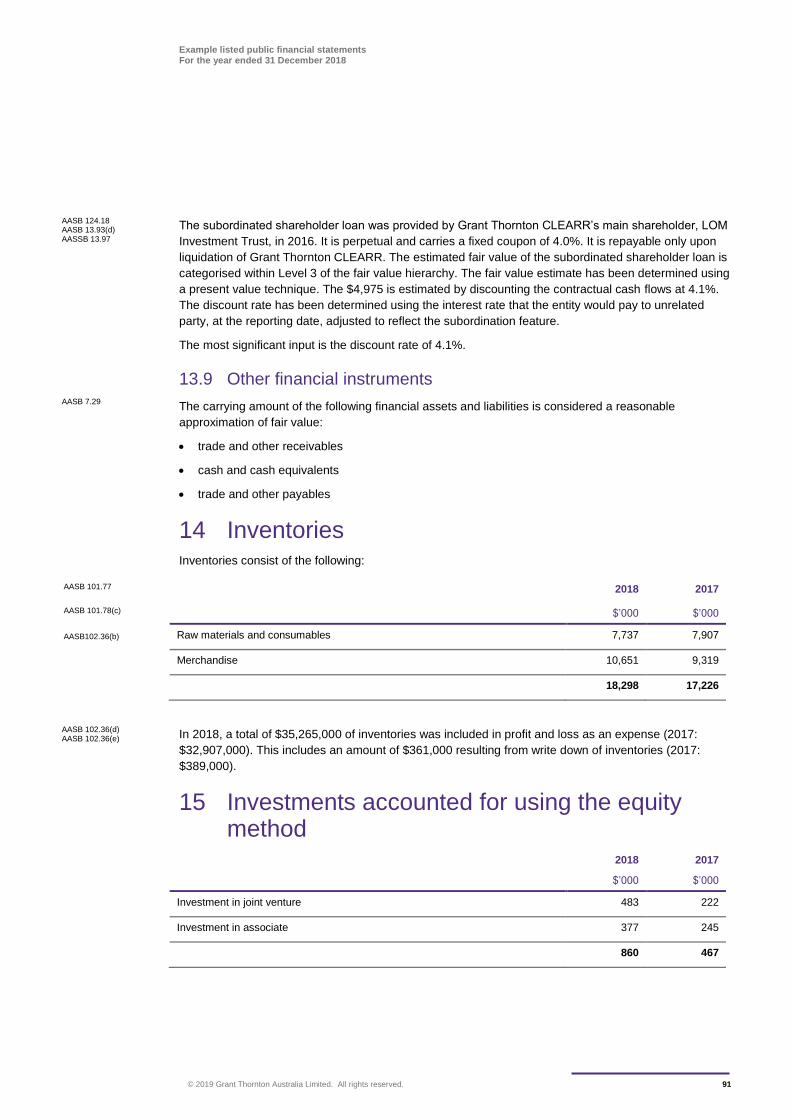
Example listed public financial statements For the year ended 31 December 2018
© 2019 Grant Thornton Australia Limited. All rights reserved. 91
The subordinated shareholder loan was provided by Grant Thornton CLEARR’s main shareholder, LOM
Investment Trust, in 2016. It is perpetual and carries a fixed coupon of 4.0%. It is repayable only upon
liquidation of Grant Thornton CLEARR. The estimated fair value of the subordinated shareholder loan is
categorised within Level 3 of the fair value hierarchy. The fair value estimate has been determined using
a present value technique. The $4,975 is estimated by discounting the contractual cash flows at 4.1%.
The discount rate has been determined using the interest rate that the entity would pay to unrelated
party, at the reporting date, adjusted to reflect the subordination feature.
The most significant input is the discount rate of 4.1%.
13.9 Other financial instruments
The carrying amount of the following financial assets and liabilities is considered a reasonable
approximation of fair value:
trade and other receivables
cash and cash equivalents
trade and other payables
14 Inventories Inventories consist of the following:
AASB 101.77 2018 2017
AASB 101.78(c) $’000 $’000
AASB102.36(b) Raw materials and consumables 7,737 7,907
Merchandise 10,651 9,319
18,298 17,226
In 2018, a total of $35,265,000 of inventories was included in profit and loss as an expense (2017:
$32,907,000). This includes an amount of $361,000 resulting from write down of inventories (2017:
$389,000).
15 Investments accounted for using the equity method
2018 2017
$’000 $’000
Investment in joint venture 483 222
Investment in associate 377 245
860 467
AASB 124.18 AASB 13.93(d) AASSB 13.97
AASB 7.29
AASB 102.36(d) AASB 102.36(e)
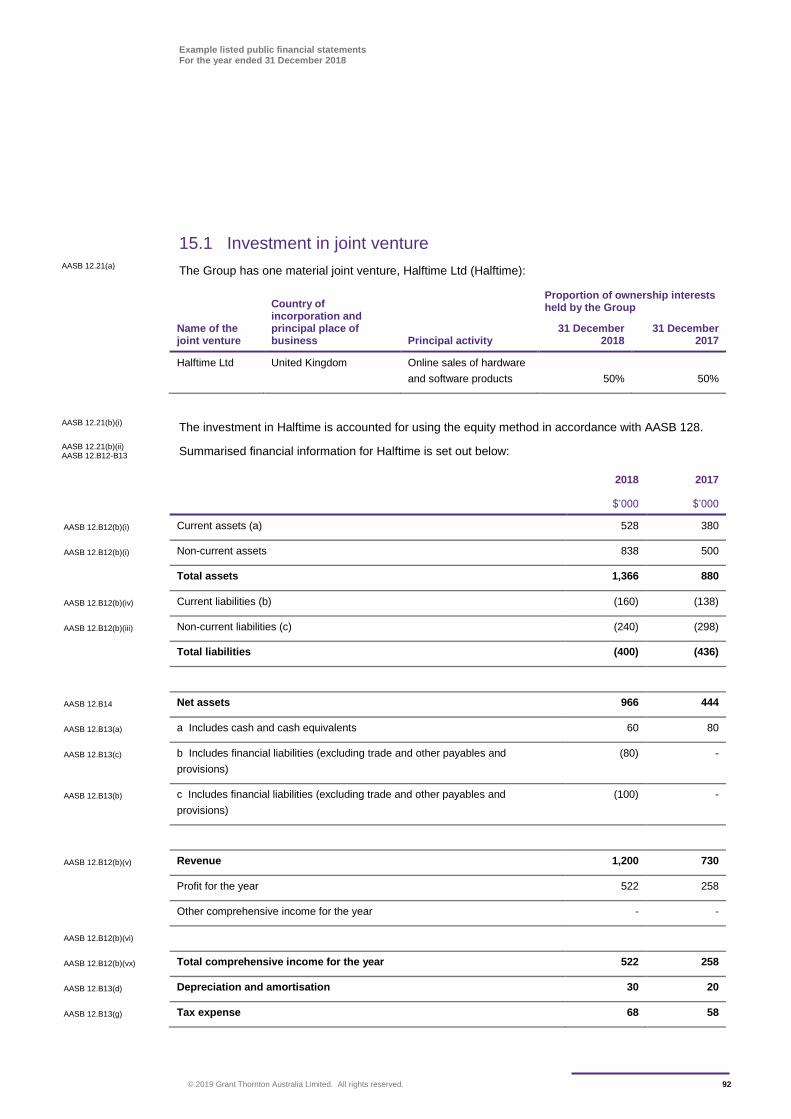
Example listed public financial statements For the year ended 31 December 2018
© 2019 Grant Thornton Australia Limited. All rights reserved. 92
15.1 Investment in joint venture
The Group has one material joint venture, Halftime Ltd (Halftime):
Name of the joint venture
Country of incorporation and principal place of business Principal activity
Proportion of ownership interests held by the Group
31 December 2018
31 December 2017
Halftime Ltd United Kingdom Online sales of hardware
and software products 50% 50%
The investment in Halftime is accounted for using the equity method in accordance with AASB 128.
Summarised financial information for Halftime is set out below:
2018 2017
$’000 $’000
AASB 12.B12(b)(i) Current assets (a) 528 380
AASB 12.B12(b)(i) Non-current assets 838 500
Total assets 1,366 880
AASB 12.B12(b)(iv) Current liabilities (b) (160) (138)
AASB 12.B12(b)(iii) Non-current liabilities (c) (240) (298)
Total liabilities (400) (436)
AASB 12.B14 Net assets 966 444
AASB 12.B13(a) a Includes cash and cash equivalents 60 80
AASB 12.B13(c) b Includes financial liabilities (excluding trade and other payables and
provisions)
(80) -
AASB 12.B13(b) c Includes financial liabilities (excluding trade and other payables and
provisions)
(100) -
AASB 12.B12(b)(v) Revenue 1,200 730
Profit for the year 522 258
Other comprehensive income for the year - -
AASB 12.B12(b)(vi)
AASB 12.B12(b)(vx) Total comprehensive income for the year 522 258
AASB 12.B13(d) Depreciation and amortisation 30 20
AASB 12.B13(g) Tax expense 68 58
AASB 12.21(a)
AASB 12.21(b)(i)
AASB 12.21(b)(ii) AASB 12.B12-B13
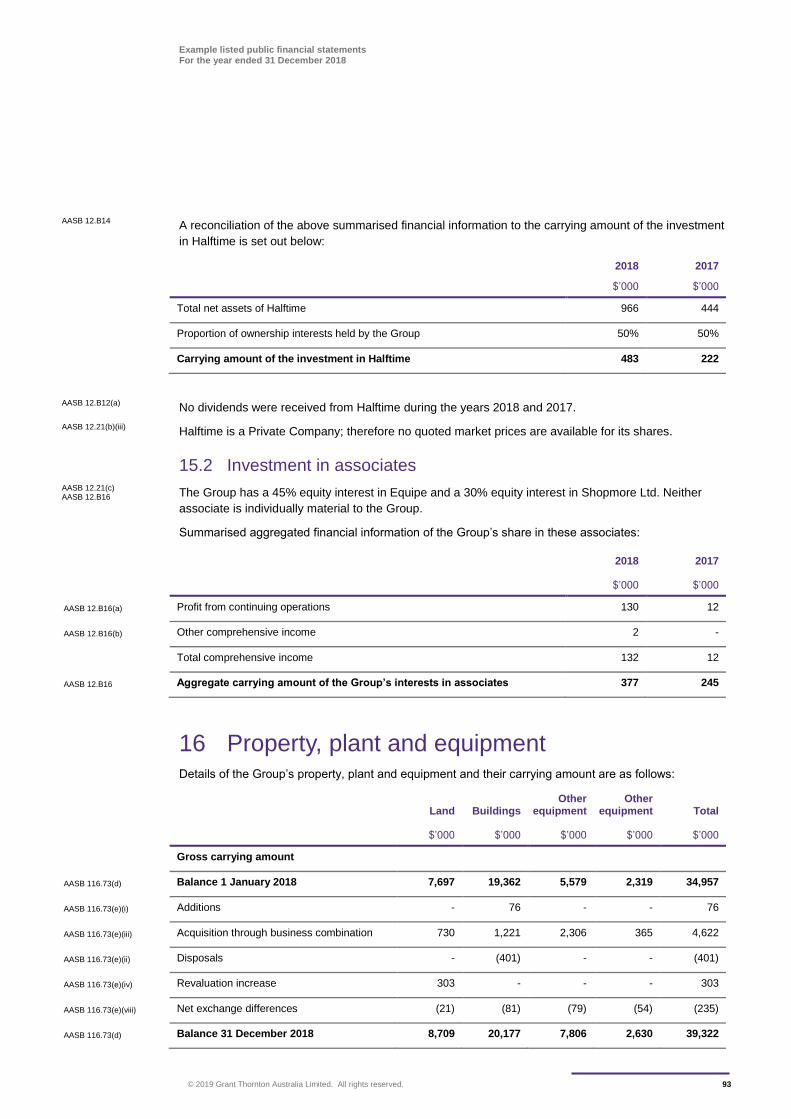
Example listed public financial statements For the year ended 31 December 2018
© 2019 Grant Thornton Australia Limited. All rights reserved. 93
A reconciliation of the above summarised financial information to the carrying amount of the investment
in Halftime is set out below:
2018 2017
$’000 $’000
Total net assets of Halftime 966 444
Proportion of ownership interests held by the Group 50% 50%
Carrying amount of the investment in Halftime 483 222
No dividends were received from Halftime during the years 2018 and 2017.
Halftime is a Private Company; therefore no quoted market prices are available for its shares.
15.2 Investment in associates
The Group has a 45% equity interest in Equipe and a 30% equity interest in Shopmore Ltd. Neither
associate is individually material to the Group.
Summarised aggregated financial information of the Group’s share in these associates:
2018 2017
$’000 $’000
AASB 12.B16(a) Profit from continuing operations 130 12
AASB 12.B16(b) Other comprehensive income 2 -
Total comprehensive income 132 12
AASB 12.B16 Aggregate carrying amount of the Group’s interests in associates 377 245
16 Property, plant and equipment Details of the Group’s property, plant and equipment and their carrying amount are as follows:
Land Buildings
Other equipment
Other equipment Total
$’000 $’000 $’000 $’000 $’000
Gross carrying amount
AASB 116.73(d) Balance 1 January 2018 7,697 19,362 5,579 2,319 34,957
AASB 116.73(e)(i) Additions - 76 - - 76
AASB 116.73(e)(iii) Acquisition through business combination 730 1,221 2,306 365 4,622
AASB 116.73(e)(ii) Disposals - (401) - - (401)
AASB 116.73(e)(iv) Revaluation increase 303 - - - 303
AASB 116.73(e)(viii) Net exchange differences (21) (81) (79) (54) (235)
AASB 116.73(d) Balance 31 December 2018 8,709 20,177 7,806 2,630 39,322
AASB 12.B14
AASB 12.B12(a)
AASB 12.21(b)(iii)
AASB 12.21(c) AASB 12.B16
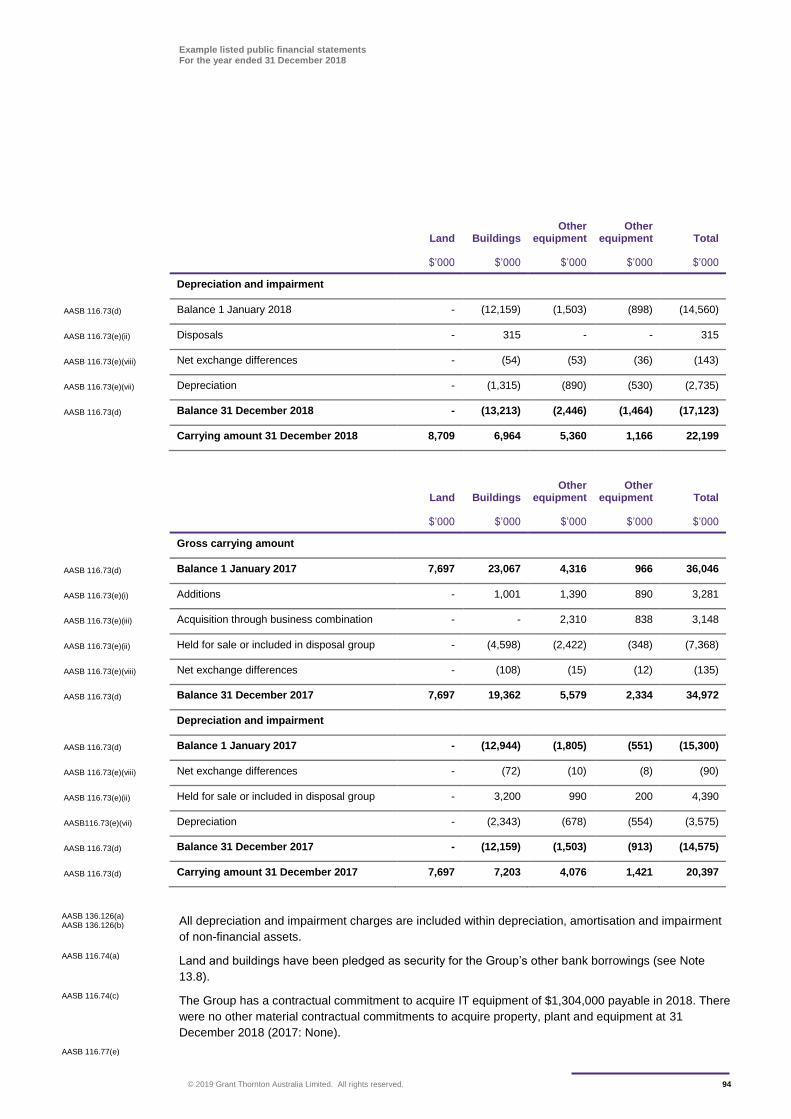
Example listed public financial statements For the year ended 31 December 2018
© 2019 Grant Thornton Australia Limited. All rights reserved. 94
Land Buildings
Other equipment
Other equipment Total
$’000 $’000 $’000 $’000 $’000
Depreciation and impairment
AASB 116.73(d) Balance 1 January 2018 - (12,159) (1,503) (898) (14,560)
AASB 116.73(e)(ii) Disposals - 315 - - 315
AASB 116.73(e)(viii) Net exchange differences - (54) (53) (36) (143)
AASB 116.73(e)(vii) Depreciation - (1,315) (890) (530) (2,735)
AASB 116.73(d) Balance 31 December 2018 - (13,213) (2,446) (1,464) (17,123)
Carrying amount 31 December 2018 8,709 6,964 5,360 1,166 22,199
Land Buildings
Other equipment
Other equipment Total
$’000 $’000 $’000 $’000 $’000
Gross carrying amount
AASB 116.73(d) Balance 1 January 2017 7,697 23,067 4,316 966 36,046
AASB 116.73(e)(i) Additions - 1,001 1,390 890 3,281
AASB 116.73(e)(iii) Acquisition through business combination - - 2,310 838 3,148
AASB 116.73(e)(ii) Held for sale or included in disposal group - (4,598) (2,422) (348) (7,368)
AASB 116.73(e)(viii) Net exchange differences - (108) (15) (12) (135)
AASB 116.73(d) Balance 31 December 2017 7,697 19,362 5,579 2,334 34,972
Depreciation and impairment
AASB 116.73(d) Balance 1 January 2017 - (12,944) (1,805) (551) (15,300)
AASB 116.73(e)(viii) Net exchange differences - (72) (10) (8) (90)
AASB 116.73(e)(ii) Held for sale or included in disposal group - 3,200 990 200 4,390
AASB116.73(e)(vii) Depreciation - (2,343) (678) (554) (3,575)
AASB 116.73(d) Balance 31 December 2017 - (12,159) (1,503) (913) (14,575)
AASB 116.73(d) Carrying amount 31 December 2017 7,697 7,203 4,076 1,421 20,397
All depreciation and impairment charges are included within depreciation, amortisation and impairment
of non-financial assets.
Land and buildings have been pledged as security for the Group’s other bank borrowings (see Note
13.8).
The Group has a contractual commitment to acquire IT equipment of $1,304,000 payable in 2018. There
were no other material contractual commitments to acquire property, plant and equipment at 31
December 2018 (2017: None).
AASB 136.126(a) AASB 136.126(b)
AASB 116.74(a)
AASB 116.74(c)
AASB 116.77(e)
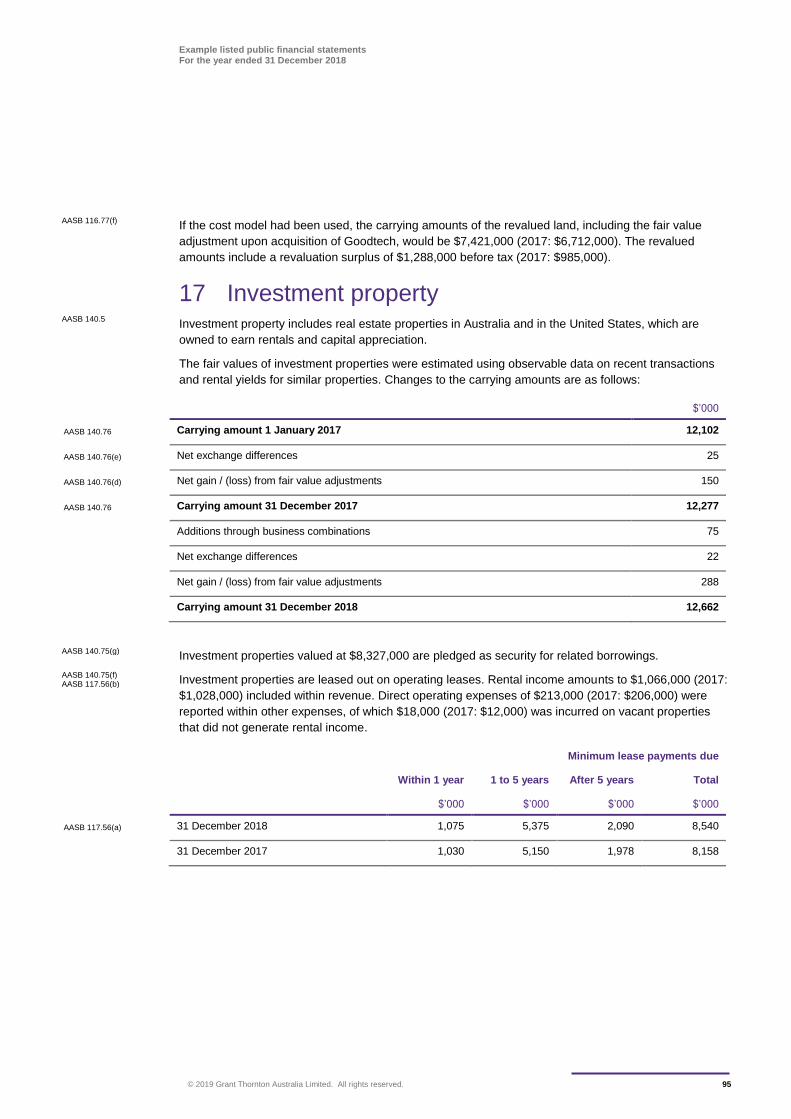
Example listed public financial statements For the year ended 31 December 2018
© 2019 Grant Thornton Australia Limited. All rights reserved. 95
If the cost model had been used, the carrying amounts of the revalued land, including the fair value
adjustment upon acquisition of Goodtech, would be $7,421,000 (2017: $6,712,000). The revalued
amounts include a revaluation surplus of $1,288,000 before tax (2017: $985,000).
17 Investment property Investment property includes real estate properties in Australia and in the United States, which are
owned to earn rentals and capital appreciation.
The fair values of investment properties were estimated using observable data on recent transactions
and rental yields for similar properties. Changes to the carrying amounts are as follows:
$’000
AASB 140.76 Carrying amount 1 January 2017 12,102
AASB 140.76(e) Net exchange differences 25
AASB 140.76(d) Net gain / (loss) from fair value adjustments 150
AASB 140.76 Carrying amount 31 December 2017 12,277
Additions through business combinations 75
Net exchange differences 22
Net gain / (loss) from fair value adjustments 288
Carrying amount 31 December 2018 12,662
Investment properties valued at $8,327,000 are pledged as security for related borrowings.
Investment properties are leased out on operating leases. Rental income amounts to $1,066,000 (2017:
$1,028,000) included within revenue. Direct operating expenses of $213,000 (2017: $206,000) were
reported within other expenses, of which $18,000 (2017: $12,000) was incurred on vacant properties
that did not generate rental income.
Minimum lease payments due
Within 1 year 1 to 5 years After 5 years Total
$’000 $’000 $’000 $’000
AASB 117.56(a) 31 December 2018 1,075 5,375 2,090 8,540
31 December 2017 1,030 5,150 1,978 8,158
AASB 116.77(f)
AASB 140.5
AASB 140.75(g)
AASB 140.75(f) AASB 117.56(b)
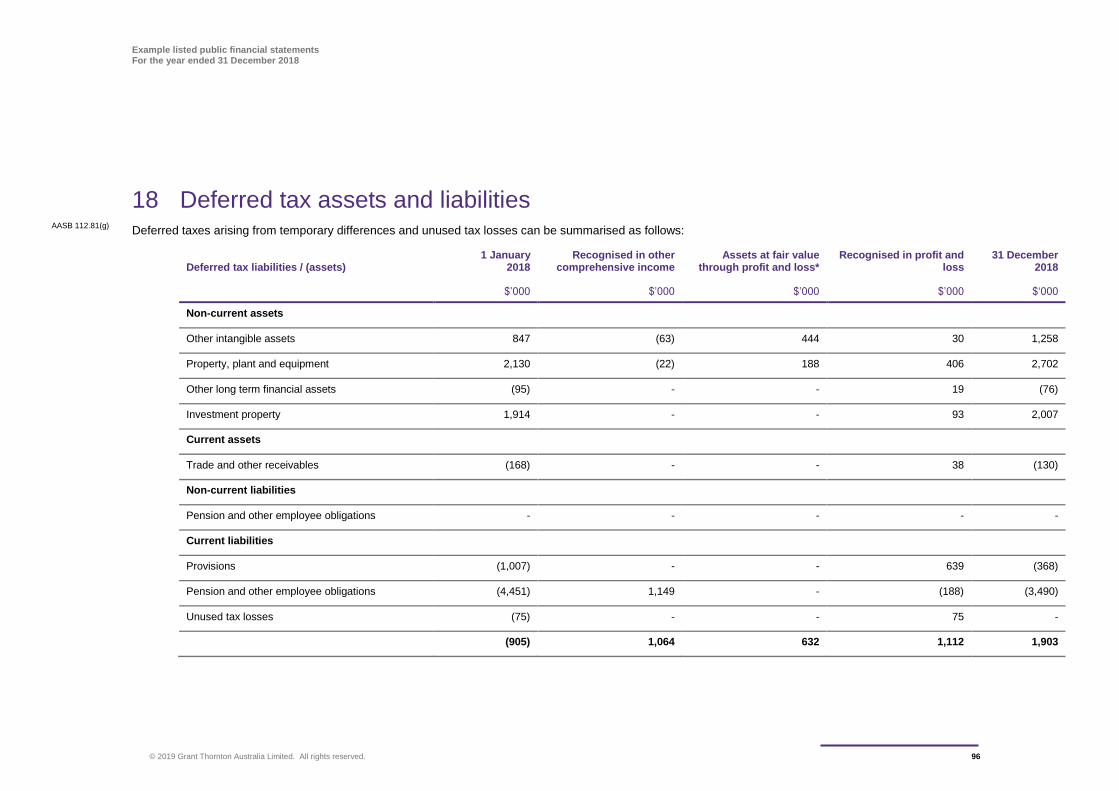
Example listed public financial statements For the year ended 31 December 2018
© 2019 Grant Thornton Australia Limited. All rights reserved. 96
18 Deferred tax assets and liabilities Deferred taxes arising from temporary differences and unused tax losses can be summarised as follows:
Deferred tax liabilities / (assets) 1 January
2018 Recognised in other
comprehensive income Assets at fair value
through profit and loss* Recognised in profit and
loss 31 December
2018
$’000 $’000 $’000 $’000 $‘000
Non-current assets
Other intangible assets 847 (63) 444 30 1,258
Property, plant and equipment 2,130 (22) 188 406 2,702
Other long term financial assets (95) - - 19 (76)
Investment property 1,914 - - 93 2,007
Current assets
Trade and other receivables (168) - - 38 (130)
Non-current liabilities
Pension and other employee obligations - - - - -
Current liabilities
Provisions (1,007) - - 639 (368)
Pension and other employee obligations (4,451) 1,149 - (188) (3,490)
Unused tax losses (75) - - 75 -
(905) 1,064 632 1,112 1,903
AASB 112.81(g)
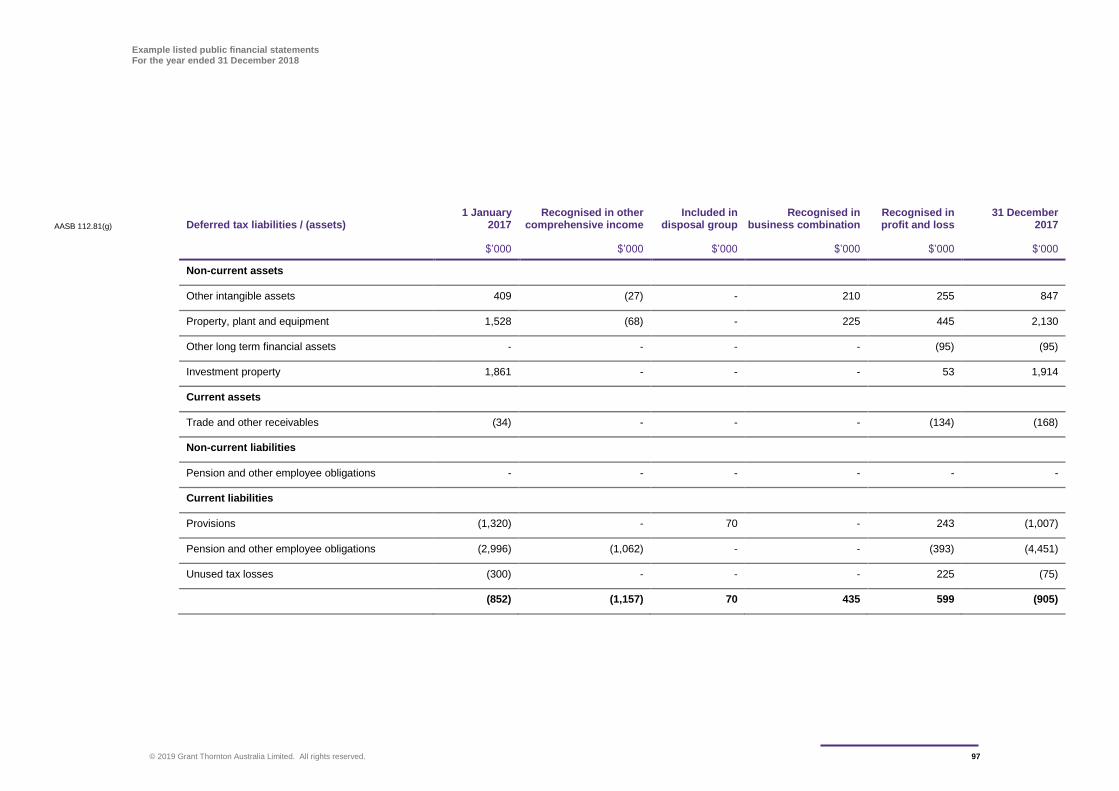
Example listed public financial statements For the year ended 31 December 2018
© 2019 Grant Thornton Australia Limited. All rights reserved. 97
AASB 112.81(g) Deferred tax liabilities / (assets) 1 January
2017 Recognised in other
comprehensive income Included in
disposal group Recognised in
business combination Recognised in profit and loss
31 December 2017
$’000 $’000 $’000 $’000 $’000 $‘000
Non-current assets
Other intangible assets 409 (27) - 210 255 847
Property, plant and equipment 1,528 (68) - 225 445 2,130
Other long term financial assets - - - - (95) (95)
Investment property 1,861 - - - 53 1,914
Current assets
Trade and other receivables (34) - - - (134) (168)
Non-current liabilities
Pension and other employee obligations - - - - - -
Current liabilities
Provisions (1,320) - 70 - 243 (1,007)
Pension and other employee obligations (2,996) (1,062) - - (393) (4,451)
Unused tax losses (300) - - - 225 (75)
(852) (1,157) 70 435 599 (905)
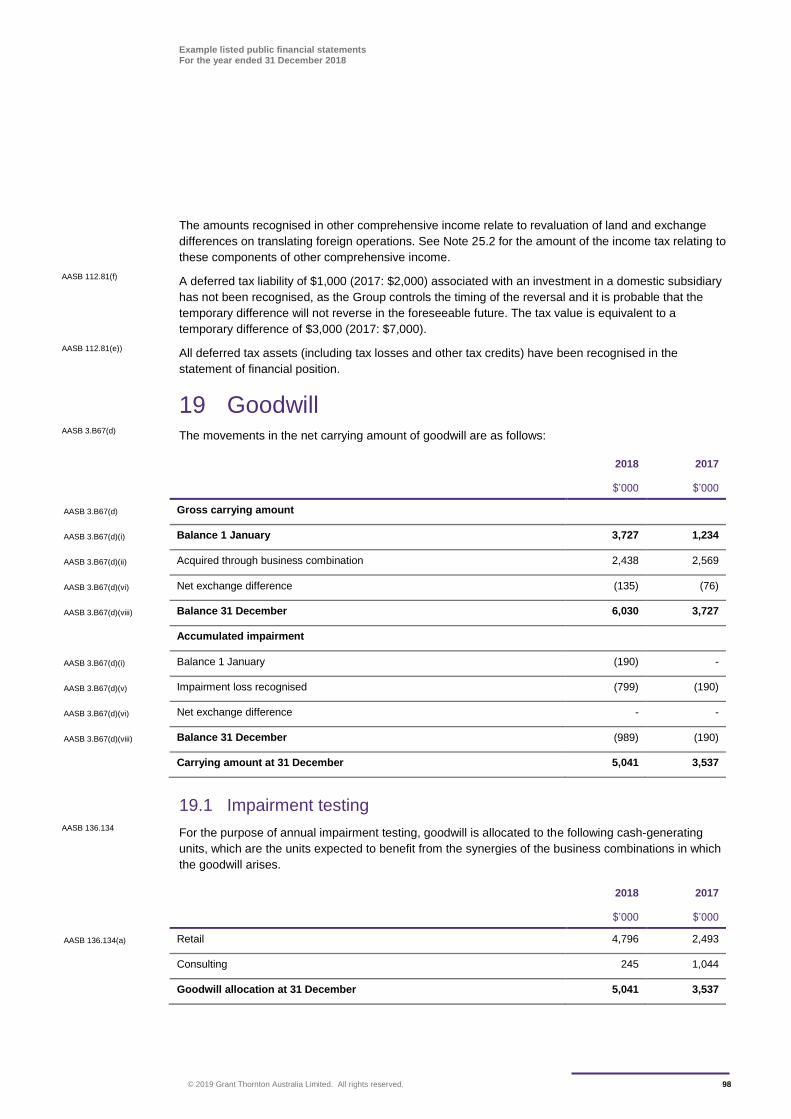
Example listed public financial statements For the year ended 31 December 2018
© 2019 Grant Thornton Australia Limited. All rights reserved. 98
The amounts recognised in other comprehensive income relate to revaluation of land and exchange
differences on translating foreign operations. See Note 25.2 for the amount of the income tax relating to
these components of other comprehensive income.
A deferred tax liability of $1,000 (2017: $2,000) associated with an investment in a domestic subsidiary
has not been recognised, as the Group controls the timing of the reversal and it is probable that the
temporary difference will not reverse in the foreseeable future. The tax value is equivalent to a
temporary difference of $3,000 (2017: $7,000).
All deferred tax assets (including tax losses and other tax credits) have been recognised in the
statement of financial position.
19 Goodwill The movements in the net carrying amount of goodwill are as follows:
2018 2017
$’000 $’000
AASB 3.B67(d) Gross carrying amount
AASB 3.B67(d)(i) Balance 1 January 3,727 1,234
AASB 3.B67(d)(ii) Acquired through business combination 2,438 2,569
AASB 3.B67(d)(vi) Net exchange difference (135) (76)
AASB 3.B67(d)(viii) Balance 31 December 6,030 3,727
Accumulated impairment
AASB 3.B67(d)(i) Balance 1 January (190) -
AASB 3.B67(d)(v) Impairment loss recognised (799) (190)
AASB 3.B67(d)(vi) Net exchange difference - -
AASB 3.B67(d)(viii) Balance 31 December (989) (190)
Carrying amount at 31 December 5,041 3,537
19.1 Impairment testing
For the purpose of annual impairment testing, goodwill is allocated to the following cash-generating
units, which are the units expected to benefit from the synergies of the business combinations in which
the goodwill arises.
2018 2017
$’000 $’000
AASB 136.134(a) Retail 4,796 2,493
Consulting 245 1,044
Goodwill allocation at 31 December 5,041 3,537
AASB 112.81(f)
AASB 112.81(e))
AASB 3.B67(d)
AASB 136.134
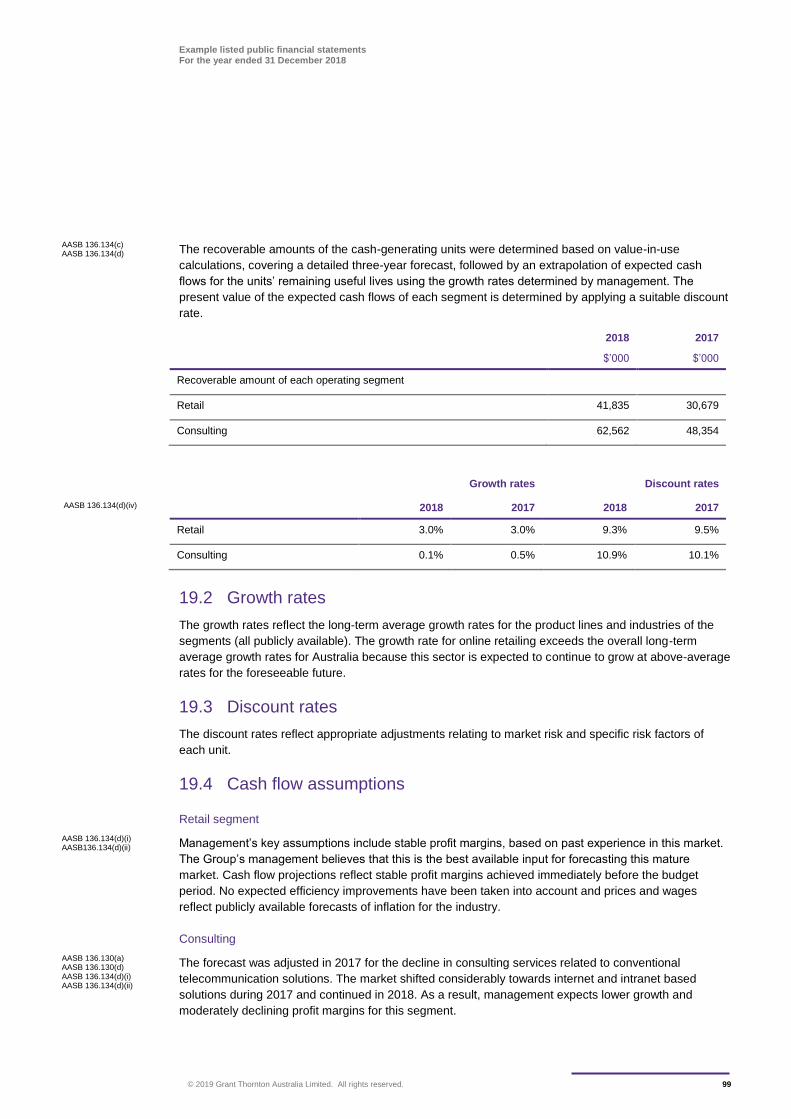
Example listed public financial statements For the year ended 31 December 2018
© 2019 Grant Thornton Australia Limited. All rights reserved. 99
The recoverable amounts of the cash-generating units were determined based on value-in-use
calculations, covering a detailed three-year forecast, followed by an extrapolation of expected cash
flows for the units’ remaining useful lives using the growth rates determined by management. The
present value of the expected cash flows of each segment is determined by applying a suitable discount
rate.
2018 2017
$’000 $’000
Recoverable amount of each operating segment
Retail 41,835 30,679
Consulting 62,562 48,354
Growth rates Discount rates
AASB 136.134(d)(iv) 2018 2017 2018 2017
Retail 3.0% 3.0% 9.3% 9.5%
Consulting 0.1% 0.5% 10.9% 10.1%
19.2 Growth rates
The growth rates reflect the long-term average growth rates for the product lines and industries of the
segments (all publicly available). The growth rate for online retailing exceeds the overall long-term
average growth rates for Australia because this sector is expected to continue to grow at above-average
rates for the foreseeable future.
19.3 Discount rates
The discount rates reflect appropriate adjustments relating to market risk and specific risk factors of
each unit.
19.4 Cash flow assumptions
Retail segment
Management’s key assumptions include stable profit margins, based on past experience in this market.
The Group’s management believes that this is the best available input for forecasting this mature
market. Cash flow projections reflect stable profit margins achieved immediately before the budget
period. No expected efficiency improvements have been taken into account and prices and wages
reflect publicly available forecasts of inflation for the industry.
Consulting
The forecast was adjusted in 2017 for the decline in consulting services related to conventional
telecommunication solutions. The market shifted considerably towards internet and intranet based
solutions during 2017 and continued in 2018. As a result, management expects lower growth and
moderately declining profit margins for this segment.
AASB 136.134(c) AASB 136.134(d)
AASB 136.134(d)(i) AASB136.134(d)(ii)
AASB 136.130(a) AASB 136.130(d) AASB 136.134(d)(i) AASB 136.134(d)(ii)
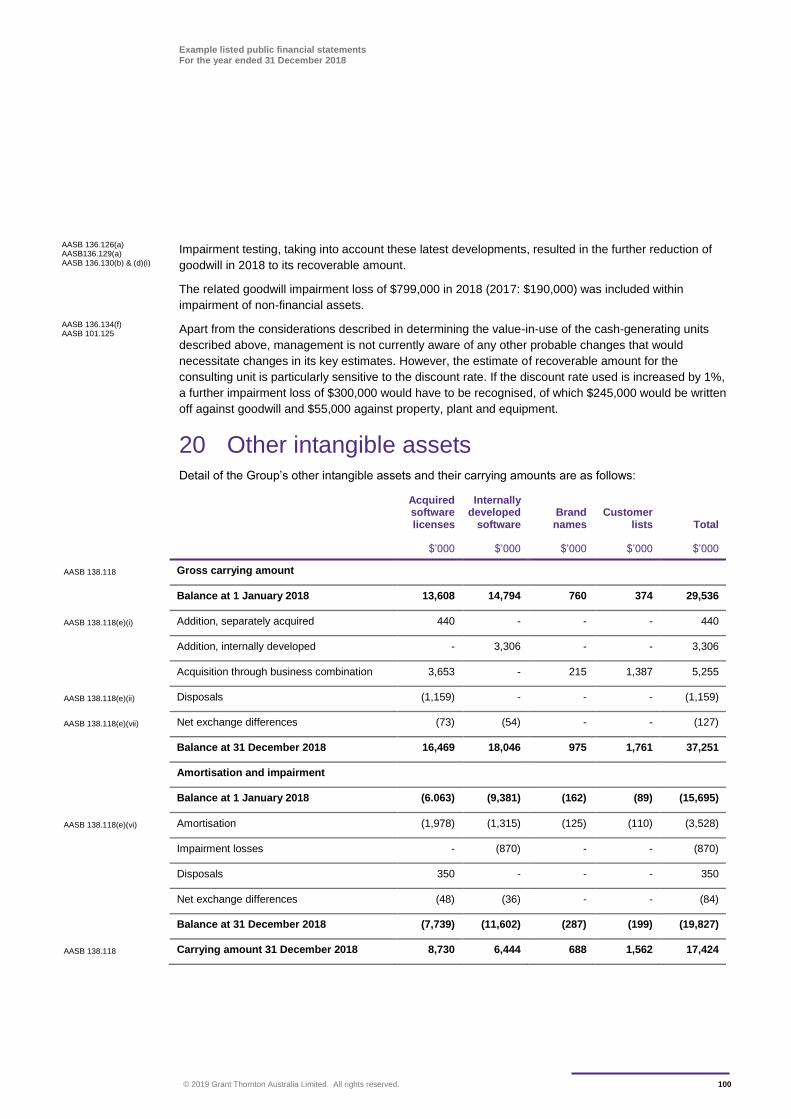
Example listed public financial statements For the year ended 31 December 2018
© 2019 Grant Thornton Australia Limited. All rights reserved. 100
Impairment testing, taking into account these latest developments, resulted in the further reduction of
goodwill in 2018 to its recoverable amount.
The related goodwill impairment loss of $799,000 in 2018 (2017: $190,000) was included within
impairment of non-financial assets.
Apart from the considerations described in determining the value-in-use of the cash-generating units
described above, management is not currently aware of any other probable changes that would
necessitate changes in its key estimates. However, the estimate of recoverable amount for the
consulting unit is particularly sensitive to the discount rate. If the discount rate used is increased by 1%,
a further impairment loss of $300,000 would have to be recognised, of which $245,000 would be written
off against goodwill and $55,000 against property, plant and equipment.
20 Other intangible assets Detail of the Group’s other intangible assets and their carrying amounts are as follows:
Acquired software licenses
Internally developed
software Brand names
Customer lists Total
$’000 $’000 $’000 $’000 $’000
AASB 138.118 Gross carrying amount
Balance at 1 January 2018 13,608 14,794 760 374 29,536
AASB 138.118(e)(i) Addition, separately acquired 440 - - - 440
Addition, internally developed - 3,306 - - 3,306
Acquisition through business combination 3,653 - 215 1,387 5,255
AASB 138.118(e)(ii) Disposals (1,159) - - - (1,159)
AASB 138.118(e)(vii) Net exchange differences (73) (54) - - (127)
Balance at 31 December 2018 16,469 18,046 975 1,761 37,251
Amortisation and impairment
Balance at 1 January 2018 (6.063) (9,381) (162) (89) (15,695)
AASB 138.118(e)(vi) Amortisation (1,978) (1,315) (125) (110) (3,528)
Impairment losses - (870) - - (870)
Disposals 350 - - - 350
Net exchange differences (48) (36) - - (84)
Balance at 31 December 2018 (7,739) (11,602) (287) (199) (19,827)
AASB 138.118 Carrying amount 31 December 2018 8,730 6,444 688 1,562 17,424
AASB 136.126(a) AASB136.129(a) AASB 136.130(b) & (d)(i)
AASB 136.134(f) AASB 101.125
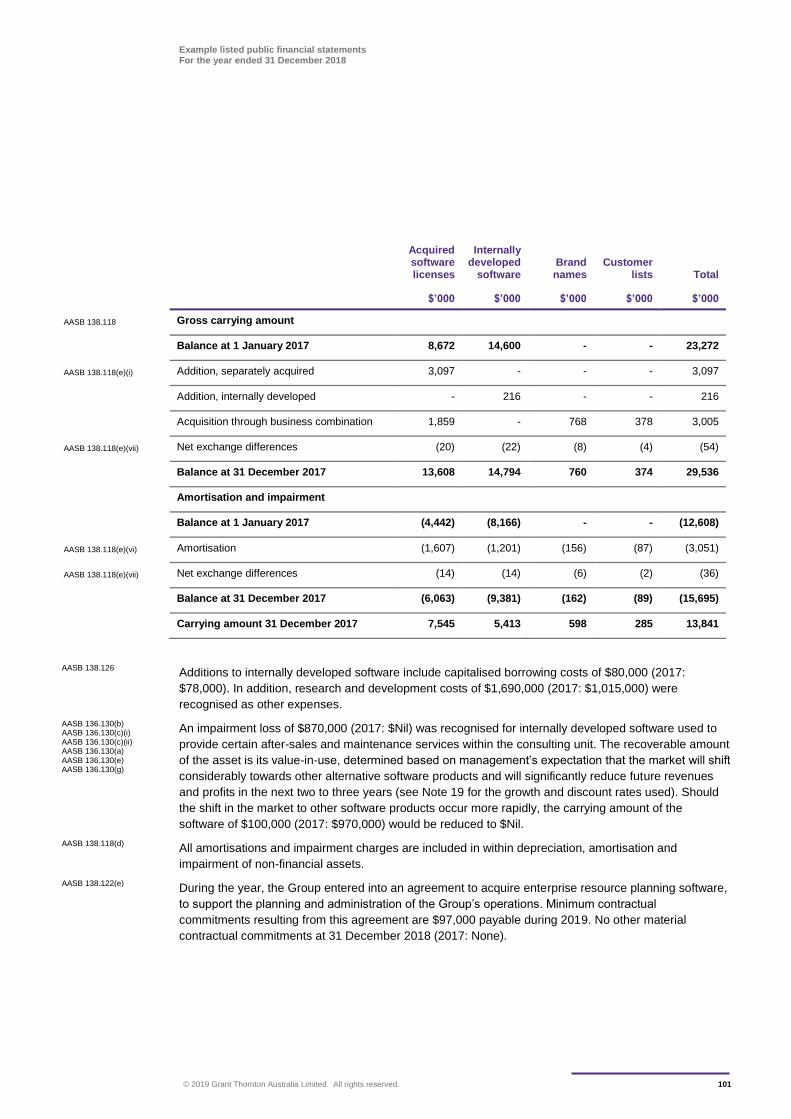
Example listed public financial statements For the year ended 31 December 2018
© 2019 Grant Thornton Australia Limited. All rights reserved. 101
Acquired software licenses
Internally developed
software Brand names
Customer lists Total
$’000 $’000 $’000 $’000 $’000
AASB 138.118 Gross carrying amount
Balance at 1 January 2017 8,672 14,600 - - 23,272
AASB 138.118(e)(i) Addition, separately acquired 3,097 - - - 3,097
Addition, internally developed - 216 - - 216
Acquisition through business combination 1,859 - 768 378 3,005
AASB 138.118(e)(vii) Net exchange differences (20) (22) (8) (4) (54)
Balance at 31 December 2017 13,608 14,794 760 374 29,536
Amortisation and impairment
Balance at 1 January 2017 (4,442) (8,166) - - (12,608)
AASB 138.118(e)(vi) Amortisation (1,607) (1,201) (156) (87) (3,051)
AASB 138.118(e)(vii) Net exchange differences (14) (14) (6) (2) (36)
Balance at 31 December 2017 (6,063) (9,381) (162) (89) (15,695)
Carrying amount 31 December 2017 7,545 5,413 598 285 13,841
Additions to internally developed software include capitalised borrowing costs of $80,000 (2017:
$78,000). In addition, research and development costs of $1,690,000 (2017: $1,015,000) were
recognised as other expenses.
An impairment loss of $870,000 (2017: $Nil) was recognised for internally developed software used to
provide certain after-sales and maintenance services within the consulting unit. The recoverable amount
of the asset is its value-in-use, determined based on management’s expectation that the market will shift
considerably towards other alternative software products and will significantly reduce future revenues
and profits in the next two to three years (see Note 19 for the growth and discount rates used). Should
the shift in the market to other software products occur more rapidly, the carrying amount of the
software of $100,000 (2017: $970,000) would be reduced to $Nil.
All amortisations and impairment charges are included in within depreciation, amortisation and
impairment of non-financial assets.
During the year, the Group entered into an agreement to acquire enterprise resource planning software,
to support the planning and administration of the Group’s operations. Minimum contractual
commitments resulting from this agreement are $97,000 payable during 2019. No other material
contractual commitments at 31 December 2018 (2017: None).
AASB 138.126
AASB 136.130(b) AASB 136.130(c)(i) AASB 136.130(c)(ii) AASB 136.130(a) AASB 136.130(e) AASB 136.130(g)
AASB 138.118(d)
AASB 138.122(e)
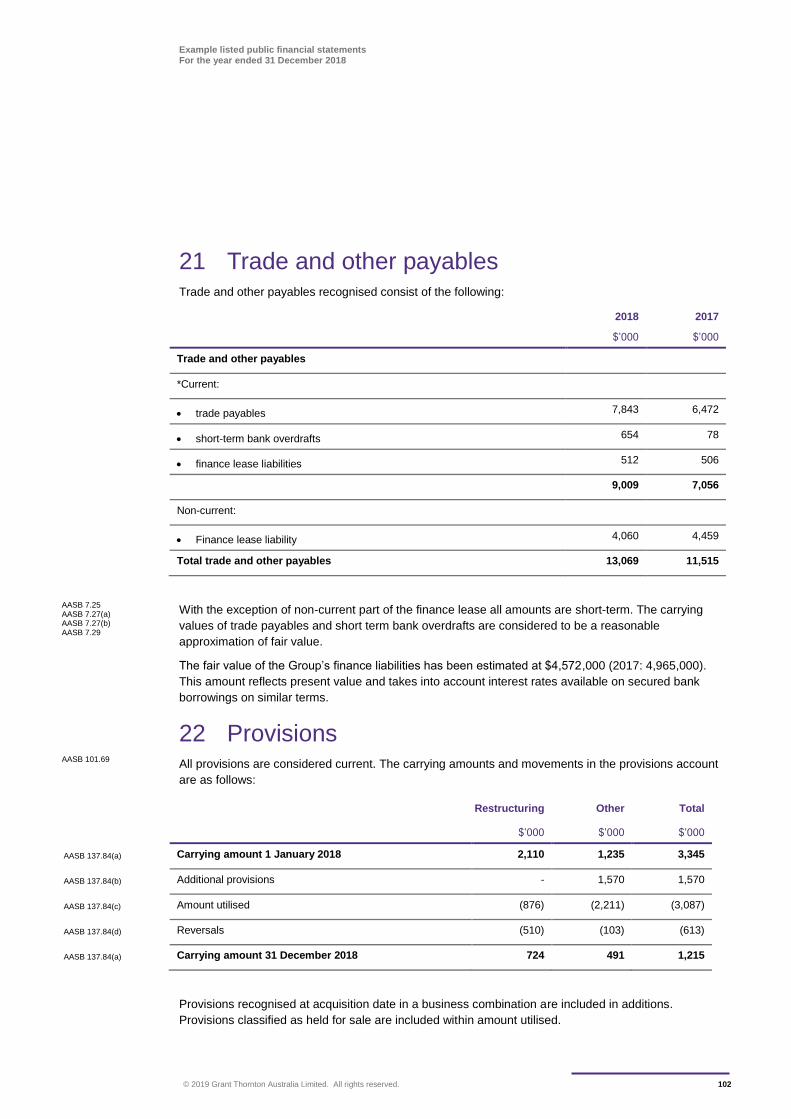
Example listed public financial statements For the year ended 31 December 2018
© 2019 Grant Thornton Australia Limited. All rights reserved. 102
21 Trade and other payables Trade and other payables recognised consist of the following:
2018 2017
$’000 $’000
Trade and other payables
*Current:
trade payables 7,843 6,472
short-term bank overdrafts 654 78
finance lease liabilities 512 506
9,009 7,056
Non-current:
Finance lease liability 4,060 4,459
Total trade and other payables 13,069 11,515
With the exception of non-current part of the finance lease all amounts are short-term. The carrying
values of trade payables and short term bank overdrafts are considered to be a reasonable
approximation of fair value.
The fair value of the Group’s finance liabilities has been estimated at $4,572,000 (2017: 4,965,000).
This amount reflects present value and takes into account interest rates available on secured bank
borrowings on similar terms.
22 Provisions All provisions are considered current. The carrying amounts and movements in the provisions account
are as follows:
Restructuring Other Total
$’000 $’000 $’000
AASB 137.84(a) Carrying amount 1 January 2018 2,110 1,235 3,345
AASB 137.84(b) Additional provisions - 1,570 1,570
AASB 137.84(c) Amount utilised (876) (2,211) (3,087)
AASB 137.84(d) Reversals (510) (103) (613)
AASB 137.84(a) Carrying amount 31 December 2018 724 491 1,215
Provisions recognised at acquisition date in a business combination are included in additions.
Provisions classified as held for sale are included within amount utilised.
AASB 7.25 AASB 7.27(a) AASB 7.27(b) AASB 7.29
AASB 101.69
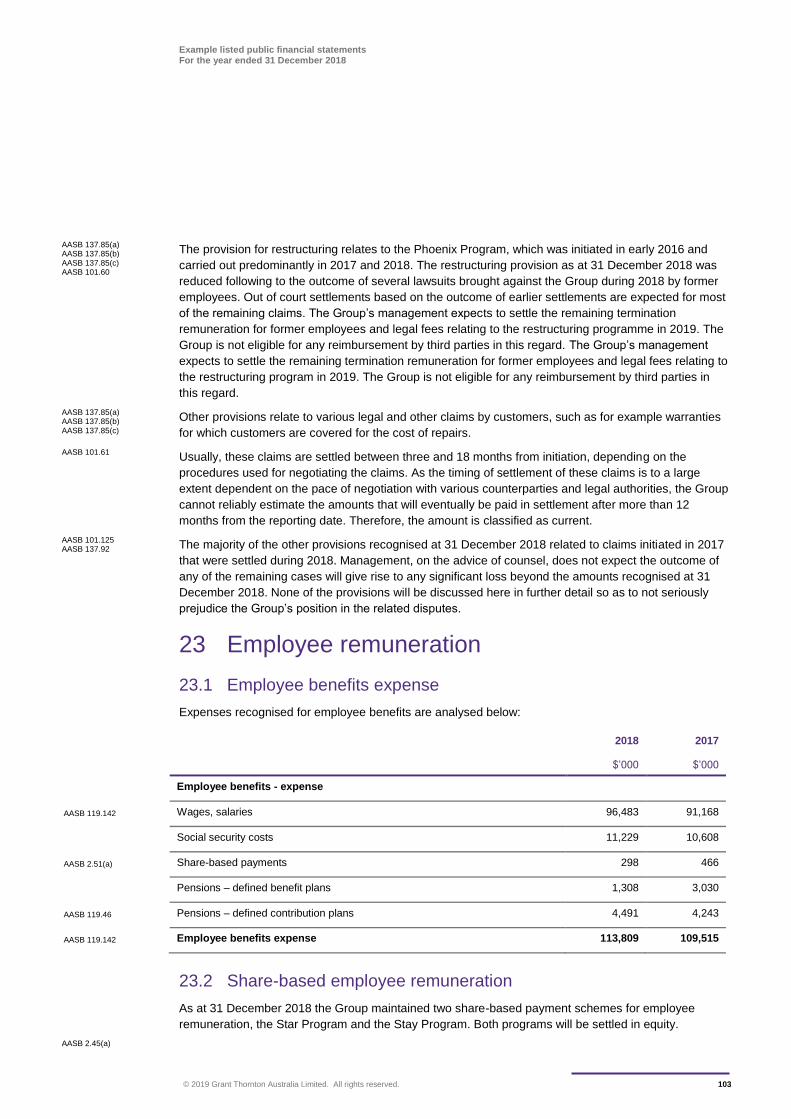
Example listed public financial statements For the year ended 31 December 2018
© 2019 Grant Thornton Australia Limited. All rights reserved. 103
The provision for restructuring relates to the Phoenix Program, which was initiated in early 2016 and
carried out predominantly in 2017 and 2018. The restructuring provision as at 31 December 2018 was
reduced following to the outcome of several lawsuits brought against the Group during 2018 by former
employees. Out of court settlements based on the outcome of earlier settlements are expected for most
of the remaining claims. The Group’s management expects to settle the remaining termination
remuneration for former employees and legal fees relating to the restructuring programme in 2019. The
Group is not eligible for any reimbursement by third parties in this regard. The Group’s management
expects to settle the remaining termination remuneration for former employees and legal fees relating to
the restructuring program in 2019. The Group is not eligible for any reimbursement by third parties in
this regard.
Other provisions relate to various legal and other claims by customers, such as for example warranties
for which customers are covered for the cost of repairs.
Usually, these claims are settled between three and 18 months from initiation, depending on the
procedures used for negotiating the claims. As the timing of settlement of these claims is to a large
extent dependent on the pace of negotiation with various counterparties and legal authorities, the Group
cannot reliably estimate the amounts that will eventually be paid in settlement after more than 12
months from the reporting date. Therefore, the amount is classified as current.
The majority of the other provisions recognised at 31 December 2018 related to claims initiated in 2017
that were settled during 2018. Management, on the advice of counsel, does not expect the outcome of
any of the remaining cases will give rise to any significant loss beyond the amounts recognised at 31
December 2018. None of the provisions will be discussed here in further detail so as to not seriously
prejudice the Group’s position in the related disputes.
23 Employee remuneration
23.1 Employee benefits expense
Expenses recognised for employee benefits are analysed below:
2018 2017
$’000 $’000
Employee benefits - expense
AASB 119.142 Wages, salaries 96,483 91,168
Social security costs 11,229 10,608
AASB 2.51(a) Share-based payments 298 466
Pensions – defined benefit plans 1,308 3,030
AASB 119.46 Pensions – defined contribution plans 4,491 4,243
AASB 119.142 Employee benefits expense 113,809 109,515
23.2 Share-based employee remuneration
As at 31 December 2018 the Group maintained two share-based payment schemes for employee
remuneration, the Star Program and the Stay Program. Both programs will be settled in equity.
AASB 137.85(a) AASB 137.85(b) AASB 137.85(c) AASB 101.60
AASB 137.85(a) AASB 137.85(b) AASB 137.85(c)
AASB 101.61
AASB 101.125 AASB 137.92
AASB 2.45(a)
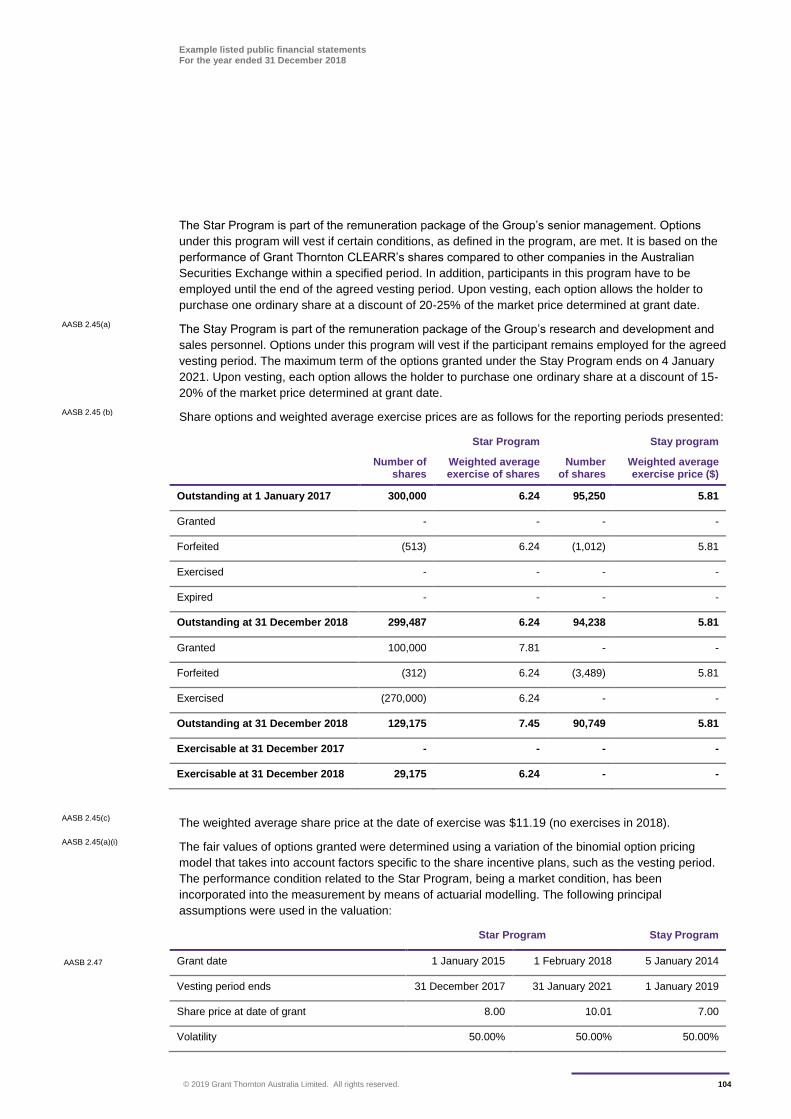
Example listed public financial statements For the year ended 31 December 2018
© 2019 Grant Thornton Australia Limited. All rights reserved. 104
The Star Program is part of the remuneration package of the Group’s senior management. Options
under this program will vest if certain conditions, as defined in the program, are met. It is based on the
performance of Grant Thornton CLEARR’s shares compared to other companies in the Australian
Securities Exchange within a specified period. In addition, participants in this program have to be
employed until the end of the agreed vesting period. Upon vesting, each option allows the holder to
purchase one ordinary share at a discount of 20-25% of the market price determined at grant date.
The Stay Program is part of the remuneration package of the Group’s research and development and
sales personnel. Options under this program will vest if the participant remains employed for the agreed
vesting period. The maximum term of the options granted under the Stay Program ends on 4 January
2021. Upon vesting, each option allows the holder to purchase one ordinary share at a discount of 15-
20% of the market price determined at grant date.
Share options and weighted average exercise prices are as follows for the reporting periods presented:
Star Program Stay program
Number of shares
Weighted average exercise of shares
Number of shares
Weighted average exercise price ($)
Outstanding at 1 January 2017 300,000 6.24 95,250 5.81
Granted - - - -
Forfeited (513) 6.24 (1,012) 5.81
Exercised - - - -
Expired - - - -
Outstanding at 31 December 2018 299,487 6.24 94,238 5.81
Granted 100,000 7.81 - -
Forfeited (312) 6.24 (3,489) 5.81
Exercised (270,000) 6.24 - -
Outstanding at 31 December 2018 129,175 7.45 90,749 5.81
Exercisable at 31 December 2017 - - - -
Exercisable at 31 December 2018 29,175 6.24 - -
The weighted average share price at the date of exercise was $11.19 (no exercises in 2018).
The fair values of options granted were determined using a variation of the binomial option pricing
model that takes into account factors specific to the share incentive plans, such as the vesting period.
The performance condition related to the Star Program, being a market condition, has been
incorporated into the measurement by means of actuarial modelling. The following principal
assumptions were used in the valuation:
Star Program Stay Program
AASB 2.47 Grant date 1 January 2015 1 February 2018 5 January 2014
Vesting period ends 31 December 2017 31 January 2021 1 January 2019
Share price at date of grant 8.00 10.01 7.00
Volatility 50.00% 50.00% 50.00%
AASB 2.45(a)
AASB 2.45 (b)
AASB 2.45(c)
AASB 2.45(a)(i)
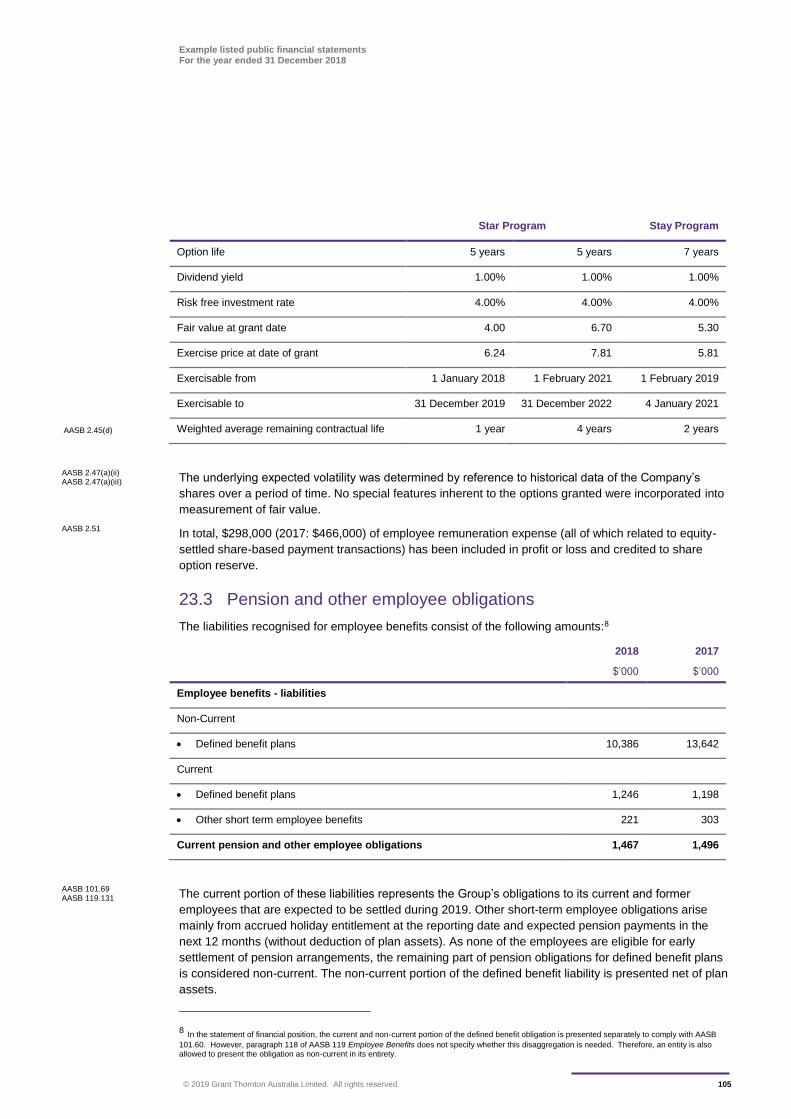
Example listed public financial statements For the year ended 31 December 2018
© 2019 Grant Thornton Australia Limited. All rights reserved. 105
Star Program Stay Program
Option life 5 years 5 years 7 years
Dividend yield 1.00% 1.00% 1.00%
Risk free investment rate 4.00% 4.00% 4.00%
Fair value at grant date 4.00 6.70 5.30
Exercise price at date of grant 6.24 7.81 5.81
Exercisable from 1 January 2018 1 February 2021 1 February 2019
Exercisable to 31 December 2019 31 December 2022 4 January 2021
AASB 2.45(d) Weighted average remaining contractual life 1 year 4 years 2 years
The underlying expected volatility was determined by reference to historical data of the Company’s
shares over a period of time. No special features inherent to the options granted were incorporated into
measurement of fair value.
In total, $298,000 (2017: $466,000) of employee remuneration expense (all of which related to equity-
settled share-based payment transactions) has been included in profit or loss and credited to share
option reserve.
23.3 Pension and other employee obligations
The liabilities recognised for employee benefits consist of the following amounts:8
2018 2017
$’000 $’000
Employee benefits - liabilities
Non-Current
Defined benefit plans 10,386 13,642
Current
Defined benefit plans 1,246 1,198
Other short term employee benefits 221 303
Current pension and other employee obligations 1,467 1,496
The current portion of these liabilities represents the Group’s obligations to its current and former
employees that are expected to be settled during 2019. Other short-term employee obligations arise
mainly from accrued holiday entitlement at the reporting date and expected pension payments in the
next 12 months (without deduction of plan assets). As none of the employees are eligible for early
settlement of pension arrangements, the remaining part of pension obligations for defined benefit plans
is considered non-current. The non-current portion of the defined benefit liability is presented net of plan
assets.
8 In the statement of financial position, the current and non-current portion of the defined benefit obligation is presented separately to comply with AASB
101.60. However, paragraph 118 of AASB 119 Employee Benefits does not specify whether this disaggregation is needed. Therefore, an entity is also allowed to present the obligation as non-current in its entirety.
AASB 2.47(a)(ii) AASB 2.47(a)(iiI)
AASB 2.51
AASB 101.69 AASB 119.131
Example listed public financial statements For the year ended 31 December 2018
© 2019 Grant Thornton Australia Limited. All rights reserved. 106
Defined benefit plan
The Group has set up a partly funded pension scheme for mid to senior management, mainly in
Australia, the UK and the US. The scheme is available to certain senior workers after completing five
years’ service.
According to the plan, a certain percentage of the current salary is converted into a pension component
each year until retirement. Pensions under this scheme are paid out when a beneficiary has reached the
age of 65. The pensionable salary is limited to $100,000 for a year. Eligible employees are required to
contribute a stated percentage of pensionable salary.
In Australia and the UK, the pension payments are linked to the Consumer Price Index (CPI), although
certain limitations apply.
The plan assets are managed by a pension fund that is legally separated from the Group. The Board of
Trustees of the pension fund is required by its articles of association to act in the best interest of the
fund and it is responsible for setting the investment policies. The Group has no representation on the
Board of the fund.
The plan exposes the Group to actuarial risks such as interest rate risk, investment risk, longevity risk
and inflation risk.
Interest rate risk
The present value of the defined benefit liability is calculated using a discount rate determined by
reference to market yields on high quality corporate bonds. The estimated term of the bonds is
consistent with the estimated term of the Defined Benefit Obligation (DBO) and it is denominated in
$AUD. A decrease in market yield on high quality corporate bonds will increase the Group’s defined
benefit liability, although it is expected that this would be offset partially by an increase in the fair value
of certain of the plan assets.
Investment risk
The plan assets at 31 December 2018 are predominantly real estate, equity and debt instruments. The
fair value of the plan assets is exposed to the real estate market (in Australia and the US). The equity
instruments are significantly weighted towards the finance and pharmaceuticals sectors in Australia.
Longevity risk
The Group is required to provide benefits for life for the members of the defined benefit liability. Increase
in the life expectancy of the members, particularly in Australia and in the UK where the pension
payments are linked to CPI, will increase the defined benefit liability.
Inflation risk
A significant proportion of the defined benefit liability is linked to inflation. An increase in the inflation rate
will increase the Group’s liability. A portion of the plan assets are inflation-linked debt securities which
will mitigate some of the effects of inflation.
The liability recognised for the Group’s DBO is represented net of plan assets in accordance with
AASB 119.131(a) and (b). It consists of the following amounts:
AASB 119.139(a)
AASB 119.139(a)
AASB 119.139(b)
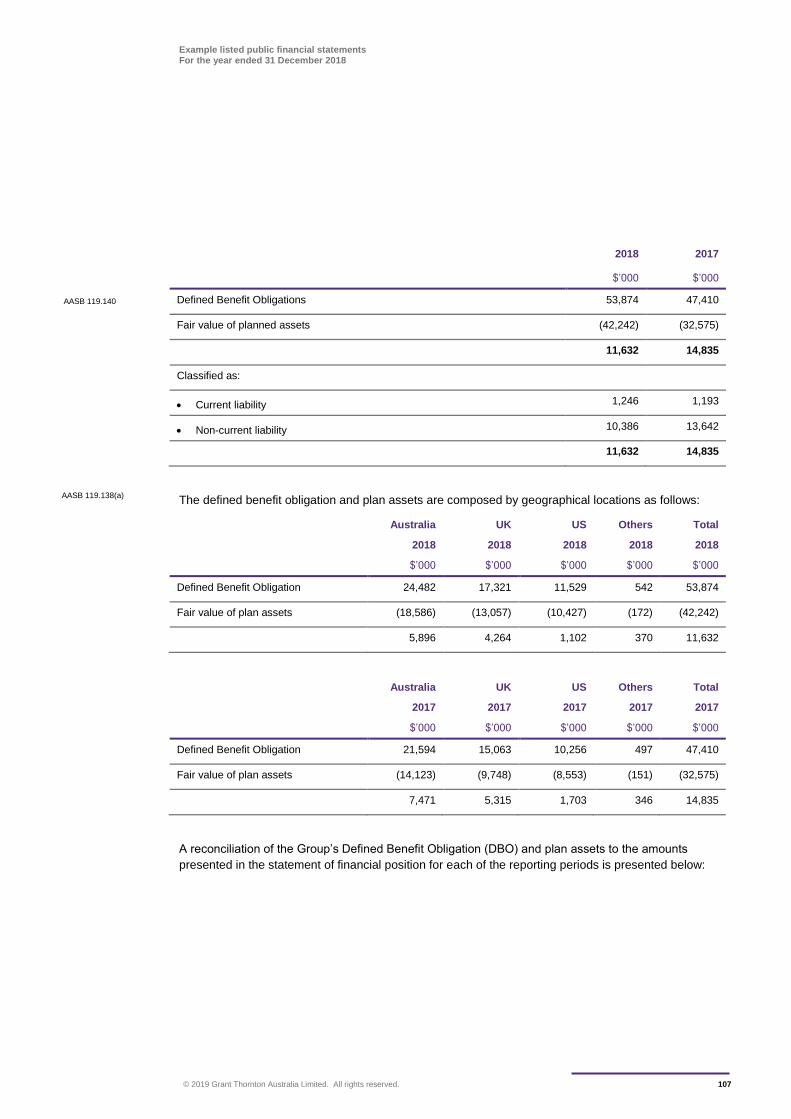
Example listed public financial statements For the year ended 31 December 2018
© 2019 Grant Thornton Australia Limited. All rights reserved. 107
2018 2017
$’000 $’000
AASB 119.140 Defined Benefit Obligations 53,874 47,410
Fair value of planned assets (42,242) (32,575)
11,632 14,835
Classified as:
Current liability 1,246 1,193
Non-current liability 10,386 13,642
11,632 14,835
The defined benefit obligation and plan assets are composed by geographical locations as follows:
Australia UK US Others Total
2018 2018 2018 2018 2018
$’000 $’000 $’000 $’000 $’000
Defined Benefit Obligation 24,482 17,321 11,529 542 53,874
Fair value of plan assets (18,586) (13,057) (10,427) (172) (42,242)
5,896 4,264 1,102 370 11,632
Australia UK US Others Total
2017 2017 2017 2017 2017
$’000 $’000 $’000 $’000 $’000
Defined Benefit Obligation 21,594 15,063 10,256 497 47,410
Fair value of plan assets (14,123) (9,748) (8,553) (151) (32,575)
7,471 5,315 1,703 346 14,835
A reconciliation of the Group’s Defined Benefit Obligation (DBO) and plan assets to the amounts
presented in the statement of financial position for each of the reporting periods is presented below:
AASB 119.138(a)
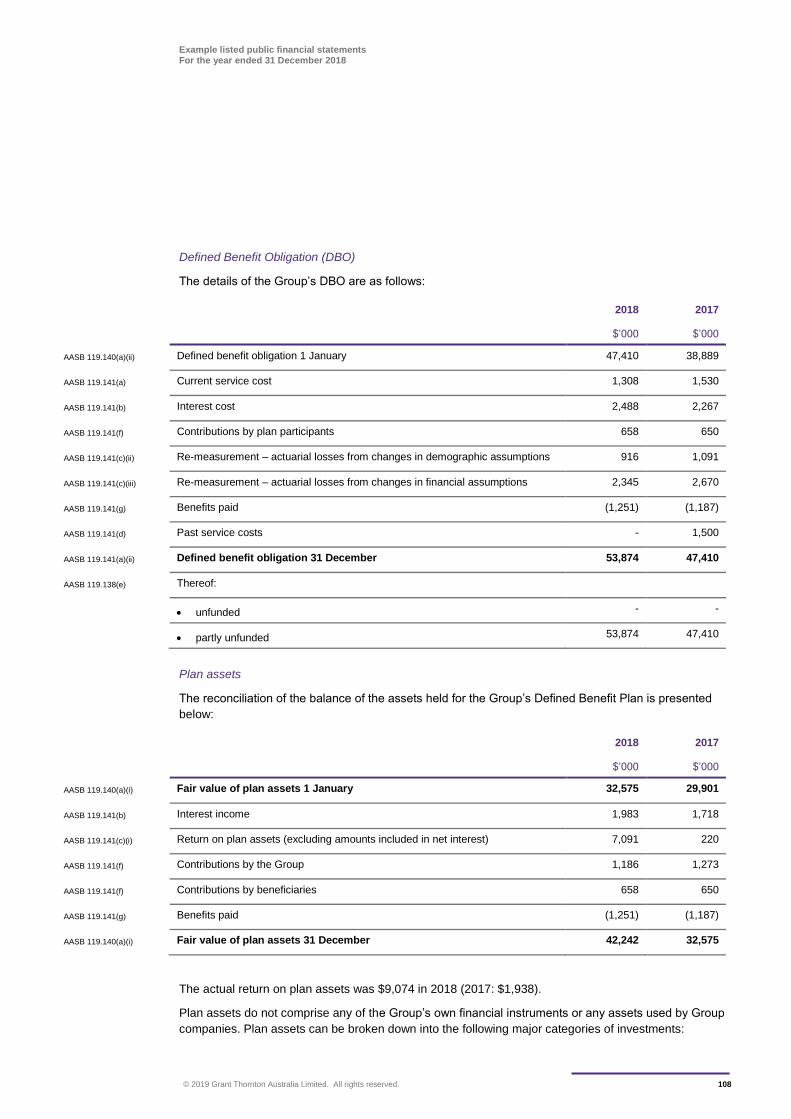
Example listed public financial statements For the year ended 31 December 2018
© 2019 Grant Thornton Australia Limited. All rights reserved. 108
Defined Benefit Obligation (DBO)
The details of the Group’s DBO are as follows:
2018 2017
$’000 $’000
AASB 119.140(a)(ii) Defined benefit obligation 1 January 47,410 38,889
AASB 119.141(a) Current service cost 1,308 1,530
AASB 119.141(b) Interest cost 2,488 2,267
AASB 119.141(f) Contributions by plan participants 658 650
AASB 119.141(c)(ii) Re-measurement – actuarial losses from changes in demographic assumptions 916 1,091
AASB 119.141(c)(iii) Re-measurement – actuarial losses from changes in financial assumptions 2,345 2,670
AASB 119.141(g) Benefits paid (1,251) (1,187)
AASB 119.141(d) Past service costs - 1,500
AASB 119.141(a)(ii) Defined benefit obligation 31 December 53,874 47,410
AASB 119.138(e) Thereof:
unfunded - -
partly unfunded 53,874 47,410
Plan assets
The reconciliation of the balance of the assets held for the Group’s Defined Benefit Plan is presented
below:
2018 2017
$’000 $’000
AASB 119.140(a)(i) Fair value of plan assets 1 January 32,575 29,901
AASB 119.141(b) Interest income 1,983 1,718
AASB 119.141(c)(i) Return on plan assets (excluding amounts included in net interest) 7,091 220
AASB 119.141(f) Contributions by the Group 1,186 1,273
AASB 119.141(f) Contributions by beneficiaries 658 650
AASB 119.141(g) Benefits paid (1,251) (1,187)
AASB 119.140(a)(i) Fair value of plan assets 31 December 42,242 32,575
The actual return on plan assets was $9,074 in 2018 (2017: $1,938).
Plan assets do not comprise any of the Group’s own financial instruments or any assets used by Group
companies. Plan assets can be broken down into the following major categories of investments:
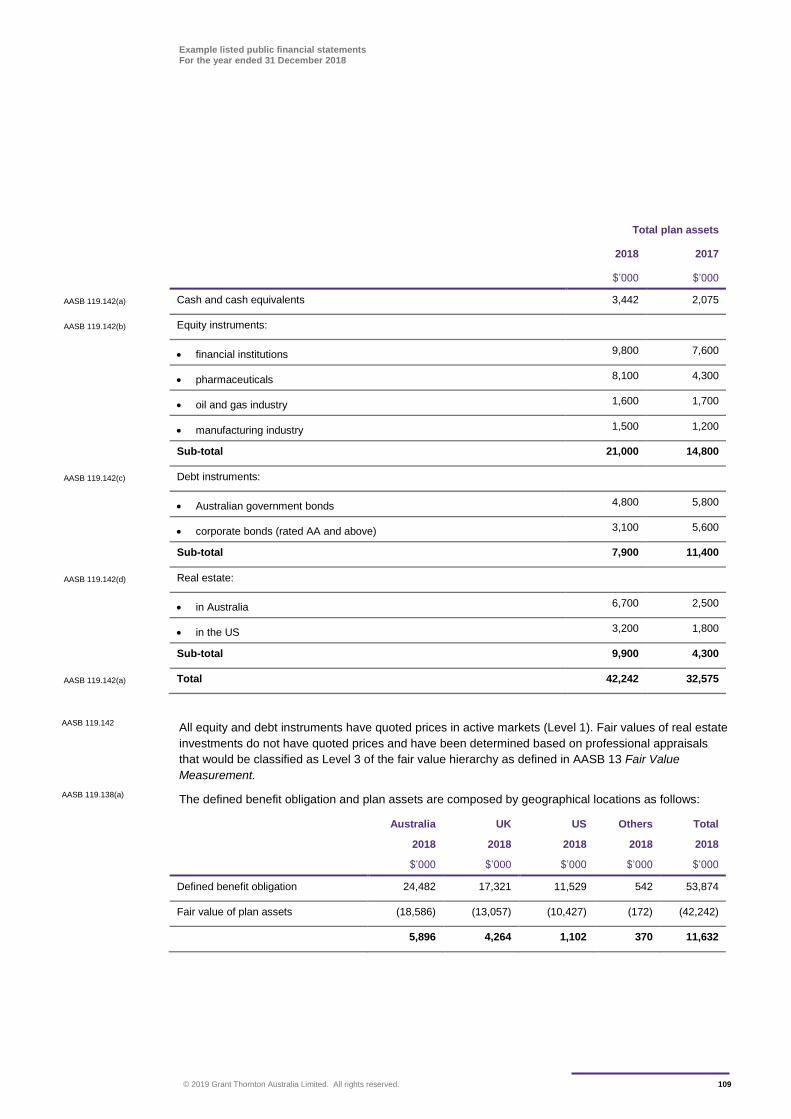
Example listed public financial statements For the year ended 31 December 2018
© 2019 Grant Thornton Australia Limited. All rights reserved. 109
Total plan assets
2018 2017
$’000 $’000
AASB 119.142(a) Cash and cash equivalents 3,442 2,075
AASB 119.142(b) Equity instruments:
financial institutions 9,800 7,600
pharmaceuticals 8,100 4,300
oil and gas industry 1,600 1,700
manufacturing industry 1,500 1,200
Sub-total 21,000 14,800
AASB 119.142(c) Debt instruments:
Australian government bonds 4,800 5,800
corporate bonds (rated AA and above) 3,100 5,600
Sub-total 7,900 11,400
AASB 119.142(d) Real estate:
in Australia 6,700 2,500
in the US 3,200 1,800
Sub-total 9,900 4,300
AASB 119.142(a) Total 42,242 32,575
All equity and debt instruments have quoted prices in active markets (Level 1). Fair values of real estate
investments do not have quoted prices and have been determined based on professional appraisals
that would be classified as Level 3 of the fair value hierarchy as defined in AASB 13 Fair Value
Measurement.
The defined benefit obligation and plan assets are composed by geographical locations as follows:
Australia UK US Others Total
2018 2018 2018 2018 2018
$’000 $’000 $’000 $’000 $’000
Defined benefit obligation 24,482 17,321 11,529 542 53,874
Fair value of plan assets (18,586) (13,057) (10,427) (172) (42,242)
5,896 4,264 1,102 370 11,632
AASB 119.142
AASB 119.138(a)
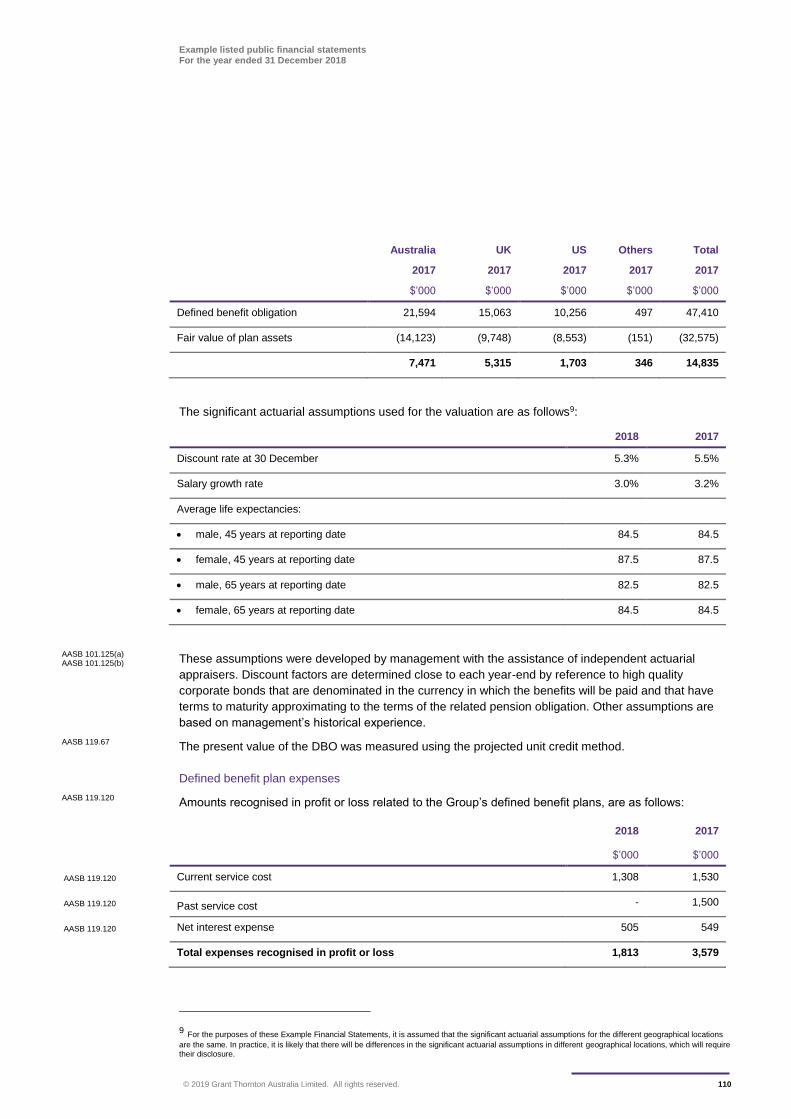
Example listed public financial statements For the year ended 31 December 2018
© 2019 Grant Thornton Australia Limited. All rights reserved. 110
Australia UK US Others Total
2017 2017 2017 2017 2017
$’000 $’000 $’000 $’000 $’000
Defined benefit obligation 21,594 15,063 10,256 497 47,410
Fair value of plan assets (14,123) (9,748) (8,553) (151) (32,575)
7,471 5,315 1,703 346 14,835
The significant actuarial assumptions used for the valuation are as follows9:
2018 2017
Discount rate at 30 December 5.3% 5.5%
Salary growth rate 3.0% 3.2%
Average life expectancies:
male, 45 years at reporting date 84.5 84.5
female, 45 years at reporting date 87.5 87.5
male, 65 years at reporting date 82.5 82.5
female, 65 years at reporting date 84.5 84.5
These assumptions were developed by management with the assistance of independent actuarial
appraisers. Discount factors are determined close to each year-end by reference to high quality
corporate bonds that are denominated in the currency in which the benefits will be paid and that have
terms to maturity approximating to the terms of the related pension obligation. Other assumptions are
based on management’s historical experience.
The present value of the DBO was measured using the projected unit credit method.
Defined benefit plan expenses
Amounts recognised in profit or loss related to the Group’s defined benefit plans, are as follows:
2018 2017
$’000 $’000
AASB 119.120 Current service cost 1,308 1,530
AASB 119.120 Past service cost - 1,500
AASB 119.120 Net interest expense 505 549
Total expenses recognised in profit or loss 1,813 3,579
9 For the purposes of these Example Financial Statements, it is assumed that the significant actuarial assumptions for the different geographical locations
are the same. In practice, it is likely that there will be differences in the significant actuarial assumptions in different geographical locations, which will require their disclosure.
AASB 101.125(a) AASB 101.125(b)
AASB 119.67
AASB 119.120
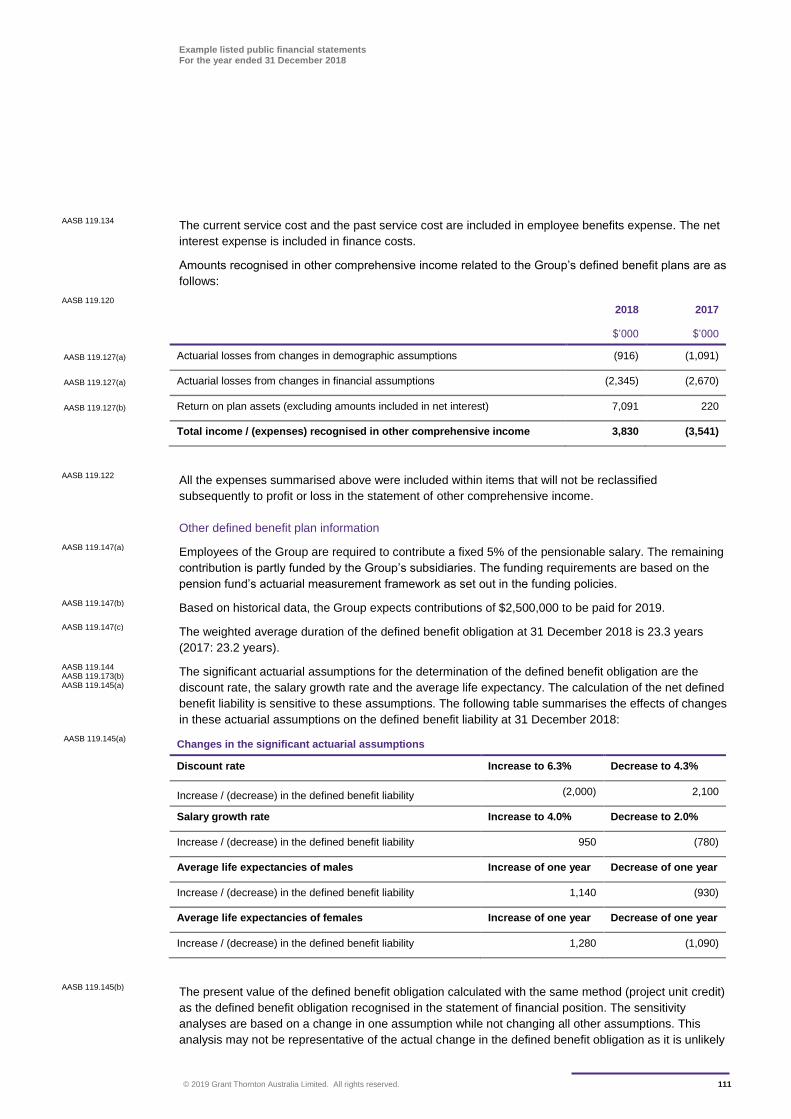
Example listed public financial statements For the year ended 31 December 2018
© 2019 Grant Thornton Australia Limited. All rights reserved. 111
The current service cost and the past service cost are included in employee benefits expense. The net
interest expense is included in finance costs.
Amounts recognised in other comprehensive income related to the Group’s defined benefit plans are as
follows:
2018 2017
$’000 $’000
AASB 119.127(a) Actuarial losses from changes in demographic assumptions (916) (1,091)
AASB 119.127(a) Actuarial losses from changes in financial assumptions (2,345) (2,670)
AASB 119.127(b) Return on plan assets (excluding amounts included in net interest) 7,091 220
Total income / (expenses) recognised in other comprehensive income 3,830 (3,541)
All the expenses summarised above were included within items that will not be reclassified
subsequently to profit or loss in the statement of other comprehensive income.
Other defined benefit plan information
Employees of the Group are required to contribute a fixed 5% of the pensionable salary. The remaining
contribution is partly funded by the Group’s subsidiaries. The funding requirements are based on the
pension fund’s actuarial measurement framework as set out in the funding policies.
Based on historical data, the Group expects contributions of $2,500,000 to be paid for 2019.
The weighted average duration of the defined benefit obligation at 31 December 2018 is 23.3 years
(2017: 23.2 years).
The significant actuarial assumptions for the determination of the defined benefit obligation are the
discount rate, the salary growth rate and the average life expectancy. The calculation of the net defined
benefit liability is sensitive to these assumptions. The following table summarises the effects of changes
in these actuarial assumptions on the defined benefit liability at 31 December 2018:
AASB 119.145(a) Changes in the significant actuarial assumptions
Discount rate Increase to 6.3% Decrease to 4.3%
Increase / (decrease) in the defined benefit liability (2,000) 2,100
Salary growth rate Increase to 4.0% Decrease to 2.0%
Increase / (decrease) in the defined benefit liability 950 (780)
Average life expectancies of males Increase of one year Decrease of one year
Increase / (decrease) in the defined benefit liability 1,140 (930)
Average life expectancies of females Increase of one year Decrease of one year
Increase / (decrease) in the defined benefit liability 1,280 (1,090)
The present value of the defined benefit obligation calculated with the same method (project unit credit)
as the defined benefit obligation recognised in the statement of financial position. The sensitivity
analyses are based on a change in one assumption while not changing all other assumptions. This
analysis may not be representative of the actual change in the defined benefit obligation as it is unlikely
AASB 119.134
AASB 119.120
AASB 119.122
AASB 119.147(a)
AASB 119.147(b)
AASB 119.147(c)
AASB 119.144 AASB 119.173(b) AASB 119.145(a)
AASB 119.145(b)
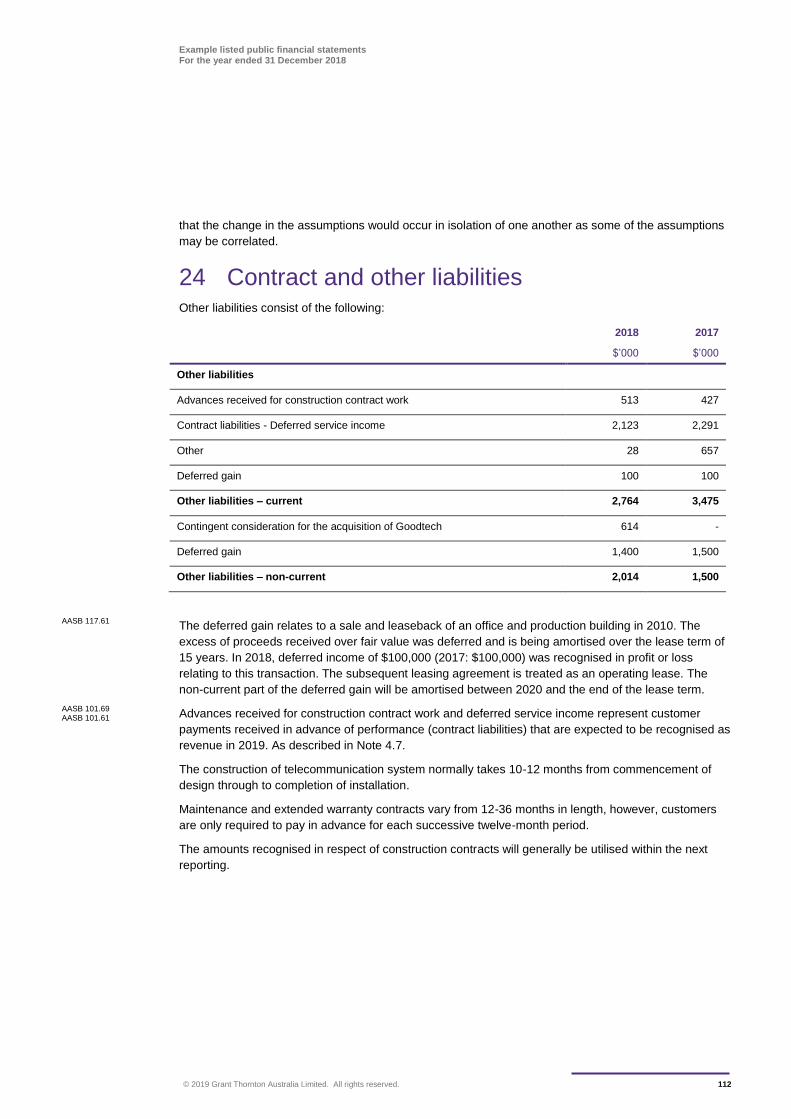
Example listed public financial statements For the year ended 31 December 2018
© 2019 Grant Thornton Australia Limited. All rights reserved. 112
that the change in the assumptions would occur in isolation of one another as some of the assumptions
may be correlated.
24 Contract and other liabilities Other liabilities consist of the following:
2018 2017
$’000 $’000
Other liabilities
Advances received for construction contract work 513 427
Contract liabilities - Deferred service income 2,123 2,291
Other 28 657
Deferred gain 100 100
Other liabilities – current 2,764 3,475
Contingent consideration for the acquisition of Goodtech 614 -
Deferred gain 1,400 1,500
Other liabilities – non-current 2,014 1,500
The deferred gain relates to a sale and leaseback of an office and production building in 2010. The
excess of proceeds received over fair value was deferred and is being amortised over the lease term of
15 years. In 2018, deferred income of $100,000 (2017: $100,000) was recognised in profit or loss
relating to this transaction. The subsequent leasing agreement is treated as an operating lease. The
non-current part of the deferred gain will be amortised between 2020 and the end of the lease term.
Advances received for construction contract work and deferred service income represent customer
payments received in advance of performance (contract liabilities) that are expected to be recognised as
revenue in 2019. As described in Note 4.7.
The construction of telecommunication system normally takes 10-12 months from commencement of
design through to completion of installation.
Maintenance and extended warranty contracts vary from 12-36 months in length, however, customers
are only required to pay in advance for each successive twelve-month period.
The amounts recognised in respect of construction contracts will generally be utilised within the next
reporting.
AASB 117.61
AASB 101.69 AASB 101.61
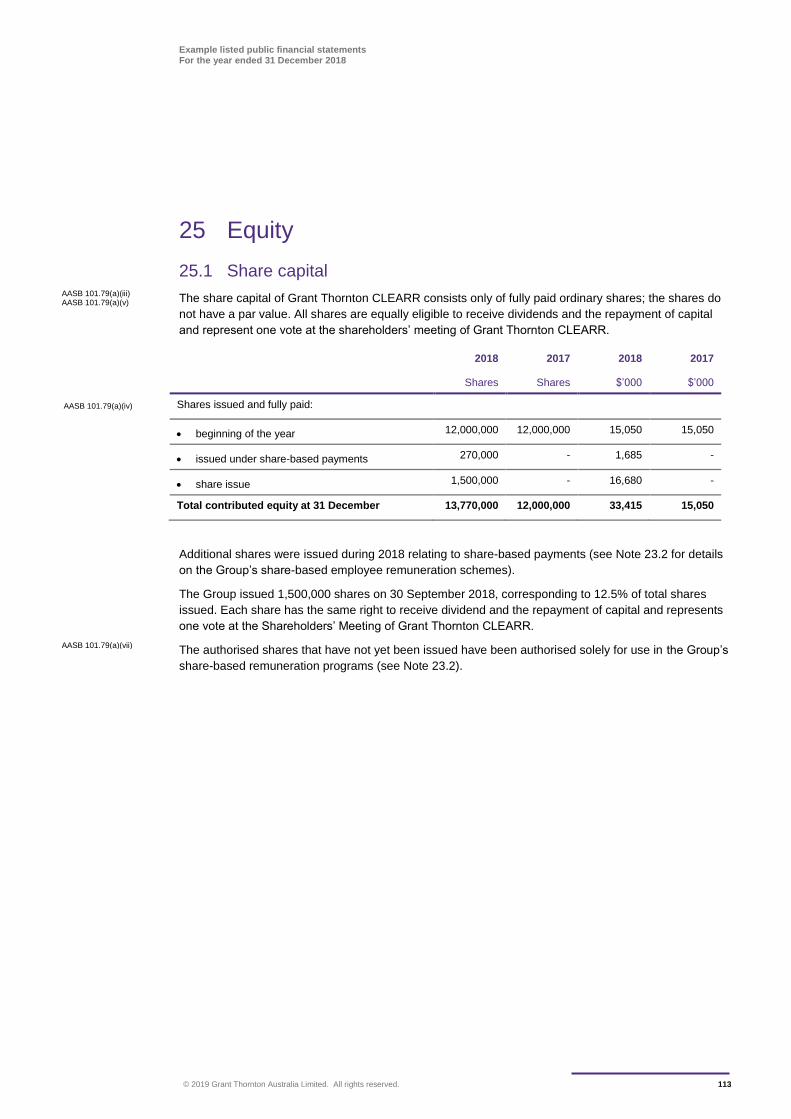
Example listed public financial statements For the year ended 31 December 2018
© 2019 Grant Thornton Australia Limited. All rights reserved. 113
25 Equity
25.1 Share capital
The share capital of Grant Thornton CLEARR consists only of fully paid ordinary shares; the shares do
not have a par value. All shares are equally eligible to receive dividends and the repayment of capital
and represent one vote at the shareholders’ meeting of Grant Thornton CLEARR.
2018 2017 2018 2017
Shares Shares $’000 $’000
AASB 101.79(a)(iv) Shares issued and fully paid:
beginning of the year 12,000,000 12,000,000 15,050 15,050
issued under share-based payments 270,000 - 1,685 -
share issue 1,500,000 - 16,680 -
Total contributed equity at 31 December 13,770,000 12,000,000 33,415 15,050
Additional shares were issued during 2018 relating to share-based payments (see Note 23.2 for details
on the Group’s share-based employee remuneration schemes).
The Group issued 1,500,000 shares on 30 September 2018, corresponding to 12.5% of total shares
issued. Each share has the same right to receive dividend and the repayment of capital and represents
one vote at the Shareholders’ Meeting of Grant Thornton CLEARR.
The authorised shares that have not yet been issued have been authorised solely for use in the Group’s
share-based remuneration programs (see Note 23.2).
AASB 101.79(a)(iii) AASB 101.79(a)(v)
AASB 101.79(a)(vii)
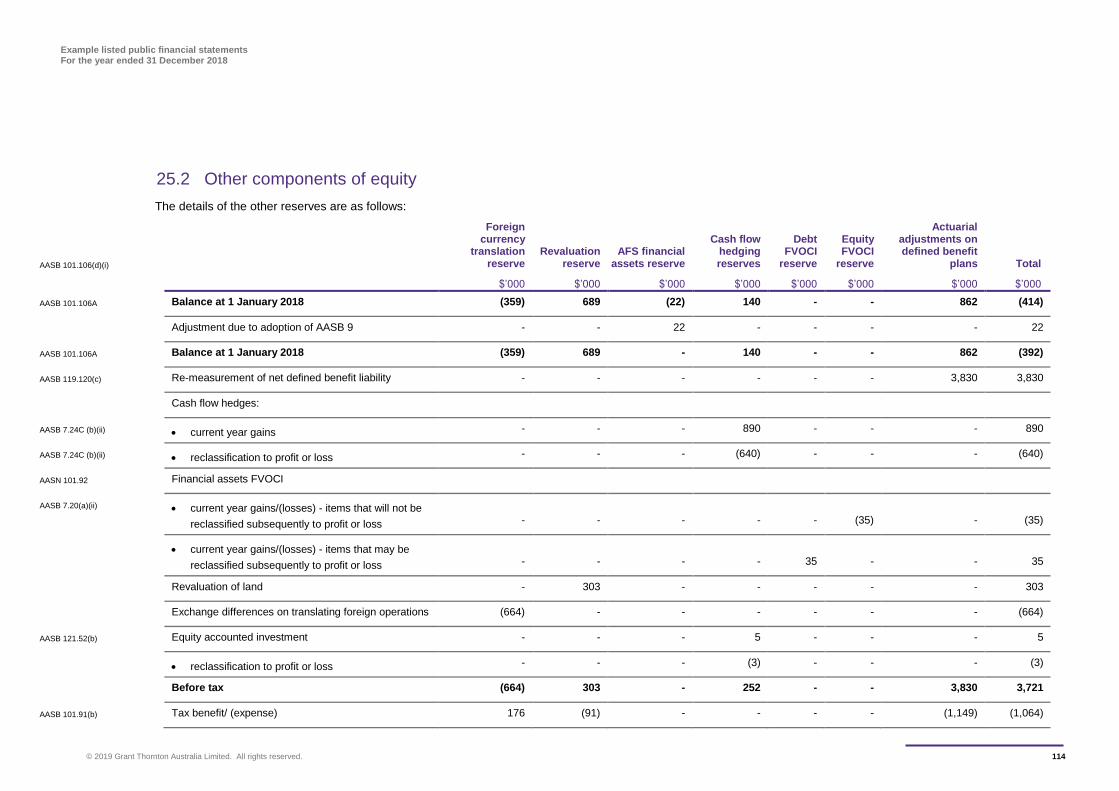
Example listed public financial statements For the year ended 31 December 2018
© 2019 Grant Thornton Australia Limited. All rights reserved. 114
25.2 Other components of equity
The details of the other reserves are as follows:
AASB 101.106(d)(i)
Foreign currency
translation reserve
Revaluation reserve
AFS financial assets reserve
Cash flow hedging reserves
Debt FVOCI
reserve
Equity FVOCI
reserve
Actuarial adjustments on defined benefit
plans Total
$’000 $’000 $’000 $’000 $’000 $’000 $’000 $’000
AASB 101.106A Balance at 1 January 2018 (359) 689 (22) 140 - - 862 (414)
Adjustment due to adoption of AASB 9 - - 22 - - - - 22
AASB 101.106A Balance at 1 January 2018 (359) 689 - 140 - - 862 (392)
AASB 119.120(c) Re-measurement of net defined benefit liability - - - - - - 3,830 3,830
Cash flow hedges:
AASB 7.24C (b)(ii) current year gains - - - 890 - - - 890
AASB 7.24C (b)(ii) reclassification to profit or loss - - - (640) - - - (640)
AASN 101.92 Financial assets FVOCI
AASB 7.20(a)(ii) current year gains/(losses) - items that will not be
reclassified subsequently to profit or loss - - - - - (35) - (35)
current year gains/(losses) - items that may be
reclassified subsequently to profit or loss - - - - 35 - - 35
Revaluation of land - 303 - - - - - 303
Exchange differences on translating foreign operations (664) - - - - - - (664)
AASB 121.52(b) Equity accounted investment - - - 5 - - - 5
reclassification to profit or loss - - - (3) - - - (3)
Before tax (664) 303 - 252 - - 3,830 3,721
AASB 101.91(b) Tax benefit/ (expense) 176 (91) - - - - (1,149) (1,064)
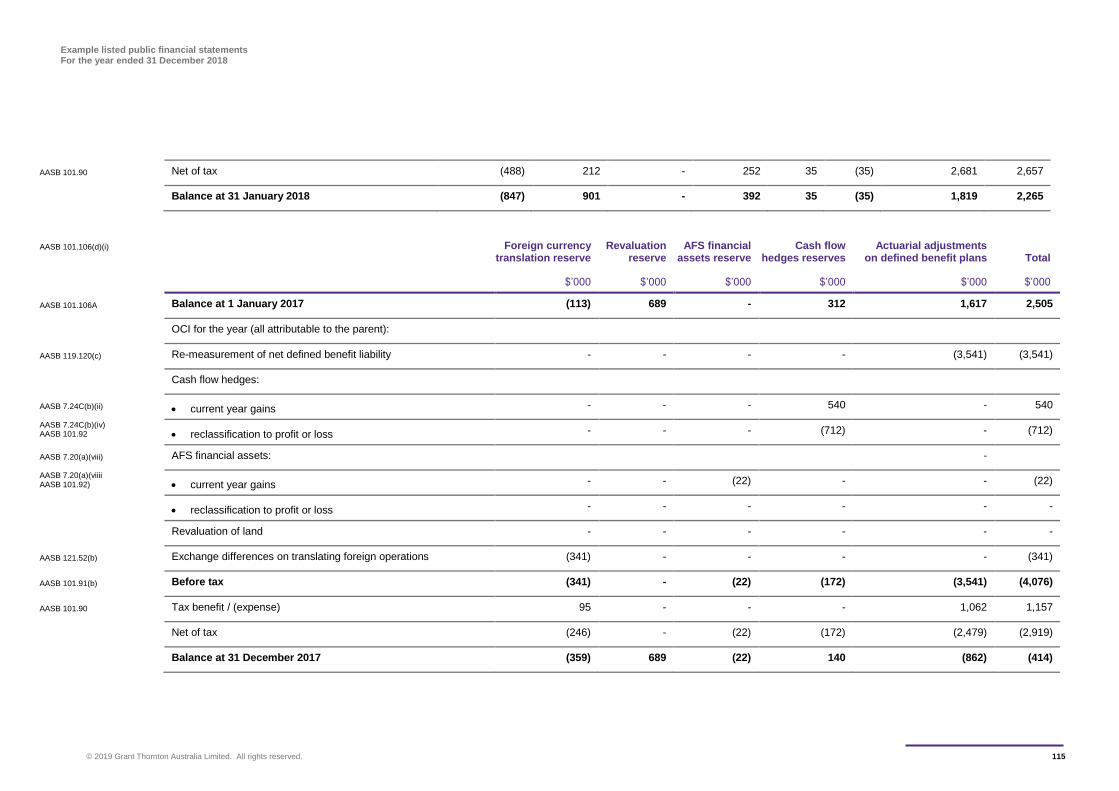
Example listed public financial statements For the year ended 31 December 2018
© 2019 Grant Thornton Australia Limited. All rights reserved. 115
AASB 101.90 Net of tax (488) 212 - 252 35 (35) 2,681 2,657
Balance at 31 January 2018 (847) 901 - 392 35 (35) 1,819 2,265
AASB 101.106(d)(i)
Foreign currency
translation reserve Revaluation
reserve AFS financial
assets reserve Cash flow
hedges reserves Actuarial adjustments
on defined benefit plans Total
$’000 $’000 $’000 $’000 $’000 $’000
AASB 101.106A Balance at 1 January 2017 (113) 689 - 312 1,617 2,505
OCI for the year (all attributable to the parent):
AASB 119.120(c) Re-measurement of net defined benefit liability - - - - (3,541) (3,541)
Cash flow hedges:
AASB 7.24C(b)(ii) current year gains - - - 540 - 540
AASB 7.24C(b)(iv) AASB 101.92 reclassification to profit or loss - - - (712) - (712)
AASB 7.20(a)(viii) AFS financial assets: -
AASB 7.20(a)(viiii AASB 101.92) current year gains - - (22) - - (22)
reclassification to profit or loss - - - - - -
Revaluation of land - - - - - -
AASB 121.52(b) Exchange differences on translating foreign operations (341) - - - - (341)
AASB 101.91(b) Before tax (341) - (22) (172) (3,541) (4,076)
AASB 101.90 Tax benefit / (expense) 95 - - - 1,062 1,157
Net of tax (246) - (22) (172) (2,479) (2,919)
Balance at 31 December 2017 (359) 689 (22) 140 (862) (414)
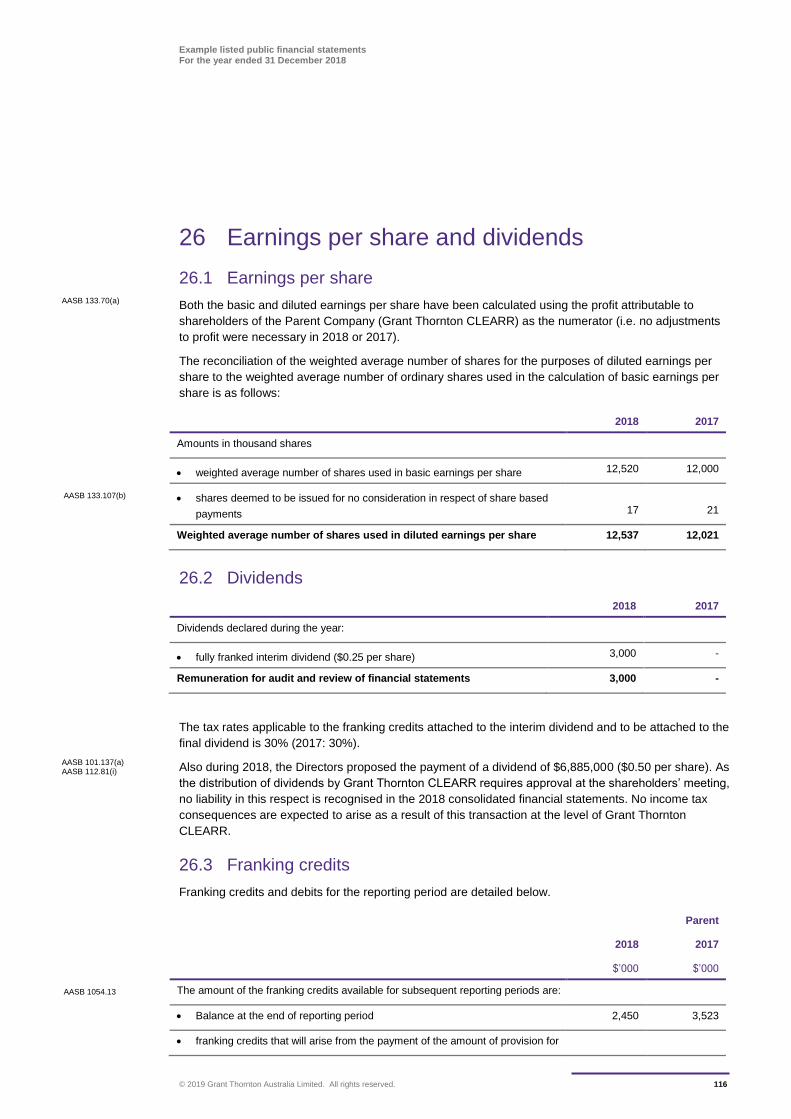
Example listed public financial statements For the year ended 31 December 2018
© 2019 Grant Thornton Australia Limited. All rights reserved. 116
26 Earnings per share and dividends
26.1 Earnings per share
Both the basic and diluted earnings per share have been calculated using the profit attributable to
shareholders of the Parent Company (Grant Thornton CLEARR) as the numerator (i.e. no adjustments
to profit were necessary in 2018 or 2017).
The reconciliation of the weighted average number of shares for the purposes of diluted earnings per
share to the weighted average number of ordinary shares used in the calculation of basic earnings per
share is as follows:
2018 2017
Amounts in thousand shares
weighted average number of shares used in basic earnings per share 12,520 12,000
AASB 133.107(b) shares deemed to be issued for no consideration in respect of share based
payments 17 21
Weighted average number of shares used in diluted earnings per share 12,537 12,021
26.2 Dividends
2018 2017
Dividends declared during the year:
fully franked interim dividend ($0.25 per share) 3,000 -
Remuneration for audit and review of financial statements 3,000 -
The tax rates applicable to the franking credits attached to the interim dividend and to be attached to the
final dividend is 30% (2017: 30%).
Also during 2018, the Directors proposed the payment of a dividend of $6,885,000 ($0.50 per share). As
the distribution of dividends by Grant Thornton CLEARR requires approval at the shareholders’ meeting,
no liability in this respect is recognised in the 2018 consolidated financial statements. No income tax
consequences are expected to arise as a result of this transaction at the level of Grant Thornton
CLEARR.
26.3 Franking credits
Franking credits and debits for the reporting period are detailed below.
Parent
2018 2017
$’000 $’000
AASB 1054.13 The amount of the franking credits available for subsequent reporting periods are:
Balance at the end of reporting period 2,450 3,523
franking credits that will arise from the payment of the amount of provision for
AASB 133.70(a)
AASB 101.137(a) AASB 112.81(i)
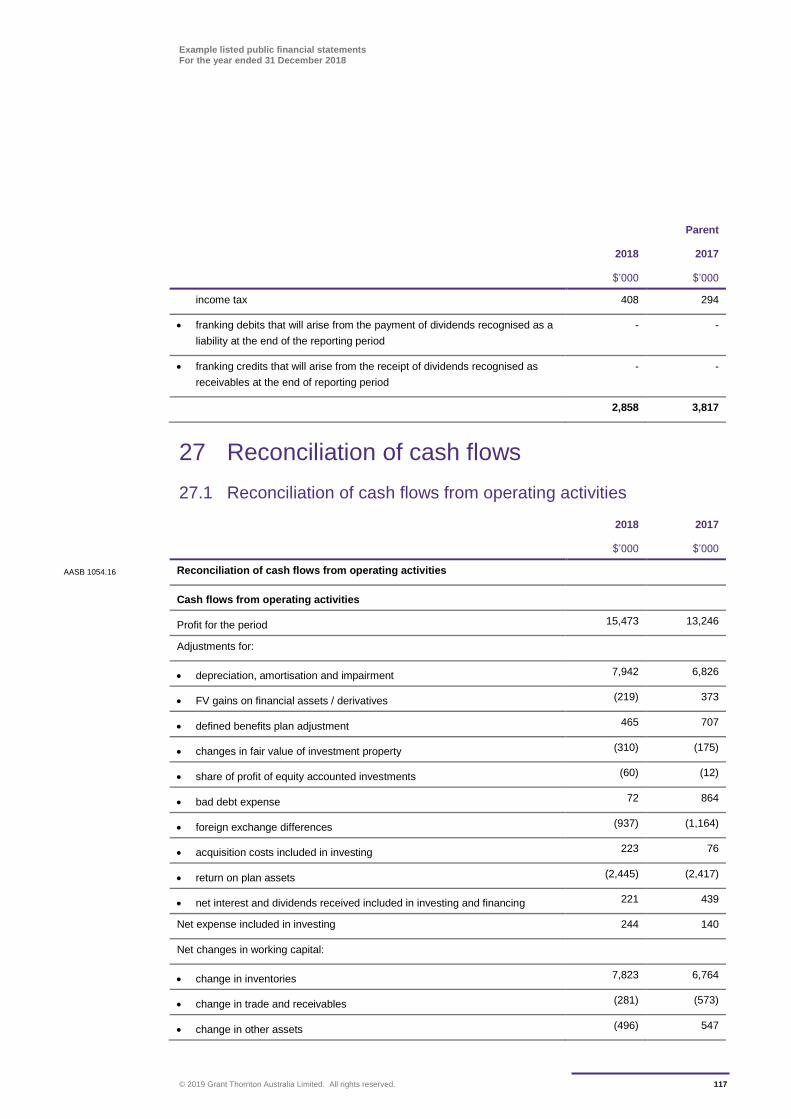
Example listed public financial statements For the year ended 31 December 2018
© 2019 Grant Thornton Australia Limited. All rights reserved. 117
Parent
2018 2017
$’000 $’000
income tax 408 294
franking debits that will arise from the payment of dividends recognised as a
liability at the end of the reporting period
- -
franking credits that will arise from the receipt of dividends recognised as
receivables at the end of reporting period
- -
2,858 3,817
27 Reconciliation of cash flows
27.1 Reconciliation of cash flows from operating activities
2018 2017
$’000 $’000
AASB 1054.16 Reconciliation of cash flows from operating activities
Cash flows from operating activities
Profit for the period 15,473 13,246
Adjustments for:
depreciation, amortisation and impairment 7,942 6,826
FV gains on financial assets / derivatives (219) 373
defined benefits plan adjustment 465 707
changes in fair value of investment property (310) (175)
share of profit of equity accounted investments (60) (12)
bad debt expense 72 864
foreign exchange differences (937) (1,164)
acquisition costs included in investing 223 76
return on plan assets (2,445) (2,417)
net interest and dividends received included in investing and financing 221 439
Net expense included in investing 244 140
Net changes in working capital:
change in inventories 7,823 6,764
change in trade and receivables (281) (573)
change in other assets (496) 547
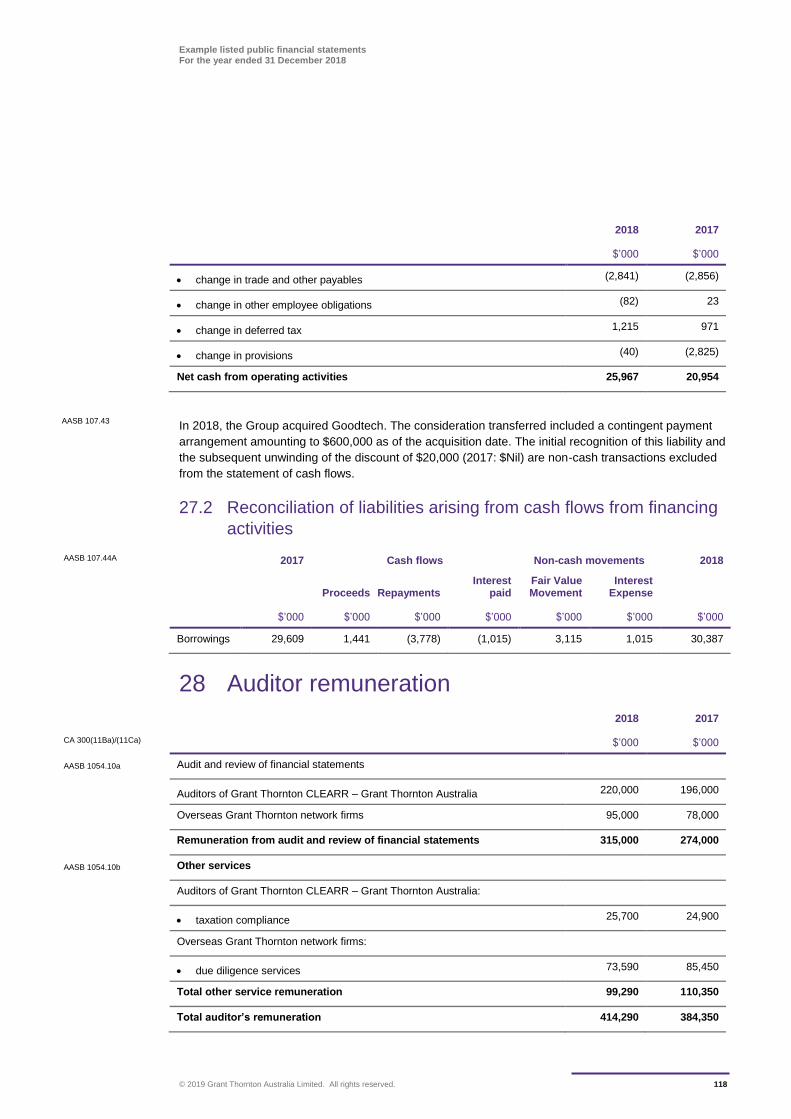
Example listed public financial statements For the year ended 31 December 2018
© 2019 Grant Thornton Australia Limited. All rights reserved. 118
2018 2017
$’000 $’000
change in trade and other payables (2,841) (2,856)
change in other employee obligations (82) 23
change in deferred tax 1,215 971
change in provisions (40) (2,825)
Net cash from operating activities 25,967 20,954
In 2018, the Group acquired Goodtech. The consideration transferred included a contingent payment
arrangement amounting to $600,000 as of the acquisition date. The initial recognition of this liability and
the subsequent unwinding of the discount of $20,000 (2017: $Nil) are non-cash transactions excluded
from the statement of cash flows.
27.2 Reconciliation of liabilities arising from cash flows from financing
activities
AASB 107.44A 2017 Cash flows Non-cash movements 2018
Proceeds Repayments Interest
paid Fair Value Movement
Interest Expense
$’000 $’000 $’000 $’000 $’000 $’000 $’000
Borrowings 29,609 1,441 (3,778) (1,015) 3,115 1,015 30,387
28 Auditor remuneration 2018 2017
CA 300(11Ba)/(11Ca) $’000 $’000
AASB 1054.10a Audit and review of financial statements
Auditors of Grant Thornton CLEARR – Grant Thornton Australia 220,000 196,000
Overseas Grant Thornton network firms 95,000 78,000
Remuneration from audit and review of financial statements 315,000 274,000
AASB 1054.10b Other services
Auditors of Grant Thornton CLEARR – Grant Thornton Australia:
taxation compliance 25,700 24,900
Overseas Grant Thornton network firms:
due diligence services 73,590 85,450
Total other service remuneration 99,290 110,350
Total auditor’s remuneration 414,290 384,350
AASB 107.43
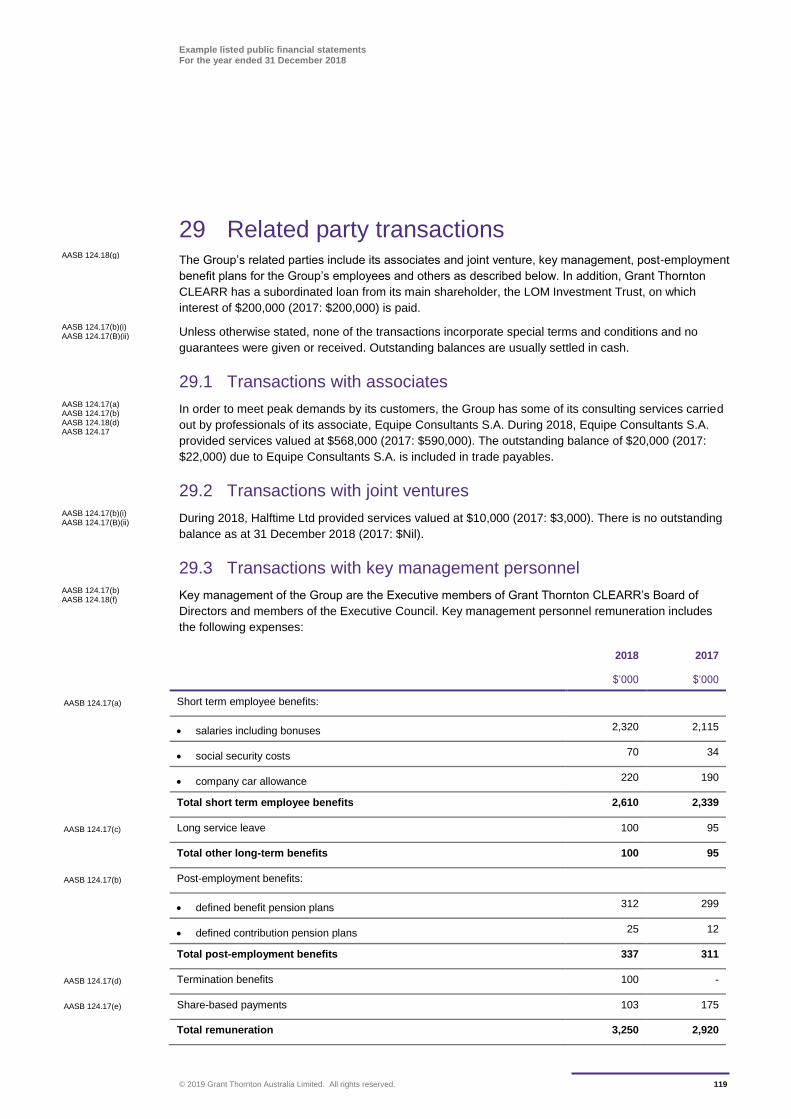
Example listed public financial statements For the year ended 31 December 2018
© 2019 Grant Thornton Australia Limited. All rights reserved. 119
29 Related party transactions The Group’s related parties include its associates and joint venture, key management, post-employment
benefit plans for the Group’s employees and others as described below. In addition, Grant Thornton
CLEARR has a subordinated loan from its main shareholder, the LOM Investment Trust, on which
interest of $200,000 (2017: $200,000) is paid.
Unless otherwise stated, none of the transactions incorporate special terms and conditions and no
guarantees were given or received. Outstanding balances are usually settled in cash.
29.1 Transactions with associates
In order to meet peak demands by its customers, the Group has some of its consulting services carried
out by professionals of its associate, Equipe Consultants S.A. During 2018, Equipe Consultants S.A.
provided services valued at $568,000 (2017: $590,000). The outstanding balance of $20,000 (2017:
$22,000) due to Equipe Consultants S.A. is included in trade payables.
29.2 Transactions with joint ventures
During 2018, Halftime Ltd provided services valued at $10,000 (2017: $3,000). There is no outstanding
balance as at 31 December 2018 (2017: $Nil).
29.3 Transactions with key management personnel
Key management of the Group are the Executive members of Grant Thornton CLEARR’s Board of
Directors and members of the Executive Council. Key management personnel remuneration includes
the following expenses:
2018 2017
$’000 $’000
AASB 124.17(a) Short term employee benefits:
salaries including bonuses 2,320 2,115
social security costs 70 34
company car allowance 220 190
Total short term employee benefits 2,610 2,339
AASB 124.17(c) Long service leave 100 95
Total other long-term benefits 100 95
AASB 124.17(b) Post-employment benefits:
defined benefit pension plans 312 299
defined contribution pension plans 25 12
Total post-employment benefits 337 311
AASB 124.17(d) Termination benefits 100 -
AASB 124.17(e) Share-based payments 103 175
Total remuneration 3,250 2,920
AASB 124.18(g)
AASB 124.17(b)(i) AASB 124.17(B)(ii)
AASB 124.17(a) AASB 124.17(b) AASB 124.18(d) AASB 124.17
AASB 124.17(b)(i) AASB 124.17(B)(ii)
AASB 124.17(b) AASB 124.18(f)

Example listed public financial statements For the year ended 31 December 2018
© 2019 Grant Thornton Australia Limited. All rights reserved. 120
During 2018, certain key management personnel exercised share options with total exercise price of
$1,685,000 (2017: $Nil) granted in the Group’s Star Program.
The Group allows its employees to take up limited short-term loans to fund merchandise and other
purchases through the Group’s business contacts. This facility is also available to the Group’s key
management personnel.
The table below explains the Group’s loans to key management personnel during 2018 and 2017
financial years:
2018 2017
$’000 $’000
Beginning of the year 1,000 3,000
Loans advanced 40,000 38,000
Loan repayment received 40,000 40,000
Interest charged - -
Interest received - -
End of year 1,000 1,000
The Group does not have an allowance account for receivables relating to outstanding loans and has
not recognised any expense for impaired receivables during 2018 or 2017 financial years.
The loans to key management personnel are generally for a period of two years and are repayable on
quarterly instalments. These loans are unsecured and interest free.
During 2018, the Group used the legal services of one Company Director and the law firm over which he
exercises significant influence. The amounts billed related to this legal service amounted to $21,000
(2017: $Nil), based on normal market rates and was fully paid as of the reporting date.
29.4 Transactions with defined benefit plan
The defined benefit plan is a related party. The defined benefit plan does not hold shares in Grant
Thornton CLEARR. The Group’s only transaction with the defined benefit plan relates to contributions
paid to the plan (see Note 23.3).
30 Contingent liabilities Various warranty and legal claims were brought against the Group during the year. Unless recognised
as a provision, management considers these claims to be unjustified and the probability that they will
require settlement at the Group’s expense to be remote. This evaluation is consistent with external
independent legal advice.
Further information on these contingencies is omitted so as not to seriously prejudice the Group’s
position in the related disputes.
AASB 124.17
AASB 124.17(a) & (b) AASB 124.18(a) & (b)
AASB 124.18(c) AASB 124.18(d)
AASB 124.18(b)(i)
AASB 124.9(g)
AASB 101.114(d)(i) AASB 137.89
AASB 137.92
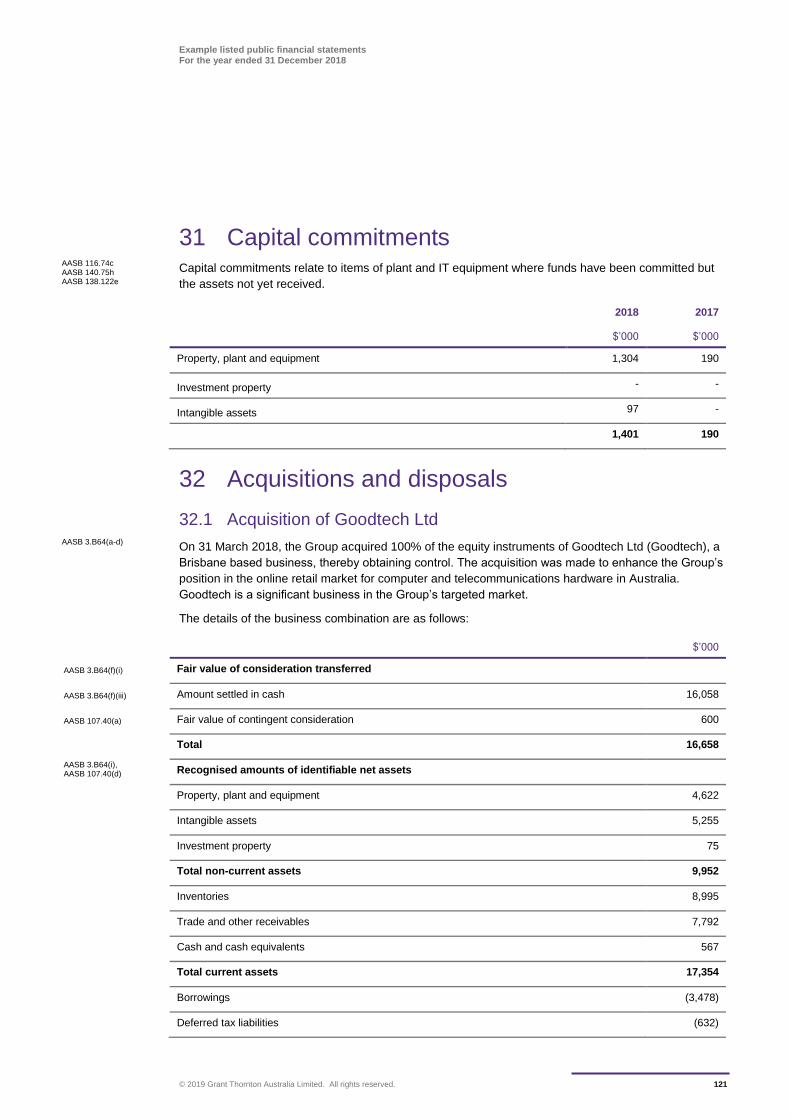
Example listed public financial statements For the year ended 31 December 2018
© 2019 Grant Thornton Australia Limited. All rights reserved. 121
31 Capital commitments Capital commitments relate to items of plant and IT equipment where funds have been committed but
the assets not yet received.
2018 2017
$’000 $’000
Property, plant and equipment 1,304 190
Investment property - -
Intangible assets 97 -
1,401 190
32 Acquisitions and disposals
32.1 Acquisition of Goodtech Ltd
On 31 March 2018, the Group acquired 100% of the equity instruments of Goodtech Ltd (Goodtech), a
Brisbane based business, thereby obtaining control. The acquisition was made to enhance the Group’s
position in the online retail market for computer and telecommunications hardware in Australia.
Goodtech is a significant business in the Group’s targeted market.
The details of the business combination are as follows:
$’000
AASB 3.B64(f)(i) Fair value of consideration transferred
AASB 3.B64(f)(iii) Amount settled in cash 16,058
AASB 107.40(a) Fair value of contingent consideration 600
Total 16,658
AASB 3.B64(i), AASB 107.40(d) Recognised amounts of identifiable net assets
Property, plant and equipment 4,622
Intangible assets 5,255
Investment property 75
Total non-current assets 9,952
Inventories 8,995
Trade and other receivables 7,792
Cash and cash equivalents 567
Total current assets 17,354
Borrowings (3,478)
Deferred tax liabilities (632)
AASB 116.74c AASB 140.75h AASB 138.122e
AASB 3.B64(a-d)
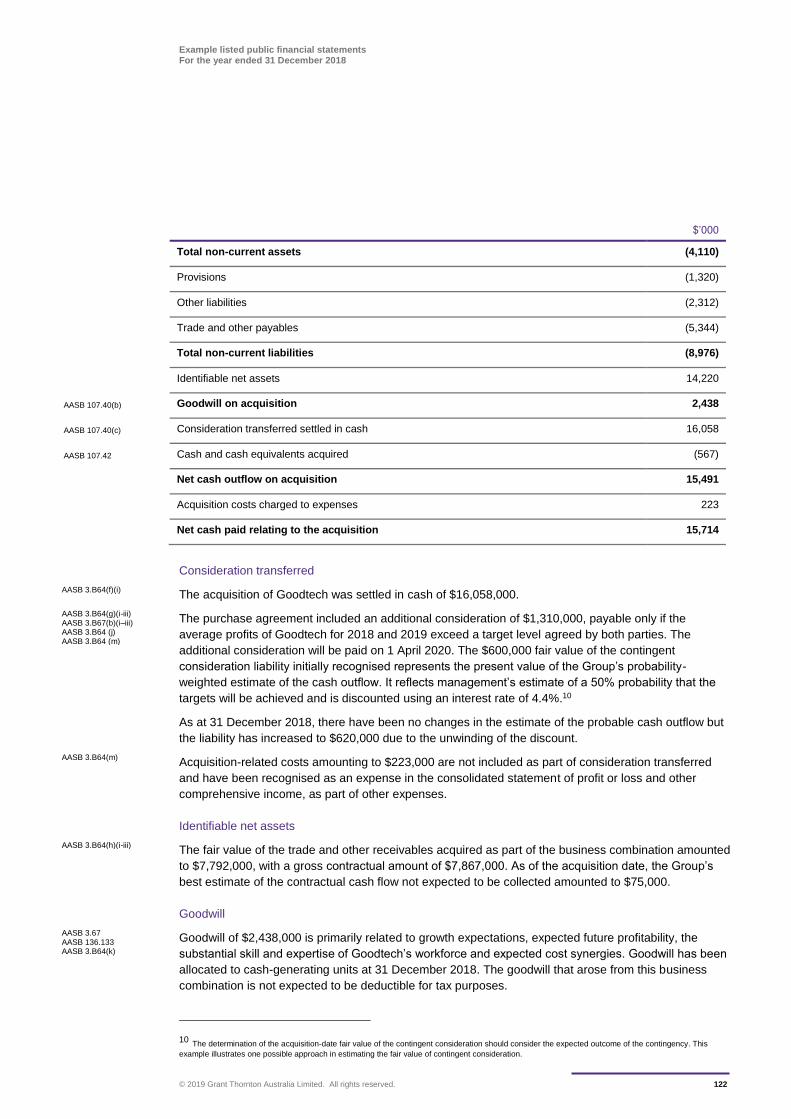
Example listed public financial statements For the year ended 31 December 2018
© 2019 Grant Thornton Australia Limited. All rights reserved. 122
$’000
Total non-current assets (4,110)
Provisions (1,320)
Other liabilities (2,312)
Trade and other payables (5,344)
Total non-current liabilities (8,976)
Identifiable net assets 14,220
AASB 107.40(b) Goodwill on acquisition 2,438
AASB 107.40(c) Consideration transferred settled in cash 16,058
AASB 107.42 Cash and cash equivalents acquired (567)
Net cash outflow on acquisition 15,491
Acquisition costs charged to expenses 223
Net cash paid relating to the acquisition 15,714
Consideration transferred
The acquisition of Goodtech was settled in cash of $16,058,000.
The purchase agreement included an additional consideration of $1,310,000, payable only if the
average profits of Goodtech for 2018 and 2019 exceed a target level agreed by both parties. The
additional consideration will be paid on 1 April 2020. The $600,000 fair value of the contingent
consideration liability initially recognised represents the present value of the Group’s probability-
weighted estimate of the cash outflow. It reflects management’s estimate of a 50% probability that the
targets will be achieved and is discounted using an interest rate of 4.4%.10
As at 31 December 2018, there have been no changes in the estimate of the probable cash outflow but
the liability has increased to $620,000 due to the unwinding of the discount.
Acquisition-related costs amounting to $223,000 are not included as part of consideration transferred
and have been recognised as an expense in the consolidated statement of profit or loss and other
comprehensive income, as part of other expenses.
Identifiable net assets
The fair value of the trade and other receivables acquired as part of the business combination amounted
to $7,792,000, with a gross contractual amount of $7,867,000. As of the acquisition date, the Group’s
best estimate of the contractual cash flow not expected to be collected amounted to $75,000.
Goodwill
Goodwill of $2,438,000 is primarily related to growth expectations, expected future profitability, the
substantial skill and expertise of Goodtech’s workforce and expected cost synergies. Goodwill has been
allocated to cash-generating units at 31 December 2018. The goodwill that arose from this business
combination is not expected to be deductible for tax purposes.
10 The determination of the acquisition-date fair value of the contingent consideration should consider the expected outcome of the contingency. This
example illustrates one possible approach in estimating the fair value of contingent consideration.
AASB 3.B64(f)(i)
AASB 3.B64(g)(i-iii) AASB 3.B67(b)(i–iii) AASB 3.B64 (j) AASB 3.B64 (m)
AASB 3.B64(m)
AASB 3.B64(h)(i-iii)
AASB 3.67 AASB 136.133 AASB 3.B64(k)
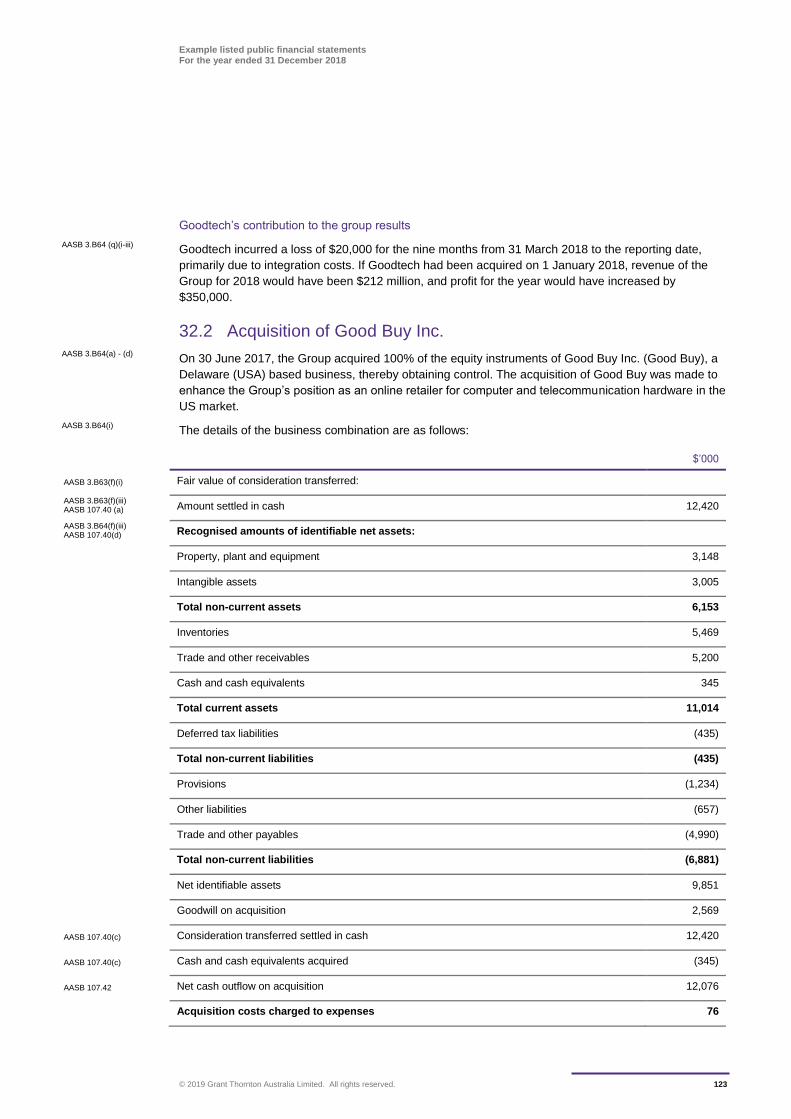
Example listed public financial statements For the year ended 31 December 2018
© 2019 Grant Thornton Australia Limited. All rights reserved. 123
Goodtech’s contribution to the group results
Goodtech incurred a loss of $20,000 for the nine months from 31 March 2018 to the reporting date,
primarily due to integration costs. If Goodtech had been acquired on 1 January 2018, revenue of the
Group for 2018 would have been $212 million, and profit for the year would have increased by
$350,000.
32.2 Acquisition of Good Buy Inc.
On 30 June 2017, the Group acquired 100% of the equity instruments of Good Buy Inc. (Good Buy), a
Delaware (USA) based business, thereby obtaining control. The acquisition of Good Buy was made to
enhance the Group’s position as an online retailer for computer and telecommunication hardware in the
US market.
The details of the business combination are as follows:
$’000
AASB 3.B63(f)(i) Fair value of consideration transferred:
AASB 3.B63(f)(iii) AASB 107.40 (a) Amount settled in cash 12,420
AASB 3.B64(f)(iii) AASB 107.40(d) Recognised amounts of identifiable net assets:
Property, plant and equipment 3,148
Intangible assets 3,005
Total non-current assets 6,153
Inventories 5,469
Trade and other receivables 5,200
Cash and cash equivalents 345
Total current assets 11,014
Deferred tax liabilities (435)
Total non-current liabilities (435)
Provisions (1,234)
Other liabilities (657)
Trade and other payables (4,990)
Total non-current liabilities (6,881)
Net identifiable assets 9,851
Goodwill on acquisition 2,569
AASB 107.40(c) Consideration transferred settled in cash 12,420
AASB 107.40(c) Cash and cash equivalents acquired (345)
AASB 107.42 Net cash outflow on acquisition 12,076
Acquisition costs charged to expenses 76
AASB 3.B64 (q)(i-iii)
AASB 3.B64(a) - (d)
AASB 3.B64(i)
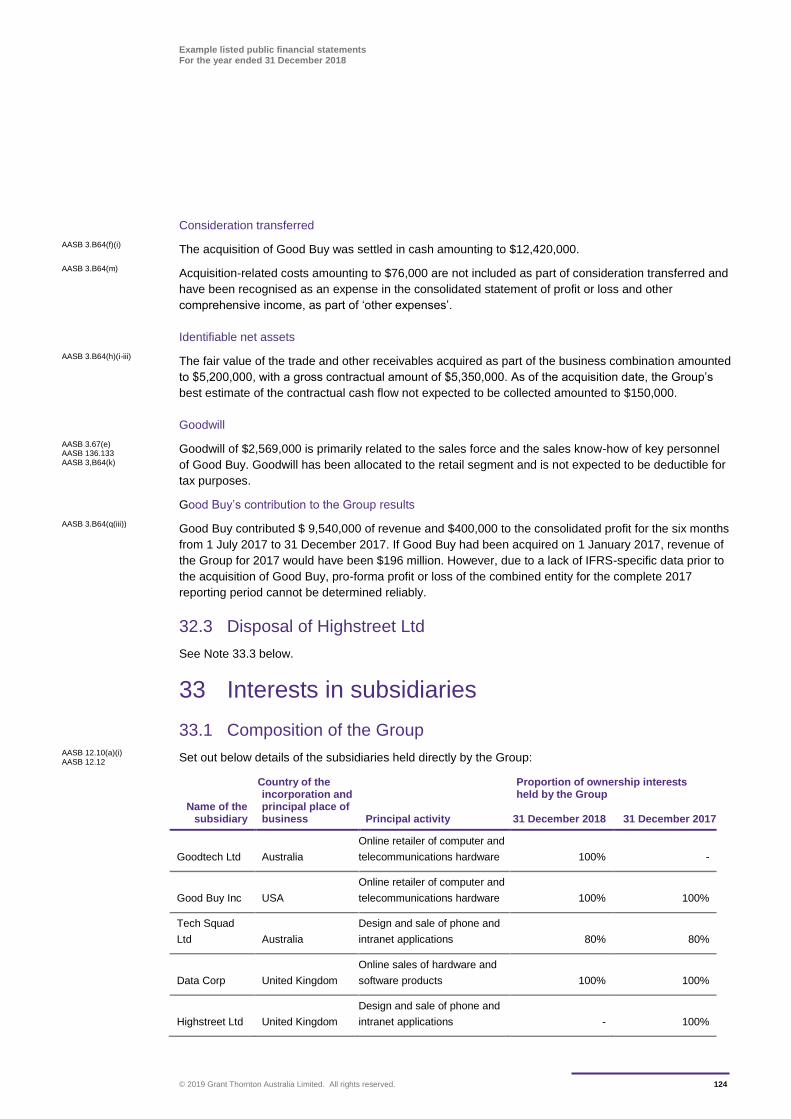
Example listed public financial statements For the year ended 31 December 2018
© 2019 Grant Thornton Australia Limited. All rights reserved. 124
Consideration transferred
The acquisition of Good Buy was settled in cash amounting to $12,420,000.
Acquisition-related costs amounting to $76,000 are not included as part of consideration transferred and
have been recognised as an expense in the consolidated statement of profit or loss and other
comprehensive income, as part of ‘other expenses’.
Identifiable net assets
The fair value of the trade and other receivables acquired as part of the business combination amounted
to $5,200,000, with a gross contractual amount of $5,350,000. As of the acquisition date, the Group’s
best estimate of the contractual cash flow not expected to be collected amounted to $150,000.
Goodwill
Goodwill of $2,569,000 is primarily related to the sales force and the sales know-how of key personnel
of Good Buy. Goodwill has been allocated to the retail segment and is not expected to be deductible for
tax purposes.
Good Buy’s contribution to the Group results
Good Buy contributed $ 9,540,000 of revenue and $400,000 to the consolidated profit for the six months
from 1 July 2017 to 31 December 2017. If Good Buy had been acquired on 1 January 2017, revenue of
the Group for 2017 would have been $196 million. However, due to a lack of IFRS-specific data prior to
the acquisition of Good Buy, pro-forma profit or loss of the combined entity for the complete 2017
reporting period cannot be determined reliably.
32.3 Disposal of Highstreet Ltd
See Note 33.3 below.
33 Interests in subsidiaries
33.1 Composition of the Group
Set out below details of the subsidiaries held directly by the Group:
Name of the subsidiary
Country of the incorporation and principal place of business Principal activity
Proportion of ownership interests held by the Group
31 December 2018 31 December 2017
Goodtech Ltd Australia
Online retailer of computer and
telecommunications hardware 100% -
Good Buy Inc USA
Online retailer of computer and
telecommunications hardware 100% 100%
Tech Squad
Ltd Australia
Design and sale of phone and
intranet applications 80% 80%
Data Corp United Kingdom
Online sales of hardware and
software products 100% 100%
Highstreet Ltd United Kingdom
Design and sale of phone and
intranet applications - 100%
AASB 3.B64(f)(i)
AASB 3.B64(m)
AASB 3.B64(h)(i-iii)
AASB 3.67(e) AASB 136.133 AASB 3,B64(k)
AASB 3.B64(q(iii))
AASB 12.10(a)(i) AASB 12.12
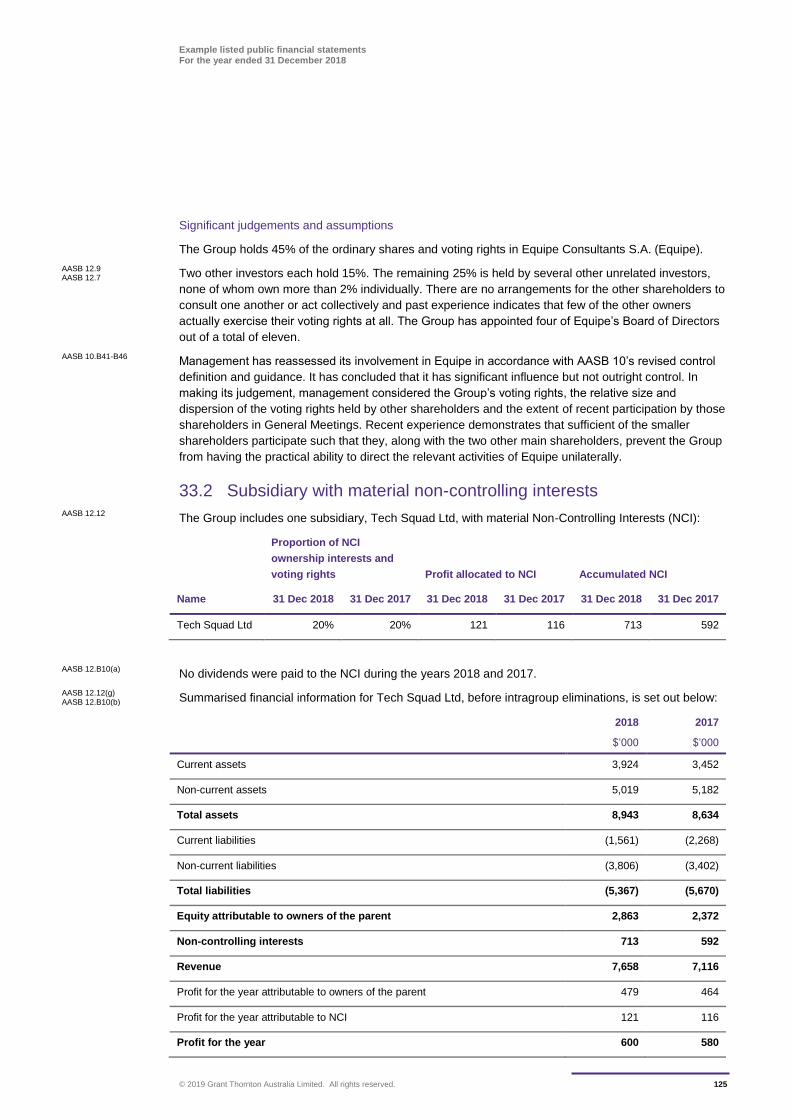
Example listed public financial statements For the year ended 31 December 2018
© 2019 Grant Thornton Australia Limited. All rights reserved. 125
Significant judgements and assumptions
The Group holds 45% of the ordinary shares and voting rights in Equipe Consultants S.A. (Equipe).
Two other investors each hold 15%. The remaining 25% is held by several other unrelated investors,
none of whom own more than 2% individually. There are no arrangements for the other shareholders to
consult one another or act collectively and past experience indicates that few of the other owners
actually exercise their voting rights at all. The Group has appointed four of Equipe’s Board of Directors
out of a total of eleven.
Management has reassessed its involvement in Equipe in accordance with AASB 10’s revised control
definition and guidance. It has concluded that it has significant influence but not outright control. In
making its judgement, management considered the Group’s voting rights, the relative size and
dispersion of the voting rights held by other shareholders and the extent of recent participation by those
shareholders in General Meetings. Recent experience demonstrates that sufficient of the smaller
shareholders participate such that they, along with the two other main shareholders, prevent the Group
from having the practical ability to direct the relevant activities of Equipe unilaterally.
33.2 Subsidiary with material non-controlling interests
The Group includes one subsidiary, Tech Squad Ltd, with material Non-Controlling Interests (NCI):
Name
Proportion of NCI
ownership interests and
voting rights Profit allocated to NCI Accumulated NCI
31 Dec 2018 31 Dec 2017 31 Dec 2018 31 Dec 2017 31 Dec 2018 31 Dec 2017
Tech Squad Ltd 20% 20% 121 116 713 592
No dividends were paid to the NCI during the years 2018 and 2017.
Summarised financial information for Tech Squad Ltd, before intragroup eliminations, is set out below:
2018 2017
$’000 $’000
Current assets 3,924 3,452
Non-current assets 5,019 5,182
Total assets 8,943 8,634
Current liabilities (1,561) (2,268)
Non-current liabilities (3,806) (3,402)
Total liabilities (5,367) (5,670)
Equity attributable to owners of the parent 2,863 2,372
Non-controlling interests 713 592
Revenue 7,658 7,116
Profit for the year attributable to owners of the parent 479 464
Profit for the year attributable to NCI 121 116
Profit for the year 600 580
AASB 12.9 AASB 12.7
AASB 10.B41-B46
AASB 12.12
AASB 12.B10(a)
AASB 12.12(g) AASB 12.B10(b)
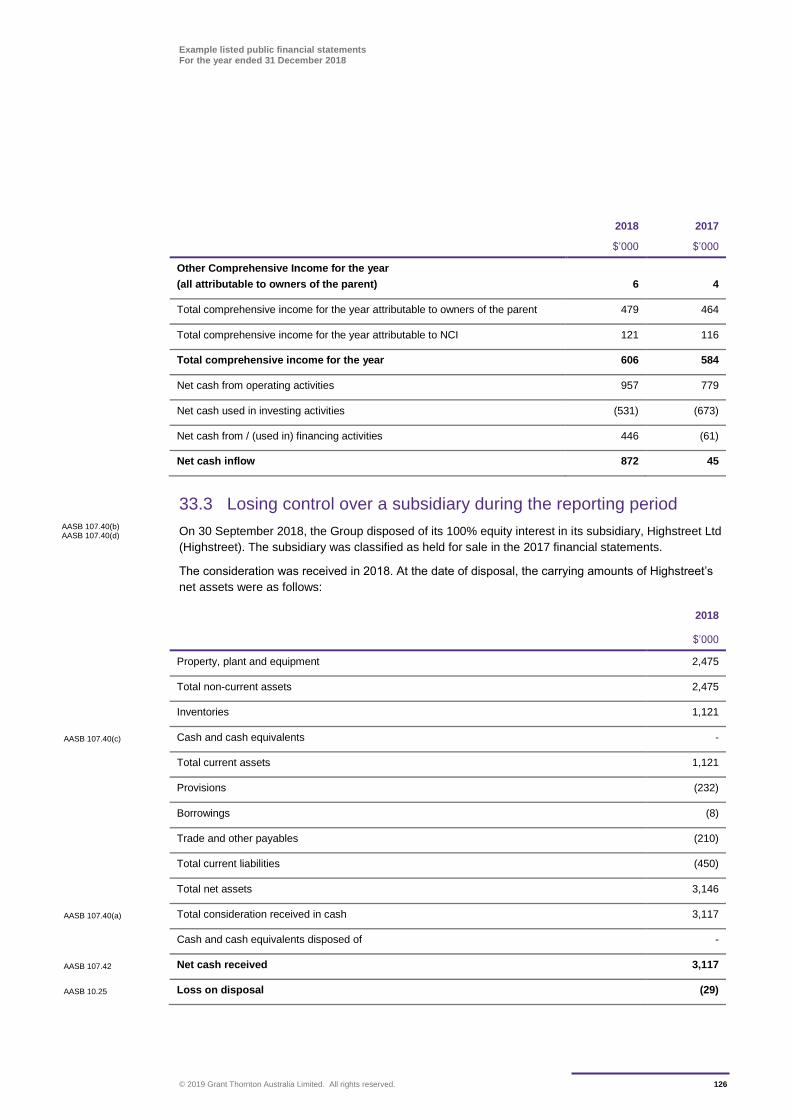
Example listed public financial statements For the year ended 31 December 2018
© 2019 Grant Thornton Australia Limited. All rights reserved. 126
2018 2017
$’000 $’000
Other Comprehensive Income for the year
(all attributable to owners of the parent) 6 4
Total comprehensive income for the year attributable to owners of the parent 479 464
Total comprehensive income for the year attributable to NCI 121 116
Total comprehensive income for the year 606 584
Net cash from operating activities 957 779
Net cash used in investing activities (531) (673)
Net cash from / (used in) financing activities 446 (61)
Net cash inflow 872 45
33.3 Losing control over a subsidiary during the reporting period
On 30 September 2018, the Group disposed of its 100% equity interest in its subsidiary, Highstreet Ltd
(Highstreet). The subsidiary was classified as held for sale in the 2017 financial statements.
The consideration was received in 2018. At the date of disposal, the carrying amounts of Highstreet’s
net assets were as follows:
2018
$’000
Property, plant and equipment 2,475
Total non-current assets 2,475
Inventories 1,121
AASB 107.40(c) Cash and cash equivalents -
Total current assets 1,121
Provisions (232)
Borrowings (8)
Trade and other payables (210)
Total current liabilities (450)
Total net assets 3,146
AASB 107.40(a) Total consideration received in cash 3,117
Cash and cash equivalents disposed of -
AASB 107.42 Net cash received 3,117
AASB 10.25 Loss on disposal (29)
AASB 107.40(b) AASB 107.40(d)
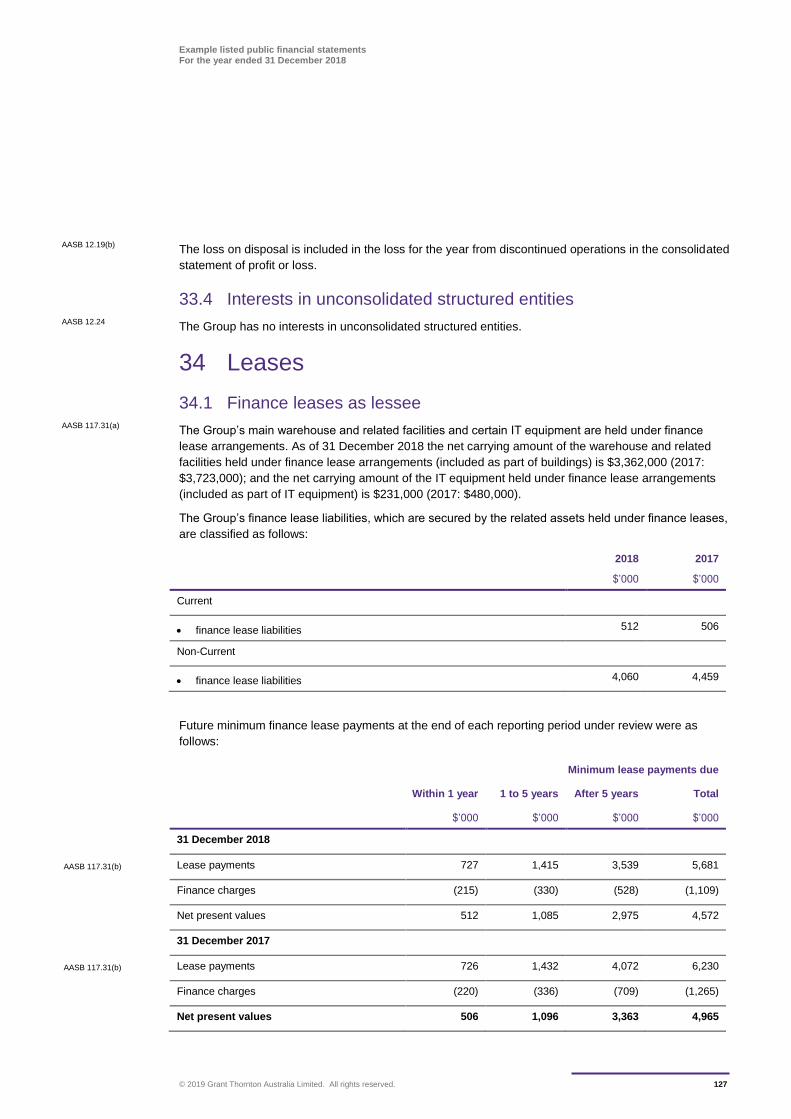
Example listed public financial statements For the year ended 31 December 2018
© 2019 Grant Thornton Australia Limited. All rights reserved. 127
The loss on disposal is included in the loss for the year from discontinued operations in the consolidated
statement of profit or loss.
33.4 Interests in unconsolidated structured entities
The Group has no interests in unconsolidated structured entities.
34 Leases
34.1 Finance leases as lessee
The Group’s main warehouse and related facilities and certain IT equipment are held under finance
lease arrangements. As of 31 December 2018 the net carrying amount of the warehouse and related
facilities held under finance lease arrangements (included as part of buildings) is $3,362,000 (2017:
$3,723,000); and the net carrying amount of the IT equipment held under finance lease arrangements
(included as part of IT equipment) is $231,000 (2017: $480,000).
The Group’s finance lease liabilities, which are secured by the related assets held under finance leases,
are classified as follows:
2018 2017
$’000 $’000
Current
finance lease liabilities 512 506
Non-Current
finance lease liabilities 4,060 4,459
Future minimum finance lease payments at the end of each reporting period under review were as
follows:
Minimum lease payments due
Within 1 year 1 to 5 years After 5 years Total
$’000 $’000 $’000 $’000
31 December 2018
AASB 117.31(b) Lease payments 727 1,415 3,539 5,681
Finance charges (215) (330) (528) (1,109)
Net present values 512 1,085 2,975 4,572
31 December 2017
AASB 117.31(b) Lease payments 726 1,432 4,072 6,230
Finance charges (220) (336) (709) (1,265)
Net present values 506 1,096 3,363 4,965
AASB 12.19(b)
AASB 12.24
AASB 117.31(a)
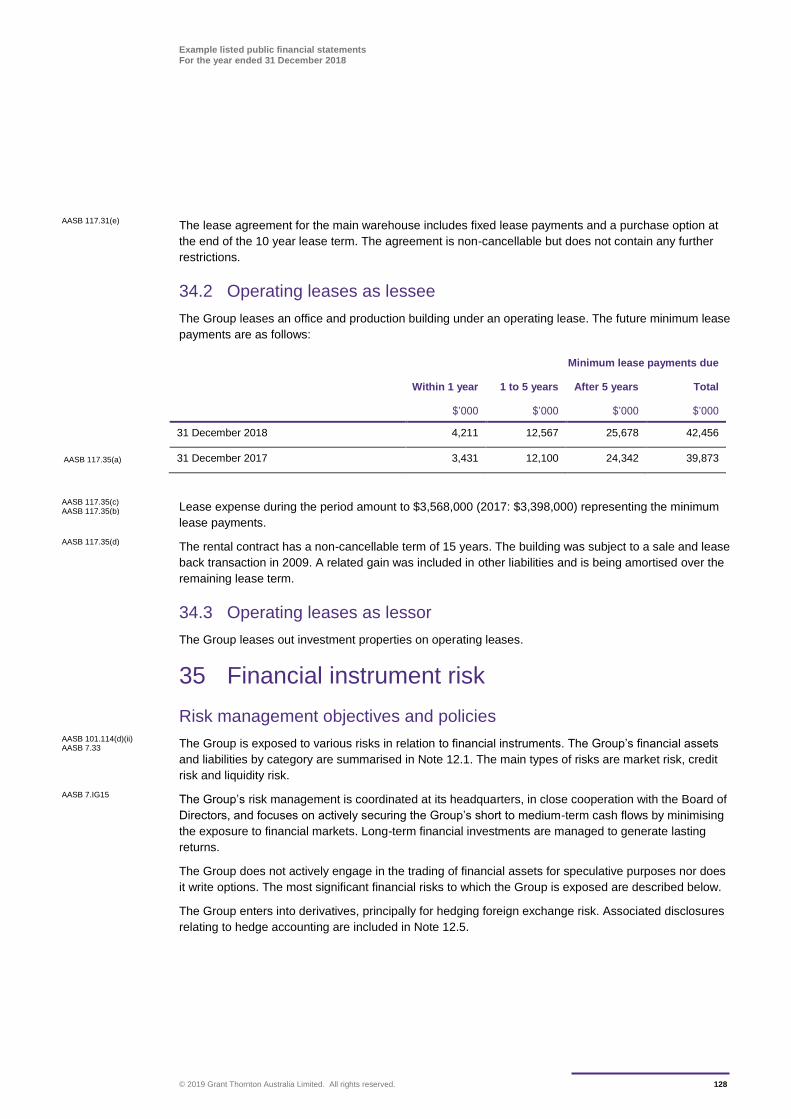
Example listed public financial statements For the year ended 31 December 2018
© 2019 Grant Thornton Australia Limited. All rights reserved. 128
The lease agreement for the main warehouse includes fixed lease payments and a purchase option at
the end of the 10 year lease term. The agreement is non-cancellable but does not contain any further
restrictions.
34.2 Operating leases as lessee
The Group leases an office and production building under an operating lease. The future minimum lease
payments are as follows:
Minimum lease payments due
Within 1 year 1 to 5 years After 5 years Total
$’000 $’000 $’000 $’000
31 December 2018 4,211 12,567 25,678 42,456
AASB 117.35(a) 31 December 2017 3,431 12,100 24,342 39,873
Lease expense during the period amount to $3,568,000 (2017: $3,398,000) representing the minimum
lease payments.
The rental contract has a non-cancellable term of 15 years. The building was subject to a sale and lease
back transaction in 2009. A related gain was included in other liabilities and is being amortised over the
remaining lease term.
34.3 Operating leases as lessor
The Group leases out investment properties on operating leases.
35 Financial instrument risk
Risk management objectives and policies
The Group is exposed to various risks in relation to financial instruments. The Group’s financial assets
and liabilities by category are summarised in Note 12.1. The main types of risks are market risk, credit
risk and liquidity risk.
The Group’s risk management is coordinated at its headquarters, in close cooperation with the Board of
Directors, and focuses on actively securing the Group’s short to medium-term cash flows by minimising
the exposure to financial markets. Long-term financial investments are managed to generate lasting
returns.
The Group does not actively engage in the trading of financial assets for speculative purposes nor does
it write options. The most significant financial risks to which the Group is exposed are described below.
The Group enters into derivatives, principally for hedging foreign exchange risk. Associated disclosures
relating to hedge accounting are included in Note 12.5.
AASB 117.31(e)
AASB 117.35(c) AASB 117.35(b)
AASB 117.35(d)
AASB 101.114(d)(ii) AASB 7.33
AASB 7.IG15
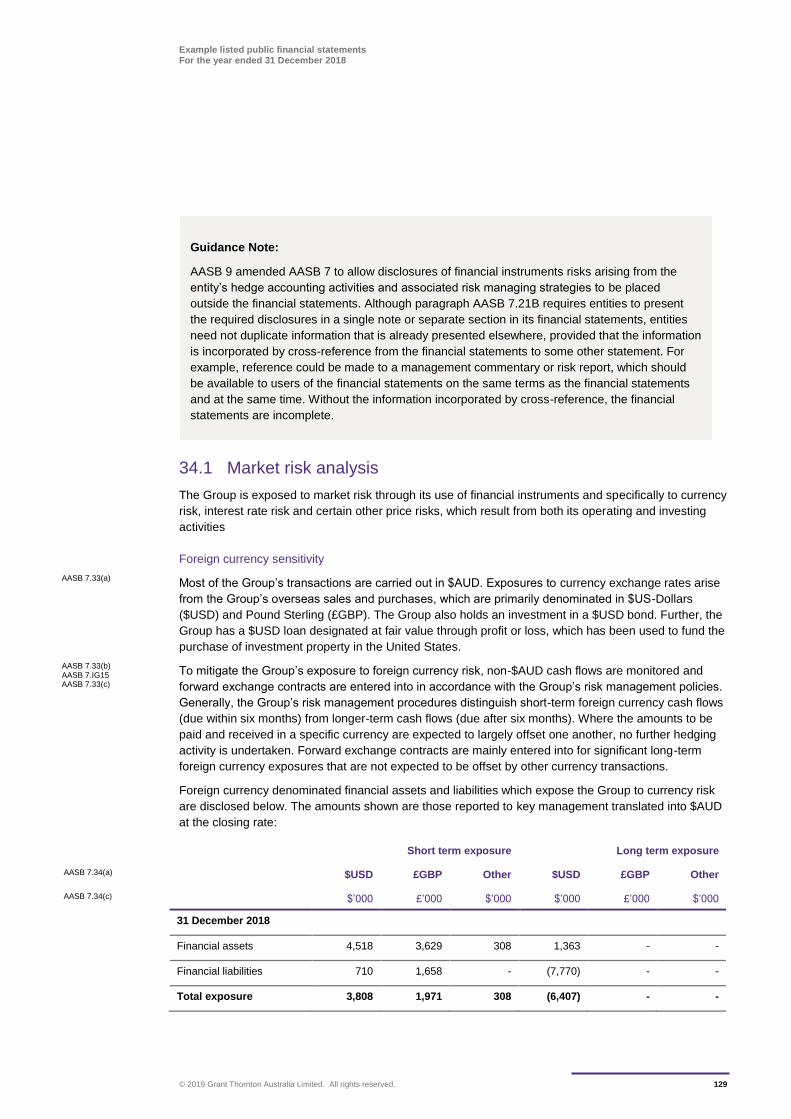
Example listed public financial statements For the year ended 31 December 2018
© 2019 Grant Thornton Australia Limited. All rights reserved. 129
34.1 Market risk analysis
The Group is exposed to market risk through its use of financial instruments and specifically to currency
risk, interest rate risk and certain other price risks, which result from both its operating and investing
activities
Foreign currency sensitivity
Most of the Group’s transactions are carried out in $AUD. Exposures to currency exchange rates arise
from the Group’s overseas sales and purchases, which are primarily denominated in $US-Dollars
($USD) and Pound Sterling (£GBP). The Group also holds an investment in a $USD bond. Further, the
Group has a $USD loan designated at fair value through profit or loss, which has been used to fund the
purchase of investment property in the United States.
To mitigate the Group’s exposure to foreign currency risk, non-$AUD cash flows are monitored and
forward exchange contracts are entered into in accordance with the Group’s risk management policies.
Generally, the Group’s risk management procedures distinguish short-term foreign currency cash flows
(due within six months) from longer-term cash flows (due after six months). Where the amounts to be
paid and received in a specific currency are expected to largely offset one another, no further hedging
activity is undertaken. Forward exchange contracts are mainly entered into for significant long-term
foreign currency exposures that are not expected to be offset by other currency transactions.
Foreign currency denominated financial assets and liabilities which expose the Group to currency risk
are disclosed below. The amounts shown are those reported to key management translated into $AUD
at the closing rate:
Short term exposure Long term exposure
AASB 7.34(a) $USD £GBP Other $USD £GBP Other
AASB 7.34(c) $’000 £’000 $’000 $’000 £’000 $’000
31 December 2018
Financial assets 4,518 3,629 308 1,363 - -
Financial liabilities 710 1,658 - (7,770) - -
Total exposure 3,808 1,971 308 (6,407) - -
AASB 7.33(a)
AASB 7.33(b) AASB 7.IG15 AASB 7.33(c)
Guidance Note:
AASB 9 amended AASB 7 to allow disclosures of financial instruments risks arising from the
entity’s hedge accounting activities and associated risk managing strategies to be placed
outside the financial statements. Although paragraph AASB 7.21B requires entities to present
the required disclosures in a single note or separate section in its financial statements, entities
need not duplicate information that is already presented elsewhere, provided that the information
is incorporated by cross-reference from the financial statements to some other statement. For
example, reference could be made to a management commentary or risk report, which should
be available to users of the financial statements on the same terms as the financial statements
and at the same time. Without the information incorporated by cross-reference, the financial
statements are incomplete.
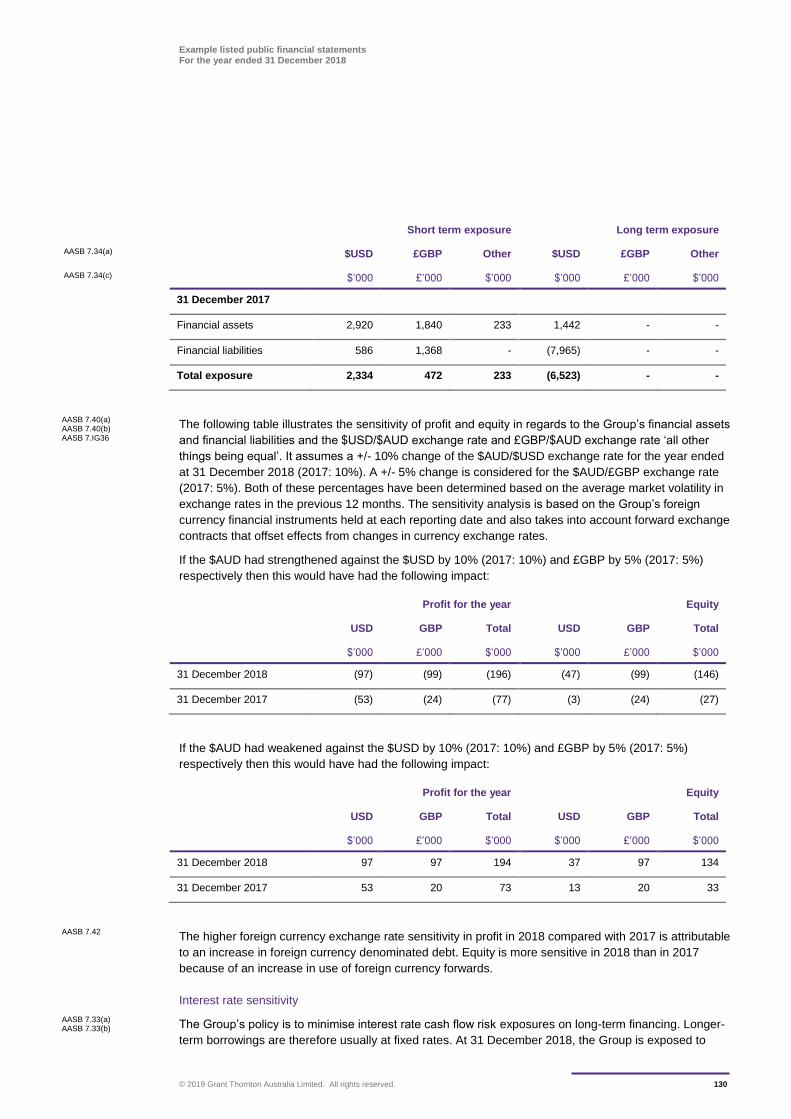
Example listed public financial statements For the year ended 31 December 2018
© 2019 Grant Thornton Australia Limited. All rights reserved. 130
Short term exposure Long term exposure
AASB 7.34(a) $USD £GBP Other $USD £GBP Other
AASB 7.34(c) $’000 £’000 $’000 $’000 £’000 $’000
31 December 2017
Financial assets 2,920 1,840 233 1,442 - -
Financial liabilities 586 1,368 - (7,965) - -
Total exposure 2,334 472 233 (6,523) - -
The following table illustrates the sensitivity of profit and equity in regards to the Group’s financial assets
and financial liabilities and the $USD/$AUD exchange rate and £GBP/$AUD exchange rate ‘all other
things being equal’. It assumes a +/- 10% change of the $AUD/$USD exchange rate for the year ended
at 31 December 2018 (2017: 10%). A +/- 5% change is considered for the $AUD/£GBP exchange rate
(2017: 5%). Both of these percentages have been determined based on the average market volatility in
exchange rates in the previous 12 months. The sensitivity analysis is based on the Group’s foreign
currency financial instruments held at each reporting date and also takes into account forward exchange
contracts that offset effects from changes in currency exchange rates.
If the $AUD had strengthened against the $USD by 10% (2017: 10%) and £GBP by 5% (2017: 5%)
respectively then this would have had the following impact:
Profit for the year Equity
USD GBP Total USD GBP Total
$’000 £’000 $’000 $’000 £’000 $’000
31 December 2018 (97) (99) (196) (47) (99) (146)
31 December 2017 (53) (24) (77) (3) (24) (27)
If the $AUD had weakened against the $USD by 10% (2017: 10%) and £GBP by 5% (2017: 5%)
respectively then this would have had the following impact:
Profit for the year Equity
USD GBP Total USD GBP Total
$’000 £’000 $’000 $’000 £’000 $’000
31 December 2018 97 97 194 37 97 134
31 December 2017 53 20 73 13 20 33
The higher foreign currency exchange rate sensitivity in profit in 2018 compared with 2017 is attributable
to an increase in foreign currency denominated debt. Equity is more sensitive in 2018 than in 2017
because of an increase in use of foreign currency forwards.
Interest rate sensitivity
The Group’s policy is to minimise interest rate cash flow risk exposures on long-term financing. Longer-
term borrowings are therefore usually at fixed rates. At 31 December 2018, the Group is exposed to
AASB 7.40(a) AASB 7.40(b) AASB 7.IG36
AASB 7.42
AASB 7.33(a) AASB 7.33(b)
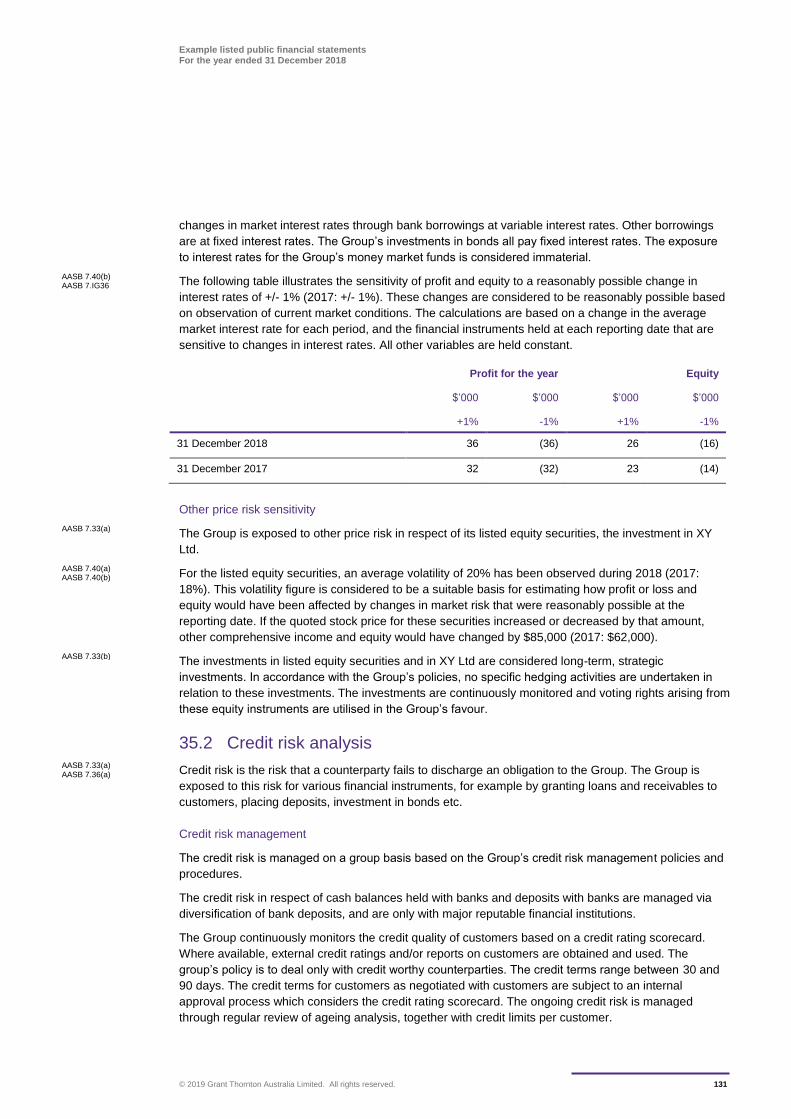
Example listed public financial statements For the year ended 31 December 2018
© 2019 Grant Thornton Australia Limited. All rights reserved. 131
changes in market interest rates through bank borrowings at variable interest rates. Other borrowings
are at fixed interest rates. The Group’s investments in bonds all pay fixed interest rates. The exposure
to interest rates for the Group’s money market funds is considered immaterial.
The following table illustrates the sensitivity of profit and equity to a reasonably possible change in
interest rates of +/- 1% (2017: +/- 1%). These changes are considered to be reasonably possible based
on observation of current market conditions. The calculations are based on a change in the average
market interest rate for each period, and the financial instruments held at each reporting date that are
sensitive to changes in interest rates. All other variables are held constant.
Profit for the year Equity
$’000 $’000 $’000 $’000
+1% -1% +1% -1%
31 December 2018 36 (36) 26 (16)
31 December 2017 32 (32) 23 (14)
Other price risk sensitivity
The Group is exposed to other price risk in respect of its listed equity securities, the investment in XY
Ltd.
For the listed equity securities, an average volatility of 20% has been observed during 2018 (2017:
18%). This volatility figure is considered to be a suitable basis for estimating how profit or loss and
equity would have been affected by changes in market risk that were reasonably possible at the
reporting date. If the quoted stock price for these securities increased or decreased by that amount,
other comprehensive income and equity would have changed by $85,000 (2017: $62,000).
The investments in listed equity securities and in XY Ltd are considered long-term, strategic
investments. In accordance with the Group’s policies, no specific hedging activities are undertaken in
relation to these investments. The investments are continuously monitored and voting rights arising from
these equity instruments are utilised in the Group’s favour.
35.2 Credit risk analysis
Credit risk is the risk that a counterparty fails to discharge an obligation to the Group. The Group is
exposed to this risk for various financial instruments, for example by granting loans and receivables to
customers, placing deposits, investment in bonds etc.
Credit risk management
The credit risk is managed on a group basis based on the Group’s credit risk management policies and
procedures.
The credit risk in respect of cash balances held with banks and deposits with banks are managed via
diversification of bank deposits, and are only with major reputable financial institutions.
The Group continuously monitors the credit quality of customers based on a credit rating scorecard.
Where available, external credit ratings and/or reports on customers are obtained and used. The
group’s policy is to deal only with credit worthy counterparties. The credit terms range between 30 and
90 days. The credit terms for customers as negotiated with customers are subject to an internal
approval process which considers the credit rating scorecard. The ongoing credit risk is managed
through regular review of ageing analysis, together with credit limits per customer.
AASB 7.40(b) AASB 7.IG36
AASB 7.33(a)
AASB 7.40(a) AASB 7.40(b)
AASB 7.33(b)
AASB 7.33(a) AASB 7.36(a)
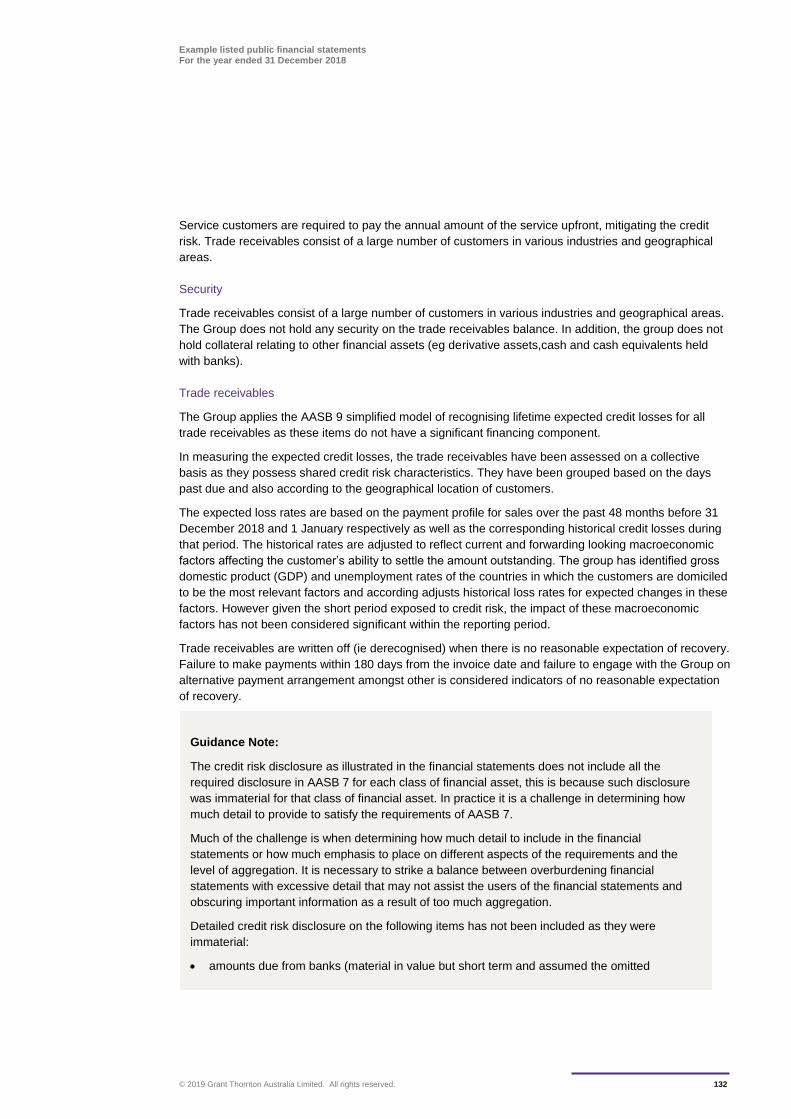
Example listed public financial statements For the year ended 31 December 2018
© 2019 Grant Thornton Australia Limited. All rights reserved. 132
Service customers are required to pay the annual amount of the service upfront, mitigating the credit
risk. Trade receivables consist of a large number of customers in various industries and geographical
areas.
Security
Trade receivables consist of a large number of customers in various industries and geographical areas.
The Group does not hold any security on the trade receivables balance. In addition, the group does not
hold collateral relating to other financial assets (eg derivative assets,cash and cash equivalents held
with banks).
Trade receivables
The Group applies the AASB 9 simplified model of recognising lifetime expected credit losses for all
trade receivables as these items do not have a significant financing component.
In measuring the expected credit losses, the trade receivables have been assessed on a collective
basis as they possess shared credit risk characteristics. They have been grouped based on the days
past due and also according to the geographical location of customers.
The expected loss rates are based on the payment profile for sales over the past 48 months before 31
December 2018 and 1 January respectively as well as the corresponding historical credit losses during
that period. The historical rates are adjusted to reflect current and forwarding looking macroeconomic
factors affecting the customer’s ability to settle the amount outstanding. The group has identified gross
domestic product (GDP) and unemployment rates of the countries in which the customers are domiciled
to be the most relevant factors and according adjusts historical loss rates for expected changes in these
factors. However given the short period exposed to credit risk, the impact of these macroeconomic
factors has not been considered significant within the reporting period.
Trade receivables are written off (ie derecognised) when there is no reasonable expectation of recovery.
Failure to make payments within 180 days from the invoice date and failure to engage with the Group on
alternative payment arrangement amongst other is considered indicators of no reasonable expectation
of recovery.
Guidance Note:
The credit risk disclosure as illustrated in the financial statements does not include all the
required disclosure in AASB 7 for each class of financial asset, this is because such disclosure
was immaterial for that class of financial asset. In practice it is a challenge in determining how
much detail to provide to satisfy the requirements of AASB 7.
Much of the challenge is when determining how much detail to include in the financial
statements or how much emphasis to place on different aspects of the requirements and the
level of aggregation. It is necessary to strike a balance between overburdening financial
statements with excessive detail that may not assist the users of the financial statements and
obscuring important information as a result of too much aggregation.
Detailed credit risk disclosure on the following items has not been included as they were
immaterial:
amounts due from banks (material in value but short term and assumed the omitted
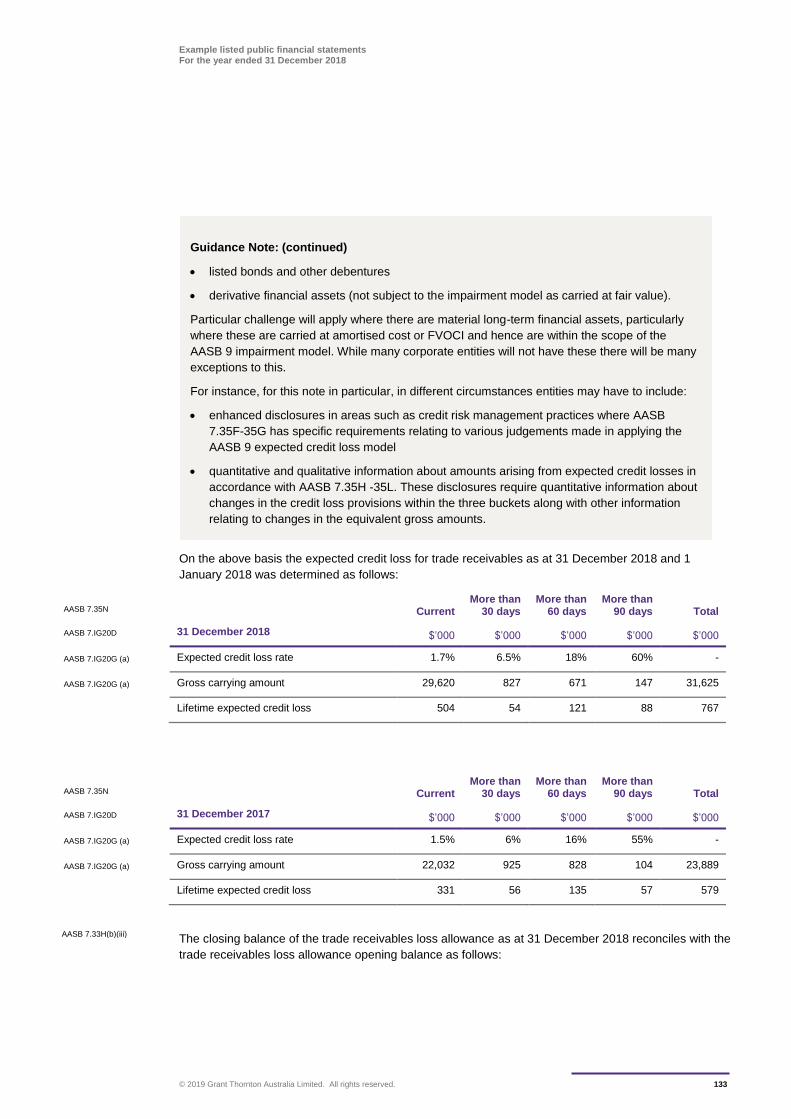
Example listed public financial statements For the year ended 31 December 2018
© 2019 Grant Thornton Australia Limited. All rights reserved. 133
On the above basis the expected credit loss for trade receivables as at 31 December 2018 and 1
January 2018 was determined as follows:
AASB 7.35N
Current More than
30 days More than
60 days More than
90 days Total
AASB 7.IG20D 31 December 2018 $’000 $’000 $’000 $’000 $’000
AASB 7.IG20G (a) Expected credit loss rate 1.7% 6.5% 18% 60% -
AASB 7.IG20G (a) Gross carrying amount 29,620 827 671 147 31,625
Lifetime expected credit loss 504 54 121 88 767
AASB 7.35N
Current More than
30 days More than
60 days More than
90 days Total
AASB 7.IG20D 31 December 2017 $’000 $’000 $’000 $’000 $’000
AASB 7.IG20G (a) Expected credit loss rate 1.5% 6% 16% 55% -
AASB 7.IG20G (a) Gross carrying amount 22,032 925 828 104 23,889
Lifetime expected credit loss 331 56 135 57 579
The closing balance of the trade receivables loss allowance as at 31 December 2018 reconciles with the
trade receivables loss allowance opening balance as follows:
AASB 7.33H(b)(iii)
Guidance Note: (continued)
listed bonds and other debentures
derivative financial assets (not subject to the impairment model as carried at fair value).
Particular challenge will apply where there are material long-term financial assets, particularly
where these are carried at amortised cost or FVOCI and hence are within the scope of the
AASB 9 impairment model. While many corporate entities will not have these there will be many
exceptions to this.
For instance, for this note in particular, in different circumstances entities may have to include:
enhanced disclosures in areas such as credit risk management practices where AASB
7.35F-35G has specific requirements relating to various judgements made in applying the
AASB 9 expected credit loss model
quantitative and qualitative information about amounts arising from expected credit losses in
accordance with AASB 7.35H -35L. These disclosures require quantitative information about
changes in the credit loss provisions within the three buckets along with other information
relating to changes in the equivalent gross amounts.
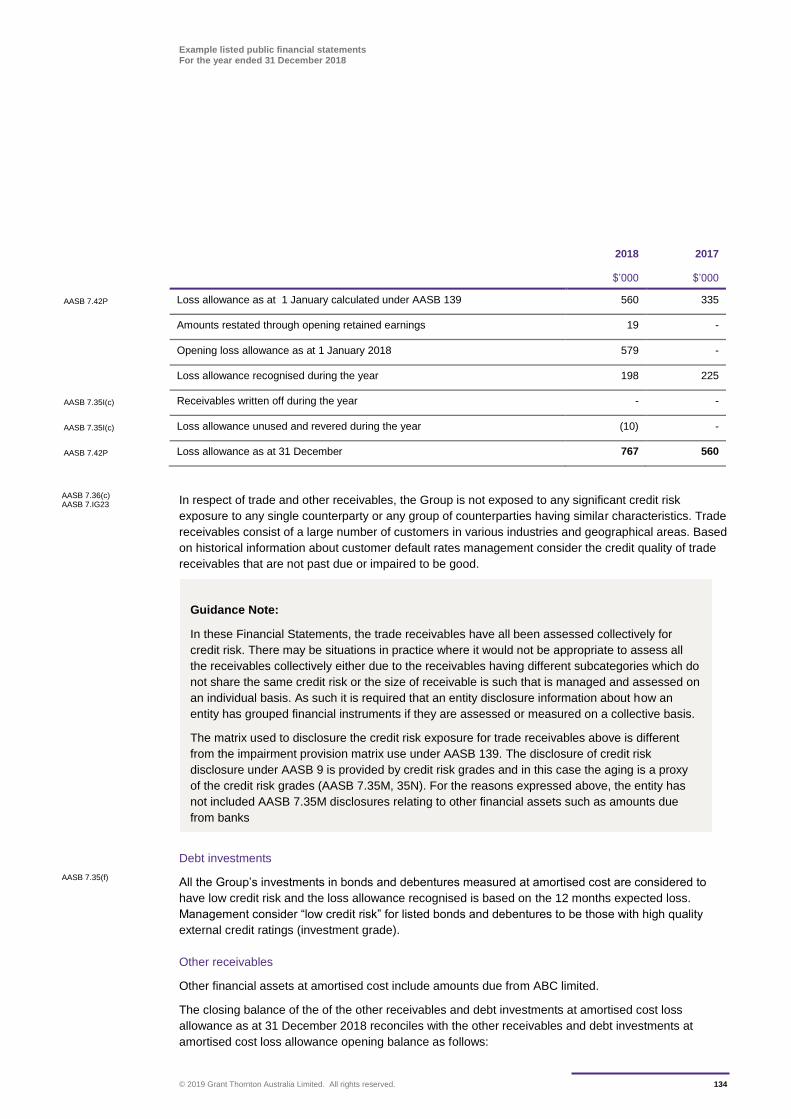
Example listed public financial statements For the year ended 31 December 2018
© 2019 Grant Thornton Australia Limited. All rights reserved. 134
2018 2017
$’000 $’000
AASB 7.42P Loss allowance as at 1 January calculated under AASB 139 560 335
Amounts restated through opening retained earnings 19 -
Opening loss allowance as at 1 January 2018 579 -
Loss allowance recognised during the year 198 225
AASB 7.35I(c) Receivables written off during the year - -
AASB 7.35I(c) Loss allowance unused and revered during the year (10) -
AASB 7.42P Loss allowance as at 31 December 767 560
In respect of trade and other receivables, the Group is not exposed to any significant credit risk
exposure to any single counterparty or any group of counterparties having similar characteristics. Trade
receivables consist of a large number of customers in various industries and geographical areas. Based
on historical information about customer default rates management consider the credit quality of trade
receivables that are not past due or impaired to be good.
Debt investments
All the Group’s investments in bonds and debentures measured at amortised cost are considered to
have low credit risk and the loss allowance recognised is based on the 12 months expected loss.
Management consider “low credit risk” for listed bonds and debentures to be those with high quality
external credit ratings (investment grade).
Other receivables
Other financial assets at amortised cost include amounts due from ABC limited.
The closing balance of the of the other receivables and debt investments at amortised cost loss
allowance as at 31 December 2018 reconciles with the other receivables and debt investments at
amortised cost loss allowance opening balance as follows:
AASB 7.36(c) AASB 7.IG23
AASB 7.35(f)
Guidance Note:
In these Financial Statements, the trade receivables have all been assessed collectively for
credit risk. There may be situations in practice where it would not be appropriate to assess all
the receivables collectively either due to the receivables having different subcategories which do
not share the same credit risk or the size of receivable is such that is managed and assessed on
an individual basis. As such it is required that an entity disclosure information about how an
entity has grouped financial instruments if they are assessed or measured on a collective basis.
The matrix used to disclosure the credit risk exposure for trade receivables above is different
from the impairment provision matrix use under AASB 139. The disclosure of credit risk
disclosure under AASB 9 is provided by credit risk grades and in this case the aging is a proxy
of the credit risk grades (AASB 7.35M, 35N). For the reasons expressed above, the entity has
not included AASB 7.35M disclosures relating to other financial assets such as amounts due
from banks
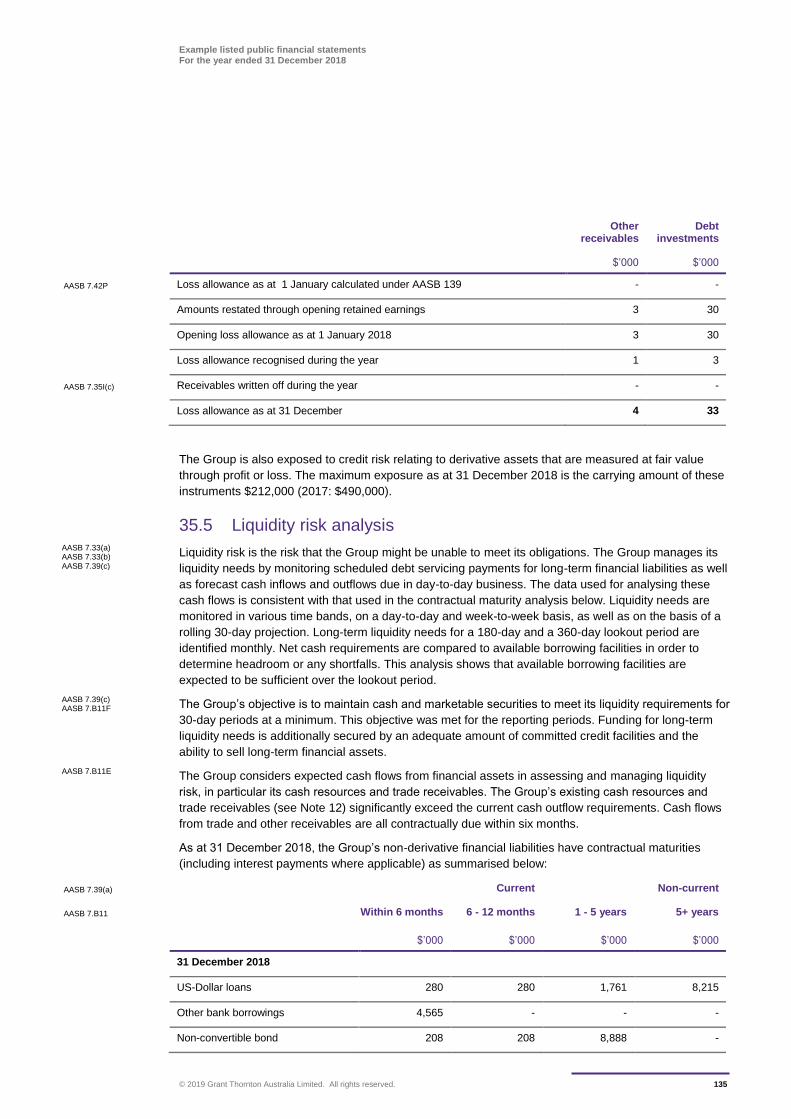
Example listed public financial statements For the year ended 31 December 2018
© 2019 Grant Thornton Australia Limited. All rights reserved. 135
Other receivables
Debt investments
$’000 $’000
AASB 7.42P Loss allowance as at 1 January calculated under AASB 139 - -
Amounts restated through opening retained earnings 3 30
Opening loss allowance as at 1 January 2018 3 30
Loss allowance recognised during the year 1 3
AASB 7.35I(c) Receivables written off during the year - -
Loss allowance as at 31 December 4 33
The Group is also exposed to credit risk relating to derivative assets that are measured at fair value
through profit or loss. The maximum exposure as at 31 December 2018 is the carrying amount of these
instruments $212,000 (2017: $490,000).
35.5 Liquidity risk analysis
Liquidity risk is the risk that the Group might be unable to meet its obligations. The Group manages its
liquidity needs by monitoring scheduled debt servicing payments for long-term financial liabilities as well
as forecast cash inflows and outflows due in day-to-day business. The data used for analysing these
cash flows is consistent with that used in the contractual maturity analysis below. Liquidity needs are
monitored in various time bands, on a day-to-day and week-to-week basis, as well as on the basis of a
rolling 30-day projection. Long-term liquidity needs for a 180-day and a 360-day lookout period are
identified monthly. Net cash requirements are compared to available borrowing facilities in order to
determine headroom or any shortfalls. This analysis shows that available borrowing facilities are
expected to be sufficient over the lookout period.
The Group’s objective is to maintain cash and marketable securities to meet its liquidity requirements for
30-day periods at a minimum. This objective was met for the reporting periods. Funding for long-term
liquidity needs is additionally secured by an adequate amount of committed credit facilities and the
ability to sell long-term financial assets.
The Group considers expected cash flows from financial assets in assessing and managing liquidity
risk, in particular its cash resources and trade receivables. The Group’s existing cash resources and
trade receivables (see Note 12) significantly exceed the current cash outflow requirements. Cash flows
from trade and other receivables are all contractually due within six months.
As at 31 December 2018, the Group’s non-derivative financial liabilities have contractual maturities
(including interest payments where applicable) as summarised below:
AASB 7.39(a) Current Non-current
AASB 7.B11 Within 6 months 6 - 12 months 1 - 5 years 5+ years
$’000 $’000 $’000 $’000
31 December 2018
US-Dollar loans 280 280 1,761 8,215
Other bank borrowings 4,565 - - -
Non-convertible bond 208 208 8,888 -
AASB 7.33(a) AASB 7.33(b) AASB 7.39(c)
AASB 7.39(c) AASB 7.B11F
AASB 7.B11E
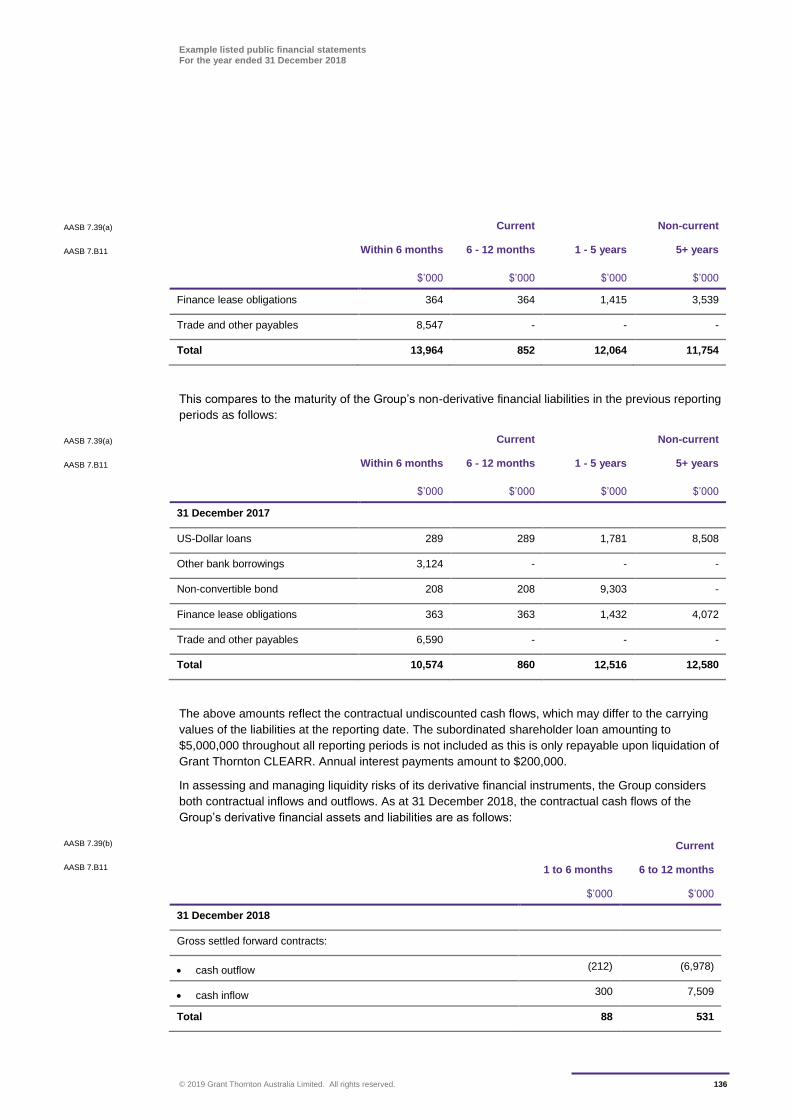
Example listed public financial statements For the year ended 31 December 2018
© 2019 Grant Thornton Australia Limited. All rights reserved. 136
AASB 7.39(a) Current Non-current
AASB 7.B11 Within 6 months 6 - 12 months 1 - 5 years 5+ years
$’000 $’000 $’000 $’000
Finance lease obligations 364 364 1,415 3,539
Trade and other payables 8,547 - - -
Total 13,964 852 12,064 11,754
This compares to the maturity of the Group’s non-derivative financial liabilities in the previous reporting
periods as follows:
AASB 7.39(a) Current Non-current
AASB 7.B11 Within 6 months 6 - 12 months 1 - 5 years 5+ years
$’000 $’000 $’000 $’000
31 December 2017
US-Dollar loans 289 289 1,781 8,508
Other bank borrowings 3,124 - - -
Non-convertible bond 208 208 9,303 -
Finance lease obligations 363 363 1,432 4,072
Trade and other payables 6,590 - - -
Total 10,574 860 12,516 12,580
The above amounts reflect the contractual undiscounted cash flows, which may differ to the carrying
values of the liabilities at the reporting date. The subordinated shareholder loan amounting to
$5,000,000 throughout all reporting periods is not included as this is only repayable upon liquidation of
Grant Thornton CLEARR. Annual interest payments amount to $200,000.
In assessing and managing liquidity risks of its derivative financial instruments, the Group considers
both contractual inflows and outflows. As at 31 December 2018, the contractual cash flows of the
Group’s derivative financial assets and liabilities are as follows:
AASB 7.39(b) Current
AASB 7.B11 1 to 6 months 6 to 12 months
$’000 $’000
31 December 2018
Gross settled forward contracts:
cash outflow (212) (6,978)
cash inflow 300 7,509
Total 88 531
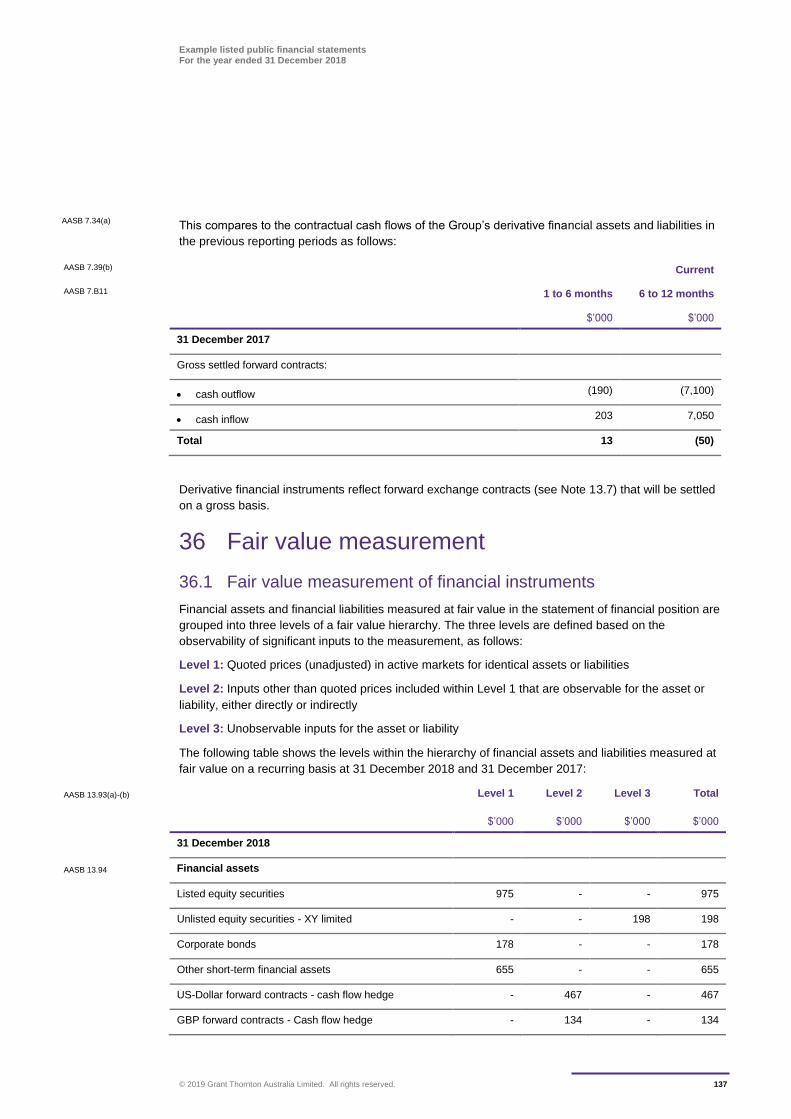
Example listed public financial statements For the year ended 31 December 2018
© 2019 Grant Thornton Australia Limited. All rights reserved. 137
This compares to the contractual cash flows of the Group’s derivative financial assets and liabilities in
the previous reporting periods as follows:
AASB 7.39(b) Current
AASB 7.B11 1 to 6 months 6 to 12 months
$’000 $’000
31 December 2017
Gross settled forward contracts:
cash outflow (190) (7,100)
cash inflow 203 7,050
Total 13 (50)
Derivative financial instruments reflect forward exchange contracts (see Note 13.7) that will be settled
on a gross basis.
36 Fair value measurement
36.1 Fair value measurement of financial instruments
Financial assets and financial liabilities measured at fair value in the statement of financial position are
grouped into three levels of a fair value hierarchy. The three levels are defined based on the
observability of significant inputs to the measurement, as follows:
Level 1: Quoted prices (unadjusted) in active markets for identical assets or liabilities
Level 2: Inputs other than quoted prices included within Level 1 that are observable for the asset or
liability, either directly or indirectly
Level 3: Unobservable inputs for the asset or liability
The following table shows the levels within the hierarchy of financial assets and liabilities measured at
fair value on a recurring basis at 31 December 2018 and 31 December 2017:
AASB 13.93(a)-(b) Level 1 Level 2 Level 3 Total
$’000 $’000 $’000 $’000
31 December 2018
AASB 13.94 Financial assets
Listed equity securities 975 - - 975
Unlisted equity securities - XY limited - - 198 198
Corporate bonds 178 - - 178
Other short-term financial assets 655 - - 655
US-Dollar forward contracts - cash flow hedge - 467 - 467
GBP forward contracts - Cash flow hedge - 134 - 134
AASB 7.34(a)
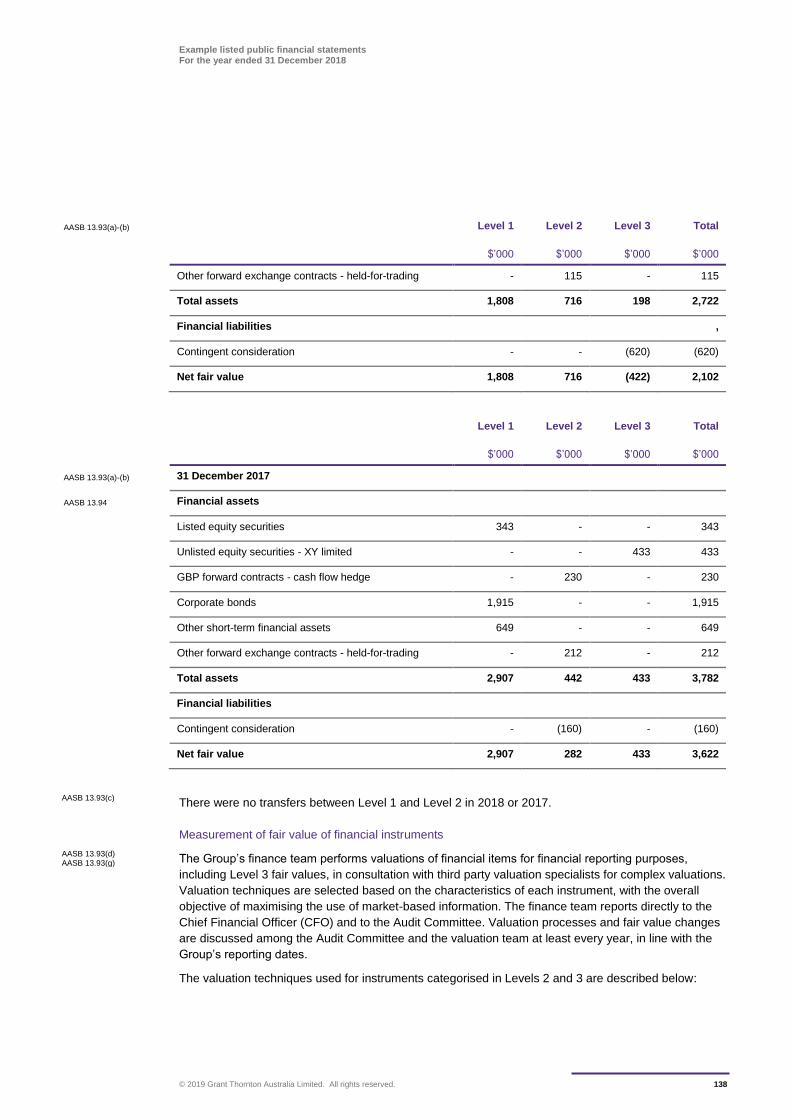
Example listed public financial statements For the year ended 31 December 2018
© 2019 Grant Thornton Australia Limited. All rights reserved. 138
AASB 13.93(a)-(b) Level 1 Level 2 Level 3 Total
$’000 $’000 $’000 $’000
Other forward exchange contracts - held-for-trading - 115 - 115
Total assets 1,808 716 198 2,722
Financial liabilities ,
Contingent consideration - - (620) (620)
Net fair value 1,808 716 (422) 2,102
Level 1 Level 2 Level 3 Total
$’000 $’000 $’000 $’000
AASB 13.93(a)-(b) 31 December 2017
AASB 13.94 Financial assets
Listed equity securities 343 - - 343
Unlisted equity securities - XY limited - - 433 433
GBP forward contracts - cash flow hedge - 230 - 230
Corporate bonds 1,915 - - 1,915
Other short-term financial assets 649 - - 649
Other forward exchange contracts - held-for-trading - 212 - 212
Total assets 2,907 442 433 3,782
Financial liabilities
Contingent consideration - (160) - (160)
Net fair value 2,907 282 433 3,622
There were no transfers between Level 1 and Level 2 in 2018 or 2017.
Measurement of fair value of financial instruments
The Group’s finance team performs valuations of financial items for financial reporting purposes,
including Level 3 fair values, in consultation with third party valuation specialists for complex valuations.
Valuation techniques are selected based on the characteristics of each instrument, with the overall
objective of maximising the use of market-based information. The finance team reports directly to the
Chief Financial Officer (CFO) and to the Audit Committee. Valuation processes and fair value changes
are discussed among the Audit Committee and the valuation team at least every year, in line with the
Group’s reporting dates.
The valuation techniques used for instruments categorised in Levels 2 and 3 are described below:
AASB 13.93(c)
AASB 13.93(d) AASB 13.93(g)
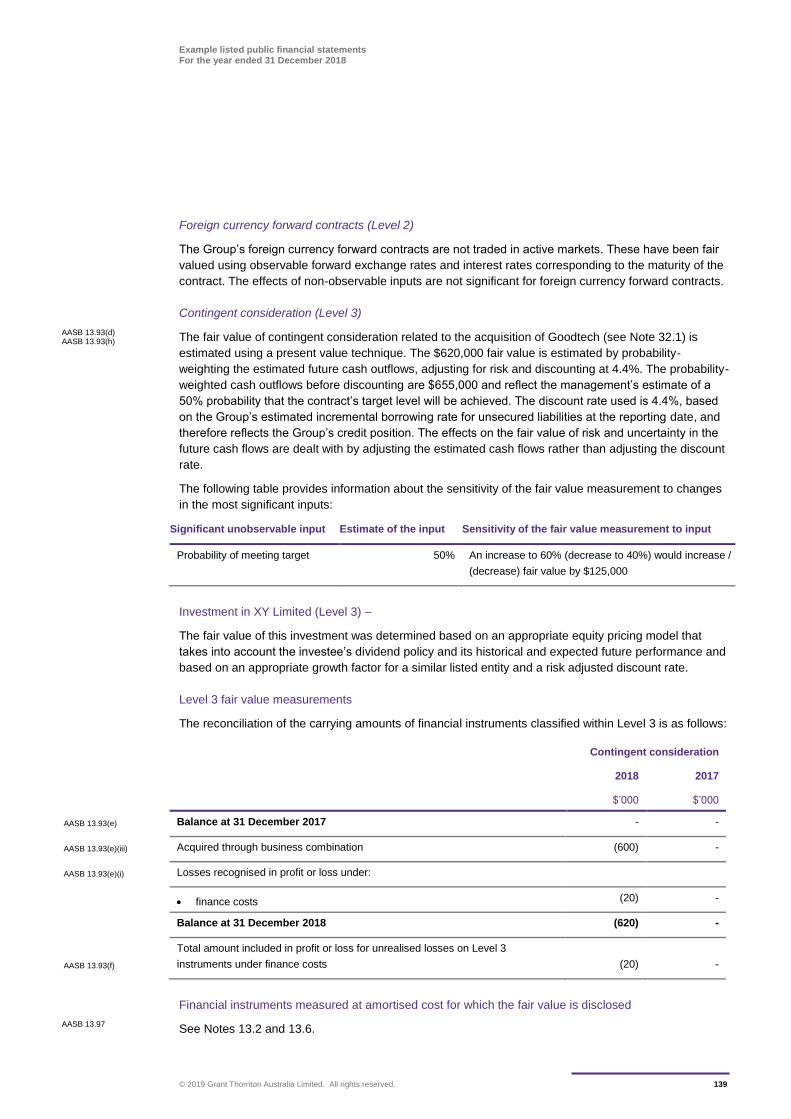
Example listed public financial statements For the year ended 31 December 2018
© 2019 Grant Thornton Australia Limited. All rights reserved. 139
Foreign currency forward contracts (Level 2)
The Group’s foreign currency forward contracts are not traded in active markets. These have been fair
valued using observable forward exchange rates and interest rates corresponding to the maturity of the
contract. The effects of non-observable inputs are not significant for foreign currency forward contracts.
Contingent consideration (Level 3)
The fair value of contingent consideration related to the acquisition of Goodtech (see Note 32.1) is
estimated using a present value technique. The $620,000 fair value is estimated by probability-
weighting the estimated future cash outflows, adjusting for risk and discounting at 4.4%. The probability-
weighted cash outflows before discounting are $655,000 and reflect the management’s estimate of a
50% probability that the contract’s target level will be achieved. The discount rate used is 4.4%, based
on the Group’s estimated incremental borrowing rate for unsecured liabilities at the reporting date, and
therefore reflects the Group’s credit position. The effects on the fair value of risk and uncertainty in the
future cash flows are dealt with by adjusting the estimated cash flows rather than adjusting the discount
rate.
The following table provides information about the sensitivity of the fair value measurement to changes
in the most significant inputs:
Significant unobservable input Estimate of the input Sensitivity of the fair value measurement to input
Probability of meeting target 50% An increase to 60% (decrease to 40%) would increase /
(decrease) fair value by $125,000
Investment in XY Limited (Level 3) –
The fair value of this investment was determined based on an appropriate equity pricing model that
takes into account the investee’s dividend policy and its historical and expected future performance and
based on an appropriate growth factor for a similar listed entity and a risk adjusted discount rate.
Level 3 fair value measurements
The reconciliation of the carrying amounts of financial instruments classified within Level 3 is as follows:
Contingent consideration
2018 2017
$’000 $’000
AASB 13.93(e) Balance at 31 December 2017 - -
AASB 13.93(e)(iii) Acquired through business combination (600) -
AASB 13.93(e)(i) Losses recognised in profit or loss under:
finance costs (20) -
Balance at 31 December 2018 (620) -
AASB 13.93(f)
Total amount included in profit or loss for unrealised losses on Level 3
instruments under finance costs (20) -
Financial instruments measured at amortised cost for which the fair value is disclosed
See Notes 13.2 and 13.6.
AASB 13.93(d) AASB 13.93(h)
AASB 13.97
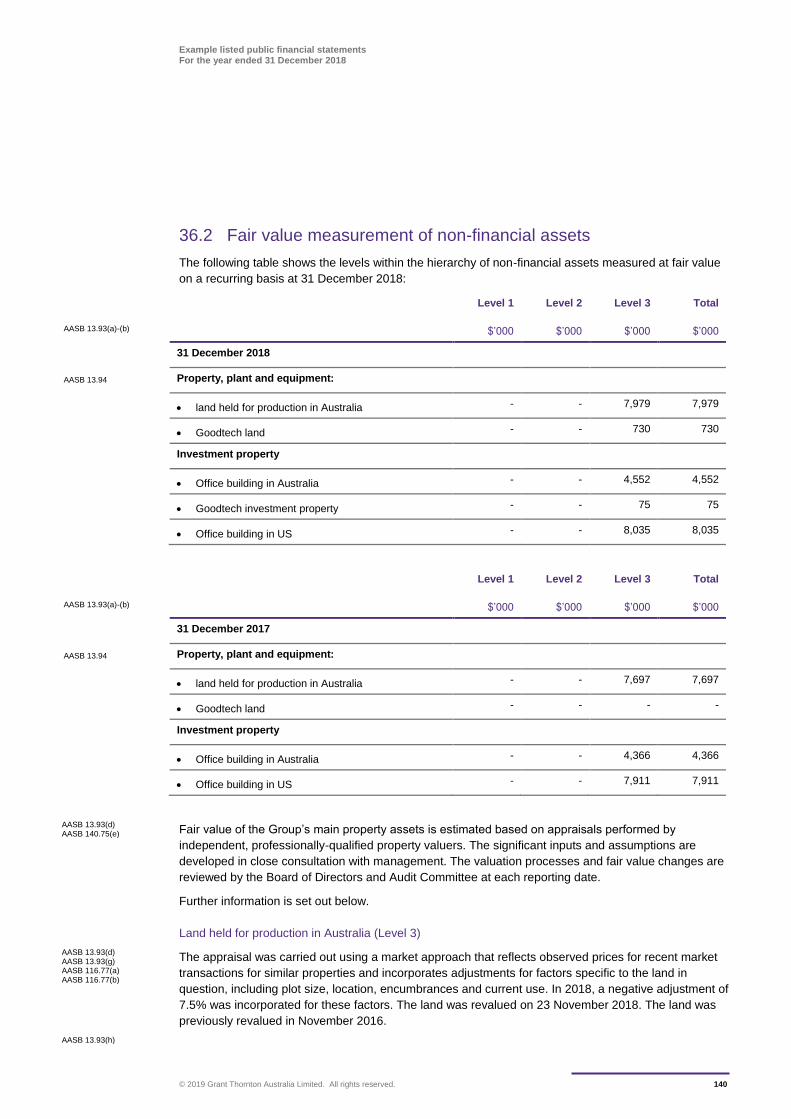
Example listed public financial statements For the year ended 31 December 2018
© 2019 Grant Thornton Australia Limited. All rights reserved. 140
36.2 Fair value measurement of non-financial assets
The following table shows the levels within the hierarchy of non-financial assets measured at fair value
on a recurring basis at 31 December 2018:
Level 1 Level 2 Level 3 Total
AASB 13.93(a)-(b) $’000 $’000 $’000 $’000
31 December 2018
AASB 13.94 Property, plant and equipment:
land held for production in Australia - - 7,979 7,979
Goodtech land - - 730 730
Investment property
Office building in Australia - - 4,552 4,552
Goodtech investment property - - 75 75
Office building in US - - 8,035 8,035
Level 1 Level 2 Level 3 Total
AASB 13.93(a)-(b) $’000 $’000 $’000 $’000
31 December 2017
AASB 13.94 Property, plant and equipment:
land held for production in Australia - - 7,697 7,697
Goodtech land - - - -
Investment property
Office building in Australia - - 4,366 4,366
Office building in US - - 7,911 7,911
Fair value of the Group’s main property assets is estimated based on appraisals performed by
independent, professionally-qualified property valuers. The significant inputs and assumptions are
developed in close consultation with management. The valuation processes and fair value changes are
reviewed by the Board of Directors and Audit Committee at each reporting date.
Further information is set out below.
Land held for production in Australia (Level 3)
The appraisal was carried out using a market approach that reflects observed prices for recent market
transactions for similar properties and incorporates adjustments for factors specific to the land in
question, including plot size, location, encumbrances and current use. In 2018, a negative adjustment of
7.5% was incorporated for these factors. The land was revalued on 23 November 2018. The land was
previously revalued in November 2016.
AASB 13.93(d) AASB 140.75(e)
AASB 13.93(d) AASB 13.93(g) AASB 116.77(a) AASB 116.77(b)
AASB 13.93(h)
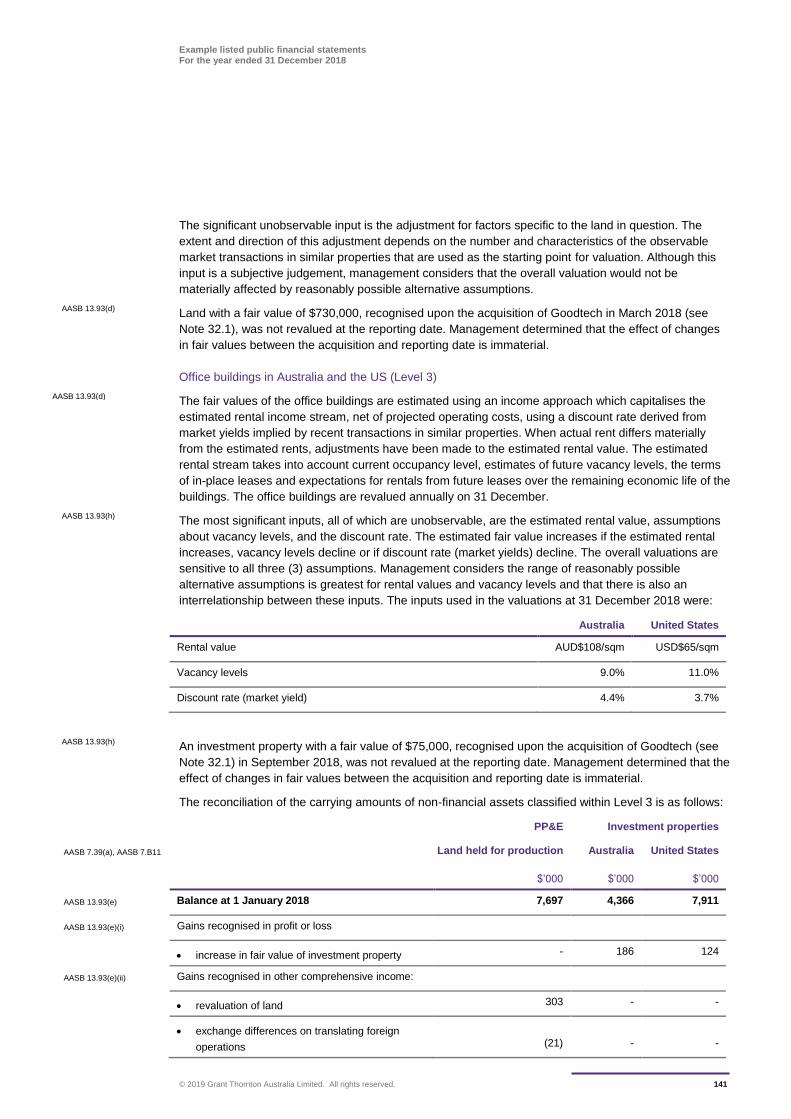
Example listed public financial statements For the year ended 31 December 2018
© 2019 Grant Thornton Australia Limited. All rights reserved. 141
The significant unobservable input is the adjustment for factors specific to the land in question. The
extent and direction of this adjustment depends on the number and characteristics of the observable
market transactions in similar properties that are used as the starting point for valuation. Although this
input is a subjective judgement, management considers that the overall valuation would not be
materially affected by reasonably possible alternative assumptions.
Land with a fair value of $730,000, recognised upon the acquisition of Goodtech in March 2018 (see
Note 32.1), was not revalued at the reporting date. Management determined that the effect of changes
in fair values between the acquisition and reporting date is immaterial.
Office buildings in Australia and the US (Level 3)
The fair values of the office buildings are estimated using an income approach which capitalises the
estimated rental income stream, net of projected operating costs, using a discount rate derived from
market yields implied by recent transactions in similar properties. When actual rent differs materially
from the estimated rents, adjustments have been made to the estimated rental value. The estimated
rental stream takes into account current occupancy level, estimates of future vacancy levels, the terms
of in-place leases and expectations for rentals from future leases over the remaining economic life of the
buildings. The office buildings are revalued annually on 31 December.
The most significant inputs, all of which are unobservable, are the estimated rental value, assumptions
about vacancy levels, and the discount rate. The estimated fair value increases if the estimated rental
increases, vacancy levels decline or if discount rate (market yields) decline. The overall valuations are
sensitive to all three (3) assumptions. Management considers the range of reasonably possible
alternative assumptions is greatest for rental values and vacancy levels and that there is also an
interrelationship between these inputs. The inputs used in the valuations at 31 December 2018 were:
Australia United States
Rental value AUD$108/sqm USD$65/sqm
Vacancy levels 9.0% 11.0%
Discount rate (market yield) 4.4% 3.7%
An investment property with a fair value of $75,000, recognised upon the acquisition of Goodtech (see
Note 32.1) in September 2018, was not revalued at the reporting date. Management determined that the
effect of changes in fair values between the acquisition and reporting date is immaterial.
The reconciliation of the carrying amounts of non-financial assets classified within Level 3 is as follows:
PP&E Investment properties
AASB 7.39(a), AASB 7.B11 Land held for production Australia United States
$’000 $’000 $’000
AASB 13.93(e) Balance at 1 January 2018 7,697 4,366 7,911
AASB 13.93(e)(i) Gains recognised in profit or loss
increase in fair value of investment property - 186 124
AASB 13.93(e)(ii) Gains recognised in other comprehensive income:
revaluation of land 303 - -
exchange differences on translating foreign
operations (21) - -
AASB 13.93(d)
AASB 13.93(d)
AASB 13.93(h)
AASB 13.93(h)
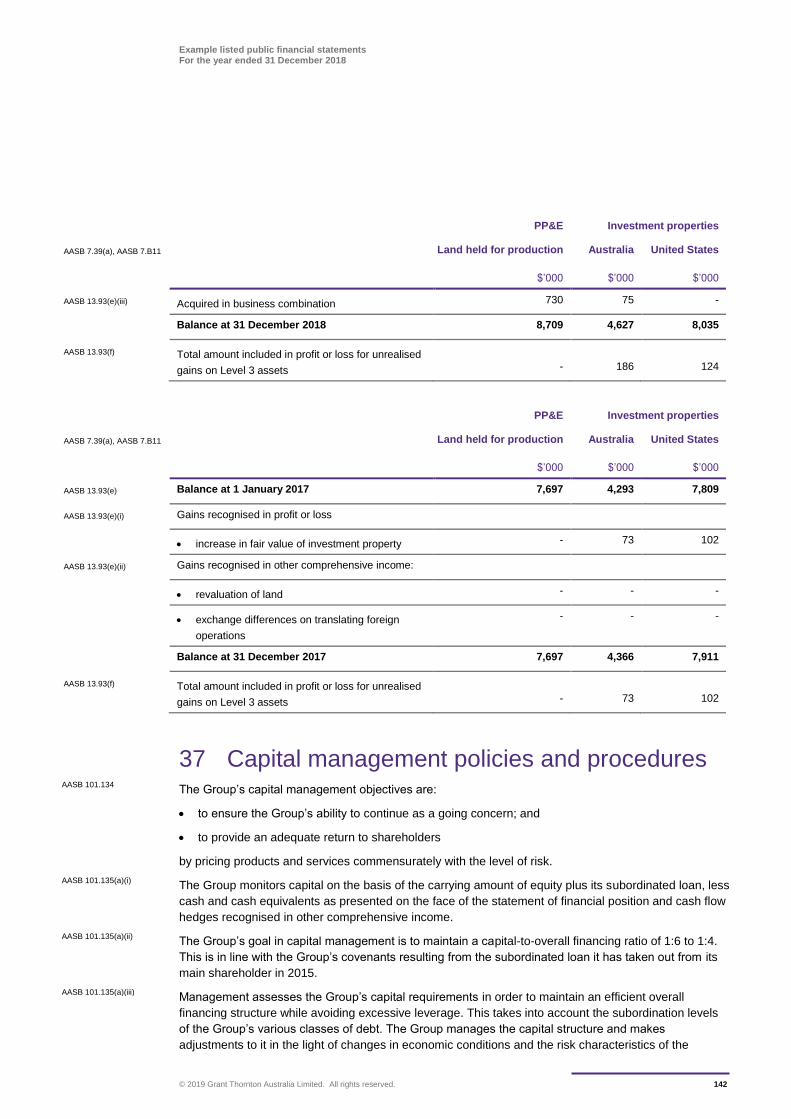
Example listed public financial statements For the year ended 31 December 2018
© 2019 Grant Thornton Australia Limited. All rights reserved. 142
PP&E Investment properties
AASB 7.39(a), AASB 7.B11 Land held for production Australia United States
$’000 $’000 $’000
AASB 13.93(e)(iii) Acquired in business combination 730 75 -
Balance at 31 December 2018 8,709 4,627 8,035
AASB 13.93(f) Total amount included in profit or loss for unrealised
gains on Level 3 assets - 186 124
PP&E Investment properties
AASB 7.39(a), AASB 7.B11 Land held for production Australia United States
$’000 $’000 $’000
AASB 13.93(e) Balance at 1 January 2017 7,697 4,293 7,809
AASB 13.93(e)(i) Gains recognised in profit or loss
increase in fair value of investment property - 73 102
AASB 13.93(e)(ii) Gains recognised in other comprehensive income:
revaluation of land - - -
exchange differences on translating foreign
operations
- - -
Balance at 31 December 2017 7,697 4,366 7,911
AASB 13.93(f) Total amount included in profit or loss for unrealised
gains on Level 3 assets - 73 102
37 Capital management policies and procedures The Group’s capital management objectives are:
to ensure the Group’s ability to continue as a going concern; and
to provide an adequate return to shareholders
by pricing products and services commensurately with the level of risk.
The Group monitors capital on the basis of the carrying amount of equity plus its subordinated loan, less
cash and cash equivalents as presented on the face of the statement of financial position and cash flow
hedges recognised in other comprehensive income.
The Group’s goal in capital management is to maintain a capital-to-overall financing ratio of 1:6 to 1:4.
This is in line with the Group’s covenants resulting from the subordinated loan it has taken out from its
main shareholder in 2015.
Management assesses the Group’s capital requirements in order to maintain an efficient overall
financing structure while avoiding excessive leverage. This takes into account the subordination levels
of the Group’s various classes of debt. The Group manages the capital structure and makes
adjustments to it in the light of changes in economic conditions and the risk characteristics of the
AASB 101.134
AASB 101.135(a)(i)
AASB 101.135(a)(ii)
AASB 101.135(a)(iii)
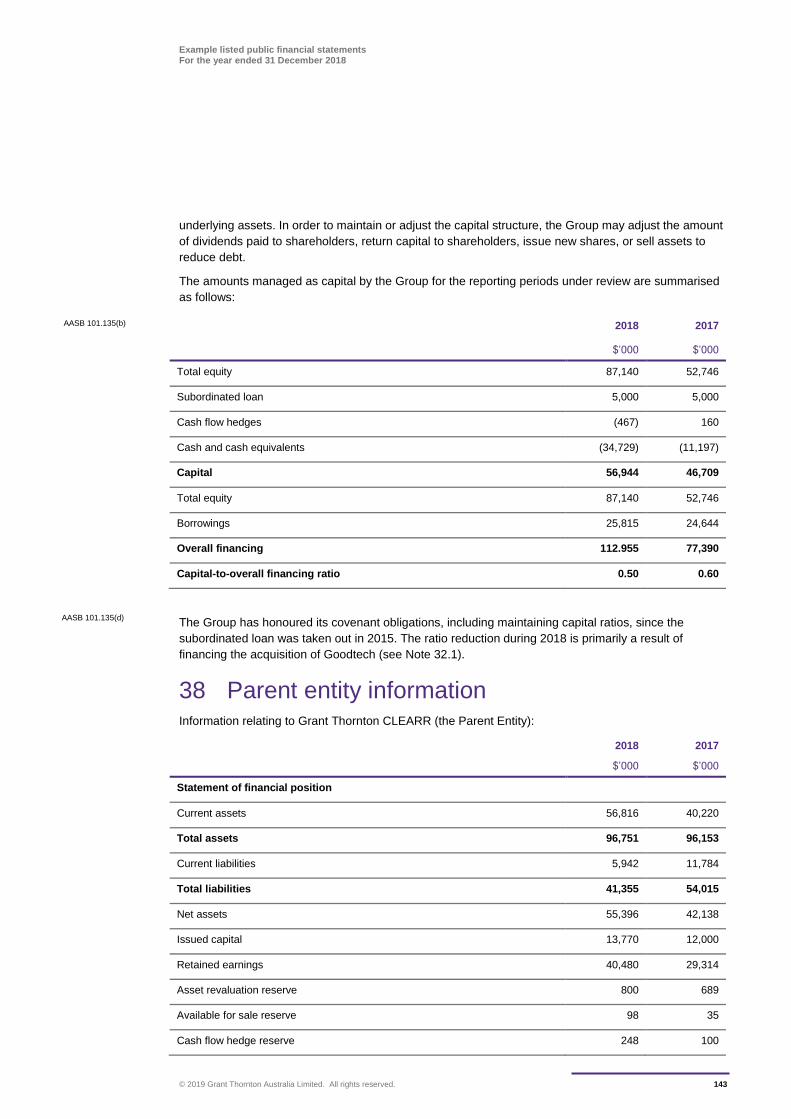
Example listed public financial statements For the year ended 31 December 2018
© 2019 Grant Thornton Australia Limited. All rights reserved. 143
underlying assets. In order to maintain or adjust the capital structure, the Group may adjust the amount
of dividends paid to shareholders, return capital to shareholders, issue new shares, or sell assets to
reduce debt.
The amounts managed as capital by the Group for the reporting periods under review are summarised
as follows:
AASB 101.135(b) 2018 2017
$’000 $’000
Total equity 87,140 52,746
Subordinated loan 5,000 5,000
Cash flow hedges (467) 160
Cash and cash equivalents (34,729) (11,197)
Capital 56,944 46,709
Total equity 87,140 52,746
Borrowings 25,815 24,644
Overall financing 112.955 77,390
Capital-to-overall financing ratio 0.50 0.60
The Group has honoured its covenant obligations, including maintaining capital ratios, since the
subordinated loan was taken out in 2015. The ratio reduction during 2018 is primarily a result of
financing the acquisition of Goodtech (see Note 32.1).
38 Parent entity information Information relating to Grant Thornton CLEARR (the Parent Entity):
2018 2017
$’000 $’000
Statement of financial position
Current assets 56,816 40,220
Total assets 96,751 96,153
Current liabilities 5,942 11,784
Total liabilities 41,355 54,015
Net assets 55,396 42,138
Issued capital 13,770 12,000
Retained earnings 40,480 29,314
Asset revaluation reserve 800 689
Available for sale reserve 98 35
Cash flow hedge reserve 248 100
AASB 101.135(d)
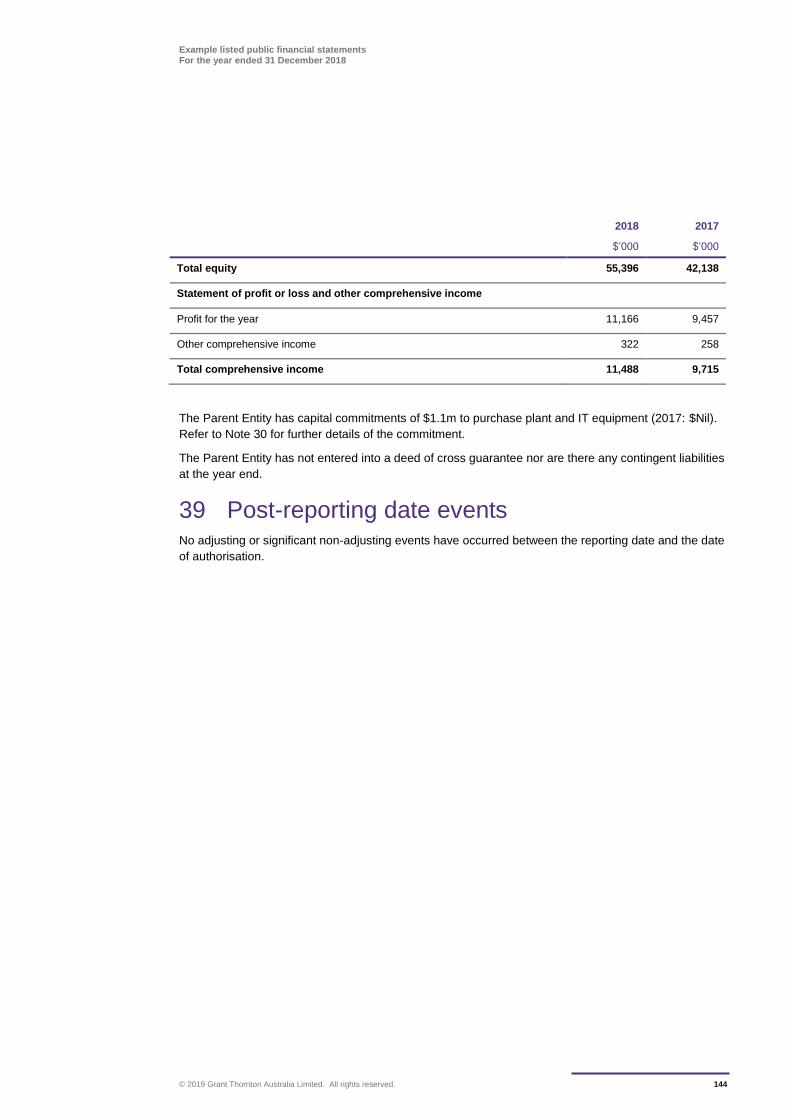
Example listed public financial statements For the year ended 31 December 2018
© 2019 Grant Thornton Australia Limited. All rights reserved. 144
2018 2017
$’000 $’000
Total equity 55,396 42,138
Statement of profit or loss and other comprehensive income
Profit for the year 11,166 9,457
Other comprehensive income 322 258
Total comprehensive income 11,488 9,715
The Parent Entity has capital commitments of $1.1m to purchase plant and IT equipment (2017: $Nil).
Refer to Note 30 for further details of the commitment.
The Parent Entity has not entered into a deed of cross guarantee nor are there any contingent liabilities
at the year end.
39 Post-reporting date events No adjusting or significant non-adjusting events have occurred between the reporting date and the date
of authorisation.

Example listed public financial statements For the year ended 31 December 2018
© 2019 Grant Thornton Australia Limited. All rights reserved. 145
1 In the opinion of the Directors of Grant Thornton CLEARR Example Ltd:
a The consolidated financial statements and notes of Grant Thornton CLEARR Example Ltd are in
accordance with the Corporations Act 2001, including:
i Giving a true and fair view of its financial position as at 31 December 2018 and of its
performance for the financial year ended on that date; and
ii Complying with Australian Accounting Standards (including the Australian Accounting
Interpretations) and the Corporations Regulations 2001; and
b There are reasonable grounds to believe that Grant Thornton CLEARR Example Ltd will be able
to pay its debts as and when they become due and payable.;
2 The Directors have been given the declarations required by Section 295A of the Corporations Act
2001 from the Chief Executive Officer and Chief Financial Officer for the financial year ended 31
December 2018.
3 Note 2 confirms that the consolidated financial statements also comply with International Financial
Reporting Standards.
Signed in accordance with a resolution of the Directors.
Director
Blake Smith
Dated the 28th day of February 2019
Directors’ Declaration
CA 295(4)
CA 295(4)(d)(ii)
CA 295(4)(d)(i)
CA 295(4)(c)
CA 295(4)(e)) ASIC PN22
CA 295(4)(ca)
CA 295(5)(a)
CA 295(5)(c)
CA 295(5)(b)
Example listed public financial statements For the year ended 31 December 2018
© 2019 Grant Thornton Australia Limited. All rights reserved. 146
An independent auditor’s report will be prepared by the entity’s auditor in accordance with Australian
Auditing Standards. This publication does not include an illustrative report as the wording of the report
may differ between entities.
Independent Auditor’s Report
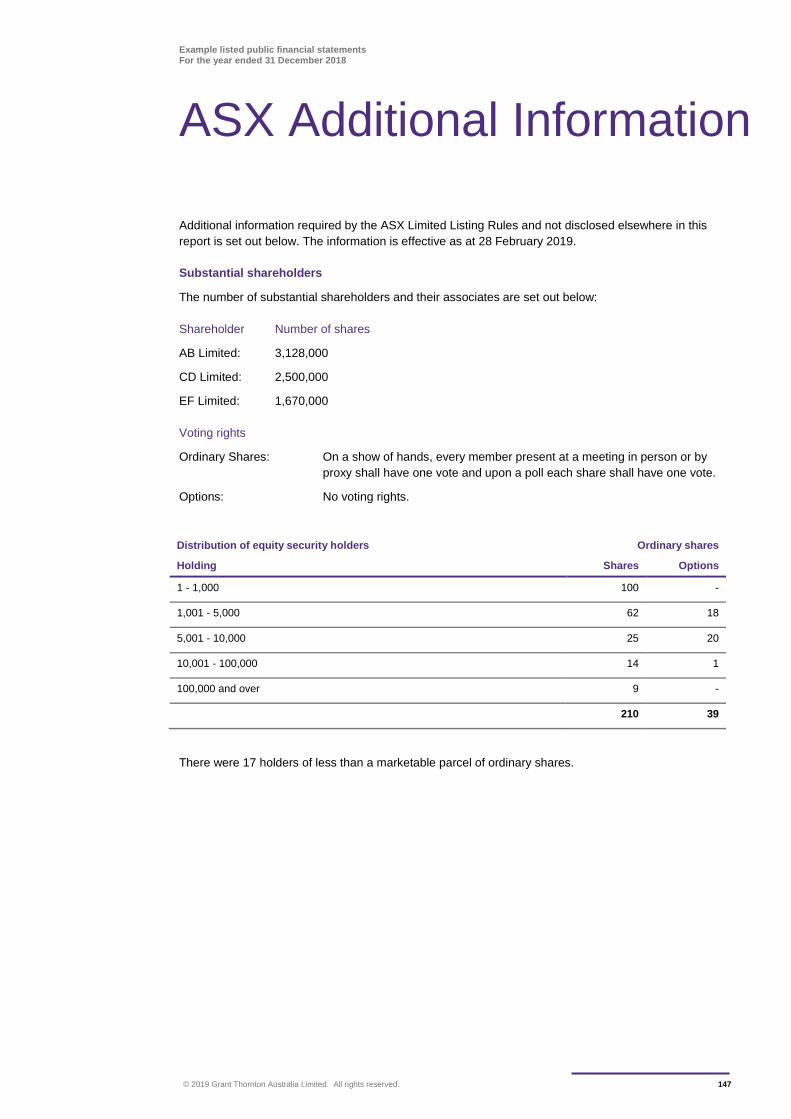
Example listed public financial statements For the year ended 31 December 2018
© 2019 Grant Thornton Australia Limited. All rights reserved. 147
Additional information required by the ASX Limited Listing Rules and not disclosed elsewhere in this
report is set out below. The information is effective as at 28 February 2019.
Substantial shareholders
The number of substantial shareholders and their associates are set out below:
Shareholder Number of shares
AB Limited: 3,128,000
CD Limited: 2,500,000
EF Limited: 1,670,000
Voting rights
Ordinary Shares: On a show of hands, every member present at a meeting in person or by
proxy shall have one vote and upon a poll each share shall have one vote.
Options: No voting rights.
Distribution of equity security holders Ordinary shares
Holding Shares Options
1 - 1,000 100 -
1,001 - 5,000 62 18
5,001 - 10,000 25 20
10,001 - 100,000 14 1
100,000 and over 9 -
210 39
There were 17 holders of less than a marketable parcel of ordinary shares.
ASX Additional Information
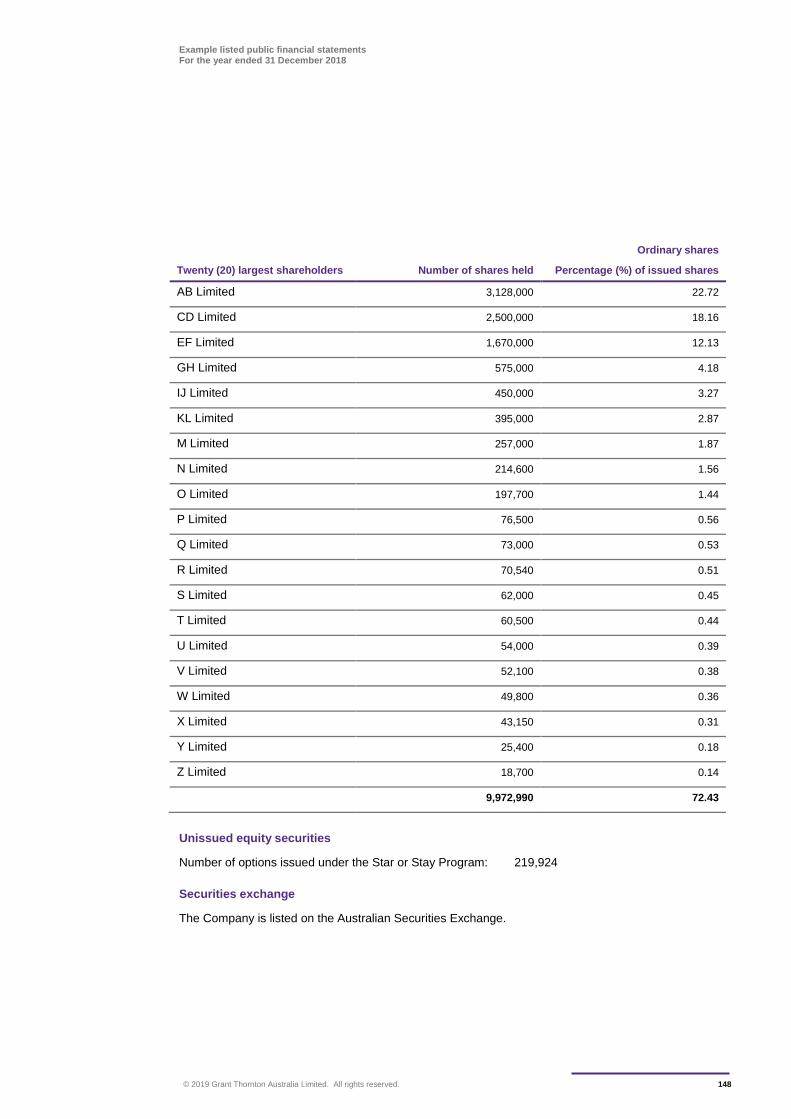
Example listed public financial statements For the year ended 31 December 2018
© 2019 Grant Thornton Australia Limited. All rights reserved. 148
Ordinary shares
Twenty (20) largest shareholders Number of shares held Percentage (%) of issued shares
AB Limited 3,128,000 22.72
CD Limited 2,500,000 18.16
EF Limited 1,670,000 12.13
GH Limited 575,000 4.18
IJ Limited 450,000 3.27
KL Limited 395,000 2.87
M Limited 257,000 1.87
N Limited 214,600 1.56
O Limited 197,700 1.44
P Limited 76,500 0.56
Q Limited 73,000 0.53
R Limited 70,540 0.51
S Limited 62,000 0.45
T Limited 60,500 0.44
U Limited 54,000 0.39
V Limited 52,100 0.38
W Limited 49,800 0.36
X Limited 43,150 0.31
Y Limited 25,400 0.18
Z Limited 18,700 0.14
9,972,990 72.43
Unissued equity securities
Number of options issued under the Star or Stay Program: 219,924
Securities exchange
The Company is listed on the Australian Securities Exchange.
Example listed public financial statements For the year ended 31 December 2018
© 2019 Grant Thornton Australia Limited. All rights reserved. 149
AASB 101.99 allows a ‘statement of profit or loss’ format analysing expenses using a classification
based on either the Nature of Expenses (NOE) or based on the Function of Expenses (FOE) within the
entity. This depends on management’s assessment of which format provides information that is reliable
and more relevant.
The NOE format is illustrated in the main body of the Example Financial Statements. The FOE format
is illustrated in this Appendix. The example shows the ‘statement of profit or loss’ separately, i.e. Other
Comprehensive Income (OCI) shall be shown in addition to the statement of profit or loss in a statement
of comprehensive income (see the example in Appendix B).
If the entity shows the statement of profit or loss and other comprehensive income in one statement
(see the main body of the Example Financial Statements), the FOE format included in this Appendix
may replace the NOE format that is part of the statement of profit or loss and other comprehensive
income.
The FOE or NOE formats do not affect the presentation requirements for other comprehensive income,
only the ‘statement of profit or loss’ is affected.
Presenting the statement of profit or loss in the FOE format requires additional considerations:
additional disclosures on the nature of certain expenses are required, including employee benefit
expenses and depreciation, amortisation and impairment of non-financial assets
the disclosures of the specific line items in the statement of profit or loss where certain transactions
or amounts are recognised should reflect the actual line items presented in the FOE statement of
profit or loss
In addition, when an entity includes the analysis of profit or loss from discontinued operation in the notes
to the financial statements (see Note 10); such information should be presented in the same format as
the main statement of profit or loss. This will facilitate a better understanding of the financial effects of
the discontinued operations.
Appendix A: Organising the Statement of Profit and Loss by Function of Expenses
AASB 101.99
AASB 101.104
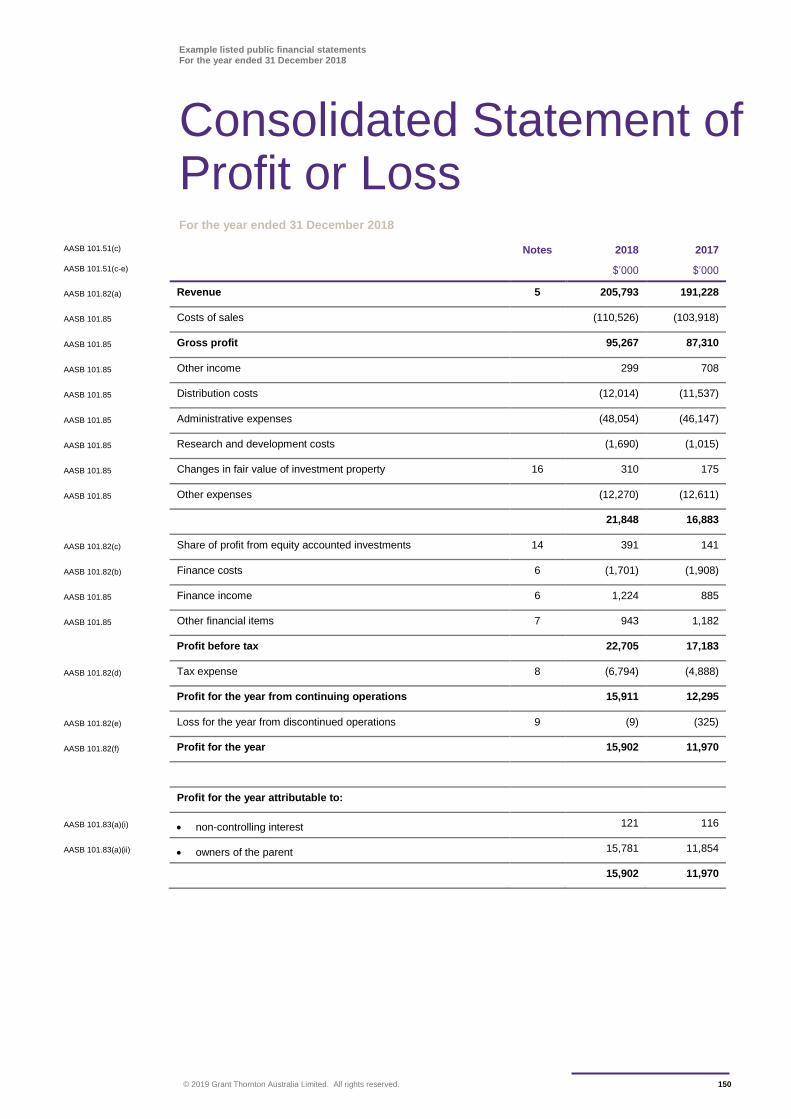
Example listed public financial statements For the year ended 31 December 2018
© 2019 Grant Thornton Australia Limited. All rights reserved. 150
For the year ended 31 December 2018
AASB 101.51(c) Notes 2018 2017
AASB 101.51(c-e) $’000 $’000
AASB 101.82(a) Revenue 5 205,793 191,228
AASB 101.85 Costs of sales (110,526) (103,918)
AASB 101.85 Gross profit 95,267 87,310
AASB 101.85 Other income 299 708
AASB 101.85 Distribution costs (12,014) (11,537)
AASB 101.85 Administrative expenses (48,054) (46,147)
AASB 101.85 Research and development costs (1,690) (1,015)
AASB 101.85 Changes in fair value of investment property 16 310 175
AASB 101.85 Other expenses (12,270) (12,611)
21,848 16,883
AASB 101.82(c) Share of profit from equity accounted investments 14 391 141
AASB 101.82(b) Finance costs 6 (1,701) (1,908)
AASB 101.85 Finance income 6 1,224 885
AASB 101.85 Other financial items 7 943 1,182
Profit before tax 22,705 17,183
AASB 101.82(d) Tax expense 8 (6,794) (4,888)
Profit for the year from continuing operations 15,911 12,295
AASB 101.82(e) Loss for the year from discontinued operations 9 (9) (325)
AASB 101.82(f) Profit for the year 15,902 11,970
Profit for the year attributable to:
AASB 101.83(a)(i) non-controlling interest 121 116
AASB 101.83(a)(ii) owners of the parent 15,781 11,854
15,902 11,970
Consolidated Statement of Profit or Loss
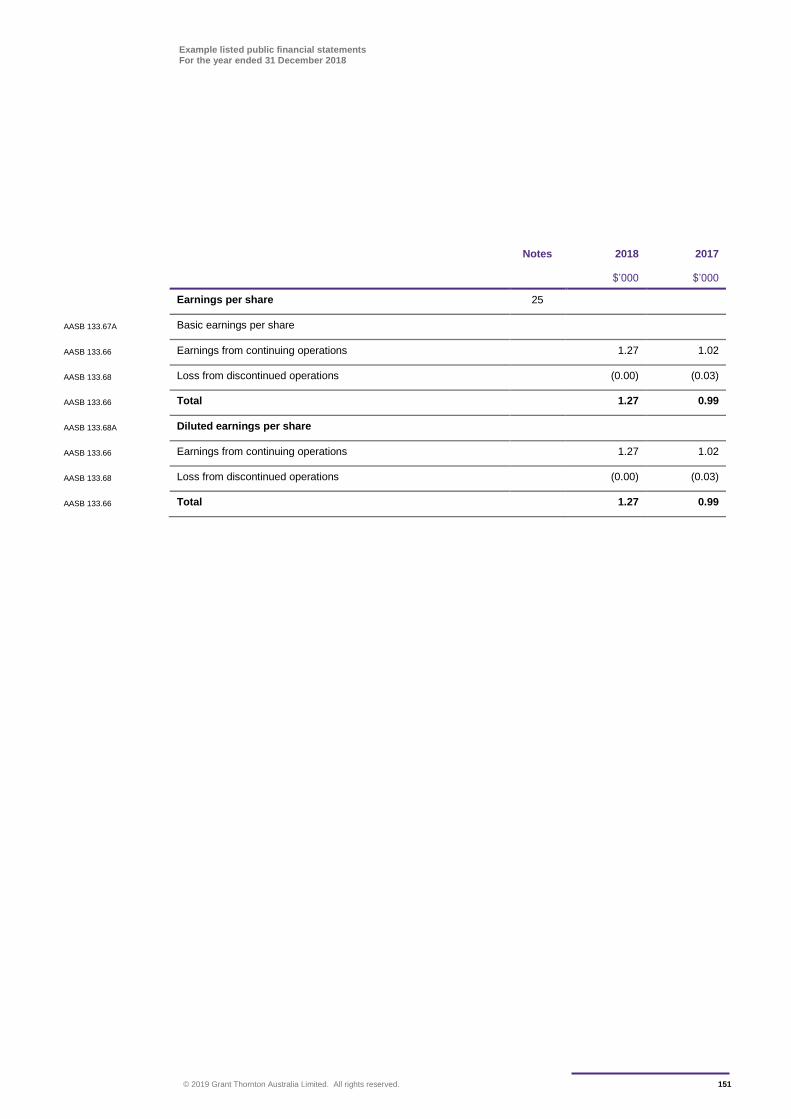
Example listed public financial statements For the year ended 31 December 2018
© 2019 Grant Thornton Australia Limited. All rights reserved. 151
Notes 2018 2017
$’000 $’000
Earnings per share 25
AASB 133.67A Basic earnings per share
AASB 133.66 Earnings from continuing operations 1.27 1.02
AASB 133.68 Loss from discontinued operations (0.00) (0.03)
AASB 133.66 Total 1.27 0.99
AASB 133.68A Diluted earnings per share
AASB 133.66 Earnings from continuing operations 1.27 1.02
AASB 133.68 Loss from discontinued operations (0.00) (0.03)
AASB 133.66 Total 1.27 0.99
Example listed public financial statements For the year ended 31 December 2018
© 2019 Grant Thornton Australia Limited. All rights reserved. 152
The main body in these Example Financial Statements presents the statement of profit or loss and other
comprehensive income of one statement (see Guidance Note to the consolidated statement of profit or
loss and other comprehensive income).
In this Appendix, the alternative of presenting the ‘statement of profit or loss and other comprehensive
income’ as two (2) statements is presented (using the nature of expense method).
Disclosure requirements, however, remain unchanged (see guidance note to the consolidated statement
of profit or loss and other comprehensive income).
In general, the notes to the financial statements will need to be tailored so that they refer to the
statement of profit or loss and other comprehensive income and not the statement of profit or loss,
where appropriate. For example, tailoring is necessary to reflect that discontinued operations are shown
as a separate line item in the statement of profit or loss and other comprehensive income (see Note
4.10). However, it should be noted that the term profit or loss continues to apply.
The illustrative two (2) statements of profit or loss and other comprehensive income are shown on the
next two (2) pages.
Appendix B: Statement of Profit or Loss and Other Comprehensive Income Presented in Two Statements
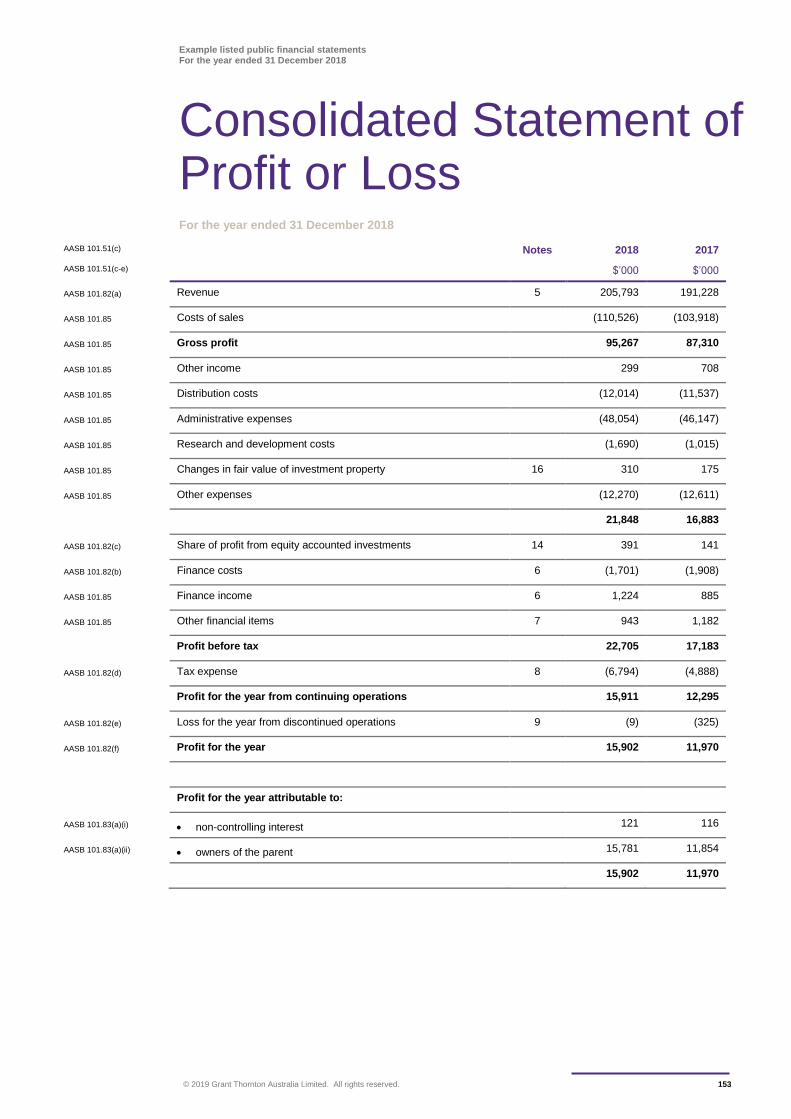
Example listed public financial statements For the year ended 31 December 2018
© 2019 Grant Thornton Australia Limited. All rights reserved. 153
For the year ended 31 December 2018
AASB 101.51(c) Notes 2018 2017
AASB 101.51(c-e) $’000 $’000
AASB 101.82(a) Revenue 5 205,793 191,228
AASB 101.85 Costs of sales (110,526) (103,918)
AASB 101.85 Gross profit 95,267 87,310
AASB 101.85 Other income 299 708
AASB 101.85 Distribution costs (12,014) (11,537)
AASB 101.85 Administrative expenses (48,054) (46,147)
AASB 101.85 Research and development costs (1,690) (1,015)
AASB 101.85 Changes in fair value of investment property 16 310 175
AASB 101.85 Other expenses (12,270) (12,611)
21,848 16,883
AASB 101.82(c) Share of profit from equity accounted investments 14 391 141
AASB 101.82(b) Finance costs 6 (1,701) (1,908)
AASB 101.85 Finance income 6 1,224 885
AASB 101.85 Other financial items 7 943 1,182
Profit before tax 22,705 17,183
AASB 101.82(d) Tax expense 8 (6,794) (4,888)
Profit for the year from continuing operations 15,911 12,295
AASB 101.82(e) Loss for the year from discontinued operations 9 (9) (325)
AASB 101.82(f) Profit for the year 15,902 11,970
Profit for the year attributable to:
AASB 101.83(a)(i) non-controlling interest 121 116
AASB 101.83(a)(ii) owners of the parent 15,781 11,854
15,902 11,970
Consolidated Statement of Profit or Loss
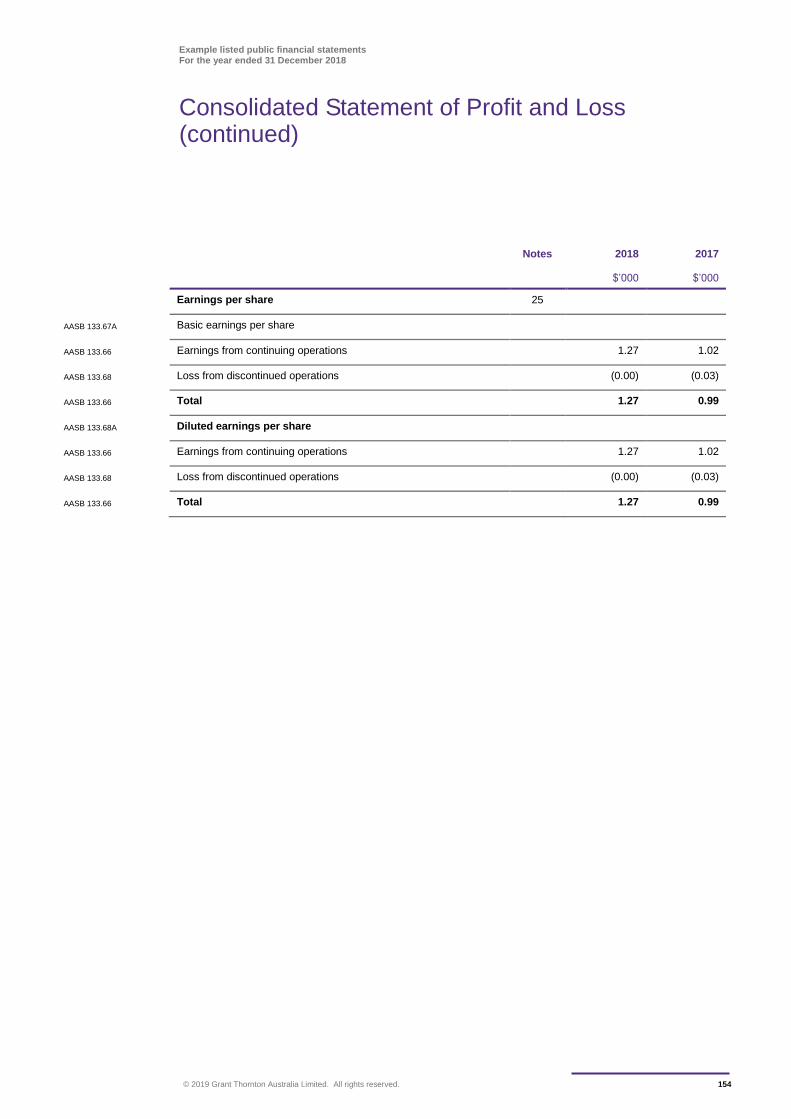
Example listed public financial statements For the year ended 31 December 2018
Consolidated Statement of Profit and Loss (continued)
© 2019 Grant Thornton Australia Limited. All rights reserved. 154
Notes 2018 2017
$’000 $’000
Earnings per share 25
AASB 133.67A Basic earnings per share
AASB 133.66 Earnings from continuing operations 1.27 1.02
AASB 133.68 Loss from discontinued operations (0.00) (0.03)
AASB 133.66 Total 1.27 0.99
AASB 133.68A Diluted earnings per share
AASB 133.66 Earnings from continuing operations 1.27 1.02
AASB 133.68 Loss from discontinued operations (0.00) (0.03)
AASB 133.66 Total 1.27 0.99
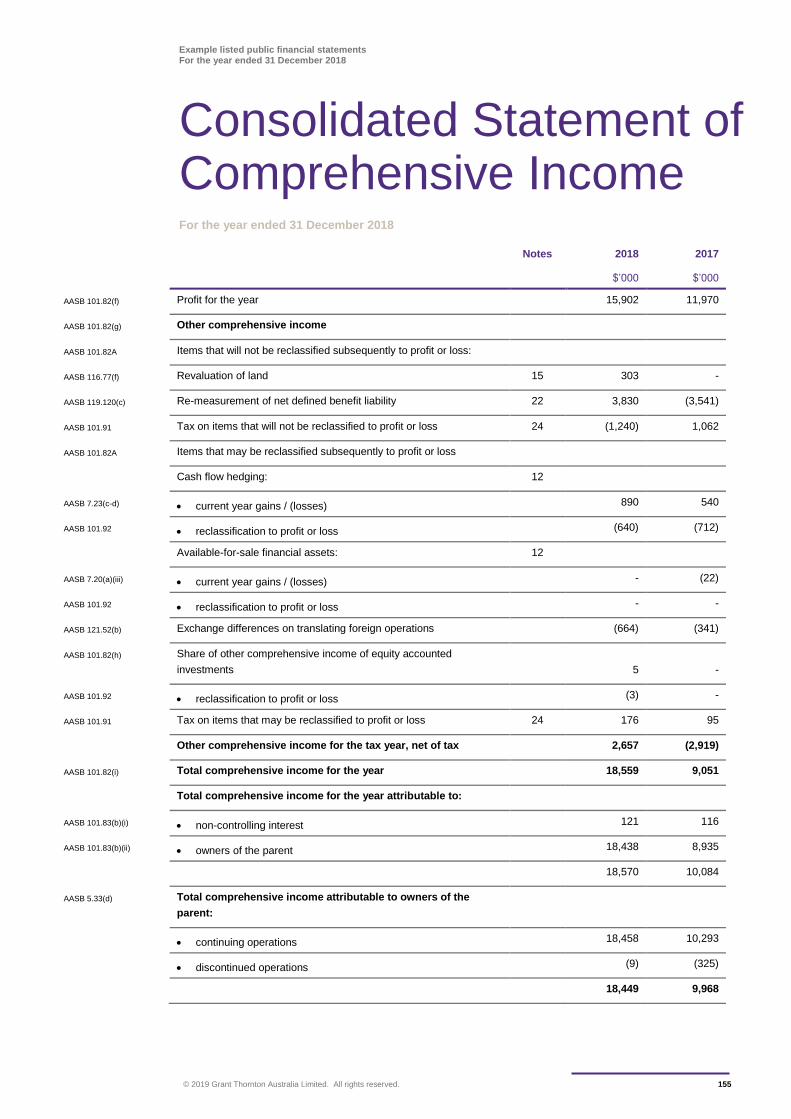
Example listed public financial statements For the year ended 31 December 2018
© 2019 Grant Thornton Australia Limited. All rights reserved. 155
For the year ended 31 December 2018
Notes 2018 2017
$’000 $’000
AASB 101.82(f) Profit for the year 15,902 11,970
AASB 101.82(g) Other comprehensive income
AASB 101.82A Items that will not be reclassified subsequently to profit or loss:
AASB 116.77(f) Revaluation of land 15 303 -
AASB 119.120(c) Re-measurement of net defined benefit liability 22 3,830 (3,541)
AASB 101.91 Tax on items that will not be reclassified to profit or loss 24 (1,240) 1,062
AASB 101.82A Items that may be reclassified subsequently to profit or loss
Cash flow hedging: 12
AASB 7.23(c-d) current year gains / (losses) 890 540
AASB 101.92 reclassification to profit or loss (640) (712)
Available-for-sale financial assets: 12
AASB 7.20(a)(iii) current year gains / (losses) - (22)
AASB 101.92 reclassification to profit or loss - -
AASB 121.52(b) Exchange differences on translating foreign operations (664) (341)
AASB 101.82(h) Share of other comprehensive income of equity accounted
investments
5 -
AASB 101.92 reclassification to profit or loss (3) -
AASB 101.91 Tax on items that may be reclassified to profit or loss 24 176 95
Other comprehensive income for the tax year, net of tax 2,657 (2,919)
AASB 101.82(i) Total comprehensive income for the year 18,559 9,051
Total comprehensive income for the year attributable to:
AASB 101.83(b)(i) non-controlling interest 121 116
AASB 101.83(b)(ii) owners of the parent 18,438 8,935
18,570 10,084
AASB 5.33(d) Total comprehensive income attributable to owners of the
parent:
continuing operations 18,458 10,293
discontinued operations (9) (325)
18,449 9,968
Consolidated Statement of Comprehensive Income
Example listed public financial statements For the year ended 31 December 2018
© 2019 Grant Thornton Australia Limited. All rights reserved. 156
As permitted by AASB 107 Statement of Cash Flows paragraph 18, an entity may report cash flows
from operating activities using either:
a The direct method, whereby major classes of gross cash receipts and gross cash payments are
disclosed; or
b The indirect method, whereby profit or loss is adjusted for the effects of transactions of a non-cash
nature, any deferrals or accruals of past or future operating cash receipts or payments, and items of
income or expense associated with investing or financing cash flows.
Entities are encouraged to report cash flows from operating activities using the direct method. The direct
method provides information which may be useful in estimating future cash flows and which is not
available under the indirect method.
The main body in these Example Financial Statements presents the statement of cash flows using the
direct method.
In this Appendix, the alternative of using the indirect method is presented.
Appendix C: Statement of Cash Flows Presented Using the Indirect Method
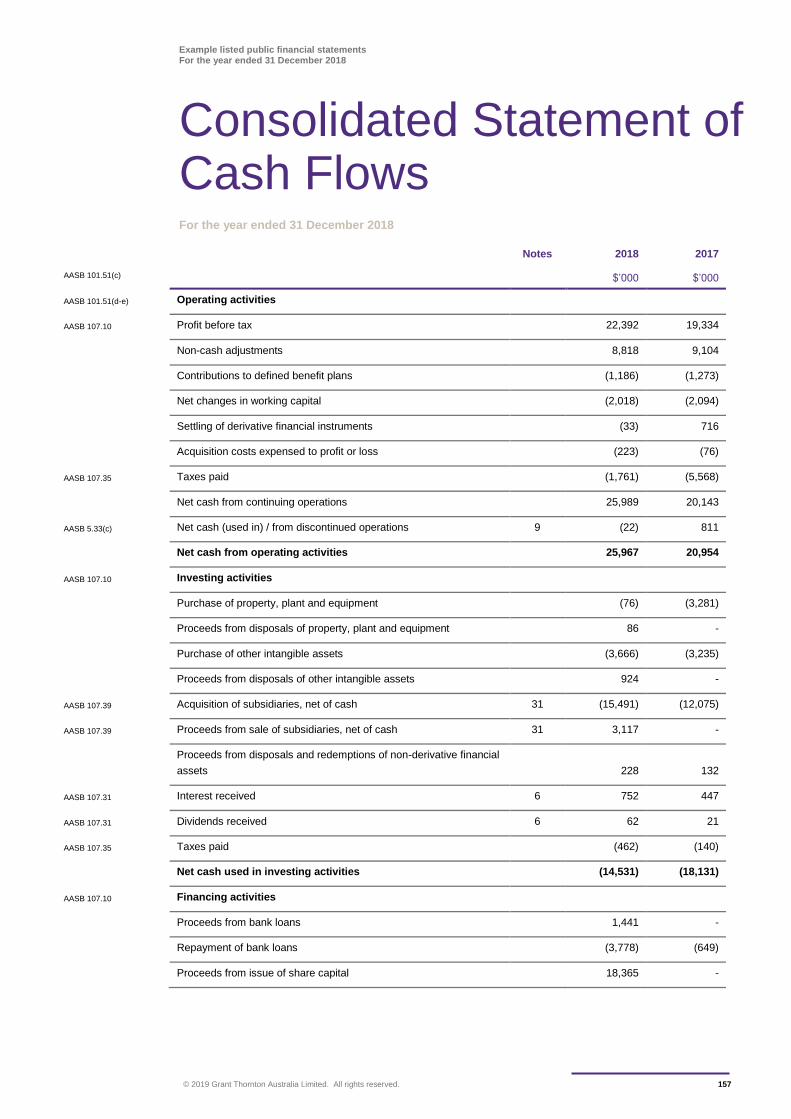
Example listed public financial statements For the year ended 31 December 2018
© 2019 Grant Thornton Australia Limited. All rights reserved. 157
For the year ended 31 December 2018
Notes 2018 2017
AASB 101.51(c) $’000 $’000
AASB 101.51(d-e) Operating activities
AASB 107.10 Profit before tax 22,392 19,334
Non-cash adjustments 8,818 9,104
Contributions to defined benefit plans (1,186) (1,273)
Net changes in working capital (2,018) (2,094)
Settling of derivative financial instruments (33) 716
Acquisition costs expensed to profit or loss (223) (76)
AASB 107.35 Taxes paid (1,761) (5,568)
Net cash from continuing operations 25,989 20,143
AASB 5.33(c) Net cash (used in) / from discontinued operations 9 (22) 811
Net cash from operating activities 25,967 20,954
AASB 107.10 Investing activities
Purchase of property, plant and equipment (76) (3,281)
Proceeds from disposals of property, plant and equipment 86 -
Purchase of other intangible assets (3,666) (3,235)
Proceeds from disposals of other intangible assets 924 -
AASB 107.39 Acquisition of subsidiaries, net of cash 31 (15,491) (12,075)
AASB 107.39 Proceeds from sale of subsidiaries, net of cash 31 3,117 -
Proceeds from disposals and redemptions of non-derivative financial
assets
228 132
AASB 107.31 Interest received 6 752 447
AASB 107.31 Dividends received 6 62 21
AASB 107.35 Taxes paid (462) (140)
Net cash used in investing activities (14,531) (18,131)
AASB 107.10 Financing activities
Proceeds from bank loans 1,441 -
Repayment of bank loans (3,778) (649)
Proceeds from issue of share capital 18,365 -
Consolidated Statement of Cash Flows
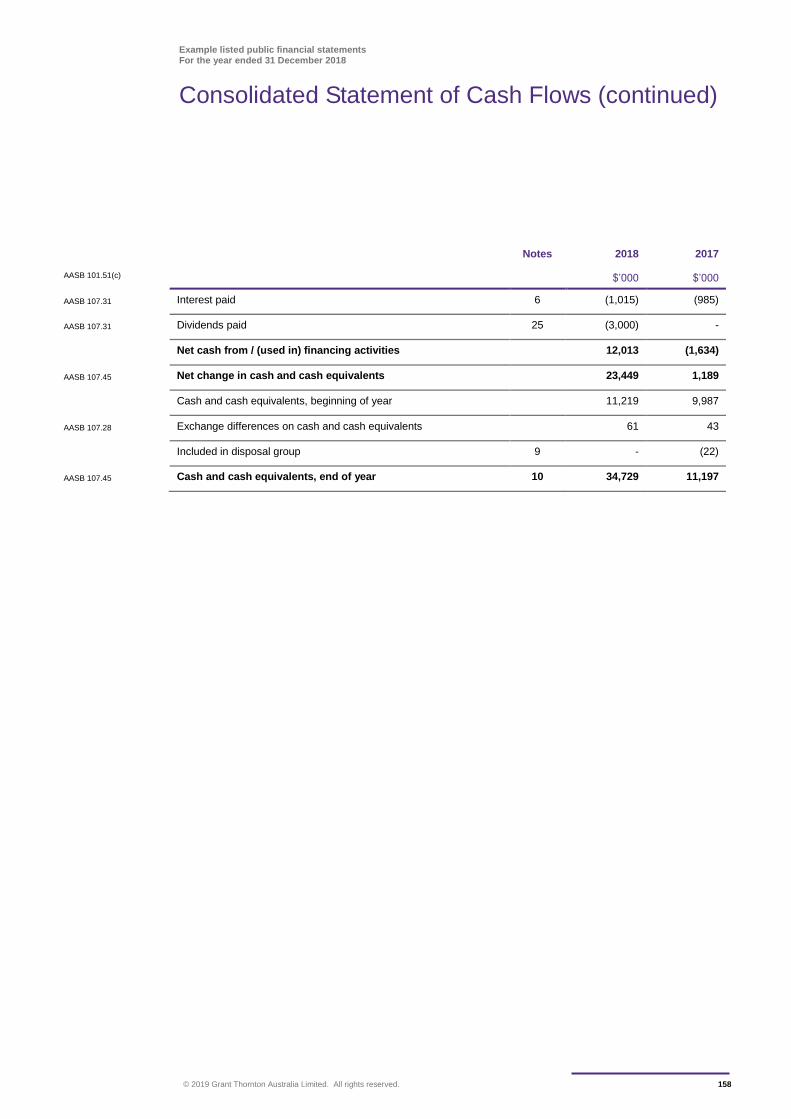
Example listed public financial statements For the year ended 31 December 2018
Consolidated Statement of Cash Flows (continued)
© 2019 Grant Thornton Australia Limited. All rights reserved. 158
Notes 2018 2017
AASB 101.51(c) $’000 $’000
AASB 107.31 Interest paid 6 (1,015) (985)
AASB 107.31 Dividends paid 25 (3,000) -
Net cash from / (used in) financing activities 12,013 (1,634)
AASB 107.45 Net change in cash and cash equivalents 23,449 1,189
Cash and cash equivalents, beginning of year 11,219 9,987
AASB 107.28 Exchange differences on cash and cash equivalents 61 43
Included in disposal group 9 - (22)
AASB 107.45 Cash and cash equivalents, end of year 10 34,729 11,197
Example listed public financial statements For the year ended 31 December 2018
© 2019 Grant Thornton Australia Limited. All rights reserved. 159
The Example Financial Statements for Grant Thornton CLEARR Example Ltd is based upon an IT
entity and therefore does not include specific disclosures relating to companies within the resource
mining industry. As resource mining is widespread within Australia, we thought that providing the
additional disclosures specific to companies within this industry would be useful for financial preparers.
We have identified common areas in the following pages that we consider our clients would be
concerned with.
Appendix D: Additional Disclosures for Mining Exploration Companies
Example listed public financial statements For the year ended 31 December 2018
© 2019 Grant Thornton Australia Limited. All rights reserved. 160
Interests in joint arrangements
Joint operation
A joint operation is a joint arrangement whereby the parties that have joint control of the arrangement
have rights to the assets, and obligations for the liabilities, relating to the arrangement.
Where the Group’s activities are conducted through joint operations, the Group recognises its assets
(including its share of any assets held jointly), its liabilities (including its share of any liabilities incurred
jointly), its share of the revenue from the sale of the output by the joint operation and its expenses
(including its share of any expenses incurred jointly).
Joint venture
A joint venture is a joint arrangement whereby the parties that have joint control of the arrangement
have rights to the net assets of the arrangement.
Where the Group’s activities are conducted through a joint venture, the Group recognises its interests in
the joint venture using the equity method.
Under the equity method, the investment in the joint venture is carried in the statement of financial
position at cost plus post acquisition changes in the Group’s share of net assets of the joint venture.
Goodwill relating to the joint venture is included in the carrying amount of the investment and is neither
amortised nor individually tested for impairment.
The profit or loss reflects the Group’s share of the results of operations of the joint venture. Where there
has been a change recognised directly in other comprehensive income or equity of the joint venture, the
Group recognises its share of any changes and discloses this, when applicable, in the statement of
profit or loss and other comprehensive income or the statement of changes in equity, as appropriate.
Unrealised gains and losses resulting from transactions between the Group and the joint venture are
eliminated to the extent of the interest in the joint venture.
The share of the joint venture’s net profit / (loss) is shown on the face of profit or loss. This is the
profit/(loss) attributable to venturers in the joint venture.
The financial statements of the joint venture are prepared for the same reporting period as the venturer.
Where necessary, adjustments are made to bring the accounting policies in line with those of the Group.
Mineral exploration, evaluation and development expenditure
Exploration and evaluation costs
Exploration and evaluation expenditure incurred is accumulated in respect of each identifiable area of
interest. These costs are only carried forward to the extent that they are expected to be recouped
through the successful development of the area or where activities in the area have not yet reached a
stage that permits reasonable assessment of the existence of economically recoverable reserves.
Accumulated costs in relation to an abandoned area are written off in full against profit or loss in the
year in which the decision to abandon the area is made.
When production commences, the accumulated costs for the relevant area of interest are transferred to
mine properties and amortised over the life of the area according to the rate of depletion of the
economically recoverable reserves (refer to ‘mine properties’ below).
A regular review for impairment is undertaken of each area of interest to determine the appropriateness
of continuing to carry forward costs in relation to that area of interest.
Example listed public financial statements For the year ended 31 December 2018
© 2019 Grant Thornton Australia Limited. All rights reserved. 161
Costs of site restoration are provided over the life of the facility from when exploration commences and
are included in the costs of that stage. Site restoration costs include the dismantling and removal of
mining plant, equipment and building structures, waste removal, and rehabilitation of the site in
accordance with clauses of the mining permits. Such costs have been determined using estimates of
future costs, current legal requirements and technology on a discounted basis.
Any changes in the estimates for the costs are accounted on a prospective basis. In determining the
costs of site restoration, there is uncertainty regarding the nature and extent of the restoration due to
community expectations and future legislation. Accordingly the costs have been determined on the
basis that the restoration will be completed within one year of abandoning the site.
Mine properties
Mine properties represent the accumulation of all exploration, evaluation and development expenditure
incurred in respect of areas of interest in which mining has commenced or in the process of
commencing. When further development expenditure is incurred in respect of mine property after the
commencement of production, such expenditure is carried forward as part of the mine property only
when substantial future economic benefits are thereby established, otherwise such expenditure is
classified as part of the cost of production.
Amortisation is provided on a unit of production basis (other than restoration and rehabilitation
expenditure detailed below) which results in a write off of the cost proportional to the depletion of the
proven and probable mineral reserves.
The net carrying value of each area of interest is reviewed regularly and to the extent to which this value
exceeds its recoverable amount, the excess is either fully provided against or written off in the financial
year in which this is determined.
The Group provides for environmental restoration and rehabilitation at site which includes any costs to
dismantle and remove certain items of plant and equipment. The cost of an item includes the initial
estimate of the costs of dismantling and removing the item and restoring the site on which it is located,
the obligation for which an entity incurs when an item is acquired or as a consequence of having used
the item during that period. This asset is depreciated on the basis of the current estimate of the useful
life of the asset.
In accordance with AASB 137 Provisions, Contingent Liabilities and Contingent Assets an entity is also
required to recognise as a provision the best estimate of the present value of expenditure required to
settle the obligation. The present value of estimated future cash flows is measured using a current
market discount rate.
Inventories
Gold bullion, base metal concentrate, metal in circuit and ore stockpiles are physically measured or
estimated and valued at the lower of cost or net realisable value. Net realisable value is the estimated
selling price (in the ordinary course of business), less estimated costs of completion and costs of selling
final product.
Cost is determined using the weighted average method and comprises direct purchase costs and an
appropriate portion of fixed and variable overhead costs, including depreciation and amortisation,
incurred in converting materials into finished goods. The cost of production is allocated to joint products
using a ratio of spot prices by volume at each month end. Separately identifiable costs of conversion of
each metal are specifically allocated.
Materials and supplies are valued at the lower of cost or net realisable value. Any provision for
obsolescence is determined by reference to specific items of stock. A regular review is undertaken to
determine the extent of any provision for obsolescence.
Example listed public financial statements For the year ended 31 December 2018
© 2019 Grant Thornton Australia Limited. All rights reserved. 162
Rehabilitation provision
In accordance with the Group’s environmental policy and applicable legal requirements, a provision for
site restoration in respect of contaminated land, is recognised when the land is contaminated.
The provision represents the best estimate of the present value of the expenditure required to settle the
restoration obligation at the reporting date, based on current legal requirements and technology. Future
restoration costs are reviewed annually and any changes are reflected in the present value of the
restoration provision at the end of the reporting period.
The amount of the provision for future restoration costs is capitalised and is depreciated in accordance
with the policy set out in Note X. The unwinding of the effect of discounting on the provision is
recognised as a finance cost.
Revenue recognition
The following criteria are also applicable to other specific revenue transactions:
Gold bullion sales
Revenue from gold bullion sales is brought to account when the significant risks and rewards of
ownership have transferred to the buyer and selling prices are known or can be reasonably estimated.
Base metal concentrate sales
Contract terms for the Group’s sale of base metal concentrate (metal in concentrate) allow for a price
adjustment based on final assay results of the metal in concentrate by the customer to determine the
final content. Recognition of sales revenue for these commodities is based on the most recently
determined estimate of metal in concentrate (based on initial assay results) and the spot price at the
date of shipment, with a subsequent adjustment made upon final determination and presented as part of
‘other income’.
The terms of metal in concentrate sales contracts with third parties contain provisional pricing
arrangements whereby the selling price for metal in concentrate is based on prevailing spot prices on a
specified future date after shipment to the customer (the ‘quotation period’). Adjustments to the sales
price occur, based on movements in quoted market prices up to the date of final settlement. The period
between provisional invoicing and final settlement can be between one and six months.
The provisionally priced sales of metal in concentrate contain an embedded derivative, which is required
to be separated from the host contract for accounting purposes. The host contract is the sale of metals
in concentrate and the embedded derivative is the forward contract for which the provisional sale is
subsequently adjusted.
Accordingly the embedded derivative, which does not qualify for hedge accounting, is recognised at fair
value, with subsequent changes in the fair value recognised in profit or loss each period until final
settlement, and presented as ‘other income’. Changes in fair value over the quotation period and up
until final settlement are estimated by reference to forward market prices for gold and copper.
Stripping costs
Costs associated with stripping activity, which is the process of removing mine waste materials to gain
access to the mineral deposits underneath, during the production phase of surface mining are
accounted for as either inventory or a non-current asset (non-current asset is also referred to as a
‘stripping activity asset’).
To the extent that the benefit from the stripping activity is realised in the form of inventory produced, the
Group accounts for the costs of that stripping activity in accordance with the principles of AASB 102
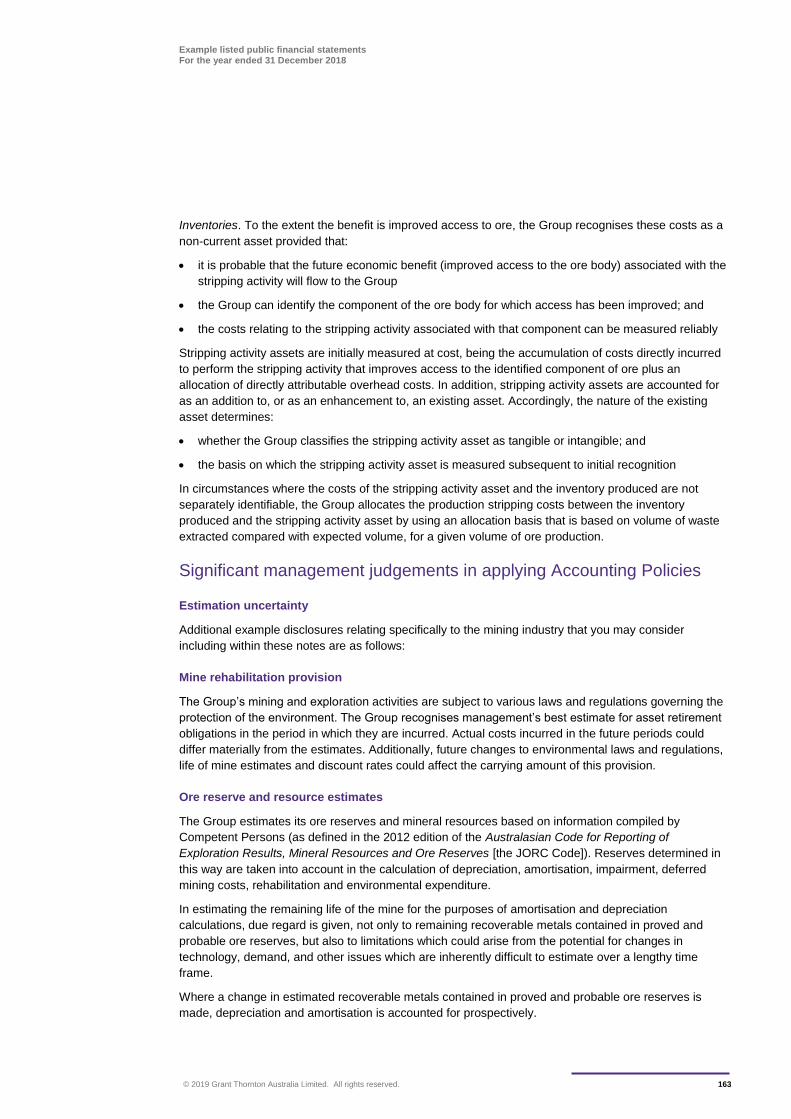
Example listed public financial statements For the year ended 31 December 2018
© 2019 Grant Thornton Australia Limited. All rights reserved. 163
Inventories. To the extent the benefit is improved access to ore, the Group recognises these costs as a
non-current asset provided that:
it is probable that the future economic benefit (improved access to the ore body) associated with the
stripping activity will flow to the Group
the Group can identify the component of the ore body for which access has been improved; and
the costs relating to the stripping activity associated with that component can be measured reliably
Stripping activity assets are initially measured at cost, being the accumulation of costs directly incurred
to perform the stripping activity that improves access to the identified component of ore plus an
allocation of directly attributable overhead costs. In addition, stripping activity assets are accounted for
as an addition to, or as an enhancement to, an existing asset. Accordingly, the nature of the existing
asset determines:
whether the Group classifies the stripping activity asset as tangible or intangible; and
the basis on which the stripping activity asset is measured subsequent to initial recognition
In circumstances where the costs of the stripping activity asset and the inventory produced are not
separately identifiable, the Group allocates the production stripping costs between the inventory
produced and the stripping activity asset by using an allocation basis that is based on volume of waste
extracted compared with expected volume, for a given volume of ore production.
Significant management judgements in applying Accounting Policies
Estimation uncertainty
Additional example disclosures relating specifically to the mining industry that you may consider
including within these notes are as follows:
Mine rehabilitation provision
The Group’s mining and exploration activities are subject to various laws and regulations governing the
protection of the environment. The Group recognises management’s best estimate for asset retirement
obligations in the period in which they are incurred. Actual costs incurred in the future periods could
differ materially from the estimates. Additionally, future changes to environmental laws and regulations,
life of mine estimates and discount rates could affect the carrying amount of this provision.
Ore reserve and resource estimates
The Group estimates its ore reserves and mineral resources based on information compiled by
Competent Persons (as defined in the 2012 edition of the Australasian Code for Reporting of
Exploration Results, Mineral Resources and Ore Reserves [the JORC Code]). Reserves determined in
this way are taken into account in the calculation of depreciation, amortisation, impairment, deferred
mining costs, rehabilitation and environmental expenditure.
In estimating the remaining life of the mine for the purposes of amortisation and depreciation
calculations, due regard is given, not only to remaining recoverable metals contained in proved and
probable ore reserves, but also to limitations which could arise from the potential for changes in
technology, demand, and other issues which are inherently difficult to estimate over a lengthy time
frame.
Where a change in estimated recoverable metals contained in proved and probable ore reserves is
made, depreciation and amortisation is accounted for prospectively.
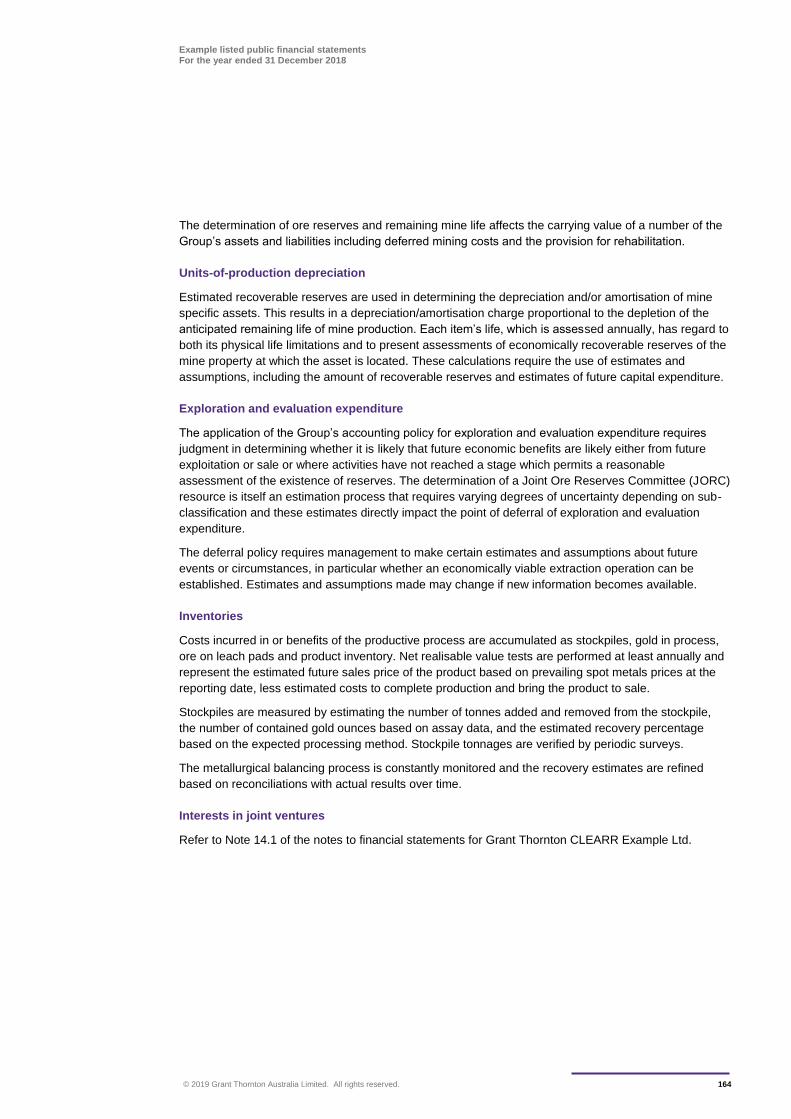
Example listed public financial statements For the year ended 31 December 2018
© 2019 Grant Thornton Australia Limited. All rights reserved. 164
The determination of ore reserves and remaining mine life affects the carrying value of a number of the
Group’s assets and liabilities including deferred mining costs and the provision for rehabilitation.
Units-of-production depreciation
Estimated recoverable reserves are used in determining the depreciation and/or amortisation of mine
specific assets. This results in a depreciation/amortisation charge proportional to the depletion of the
anticipated remaining life of mine production. Each item’s life, which is assessed annually, has regard to
both its physical life limitations and to present assessments of economically recoverable reserves of the
mine property at which the asset is located. These calculations require the use of estimates and
assumptions, including the amount of recoverable reserves and estimates of future capital expenditure.
Exploration and evaluation expenditure
The application of the Group’s accounting policy for exploration and evaluation expenditure requires
judgment in determining whether it is likely that future economic benefits are likely either from future
exploitation or sale or where activities have not reached a stage which permits a reasonable
assessment of the existence of reserves. The determination of a Joint Ore Reserves Committee (JORC)
resource is itself an estimation process that requires varying degrees of uncertainty depending on sub-
classification and these estimates directly impact the point of deferral of exploration and evaluation
expenditure.
The deferral policy requires management to make certain estimates and assumptions about future
events or circumstances, in particular whether an economically viable extraction operation can be
established. Estimates and assumptions made may change if new information becomes available.
Inventories
Costs incurred in or benefits of the productive process are accumulated as stockpiles, gold in process,
ore on leach pads and product inventory. Net realisable value tests are performed at least annually and
represent the estimated future sales price of the product based on prevailing spot metals prices at the
reporting date, less estimated costs to complete production and bring the product to sale.
Stockpiles are measured by estimating the number of tonnes added and removed from the stockpile,
the number of contained gold ounces based on assay data, and the estimated recovery percentage
based on the expected processing method. Stockpile tonnages are verified by periodic surveys.
The metallurgical balancing process is constantly monitored and the recovery estimates are refined
based on reconciliations with actual results over time.
Interests in joint ventures
Refer to Note 14.1 of the notes to financial statements for Grant Thornton CLEARR Example Ltd.
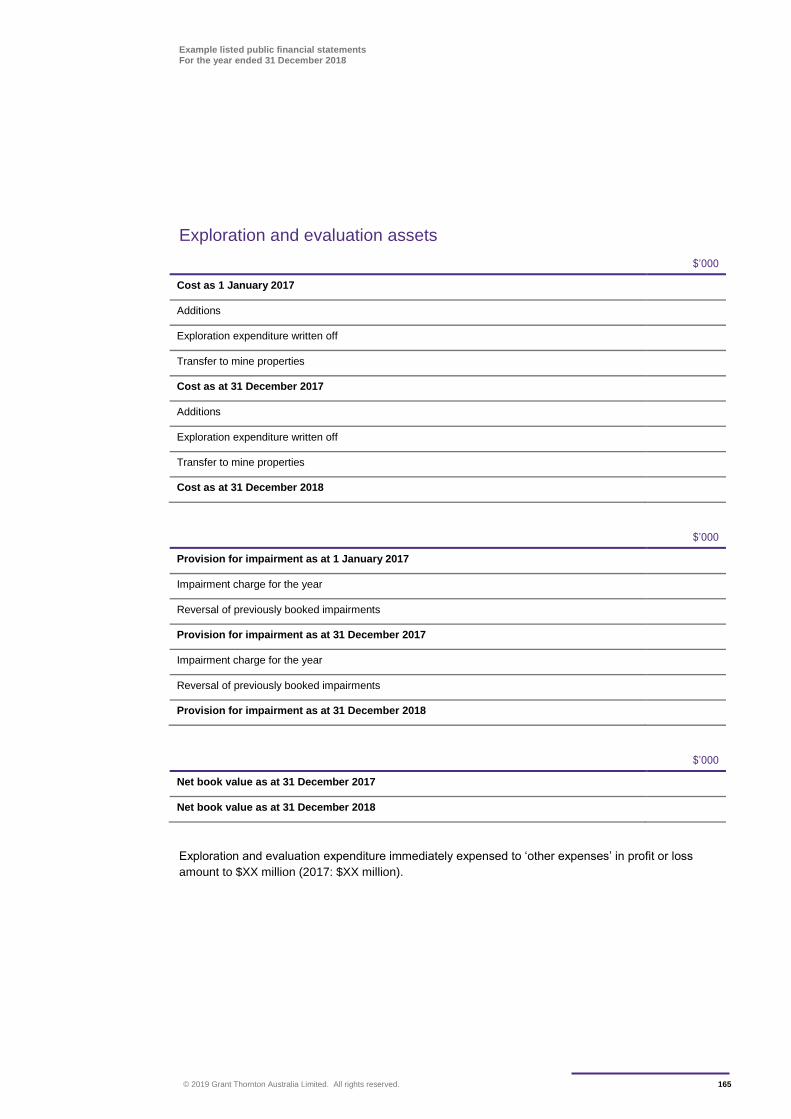
Example listed public financial statements For the year ended 31 December 2018
© 2019 Grant Thornton Australia Limited. All rights reserved. 165
Exploration and evaluation assets
$’000
Cost as 1 January 2017
Additions
Exploration expenditure written off
Transfer to mine properties
Cost as at 31 December 2017
Additions
Exploration expenditure written off
Transfer to mine properties
Cost as at 31 December 2018
$’000
Provision for impairment as at 1 January 2017
Impairment charge for the year
Reversal of previously booked impairments
Provision for impairment as at 31 December 2017
Impairment charge for the year
Reversal of previously booked impairments
Provision for impairment as at 31 December 2018
$’000
Net book value as at 31 December 2017
Net book value as at 31 December 2018
Exploration and evaluation expenditure immediately expensed to ‘other expenses’ in profit or loss
amount to $XX million (2017: $XX million).
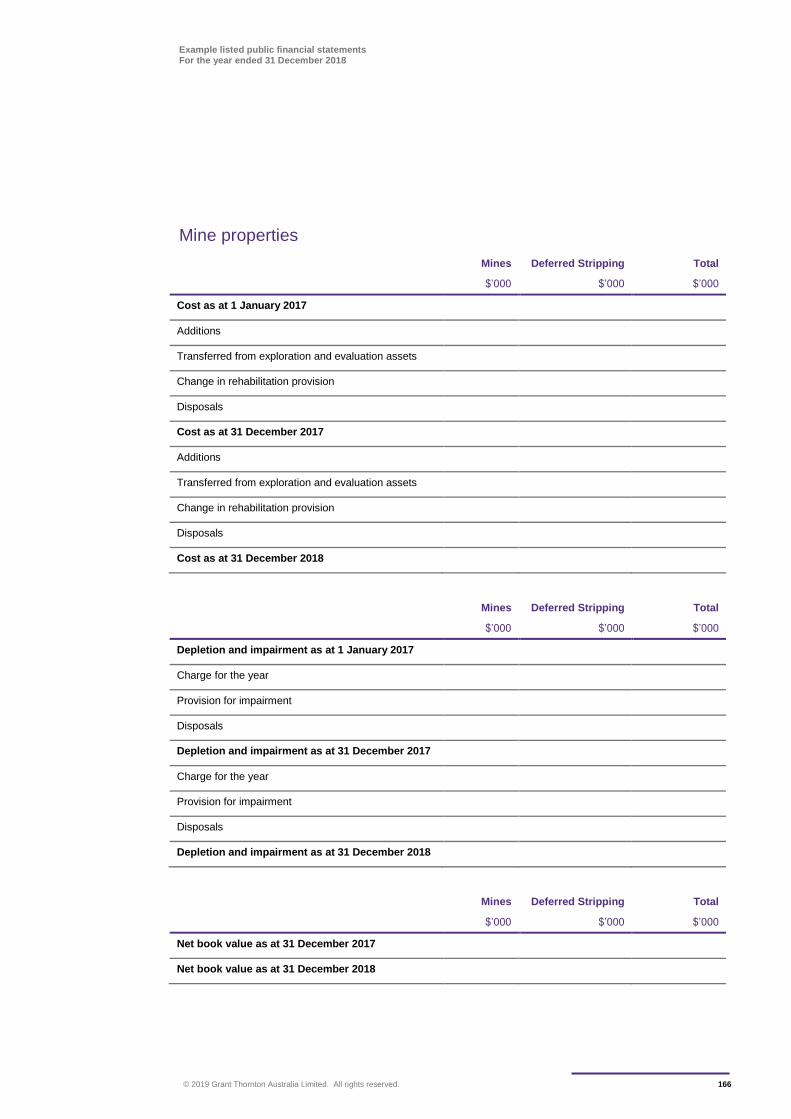
Example listed public financial statements For the year ended 31 December 2018
© 2019 Grant Thornton Australia Limited. All rights reserved. 166
Mine properties
Mines Deferred Stripping Total
$’000 $’000 $’000
Cost as at 1 January 2017
Additions
Transferred from exploration and evaluation assets
Change in rehabilitation provision
Disposals
Cost as at 31 December 2017
Additions
Transferred from exploration and evaluation assets
Change in rehabilitation provision
Disposals
Cost as at 31 December 2018
Mines Deferred Stripping Total
$’000 $’000 $’000
Depletion and impairment as at 1 January 2017
Charge for the year
Provision for impairment
Disposals
Depletion and impairment as at 31 December 2017
Charge for the year
Provision for impairment
Disposals
Depletion and impairment as at 31 December 2018
Mines Deferred Stripping Total
$’000 $’000 $’000
Net book value as at 31 December 2017
Net book value as at 31 December 2018
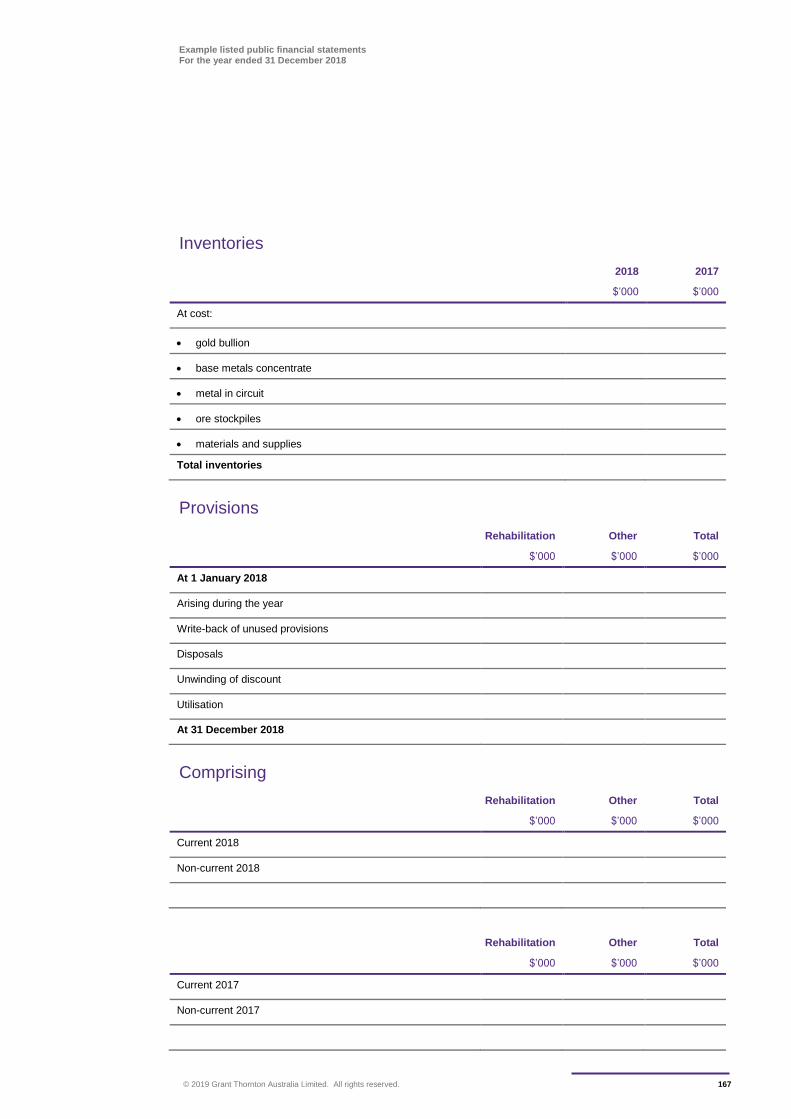
Example listed public financial statements For the year ended 31 December 2018
© 2019 Grant Thornton Australia Limited. All rights reserved. 167
Inventories
2018 2017
$’000 $’000
At cost:
gold bullion
base metals concentrate
metal in circuit
ore stockpiles
materials and supplies
Total inventories
Provisions
Rehabilitation Other Total
$’000 $’000 $’000
At 1 January 2018
Arising during the year
Write-back of unused provisions
Disposals
Unwinding of discount
Utilisation
At 31 December 2018
Comprising
Rehabilitation Other Total
$’000 $’000 $’000
Current 2018
Non-current 2018
Rehabilitation Other Total
$’000 $’000 $’000
Current 2017
Non-current 2017

Example listed public financial statements For the year ended 31 December 2018
© 2019 Grant Thornton Australia Limited. All rights reserved. 168
Rehabilitation provision
The Group makes full provision for the future cost of rehabilitating mine sites and related production
facilities on a discounted basis at the time of developing the mines and installing and using those
facilities.
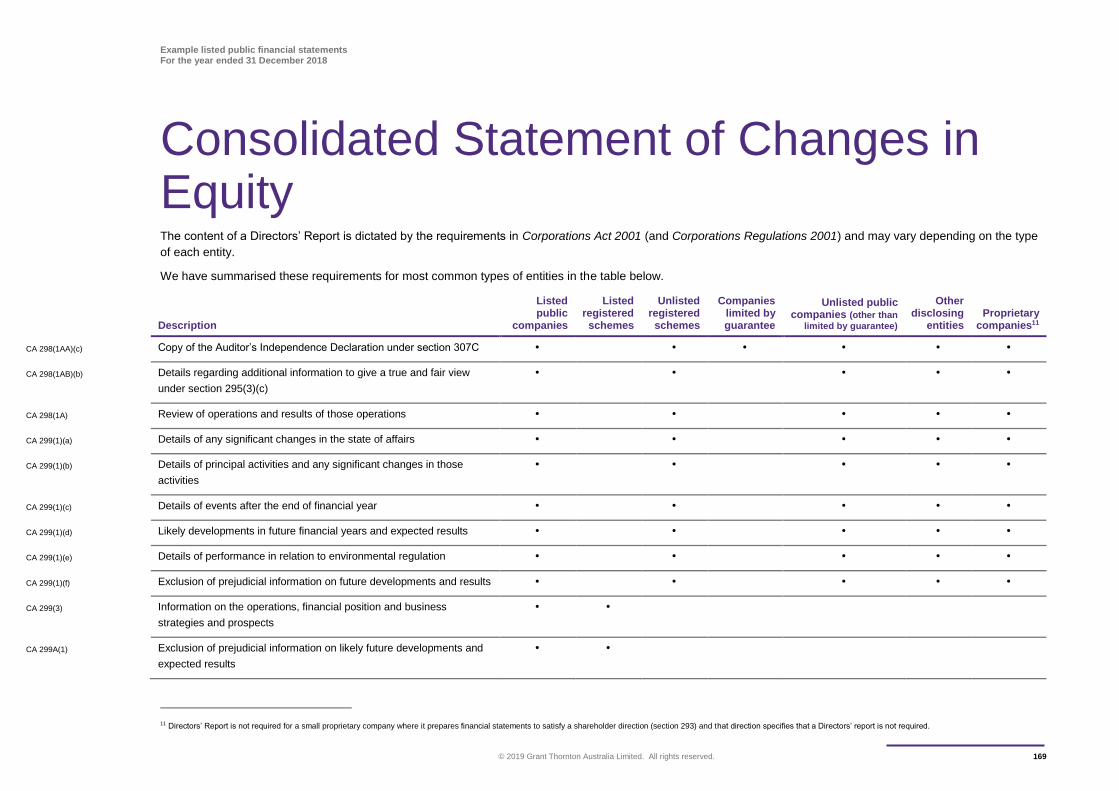
Example listed public financial statements For the year ended 31 December 2018
© 2019 Grant Thornton Australia Limited. All rights reserved. 169
The content of a Directors’ Report is dictated by the requirements in Corporations Act 2001 (and Corporations Regulations 2001) and may vary depending on the type
of each entity.
We have summarised these requirements for most common types of entities in the table below.
Description
Listed public
companies
Listed registered
schemes
Unlisted registered
schemes
Companies limited by guarantee
Unlisted public companies (other than
limited by guarantee)
Other disclosing
entities Proprietary
companies11
CA 298(1AA)(c) Copy of the Auditor’s Independence Declaration under section 307C • • • • • •
CA 298(1AB)(b) Details regarding additional information to give a true and fair view
under section 295(3)(c)
• • • • •
CA 298(1A) Review of operations and results of those operations • • • • •
CA 299(1)(a) Details of any significant changes in the state of affairs • • • • •
CA 299(1)(b) Details of principal activities and any significant changes in those
activities
• • • • •
CA 299(1)(c) Details of events after the end of financial year • • • • •
CA 299(1)(d) Likely developments in future financial years and expected results • • • • •
CA 299(1)(e) Details of performance in relation to environmental regulation • • • • •
CA 299(1)(f) Exclusion of prejudicial information on future developments and results • • • • •
CA 299(3) Information on the operations, financial position and business
strategies and prospects
• •
CA 299A(1) Exclusion of prejudicial information on likely future developments and
expected results
• •
11 Directors’ Report is not required for a small proprietary company where it prepares financial statements to satisfy a shareholder direction (section 293) and that direction specifies that a Directors’ report is not required.
Consolidated Statement of Changes in Equity
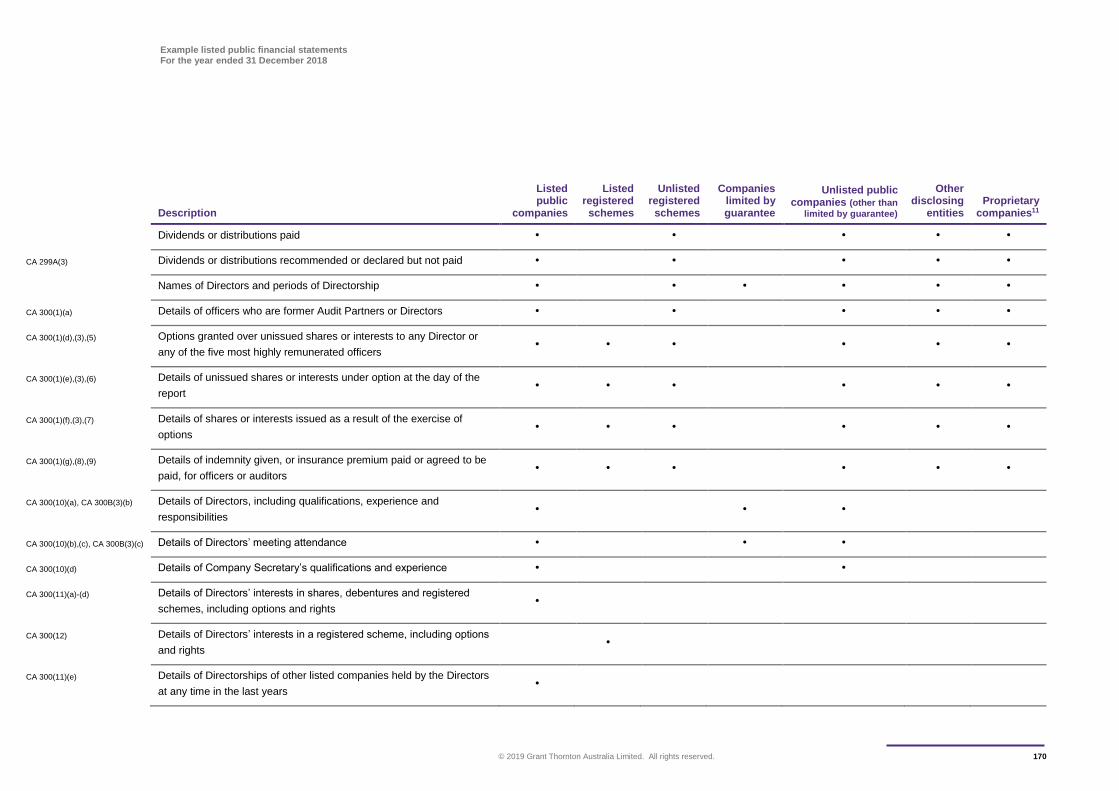
Example listed public financial statements For the year ended 31 December 2018
© 2019 Grant Thornton Australia Limited. All rights reserved. 170
Description
Listed public
companies
Listed registered
schemes
Unlisted registered
schemes
Companies limited by guarantee
Unlisted public companies (other than
limited by guarantee)
Other disclosing
entities Proprietary
companies11
Dividends or distributions paid • • • • •
CA 299A(3) Dividends or distributions recommended or declared but not paid • • • • •
Names of Directors and periods of Directorship • • • • • •
CA 300(1)(a) Details of officers who are former Audit Partners or Directors • • • • •
CA 300(1)(d),(3),(5) Options granted over unissued shares or interests to any Director or
any of the five most highly remunerated officers • • • • • •
CA 300(1)(e),(3),(6) Details of unissued shares or interests under option at the day of the
report • • • • • •
CA 300(1)(f),(3),(7) Details of shares or interests issued as a result of the exercise of
options • • • • • •
CA 300(1)(g),(8),(9) Details of indemnity given, or insurance premium paid or agreed to be
paid, for officers or auditors • • • • • •
CA 300(10)(a), CA 300B(3)(b) Details of Directors, including qualifications, experience and
responsibilities • • •
CA 300(10)(b),(c), CA 300B(3)(c) Details of Directors’ meeting attendance • • •
CA 300(10)(d) Details of Company Secretary’s qualifications and experience • •
CA 300(11)(a)-(d) Details of Directors’ interests in shares, debentures and registered
schemes, including options and rights •
CA 300(12) Details of Directors’ interests in a registered scheme, including options
and rights •
CA 300(11)(e) Details of Directorships of other listed companies held by the Directors
at any time in the last years •
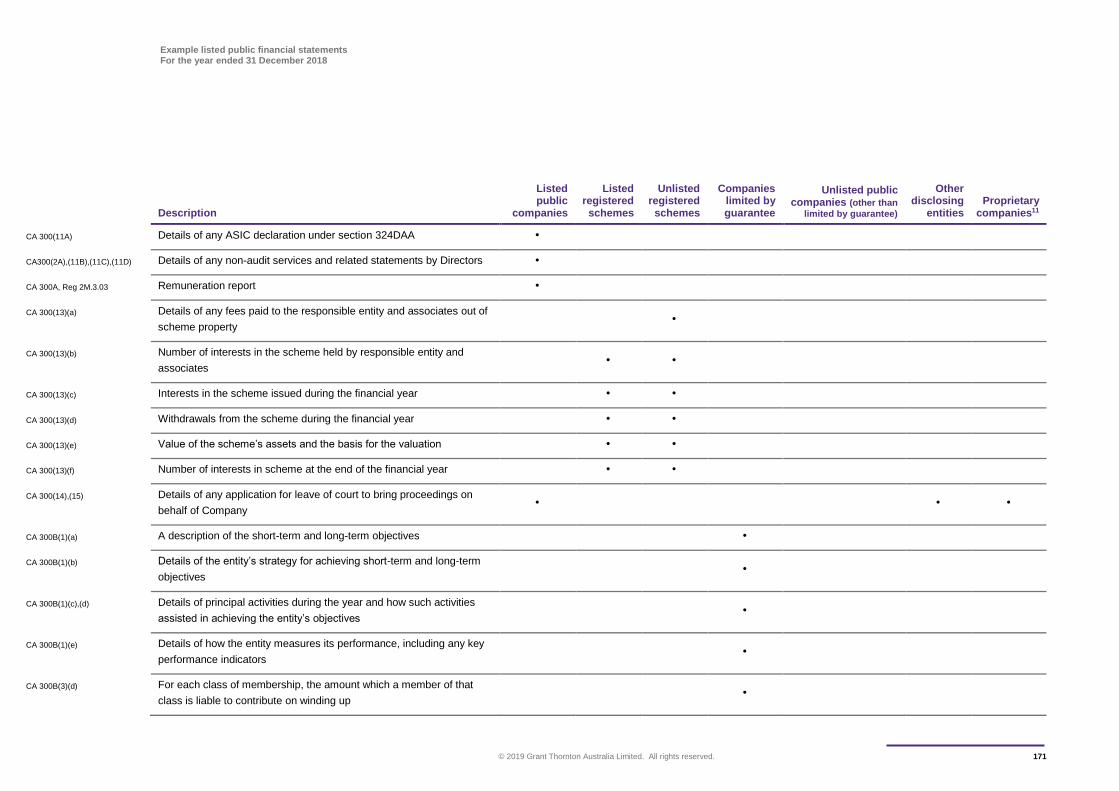
Example listed public financial statements For the year ended 31 December 2018
© 2019 Grant Thornton Australia Limited. All rights reserved. 171
Description
Listed public
companies
Listed registered
schemes
Unlisted registered
schemes
Companies limited by guarantee
Unlisted public companies (other than
limited by guarantee)
Other disclosing
entities Proprietary
companies11
CA 300(11A) Details of any ASIC declaration under section 324DAA •
CA300(2A),(11B),(11C),(11D) Details of any non-audit services and related statements by Directors •
CA 300A, Reg 2M.3.03 Remuneration report •
CA 300(13)(a) Details of any fees paid to the responsible entity and associates out of
scheme property •
CA 300(13)(b) Number of interests in the scheme held by responsible entity and
associates • •
CA 300(13)(c) Interests in the scheme issued during the financial year • •
CA 300(13)(d) Withdrawals from the scheme during the financial year • •
CA 300(13)(e) Value of the scheme’s assets and the basis for the valuation • •
CA 300(13)(f) Number of interests in scheme at the end of the financial year • •
CA 300(14),(15) Details of any application for leave of court to bring proceedings on
behalf of Company • • •
CA 300B(1)(a) A description of the short-term and long-term objectives •
CA 300B(1)(b) Details of the entity’s strategy for achieving short-term and long-term
objectives •
CA 300B(1)(c),(d) Details of principal activities during the year and how such activities
assisted in achieving the entity’s objectives •
CA 300B(1)(e) Details of how the entity measures its performance, including any key
performance indicators •
CA 300B(3)(d) For each class of membership, the amount which a member of that
class is liable to contribute on winding up •
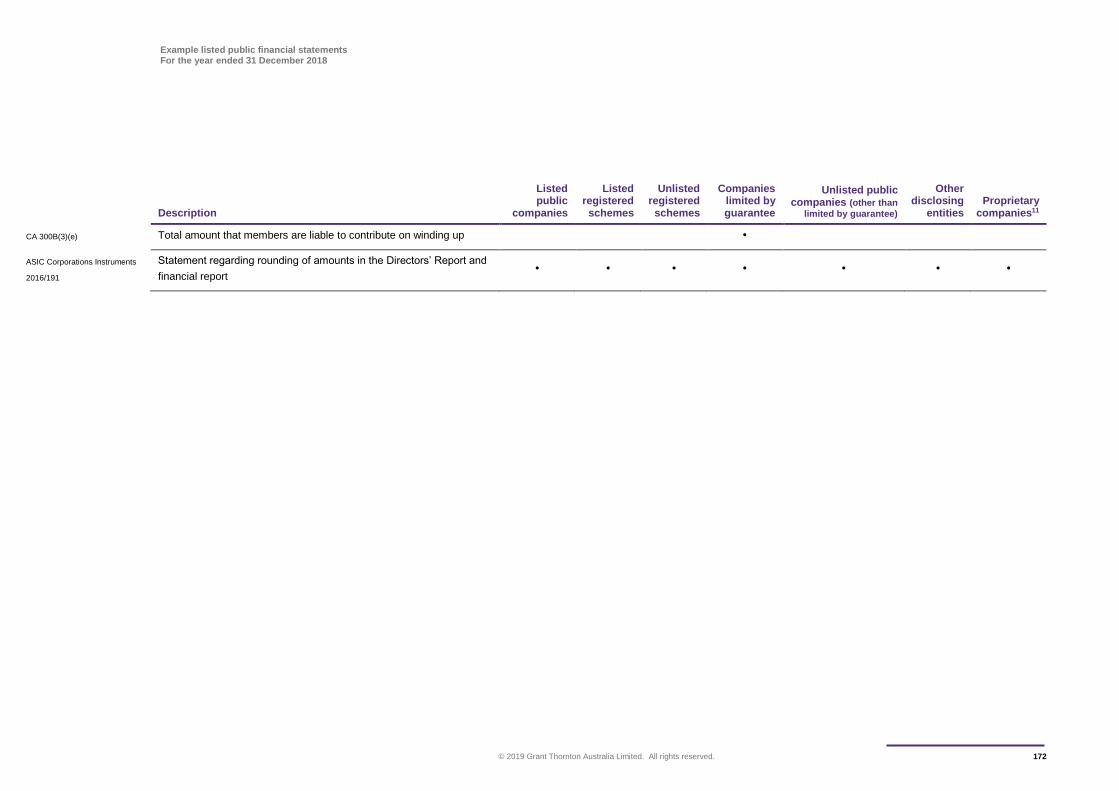
Example listed public financial statements For the year ended 31 December 2018
© 2019 Grant Thornton Australia Limited. All rights reserved. 172
Description
Listed public
companies
Listed registered
schemes
Unlisted registered
schemes
Companies limited by guarantee
Unlisted public companies (other than
limited by guarantee)
Other disclosing
entities Proprietary
companies11
CA 300B(3)(e) Total amount that members are liable to contribute on winding up •
ASIC Corporations Instruments
2016/191
Statement regarding rounding of amounts in the Directors’ Report and
financial report • • • • • • •
Example listed public financial statements For the year ended 31 December 2018
© 2019 Grant Thornton Australia Limited. All rights reserved. 173
An independent auditor’s report will be prepared by the entity’s auditor in accordance with Australian
Auditing Standards. This publication does not include an illustrative report as the wording of the report
may differ between entities.
Independent Auditor’s Report
www.grantthornton.com.au The information contained herein is of a general nature and is not intended to address the circumstances of any particular individual or entity. Although we endeavour to provide accurate and timely information, there can be no guarantee that such information is accurate as of the date it is received or that it will continue to be accurate in the future. No one is entitled to rely on this information and no one should act on such information without appropriate professional advice obtained after a thorough examination of the particular situation.
‘Grant Thornton’ refers to the brand under which the Grant Thornton member firms provide assurance, tax and advisory services to their clients and/or refers to one or more member firms, as the context requires. Grant Thornton Australia Ltd is a member f irm of Grant Thornton International Ltd (GTIL). GTIL and the member firms are not a worldwide partnership. GTIL and each member firm is a separate legal entity. Services are delivered by the member firms. GTIL does not provide services to clients. GTIL and its member firms are not agents of, and do not obligate one another and are not liable for one another’s acts or omissions. In the Australian context only, the use of the term ‘Grant Thornton’ may refer to Grant Thornton Australia Limited ABN 41 127 556 389 and its Australian subsidiaries and related entities. GTIL is not an Australian related entity to Grant Thornton Australia Limited.
Liability limited by a scheme approved under Professional Standards Legislation. © 2019 Grant Thornton International Ltd. All rights reserved. "[click here to update disclaimer]"
grantthornton.com.au © 2019 Grant Thornton Australia Ltd. All rights reserved.


![Example Consolidated Financial Statements 2008[1]](https://img.pdfslide.net/doc/110x75/55cf91a1550346f57b8f1a59/example-consolidated-financial-statements-20081.jpg)