Embed Size (px)
Citation preview

SEDIMENTOLOGY AND DEPOSITIONAL ENVIRONMENT OF THE WADESBORO SUB-‐BASIN, EASTERN PIEDMONT, NORTH CAROLINA
Seth Brazell

I. INTRODUCTION
Background
Rift basins form under extensional tectonic regimes and contain valuable
repositories of sediment that record signiOicant episodes of geologic history
(LeTourneau and Olsen 2003; Schlische 1993). The timing and rates of rifting can be
constrained by documenting the age, thickness, and stratigraphy of rift basin
sequences (Randazzo et al. 1970, Tiercelin 1990). The Mesozoic rift basins of
eastern North America provide valuable sedimentary records for the breakup of
Pangea in Triassic and Jurassic times. In addition, these rift basins are known to
contain valuable economic resources including oil, coal, natural gas, uranium, and
materials used for brick-‐making (Schlische 1993; Olsen et al. 1996, Olsen et al.
1991). Further study is needed to constrain the geometries of extensional basins so
that accurate Oilling models of the basins can be developed (Schlische and Olsen
1990).
The following proposed research project focuses on a Mesozoic rift basin
located in the Piedmont physiographic province of North Carolina. Rift basins
located in North Carolina include the Dan River Basin, the Deep River Group
(Durham, Sanford, and Wadesboro sub-‐basins) and small outliers, the Davie County
Basin and the Ellerbe basin. This study focuses on the southernmost exposed sub-‐
basin of the Deep River Group, the Wadesboro basin, which covers portions of
Union, Anson, Richmond, and Montgomery Counties and a portion crosses into
South Carolina (Figure 1).
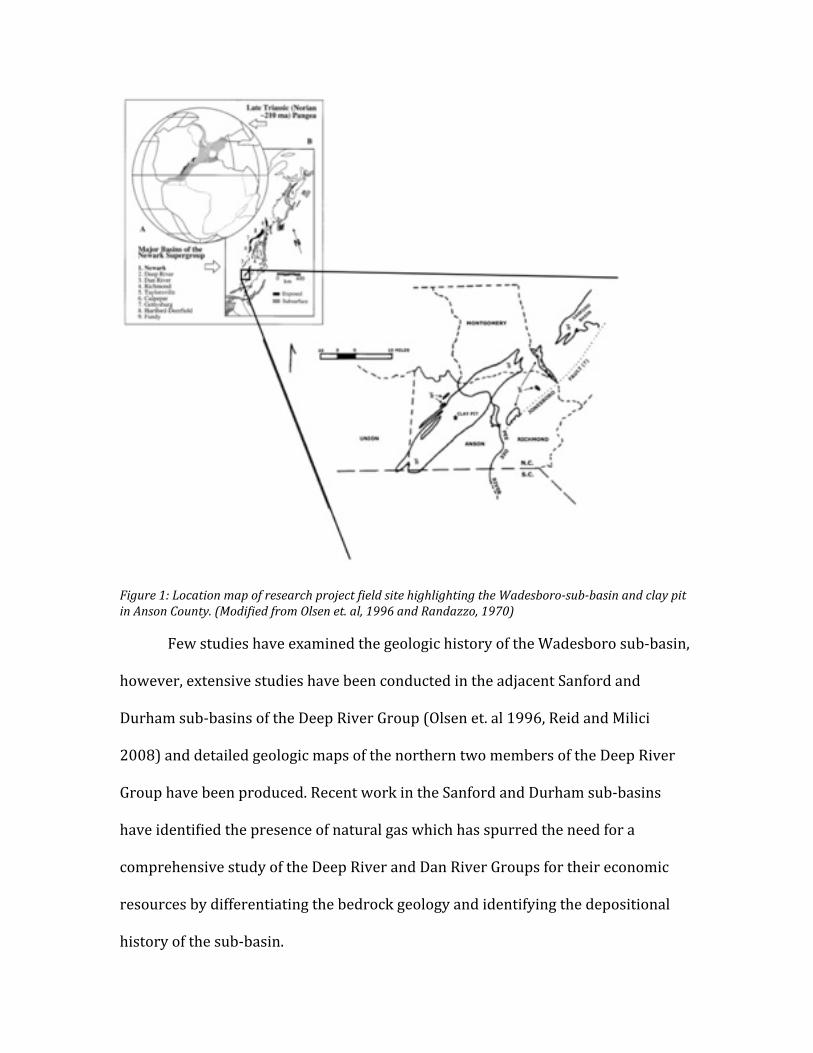
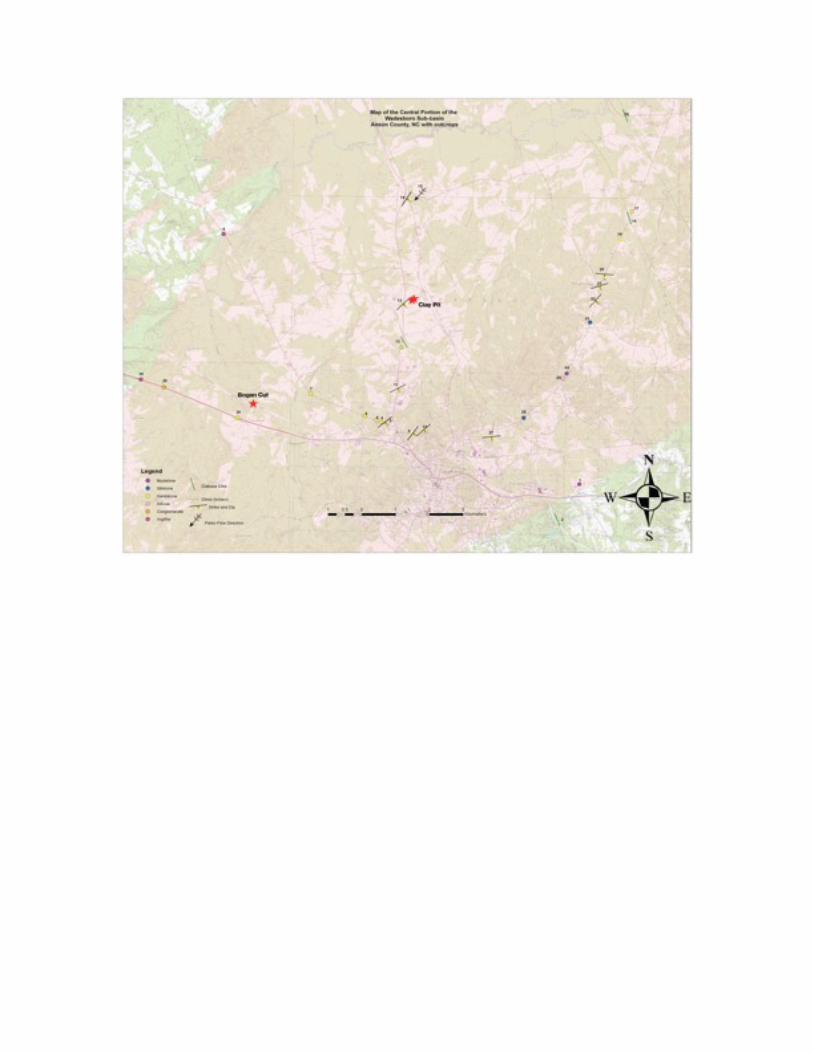
Figure 1: Location map of research project 9ield site highlighting the Wadesboro-‐sub-‐basin and clay pit in Anson County. (Modi9ied from Olsen et. al, 1996 and Randazzo, 1970)
Few studies have examined the geologic history of the Wadesboro sub-‐basin,
however, extensive studies have been conducted in the adjacent Sanford and
Durham sub-‐basins of the Deep River Group (Olsen et. al 1996, Reid and Milici
2008) and detailed geologic maps of the northern two members of the Deep River
Group have been produced. Recent work in the Sanford and Durham sub-‐basins
have identiOied the presence of natural gas which has spurred the need for a
comprehensive study of the Deep River and Dan River Groups for their economic
resources by differentiating the bedrock geology and identifying the depositional
history of the sub-‐basin.

In order to reconstruct the geologic history of the Wadesboro sub-‐basin and
assess its economic potential, a detailed study, including petrographic, stratigraphic,
and structural analyses, is proposed here. Previous studies of the Wadesboro sub-‐
basin have been limited in extent by comparison to other basins within the Newark
Supergroup (Clark et al. 2001). Since 1970 there have been few studies of the
Wadesboro sub-‐basin; furthermore, detailed geologic mapping for the Wadesboro
sub-‐basin is absent, and stratigraphic units are only generally deOined (Randazzo et
al. 1970). This study proposes to document the geometry, sedimentology,
depositional environments and economic potential of the central portion of the
Wadesboro sub-‐basin. Central to this study is the detailed study of the
sedimentology, stratigraphy and provenance of 87 meters of exposure in a clay pit
that is located in the geographic center of the Wadesboro sub-‐basin. The facies and
stratigraphy identiOied from detailed work at the clay pit will be extended to a map
area comprising the southern-‐central portion of the Wadesboro sub-‐basin, which is
typiOied by limited and poor surface exposures.
This project aims to Oill a gap in knowledge concerning the geologic history of
the Wadesboro sub-‐basin. This will be accomplished by a combination of detailed
sedimentologic logging, facies analysis, petrographic analysis, and geologic mapping.
Literature Review
Pangea began to break up during the Mesozoic period approximately 200Ma.
Extensional forces produced by this rifting event created a series of segmented
faults along the eastern margin of the North American continent that paralleled

Paleozoic contractional structures and faults that were activated during the
Appalachian orogen and where extensional forces were at a high angle to the
preexisting structures (Schlische 1993). These segmented faults produced
numerous northeast-‐southwest trending half-‐graben basins known as the Newark
Supergroup that are present, exposed or buried, from Nova-‐Scotia to Florida. The
highest displacement along the border fault systems occur in the center of the
basins with decreasing displacement toward the ends of the basins. As the border
fault systems grew during extension the basins likely widened and linked to other
once isolated basins. Most of the exposed Mesozoic basins experienced an incipient
period of Oluvial sedimentation that was replaced by lacustrine sedimentation
(Schlische 1993).
Most extensional basin Oilling models have focused on tectonics (differential
subsidence) and climate Oluctuations as the mechanisms controlling depositional
environments. Other models have attributed transitions from Oluvial to lacustrine
environments to increases or decreases in sediment supply (Lambiase and
Bosworth, 1995), however, Schlische and Olsen have proposed a simple model that
assumes constant subsidence and inputs of sediment and water, a model that yields
results consistent with previous theoretical models and observed basin Oilling
(Schlische and Olsen 1990, Tiercelin 1990). The Schlische and Olsen model
prediction suggests Oluvial and alluvial deposition during initial subsidence,
processes indicative of open-‐basin conditions, followed by a transition to lacustrine
deposition as the basin grows. During lacustrine deposition the basin continues to
grow and transitions from an open to a closed-‐basin environment, which results in

deep lacustrine deposition followed by a further subsidence, a wider and shallower
basin, and a decrease in lacustrine deposition with a Oinal return to Oluvial
deposition (Schlische and Olsen, 1990). The Oilling model proposed by Schlische and
Olsen makes simple assumptions that do not reOlect the obvious complexities of
many extensional basins and, furthermore, this model assumes full-‐graben basin
architecture though evidence is available to suggest a correlation of the Oilling model
for half-‐graben basins.
Quantitatively analyzing basin sediments for changing provenance is another
aspect of this project. Provenance analysis is never straight forward, however,
advances have been made in the last few decades. Large concentrations of zircon,
tourmaline, and rutile and Zr/Sc ratios have been used to suggest sediment
recycling and may be used to suggest interbasin sediment transport (Huert, 1962
and McLennan et al., 1993). SEM, CL, and ICP-‐MS have also been used as
microscopic-‐morphological techniques to constrain protolith characteristics (Weltje
and von Eynatten, 2004)
Of the 9 major basins the Deep River basin is the southern most exposed
basin in North America. The Deep River Basin is sub divided into three basins, the
Durham sub-‐basin, Sanford sub-‐basin, and the Wadesboro sub-‐basin from north to
south, respectively. The three basins are structurally separated by cross structures
with the Durham and Sanford sub-‐basins separated by the Colon cross structure and
the Sanford and Wadesboro sub-‐basins separated by the Pekin cross-‐structure. The
Durham and Sanford sub-‐basins are differentiated by the presence of dark, organic
rich strata that is not present or is unexposed in the Wadesboro sub-‐basin. Of the

three sub-‐basins, the Wadesboro sub-‐basin is the least studied and much of the
strata remain undifferentiated.
Studies that have been conducted in the Wadesboro sub-‐basin (Reinemund
1955, Zablocki 1959, Randazzo et al. 1970, Clark et. al 2001, and Reid and Milici
2008,) lack fundamental context to cohesively address important economic
questions of today. The development of a geologic framework including a detailed
bedrock map, and understanding of basin depositional history and the identiOication
of formations is needed to assess the economic potential of the Wadesboro sub-‐
basin.
II. PROBLEM STATEMENT
Few studies of the Wadesboro sub-‐basin exist that examine the extent of lithologies
present in the basin and their depositional environments. Coal and other economic
deposits have been identiOied in adjacent basins within the Deep River Group
(Sanford and Durham sub-‐basins), however no such deposits have been identiOied in
the Wadesboro sub-‐basin.
III. HYPOTHESES
The hypotheses to be tested include: 1) whether depositional environments such as
alluvial fans, axial Oluvial rivers, and lakes can be recognized in the Wadesboro sub-‐
basin; 2) are the depositional environments tectonically controlled; 3) did

sedimentary provenance change over time; and 4) did conditions exist for natural
gas production? This study will document the sedimentology and depositional
environments of the Wadesboro sub-‐basin. This information will be used to
constrain the tectonic controls on basin evolution and to assess natural gas potential
of the Wadesboro sub-‐basin.
IV. METHODS
This project aims to Oill a gap in knowledge concerning the geologic history of the
Wadesboro sub-‐basin. This will be accomplished by a combination of detailed
sedimentologic logging, facies analysis, petrography, and geologic mapping. Each of
the hypotheses can be tested by this approach.
Hypothesis 1: Sedimentologic logging and facies analysis should provide a
detailed record of sedimentary environments that existed during rifting of the basin.
Interpretation of the various depositional environments will depend on comparison
of sedimentologic logs from the Wadesboro sub-‐basin with established facies
models (e.g. Cant and Walker 1978) and well-‐documented sections from other
Triassic rift basins (e.g. Olsen et al. 1996). To address this problem, a detailed study
of a brick quarry in Anson County, NC, has been initiated. The facies established in
the clay pit will be used to extend a geologic map to those portions of the basin that
lack good exposures.
Hypothesis 2: Geologic mapping of the central portion of the Wadesboro sub-‐
basin (an area equivalent to a standard USGS 7.5’ quadrangle) will provide
information about thicknesses, attitude and distribution of stratigraphic units. This
map will identify faults, joints, and possibly folds within the sub-‐basin. Progressive
changes in dip could provide information about the amount and timing of fault
motion on the margins of the rift basin. The distribution of Oluvial channel deposits
could provide information about the fault control on the basin (e.g. Alexander and
Leeder 1987).
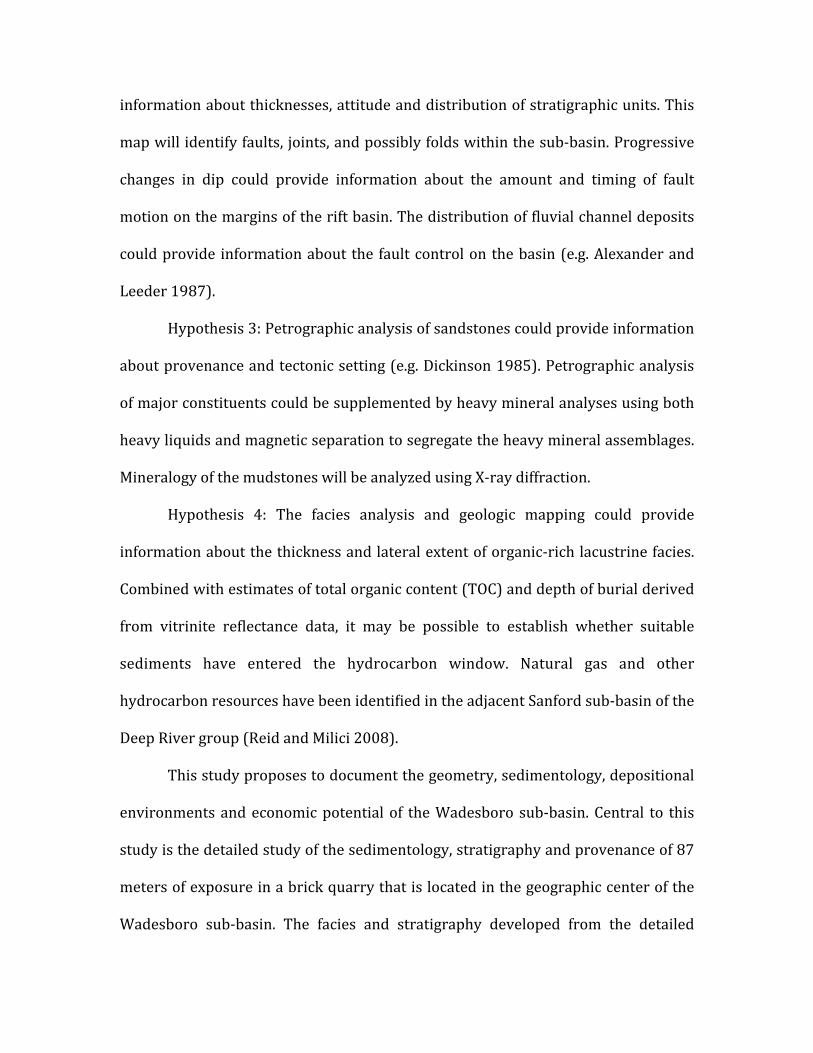
Hypothesis 3: Petrographic analysis of sandstones could provide information
about provenance and tectonic setting (e.g. Dickinson 1985). Petrographic analysis
of major constituents could be supplemented by heavy mineral analyses using both
heavy liquids and magnetic separation to segregate the heavy mineral assemblages.
Mineralogy of the mudstones will be analyzed using X-‐ray diffraction.
Hypothesis 4: The facies analysis and geologic mapping could provide
information about the thickness and lateral extent of organic-‐rich lacustrine facies.
Combined with estimates of total organic content (TOC) and depth of burial derived
from vitrinite reOlectance data, it may be possible to establish whether suitable
sediments have entered the hydrocarbon window. Natural gas and other
hydrocarbon resources have been identiOied in the adjacent Sanford sub-‐basin of the
Deep River group (Reid and Milici 2008).
This study proposes to document the geometry, sedimentology, depositional
environments and economic potential of the Wadesboro sub-‐basin. Central to this
study is the detailed study of the sedimentology, stratigraphy and provenance of 87
meters of exposure in a brick quarry that is located in the geographic center of the
Wadesboro sub-‐basin. The facies and stratigraphy developed from the detailed

work at that quarry will be extended to a map area comprising the southern half of
the Wadesboro sub-‐basin which is generally characterized by limited and poor
exposures.
V. PRELIMINARY RESULTS
Fieldwork in a clay pit in Anson County, N.C. has been conducted in which 87
meters of continuous exposure was sedimentologically described, sampled, and
logged (Appendix A). This stratigraphic work has identiOied 7 distinct lithofacies: 1)
a cyclic Oining upward facies 86.7-‐72.0m; 2) an interbedded sand and siltstone facies
72.0-‐61.4m; 3) a channelized deposit 61.4-‐54.5m; 4) a massive mudstone facies
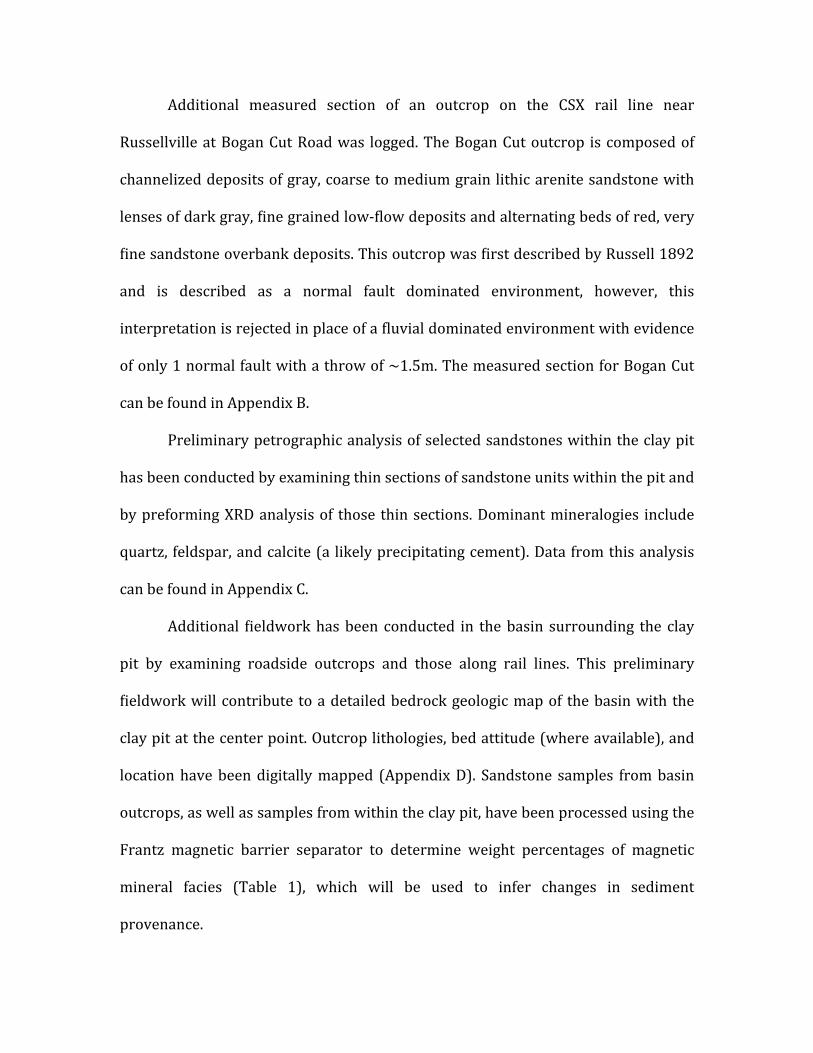
54.5-‐42.6m; 5) an interbedded mudstone, siltstone, and sandstone facies
42.6-‐23.0m; 6) an interbedded mudstone and siltstone with alternating gray and red
beds 23.0-‐1.7m; and 7) an organic rich gray shale in the lowest exposed section of
the pit located at 1.7-‐0m with a base not seen.
Facies 1 contains 7 cyclic Oining upward sequences, possibly climactically
inOluenced, that grade from Oine sandstone to siltstone and is interpreted as a
proximal Olood plain facies as crevasse splays were accreted onto a Olood plain
dominated by silt and clay. Facies 2 is not obviously cyclic but does display similar
Oining upward sequences as identiOied in facies 1. Facies 2 contains coarser grained
sandstones that generally Oine upward, interbedded with siltstones and is
interpreted as a proximal Olood plain facies when the channel was closer than facies
1. Facies 3 is interpreted as a channelized Oluvial deposit reaching 7m at its thickest
extent and spanning ~50m laterally that has eroded into facies 4 and contains very
coarse grained to granular sandstones that Oine upward to medium sandstone.

Trough cross stratiOication is visible in the deposit and a paleo-‐Olow direction of
azimuth 190° was measured suggesting axial basin Olow. Facies 4 is a massive, red,
silty-‐mudstone with numerous crosscutting veins of calcite .5-‐2cm thick with very
few thin beds of siltstone and very Oine sandstone 5-‐10cm thick. This facies is
interpreted as a distal Oloodplain facies as the dominant grain size is silt and clay
and thin beds of siltstone and sandstone that may have been deposited during large
Olood events. The bright red color and mottled texture of this facies suggests an
oxidizing environment and a vegetated surface, however, the presence of paleosols
was not observed in the Oield. Facies 5 contains siltstone beds 1-‐2m thick
interbedded with Oine to medium sandstones and small-‐scale coarsening upward
sequence with cross trough laminations and is interpreted as a Oluvial-‐dominated
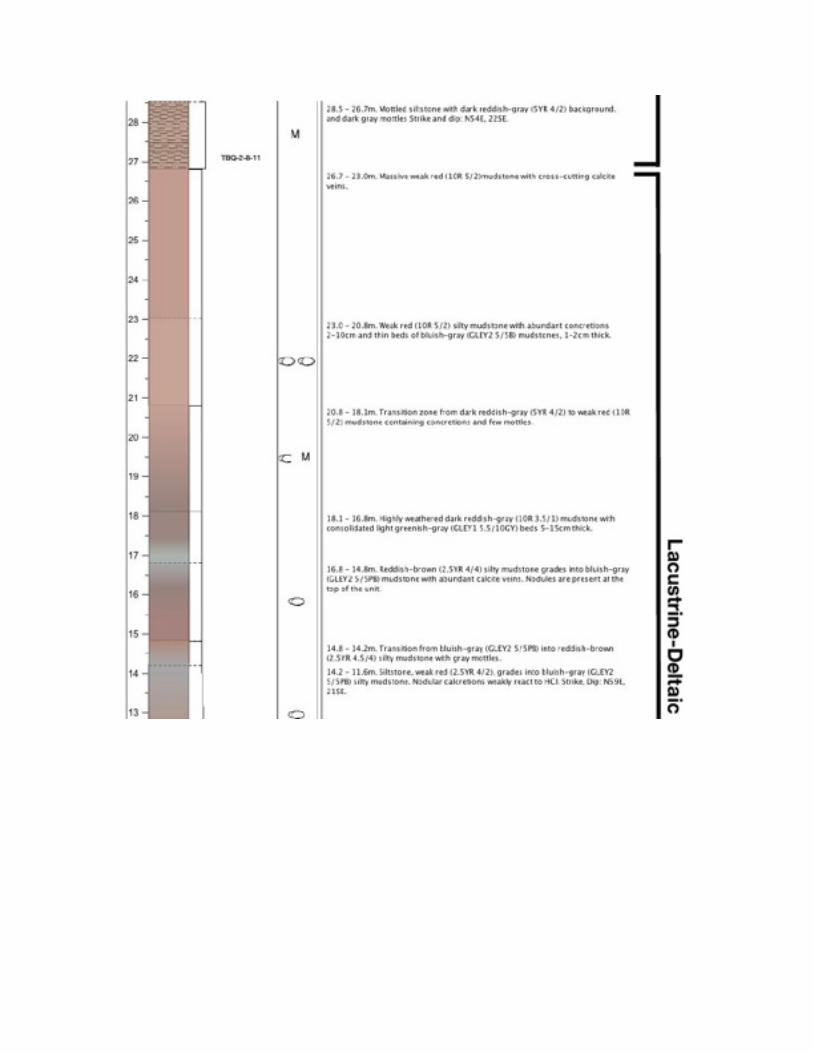
delta. Facies 6 represents a departure from Oluvial dominated depositional
environments and a transition to shallow lacustrine facies. This facies is comprised
of siltstone and silty-‐mudstones that alternate color from gray to red. This cyclic
color change is interpreted as a function of oxidizing and reducing environment as a
lacustrine transgression and regression. Desiccation cracks at the tops of gray
siltstone beds evidence periods of aridity and variable lake levels, which allowed the
subsequently deposited sediments to be oxidized. Facies 7 is partially exposed in
the clay pit and is comprised of gray shale and is interpreted as lacustrine in origin.
This bed is of interest for its potential to produce natural gas, however, initial Total
Organic Carbon (TOC) analysis does not support this view. There is anecdotal
evidence of numerous vertebrate fossils in facies 7, however, none were found
during preliminary Oield work.
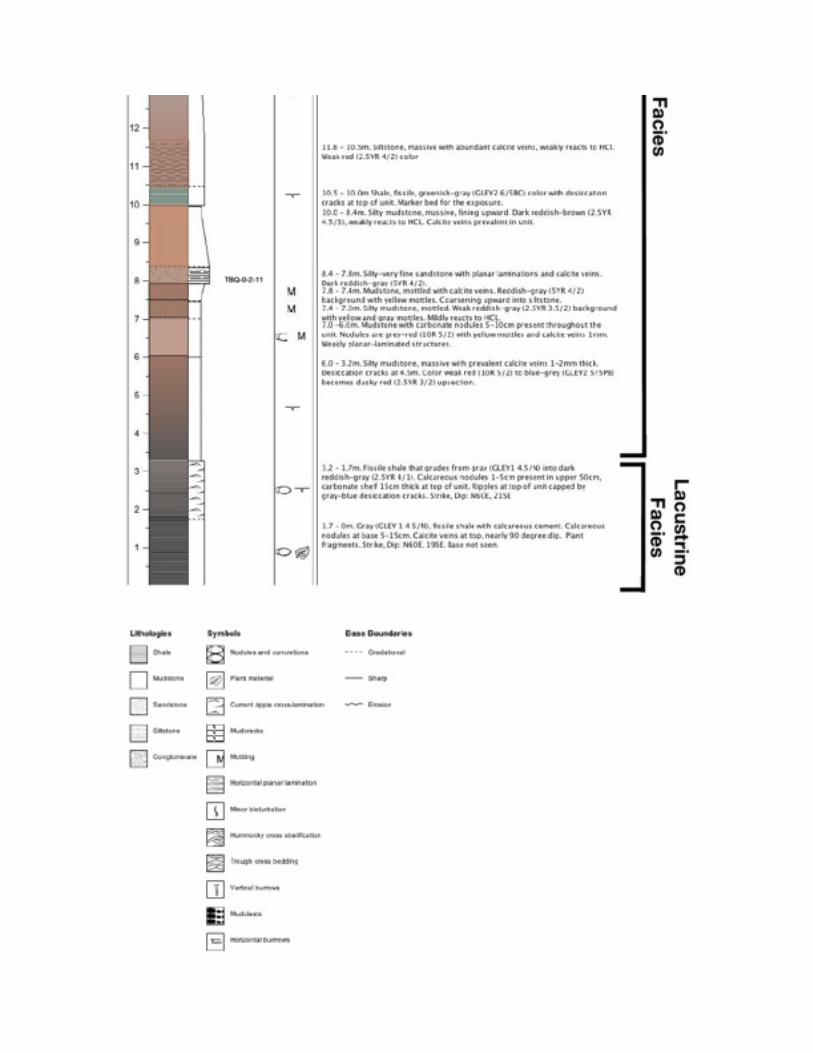
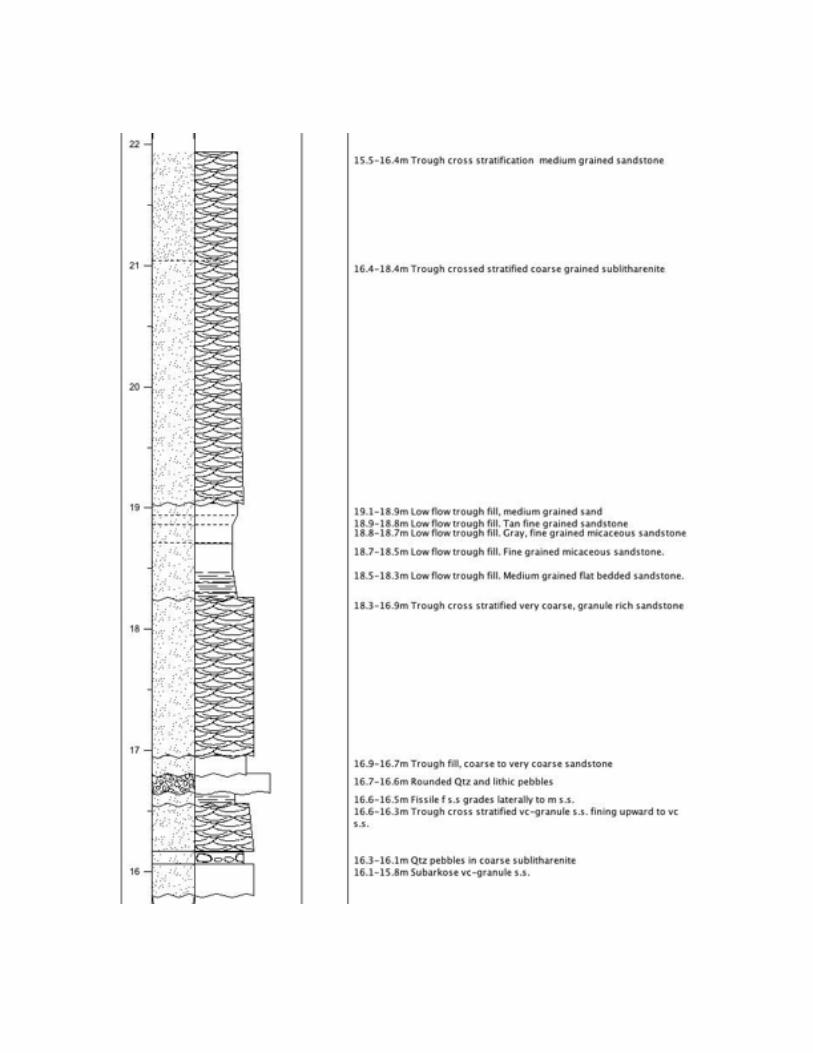
Additional measured section of an outcrop on the CSX rail line near
Russellville at Bogan Cut Road was logged. The Bogan Cut outcrop is composed of
channelized deposits of gray, coarse to medium grain lithic arenite sandstone with
lenses of dark gray, Oine grained low-‐Olow deposits and alternating beds of red, very
Oine sandstone overbank deposits. This outcrop was Oirst described by Russell 1892
and is described as a normal fault dominated environment, however, this
interpretation is rejected in place of a Oluvial dominated environment with evidence
of only 1 normal fault with a throw of ~1.5m. The measured section for Bogan Cut
can be found in Appendix B.
Preliminary petrographic analysis of selected sandstones within the clay pit
has been conducted by examining thin sections of sandstone units within the pit and
by preforming XRD analysis of those thin sections. Dominant mineralogies include
quartz, feldspar, and calcite (a likely precipitating cement). Data from this analysis
can be found in Appendix C.
Additional Oieldwork has been conducted in the basin surrounding the clay
pit by examining roadside outcrops and those along rail lines. This preliminary
Oieldwork will contribute to a detailed bedrock geologic map of the basin with the
clay pit at the center point. Outcrop lithologies, bed attitude (where available), and
location have been digitally mapped (Appendix D). Sandstone samples from basin
outcrops, as well as samples from within the clay pit, have been processed using the
Frantz magnetic barrier separator to determine weight percentages of magnetic
mineral facies (Table 1), which will be used to infer changes in sediment
provenance.

Magnetic Mineral Facies MineralogyFacies 1 – Non-‐Magnetic Quarts, Feldspar, Calcite, Zircon, Rutile,
Apatite, Corundum, Fluorite, SillimaniteFacies 2 – Flux 0.40 Amp Garnet, Ilmenite, Chromite, Chloritoid,
OlivineFacies 3 – Flux 0.80 Amp Biotite, Hornblende, Hypersthene, Augite,
Actinolite, Staurolite, Epidote, ChloriteFacies 4 – Flux 1.50 Amp Muscovite, Spinel, Enstatite, Tourmaline,
Clinozosite, Diopside, TremoliteTable 1. Magnetic mineral facies assemblages, from Rosenblum, 1958)
Magnetic separation data has been arranged perpendicular to basin strike (NW to
SE) in order to capture changes in mineralogy over time that may indicate changes
in sediment provenance (Figure 2).
Figure 2. Cross sectional magnetic mineral facies distribution within Wadesboro sub-‐basin, perpendicular to basin strike by wt.%.
The data shows three areas in the basin with a higher percentage of magnetic
minerals. Little correlation can be discerned from the current, small data set,
furthermore, additional analysis will be conducted to measure the effects of
weathering on the magnetic susceptibility of minerals within a lithology. The
magnetic data collected from the clay pit samples sandstones over the extent of the
exposure includes the interpreted lacustrine and Oluvial facies and are identiOied in
Appendix A (Figure 3).

Figure 3. Magnetic mineral facies distribution up section in a clay pit in Anson County, N.C. Location of samples noted in Appendix A.
The clap pit samples contained anomalously higher weight percentages of magnetic
minerals than were identiOied in samples from the surrounding basin. This may be a
result of FexOx coating mineral grains freshly exposed in the pit than may be leached
with continued surface exposure.
VI. TIMELINE
Conducting Research (Summer 2012, by week) 1 2 3 4 5 6 7 8 9 10 11 12 13 14 15
Contact Land Owners X X XComplete Field Work X X X X X XLab Analysis X X X X X X
Conducting Research (Fall 2012, by week) 1 2 3 4 5 6 7 8 9 10 11 12 13 14 15 16 17
Conduct Research for Study X X X X X X X X X X X X X X X X XLab Analysis X X X X X X X X X X X X X X X X XAnalyze data from research X X X X X
Writing and Defending Dissertation (Spring 2013, by week) 1 2 3 4 5 6 7 8 9 10 11 12 13 14 15 16 17
Outline Dissertation X Update Proposal ChaptersFor Dissertation X X X X X Write Results Chapter X X X X X X XWrite Summary and

Conclusions Chapter X X X X X X XPolish Writing X X X XDefend Dissertation X X XMinor Revisions X XGraduate X

VII. REFERENCES
Clark, T.W., Gore, P.J., and Watson, M.E., 2001, Depositional and structural framework of the Deep River Triassic basin, North Carolina, in Hoffman, C.W., ed. Field Trip Guidebook for the 50th Annual Meeting of the Southeastern Section, Geological Society of America, Raleigh, North Carolina, p. 27-50.
Dickinson, W.D., 1985, Interpreting provenance relations from detrital modes of sandstone, in Zuffa, G.G., editor, Provenance of Arenites: Dordrecht, Holland, Reidel p. 333-361
Hubert, J.F., 1962. A zircon-tourmaline-rutile maturity index and the interdependence of the composition of heavy mineral assemblages with the gross composition and texture of sandstones. Journal of Sediment and Petrology, v.32, p. 440-450
Lambiase, J. J., and Bosworth, W., 1995, Structural controls on sedimentation in continental rifts, in Lambiase, J.J., ed., Hydrocarbon habitat in rift basins: Geological Society Special Publication 80, p. 117-144.
Letourneau, P.M., and Olsen, P.E. (Eds.), 2003, The Great Rift Valleys of Pangea in Eastern North America, Volume 1: Tectonics, Structure, and Volcanism: Columbia University Press.
McLennan, S.M., Hemming, S., McDaniel, D.K., Hanson, G.N., 1993, Geochemical approaches to sedimentation, provenance, and tectonics. In: Johnsson, M.J., Basu, A. (Eds.), Processes Controlling the Composition of Clastic Sediments. Special Paper, Geologic Society of America, v. 284, p.21-40.
Olsen, P.E., Froelich, A.J., Daniels, D.L., Smoot, J.P., and Gore, P.W., 1991, The Geology of the Carolinas: North,, p. 142-170.
Olsen, P.E., Kent, D.V., Cornet, B., Witte, W.K., and Schlische, R.W., 1996, High-resolution stratigraphy of the Newark rift basin (early Mesozoic, eastern North America): Geological Society of America Bulletin, v. 108, no. 1, p. 40-77, doi: 10.1130/0016-7606(1996)108<0040:HRSOTN>2.3.CO;2.
Randazzo, A.F., Swe, W., and Wheeler, W.H., 1970, A study of tectonic influence on triassic sedimentation - the Wadesboro Basin, Central Piedmont: Journal of Sedimentary Petrology, v. 40, no. 3, p. 998-1006.
Reid, B.J.C., Milici, R.C., and Survey, U.S.G., 2008, Hydrocarbon Source Rocks in the Deep River and Dan River Triassic Basins , North Carolina: North,.
Reinemund, J.A., 1955, Geology of the Deep River coal field, North Carolina: U.S. Geological Survey Professional Paper 246, 159 p.
Schlische, R.W., 1993, TRIASSIC-JURASSIC CONTINENTAL RIFT SYSTEM , EASTERN NORTH AMERICA: America, v. 12, no. 4, p. 1026-1042.
Schlische, R.W., and Olsen, P.E., 1990, Quantitative filling model for continental extensional basins with applications to Early Mesozoic rifts of Eastern North America: The Journal of Geology, v. 98, no. 2, p. 135-155.
Tiercelin, J.J., 1990, Rift-basin sedimentation : responses to climate , tectonism and volcanism. Examples of the East African Rift: Journal of African Earth Sciences, v. 10, no. 1, p. 283-305.
Weltje, G.J. & von Eynatten, H. 2004, Quantitative provenance analysis of sediments: review and outlook.- Sedimentary Geology, v.171, p. 1-11

Zablocki, F.S., 1959, A gravity study of the Deep River-Wadesboro Triassic basin of North Carolina: (Unpubl. MS Thesis) University of North Carolina at Chapel Hill, North Carolina, 44 p.

VIII. APPENDIX A – Anson County Clay Pit Stratigraphic Column


IX. APPENDIX B – Bogan Cut Stratigraphic Column


X. APPENDIX C – Anson County Clay Pit XRD Analysis
TBQ00-‐02
Tbq 00-‐2Tbq 00-‐2Tbq 00-‐2Phase Mineral Figure of MeritMajor Quartz 1.9Major Albite-‐high 6Minor Quartz 3.3Minor Albite-‐high 6Trace Quartz 10.2
TBQ01-‐05
Tbq 01-‐05Tbq 01-‐05Tbq 01-‐05Phase Mineral Figure of MeritMajor Quartz 1.4Major Calcite 4.3Major Albite-‐high 9.4Minor Albite-‐low 5.7Minor Calcite 5.9Minor Quartz 6.6Minor Cuprite 7Minor Cristolobite 7.4Minor Wurtzite 8.3Minor Corundum 9.4Trace Albite-‐high 4.6Trace Calcite 6.3Trace Corundum 6.7Trace Wurtzite 7.4Trace Cobalite 9.8
TBQ 03-‐10.5
Tbq3-‐10.5Tbq3-‐10.5Tbq3-‐10.5Phase Mineral Figure of MeritMajor Quartz 2.8Major Albite-‐low 6Major Cristobolite(low) 6.1Major Topaz 8.2
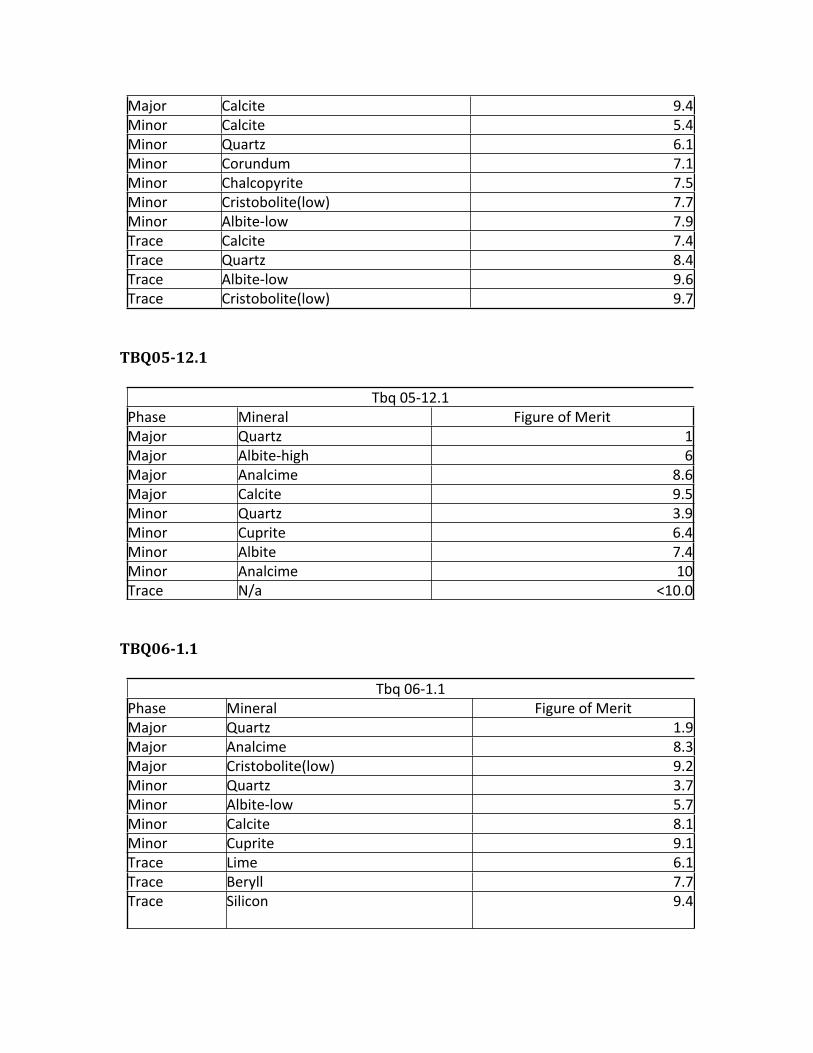
Major Calcite 9.4Minor Calcite 5.4Minor Quartz 6.1Minor Corundum 7.1Minor Chalcopyrite 7.5Minor Cristobolite(low) 7.7Minor Albite-‐low 7.9Trace Calcite 7.4Trace Quartz 8.4Trace Albite-‐low 9.6Trace Cristobolite(low) 9.7
TBQ05-‐12.1
Tbq 05-‐12.1Tbq 05-‐12.1Tbq 05-‐12.1Phase Mineral Figure of MeritMajor Quartz 1Major Albite-‐high 6Major Analcime 8.6Major Calcite 9.5Minor Quartz 3.9Minor Cuprite 6.4Minor Albite 7.4Minor Analcime 10Trace N/a <10.0
TBQ06-‐1.1
Tbq 06-‐1.1Tbq 06-‐1.1Tbq 06-‐1.1Phase Mineral Figure of MeritMajor Quartz 1.9Major Analcime 8.3Major Cristobolite(low) 9.2Minor Quartz 3.7Minor Albite-‐low 5.7Minor Calcite 8.1Minor Cuprite 9.1Trace Lime 6.1Trace Beryll 7.7Trace Silicon 9.4

TBQ 07-‐03
Tbq 07-‐03Tbq 07-‐03Tbq 07-‐03Phase Mineral Figure of MeritMajor Quartz 1.8Major Albite-‐low 7.3Major Calcite 9.8Minor Calcite 6Minor Quartz 1.8Minor Cristobolite(low) 7.3Minor Albite-‐low 3.6Trace Calcite 2.9Trace Lime 6Trace Albite-‐low 2.7Trace Halite 8.8
XI. APPENDIX D – Outcrop map of southern-‐central portion of Wadesboro sub-‐basin