Embed Size (px)
Citation preview

Tunnelling and Underground Space Technology 25 (2010) 811–818
Contents lists available at ScienceDirect
Tunnelling and Underground Space Technology
journal homepage: www.elsevier .com/ locate/ tust
Technical note
Excavation failure during micro-tunneling in fine sands: A case study
J. Jebelli a,1, M.A. Meguid b,*, M.K. Sedghinejad c
a 12th Floor, 455 Rene-Lévesque West Blvd. SNC-Lavalin International, Montreal, QC, Canadab Civil Engineering and Applied Mechanics, McGill University, 817 Sherbrooke Street West, Montreal, Quebec, Canada H3A 2K6c Loshan Manufacturing, Suite 10, 1496 Valiasr Avenue, Tehran, Iran
a r t i c l e i n f o
Article history:Received 8 November 2009Received in revised form 25 May 2010Accepted 26 May 2010Available online 17 June 2010
Keywords:PipejackingMicro-tunnelingSandy soilFace failureShafts
0886-7798/$ - see front matter � 2010 Elsevier Ltd. Adoi:10.1016/j.tust.2010.05.006
* Corresponding author. Tel.: +1 514 398 1537; faxE-mail addresses: [email protected] (J. Jebelli),
(M.A. Meguid), [email protected] (M.K. Sedghinejad1 Tel.: +1 514 393 3900; fax: +1 514 393 3901.
a b s t r a c t
Partly funded by the World Bank, a new gravity sewer line is currently being constructed in Anzali, Iranusing micro-tunneling methods. The project includes the installation of 2551 m reinforced concrete pipeswith diameter ranging from 600 to 1000 mm at an average depth of 5 m below surface. Micro-tunnel Bor-ing Machine (MTBM) and hydraulic pipejacking have been used to install the sewer line. Pipejacking insaturated highly porous sandy soil poses various challenges during construction including the risk of facefailure, possibility of shaft collapse, massive rush of groundwater (in this case from the Caspian Sea) andsurface subsidence. This paper provides an overview of the project and summarizes the challenges facedand the techniques used to handle the difficulties encountered during construction.
� 2010 Elsevier Ltd. All rights reserved.
1. Introduction
A sewer line project partly funded by the World Bank is cur-rently being constructed under the supervision of SNC-LavalinInternational in Anzali, Iran. The project started in May 2008 andincluded the installation of 2551 m reinforced concrete pipes withdiameter ranging from 500 to 1000 mm at an average depth of 5 musing Micro-tunnel Boring Machine (MTBM) and hydraulic pipe-jacking. The jacked pipes are part of the sewer network that col-lects the sewage flow of Anzali city to be transported to thepumping station to be lifted to the existing Anzali city sewagetreatment plant.
Micro-tunneling in saturated cohesionless soil has led to partialsoil loss due to short stand-up time and high groundwater pres-sure. Therefore, temporary front support such as bentonite slurryis used to maintain the stability of the working face. The use ofbentonite slurry develops a layer of filter-cake on the micro-tunnelfront acting as a membrane and inhibiting diffusion of the suspen-sion into ground. The supporting action results from the differencein hydrostatic pressure, Dq, between the slurry and the groundwa-ter (Anagnostou and Kovari, 1996).
To prevent seepage flow towards the excavation face, the slurrypressure must be higher than the groundwater pressure. Muller-
ll rights reserved.
: +1 514 398 [email protected]).
Kirchenbauer (1972) and Xanthakos (1979) highlighted the factthat the stabilizing force of slurry depends on the extent of the slur-ry diffusion into the soil. The less the slurry diffuses, the greater theextent of supporting forces. Obviously, raising the excess slurrypressure in order to stabilize the excavation face could cause an in-crease in safety, but only to the extent that it keeps the pressure inequilibrium at the excavation front (Anagnostou and Kovari, 1996).The objective of this article is to present an overview of this casestudy and discuss the challenges faced during construction includ-ing excavation face failure, surface subsidence and shaft failure. Inaddition, various other technical challenges encountered in the pro-cess of pipejacking such as dealing with intensive water disposaland the adverse effects on groundwater will also be discussed.
2. Soil characteristics
Initial site investigation classifies the soil as poorly graded sand(SP) using the Unified Soil Classification system. Table 1 presentsthe borehole record of a typical soil profile up to a depth of 6 m be-low surface. The soil consists of loose to very loose poorly gradedsand with water table located at approximately 2 m below surface.Natural and submerged specific gravity of the soil are measured ascwt = 20.6 kN/m3 and cb = 10.6 kN/m3, respectively. Fig. 1 showsthe grain size distribution for two sand samples located at 1.5 mand 4.5 m below surface. The uniformity coefficient of the samplesranged from 3.2 to 4.4 with no fines. The direct shear testsconducted on selected samples indicated an angle of friction / of27� with no cohesion (c = 0.0 kN/m2).

Table 1Soil characteristics.
Identification Classification Density
Sample Depth Description Symbollog
Particle size distribution %passing
Atterberg,limits Per %
% Natmoisture
Bulkg/cm3
Dry g/cm3
SP-GRg/cm3
S.P.T blowsper 30 cm
No. Type m. 76 mm 4.8 mm 75C
2C
LL PL PI W cwt cd cs N
0201 1.5 Gr. very loose poorlygraded SAND SP
100 96 3 25.6 32.0
0202 4.5 Gr. loose poorly, gradedSAND with shell SP
100 100 4 85.0
Grain Size (mm)
Perc
ent f
iner
by
wei
ght
4.5 m in depth
SP 1.5 m in depth
SP
Fig. 1. Grain size distribution of the sand.
812 J. Jebelli et al. / Tunnelling and Underground Space Technology 25 (2010) 811–818
3. Construction of shafts
Temporary shafts are required to launch and retrieve the MTBMbefore and after the jacking process. Micro-tunneling proceedsfrom a jacking shaft to a reception shaft. About 42 shafts are tobe constructed at the rim of streets each converting to a functionalmanhole after the completion of pertinent pipejacking drive. Eachshaft is constructed by sinking a concrete cylinder as the soil insideis removed by an excavation machine. For the first few shaft rings,the surrounding soils were cement grouted using 0.91 m diameterby 6 m deep boreholes distributed around the shaft area. The mainpurpose of the pre-grouting was to stabilize the walls and founda-tion of the excavation during construction. To construct each shaftthe seeping groundwater had to be continually pumped out with-out interruption. After construction of each manhole, the gap be-tween manhole and the shaft is filled using a suitable backfill
material. A reinforced concrete thrust block is then built insidethe shaft to provide support for the jacking force. The block is ori-ented such that it is perpendicular to the direction of the pipejack-ing to prevent any possible deviation from the proposed alignment.
4. Construction of pipes
Micro-tunneling pipes are generally subject to large transientaxial jacking forces applied during the installation process toadvance the pipe. Therefore, selection of the pipe material playsan important role in the constructability of the pipejacking project.The proposed C25 reinforced concrete pipe accommodates bothhelical and longitudinal reinforcements. Helical reinforcementsresist live and dead loads whereas the longitudinal reinforcementprovides resistance against the forces imposed by hydraulic jack-ing. Reinforcements are made of AIII rods (yield tensile strength

pipe collar
Fig. 2. Details of the reinforced concrete pipe.
J. Jebelli et al. / Tunnelling and Underground Space Technology 25 (2010) 811–818 813
of 4000 kg/cm2) with diameters and arrangements as shown inFig. 2. The pipes are constructed from self-compacted concrete thathas been prepared in the factory and transported to the site. Utiliz-ing self-compacted wet concrete would allow less water consump-tion with fewer pores leading to a dense and smooth concretesurface. The maximum thrust imposed by the hydraulic jack onthe 600 mm pipe is about 250 tons. The recommended thicknessfor the 600 mm pipe is 106 mm according to the International PipeJacking Association (PJA, 1995).
As shown in Fig. 2, the pipe collars are made of polyethylene (PE)material and the interior is coated using 1.5–2 m thick HDPE layer.The space between two consecutive shafts varies between 60 and80 m to accommodate primary design perspectives and the neces-sary site adjustments. After the first few drives the proposed shaftdistances have been reduced to about 60 m to facilitate the controlof any undesirable soil conditions. The longitudinal profile of thesewer line and the pipejacking shafts are shown in Fig. 3.
The 2-m length reinforced concrete pipes are designed with asafety factor of 4 to bear the maximum axial jacking force. Thepipes are also inspected in the factory by performing standardthree-edge crush tests on selected pipes. The joints are designedwith outer smooth edges to minimize friction forces and at the
58 m 68 m 62 m
(The fifth run) (The fourth run) (The third run)
Fig. 3. Longitudinal profi
same time remain water tight under loading with allowable deflec-tion angle of 1�. Pipes are also hydrostatically tested in the factoryfor 2 bars under the maximum allowable deflection angle.
4.1. Joint sealer
The pipe joints are water-sealed using a special rubber gasketmade of natural substance (Caoutchoue) that is resistant to Ozoneray. This water proofing elastic rubber can bear up to 5� deflectionaccording to the British Standards (BS 2494, 1990). The maximumpressure imposed on the joints is less than 23.5 N/mm2. Under amaximum bearing pressure of 23.5 N/mm2 the elastic return ap-proaches 56% of its original length. The hourly compression ofthe rubber sealer amounts to 50% of the primary 8 mm thickness.As Fig. 4 illustrates, the joint sealer covers the edges of two adja-cent pipes at their connection point. The gap between two pipesvaries from 6 to 15 mm (proportional to the pipejacking forces).The grooves between the two adjacent pipes are filled with Polyor-ton sealer. A standard hydrostatic leaking test verifies the watertightness of joints after completion of each pipejacking drive. Eachcompleted drive is expected to prove leaks less than 0.15 L per unitwetted area under 5 m head of water for a period of half an hour
80 m 80 m
(The second run) (The first run)
le of the sewer line.

Fig. 4. Details of the pipe connection.
814 J. Jebelli et al. / Tunnelling and Underground Space Technology 25 (2010) 811–818
(0.15 L/m2/0.5 h). The leak test is carried out after complete dewa-tering of the two adjacent shafts.
4.2. Pipejacking
Jacking pipes require prior construction of at least three consec-utive shafts to accommodate the MTBM cutter head in the middleone (sending shaft) and to jack pipes to either side towards thereceiving shaft. A full face MTBM with slurry pressure has beenemployed in this project to perform the excavation. A laser beam
Table 2Slurry characteristics.
Tests Results at 20� Test method
Density <1.1 g/cm3 Mud density balanceViscosity 0.02 Pa/s March cone method
(Fann viscometer)Shear test (the gel
resistance in 10 min)4–40 Pa or 1.4–10 Pa Shearometer
pH 9.5–12 The pH strips
The distance betwee
Fig. 5. Pipejacking alignment us
apparatus targeted at a moving sensitive plate attached to the backof the shield, dispatches the alignment signals to the control room.The collected data provides information to the operator in order tomaneuver the steering cylinder. Each concrete pipe is fed succes-sively into the hydraulic jack carrier and is pushed into the groundusing the transfer carrier jack. The micro-tunneling technique uti-lizes bentonite drilling mud to maintain the equilibrium pressurebetween the excavation face and groundwater in addition to facil-itating the collection of the excavated material. The excavatedmaterial including the bentonite mud flows to a sedimentationtank and the deposited sand is then removed from the tank byan excavator. The speed of micro-tunneling, volume of the exca-vated materials, water feed rates, bentonite feed rates, and cutterhead pressure are continuously measured and controlled by theoperator.
To ease jacking loads on pipes, a lubricant is used throughoutthe pipejacking process. The lubrication system consists of a mix-ing tank, sedimentation tank and a pump to convey the pipejackingfluid from the holding tank to the application points at the rear ofthe cutter head. The fluid thickness has been measured on daily
n two shafts
ing a laser beam apparatus.
J. Jebelli et al. / Tunnelling and Underground Space Technology 25 (2010) 811–818 815
basis. The results of the density, viscosity, shear and pH tests arereported in Table 2.
Ground surface elevation and the pipe behavior during and afterpipejacking have been continuously inspected. Unexpected hori-zontal or vertical deflection is examined using a laser beam appa-ratus as shown in Fig. 5. A marked plate installed in the receivingshaft allows four laser beams dispatched from the adjacent sendingshaft. Laser beam deviation from the marked locations on thereceiving plate is measured in order to detect and fix possiblealignment problems.
5. Observations and discussions
5.1. Excavation face failure
Face stability of excavations made in saturated sand with aninternal angle of friction as low as 27� and zero cohesion reliesmainly on the slurry pressure, Ps. Slurry pressure is a temporal var-iable that is a function of ground reaction pressure, Pr, and resul-tant excess slurry pressure Dp. Accordingly, it can be expressed as:
Ps f ðPr; Dp; tÞ ð1Þ
@Ps
@t¼ @Pr
@tþ @Dp
@tð2Þ
Integrating Eq. (2) for a specific time interval t2–t1:Z t2
t1
@Ps
@t¼Z t2
t1
@Pr
@tþZ t2
t1
@Dp@t
ð3Þ
Given that the boundary conditions in Eq. (3) denote the pipe-jacking starting time (t1) and ending time (t2) at 8:00 AM and18:00 PM, respectively it yields:Z t1
t2Ps ¼
Z t2
t1Pr þ
Z t2
t1Dp ð4Þ
ðPsðt2Þ � Psðt1ÞÞ ¼ ðPrðt2Þ � Prðt1ÞÞ þ ðDpðt2Þ � Dpðt1ÞÞ ð5Þ
Considering that, the average pressure values are the only avail-able data from the pipejacking daily logs (Table 3) therefore:
Ps ¼ Pr þ Dp ð6Þ
The allowable excess slurry pressure in Eq. (6), Dp, is estimatedusing the following expression (Anagnostou and Kovari, 1996):
Dp ¼ 2sf emax
d10ð7Þ
where sf is the slurry yield strength, emax is the allowable slurry dif-fusion distance in soil and d10 is the characteristic grain diameter.Substituting for Dp in Eq. (6) yields:
Ps ¼ Pr þ2sf emax
d10ð8Þ
Table 3The measured slurry and ground pressure in an average drive.
Date Startingtime
Finishingtime
Average slurrypressure (Bar)
Average groundreaction pressure (Bar)
27/1/2009 8:00 AM 18:30 0.15 0.3528/1/2009 8:00 AM 18:30 0.25 0.3029/1/2009 8:00 AM 19:00 0.25 0.3530/1/2009 8:00 AM 17:00 0.25 0.3031/1/2009 8:00 AM 18:30 0.25 0.301/2/2009 8:00 AM 18:30 0.20 0.35
Average 0.225 0.325
Based on the collected data for an average drive sf = 0.01 kPa,emax = 100 mm and d10 = 0.2 mm thus the excess slurry pressureis calculated as Dp = 10 kPa. It is worth mentioning that the yieldstrength sf of the suspension depends essentially on the bentoniteconcentration. The extent of slurry diffusion is also governed byfine soil particle fraction. The calculated excess pressure, Dp, de-fines the theoretical bearable soil pressure before failure. Undernegligible diffusion distance (emax < 100 mm), slurry acts essen-tially as a membrane.
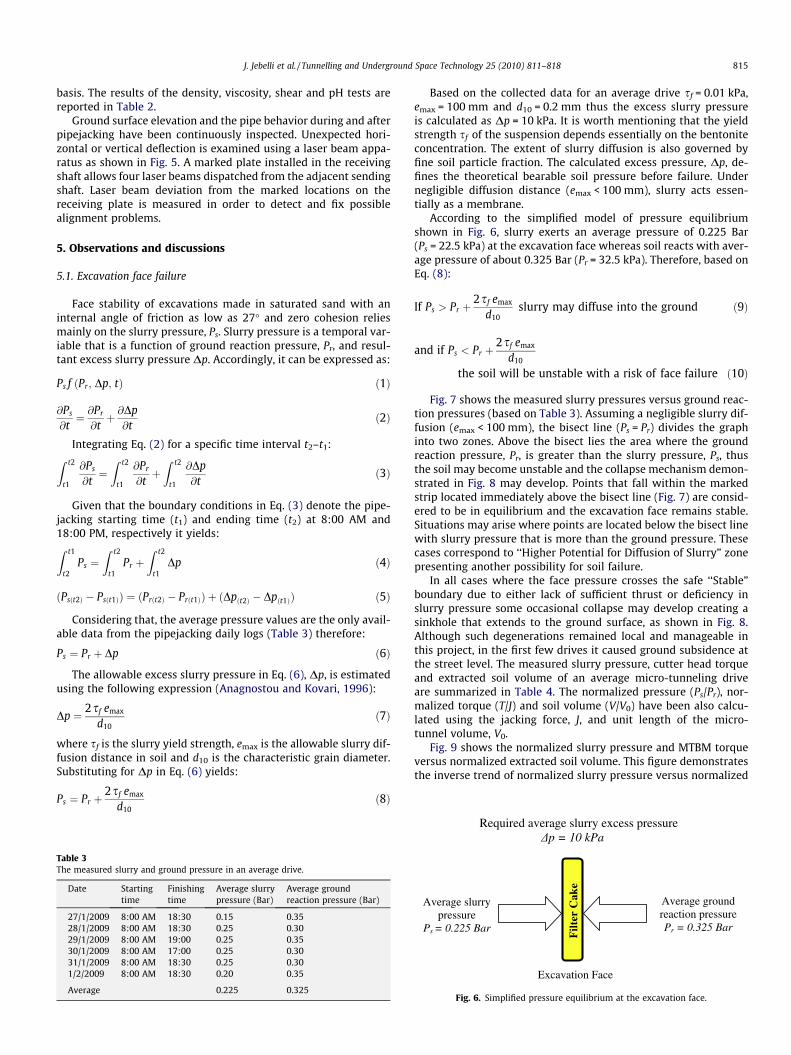
According to the simplified model of pressure equilibriumshown in Fig. 6, slurry exerts an average pressure of 0.225 Bar(Ps = 22.5 kPa) at the excavation face whereas soil reacts with aver-age pressure of about 0.325 Bar (Pr = 32.5 kPa). Therefore, based onEq. (8):
If Ps > Pr þ2sf emax
d10slurry may diffuse into the ground ð9Þ
and if Ps < Pr þ2sf emax
d10
the soil will be unstable with a risk of face failure ð10Þ
Fig. 7 shows the measured slurry pressures versus ground reac-tion pressures (based on Table 3). Assuming a negligible slurry dif-fusion (emax < 100 mm), the bisect line (Ps = Pr) divides the graphinto two zones. Above the bisect lies the area where the groundreaction pressure, Pr, is greater than the slurry pressure, Ps, thusthe soil may become unstable and the collapse mechanism demon-strated in Fig. 8 may develop. Points that fall within the markedstrip located immediately above the bisect line (Fig. 7) are consid-ered to be in equilibrium and the excavation face remains stable.Situations may arise where points are located below the bisect linewith slurry pressure that is more than the ground pressure. Thesecases correspond to ‘‘Higher Potential for Diffusion of Slurry” zonepresenting another possibility for soil failure.
In all cases where the face pressure crosses the safe ‘‘Stable”boundary due to either lack of sufficient thrust or deficiency inslurry pressure some occasional collapse may develop creating asinkhole that extends to the ground surface, as shown in Fig. 8.Although such degenerations remained local and manageable inthis project, in the first few drives it caused ground subsidence atthe street level. The measured slurry pressure, cutter head torqueand extracted soil volume of an average micro-tunneling driveare summarized in Table 4. The normalized pressure (Ps/Pr), nor-malized torque (T/J) and soil volume (V/V0) have been also calcu-lated using the jacking force, J, and unit length of the micro-tunnel volume, V0.
Fig. 9 shows the normalized slurry pressure and MTBM torqueversus normalized extracted soil volume. This figure demonstratesthe inverse trend of normalized slurry pressure versus normalized
Required average slurry excess pressure p = 10 kPa
Excavation Face
Filt
er C
ake
Average slurry pressure
Ps = 0.225 Bar
Average ground reaction pressure Pr = 0.325 Bar
Fig. 6. Simplified pressure equilibrium at the excavation face.

0
0.1
0.2
0.3
0.4
0.5
0.6
0.7
0 0.1 0.2 0.3 0.4 0.5 0.6 0.7Gro
und
pres
sure
at t
he e
xcav
atio
n fa
ce, P
r
(Bar
)
Slurry pressure, Ps (Bar)
Unstablesoil (Pr > Ps)
High potential of slurrydiffusion (Pr < Ps)
Fig. 7. Stability of the excavation face.
816 J. Jebelli et al. / Tunnelling and Underground Space Technology 25 (2010) 811–818
extracted soil volume. The trend implies that as the slurry pressureat excavation face decreases the normalized extracted soil volumeincreases. To avoid face failure the V/V0 ratio should constantly ap-proach unity during the course of pipejacking (V/V0 = 1). The nor-malized extracted soil volume is also positively proportional tothe increase in values of normalized MTBM torque. These trendsexplicitly indicate that the optimized slurry pressure and MTBM
(b) Street subside
(a) Failure mecha
Fig. 8. Failure mechanism
torque play an important role in maintaining stable excavationface at ideal V/V0 = 1 zone, where there will not be any soil over-extraction.
To prevent face failure and saturated sand from escapingthrough the slurry circulation, the following corrective measureswere implemented in the work procedure:
� The cutter head rotational torque and speed was proportionallyincreased to achieve pressure equilibrium at the excavation faceand hence reduce the risk of soil collapse.� The bentonite feed to the system was adjusted such that it is
less than 50 m3/h to control the volume of the transportedmaterial.� The slurry concentration at the recovery tank was continuously
kept at about 40 kg bentonite per cubic meter of water to safe-guard the continuity of operation.� Two out of 5 cutter head openings were closed to minimize the
risk of soil over-extraction by cutter head openings.� The advanced detection of possible cavities below pavement
was adopted by passing over a 40 tons loaded truck after thecompletion of each drive.� The real time data acquisition of sand concentration in the sed-
imentation tank became quite evident to comply with a veryshort stand-up time at the excavation front.
nce
nism
of the excavation face.

Table 4The normalized pressures and soil volumes.
Measured values Normalized values
Average slurrypressure Ps
(Bar)
Average groundreaction pressurePr (Bar)
AverageMTBMtorque T(Bar)
Averagejacking forceJ (Bar)
Soilextractedvolume V(m3)
(Average slurry pressure)/(ground reaction pressure)(Ps/Pr)
(Average MTBMtorque)/(Jackforce) (T/J)
(Average extracted soilvolume)/(micro-tunnelvolume) (V/V0)
0.15 0.35 100 55 5.8 0.43 1.8 1.90.25 0.30 110 77.5 9.0 0.83 1.4 1.10.25 0.35 100 100 1.0 0.71 1.0 1.00.25 0.30 110 110 1.5 0.83 1.0 1.50.25 0.30 100 155 10.5 0.83 0.6 1.30.20 0.35 100 220 4.5 0.57 0.5 0.7
J. Jebelli et al. / Tunnelling and Underground Space Technology 25 (2010) 811–818 817
5.2. Shaft failure
Primary assessment of soil data showed that due to short stand-up time the cement grouting of sub-soil at 6 m depth can lead tothe creation of solid pockets and stabilize the surrounding soilaround the shafts during the course of excavation. This was in-tended to prevent the collapse of walls into the excavated shafts.In the first few shafts the cement grout was injected in a seriesof 75 mm diameter by 6 m deep boreholes. However, observations
0.0
0.5
1.0
1.5
2.0
2.5
3.0
0.0
0.5
1.0
1.5
2.0
2.5
3.0
0.0 0.5 1.0 1.5 2.0 2.5 3.0
Pressure versus soil volumeTorque versus soil volume
Extracted soil volume / micro-tunnelvolume(V / V0 )
Slur
ry p
ress
ure
/ gro
undr
eact
ion
pres
sure
(P
s/ P
r)
MT
BM
torq
ue /
jack
ing
forc
e(T
/ J)
Fig. 9. Relationship between normalized slurry pressure, applied torque andnormalized soil volume.
ReceivingShaft
Saturated & Dry Soil Interface
Saturated Sandy S
Groundwater
600 Groundwater
lioSydnaSSandy Soi l
Fig. 10. Schematic view of the ground
showed no indications of the anticipated cement pockets in the soiland yet the walls were unstable. This was explained by the possi-ble diffusion of cement mortar into groundwater. Therefore, theinjection of cement grouting in other shafts was abandoned.
The average local groundwater depth along the sewer line isabout 3 m below surface. At any time interval at least three consec-utive shafts must be continuously dewatered so that the pipejack-ing and/or construction of manholes could be carried outuninterrupted. Closeness to the Caspian Sea caused massive vol-umes of water to infiltrate through the permeable soil layers to-wards the pumping shafts causing real trouble for the effluentdisposal. To dispose of the pumping water, a series of sequentialbackward shafts (manholes in the case of constructed ones) hadto be utilized in order to approach the Caspian Sea for possibledisposal.
5.3. Groundwater effects
Groundwater condition has significant effects on the soil behav-ior during excavation and the success of the pipejacking process.Dewatering the accumulated water in shafts causes a depressioncone around the discharging points. Consequently, as shown inFig. 10 the pipejacking route crosses both wet and dry zones cre-ated by the depression cones as the jacking pipes move towardsthe receiving shaft. The fluctuating soil moisture content alongthe pipejacking route necessitates real time control of the MTBMoperation. In some instances, the untimely response to groundwa-ter fluctuations has caused horizontal or vertical alignment devia-tion in the last few jacked pipes. To control the groundwater effect
"
Sending Shaft
Jack
Dry & Saturated Soil Interface
oil
mm RCP
Groundwater
lioSydnaS
water effects during pipejacking.

818 J. Jebelli et al. / Tunnelling and Underground Space Technology 25 (2010) 811–818
along the pipejacking route, closely spaced well points had to beimplemented along the pipejacking alignment in order to allowearlier and continuous monitoring of groundwater prior to pipe-jacking (ASCE, 1998).
6. Summary and conclusions
The case study of a new sewer installation using micro-tunnel-ing in saturated sandy soil is presented in this paper. The projectinvolved the installation of about 2.5 km of reinforced concretepipes with diameters ranging from 600 to 1000 mm at an averagedepth of 5 m below surface. Micro-tunnel Boring Machine (MTBM)and hydraulic pipejacking have been used to install the sewer line.Several problems have been encountered during the constructionprocess including face instability, shaft failure and ground-water related issues. Description of the subsurface conditions andconstruction technique, and the criterion used for the face stabilityof the excavation are summarized. In addition the measures takento control the above problems are also described. Great care hasto be taken in similar micro-tunnelling projects to minimize the
adverse effects of short stand-up time of the soil and seepage pres-sure on the stability of the required shaft and tunnel excavations.
Acknowledgements
This is to acknowledge the valuable contributions that wereprovided by Mr. Pierre Beaudoin the project director and Mr. Ray-mond Bousquet the SNC-lavalin’s senior geotechnical expert.
References
Anagnostou, G., Kovari, K., 1996. In: Mair, Taylor (Eds.), Face Stability in Slurry andEPB Shield Tunneling. Geotechnical Aspects of Underground Construction inSoft Ground. Belkema, Rotterdam, pp. 453–458.
ASCE, 1998. Standard Construction Guidelines for Micro-Tunneling. CommitteeBallot, Revision 7, Reston, Virginia 20191-4400, p. 45.
BS 2494, 1990. Specification for Elastomeric Seals for Joints in Pipework andPipelines. British Standards Institution, 20 p.
Muller-Kirchenbauer, H., 1972. Stability of slurry trenches. In: Proc. 5th EuropeConf. SMFE, Madrid, vol. I. pp. 543–553.
Pipe Jacking Association (PJA), 1995. An Introduction to Pipe Jacking andMicrotunnelling Design. PJA, London, UK.
Xanthakos, P., 1979. Slurry Walls. McGraw-Hill, New York. p. 662.