Embed Size (px)
Citation preview
UNITED STATES SECURITIES AND EXCHANGE COMMISSION
Washington, D.C. 20549
FORM 10-K
For the fiscal year ended December 31, 2010
or
For the transition period from to
Commission file number: 0-51948
Excelsior LaSalle Property Fund, Inc.
(Exact name of registrant as specified in its charter)
225 High Ridge Road, Stamford, CT, 06905-3039 (Address of principal executive offices, including Zip Code)
(203) 352-4400 (Registrant’s telephone number, including area code)
Securities registered pursuant to Section 12(b) of the Act: None Securities registered pursuant to Section 12(g) of the Act:
Title of each class Class A Common Stock, $.01 par value
Indicate by check mark if the registrant is a well-known seasoned issuer, as defined in Rule 405 of the Securities Act. Yes � No ⌧
Indicate by check mark if the registrant is not required to file reports pursuant to Section 13 or Section 15(d) of the Act. Yes � No ⌧
Indicate by check mark whether the registrant (1) has filed all reports required to be filed by Section 13 or 15(d) of the Securities Exchange Act of 1934 during the preceding 12 months (or for such shorter period that the registrant was required to file such reports), and (2) has been subject to such filing requirements for the past 90 days. Yes � No ⌧
Indicate by check mark whether the registrant has submitted electronically and posted on its corporate Website, if any, every Interactive Data File required to be submitted and posted pursuant to Rule 405 of Regulation S-T (§232.405 of this chapter) during the preceding 12 months (or for such shorter period that the registrant was required to submit and post such files). Yes � No �
Indicate by check mark if disclosure of delinquent filers pursuant to Item 405 of Regulation S-K (§229.405 of this chapter) is not contained herein, and will not be contained, to the best of registrant’s knowledge, in definitive proxy or information statements incorporated by reference in Part III of this Form 10-K or any amendment to this Form 10-K. ⌧
Indicate by check mark whether the registrant is a large accelerated filer, an accelerated filer, a non-accelerated filer, or a smaller reporting company. See the definitions of “large accelerated filer,” “accelerated filer” and “smaller reporting company” in Rule 12b-2 of the Exchange Act. (Check one):
⌧ ANNUAL REPORT PURSUANT TO SECTION 13 OR 15(d) OF THE SECURITIES EXCHANGE ACT OF 1934
� TRANSITION REPORT PURSUANT TO SECTION 13 OR 15(d) OF THE SECURITIES EXCHANGE ACT OF 1934
Maryland 20-1432284(State or other jurisdiction of
incorporation or organization) (I.R.S. Employer
Identification Number)
Large accelerated filer � Accelerated filer ⌧
Non-accelerated filer � Smaller reporting company �

Indicate by check mark whether the registrant is a shell company (as defined in Rule 12b-2 of the Act). Yes � No ⌧ As of June 30, 2010, the aggregate market value of the 4,135,635 shares of common stock held by non-affiliates of the Registrant
was $215,747,081 based upon the last appraised value of $52.17 per share. As of March 3, 2011, there were 4,135,635 shares of Common Stock outstanding.
DOCUMENTS INCORPORATED BY REFERENCE Specified portions of the registrant’s proxy statement, which will be filed with the Commission pursuant to Regulation 14A in
connection with the registrant’s 2010 Annual Meeting of Stockholders are incorporated by reference into Part III of this annual report.

TABLE OF CONTENTS
Cautionary Note Regarding Forward-Looking Statements
This Form 10-K may contain forward-looking statements within the meaning of Section 21E of the Securities Exchange Act of 1934 (the “Exchange Act”), regarding, among other things, our plans, strategies and prospects, both business and financial. Forward-looking statements include, but are not limited to, statements that represent our beliefs concerning future operations, strategies, financial results or other developments. Forward-looking statements can be identified by the use of forward-looking terminology such as, but not limited to, “may,” “should,” “expect,” “anticipate,” “estimate,” “would be,” “believe,” or “continue” or the negative or other variations of comparable terminology. Because these forward-looking statements are based on estimates and assumptions that are subject to significant business, economic and competitive uncertainties, many of which are beyond our control or are subject to change, actual results could be materially different. Although we believe that our plans, intentions and expectations reflected in or suggested by these forward-looking statements are reasonable, we cannot assure you that we will achieve or realize these plans, intentions or expectations. Forward-looking statements are inherently subject to risks, uncertainties and assumptions. Readers are cautioned not to place undue reliance on these forward-looking statements, which speak only as of the date this Form 10-K is filed with the Securities Exchange Commission (“SEC”). Except as required by law, we do not undertake any obligation to update or revise any forward-looking statements contained in this Form 10-K. Important factors that could cause actual results to differ materially from the forward-looking statements are disclosed in “Item 1A. Risk Factors,” “Item 1. Business” and “Item 7. Management’s Discussion and Analysis of Financial Condition and Results of Operations.”
Presentation of Dollar Amounts
Unless otherwise noted, all dollar amounts, except per share dollar amounts, reported in this Form 10-K are in thousands.
1
Page
PART I
Item 1. Business 2 Item 1A. Risk Factors 9 Item 1B. Unresolved Staff Comments 20 Item 2. Properties 21 Item 3. Legal Proceedings 26 Item 4. (Removed and Reserved) 26
PART II
Item 5. Market for Registrant’s Common Equity, Related Stockholder Matters and Issuer Purchases of Equity Securities 27 Item 6. Selected Financial Data 30 Item 7. Management’s Discussion and Analysis of Financial Condition and Results of Operations 32 Item 7A. Quantitative and Qualitative Disclosures About Market Risk 53 Item 8. Financial Statements and Supplementary Data 55 Item 9. Changes in and Disagreements With Accountants on Accounting and Financial Disclosure 55 Item 9A. Controls and Procedures 55 Item 9B. Other Information 55
PART III
Item 10. Directors, Executive Officers and Corporate Governance 55 Item 11. Executive Compensation 56 Item 12. Security Ownership of Certain Beneficial Owners and Management and Related Stockholders Matters 56 Item 13. Certain Relationships and Related Transactions, and Director Independence 56 Item 14. Principal Accountant Fees and Services 56
PART IV
Item 15. Exhibits, Financial Statement Schedule 56

PART I
GENERAL Except where the context suggests otherwise, the terms “we,” “us,” “our” and the “Fund” refer to Excelsior LaSalle Property
Fund, Inc.
The Fund is a Maryland corporation and was incorporated on May 28, 2004. The Fund was created to provide accredited investors within the meaning of Regulation D promulgated under the Securities Act of 1933, as amended (the “Securities Act”), with an opportunity to participate in a private real estate investment fund that has elected to be taxed as a real estate investment trust (“REIT”) for federal income tax purposes. We are authorized to issue up to 100,000,000 of our Class A common stock, $0.01 par value per share (our “Common Stock” or “Shares”). Please note that while we use the term “Fund,” the Fund is not a mutual fund or any other type of “investment company” as that term is defined by the Investment Company Act of 1940, as amended (the “Investment Company Act”), and will not be registered under the Investment Company Act.
The Fund is managed by Bank of America Capital Advisors LLC (the “Manager”). The Manager is registered as an investment advisor with the Securities and Exchange Commission (the “SEC”). The Manager has the day-to-day responsibility for our management and administration pursuant to a management agreement between the Fund and the Manager (the “Management Agreement”).
LaSalle Investment Management, Inc. (“LaSalle”) acts as our investment advisor (the “Advisor”), pursuant to the advisory agreement between the Fund, LaSalle and the Manager (the “Advisory Agreement”). The Advisor is registered as an investment advisor with the SEC. The Advisor has broad discretion with respect to our investment decisions and is responsible for selecting our investments and for managing our investment portfolio pursuant to the terms of the Advisory Agreement. LaSalle is a wholly-owned but operationally independent subsidiary of Jones Lang LaSalle Incorporated, a New York Stock Exchange-listed real estate services and money management firm. We have no employees as all operations are overseen and undertaken by the Manager and Advisor. In accordance with Maryland law, the Fund does have certain officers who administer the Fund’s operations. These officers are employees of, and are compensated by, the Manager.
The Manager has retained The Townsend Group, at the expense of the Manager, to assist the Manager in reviewing the investment activities of the Advisor and the investment performance of the Fund’s assets and monitoring compliance with the Fund’s investment guidelines. The Townsend Group is a consulting firm whose exclusive focus is the asset class of real estate. Founded in 1983, and with offices in Cleveland, Denver, San Francisco, London and Hong Kong, The Townsend Group is a provider of real estate consulting services to institutional investors in the United States.
Our primary business is the ownership and management of a diversified portfolio of retail, office, industrial and apartment properties primarily located in the United States. As of December 31, 2010, we wholly or majority owned and controlled 34 consolidated properties. As of December 31, 2010, we owned interests in two unconsolidated properties. For a description of our properties, see “Item 2. Properties.”
INVESTMENT STRATEGY Our investment objective is to seek to generate attractive long-term risk-adjusted total returns. When we have available capital to
invest, we intend to pursue our investment objective by investing in real estate and real estate related assets directly or through subsidiaries (as described below), including joint venture arrangements with third parties. We have acquired and manage a portfolio of real estate investments that is diversified by property sector and geographic market. We expect to actively manage the mix of properties and markets over time in response to changing operating fundamentals within each property sector and to changing economies and
2
Item 1. Business.

real estate markets in the cities considered for investment. When consistent with our investment objective, we will also seek to maximize the tax efficiency of our investments through tax-free exchanges and other tax planning strategies. Our investment strategy may be changed from time to time by our board of directors. Given the uncertain economic climate and extraordinary conditions in the commercial real estate industry, management has made it a priority to implement a cash conservation strategy designed to strengthen our balance sheet and protect the value of the Fund’s assets. In this regard, we are not currently pursuing property acquisitions and also have engaged in selective property dispositions. We may make further selective property dispositions. For more information regarding our cash conservation strategy, please see “Liquidity and Capital Resources—Recent Events and Outlook” in Item 7 below.
We have relied primarily on fixed-rate financing, locking in what were favorable spreads between real estate income yields and mortgage interest rates and have tried to maintain a balanced schedule of debt maturities. We attempted to limit overall portfolio leverage to 65% at the time we made our investments (portfolio leverage is calculated as our share of the current property debt balance divided by the fair value of all our real estate investments). Declining commercial property values have caused our portfolio leverage to increase above our target leverage ratio of 65%. Based upon the valuation declines in our portfolio, we estimate our current loan-to-value to be approximately 83%.
As our portfolio of properties has been relatively static over the last two years (except for selected dispositions) and in response to the broader financial crisis and recessionary environment, we have prioritized the use of cash generated from operations and dispositions to strengthen our balance sheet. This strengthening has occurred as we have significantly reduced our borrowings on our line of credit, we renewed and extended the term and relaxed the covenants on the credit facility, and we have substantially increased our liquidity through accumulating cash reserves that may be necessary for the management of our properties. In 2010, we converted this line of credit into a term loan and fully repaid that loan in the fourth quarter.
We will continue to monitor the broader economic slowdown and, as best we can, mitigate the impacts of weakening property fundamentals on our portfolio. Our challenge for the coming year (and foreseeable future) will be to balance the objectives of further growing our cash reserves and retiring the debt (thereby reducing risk in our portfolio) with our desire to distribute free cash flow generated from our property investments to pay dividends to stockholders or to repurchase shares through tender offers. Our strategic bias towards longer dated leases, higher credit tenants and fixed rate financing as we grew our portfolio was at the time considered conservative by most objective criteria. However, the duration and magnitude of the recent recession has exceeded expectations and historical precedents causing even the most conservative and defensive investment strategies to under perform. As liquidity (both debt and equity) dried up for commercial real estate and as valuations and operating fundamentals declined, we were responsive to these changes in market conditions and adopted a more defensive posture in the management of our balance sheet. In this regard, after 17 consecutive quarters of paying a dividend, we have not paid dividends since May 2009 and did not conduct a tender offer during 2009 or 2010.
INVESTMENT POLICIES We may invest directly in real estate or indirectly in real estate through interests in corporations, limited liability companies,
partnerships and joint ventures having an equity interest in real property, real estate investment trusts, ground leases, tenant in common interests, mortgages, participating mortgages, convertible mortgages, second mortgages, mezzanine loans or other debt interests convertible into equity interests in real property, options to purchase real estate, real property purchase-and-leaseback transactions and other transactions and investments with respect to real estate.
Historically, long-term non-recourse financing, on a portfolio-wide basis, was not expected to exceed 65% of portfolio fair value. Initial leverage on any single property was not expected to exceed 75% of the property’s fair value without the approval of our board of directors. There is no set limit as to the number of mortgages that
3

may be secured by a single property, as long as the 75% leverage threshold is not exceeded. Declining real estate values have caused the Fund’s portfolio leverage to increase well above our target leverage of 65%. Based upon the valuation declines in our portfolio, we estimate our current loan-to-value to be approximately 83%. Our board of directors has approved a resolution that allows the Fund to operate with a higher level of portfolio leverage as a result of the decrease in property values. Going forward, we intend to reduce the overall leverage on the Fund, subject to having available capital, through principal amortization on existing loans, refinancing maturing property level debt at lower leverage amounts and selective property dispositions.
Our Advisor performs hold/sell analyses for each property as part of the annual strategic planning process. A sale decision may also originate at the portfolio or Fund level, where diversification objectives relating to property, geographical mix or scheduled lease expirations may indicate the need to rebalance the portfolio, where our Advisor’s perspectives on risks within a property sector change, or where the Fund’s capital needs have changed. A range of property-specific conditions may also indicate the need to sell, including changing demand fundamentals, potential market oversupply, changing conditions in debt or equity capital markets, changes in the asset’s competitive status in its market, or lastly, changes in the Advisors outlook on the availability of refinancing a certain property. Ultimately, the optimal holding period for every property is the period that maximizes return within our risk tolerance objectives. This goal is achieved when:
We have no limitation on the percentage of total assets that may be invested in any asset, nor the concentration of investments in any one geographic location within the United States nor to any individual tenant. The Advisory Agreement includes broad investment guidelines that provide for our diversification goals, which include goals for investment style, property type and geographic diversification.
COMPETITION We face competition when attempting to make real estate investments, including competition from domestic and foreign
financial institutions, other REITs, life insurance companies, pension funds, partnerships and individual investors. The leasing of real estate is highly competitive. Our properties compete for tenants with similar properties primarily on the basis of location, total occupancy costs (including base rent and operating expenses), services provided, and the design and condition of the improvements.
SEASONALITY With the exception of our student-oriented apartment communities, our investments are not materially impacted by seasonality,
despite certain of our retail tenants being impacted by seasonality. Percentage rents (rents computed as a percentage of tenant sales) that we earn from investments in retail and office properties may, in the future, be impacted by seasonality.
For our six student-oriented apartment communities, the majority of our leases commence mid-August and terminate the last day of July. These dates generally coincide with the commencement of the universities’ fall academic term and the completion of the subsequent summer school session. In certain cases we enter into leases for less than the full academic year, including nine-month or shorter-term semester leases. As a result, we may experience significantly reduced cash flows during the summer months at properties leased under leases having terms shorter than 12 months. We are required to re-lease each property in its entirety each year, resulting in significant turnover in our tenant population from year to year. We have found certain property revenues and operating expenses to be cyclical in nature, and therefore not incurred ratably over the course of the year. Prior to
4
• the Advisor’s research and analysis conclude that the asset or the market have reached a cyclical peak; • analysis indicates that a property is likely to under-perform our return objectives going forward; • analysis indicates that a property’s risk profile exceeds our tolerances; or
• we can achieve improved returns by redeploying capital into new investments.

the commencement of each new lease period, mostly during the first two weeks of August, we prepare the units for new incoming tenants. Other than revenue generated by in-place leases for returning tenants, we do not generally recognize lease revenue during this period referred to as “Turn” as we have no leases in place. In addition, during Turn we incur significant expenses making our units ready for occupancy, which we recognize immediately. This lease Turn period results in seasonality in our operating results during the second and third quarter of each year.
ENVIRONMENTAL STRATEGIES As an owner and operator of real estate, we are subject to various environmental laws. Compliance with existing laws has not
had a material adverse effect on our financial condition and results of operations, and we do not believe it will have such an impact in the future. However, we cannot predict the impact of unforeseen environmental contingencies or new or changed environmental laws or regulations applicable to our current investments in properties or investments in properties we may make in the future. During our due diligence prior to making investments in properties, we retain qualified environmental consultants to assist us in identifying and quantifying environmental risks associated with such investments.
GEOGRAPHIC CONCENTRATION The following sets forth the percentage of our consolidated revenues derived from properties owned in each state that accounted
for more than 10% of our consolidated revenues during 2010, 2009 and 2008:
FOREIGN OPERATIONS We currently own one property outside the United States, a multi-tenant office building located in Calgary, Canada. We are
subject to currency risk and general Canadian economy risks associated with this investment. Canada accounted for 4% of our consolidated revenues for each of the years ended December 31, 2010, 2009 and 2008.
DEPENDENCE ON SIGNIFICANT TENANTS No tenant accounted for more than 10% of our consolidated revenues during 2010, 2009 or 2008.
5
State Percentage of
Consolidated Revenues
2010
California 17% Florida 13% Georgia 12% Missouri 10%
2009
California 19% Georgia 13% Florida 10%
2008
California 17% Georgia 14% Florida 11% Colorado 10%

REPORTABLE SEGMENTS The authoritative guidance regarding disclosures about segments of an enterprise requires disclosure of certain operating and
financial data with respect to separate business activities within an enterprise. Our primary business is the ownership and operation of real estate investments. We evaluate cash flow and allocate resources on a property-by-property basis. We aggregate our properties into one reportable segment since all properties are institutional quality real estate. We do not distinguish or group our consolidated operations by property type or on a geographic basis. Accordingly, we have concluded that we currently have a single reportable segment under the authoritative guidance.
AVAILABLE INFORMATION We are subject to the information requirements of the Securities Exchange Act of 1934, or the Exchange Act. Therefore, we file
periodic reports, proxy statements and other information with the SEC. Such reports, proxy statements and other information may be obtained by visiting the Public Reference Room of the SEC at 100 F Street, NE, Washington, DC 20549 or by calling the SEC at 1-800-SEC-0330. In addition, the SEC maintains a website (www.sec.gov) that contains reports, proxy and information statements, and other information regarding issuers, like the Fund, that file electronically. We currently do not have an Internet website. However we provide electronic or paper copies of our SEC filings free of charge upon request. If you would like us to send you an electronic or paper copy of our SEC filings, please contact Peggy Lynn, 225 High Ridge Road, Stamford, CT 06905-3039, or call (203) 352-4497.
INSURANCE Although we believe our investments are currently adequately covered by insurance consistent with the level of coverage that is
standard in our industry, we cannot predict at this time if we will be able to obtain adequate coverage at a reasonable cost in the future.
EXECUTIVE OFFICERS OF THE REGISTRANT James D. Bowden, age 57, has been Chief Executive Officer of the Fund since June 2008. Mr. Bowden has been in the financial
industry for over 30 years and has specialized in private equity for the last eighteen. He joined the Manager in 1998 to form the private equity group and to manage BAC’s private equity fund of funds business. In that capacity, he has acted as the primary investment strategist for various private placement offerings and client advisory activities associated with the private equity asset class. He has led private placement capital raising activities, directed investment origination and has ongoing management and administration responsibilities for the business. He is a frequent speaker before private equity industry groups and asset management organizations concerning issues associated with investing in private equity, and is a member of the Advisory Board of Private Equity Center of the American Graduate School of International Management. Mr. Bowden’s career covers a variety of private equity, commercial banking and management consulting positions. From 1993 to 1998, he served as the manager of the Chicago office of Corporate Credit Examination Services for Continental Bank, where he had responsibility for the independent oversight of the Private Equity Investing and Midwest Commercial Banking Division. He continued in that capacity after Continental Bank merged with BAC, until he joined the Manager. From 1988 to 1993, Mr. Bowden was a Managing Consultant in the Financial Advisory Services practice of Coopers & Lybrand, specializing in corporate turnarounds. His career focused on commercial lending and problem loan workouts prior to joining Coopers & Lybrand, with work at Continental Bank from 1985 to 1988, Citicorp from 1980 to 1985 and American National Bank of Chicago from 1977 to 1980. He received his MBA and BBA degrees from the University of Michigan in 1977 and 1975, respectively. Mr. Bowden is a Certified Public Accountant.
Steven L. Suss, age 50, has been an officer of the Fund since April 2007. Mr. Suss is the Fund’s Chief Financial Officer and the Chief Financial Officer of the Global Wealth and Investment Management Alternative Investment Solutions group (“GWIM”) and is responsible for managing the financial reporting and operational affairs of the investment vehicles within the group. Mr. Suss joined BAC in July 2007 via BAC’s acquisition of
6

U.S. Trust, which he joined in April 2007. At U.S. Trust, Mr. Suss was the Chief Financial Officer of the Alternative Investments Division. Prior to joining U.S. Trust, Mr. Suss served as the Chief Financial Officer and Chief Compliance Officer of Heirloom Capital Management, L.P. (“Heirloom”), an SEC-registered investment adviser focused on investing in small to medium capitalized consumer, healthcare and technology companies, from May 2002 until September 2006. Mr. Suss was responsible for, among other things, all accounting and tax functions for all legal entities and managed accounts affiliated with Heirloom and investor communications. From September 1997 until January 2002, Mr. Suss served as the Chief Financial Officer and Vice President of Westway Capital LLC, an organization dedicated to achieving high performance returns by investing in technology and technology-related companies. Mr. Suss received a B.B.A. from the University of Texas at Austin.
INVESTMENT COMMITTEE OF THE ADVISOR All of the Advisor’s major investment decisions on our behalf require the approval of its North American Private Equity
Investment Committee, which is comprised of the following: Peter H. Schaff has been a Director of the Fund since May 2004. Mr. Schaff was designated as a Director by the Advisor.
Mr. Schaff is the Regional Chief Executive Officer of LaSalle’s North America Private Equity business. In this capacity, he is responsible for overseeing LaSalle’s private equity activities in the United States, Canada and Mexico. Mr. Schaff also serves on LaSalle’s Global Management Committee and LaSalle’s North American Private Equity Investment and Allocation Committees. Since joining LaSalle in 1984, he has had extensive experience in all aspects of institutional real estate investment management including acquisitions, joint ventures, financings, redevelopments and dispositions. Prior to joining LaSalle, Mr. Schaff was a Banking Officer of Continental Illinois National Bank, working on private debt placements, interest rate swaps and related financial products. Mr. Schaff holds an MBA from the University of Chicago Graduate School of Business and an undergraduate degree from Stanford University.
Wade W. Judge is the Chief Investment Officer of LaSalle’s North American Private Equity business and Chairman of LaSalle’s North American Investment Committee. He also serves as the Fund President for the firm’s U.S. open-end fund, LaSalle Property Fund, and as Senior Account Executive for some of LaSalle’s major separate account clients. Prior to assuming these responsibilities, Mr. Judge was responsible for directing the Acquisitions Group’s office, industrial, retail and residential investments throughout the United States for approximately 10 years. Prior to joining LaSalle in 1992, Mr. Judge worked for the Chairman of Jones Lang LaSalle and later managed the firm’s Development group. Before joining Jones Lang LaSalle in 1975, he was a loan officer with Brown Brothers Harriman & Co. in New York City. Mr. Judge earned an MBA from Stanford University and a BA from Dartmouth College.
Jack Chandler is the Chief Executive Officer of the Advisor’s Asia Pacific business, and has overall management responsibility for LaSalle’s Asia Pacific business which includes organization development, strategic planning, new product development and oversight of the overall investment process and results. In addition, he serves as Chairman of LaSalle’s Asia Pacific Investment Committee and is on LaSalle’s Global Management and North American Investment Committees, as well as Jones Lang LaSalle’s Co-Investment Committee. Mr. Chandler joined the firm in 1986 and has been the Chief Executive Officer of Asia Pacific since 2000. Prior this role, Mr. Chandler served as Managing Director for the firm’s direct investment activities in the U.S. He is a founding Member of the Asian Real Estate Association and is also a member of the Urban Land Institute and Pension Real Estate Association. He earned a BS in Industrial Engineering (Summa Cum Laude) from the University of Massachusetts and an MBA from the Harvard Graduate School of Business.
James Hutchinson is the President of LaSalle’s Income & Growth series of funds in the U.S. These funds seek value added returns for investors by assembling portfolios of properties that can be improved and sold to core property investors at higher prices. In this position Mr. Hutchinson is responsible for relationships with investors, portfolio design, and selection of acquisitions for the fund and financing of fund properties. He has significant experience with all types of property acquisitions, including opportunistic, value added and core, in all
7

major property types in the U.S. Mr. Hutchinson has worked with both domestic and international investors including closed- and open-ended funds, international insurance companies, opportunity funds and domestic separate account investors. For the first fifteen years after joining LaSalle in 1985, he was an Acquisitions Officer in LaSalle’s Acquisitions Group. Prior to joining LaSalle, Mr. Hutchinson was a Senior Manager at Deloitte & Touche in the Audit department. Mr. Hutchinson earned an MBA from Indiana University and a BA from Brown University.
William J. Maher is Director of North American Research & Strategy for LaSalle. He is responsible for developing real estate investment strategy for our North American business and he oversees a team that provides market analysis for existing and potential new investments. In addition to leading research efforts throughout North America, he works with clients to develop custom real estate investment and portfolio strategies. Mr. Maher is a principal author of LaSalle’s Investment Strategy Annual and numerous white papers and reports. Mr. Maher is a member of LaSalle’s North American Investment Committee and Management Board, and is a member of LaSalle’s Global Sustainability Task Force. Prior to joining LaSalle, Mr. Maher was a partner with Ernst & Young and director of the Real Estate Consulting Group’s Washington, D.C. office. He managed the Group’s efforts in the fields of strategic planning, market and financial feasibility assessment, portfolio due diligence and corporate real estate. Before that, Mr. Maher was Executive Vice President of Halcyon Ltd., a real estate consulting and services firm. He holds or has held leadership positions with the Urban Land Institute, International Council of Shopping Centers, Real Estate Research Institute and the Real Estate Roundtable. Mr. Maher earned an MS in Urban Planning, with distinction, from Harvard University’s Kennedy School of Government, and a BA in Economics from Williams College.
Non-Voting, Ex Officio Members The following employees of the Advisor are non-voting, ex officio members of its North American Private Equity Investment
Committee: Jeff Jacobson is Chief Executive Officer of LaSalle. In this role since January 2007, he is responsible for a 700-person team
managing over $44 billion of investments in both private and public real estate across all major markets within Europe, North America and Asia Pacific. He is a member of Jones Lang LaSalle’s Global Executive Committee, a member of the Jones Lang LaSalle Co-Investment Capital Allocation Committee and sits on various LaSalle Investment Committees. Mr. Jacobson has more than 20 years of property investment and transactions experience. From 1986 until 1997, he worked in Jones Lang LaSalle’s Capital Markets Group, where he completed property acquisitions, sales, financings and restructuring assignments. Prior to returning to LaSalle in 2000, Mr. Jacobson was a Managing Director of Security Capital Group Incorporated working on the establishment of a Luxembourg-listed REIT and leading the investment team that acquired the largest self storage company in Australia. In 2000, he returned to the Jones Lang LaSalle organization when he was appointed Regional Chief Executive Officer of LaSalle’s European operations with responsibility for all aspects of the European business. In this capacity he serviced the firm’s European investment management clients, chaired the European Investment Committee and implemented growth initiatives. Mr. Jacobson earned an MA and a BA in Economics from Stanford University.
Jacques Gordon is International Director of Research and Investment Strategy for LaSalle and has served in this role since 1994. He serves on the Management Committee of the firm and the Investment Committees for Asia and North America and directs the 20+ person Investment Research & Strategy group, which analyzes capital markets, regional economies and property markets in 150 metropolitan areas and thirty countries. Dr. Gordon is managing editor and a primary author of LaSalle’s Investment Strategy Annual. He also chairs the Global Research Board of Jones Lang LaSalle, which guides the efforts of nearly 300 market analysts around the world. He also serves as the chief strategist for several of LaSalle’s clients. He currently serves on the Board of the International Real Estate Society and the Editorial Boards of three journals. In 2000, Jacques received the “Graaskamp Award” from the Pension Real Estate Association (PREA) for his contribution to institutional investment research and strategy. Dr. Gordon earned a PhD from the Massachusetts Institute of Technology, an MSc from the London School of Economics and a Bachelor’s degree from the University of Pennsylvania.
8

You should consider carefully the risks described below and the other information in this Form 10-K, including our consolidated financial statements and the related notes included elsewhere in this Form 10-K. If any of the following risks actually occur, they may materially harm our business and our financial condition and results of operations and cause the Fund’s NAV to decline.
The current global financial crisis may cause us to lose tenants and may impair our ability to borrow money to refinance existing mortgage loans.
Our operations and performance depend on general economic conditions. The U.S. economy has experienced a prolonged financial slowdown, which led to a decline in consumer spending, credit tightening and unemployment rising. This economic slowdown may adversely affect the businesses of many of our tenants. Accordingly, we may experience higher vacancy rates and deterioration in our financial results as a result of the economic downturn.
This economic slowdown has had an unprecedented impact on global credit markets. Credit availability has tightened significantly and continues to be less available than in the past for commercial real estate. There can be no assurance that we will be able to obtain mortgage loans to purchase additional properties if such opportunities arise or to refinance existing mortgage loans. The Fund’s failure to obtain leverage at the contemplated levels, or to obtain leverage on attractive terms, could have a material adverse effect on the Fund’s ability to sell at fair value or refinance its existing investments and could also negatively impact its operating costs and its ability to pay dividends over time. In addition, as discussed under the heading “Liquidity and Capital Resources—Recent Events and Outlook” in Item 7 below, we have taken significant measures, including selective property dispositions, to conserve cash and preserve our liquidity. There can be no assurance that our cash conservation strategy will be sufficient, and we may be required to engage in additional property dispositions to preserve our liquidity. In this regard, to the extent the availability of credit remains tight, this may have a negative impact on the price we receive for any property disposition we undertake.
Our student-oriented apartment communities are susceptible to certain risks, including: (i) seasonality in rents; (ii) annual re-leasing that is highly dependent on marketing and university admission policies; (iii) competition for tenants from other housing operated by educational institutions or other off-campus properties; and (iv) negative publicity.
For the year ended December 31, 2010, student-oriented apartment communities comprised approximately 31% of our revenues. The results of operations from our student-oriented apartment communities are subject to an annual leasing cycle, short lease-up period, seasonal cash flows, changing university admission and housing policies and other risks inherent in the student housing industry.
Student apartment communities are typically leased by the bed on an individual lease liability basis, unlike multifamily housing where leasing is by the unit. Individual lease liability limits each resident’s liability to his or her own rent without liability for a roommate’s rent. A parent or guardian is required to execute each lease as a guarantor unless the resident provides adequate proof of acceptable credit. The number of lease contracts that we administer is therefore equivalent to the number of beds occupied and not the number of units. We generally lease our owned properties under 12-month leases, and in certain cases, under nine-month or shorter-term semester leases. As a result, we may experience significantly reduced cash flows during the summer months at properties leased under leases having terms shorter than 12 months. Furthermore, all of our student-oriented housing properties must be entirely re-leased each year, exposing us to increased leasing risk. Student apartment communities are also typically leased during a limited leasing season that usually begins in January and ends in August of each year. We are therefore highly dependent on the effectiveness of our marketing and leasing efforts and personnel during this season.
Changes in university admission policies could adversely affect us. For example, if a university reduces the number of student admissions or requires that a certain class of students, such as freshman, live in a university
9
Item 1A. Risk Factors.

owned facility, the demand for beds at our properties may be reduced and our occupancy rates may decline. While we may engage in marketing efforts to compensate for such change in admission policy, we may not be able to effect such marketing efforts prior to the commencement of the annual lease-up period or our additional marketing efforts may not be successful.
Many colleges and universities own and operate their own competing on-campus housing facilities. On-campus student housing has certain inherent advantages over off-campus student housing in terms of physical proximity to the university campus and integration of on-campus facilities into the academic community. Colleges and universities can generally avoid real estate taxes and borrow funds at lower interest rates than us and other private sector operators. We also compete with national and regional owner-operators of off-campus student housing in a number of markets as well as with smaller local owner-operators.
Currently, the student-oriented housing industry is fragmented with no participant holding a significant market share. There are anumber of student apartment communities that are located near or in the same general vicinity of many of our owned properties and that compete directly with us. Such competing student housing complexes may be newer than our properties, located closer to campus, charge less rent, possess more attractive amenities or offer more services or shorter term or more flexible leases. Rental income at a particular property could also be affected by a number of other factors, including the construction of new on-campus and off-campus residences, increases or decreases in the general levels of rents for housing in competing communities and other general economic conditions. We believe that a number of other large national companies with substantial financial and marketing resources may be potential entrants in the student housing business. The entry of one or more of these companies could increase competition for students.
Federal and state laws require colleges to publish and distribute reports of on-campus crime statistics, which may result in negative publicity and media coverage associated with crimes occurring on or in the vicinity of our properties. Reports of crime or other negative publicity regarding the safety of the students residing on, or near, our properties may have an adverse effect on our business.
The Fund is subject to the risks of commercial real estate ownership that could reduce the value of its properties. Real estate historically has experienced significant fluctuations and cycles in value that have resulted in reductions in the value
of real estate related investments. Real estate will continue to be subject to such fluctuations and cycles in value in the future that may negatively impact the value of the Fund’s investments. The marketability and value of the Fund’s investments will depend on many factors beyond the control of the Fund. The ultimate performance of the Fund’s investments will be subject to the varying degrees of risk generally incident to the ownership and operation of the underlying real properties. The ultimate value of the Fund’s investment in the underlying real properties depends upon the Fund’s ability to operate the real properties in a manner sufficient to maintain or increase revenues in excess of operating expenses and debt service. Revenues and the values of our properties may be adversely affected by:
10
• changes in national or international economic conditions;
• cyclicality of real estate;
• changes in local market conditions due to changes in general or local economic conditions and neighborhood
characteristics; • the financial condition of tenants, buyers and sellers of properties;
• competition from other properties offering the same or similar services;
• changes in interest rates and in the availability, cost and terms of mortgage debt;
• access to capital;
In the event that any of the real properties underlying the Fund’s investments experience any of the foregoing events or occurrences, the value of and return on such investments would be negatively impacted.
To the extent the Fund resumes acquiring properties, the success of the Fund may be dependent on the availability of, and the degree of competition for, attractive investments. The lack of availability of attractive investments could materially impair the financial performance of the Fund.
To the extent the Fund resumes acquiring properties, the Fund’s operating results may be dependent upon the availability of, and the Advisor’s ability to identify, acquire and manage, appropriate real estate investment opportunities. It may take considerable time for the Fund to identify and acquire appropriate investments. In general, the availability of desirable real estate opportunities and the Fund’s investment returns will be affected by the level and volatility of interest rates, conditions in the financial markets and general, national and local economic conditions. No assurance can be given that the Fund will be successful in identifying, underwriting and then acquiring investments which satisfy the Fund’s return objectives or that such investments, once acquired, will perform as intended. The Fund is engaged in a competitive business and competes for investments with traditional equity sources, both public and private, as well as existing funds, or funds formed in the future, with similar investment objectives. If the Fund cannot effectively compete with these entities for investments, its financial performance may be adversely affected.
The past performance of the Manager and the Advisor or any fund connected to either is not a predictor of future results of the Fund, and the Fund may not achieve positive financial results.
Neither the track record of senior management of the Manager or the Advisor nor the performance of any fund connected to either shall imply or predict (directly or indirectly) any level of future performance of the Fund, the Manager or the Advisor. The Advisor’s and Manager’s performance and the performance of the Fund is dependent on future events and is, therefore, inherently uncertain. Past performance cannot be relied upon to predict future events due to a variety of factors, including, without limitation, varying business strategies, different local and national economic circumstances, different supply and demand characteristics, varying degrees of competition, varying circumstances pertaining to the real estate capital markets and the cyclical nature of real estate. The Fund may not achieve positive financial results.
If the Fund is unable to obtain leverage on favorable terms, its ability to make new investments, its operating costs and its ability to make dividend payments may be adversely affected.
The Fund’s return on investment is somewhat dependent upon its ability to grow its portfolio of existing and future investments through the use of leverage. The Fund’s ability to obtain the leverage necessary on attractive terms will ultimately depend upon its ability to maintain interest coverage ratios and meet market underwriting standards, which will vary according to lenders’ assessments of the Fund’s creditworthiness and its ability to
11
• the impact of present or future environmental legislation and compliance with environmental laws; • the ongoing need for capital improvements (particularly in older structures);
• changes in real estate tax rates and other operating expenses;
• adverse changes in governmental rules and fiscal policies;
• civil unrest;
• acts of God, including earthquakes, hurricanes and other natural disasters, acts of war, acts of terrorism (any of which may
result in uninsured losses); • adverse changes in zoning laws; and • other factors that are beyond the control of the real property owners and the Fund.

comply with the terms of the borrowings. The Fund’s failure to obtain leverage at the contemplated levels, or to obtain leverage on attractive terms, could have a material adverse effect on the Fund’s ability to make new investments, its operating costs and its ability to pay dividends over time.
The Fund’s use of leverage could impair its financial performance and result in the loss of some or all of its assets. Leverage creates an opportunity for increased return on the Fund’s investments, but at the same time creates risks. For example,
leveraging magnifies changes in the net worth of the Fund. This magnification may be realized, for example, in a circumstance where the gross asset value of one of the Fund’s investments declines, the principal amount of the debt secured by that investment stays constant and the net equity or net worth of the Fund absorbs 100% of the decline in the investment’s value. As stated above, the valuations of many of the Fund’s investments have declined. The Fund will leverage assets only when there is an expectation that leverage will enhance returns, although there can be no assurance that the Fund’s use of leverage will prove to be beneficial. Moreover, there can be no assurance that the Fund will be able to meet its debt service obligations and, to the extent that it cannot, the Fund risks the loss of some or all of its assets or a financial loss if the Fund is required to liquidate assets at a commercially inopportune time.
If the Manager or Advisor were to lose key personnel or the Fund were to lose the services of the Manager or the Advisor, the Fund’s ability to run its business could be adversely affected.
The Manager’s ability to successfully manage the Fund’s affairs currently depends on the Manager’s organization and the Advisor’s ability to identify, structure and finance investments. The Fund will also be relying to a substantial extent on the experience, relationships and expertise of the senior management and other key employees of the Manager and the Advisor. There can be no assurance that these individuals will remain in the employ of the Manager and the Advisor. The loss of the services of the Manager’s organization, the Advisor’s investment advice or any of such individuals, could have a material adverse effect on the Fund’s operations. In addition, under certain circumstances, our board of directors has the right to remove the Manager and the Advisor.
The Fund incurs significant costs in connection with Exchange Act compliance and it may become subject to liability or sanctions for any failure to comply, which could materially impact the results of operations and financial condition of the Fund.
The Fund is subject to Exchange Act rules and related reporting requirements. Compliance with the reporting requirements of the Exchange Act requires timely filing of Quarterly Reports on Form 10-Q, Annual Reports on Form 10-K and Current Reports on Form 8-K, among other actions. Further, recently enacted regulations and standards relating to corporate governance and disclosure requirements applicable to public companies have increased the costs of corporate governance, reporting and disclosure practices to which the Fund is subject. The Fund’s efforts to comply with applicable laws and regulations involve significant, and potentially increasing, costs. In addition, these laws, rules and regulations create legal bases for administrative, civil and criminal proceedings against the Fund in cases of non-compliance.
The Fund may not achieve its return objectives, which may adversely affect the value of our Common Stock. To the extent the Fund resumes making investments, the Fund will make these investments based on the Advisor’s estimates or
projections of internal rates of return and current returns, which in turn are based on, among other considerations, assumptions regarding the performance of Fund assets, the amount and terms of available financing and the manner and timing of dispositions, all of which are subject to significant uncertainty. In addition, events or conditions that have not been anticipated may occur and could have a significant effect on the ability of the Fund to generate attractive long-term risk-adjusted total returns. The Fund has a limited
12

operating history and therefore may be subject to greater uncertainty than funds with longer track records. Moreover, the Fund’s ability to achieve its objectives may be adversely impacted by any of the factors discussed in this “Risk Factors” section. The Fund’s failure to achieve its return objectives may adversely affect the value of our Common Stock.
The Fund may suffer declines in rental revenue and/or occupancy at certain of its current and future retail properties related to co-tenancy provisions contained in certain tenant’s leases, which would have a negative impact on the value of our Common Stock.
Tenants of certain retail properties held by the Fund have leases that contain co-tenancy provisions, which require either certain tenants and/or certain amounts of square footage to be occupied and open for business or other tenants of the property gain certain rights. These rights often include the right to pay reduced rents and/or the right to terminate the lease should the co-tenancy provision not be satisfied. As a result of these co-tenancy provisions, and the exercise of rights pursuant to these provisions, the loss of a single tenant may have a negative impact on the Fund beyond the loss of rent from that particular tenant, in that the loss of a tenant due to its exercise of its co-tenancy provision, may trigger the co-tenancy provisions of other tenants, which can result in additional co-tenancy provisions being triggered. In addition, the Fund could still be negatively impacted even if a tenant that vacates the property continues to pay the full rent amount under its lease as the reduced occupancy could permit other tenants to exercise their co-tenancy provision rights. As a result, the Fund would have to recognize reduced rental income and/or reduced occupancy, which would have a negative impact on the value of the Fund’s Common Stock.
If significant tenants were to default on their lease obligations to the Fund or elect not to renew their leases, the Fund’s results of operations and ability to pay dividends to stockholders may be adversely affected.
During the year ended December 31, 2010, Federal National Mortgage Association (“Fannie Mae”), Nordstrom, Inc., Conexant Systems, Inc and Catholic Healthcare West each individually accounted for at least 3.5% of annualized base rents. If any of these significant tenants were to default on its lease obligation(s) to the Fund or not extend current leases as they mature, our results of operations and ability to reinstate dividends to our stockholders could be adversely affected. In this regard, 19.8% and 20.4% of the leases on our Consolidated Properties expire in 2011 and 2012 (excluding our apartment investments), respectively, and 19.0% and 6.6% of the leases on our Unconsolidated Properties expire in 2011 and 2012, respectively. In addition, Fannie Mae’s lease expires on December 31, 2011, and it did not exercise its market renewal option, which expired on December 31, 2010. As of December 31, 2010, Fannie Mae accounted for 6.1% of our annualized minimum base rent.
The costs of compliance with environmental laws and other governmental laws and regulations may adversely affect the Fund’s results of operations and financial condition and its ability to pay dividends to stockholders.
All real property and the operations conducted on real property are subject to federal, state and local laws and regulations relating to environmental protection and human health and safety. These laws and regulations generally govern wastewater discharges, air emissions, the operation and removal of underground and above-ground storage tanks, the use, storage, treatment, transportation and disposal of solid and hazardous materials, and the remediation of contamination associated with disposals. Some of these laws and regulations may impose joint and several liability on tenants, owners or operators for the costs of investigation or remediation of contaminated properties, regardless of fault or the legality of the original disposal. Under various federal, state and local laws, ordinances and regulations, a current or previous owner, developer or operator of real property may be liable for the costs of removal or remediation of hazardous or toxic substances at, on, under, or in its property. In addition, the presence of these substances, or the failure to properly remediate these substances, may subject the Fund to claims by private plaintiffs and adversely affect its ability to sell or rent a property or to use the property as collateral for future borrowings.
13

Some of these laws and regulations have been amended so as to require compliance with new or more stringent standards as of future dates. Compliance with new or more stringent laws or regulations, stricter interpretation of existing laws or the future discovery of environmental contamination may require material expenditures by the Fund. The Fund cannot assure that future laws, ordinances or regulations will not impose any material environmental liability, or that the current environmental condition of its properties will not be affected by the operations of the tenants, by the existing condition of the land, by operations in the vicinity of the properties, such as the presence of underground storage tanks, or by the activities of unrelated third parties.
These laws typically allow liens to be placed on the affected property. In addition, there are various local, state and federal fire, health, life-safety and similar regulations with which the Fund may be required to comply and that may subject it to liability in the form of fines and/or damages for noncompliance.
The Fund cannot predict what other environmental legislation or regulations will be enacted in the future, how existing or future laws or regulations will be administered or interpreted, or what environmental conditions may be found to exist in the future. The Fund cannot provide assurance that its business, results of operations, liquidity, financial condition and ability to pay dividends will not be adversely affected by these laws.
The Fund’s properties may contain or develop harmful mold, which could lead to liability for adverse health effects and costs of remediation of the problem.
When excessive moisture accumulates in buildings or on building materials, mold growth may occur, particularly if the moisture problem remains undiscovered or is not addressed over a period of time. Some molds may produce airborne toxins or irritants. Public concern about indoor exposure to mold has been increasing along with awareness that exposure to mold may cause a variety of adverse health effects and symptoms, including allergic or other reactions. As a result, the presence of a significant amount of mold at any of the Fund’s properties could require the Fund to undertake a costly remediation program to contain or remove the mold from the affected properties. In addition, the presence of mold could expose the Fund to liability from tenants, employees of tenants and others if property damage or health concerns arise as a result of the presence of mold in the properties of the Fund. If the Fund ever becomes subject to significant mold-related liabilities, its business, financial condition, liquidity, results of operations and ability to pay dividends could be materially and adversely affected.
Stockholders may experience dilution. The Fund has historically and may in the future sell additional Shares through private placements to accredited investors.
Stockholders that do not participate in future private placements will experience dilution in the percentage of their equity investment in the Fund. In addition, depending on the value of the Fund’s properties at the time of any future sale of Shares, stockholders may experience dilution in Current Share Price (as defined under “Item 5. Markets for Registrant’s Common Equity, Related Stockholders Matters and Issuer Purchase of Equity Securities” below) of their Shares.
If the Fund is unable to raise additional capital to support its growth through the sale of Shares, its financial results may suffer.
To support the Fund’s growth and further diversify its portfolio and investments, the Fund has historically and may in the future raise additional capital by selling Shares to accredited investors in private placement transactions. If the Fund is unable to sell additional Shares due to market forces or other factors, its ability to grow its business may be adversely affected. This may negatively affect the Fund’s ability to achieve greater diversification and economies of scale in its operations and therefore, may adversely affect its financial results. In this regard, due to market conditions, the Fund has not sold Shares since January 2009.
14

Future terrorist attacks may result in financial losses for the Fund and limit its ability to obtain terrorism insurance.
The terrorist attacks on September 11, 2001 disrupted the United States financial markets and negatively impacted the U.S. economy in general. Any future terrorist attacks and the anticipation of any such attacks, or the consequences of the military or other response by the United States and its allies, may have a further adverse impact on U.S. financial markets, including real estate capital markets, and the economy. It is not possible to predict the severity of the effect that such future events would have on the financial markets and economy.
It is possible that the economic impact of any future terrorist attacks will adversely affect some of the Fund’s investments. Some of the Fund’s investments, particularly those located in or around major population centers, may be more susceptible to these adverse effects than others. The Fund may suffer losses as a result of the adverse impact of any future attacks and these losses may adversely impact investors’ returns.
In addition, the events of September 11, 2001 created significant uncertainty regarding the ability of real estate owners of high profile properties to obtain insurance coverage protecting against terrorist attacks at commercially reasonable rates, if at all. With the enactment of the Terrorism Risk Insurance Act, which was extended through 2014 by Terrorism Risk Insurance Program Reauthorization Act of 2007, insurers must make terrorism insurance available under their property and casualty insurance policies, but this legislation does not regulate the pricing of such insurance. The absence of affordable insurance coverage may affect the general real estate lending market, lending volume and the market’s overall loss of liquidity may reduce the number of suitable investment opportunities available to the Fund and the pace at which its investments are made. The Fund currently carries terrorism insurance under its master insurance program on all of its investments, except for Railway Street Corporate Centre, an office building located in Calgary, Canada.
Insurance on the Fund’s properties may not adequately cover all losses to its properties, which could reduce stockholder returns if a material uninsured loss occurs.
The Fund’s tenants are required to maintain property insurance coverage for the properties under net leases. The Fund maintains a blanket policy on its properties not insured by its tenants. There are various types of losses, generally of a catastrophic nature, such as earthquakes, floods, hurricanes, terrorism or acts of war, that may be uninsurable or not economically insurable. Should an uninsured loss occur, the Fund could lose its capital investment and/or anticipated profits and cash flow from one or more properties. Inflation, changes in building codes and ordinances, environmental considerations, and other factors, including terrorism or acts of war, might make the insurance proceeds insufficient to repair or replace a property if it is damaged or destroyed. In that case, the insurance proceeds received might not be adequate to restore the Fund’s economic position with respect to the affected real property, which could reduce the amounts the Fund has available to pay dividends.
Due to limitations on the ability of the Fund to repurchase stockholders’ Shares and restrictions on their transfer, an investment in the Shares will be illiquid.
An investment in Shares requires a long-term commitment, with no certainty of return. The sale of Shares to investors in the Fund have not been registered under the Securities Act and the Shares may not be offered or sold except pursuant to an exemption from, or in a transaction not subject to, the registration requirements of the Securities Act and applicable state securities laws. The Fund does not currently intend to apply for listing of its Common Stock on any securities exchange or arrange for it to be quoted on any automated dealer quotation system. There is no public market for the Shares and none is expected to develop. The Shares are also subject to other transfer restrictions.
Although the Fund intends to provide limited liquidity to its stockholders, subject to board of directors approval, by conducting tender offers pursuant to which the Fund expects to offer to repurchase a specific percentage, number or dollar amount of outstanding Shares, the Fund may not have sufficient available cash to
15

fund the repurchase of Shares. There is no guarantee that cash will be available at any particular time to fund repurchases of Shares, and the Fund will be under no obligation to make such cash available through the sale of assets, borrowings or otherwise. In addition, the Fund’s compliance with the Federal income tax rules applicable to REITs and rules under the federal securities laws may affect the Fund’s ability to repurchase Shares. If the number of Shares tendered by stockholders exceeds the percentage, number or dollar amount of Shares offered to be repurchased by the Fund, the Fund might only accept Shares properly tendered on a pro rata basis.
In addition, the repurchase of Shares is subject to regulatory requirements imposed by the SEC. The Fund’s repurchase procedures are intended to comply with such requirements. However, in the event that our board of directors determines that the Fund’s repurchase procedures described above are required to be or appropriately should be amended, the board of directors will adopt revised repurchase procedures as necessary to ensure the Fund’s compliance with applicable regulations or as the board of directors in its sole discretion deems appropriate. The Fund may terminate, reduce or otherwise change the above share repurchase program. In this regard, the Fund has not repurchased Shares since December 2008 in an effort to preserve liquidity.
The Fund’s investments may be illiquid, which may limit the Fund’s ability to repurchase Shares. Real estate investments are relatively illiquid. Such illiquidity may limit the Fund’s ability to vary its portfolio of investments in
response to changes in economic and other conditions. Illiquidity may result from the absence of an established market for real estate investments as well as the legal or contractual restrictions on their resale. In addition, illiquidity may result from the decline in value of one or more of the Fund’s investments. There can be no assurances that the fair market value of any of the Fund’s real property investments will not decrease further in the future. The relative illiquidity of the Fund’s investments may limit its ability to repurchase your Shares through tender offers as planned, and, as noted above, the Fund has not repurchased Shares since December 2008 in an effort to preserve liquidity.
If the Fund is not able to appropriately diversify its investments, its financial results would be disproportionately affected by a downturn in the particular geographic region or property sector in which its investments are concentrated.
The Fund has, to a certain extent, diversified its investments both geographically and by property sector. The Fund may not, however, be able to assemble and maintain a fully diversified portfolio. Furthermore, to the extent the Fund resumes its property acquisition activities, the Fund may make investments involving contemplated sales or refinancings that do not actually occur as expected, which could lead to increased risk as a result of it having an unintended long-term investment and reduced diversification. Further diversification consistent with the Fund’s objectives will be dependent on a number of additional factors, including the Fund’s ability to raise additional capital. Accordingly, there can be no assurance that the Fund’s diversification objectives will be achieved. To the extent the Fund is not able to appropriately diversify its investments, its financial results would be adversely affected if there were a downturn in the particular geographic region or property sector in which the Fund’s investments were concentrated. As of December 31, 2010, 44% of the current fair value of the Fund’s consolidated properties is geographically concentrated in the western United States. As of December 31, 2010, 52% of the current fair value of unconsolidated properties is geographically concentrated in the midwestern United States and 48% of the current fair value is located in the western United States. The Fund’s diversification of consolidated properties by property type, based on current fair value as of December 31, 2010, consists of 47% in the office property sector, 26% in the residential property sector, 19% in the retail property sector and 8% in the industrial property sector. The Fund’s diversification of unconsolidated properties by property type at December 31, 2010 consists of 52% in the retail property sector and 48% in the office property sector. Moreover, during the fiscal year ended December 31, 2010, approximately 17%, 13%, 12% and 10% of our consolidated revenues were derived from California, Florida, Georgia and Missouri, respectively. While most states have felt the impact of the current economic climate, the economies of California and Florida have been particularly hard hit.
16
The Fund may not have unilateral control over some of its investments and may be unable to take actions to protect its interests in these investments, which may result in losses with respect to these investments and expose the Fund to liability.
In certain situations, the Fund may (a) acquire only a noncontrolling interest in a property or other asset in which it invests, (b) rely on independent third party management or strategic partners with respect to the operations of a property or other asset in which it invests or (c) acquire only a participation in an asset underlying an investment, and therefore may not be able to exercise control over the management of such investment. The Fund may also co-invest with third parties through partnerships, joint ventures or other entities, thereby acquiring non-controlling interests in certain investments. These investments may involve risks not present in investments where a third party is not involved, including the possibility that a third party partner or co-venturer may have financial difficulties resulting in a negative impact on such investment, may have economic or business interests or goals that are inconsistent with or adverse to those of the Fund, or may be in a position to take action contrary to the Fund’s investment objectives. The Fund may in certain circumstances be liable for the actions of its third party partners or co-venturers. In addition, the Fund’s lack of control over the properties in which it invests could result in the Fund being unable to obtain accurate and timely financial information for these properties and could adversely affect the Fund’s internal control over financial reporting.
A portion of the Advisor’s and Manager’s fees is based on the Fund’s ability to generate cash flow from operations, which may result in the Advisor and the Manager having incentives that conflict with those of the Fund’s stockholders.
A portion of the Advisor’s and Manager’s fees is based on the Fund’s ability to generate cash flow from operations. Therefore, they may have an incentive to maximize the amount of cash generated from Fund operations, rather than to maximize appreciation, and to hold properties rather than to sell properties at an otherwise appropriate time for the stockholders.
Because a portion of the fees paid to the Manager and the Advisor is based on the Fund’s NAV, the Manager and the Advisor may have an incentive to sell Shares at a time when the capital from those sales cannot be effectively employed, which could harm the Fund’s financial performance and decrease the amount of dividends paid to stockholders.
A portion of the fees paid to the Manager and the Advisor is based on the Fund’s NAV. The Manager and the Advisor may have an incentive to sell Shares, as doing so will bring cash into the Fund and increase NAV, which, in turn, will increase the amount of fees paid to the Manager and the Advisor. However, if the Fund is not able to effectively deploy this capital in new real estate investments, the Fund’s financial performance may be harmed and the amount of dividends paid to stockholders could decrease.
Stockholders will have limited recourse against our board of directors, the Manager and the Advisor. The Fund’s governing documents, as well as the Management Agreement and Advisory Agreement, limit the circumstances
under which the board of directors, the Manager, the Advisor and their respective affiliates, including their officers, partners, employees, stockholders, members, managers and other agents, can be held liable to the Fund and our stockholders. For example, the Fund’s charter provides that the directors and officers will not be liable to the Fund or our stockholders for money damages to the maximum extent permissible under Maryland law. In addition, the Advisory Agreement and the Management Agreement, respectively, provide for the Fund to indemnify, defend and hold harmless the Advisor and the Manager and their affiliates, partners, members, stockholders, officers, employees, agents, successors, and assigns from and against all liabilities, judgments, costs, losses, and expenses, including attorneys’ fees, charges and expenses and expert witness fees, of any nature, kind or description, arising out of claims by third parties in connection with the Advisory Agreement and the Management Agreement, respectively, and the Advisor’s and the Manager’s respective services thereunder except to the extent caused by or resulting from (i) the Advisor’s or Manager’s breach of the
17

Advisory Agreement or Management Agreement, as applicable, or (ii) the negligent or wrongful acts or omissions of the Advisor or Manager or their affiliates, officers, partners, agents, employees, successors or assigns. As a result, our stockholders may have a more limited right of action in certain cases than they would have in the absence of such limitations.
If the Fund fails to qualify as a “venture capital operating company” under ERISA, stockholders subject to ERISA and the related excise tax provisions of the Internal Revenue Code may be subject to adverse financial and legal consequences if they engage in specified prohibited transactions.
Stockholders subject to ERISA should consult their own advisors as to the effect of ERISA on an investment in the Shares. The Advisor will use reasonable best efforts to conduct the operations of the Fund so that the Fund will qualify as a “venture capital operating company” under applicable ERISA regulations. If in the future the Fund were to fail to qualify as a venture capital operating company under ERISA and the Fund’s investments would be deemed to be “plan assets” of the stockholders that are employee benefit plans subject to ERISA (“Plans”), transactions involving the assets of the Fund with “Parties in Interest” under ERISA or “Disqualified Persons” under the Internal Revenue Code, which we refer to as the Code, with respect to such Plans might be prohibited under Section 406 of ERISA and Section 4975 of the Code.
The Fund may not be able to qualify for exemption from registration under the Investment Company Act, which could limit the Fund’s ability to use leverage and could materially impair the Fund’s financial performance.
The Fund intends not to become regulated as an investment company under the Investment Company Act based upon certain exemptions thereunder. Accordingly, the Fund does not expect to be subject to the restrictive provisions of the Investment Company Act. If the Fund fails to qualify for exemption from registration as an investment company, its ability to use leverage would be substantially reduced and it may be unable to conduct its business as described in this report. Any failure to qualify for such exemption from the Investment Company Act could have a material adverse effect on the operations and expenses of the Fund. The Fund’s efforts to avoid registration as an investment company in reliance on one of the available exemptions may affect the composition of the Fund’s investment portfolio and the investment and disposition decisions of the Advisor.
Our Charter does not permit ownership of over 9.9% of the Fund’s Common Stock by any individual or entity, and attempts to acquire Shares in excess of the 9.9% limit would be void without the prior approval of our board of directors.
For the purpose of preserving the Fund’s REIT qualification, our Charter prohibits, without the consent of our board of directors, direct or constructive ownership by any individual or entity of more than 9.9% of the lesser of the total number or value of the Shares as a means of preventing ownership of more than 50% of the Shares by five or fewer individuals. Our Charter’s constructive ownership rules are complex and may cause the Shares owned by a group of related individuals or entities to be deemed to be constructively owned by one individual. As a result, the acquisition of less than 9.9% of the Common Stock by an individual or entity could cause an individual to own constructively in excess of 9.9% of the Shares, and thus be subject to our Charter’s ownership limit. Any attempt to own or transfer Shares in excess of the ownership limit without the consent of our board of directors will be void, and will result in those Shares being transferred by operation of law to a charitable trust, and the person who acquired such excess Shares will not be entitled to any distributions thereon or to vote those excess Shares.
There are no assurances of the Fund’s ability to pay dividends in the future. The Fund intends to pay dividends and to make distributions to stockholders in amounts such that all or substantially all of the
Fund’s taxable income in each year, subject to certain adjustments, is distributed to stockholders. This, along with other factors, should enable the Fund to qualify for the tax benefits afforded to a
18

REIT under the Code. All distributions will be made at the discretion of our board of directors and will depend on the Fund’s earnings, financial condition, maintenance of its REIT status and such other factors as our board of directors may deem relevant from time to time. In this regard, we are not immune to impacts from a continuation of the current economic climate and the financial stress it may have on our tenants. We intend to take a more defensive posture in the management of our balance sheet. These defensive tactics may include, altering the timing and amount of what we have historically paid in dividends. For example, we have not paid dividends since May 1, 2009. There are no assurances as to the Fund’s ability to pay dividends in the future or the amount of any future dividends. There may be little or no cash flow available to investors. In addition, any distributions made by the Fund may include a return of capital.
A stockholder who decides to participate in the dividend reinvestment plan will be subject to taxes on those dividends that are reinvested.
Each stockholder has the option of participating in the Fund’s dividend reinvestment plan under which all or a designated portion of such stockholder’s dividends will automatically be reinvested in additional Shares. A stockholder participating in the dividend reinvestment plan will be required to pay taxes with respect to such reinvested dividends in the year that the dividend is paid by the Fund although no cash is actually distributed.
If the Fund does not maintain its qualification as a REIT, the Fund will be subject to tax as a regular corporation and face a substantial tax liability.
The Fund expects to operate so as to qualify as a REIT under the Code. However, qualification as a REIT involves the application of highly technical and complex Code provisions for which only a limited number of judicial or administrative interpretations exist. Even a technical or inadvertent mistake could jeopardize the Fund’s REIT status. Furthermore, new tax legislation, administrative guidance or court decisions, in each instance potentially with retroactive effect, could make it more difficult or impossible for the Fund to qualify as a REIT. If the Fund fails to qualify as a REIT in any tax year, then:
The tax treatment of dividends may cause investments in non-REIT corporations to be relatively more desirable. The Code generally provides for reduced tax rates for certain qualified dividends paid to individuals. These reduced rates
generally do not apply to dividends paid by REITs. Although this legislation does not adversely affect the tax treatment of REITs, it may cause investments in non-REIT corporations to be relatively more desirable. Such reduced tax rates are currently set to expire at the end of 2012.
Complying with REIT requirements may cause the Fund to forego otherwise attractive opportunities. To qualify as a REIT for federal income tax purposes, the Fund must continually satisfy tests concerning, among other things, its
sources of income, the nature and diversification of its investments in commercial real
19
• the Fund would be taxed as a regular domestic corporation, which under current laws, among other things, means being
unable to deduct distributions to the stockholders in computing taxable income and being subject to federal income tax on its taxable income at regular corporate rates;
• any resulting tax liability could be substantial, could have a material adverse effect on the Fund’s book value and could
reduce the amount of cash available for distribution to the stockholders;
• unless the Fund was entitled to relief under applicable statutory provisions, it would be required to pay taxes, and thus, its
cash available for distribution to the stockholders would be reduced for each of the years during which the Fund did not qualify as a REIT; and
• the Fund may also be disqualified from re-electing REIT status for the four taxable years following the year during which
it became disqualified.

estate and related assets, the amounts it distributes to stockholders and the ownership of its Shares. The Fund may also be required to make distributions to stockholders at disadvantageous times or when it does not have capital readily available for distribution. The REIT provisions of the Code may substantially limit the Fund’s ability to hedge its financial assets and related borrowings. Thus, compliance with REIT requirements may hinder the Fund’s ability to operate solely on the basis of maximizing profits.
Complying with REIT requirements may force the Fund to liquidate or restructure otherwise attractive investments. To qualify as a REIT, the Fund must also ensure that at the end of each calendar quarter, at least 75% of the value of its assets
consists of cash, cash items, government securities and qualified REIT real estate assets. The remainder of the Fund’s investments in securities cannot include more than 10% of the outstanding voting securities of any one issuer or 10% of the total value of the outstanding securities of any one issuer. In addition, no more than 5% of the value of the Fund’s assets can consist of the securities of any one issuer. If the Fund fails to comply with these requirements, it must dispose of a portion of its assets within 30 days after the end of the calendar quarter to avoid losing its REIT status and suffering adverse tax consequences.
Complying with REIT requirements may force the Fund to borrow to make distributions to stockholders. From time to time, the Fund’s taxable income may be greater than its cash flow available for distribution to stockholders. If the
Fund does not have other capital available in these situations, it may be unable to distribute substantially all of its taxable income as required by the REIT provisions of the Code. Thus, the Fund could be required to borrow capital, sell a portion of its assets at disadvantageous prices, issue consent dividends (which will be taxable to stockholders) or find another alternative. These options could increase the Fund’s costs or reduce its NAV.
On November 21, 2007, the Fund acquired Cabana Beach Gainesville which met the “significant” criteria as described in Rule 3-14 of Regulation S-X. Also on November 21, 2007, the Fund acquired three additional real estate investments from a related selling group (the “Selling Group”), Cabana Beach San Marcos, Campus Lodge Athens and Campus Lodge Columbia. The Fund also acquired a fifth real estate investment from the Selling Group in February 2008. Pursuant to Rule 3-14, we were required to file certain financial statements relating to these acquisitions. However, the Selling Group has refused to participate in the audits, and we were therefore unable to supply the required audited income statement required by Rule 3-14. The staff of the Division of Corporation Finance of the SEC (“the Staff”) indicated that, until we provide the Rule 3-14 financial statements for the aforementioned real estate investments, it would neither declare effective any registration statement or post-effective amendments, nor consider compliant any proxy or other filing that require our financial statements. The Staff also indicated that our filings are not considered timely for purposes of Form S-3. Finally, the Staff stated that, subject to certain exceptions, we should not make offerings under effective registration statements or under Rule 505 or 506 of Regulation D where any purchasers are not accredited investors under Rule 501(a) of Regulation D. As stated above, we only sell Shares to accredited investors. As of the filing of this Form 10-K, we believe we have passed the timeframe for which we would need to provide the historical financial statements and therefore are now compliant with the SEC’s financial statement requirements with respect to the Selling Group.
20
Item 1B. Unresolved Staff Comments.

DESCRIPTION OF REAL ESTATE: Our investments in real estate assets as of December 31, 2010 consist of our interests in properties that are consolidated in our
consolidated financial statements including interests in seven joint ventures (the “Consolidated Properties”) and interests in two additional joint ventures that own real estate (the “Unconsolidated Properties”). The following table sets forth the information with respect to our real estate assets as of December 31, 2010:
21
Item 2. Properties.
Property Name Location Type %
Owned Year Built Date Acquired Net RentableSquare Feet
PercentageLeased
Consolidated Properties: Monument IV at Worldgate (1) Herndon, VA Office 100% 2001 August 27, 2004 228,000 100% Georgia Door Sales Distribution Center (1) Austell, GA Industrial 100% 1994/1996 (2) February 10, 2005 254,000 76% 105 Kendall Park Lane (1) Atlanta, GA Industrial 100% 2002 June 30, 2005 409,000 100%
CHW Medical Office Portfolio: 300 Old River Road (3) Bakersfield, CA Office 100% 1992 December 21, 2005 37,000 100% 500 Old River Road (3) Bakersfield, CA Office 100% 1992 December 21, 2005 30,000 80% 500 West Thomas Road (3) Phoenix, AZ Office 100% 1994 December 21, 2005 169,000 79% 1500 South Central Ave (3) Glendale, CA Office 100% 1980 December 21, 2005 37,000 94% 14600 Sherman Way (1) Van Nuys, CA Office 100% 1991 December 21, 2005 50,000 73% 14624 Sherman Way (1) Van Nuys, CA Office 100% 1981 December 21, 2005 53,000 74% 18350 Roscoe Blvd (3) Northridge, CA Office 100% 1979 December 21, 2005 68,000 91% 18460 Roscoe Blvd (3) Northridge, CA Office 100% 1991 December 21, 2005 25,000 100% 18546 Roscoe Blvd (3) Northridge, CA Office 100% 1991 December 21, 2005 41,000 95% 4545 East Chandler (3) Chandler, AZ Office 100% 1994 December 21, 2005 49,000 55% 485 South Dobson (3) Chandler, AZ Office 100% 1984 December 21, 2005 43,000 66% 1501 North Gilbert (3) Gilbert, AZ Office 100% 1997 December 21, 2005 38,000 65% 116 South Palisade (3) Santa Maria, CA Office 100% 1995 December 21, 2005 33,000 87% 525 East Plaza (3) Santa Maria, CA Office 100% 1995 December 21, 2005 44,000 76% 10440 East Riggs (3) Chandler, AZ Office 100% 1996 December 21, 2005 40,000 45%
Marketplace at Northglenn (1) Northglenn, CO Retail 100% 1999-2001 (4) December 21, 2005 439,000 93% Metropolitan Park North (1) Seattle, WA Office 100% 2001 March 28, 2006 179,000 100% Stirling Slidell Shopping Centre (1) Slidell, LA Retail 100% 2003 December 14, 2006 139,000 75% 4001 North Norfleet Road (1) Kansas City, MO Industrial 100% 2007 February 27, 2007 702,000 100% Station Nine Apartments (1) Durham, NC Apartment 100% 2005 April 16, 2007 312,000 97% 4 Research Park Drive (1) St. Charles, MO Office 100% 2000/2004 June 13, 2007 60,000 100% 36 Research Park Drive (1) St. Charles, MO Office 100% 2007 June 13, 2007 81,000 100% The District at Howell Mill (5) Atlanta, GA Retail 87.85% 2006 June 15, 2007 306,000 99% Canyon Plaza (1) San Diego, CA Office 100% 1986/1993 (6) June 26, 2007 199,000 100% Railway Street Corporate Centre (1) Calgary, Canada Office 100% 2007 August 30, 2007 135,000 100%
Student-oriented Apartment Communities: Cabana Beach San Marcos (5) San Marcos, TX Apartment 78% 2006 November 21, 2007 258,000 95% Cabana Beach Gainesville (5) Gainesville, FL Apartment 78% 2005-2007 (7) November 21, 2007 598,000 92% Campus Lodge Athens (5) Athens, GA Apartment 78% 2003 November 21, 2007 229,000 83% Campus Lodge Columbia (5) Columbia, MO Apartment 78% 2005 November 21, 2007 256,000 100% The Edge at Lafayette (5) Lafayette, LA Apartment 78% 2007 January 15, 2008 207,000 99% Campus Lodge Tampa (5) Tampa, FL Apartment 78% 2001 February 29, 2008 477,000 97%
Unconsolidated Properties: Legacy Village (8) Lyndhurst, OH Retail 46.5% 2003 August 25, 2004 595,000 96% 111 Sutter Street (5) San Francisco, CA Office 80% 1926/2001 (9) March 29, 2005 286,000 88%
(1) This property is owned fee. (2) Built in 1994 and expanded in 1996. (3) This property is owned leasehold. (4) Redeveloped between 1999 and 2001. (5) This property is owned as majority interest holder in a joint venture. (6) Built in 1986 with addition completed in 1993. (7) Portions of property built and completed between 2005 and 2007. (8) This property is owned as an interest holder in a joint venture. (9) Built in 1926 and renovated in 2001.

ACQUISITIONS 2010 Acquisitions
None
2009 Acquisitions None
2008 Acquisitions Consolidated Properties On January 15, 2008, we acquired a 78% interest in The Edge at Lafayette, a student-oriented apartment community. The Edge
at Lafayette, located in Lafayette, Louisiana near the University of Louisiana-Lafayette, has 168 units and 524 bedrooms. Leases for this property generally expire within one year. The gross purchase price for the property was approximately $26,870.
On February 29, 2008, we acquired a 78% interest in Campus Lodge Tampa, a student-oriented apartment community. Campus Lodge Tampa, located in Tampa, Florida near the University of South Florida, has 312 units and 1068 bedrooms. Leases for this property generally expire within one year. The gross purchase price for the property was approximately $46,787 and included the assumption of a $33,500, nine-year fixed rate mortgage loan, at 5.95% with interest only due for the first five years.
DISPOSITIONS 2010 Dispositions
On April 15, 2010, we sold Havertys Furniture, an 808,000 square foot industrial center located in Braselton, GA, for $35,000, resulting in a gain of $113. On the same day, we sold 25850 S. Ridgeland, a 719,000 square foot industrial center located in Monee, IL for $19,060 resulting in a gain of $709. The sales reduced our single tenant exposure and refinancing risks. We used the proceeds to pay off the mortgage debt on Havertys Furniture, 25850 S. Ridgeland and Georgia Door Sales Distribution Center resulting in losses on early debt retirement of $405, $233 and $73, respectively.
On September 30, 2010, the Fund assigned its 90% interests in the 9800 South Meridian and 18922 Forge Drive investments to our operating partner and received a distribution of $1,000 from property cash reserves. The Fund recorded a loss on the assignment of its interest in 18922 Forge Drive of $428, which is included in equity in loss of unconsolidated affiliates on the Consolidated Statement of Operations and Comprehensive Loss. The Fund recorded no loss on its assignment of interest in 9800 South Meridian as the investment was previously recorded at $0. The Fund has no further involvement in and no obligation to fund the investments in 9800 South Meridian and 18922 Forge Drive subsequent to assigning its interests.
2009 Dispositions On June 26, 2009, we sold Hagemeyer Distribution Center, a 300,000 square foot industrial property located in Auburn, GA, for
$10,400, resulting in a gain of $911. While the property was rent-bearing under a long-term lease, it was vacant and no longer fit within the Fund’s strategy. The buyer was a local user looking to expand its operations. We used the proceeds to pay off the mortgage debt on the property resulting in a loss on early debt retirement of $140.
On September 4, 2009, we sold Waipio Shopping Center, a 137,000 square foot retail center in Waipahu, HI, for $30,850, resulting in a gain of $1,619. The sale reduced our refinancing risk by eliminating one of our 2010 loan maturities. We used the proceeds to payoff the mortgage debt on the property resulting in a loss on early debt retirement of $863.
22

FINANCING The following is a summary of the mortgage debt for our Consolidated Properties and our Unconsolidated Properties as of
December 31, 2010.
INSURANCE We believe our properties currently are adequately covered by insurance consistent with the level of coverage that is standard in
our industry.
23
Property Interest Rate Maturity Date PrincipalBalance
Consolidated Properties:
Monument IV at Worldgate 5.29% September 2011 $35,616 105 Kendall Park Lane 4.92% September 2012 12,659 4001 North Norfleet Road 5.60% March 2013 24,230 Metropolitan Park North 5.73% April 2013 60,480 36 Research Park Drive 5.60% July 2013 10,990 CHW Medical Office Portfolio 5.75% November 2013 16,627 CHW Medical Office Portfolio 5.75% November 2013 14,471 CHW Medical Office Portfolio 5.75% November 2013 14,986 CHW Medical Office Portfolio 5.79% March 2014 32,763 Stirling Slidell Shopping Centre 5.15% April 2014 13,059 Cabana Beach San Marcos 5.57% December 2014 19,404 Cabana Beach Gainesville 5.57% December 2014 48,493 Campus Lodge Athens 5.57% December 2014 13,551 Campus Lodge Columbia 5.57% December 2014 16,137 The Edge at Lafayette 5.57% February 2015 17,281 4 Research Park Drive 6.05% March 2015 6,794 Marketplace at Northglenn 5.50% January 2016 61,984 Campus Lodge Tampa 5.95% October 2016 33,500 Station Nine Apartments 5.50% May 2017 36,885 The District at Howell Mill 6.14% June 2017 10,000 Canyon Plaza 5.90% June 2017 29,883 Railway Street Corporate Centre 5.16% September 2017 29,547 The District at Howell Mill 5.30% March 2027 35,000 Unconsolidated Properties:
Legacy Village 5.63% January 2014 $91,563 111 Sutter Street 5.58% June 2015 55,634

OPERATING STATISTICS We generally have investments in properties with high occupancy rates leased to quality tenants under long-term, non-
cancelable leases. We believe our leases are beneficial to achieving our investment objectives. The following table shows our operating statistics by property sector for our consolidated properties as of December 31, 2010:
The following table shows our operating statistics by property sector for our unconsolidated properties as of December 31, 2010:
As of December 31, 2010, the scheduled lease expirations at our consolidated properties are as follows:
24
Number ofProperties
Total Area(Sq Ft)
% of TotalArea Occupancy %
Average MinimumBase Rent per
Occupied Sq Ft (1) Consolidated Properties:
Office:
Commercial Office 6 882,000 14.2% 100.0% $ 21.79 Medical Office 15 757,000 12.2% 78.0% 19.02
Retail 3 884,000 14.2% 92.2% 13.73 Industrial 3 1,365,000 21.9% 95.6% 3.50 Apartments 7 2,337,000 37.5% 94.5% 13.55
Total 34 6,225,000 100.0% 93.2% $ 13.12
(1) Amount calculated as in-place minimum base rent for all occupied space at December 31, 2010 and excludes any straight line rents, tenant recoveries and percentage rent revenues.
Number ofProperties
Total Area(Sq Ft)
% of TotalArea Occupancy %
Average MinimumBase Rent per
Occupied Sq Ft
Unconsolidated Properties:
Office:
Commercial Office 1 286,000 32.5% 87.0% $ 37.10 Retail 1 595,000 67.5% 96.2% 20.43
Total 2 881,000 100.0% 93.2% $ 25.48
Year Number of
Leases Expiring Annualized
Minimum Base Rent (1) Square Footage
Percentage ofAnnualized Minimum
Base Rent
2011 (2) 123 $ 9,161 475,000 19.8% 2012 62 9,445 420,000 20.4% 2013 52 3,122 171,000 6.8% 2014 42 4,984 460,000 10.8% 2015 21 2,324 147,000 5.0% 2016 and thereafter 49 17,198 1,922,000 37.2%
Total 349 $ 46,234 3,595,000
(1) Amount calculated as annualized in-place minimum base rent excluding any straight line rents, tenant recoveries and percentage rent revenues as of December 31, 2010 presented in the year of lease expiration.
(2) Does not include 4,816 leases totaling approximately 2,208,000 square feet and approximately $29,911 in annualized minimum base rent associated with our seven apartment investments.

As of December 31, 2010, the scheduled lease expirations at our unconsolidated properties are as follows:
PRINCIPAL TENANTS The following table sets forth the top ten tenants, in our consolidated properties, based on their percentage of annualized
minimum base rent as of December 31, 2010:
PRINCIPAL PROPERTIES The following table sets forth the top ten properties, of our consolidated properties, based on their percentage of minimum base
rent as of December 31, 2010:
25
Year Number of
Leases Expiring Annualized
Minimum Base Rent Square Footage
Percentage ofAnnualized Minimum
Base Rent
2011 27 $ 3,971 90,000 19.0% 2012 8 1,382 51,000 6.6% 2013 22 3,386 116,000 16.2% 2014 16 1,785 65,000 8.5% 2015 8 1,195 42,000 5.7% 2016 and thereafter 23 9,200 457,000 44.0%
Total 104 $ 20,919 821,000
Tenants Line of Business Date of Lease
Expiration Lease Renewal
Options
% of Total Area
% ofAnnualizedMinimumBase Rent
Fannie Mae Financial Services December 31, 2011 None 3.7% 6.1% Nordstrom, Inc Retailer January 31, 2012 None 2.2% 5.3% Conexant Systems, Inc. Communications June 20, 2017 Two 5-year options 3.2% 4.8% Catholic Healthcare West Healthcare Varies Varies 2.8% 4.0% Musician’s Friend, Inc. Retailer February 28, 2017 Three 5-year options 11.3% 3.3% Westar Aerospace & Defense
Group, Inc.
Technical and Scientific Research Services
Varies Varies 2.3% 2.6%
Ross Stores. Retailer Varies Varies 1.4% 1.6% Acuity Specialty Products Group, Inc.
Specialty Chemical Products
April 30, 2017 Two 5-year options 6.6% 1.6%
24 Hour Fitness Health Club February 11, 2016 Three 5-year options 0.6% 1.1% PetSmart Stores Retailer Varies Varies 1.1% 1.1%
Total 35.2% 31.5%
Properties % of Total Area % of Minimum
Base Rent
Cabana Beach Gainesville 9.6% 8.5% Metropolitan Park North 2.9% 7.8% Campus Lodge Tampa 7.7% 7.2% Marketplace at Northglenn 7.1% 6.9% Monument IV at Worldgate 3.7% 6.2% Station Nine Apartments 5.0% 5.7% The District at Howell Mill 4.9% 5.5% Cabana Beach San Marcos 4.1% 5.1% Canyon Plaza 3.2% 5.1% Campus Lodge Columbia 4.1% 4.5%
Total 52.3% 62.5%

GROUND LEASES We are subject to a number of ground leases at certain properties we own or control. As of December 31, 2010 we have $2 in
total payments due over the next 68 years.
We are involved in various matters of litigation arising in the normal course of business. While we are unable to predict with anycertainty the amounts involved, management is of the opinion that, when such litigation is resolved, our resulting net liability, if any, will not have a significant effect on our consolidated financial position or results of operations.
26
Item 3. Legal Proceedings.
Item 4. (Removed and Reserved)

PART II
Our Common Stock is not currently traded on any exchange and there is no established public trading market for our Common Stock. As of the filing date of this Form 10-K, there were approximately 1,765 holders of our Common Stock.
The price at which Shares are sold or redeemed at any future dates will be determined based on the current share price (the “Current Share Price” as defined below). We may sell additional Shares through private placements to accredited investors on a periodic basis to accommodate investment by existing and additional investors. Subsequent offerings may be made either for our Common Stock or for other share classes that may be subject to sales loads or bear different expense ratios.
Unregistered Sales of Equity Securities During the year ended December 31, 2010, we did not sell any unregistered equity securities.
Issuer Purchases of Equity Securities
During the fourth quarter of 2010, neither the Fund nor any affiliated purchaser of the Fund repurchased any of our equity securities.
CALCULATION OF SHARE PRICE The Current Share Price of our Common Stock (the “Current Share Price”) is established quarterly based on the following
valuation methodology, which may be modified from time to time by our board of directors.
Net Asset Value Calculation The NAV of the Fund is determined as of the end of each of the first three quarters of a fiscal year, within 45 calendar days
following the end of such quarter. The Fund’s year-end NAV is determined after the completion of our year-end audit. NAV is determined as follows: (i) the aggregate fair value of (A) our interests in the real estate investments (“Investments”) plus (B) all other assets of the Fund, minus (ii) the aggregate fair value of our indebtedness and other outstanding obligations as of the determination date.
We identify and retain independent third-party real estate appraisal firms that appraise each Investment not less than annually beginning one year after acquisition. During the first three quarters after acquisition, the Investment will be carried at capitalized cost and reviewed quarterly for material events at the property or market level that may require an adjustment of the Investment’s valuation.
For each of the three quarters following the independent appraisal of a particular Investment, we determine the value of such Investment based on our review of the appraisal and material changes at the property or market level. We also determine the value of the indebtedness related to each Investment beginning one year after acquisition of the encumbered property and on a quarterly basis thereafter.
Current Share Price Calculation The Current Share Price equals NAV as of the end of each quarter divided by the number of outstanding Shares at the end of
such quarter. During the first three quarters of the calendar year, the Current Share Price is calculated based on the real estate investment value, indebtedness values and value of other assets and liabilities
27
Item 5. Market for Registrant’s Common Equity, Related Stockholder Matters and Issuer Purchases of Equity Securities.

as determined by us and reviewed by our independent auditors. Year-end Current Share Price is calculated based on the real estate investment value, indebtedness values and value of other assets and liabilities as determined by us and audited by our independent auditors. The supplemental consolidated fair value information is presented to the board of directors with our year-end audited financial statements.
The following table presents the NAV per share for each period indicated below:
DIVIDEND POLICY To comply with current tax laws necessary to qualify as a REIT, we expect to distribute at least 90% of our taxable income to
our stockholders. Accordingly, we currently intend, although are not legally obligated, to make distributions to our stockholders in amounts sufficient to maintain our qualification as a REIT. Before payment of any dividend, we must have cash available after payment of both operating requirements and scheduled debt service on mortgages and loans payable. The declaration of dividends is at the discretion of our board of directors, which decision is made from time to time based on then prevailing circumstances.
On March 13, 2009, our board of directors declared a dividend of $0.875 per Share to stockholders of record on March 31, 2009, payable on May 1, 2009. This represented a reduction from $1.75 per Share, our historic practice for quarterly dividends for the previous 16 quarters. No further dividends were declared in 2009 or 2010. We cannot provide assurance with respect to the amount of dividends, if any, that we will pay in the future.
Our board of directors, the Manager and the Advisor will periodically review the dividend policy to determine the appropriateness of our dividend rate relative to our current and forecasted cash flows.
The following table presents the distributions declared per Share for each period indicated below:
Any future distributions will be declared at the discretion of the board of our directors and will depend on our actual cash flow, financial condition, capital requirements, the annual distribution requirements under the REIT provisions of the Code, and such other factors as our board of directors deems necessary or appropriate.
28
Quarter Ended NAV per Share
December 31, 2010 $ 47.69 September 30, 2010 49.60 June 30, 2010 52.17 March 31, 2010 55.23 December 31, 2009 55.53 September 30, 2009 65.56 June 30, 2009 72.24 March 31, 2009 78.04
To Stockholders of Record as of Paid on or to be paid on Distribution
per Share
March 31, 2009 May 1, 2009 $ 0.875

Performance Graph (1) (Dollars in whole dollars) The following graph is a comparison of the five-year cumulative return of our Shares (post leverage and fees), the Standard and
Poor’s 500 Index (“S&P 500”), the National Real Estate Investment Trusts’ (“NAREIT”) All Equity Index and the National Counsel of Real Estate Investment Fiduciaries Property Index (“NPI”) (before leverage and fees), as peer group indices. The graph assumes that $100 was invested on December 31, 2005 in our Shares, the S&P 500 Index, the NAREIT All Equity Index and the NPI assuming that all dividends were reinvested without the payment of any commissions. There can be no assurance that the performance of our Shares will continue in line with the same or similar trends depicted in the graph below.
29
(1) The information in this section is not “soliciting material,” is not deemed “filed” with the SEC, and is not to be incorporated by reference into any filing of the Fund under the Securities Act or the Exchange Act, whether made before or after the date hereof and irrespective of any general incorporation language contained in such filing.
* The NPI is a quarterly time series composite total rate of return measure (before leverage and fees) of investment performance of a very large pool of individual commercial real estate properties acquired in the private market for investment purposes only. Its value is based on the value of the properties in the index and not the market value of securities. All properties in the NPI have been acquired, at least in part, on behalf of tax-exempt institutional investors—the great majority being pension funds. Properties in the NPI are accounted for using market value accounting standards, not historical cost. We measure the performance of our Advisor against the NPI.

The following table sets forth our selected financial and operating data on a historical basis. The following data should be read in conjunction with our consolidated financial statements and the accompanying notes thereto and Management’s Discussion and Analysis of Financial Condition and Results of Operations included elsewhere in this Form 10-K.
30
Item 6. Selected Financial Data.
Year ended December 31, 2010 2009 2008 2007 2006
Operating Data:
Total revenues $ 95,695 $ 96,908 $ 97,862 $ 63,178 $ 43,931 Operating expenses 97,472 86,892 104,395 56,612 37,245
Operating (loss) income (1,777) 10,016 (6,533) 6,566 6,686 Interest income 17 84 293 1,399 1,229 Interest expense (34,920) (34,931) (36,035) (23,040) (14,513) Equity in (loss) income of unconsolidated affiliates (2,373) (8,277) 1,230 536 425 Gain (loss) on foreign currency derivative — — 1,492 (504) —
Net loss from continuing operations (39,053) (33,108) (39,553) (15,043) (6,173) Net income (loss) from discontinued operations 2,323 (8,708) 1,328 835 (746)
Net loss (36,730) (41,816) (38,225) (14,208) (6,919) Loss allocated to noncontrolling interests 1,090 2,205 5,651 572 156
Net loss attributable to Excelsior LaSalle Property Fund, Inc. (35,640) (39,611) (32,574) (13,636) (6,763)
Foreign currency translation adjustment 501 1,846 (2,848) — —
Net comprehensive loss $ (35,139) $ (37,765) $ (35,422) $ (13,636) $ (6,763)
Weighted average shares outstanding 4,135,635 4,128,290 3,822,484 3,252,725 2,341,347 Net loss attributable to Excelsior LaSalle Property
Fund, Inc. per share–basic and diluted $ (8.62) $ (9.59) $ (8.52) $ (4.19) $ (2.89) Cash distributions declared per common share $ 0.00 $ 0.875 $ 7.00 $ 7.00 $ 7.00
December 31, 2010 2009 2008 2007 2006
Balance Sheet Data:
Investments in real estate–net of accumulated depreciation $ 771,387 $ 897,207 $ 957,974 $ 918,604 $ 504,133
Investments in real estate and other assets held for sale — 52,136 — — — Total assets 870,689 1,017,140 1,084,805 1,070,188 635,694 Total mortgage notes and other debt payable 592,804 654,086 717,497 691,316 361,351 Liabilities held for sale — 43,352 — — — Total equity 252,709 289,323 323,616 331,595 244,258
Year ended December 31, 2010 2009 2008 2007 2006
Cash Flow Information:
Net cash flows provided by operating activities $ 19,040 $ 17,758 $ 19,983 $ 26,464 $ 9,941 Net cash flows provided by (used in) investing activities 42,680 37,384 (37,933) (391,619) (118,800) Net cash flows (used in) provided by financing
activities (72,548) (27,305) 26,011 344,590 129,667 Other Data:
Funds from operations $ (3,484) $ (3,593) $ 26,149 $ 22,162 $ 16,821 Funds from operations per share–basic and diluted (1) $ (0.84) $ (0.87) $ 6.84 $ 6.81 $ 7.18
(1) Funds from operations (“FFO”) does not represent cash flow from operations as defined by accounting principles generally accepted in the United States of America (“GAAP”), should not be considered as an alternative to GAAP net income and is not necessarily indicative of cash available to fund all cash requirements. Please see below for a reconciliation of net income to FFO.

The selected financial data presented above has been dramatically impacted by acquisitions and dispositions made since the inception of the Fund. These acquisitions drastically impact the comparability of our results from operations, financial position and cash flows. We are uncertain how the results from operations, financial position and cash flows will be impacted should we make future acquisitions or dispositions.
FUNDS FROM OPERATIONS Consistent with real estate industry and investment community preferences, we consider FFO as a supplemental measure of the
operating performance for a real estate investment trust and a complement to GAAP measures because it facilitates an understanding of the operating performance of our properties. NAREIT defines FFO as net income (loss) (computed in accordance with GAAP), excluding gains or losses from cumulative effects of accounting changes, extraordinary items and sales of properties, plus real estate related depreciation and amortization and after adjustments for these items related to noncontrolling interests and unconsolidated affiliates.
FFO does not give effect to real estate depreciation and amortization because these amounts are computed to allocate the cost of a property over its useful life. Because values for well-maintained real estate assets have historically increased or decreased based upon prevailing market conditions, we believe that FFO provides investors with a clearer view of our operating performance.
In order to provide a better understanding of the relationship between FFO and GAAP net income, the most directly comparable GAAP financial reporting measure, we have provided a reconciliation of GAAP net (loss) income attributable to Excelsior LaSalle Property Fund, Inc., to FFO. FFO does not represent cash flow from operating activities in accordance with GAAP, should not be considered as an alternative to GAAP net income and is not necessarily indicative of cash available to fund cash needs.
Net loss for the year ended December 31, 2010 and 2009 included impairment charges of $25,639 and $25,955, respectively. There were no impairment charges for the years ended December 31, 2008, 2007 and 2006.
31
For the year ended
December 31, 2010
For theyear ended
December 31,2009
For theyear ended
December 31,2008
For the year ended
December 31, 2007
For theyear ended
December 31,2006
Net loss attributable to Excelsior LaSalle Property Fund, Inc $ (35,640) $ (39,611) $ (32,574) $ (13,636) $ (6,763)
Plus: Real estate depreciation and amortization 28,894 32,359 55,759 28,412 17,009
Gain from sales of real estate (822) (2,530) — — — Real estate depreciation and amortization
from discontinued operations 118 3,763 4,485 3,948 2,201 Real estate depreciation and amortization
for noncontrolling interests (1,810) (2,260) (6,462) (1,198) (445) Real estate depreciation and amortization
from unconsolidated real estate affiliates 5,776 4,686 4,941 4,636 4,819
Funds from operations $ (3,484) $ (3,593) $ 26,149 $ 22,162 $ 16,821
Weighted average shares outstanding, basic and diluted 4,135,635 4,128,290 3,822,484 3,252,725 2,341,347
Funds from operations per share, basic and diluted $ (0.84) $ (0.87) $ 6.84 $ 6.81 $ 7.18

Management Overview The following Management’s Discussion and Analysis of Financial Condition and Results of Operations (“MD&A”) is intended
to help the reader understand our results of operations and financial condition. This MD&A is provided as a supplement to, and should be read in conjunction with, our consolidated financial statements and the accompanying notes to the consolidated financial statements appearing elsewhere in this Form 10-K. All references to numbered Notes are to specific notes to our Consolidated Financial Statements beginning on page F-1 of this Form 10-K, and which descriptions are incorporated into the applicable response by reference. References to “base rent” in this Form 10-K refer to cash payments made under the relevant lease(s), excluding real estate taxes and certain property operating expenses that are paid by us and are recoverable under the relevant lease(s) and exclude adjustments for straight-line rent revenue and above- and below-market lease amortization (See Note 2).
The discussions surrounding our Consolidated Properties refer to our wholly or majority owned and controlled properties, which as of December 31, 2008, 2009 and 2010 were comprised of:
32
Item 7. Management’s Discussion and Analysis of Financial Condition and Results of Operations.
• Monument IV at Worldgate,
• Havertys Furniture (sold in 2010, excluded from December 31, 2010 Consolidated Properties), • Hagemeyer Distribution Center (sold in 2009, excluded from December 31, 2009 and 2010 Consolidated Properties),
• 25850 S. Ridgeland (sold in 2010, excluded from December 31, 2010 Consolidated Properties), • Georgia Door Sales Distribution Center, • 105 Kendall Park Lane, • Waipio Distribution Center (sold in 2009, excluded from December 31, 2009 and 2010 Consolidated Properties),
• Marketplace at Northglenn,
• the CHW Medical Office Portfolio, • Metropolitan Park North, • Stirling Slidell Shopping Centre,
• 9800 South Meridian (deconsolidated in 2010, excluded from December 31, 2010 Consolidated Properties), • 18922 Forge Drive (deconsolidated in 2010, excluded from December 31, 2010 Consolidated Properties), • 4001 North Norfleet Road, • Station Nine Apartments, • 4 Research Park Drive, • 36 Research Park Drive, • The District at Howell Mill,
• Canyon Plaza, • Railway Street Corporate Centre,
• Cabana Beach San Marcos,

Our Unconsolidated Properties, which are owned through joint venture arrangements, consisted of Legacy Village and 111 Sutter Street as of December 31, 2008, 2009 and 2010. From January 1, 2010 through September 30, 2010, our Unconsolidated Properties were also comprised of 9800 South Meridian and 18922 Forge Drive. Because management’s operating strategies are generally the same whether the properties are consolidated or unconsolidated, we believe that financial information and operating statistics with respect to all properties, both consolidated and unconsolidated, provide important insights into our operating results, including the relative size and significance of these elements to our overall operations. Collectively, we refer to our Consolidated and Unconsolidated Properties as our “Fund Portfolio.”
Our primary business is the ownership and management of a diversified portfolio of retail, office, industrial and apartment properties primarily located in the United States. We hire property management companies to provide the on-site, day-to-day management services for our properties. When selecting a property management company for one of our properties, we look for service providers that have a strong local market or industry presence, create portfolio efficiencies, have the ability to develop new business for us and will provide a strong internal control environment that will comply with our Sarbanes-Oxley Act of 2002 (“Sarbanes-Oxley”) internal control requirements. We currently use a mix of property management service providers that include large national real estate service firms, including an affiliate of the Advisor, and smaller local firms. Our property management service providers are generally hired to perform both property management and leasing services for our properties.
We seek to minimize risk and maintain stability of income and principal value through broad diversification across property sectors and geographic markets and by balancing tenant lease expirations and debt maturities across the Fund Portfolio. Our diversification goals also take into account investing in sectors or regions we believe will create returns consistent with our investment objective. Under normal conditions, we intend to pursue investments principally in well-located, well-leased assets within the office, retail, industrial and apartment sectors, which we refer to as the “Primary Sectors”. We will also pursue investments in certain sub-sectors of the Primary Sectors, for example the medical office sub-sector of the office sector or the student-oriented housing sub-sector of the apartment sector. We expect to actively manage the mix of properties and markets over time in response to changing operating fundamentals within each property sector and to changing economies and real estate markets in the geographic areas considered for investment. When consistent with our investment objectives, we will also seek to maximize the tax efficiency of our investments through like-kind exchanges and other tax planning strategies.
A key ratio reviewed by management in our investment decision process is the cash flow generated by the proposed investment, from all sources, compared to the amount of cash investment required (the “Cash on Cash Return”). Generally, we look at the Cash on Cash Returns over the one, five and ten-year time horizons and select investments that we believe meet our objectives. We own certain investments that provide us with significant cash flows that do not get treated as revenue under GAAP, but do get factored into our Cash on Cash Return calculations. An example of such non-revenue generating cash flows include the income guarantees from the seller of five student-oriented apartment communities we acquired in November 2007 and February 2008. For GAAP purposes, cash received from the seller of the student-oriented apartment communities income guarantees received in 2008 were treated as a reduction of purchase price. Additionally, certain GAAP concepts such as straight-line rent and depreciation and amortization, are not factored into our Cash on Cash Returns (See Note 2).
33
• Cabana Beach Gainesville, • Campus Lodge Athens, • Campus Lodge Columbia, • The Edge at Lafayette and • Campus Lodge Tampa.

The following tables summarize our diversification by property sector and geographic region based upon the fair value of our Consolidated and Unconsolidated Properties. The ten-year lease expiration table represents the lease expirations by both total square feet and annualized minimum base rents for current tenants of our Consolidated and Unconsolidated Properties. The ten-year debt repayment schedule represents debt principal repayments and maturities and the weighted average interest rate of those repayments and maturities for our Consolidated and Unconsolidated Properties. These tables provide examples of how the Advisor evaluates the Fund Portfolio when making investment decisions.
Property Sector Diversification Consolidated Properties
Unconsolidated Properties
Geographic Region Diversification Consolidated Properties
Unconsolidated Properties
34
Percent of Fair Value 2010 2009
Office
Commercial Office 28% 29% Medical Office 19% 17%
Retail 19% 17% Industrial 8% 14% Apartment 26% 23%
Percent of Fair Value 2010 2009
Office
Commercial Office 48% 46% Medical Office — —
Retail 52% 54% Industrial — — Apartment — —
Percent of Fair Value 2010 2009
East 14% 11% West 44% 44% Midwest 11% 13% South 26% 28% International 5% 4%
Percent of Fair Value 2010 2009
East — — West 48% 46% Midwest 52% 54% South — — International — —

Future Lease Expirations
Consolidated Properties
Unconsolidated Properties
Ten-Year Debt Repayment Consolidated Properties
35
Total OccupiedSquare Footage
AnnualizedMinimumBase Rents
Percent of Annualized Minimum
Base Rents
2011 475,000 $ 9,161 19.8% 2012 420,000 9,445 20.4% 2013 171,000 3,122 6.8% 2014 460,000 4,984 10.8% 2015 147,000 2,324 5.0% 2016 148,000 2,891 6.2% 2017 1,510,000 11,909 25.8% 2018 30,000 497 1.1% 2019 31,000 473 1.0% 2020 45,000 635 1.4% 2021 and thereafter 158,000 793 1.7%
(1) Does not includes 4,816 leases totaling approximately 2,208,000 square feet and approximately $29,911 in annualized minimum base rent associated with our seven apartment investments.
Total OccupiedSquare Footage
AnnualizedMinimumBase Rents
Percent of Annualized Minimum
Base Rents
2011 90,000 $ 3,971 19.0% 2012 51,000 1,382 6.6% 2013 116,000 3,386 16.2% 2014 65,000 1,785 8.5% 2015 42,000 1,195 5.7% 2016 43,000 1,701 8.1% 2017 4,000 163 0.8% 2018 79,000 1,561 7.5% 2019 103,000 1,231 5.9% 2020 32,000 840 4.0% 2021 and thereafter 196,000 3,704 17.7%
Principal Repayments
and Maturities Percent of Total
Outstanding Debt Weighted Average
Interest Rate
2011 $ 41,930 7.1% 5.57% 2012 19,835 3.3% 5.57% 2013 143,618 24.2% 5.63% 2014 140,016 23.6% 5.57% 2015 25,677 4.3% 5.61% 2016 90,152 15.2% 5.61% 2017 101,368 17.1% 5.42% 2018 666 0.1% 5.30% 2019 702 0.1% 5.30% 2020 and thereafter 30,376 5.0% 5.30%

Unconsolidated Properties
Fund portfolio leverage (calculated as our share of the current property debt balance divided by the fair value of all of our real estate investments) was limited to approximately 65% loan-to-value measured at the time we made our investments. Declining commercial property values have caused our portfolio leverage to increase above our target leverage ratio of 65%. Our directors have approved the Fund operating with this higher portfolio leverage ratio as a result of the decline in values of our properties. We relied primarily on long-term fixed-rate financing to lock in favorable spreads between real estate income yields and mortgage interest rates, and strive to maintain a balanced schedule of debt maturities.
Going forward, we intend to reduce the overall leverage on the Fund, subject to having available capital, through principal amortization on existing loans, refinancing maturing property level debt at lower leverage amounts and selective property dispositions.
Use of Estimates The preparation of financial statements in conformity with accounting principles generally accepted in the United States of
America requires us to make estimates and assumptions. These estimates and assumptions affect the reported amounts of assets and liabilities and the disclosure of contingent assets and liabilities at the date of the financial statements and the reported amounts of revenues and expenses during the reporting period. For example, significant estimates and assumptions have been made with respect to the useful lives of assets, recoverable amounts of receivables, and initial valuations and related amortization periods of deferred costs and intangibles, particularly with respect to property acquisitions. Actual results could differ from those estimates.
Critical Accounting Policies
Critical accounting policies are those that are both significant to the overall presentation of our financial condition and results of operations in our consolidated financial statements and require management to make difficult, complex or subjective judgments. Our critical accounting policies are those applicable to the following:
Initial Valuations and Estimated Useful Lives or Amortization Periods for Real Estate Investments and Intangibles At acquisition, we make an assessment of the value and composition of the assets acquired and liabilities assumed. These
assessments consider fair values of the respective assets and liabilities and are primarily determined based on estimated future cash flows using appropriate discount and capitalization rates, but may also be based on independent appraisals or other market data. The estimated future cash flows that are used for this analysis reflect the historical operations of the property, known trends and changes expected in current market and economic conditions that would impact the property’s operations, and our plans for such property. These
36
Principal Repayments
and Maturities Percent of Total
Outstanding Debt Weighted Average
Interest Rate
2011 $ 3,680 2.5% 5.62% 2012 3,958 2.7% 5.62% 2013 4,186 2.8% 5.62% 2014 82,993 56.4% 5.58% 2015 52,380 35.6% 5.58% 2016 — — — 2017 — — — 2018 — — — 2019 — — — 2020 and thereafter — — —

estimates are particularly important as they are used for the allocation of purchase price between depreciable and non-depreciable real estate and other identifiable intangibles, including above, below and at-market leases. As a result, the impact of these estimates on our operations could be substantial. Significant differences in annual depreciation or amortization expense may result from the differing useful life or amortization periods related to such purchased assets and liabilities.
Events or changes in circumstances concerning a property may occur, which could indicate that the carrying values or amortization periods of the assets and liabilities may require adjustment. The resulting recovery analysis also depends on an analysis of future cash flows to be generated from a property’s assets and liabilities. Changes in our overall plans and views on current market and economic conditions may have a significant impact on the resulting estimated future cash flows of a property that are analyzed for these purposes.
Impairment of Long-Lived Assets Real estate investments are individually evaluated for impairment whenever conditions exist which may indicate that the
carrying value may not be recoverable. A real estate asset is considered to be impaired when the future cash flows (on an undiscounted basis) over the anticipated holding period is less than its depreciated historical cost. Upon determination that a permanent impairment has occurred, rental properties will be reduced to their fair value.
Our estimate of the expected future cash flows used in testing for impairment is highly subjective and based on, among other things, our estimates regarding future market conditions, rental rates, occupancy levels, costs of tenant improvements, leasing commissions and other tenant concessions, assumptions regarding the residual value of our properties at the end of our anticipated holding period, discount rates and the length of our anticipated holding period. These assumptions could differ materially from actual results. If our strategy changes or if market conditions otherwise dictate a reduction in the holding period and an earlier sale date, an impairment loss could be recognized and such loss could be material. During the year ended December 31, 2010, the Fund recorded impairment charges on consolidated real estate properties totaling $29,505 and recovery of an impairment charge of $3,866. During the year ended December 31, 2009, the Fund recorded impairment charges on consolidated real estate properties totaling $18,686. The Fund did not have impairment charges in 2008.
The Fund evaluates the carrying value of its investments in unconsolidated joint ventures using the equity method of accounting in accordance with the authoritative guidance. We analyze our investments in unconsolidated real estate affiliates when circumstances change and each reporting period and determine if an “other-than-temporary” impairment exists and, if so, assess our ability to recover our carrying cost of the investment. The Fund did not have an “other-than-temporary” impairment in any of its investments in unconsolidated joint ventures in 2010. During the year ended December 31, 2009, the Fund recorded an “other-than-temporary” impairment charge on its investment in the Legacy Village property in the amount of $7,269. The Fund did not have an “other-than-temporary” impairment in any of its investments in unconsolidated joint ventures in 2008.
Results of Operations General
Our revenues are primarily received from tenants in the form of fixed minimum base rents and recoveries of operating expenses. Our expenses primarily relate to the costs of operating and financing the properties. Our share of the net income or net loss from Unconsolidated Properties is included in the equity in income of unconsolidated affiliates. We believe the following analyses of comparable real estate investments provide important information about the operating results of our real estate investments, such as trends in total revenues or operating expenses that may not be as apparent in a period-over-period comparison of the entire Fund.
37

Results of Operations for the years ended December 31, 2010 and 2009: Comparable real estate investments represent properties currently classified as continuing operations and owned by us for the
year ended on December 31, 2010, which were also owned by us for the year ended on December 31, 2009 and included all of our Consolidated Properties as of December 31, 2010. Accordingly, with respect to the discussions of revenues and operating expenses below, the comparable real estate investments amounts are the same as the total real estate investment amounts.
Revenues
Minimum rents increased by $630 between the year ended December 31, 2010 and the same period in 2009. The increase is primarily due to increases at Cabana Beach Gainesville and Station Nine Apartments of approximately $1,035 and $187, respectively, due to increases in occupancy and Railway Street Corporate Center of $270 related to favorable foreign exchange rates during the year ended December 31, 2010 as compared to the year ended December 31, 2009. Partially offsetting the increases were decreases in minimum rents at the CHW Medical Office Portfolio and the Marketplace at Northglenn of approximately $641 and $310, respectively, mainly due to decreases in occupancy and rental rates for newly-signed leases during the year ended December 31, 2010 as compared to the same period in 2009.
Included in minimum rents, as a net increase, are above- and below-market lease amortization of $1,897 and $2,102 for the years ended December 31, 2010 and 2009, respectively. Also included in minimum rents is straight-line rental income, representing rents recognized prior to being billed and collectible as provided by the terms of the lease, which caused a decrease of $779 and an increase of $844 for the years ended December 31, 2010 and 2009, respectively.
Tenant recoveries relate mainly to real estate taxes and certain property operating expenses that are paid by us and are recoverable under the various tenants’ leases. Tenant recoveries and other rental income decreased by $1,843 for the year ended December 31, 2010 over the same period in 2009. The decrease was primarily due to decreases of $1,456 at the CHW Medical Office Portfolio due to lower occupancy and less recoverable real estate taxes and decreases of $139 and $102 at Monument IV at Worldgate and Marketplace at Northglenn, respectively, due to lower recoverable real estate taxes.
Operating Expenses
38
Total Fund Real Estate Investments /Comparable Real Estate Investments
Year Ended
December 31, 2010 Year Ended
December 31, 2009 $ Change %
Change
Revenues:
Minimum rents $ 77,356 $ 76,726 $ 630 0.8% Tenant recoveries and other rental
income 18,339 20,182 (1,843) (9.1)%
Total revenues $ 95,695 $ 96,908 $ (1,213) (1.3)%
Total Fund
Year Ended
December 31, 2010 Year Ended
December 31, 2009 $ Change %
Change
Operating expenses:
Real estate taxes $ 10,255 $ 11,807 $ (1,552) (13.1)% Property operating 24,038 24,268 (230) (0.9)% Manager and advisor fees 3,264 6,413 (3,149) (49.1)% Fund level expenses 1,822 2,354 (532) (22.6)% Provision for doubtful accounts 889 861 28 3.3% General and administrative 1,036 1,518 (482) (31.8)% Provision for impairment of real estate, net 27,201 7,312 19,889 272.0% Depreciation and amortization 28,894 32,359 (3,465) (10.7)%
Total operating expenses $ 97,399 $ 86,892 $10,507 12.1%

Real estate tax expense decreased by $1,552 for the year ended December 31, 2010 compared to the same period of 2009 mainly due to decreases of $921 at the CHW Medical Office Portfolio, $329 at the Marketplace at Northglenn, $198 at Campus Lodge Tampa and $129 at Monument IV at Worldgate as a result of property reassessments.
Property operating expenses consist of the costs of ownership and operation of the real estate investments, many of which are recoverable under net leases. Examples of property operating expenses include insurance, utilities, repair and maintenance expenses. Property operating expenses decreased by $230 related to decreases at the CHW Medical Office Portfolio of $624 mainly due to decreases in payroll costs for the property management company, electric utility costs due to lower occupancy and fewer repairs and maintenance projects during the year ended December 31, 2010 when compared to the year ended December 31, 2009. The decrease was partially offset by an increase of $286 in utilities and other operating costs at Cabana Beach Gainesville and $113 in operating costs at The Edge at Lafayette primarily due to an increase in occupancy at both properties during the year ended December 31, 2010 compared to the same period in 2009.
Manager and advisor fees relate to the fixed and variable management and advisory fees earned by the Manager and Advisor. Fixed fees increase or decrease based on changes in the Fund’s NAV. NAV will be impacted by changes in the value of our properties and the related debt. Variable fees are calculated as a formula of cash flow generated from owning and operating the real estate investments and will fluctuate as future cash flows fluctuate. The decrease in Manager and Advisor fees from 2009 to 2010 relates mainly to a decrease in NAV and due to the Manager decreasing its fixed fee from 75 basis points to 10 basis points and electing to waive its portion of the variable fee.
Our Fund level expenses in 2010 and 2009 were subject to the Expense Limitation Agreement with the Manager (See Note 9), which, prior to its expiration at December 31, 2010, limited certain expenses to 0.75% of NAV. These expenses relate mainly to our compliance and administration related costs. We record Fund level expenses based on a calculation of 0.75% of NAV annually, calculated quarterly, limited to actual costs incurred by the Fund during the current quarter plus reimbursable expenses carried forward from prior periods. Through December 31, 2010, expenses in excess of the 0.75% of NAV annually, calculated quarterly, will be carried forward for up to three years and may be reimbursed to the Manager in a year that Fund expenses are less than 0.75% of NAV, but only to the extent Fund expenses do not exceed 0.75% of NAV. As of December 31, 2010 and 2009, $136 and $0, respectively, of Fund level expenses were being carried forward by the Manager. As the Expense Limitation Agreement has expired, we are now responsible for all expenses as incurred. The decrease in Fund level expense for the year ended December 31, 2010 when compared to the year ended December 31, 2009 is due to decreases in professional service fees and insurance costs.
Provision for doubtful accounts relates to receivables deemed as potentially uncollectible due to the age of the receivable or the status of the tenant. Provision for doubtful accounts increased by $28 primarily related to an increase in uncollectible accounts at the CHW Medical Office Portfolio of $330 due to collection difficulties of expense recoveries and tenant bankruptcies that occurred during the year ended December 31, 2010 that did not occur in the same period in 2009. This increase was partially offset by decreases of $97, $52 and $35 at Campus Lodge Tampa, The District at Howell Mill and Campus Lodge Columbia, respectively, due to less bad debt expenses for the year ended December 31, 2010 as compared to the same period in 2009. An additional decrease was the result of a $53 collection of a past due account at Stirling Slidell Shopping Centre that has been reserved for in the prior year.
General and administrative expenses relate mainly to property expenses unrelated to property operations. General and administrative expenses decreased by $482 for the year ended December 31, 2010 as compared to the year ended December 31, 2009 primarily related to the expensing of $339 of pre-acquisition legal services related to the 2009 adoption of the authoritative guidance regarding acquisition costs, as well as a decrease of $115 at the CHW Medical Office Portfolio for various legal and professional services. The decreases were partially offset by increases of $84 and $31 at Railway Street Corporate Centre and The District at Howell Mill, respectively, due to property level legal services.
39

The net provision for impairment of real estate relates to assets whose estimated future undiscounted cash flows have decreased below the carrying value. A provision for impairment of real estate is recorded to write the property down from its carrying value to its fair value. Net recovery of provision for impairment of real estate related to the change in fair value of properties previously classified as held for sale which have now been placed in held for use. Net provision for impairment of real estate increased by $19,889 for the year ended December 31, 2010 as compared to the year ended December 31, 2009 primarily due to $28,781 of impairment charges taken on Metropolitan Park North. This increase was partially offset by a net recovery of provision for impairment of real estate of $8,892 for the year ended December 31, 2010 due to recovery of previously recorded impairment at 4001 North Norfleet Road, 105 Kendall Park Lane, and Georgia Door Sales Distribution Center. Impairment was recovered when these previously-classified held-for-sale assets were returned to held-for-use status during the year ended December 31, 2010. During 2009 we recorded impairment charges of $3,498, $3,351 and $463 on 105 Kendall Park Lane, 4001 North Norfleet Road and Georgia Door Sales Distribution Center, respectively, in order to write the properties down to their fair values.
Depreciation and amortization expense will be impacted by the values assigned to buildings, personal property and in-place lease assets as part of the initial purchase price allocation. The decrease of $3,465 in depreciation and amortization expense for the year ended December 31, 2010 as compared to the year ended December 31, 2009 primarily relates to decreases of $1,781, $547, $397 and $158 at the CHW Medical Office Portfolio, Campus Lodge Tampa, Campus Lodge Athens and The District at Howell Mill, respectively, due to in-place lease assets and personal property becoming fully amortized during 2009. Additionally, 4001 North Norfleet Road, 105 Kendall Park Lane and Georgia Door Sales Distribution Center had decreases of $186, $85 and $59, respectively, primarily related to decreased amortization of these assets which were written down to their fair values in 2009.
Other Income and Expenses
Interest income decreased for the year ended December 31, 2010 over 2009 as a result of significantly lower interest rates in 2010 and the expiration of the Marketplace at Northglenn Enhanced Sales Tax Incentive Program.
Interest expense decreased from 2009 to 2010 due to lower principal balances on various loans that have amortized and the loan payoff of the Georgia Door Sales Distribution Center. The decreases were partially offset by increases of $242 related to the Fund’s term loan and $148 due to unfavorable exchange rates at Railway Street Corporate Centre for the year ended December 31, 2010 over the same period in 2009. Interest expense includes the amortization of deferred finance fees of $823 and $703 for the year ended December 31, 2010 and 2009, respectively. Also included in interest expense for both years ended December 31, 2010 and 2009, as a net reduction, is amortization of debt premium and discount associated with the assumption of debt of $214.
Loss on extinguishment of debt relates to any prepayment penalty as well as the write-off of unamortized financing fees on mortgage loans and other debt payables that were extinguished prior to their maturity date. Loss on extinguishment of debt increased by a $73 due to the debt payoff at Georgia Door Sales Distribution Center during the year ended December 31, 2010.
40
Total Fund
Year Ended
December 31, 2010 Year Ended
December 31, 2009 $ Change %
Change
Other income and (expenses):
Interest income $ 17 $ 84 $ (67) (79.8)% Interest expense (34,920) (34,931) 11 0.0% Loss on extinguishment of debt (73) — (73) — Equity in loss of unconsolidated affiliates (2,373) (8,277) 5,904 71.3%
Total other income and (expenses): $ (37,349) $ (43,124) $ 5,775 13.4%

Equity in loss of unconsolidated affiliates decreased by $5,904 to equity loss of $2,373 for the year ended December 31, 2010 from equity loss of $8,277 for the year ended December 31, 2009 due primarily to an impairment charge of $7,269 taken on our investment in Legacy Village during the year ended December 31, 2009. The decrease was partially offset by an increase in the equity loss at Legacy Village of $28 to $383 for the year ended December 31, 2010 from equity loss of $355 for the year ended December 31, 2009 due to lower minimum rents for newly-signed leases. Additionally, the decrease is partially offset by an increase of $1,141 in equity loss at 111 Sutter Street from equity loss of $652 for the year ended December 31, 2009 to equity loss of $1,793 for the year ended December 31, 2010. The increase in equity loss at 111 Sutter Street was a result of lower minimum rents for newly-signed leases during the year ended December 31, 2010. As a result of the adoption of guidance related to variable interest entities, 2010 is the initial period that 9800 South Meridian and 18922 Forge Drive were accounted for as unconsolidated affiliates. For the year ending December 31, 2010, the Fund recorded equity income of $197 from 18922 Forge Drive which represents our allocation of net income from property operations. On September 30, 2010, the Fund assigned its interests in the 9800 South Meridian and 18922 Forge Drive investments to our operating partner and received a distribution of $1,000 from property cash reserves. The Fund recorded a loss on the assignments of $428.
Discontinued Operations
The increase of income from discontinued operations is primarily related to a net $1,562 recovery of previously-recorded impairment taken on properties classified as held for sale as of March 31, 2010. The authoritative guidance states that impairment charges for previously-impaired assets classified as held for sale may be recovered at subsequent measurement dates, not to be written above carrying cost. At March 31, 2010, it was determined that two assets had recovered impairment charges recognized at December 31, 2009. For the year ended December 31, 2009, Havertys Furniture, 25850 S. Ridgeland and 9800 South Meridian recognized impairment charges of $11,374.
The decrease of $1,708 in the gain on sale of discontinued operations is related to the gain on sale of Havertys and 25850 S. Ridgeland during the year ended December 31, 2010 compared to the gain on sale of Hagemeyer Distribution Center and Waipio Shopping Center in 2009.
Results of Operations for the years ended December 31, 2009 and 2008: We believe the following analyses of comparable real estate investments provide important information about the operating
results of our real estate investments, such as trends in total revenues or operating expenses that may not be as apparent in a period-over-period comparison of the entire Fund. Comparable real estate investments represent properties currently classified as continuing operations and owned by us at December 31, 2009, which were also owned by us during the entire year ended on December 31, 2008. Comparable real estate investments at December 31, 2008 include all our Consolidated Properties as of December 31, 2009 except Campus Lodge Tampa and The Edge at Lafayette.
41
Total Fund Real Estate Investments
Year Ended
December 31, 2010 Year Ended
December 31, 2009
$
Change
%
Change
Discontinued Operations:
Income (loss) from discontinued operations $ 1,501 $ (11,238) $12,739 113.4% Gain on sale of discontinued operations 822 2,530 (1,708) (67.5)%
Total income (loss) from discontinued operations $ 2,323 $ (8,708) $11,031 126.7%

Revenues
Included in minimum rents, as a net increase, are above- and below-market lease amortization (See Note 2) of $2,102 and $2,540 for the years ended December 31, 2009 and 2008, respectively. Also included in minimum rents is straight-line rental income, representing rents recognized prior to being billed and collectible as provided by the terms of the lease, of $895 and $807 for the years ended December 31, 2009 and 2008, respectively.
Tenant recoveries relate mainly to real estate taxes and certain property operating expenses that are paid by us and are recoverable under the various tenants’ leases.
Minimum rents at comparable real estate investments decreased by $2,381 for the year ended December 31, 2009 as compared to the same period in 2008. The decrease is primarily due to decreases in occupancy and rents of $1,777, $529 and $428 at Cabana Beach Gainesville, the CHW Medical Office Portfolio and Marketplace at Northglenn. The decrease also stemmed from a $746 decrease at Stirling Slidell Shopping Centre due to the Circuit City bankruptcy during the fourth quarter of 2008 and a $177 decrease at Railway Street Corporate Centre due to the impact of foreign currency translation. This decrease was partially offset by an approximate $677 increase at Campus Lodge Columbia and a $346 increase at Cabana Beach San Marcos due to increases in occupancy and rental rates during 2009 as compared to 2008.
Tenant recoveries and other rental income at comparable real estate investments increased by $966 for the year ended December 31, 2009 over the same period in 2008. The increase in tenant recoveries was primarily due to increases in recoverable real estate taxes at the CHW Medical Office Portfolio for $737. An additional increase stemmed from an approximate $162 increase in other income at Cabana Beach Gainesville due to an agreement reached with the property management company for payments on short-term leases.
42
Total Fund
Year Ended
December 31, 2009 Year Ended
December 31, 2008 $
Change
%
Change
Revenues:
Minimum rents $ 76,726 $ 78,750 $(2,024) (2.6)% Tenant recoveries and other rental income 20,182 19,112 1,070 5.6%
Total revenues $ 96,908 $ 97,862 $ (954) (1.0)%
Comparable Real Estate Investments
Year Ended
December 31, 2009 Year Ended
December 31, 2008 $
Change
%
Change
Revenues:
Minimum rents $ 68,403 $ 70,784 $(2,381) (3.4)% Tenant recoveries and other rental income 19,659 18,693 966 5.2%
Total revenues $ 88,062 $ 89,477 $(1,415) (1.6)%
Total Revenues Reconciliation
Year Ended
December 31, 2009 Year Ended
December 31, 2008
Total revenues:
Comparable real estate investments $ 88,062 $ 89,477 Non-comparable real estate investments 8,846 8,385
Total revenues $ 96,908 $ 97,862

Operating Expenses
Real estate taxes and property operating expenses consist of the costs of ownership and operation of the real estate investments, many of which are recoverable under net leases. Examples of property operating expenses include insurance, utilities, repair and maintenance expenses.
Manager and advisor fees relate to the fixed and variable management and advisory fees earned by the Manager and Advisor. Fixed fees increase or decrease based on changes in our NAV. NAV will be impacted by changes in the value of our properties and the related debt. Variable fees are calculated as a formula of cash flow generated from owning and operating the real estate investments and will fluctuate as future cash flows fluctuate. The decrease in manager and advisor fees from 2008 to 2009 relate mainly to the fixed management and advisory fee.
Our Fund level expenses in 2009 and 2008 were subject to the Expense Limitation Agreement with the Manager (See Note 9), which limited certain expenses to 0.75% of NAV. These expenses relate mainly to our compliance and administration related costs. We record Fund level expenses based on a calculation of 0.75% of NAV annually, calculated quarterly, limited to actual costs incurred by the Fund during the current quarter plus reimbursable expenses carried forward from prior periods. Expenses in excess of the 0.75% of NAV annually, calculated quarterly, will be carried forward for up to three years. As of December 31, 2009 and December 31, 2008, no Fund level expenses were being carried forward by the Manager. The Expense Limitation Agreement expired on December 31, 2010, after which time we will be responsible for all expenses as incurred.
Provision for doubtful accounts relate to receivables deemed as potentially uncollectible due to the age of the receivable or the status of the tenant Provisions for doubtful accounts in 2008 and 2009 relate mainly to minimum rents and unit damage charges at some of our student-oriented apartment communities for tenants whose leases have expired as well as to tenant bankruptcies at some of our multi-tenant retail and office properties.
General and administrative expenses relate mainly to property expenses unrelated to property operations. The increase in general and administrative expenses from 2008 to 2009 is mainly related to expensing of pre-acquisition costs, bank fees, franchise taxes and various property level legal services.
Provision for impairment of real estate relates to assets whose estimated future undiscounted cash flows have decreased below the carrying value. A provision for impairment of real estate is recorded to write the property down from its carrying value to its fair value.
Depreciation and amortization expense will be impacted by the values assigned to buildings, personal property and in-place lease assets as part of the initial purchase price allocation.
43
Total Fund
Year Ended
December 31, 2009 Year Ended
December 31, 2008 $
Change
%
Change
Operating expenses:
Real estate taxes $ 11,807 $ 11,769 $ 38 0.3% Property operating 24,268 23,453 815 3.5% Manager and advisor fees 6,413 9,035 (2,622) (29.0)% Fund level expenses 2,354 2,444 (90) (3.7)% Provision for doubtful accounts 861 935 (74) (7.9)% General and administrative 1,518 1,000 518 51.8% Provision for impairment of real estate 7,312 — 7,312 — Depreciation and amortization 32,359 55,759 (23,400) (42.0)%
Total operating expenses $ 86,892 $ 104,395 $(17,503) (16.8)%

The decrease in real estate taxes expense at comparable real estate investments is mainly due to a decrease of $354 at the CHW Medical Office Portfolio due to reassessed property values partially offset by a $225 increase at Marketplace at Northglenn as a result of being reassessed at a higher value and increased tax rates.
The increase in property operating expenses is mainly due to a $197 increase at Marketplace at Northglenn related to snow removal in 2009 not necessary in 2008 and a $181 increase at The District at Howell Mill due to water and sewer increase in 2009. This increase is partially offset by a $152 decrease at Railway Street Corporate Centre due to the impact of foreign currency translation and a $73 decrease at the Station Nine Apartments related to a decrease in repair and maintenance projects.
The decrease in provision for doubtful accounts at comparable real estate investments is mainly related to a $110 decrease from 2008 to 2009 in uncollectable minimum rents and unit damage charges at some of our student-oriented apartment communities for tenants whose leases have expired. This decrease is offset by an increase at the CHW Medical Office Portfolio of $44 as the prior year included recoveries that did not occur in 2009.
The increase in general and administrative expenses is mainly related to a $339 expense of pre-acquisition legal services due to the 2009 adoption of the authoritative guidance regarding acquisition costs. The increase was partially offset by a $67 decrease at Stirling Slidell Shopping Centre due state and local taxes.
The increase in provision for impairment of real estate relates to impairment charges of $3,498, $3,351 and $463 taken on 105 Kendall Park Lane, 4001 North Norfleet Road and Georgia Door Sales Distribution Center, respectively, in order to write the property down to its fair value.
The decrease in depreciation and amortization expense at comparable real estate investments is primarily related to decreases in in-place lease amortization of $11,088 at our student housing properties and $2,014 at the CHW Medical Office Portfolio. An additional decrease stemmed from the decrease of $1,232 at Metropolitan Park North as the property was classified as held for sale during July 2007 and later removed from this classification during the first quarter of 2008. As a result of this change in classification, the year ended December 31, 2008 includes additional depreciation to make up for the period when Metropolitan Park North
44
Comparable Real Estate Investments
Year Ended
December 31, 2009 Year Ended
December 31, 2008 $
Change
%
Change
Operating expenses: Real estate taxes $ 10,897 $ 10,983 $ (86) (0.8)% Property operating 20,195 20,045 150 0.7% Provision for doubtful accounts 679 832 (153) (18.4)% General and administrative 1,518 893 625 70.0% Provision for impairment of real estate 7,312 — 7,312 — Depreciation and amortization 29,765 45,525 (15,760) (34.6)%
Total operating expenses $ 70,366 $ 78,278 $ (7,912) (10.1)%
Operating Expenses Reconciliation
Year Ended
December 31, 2009 Year Ended
December 31, 2008
Total operating expenses: Comparable real estate investments $ 70,366 $ 78,278 Non-comparable real estate investments 7,600 14,638 Manager and advisor fees 6,413 9,035 Fund level expenses 2,513 2,444
Total operating expenses $ 86,892 $ 104,395

was classified as held for sale, during which no depreciation charges were taken. There was also a decrease of $675 at Stirling Slidell Shopping Centre related mainly to the acceleration of amortization of an in-place lease intangible asset in 2008 due to the Circuit City bankruptcy.
The decrease in non-comparable real estate investments operating expenses for the year ended December 31, 2009 as compared to the same period in 2008 was primarily related to a decrease in in-place lease amortization at The Edge at Lafayette and Campus Lodge Tampa of $8,161, as those assets were fully amortized in 2008. The decrease in in-place lease amortization was partially offset by increases in other operating expenses as a result of owning The Edge at Lafayette and Campus Lodge Tampa for the entire year in 2009 and only part of the year in 2008.
Other Income and Expenses
Interest income decreased for the year ended December 31, 2009 over 2008 as a result of investing less average cash balances in 2009 than were invested in 2008 and lower interest rates.
Interest expense decreased slightly from 2008 to 2009 primarily due to lower interest rates on our variable rate loans and a lower average balance borrowed on our line of credit. Interest expense includes the amortization of deferred finance fees of $703 and $737 for the years ended December 31, 2009 and 2008, respectively. Also included in interest expense for the years ended December 31, 2009 and 2008, as a net reduction, is amortization of debt premium and discount associated with the assumption of debt of $214 and $183, respectively.
Equity in (loss) income of unconsolidated affiliates decreased by $9,507 due primarily to an impairment charge of $7,269 taken on our investment in Legacy Village in 2009. The impairment charge stemmed from the continued deterioration of the U.S. capital markets, the lack of liquidity and the related impact on the real estate market and retail industry. The impairment charge was triggered by several negative factors, including an estimated loss in value due to weakness of our retail tenant base related to requests for rent relief and the loss of some smaller tenants. Further decreases in the equity in (loss) income of unconsolidated affiliates stems from a decrease of equity income at Legacy Village of $1,636 from equity income of $1,281 for the year ended December 31, 2008 to equity loss of $355 for year ended December 31, 2009. The decrease in equity income stemmed from an increase in the amount of income allocated to other partners as the Fund had completed its preferred return allocation and decreased occupancy at the property as well as termination fee income received in 2008 that did not occur in 2009. Equity in the loss from 111 Sutter Street increased by $602 from equity loss of $51 for the year ended December 31, 2008 to equity loss of $653 for the year ended December 31, 2009. The increase in loss at 111 Sutter Street was mainly a result of decreased occupancy.
Gain on foreign currency derivatives relates to the change in fair value of the foreign currency forward contracts that were held in 2008 and matured on December 31, 2008.
45
Total Fund
Year Ended
December 31, 2009 Year Ended
December 31, 2008 $
Change
%
Change
Other income and (expenses):
Interest income $ 84 $ 293 $ (209) (71.3)% Interest expense (34,931) (36,035) 1,104 3.1% Equity in (loss) income of unconsolidated
affiliates (8,277) 1,230 (9,507) (772.9)% Gain on foreign currency derivative — 1,492 (1,492) (100.0)%
Total other income and (expenses): $ (43,124) $ (33,020) $(10,104) (30.6)%

Discontinued Operations
Income from discontinued operations consists of the net income from Havertys Furniture, 25850 S. Ridgeland, Hagemeyer Distribution Center, Waipio Shopping Center, 9800 South Meridian and 18922 Forge Drive.
The decrease in (loss) income from discontinued operations is primarily related to $11,374 provision for impairment taken on Havertys Furniture, 25850 S. Ridgeland and 9800 South Meridian in 2009. In addition, there was a $1,003 loss on extinguishments of debt related to prepayment premiums and unamortized deferred financing fees for properties which were sold during 2009, and $302 related to partial period of ownership in 2009 for Hagemeyer Distribution Center and Waipio Shopping Center compared to a full year of ownership in the year ended December 31, 2008.
We recognized a $2,530 gain on sale associated with the sales of Hagemeyer Distribution Center and Waipio Shopping Center in 2009.
Liquidity and Capital Resources The Fund’s primary uses and sources of cash are as follows:
46
Total Fund Real Estate Investments
Year Ended
December 31, 2009 Year Ended
December 31, 2008
$
Change
%
Change
Discontinued Operations:
(Loss) income from discontinued operations $ (11,238) $ 1,328 $(12,566) (946.2)% Gain on sale of discontinued operations 2,530 — 2,530 —
Total income from discontinued operations $ (8,708) $ 1,328 $(10,036) (755.7)%
Uses Sources
Short-term liquidity and capital needs such as:
• Interest payments on debt
• Distributions to shareholders
• Fees payable to the Manager and the Advisor
• Minor improvements made to individual properties that are not recoverable through expense recoveries or common area maintenance charges to tenants
• General and administrative costs
• Other Fund level expenses
• Lender escrow accounts for real estate taxes, insurance and capital expenditures
• Operating cash flow, including the receipt of distributions of our share of cash flow produced by our unconsolidated real estate affiliates
• Proceeds from secured loans collateralized by individual properties
• Proceeds from construction loans
• Sales of our Common Stock, if we resume sales of Shares
Longer-term liquidity and capital needs such as:
• Acquisitions of new real estate
• Expansion of existing properties
• Tenant improvements and leasing commissions
• Debt repayment requirements, including both principal and interest
• Repurchases of our Common Stock
• Sales of real estate investments
• Draws from lender escrow accounts

The sources and uses of cash for the years ended December 31, 2010 and 2009 were as follows:
Our net cash flows provided by operating activities were impacted by a decrease in net loss attributable to the Fund of $3,971 primarily due to decreases in equity in loss of unconsolidated affiliates of $5,904, interest expense of $4,172 and depreciation and amortization of $7,110 partially offset by an increase in provision for impairments (including discontinued operations) of $6,953. Our working capital, which consists of cash, tenant accounts receivable and prepaid and other assets less accounts payable and accrued expenses, accrued interest and accrued real estate taxes, was impacted between December 31, 2009 and December 31, 2010 by the following items:
Cash provided by investing activities increased as a result of sale proceeds received from the Havertys Furniture and 25850 S. Ridgeland of $13,077 partially offset by an increase in loan escrow funding of $4,906 and a decrease in distributions received from unconsolidated affiliates of $1,820. Cash used in financing activities increased for the twelve months ended December 31, 2010 over the same period in 2009 as a result of (i) a decrease in Share issuances of $5,991, (ii) an increase net credit facility payments of $25,000 and (iii) an increase in principal payments on mortgage notes of $21,183, mainly related to the sale of Havertys Furniture and 25850 S. Ridgeland partially offset by no distributions being made in 2010 versus $7,217 of distributions in 2009.
Financing We have relied primarily on fixed-rate financing, locking in what were favorable spreads between real estate income yields and
mortgage interest rates and have tried to maintain a balanced schedule of debt maturities. We attempted to limit overall portfolio leverage to 65% at the time we made our investments (portfolio leverage is calculated as our share of the current property debt balance divided by the fair value of all our real estate investments). Declining commercial property values have caused our portfolio leverage to increase above our target leverage ratio of 65%. Based upon the valuation declines in our portfolio, we estimate our current loan-to-value to be approximately 83%.
The following Consolidated Debt table provides information on the outstanding principal balances and the weighted average interest rate at December 31, 2010 and 2009 for such debt. The Unconsolidated Debt table provides information on our pro rata share of debt associated with our unconsolidated joint ventures.
Consolidated Debt
47
Year Ended
December 31, 2010 Year Ended
December 31, 2009 $ Change
Net cash provided by operating activities $ 19,040 $ 17,758 $ 1,282 Net cash provided by investing activities 42,680 37,384 5,296 Net cash used in financing activities (72,548) (27,305) (45,243)
• a decrease in tenant accounts receivable of $1,463 due to timing of collections in addition to prepaid expenses and other
assets of $255 related to timing of payments; and
• decreases in accrued real estate taxes of $2,081 due to successful real estate tax appeals at existing properties, manager and
advisor fees payable of $628 due to a decrease in NAV during 2010 partially offset by an increase in accounts payable and accrued expenses of $820 due to timing of payments and
• 9800 South Meridian and 18922 Forge Drive no longer being consolidated as of January 1, 2010.
2010 2009
PrincipalBalance
WeightedAverage
Interest RatePrincipal Balance
WeightedAverage
Interest Rate
Fixed $594,340 5.58% $666,728 5.59% Variable — — 31,111 2.06%
Total $594,340 5.58% $697,839 5.43%

Unconsolidated Debt
We currently only have fixed-rate financing with maturities through 2027. At December 31, 2009, we had one floating rate loan at LIBOR plus 160 basis points (1.83% at December 31, 2009) and a borrowing on our line of credit at 2.24%.
Covenants At December 31, 2010, we were in compliance with all debt covenants.
Line of Credit / Term Loan On February 19, 2010, we replaced our existing line of credit with a $17,000 term loan with a $6,000 letter of credit sub-limit
provided by PNC Bank, National Association. The term loan bore interest at LIBOR plus 3.75%, with a LIBOR floor of 1.00%. The term loan required quarterly principal amortization of $2,125 and could be prepaid without penalty. We fully paid the term loan on November 19, 2010.
Our previous $50,000 line of credit agreement, which expired in February 2010, was provided by PNC Bank, National Association BMO Capital Markets Financing, Inc. and Bank of America, N.A. (“BANA”), an affiliate of the Manager. The line of credit carried an interest rate that approximates LIBOR plus 1.50% to 2.00% based on certain covenant provisions or a base rate which was the greater of (i) the interest rate per annum announced from time to time by the lender, as its prime rate or (ii) the Federal Funds effective rate plus 0.75%. We had $17,500 borrowed at 2.24% at December 31, 2009.
Recent Events and Outlook General Fund and Market Commentary Given the uncertain economic climate and extraordinary conditions in the commercial real estate industry over the last few
years, management made it a priority to implement a cash conservation strategy designed to strengthen our balance sheet and protect the value of the Fund’s assets. Through the establishment of cash reserves, management aims to equip the Fund with sufficient resources to address the portfolio’s fluctuating working capital needs, future capital expenditures, existing loan amortizations, and nearer-term debt maturities until market conditions stabilize. Several actions have been taken toward this objective including reductions in discretionary expenditures, reductions in fees, the suspension of dividend payments and the suspension of the redemption of Shares through tender offers, and lastly, selected property sales. The combination of suspending dividends and Share redemptions, coupled with the results from expense reductions and proceeds generated from property sales, has strengthened the Fund’s balance sheet and moved the Fund into an improved cash position: at December 31, 2010, the Fund had accumulated a cash balance of approximately $23,200 and had fully repaid its term loan, well in advance of its maturity, which had a balance of $17,000 during the first quarter of 2010.
As the U.S. economy continues on a path towards recovery, the commercial real estate markets have begun following suit. Many of the signals seen in the broader economic indicators have been mixed, which is the same as they have been for commercial real estate. The continuing uncertainty in the markets is a major issue for property investors currently. One of the most watched indicators in the private real estate space is the NPI. The
48
2010 2009
PrincipalBalance
WeightedAverage
Interest Rate Principal Balance
WeightedAverage
Interest Rate
Fixed $87,133 5.60% $88,688 5.60% Variable — — — —
Total $87,133 5.60% $88,688 5.60%

NPI for the fourth quarter was up 4.62%, with a 1.60% return from income and 3.02% from capital appreciation. This is the fourth quarter in a row that the NPI has been positive and the third quarter in a row that the appreciation component in particular has been positive. However, the NPI was in direct contradiction to Moody’s / REAL Commercial Property Price Index, which was down 2.7% from July through November. The difference in the two indicators could be a result of the fact that Moody’s uses actual transactional information while the NPI follows the valuations of a portfolio of properties over time.
Despite modest improvements in property market fundamentals and real estate capital markets, the Fund will continue to maintain a defensive tact until indications of a meaningful economic recovery become clearly evident. The Fund will continue its cash conservation initiatives designed to fortify the balance sheet and provide sufficient working capital to address the portfolio’s working capital needs, capital expenditures, loan amortizations, and nearer-term debt maturities. Opportunities to execute select property dispositions will continue to be evaluated as a means of generating additional liquidity, deleveraging, or reducing risk in the portfolio. Property sales will only be considered in situations where a fair and reasonable value may be achieved.
The challenge for the coming year and foreseeable future will be to balance the objectives of reducing portfolio risk through the establishment of increased cash reserves and retirement of debt while also returning to one of our original and primary objectives, that being to distribute free cash flow generated from property investments. However, until a marked improvement in the economy is realized and there is clearer evidence of a stabilization of property values, cash conservation will remain a near-term priority of the Fund. To help advance this initiative and as mentioned in previous investor quarterly letters, Bank of America has reduced its portion of the management fee on the Fund, resulting in a decrease in the management fee from 1.5% on NAV to 0.85%. This fee reduction is intended to reduce Fund expenses and benefit investors. Additionally, as fees paid to the Manager and Advisor are based upon the NAV of the Fund, as the NAV has declined their compensation has been significantly reduced.
While we historically provided limited liquidity to our stockholders by conducting tender offers, we did not and do not guarantee that sufficient cash will be available at any particular time to fund repurchases of our Shares. In this regard, we did not conduct a tender offer during the years ended December 31, 2009 and 2010, and, in order to preserve cash in light of the current market environment, we do not intend to repurchase Shares for the immediate future. The timing of future tender offers, if any, will be at the discretion of our board of directors, based on, among other things, the Fund’s need for liquidity.
The Fund is considering additional property dispositions as a means of generating cash. Selective dispositions will be considered in situations where a fair and reasonable value may be achieved and the transaction furthers the Fund’s strategic goals. The Fund will consider dispositions of non-strategic properties when it creates liquidity, deleverages the Fund and reduces risk (debt maturity and tenant lease related risk). The Fund does not intend to participate in distressed asset sales that negatively impact the Fund’s longer-term performance.
Fourth Quarter NAV In the fourth quarter of 2010, the Fund’s NAV decreased by $1.91 per share from $49.60 per share at September 30, 2010 to
$47.69 per share at December 31, 2010. During the quarter, 23% of the portfolio was externally appraised while the balance of the portfolio was internally valued using methodologies consistent with those of external appraisers. Overall, the Fund’s property values at pro-rata share decreased 2.8%, resulting in a $1.32 per share negative contribution to NAV primarily related to retail tenant bankruptcies. The fourth quarter NAV was increased by $1.04 from property operations. The total property related NAV impact resulted in a $0.28 per share decline.
The Fund’s NAV was further decreased due to the continued decline in the fair value of the Fund’s debt which fluctuates in tandem with market interest rates. Given that interest rates have continued to hover at
49

historically low levels and the availability of credit has increased, the Fund’s debt mark-to-market has declined significantly. As a result, the valuation of the Fund’s fixed-rate loans had a negative $1.63 impact on share value in the fourth quarter.
Although the debt mark-to-market had a negative impact on share value, management views the erosion of the accumulated debt component of the NAV as a positive trend since the debt valuation is a diminishing asset that will eventually amortize to zero. While the debt mark-to-market constituted over 30% of the Fund’s NAV at its peak in the third quarter of 2009, today’s NAV per share of $47.69 is comprised of 2%, or $0.99, debt value and 98%, or $46.70, asset or property value. Management believes this strengthening of asset value relative to debt value will help preserve the Fund’s NAV in the long term.
2011 Key Initiatives In 2011, the Advisor will continue its ongoing evaluation of our investment in Monument IV at Worldgate. While the outcomes
of this evaluation cannot be determined at this time, the Advisor continues to closely monitor this investment and its ongoing fit within the Fund’s current strategy. The property is located in the steadily recovering Washington, D.C. submarket of Herndon, VA, directly visible from the Dulles Toll Road. As of this filing, the single tenant of the building, Fannie Mae, has not renewed its lease. Fannie Mae’s lease expires on December 31, 2011 and they did not exercise their market renewal option which expired on December 31, 2010. Upon the expiration of this option the Advisor retained a local leasing agent and this agent has begun a broad marketing campaign for the building as available for lease. Based upon the results of this marketing campaign along with feedback from local investment sales brokers and mortgage bankers, a specific hold, sale or refinance strategy will be developed for this property as its existing fixed-rate mortgage loan matures on September 1, 2011. Over the next few months, the Advisor will decide the strategic direction for this investment, which could include selling the property or refinancing a portion of the loan and using cash reserves to pay down the loan and re-tenant the building. Under either alternative, the Advisor believes Monument IV at Worldgate continues to represent significant value to the Fund.
2010 Key Events and Accomplishments On February 19, 2010, the Fund obtained a new two year $17,000 amortizing term loan to replace the expiring working capital
line of credit. The term loan allowed the Fund to temporarily retain cash reserves that would be needed to fund a portion of our capital expenditures, mortgage principal amortization and other working capital requirements. Based upon the success of our cash conservation strategies and the accumulation of sufficient cash balances, the term loan was fully repaid in the fourth quarter of 2010, well in advance of its February 2012 maturity.
On March 12, 2010, the Manager proposed and our board of directors approved a reduction in the annual fixed fee paid to the Manager from 0.75% of NAV to 0.10% of NAV, which will result in a reduction of the total annual fixed fee paid by us to the Advisor and Manager from 1.5% of NAV to 0.85% of NAV. In addition, the Manager will forgo its participation in the variable fee and the aggregate annual variable fee will be reduced by that amount. The fee reductions were retroactive to January 1, 2010 and are for an indefinite period. The Manager, with the prior approval of our board of directors, may discontinue either waiver at any time. Otherwise, the Management Agreement continues in effect in all material respects.
On April 15, 2010, the Fund sold Havertys Furniture and 25850 S. Ridgeland for a combined sales price of $54,060. In conjunction with the sale of the properties, the Fund paid off the mortgage loans associated with Havertys Furniture, 25850 S. Ridgeland and Georgia Door Sales Distribution Center, which as of the date of sale, totaled approximately $46,924. As a result of these sales and payoffs of the mortgage notes payable, the Fund’s cash balance increased by approximately $5,730 and Georgia Door Sales Distribution Center is now owned free and clear of any debt. Also on April 15, 2010, the Fund removed Georgia Door Sales Distribution Center, 105 Kendall Park Lane, and 4001 North Norfleet Road from held for sale status.
50

On September 30, 2010, we assigned our 90% ownership interests in 9800 South Meridian to our local operating partner. This suburban-Denver, Colorado office building suffered from significant vacancy and the Advisor’s outlook for this property and the local market had grown increasingly negative. Further, this property’s loan was scheduled to mature in January 2011 and the lender was unwilling to offer an extension. Rather than invest significant additional capital to refinance and re-tenant this property, we assigned our interests in exchange for a full release from future funding obligations. The Fund did not recognize a loss on this assignment as the investment was previously recorded at $0.
On September 30, 2010, we assigned our 90% ownership interests in 18922 Forge Drive to our local operating partner. This Cupertino, California office building was 100% vacant and the Advisor’s outlook for this property and the local market had grown increasingly negative. Rather than invest significant additional capital to re-tenant this property, we assigned our interests in exchange for a distribution of $1,000 from property-level cash reserves and a full release from future funding obligations. The Fund recorded a loss on the assignment of $428.
For both 9800 South Meridian and 18922 Forge Drive, the Advisor determined that they had lost significant value due to the economic downturn and that they could not be refinanced on reasonable terms when their debt matured over the next two years.
Contractual Cash Obligations and Commitments
The following table below aggregates our contractual obligations and commitments with payments due subsequent to December 31, 2010. The table does not include commitments with respect to the purchase of services from the Manager and the Advisor, as future payments due on such commitments cannot be determined.
As our portfolio of properties has been relatively static over the last two years (except for selected dispositions) and in response to the broader financial crisis and recessionary environment, we have prioritized the use of cash generated from operations and dispositions to strengthen our balance sheet. This strengthening has occurred as we have reduced all borrowings on our former line of credit, and we have substantially increased our liquidity through accumulating cash reserves that may be necessary for the management of our properties.
We have one long-term debt maturity balloon payment due in September 2011 collateralized by Monument IV at Worldgate in the aggregate amount of $35,245. We will either sell this property, refinance this loan, or refinance a portion of this loan, with a new long-term loan funding the difference with cash on hand. However, there can be no assurance that we will have such cash available at the time this debt matures.
We intend to actively monitor and manage our available liquidity to ensure the long-term viability of the Fund.
Commitments The CHW Medical Office Portfolio mortgage debt requires that we deposit an annual amount of $855, up to a cumulative
maximum of $1,900, into an escrow account to fund future tenant improvements and leasing commissions. The amount of the escrow funded by each of the fifteen buildings in the portfolio is capped
51
Obligations
Total Payments due by period
Less than 1 year 1 – 3 years 3 – 5 years More than 5 years
Long-term debt (1) $850,393 $ 81,640 $234,317 $283,328 $ 251,108 Loan escrows 4,068 2,690 749 484 145 Tenant obligations 1,693 1,627 37 5 24
Total $856,154 $ 85,957 $235,103 $283,817 $ 251,277
(1) Includes interest expense calculated using the effective interest rates of the underlying borrowings for all fixed-rate debt at December 31, 2010, which was 5.60%.

individually pursuant to each loan agreement. At December 31, 2010, we had approximately $1,046 deposited in this escrow, and we expect to fund approximately $855 during 2011. Additionally, we are required to deposit approximately $151 per year into an escrow account to fund capital expenditures. At December 31, 2010, our capital account escrow account balance was $359. These escrow accounts allow us to withdraw funds as we incur costs related to tenant improvements, leasing commissions and capital expenditures. Additionally, monthly we are required to fund an escrow account for the future payment of real estate taxes and insurance costs in an amount equal to 1/12 of the estimated insurance premium and real estate taxes. At December 31, 2010, our insurance and real estate tax escrow balance was $748. We expect to fund the escrow requirements with operating cash flows generated by the portfolio.
The mortgage loan collateralized by Metropolitan Park North required that on April 1, 2009 we post a $3,900 reserve in escrow to cover costs of certain tenant improvements, leasing commissions, rent concessions, and lost rental income in connection with re-leasing space currently occupied by Nordstrom, a major anchor tenant of the building. We satisfied this reserve requirement with a letter of credit, which was posted on March 23, 2009. Since Nordstrom has determined they will not renew their lease at Metropolitan Park North, we were obligated to post an additional $2,800 reserve into the escrow on September 30, 2010. We did not post the $2,800 reserve and have received an extension through February 9, 2011. On February 9, 2011, we amended the mortgage loan collateralized by Metropolitan Park North. The terms of the modification include an agreement to sweep all future cash flow to the lender. Additionally, the borrower, a wholly owned entity of ours, was released from its obligation to post a $2,800 letter of credit. Other amendments include changing the loan to interest only until February 1, 2012, and granting the lender certain approval rights over various operating decisions.
The mortgage loan collateralized by Monument IV at Worldgate requires that, should Fannie Mae, the sole tenant at this property, not renew its lease or the space not be leased to a new tenant(s), the Fund must reserve all rental payments received from Fannie Mae at the earlier of September 1, 2010 or upon the tenant delivering a notice of its intent not to renew the lease. We had not received Fannie Mae’s notice of intent to renew at September 1, 2010, and rental payments totaling $978 have been reserved. We expect to fund approximately $2,316 during 2011. The lender will return the reserve to the Fund if the following conditions are met: (1) no default has occurred and remains outstanding; and (2) either the tenant has renewed its lease or the space has been re-leased to a new tenant(s).
The debt associated with six of the Fund’s student-oriented apartment communities requires that we deposit a total of $224 per year into a replacement reserve to fund future furniture replacement costs. As of December 31, 2010, we had deposited approximately $191 into this escrow. We expect to fund the loan escrows from property operations. These reserve accounts allow us to withdraw funds as we incur costs related to furniture replacement.
As part of the lease with our single tenant at the 4001 North Norfleet Road property, we provided the tenant a right to expand thecurrent building by up to 286,000 square feet of space. If the tenant exercises this right, we will be obligated to construct this expansion space. The tenant has the right to notify us of their desire to expand at any time prior to February 28, 2016, (the end of the ninth year of the lease), or if the lease is extended, until any time prior to the end of the fourth year of any extension. As of December 31, 2010, we have not received an expansion notice from the tenant.
Off Balance Sheet Arrangements Letters of credit are issued in most cases as additional collateral for mortgage debt on properties we own. At December 31, 2010
and 2009, we had approximately $5,580 and $5,580, respectively, in outstanding letters of credit, none of which are reflected as liabilities on our balance sheet. We have no other off balance sheet arrangements.
52
th

REIT Requirements To remain qualified as a real estate investment trust for federal income tax purposes, we must distribute or pay tax on 100% of
our capital gains and at least 90% of ordinary taxable income to stockholders.
The following factors, among others, will affect operating cash flow and, accordingly, influence the decisions of our board of directors regarding distributions:
We anticipate that operating cash flow, cash on hand, proceeds from dispositions of real estate investments, or refinancings will provide adequate liquidity to conduct our operations, fund general and administrative expenses, fund operating costs and interest payments and allow distributions to our stockholders in accordance with the requirements of the Code.
We are subject to market risk associated with changes in interest rates both in terms of our variable-rate debt and the price of new fixed-rate debt for refinancing of existing debt. We manage our interest rate risk exposure by obtaining fixed-rate loans where possible. As of December 31, 2010, we had consolidated debt of $594,340, none of which is variable-rate debt. Including the $1,536 net discount on the assumption of debt, we have consolidated debt of $592,804 at December 31, 2010.
As of December 31, 2009, we had consolidated debt of $697,839, which included $31,111 of variable-rate debt. Including the $1,322 net discount on the assumption of debt, we have consolidated debt of $696,517 at December 31, 2009. None of the variable-rate debt was subject to interest rate cap agreements. A 25 basis point movement in the interest rate on the $31,111 of variable-rate debt would have resulted in an approximately $78 annualized increase or decrease in consolidated interest expense and cash flow from operating activities.
All our Unconsolidated Properties are financed with fixed-rate debt; therefore we are not subject to interest rate exposure at these properties.
We are subject to interest rate risk with respect to our fixed-rate financing in that changes in interest rates will impact the fair value of our fixed-rate financing. To determine fair market value, the fixed-rate debt is discounted at a rate based on an estimate of current lending rates, assuming the debt is outstanding through maturity and considering the collateral. At December 31, 2010, the fair value of our mortgage notes payable and other debt payable was estimated to be approximately $27,860 lower than the carrying value of $594,340. If treasury rates were 25 basis points higher at December 31, 2010, the fair value of our mortgage notes payable and other debt payable would have been approximately $33,052 lower than the carrying value.
At December 31, 2009, the fair value of our mortgage notes payable and other debt payable was estimated to be approximately $85,067 lower than the carrying value of $696,517. If treasury rates were 25 basis points higher at December 31, 2009, the fair value of our mortgage notes payable and other debt payable would have been approximately $91,240 lower than the carrying value.
53
• scheduled increases in base rents of existing leases;
• changes in minimum base rents and/or overage rents attributable to replacement of existing leases with new or renewal
leases; • changes in occupancy rates at existing properties and procurement of leases for newly acquired or developed properties;
• necessary capital improvement expenditures or debt repayments at existing properties; and
• our share of distributions of operating cash flow generated by the unconsolidated real estate affiliates, less management
costs and debt service on additional loans that have been or will be incurred.
Item 7A. Quantitative and Qualitative Disclosures About Market Risk.

In August 2007, we purchased Railway Street Corporate Centre located in Calgary, Canada. For this investment, we use the Canadian dollar as the functional currency. When preparing consolidated financial statements, assets and liabilities of foreign entities are translated at the exchange rates at the balance sheet date, while income and expense items are translated at weighted average rates for the period. Foreign currency translation adjustments are recorded in accumulated other comprehensive (loss) income on the Consolidated Balance Sheet and foreign currency translation adjustment on the Consolidated Statement of Operations and Comprehensive Loss.
As a result of our Canadian investment, we are subject to market risk associated with changes in foreign currency exchange rates. These risks include the translation of local currency balances of our Canadian investment and transactions denominated in Canadian dollars. Our objective is to control our exposure to these risks through our normal operating activities. For the year ended December 31, 2010, we recognized a foreign currency translation gain of $501 and for the year ended December 31, 2009, we recognized a foreign currency translation gain of $1,846. At December 31, 2010, a 10% unfavorable exchange rate movement would have decreased our foreign currency translation loss by approximately $1,035 to a foreign currency translation loss of approximately $534.
54

See “Index to Financial Statements” on page F-1 of this Form 10-K.
None.
Evaluation of Disclosure Controls and Procedures Under the supervision and with the participation of our management, including the chief executive officer and chief financial
officer, we conducted an evaluation of the effectiveness of the design and operation of our disclosure controls and procedures (as defined in Rules 13a-15(e) and 15d-15(e) under the Exchange Act), as the end of the period covered by this report. Based on management’s evaluation as of December 31, 2010, our chief executive officer and chief financial officer concluded that our disclosure controls and procedures were effective to provide reasonable assurance that the information required to be disclosed by us in our reports that we file or submit under the Exchange Act is recorded, processed, summarized and reported within the time periods specified in the SEC’s rules and forms and such information is accumulated and communicated to management, including our chief executive officer and chief financial officer, as appropriate to allow timely decisions regarding required disclosure.
Changes in Internal Control Over Financial Reporting There were no changes to our internal control over financial reporting during the fourth quarter ended December 31, 2010 that
have materially affected, or are reasonably likely to materially affect, our internal controls over financial reporting.
Management’s Report on Internal Control Over Financial Reporting Management’s Report on Internal Control Over Financial Reporting, which appears on page F-2, is incorporated herein by
reference.
None.
PART III In accordance with the rules of the SEC, certain information required by Part III is omitted and is incorporated by reference into
this Form 10-K from our definitive proxy statement relating to our 2011 annual meeting of stockholders (our “2011 Proxy Statement”) that we intend to file with the SEC no later than May 2, 2011.
The information regarding Directors and Executive Officers appearing under the headings “Proposal 1: Election of Directors,” “Information Regarding the Board of Directors and its Committees” and “Section 16(a) Beneficial Ownership Reporting Compliance” of our 2011 Proxy Statement is incorporated by reference. The information under the heading “Executive Officers of the Registrant” in Item 1 of this Form 10-K is also incorporated by reference in this section.
We have adopted the Excelsior LaSalle Property Fund, Inc. Code of Business Conduct and Ethics Policy that applies to all of our officers, directors and employees. We have also adopted Corporate Governance Guidelines. If you would like a copy of our Code of Business Conduct and Ethics Policy and/or our Corporate Governance Guidelines, please contact Peggy Lynn, 225 High Ridge Road, Stamford, CT 06905-3039, or call (203) 352-4497.
55
Item 8. Financial Statements and Supplementary Data.
Item 9. Changes in and Disagreements With Accountants on Accounting and Financial Disclosure.
Item 9A. Controls and Procedures.
Item 9B. Other Information.
Item 10. Directors, Executive Officers and Corporate Governance.

The information appearing in our 2011 Proxy Statement under the headings “Compensation,” and “Compensation Committee Interlocks and Insider Participation” is incorporated herein by reference.
We do not have any compensation plans pursuant to which our equity securities are authorized for issuance.
The information appearing in our 2011 Proxy Statement under the heading “Security Ownership of Certain Beneficial Owners and Management” is incorporated herein by reference.
The information appearing in our 2011 Proxy Statement under the headings “Information Regarding the Board of Directors and its Committees” and “Transactions with Related Persons, and Certain Control Persons” is incorporated herein by reference.
The information appearing in our 2011 Proxy Statement under the headings “Fees Paid to Independent Registered Public Accounting Firm” and “Audit Committee Pre-Approval Policies and Procedures” is incorporated herein by reference.
PART IV
Dollars are shown in thousands except Share and per Share amounts.
56
Item 11. Executive Compensation.
Item 12. Security Ownership of Certain Beneficial Owners and Management and Related Stockholders Matters.
Item 13. Certain Relationships and Related Transactions, and Director Independence.
Item 14. Principal Accounting Fees and Services.
Item 15. Exhibits, Financial Statement Schedules.
(1) Financial Statements: See “Index to Financial Statements” at page F-1 below.
(2) Financial Statement Schedule: See “Schedule III—Real Estate and Accumulated Depreciation as of December 31, 2010” at page F-26 below.
(3) The Index of Exhibits below is incorporated herein by reference.

SIGNATURES
Pursuant to the requirements of Section 13 or 15(d) of the Securities Exchange Act of 1934, the Registrant, Excelsior LaSalle Property Fund, Inc., has duly caused this report to be signed on its behalf by the undersigned, thereunto duly authorized.
POWER OF ATTORNEY
Each individual whose signature appears below constitutes and appoints James D. Bowden and Steven Suss, and each of them, his or her true and lawful attorneys-in-fact and agents with full power of substitution, for him or her and in his or her name, place and stead, in any and all capacities, to sign any and all amendments to this report on Form 10-K, and to file the same, with all exhibits thereto and all documents in connection therewith, with the Securities and Exchange Commission, granting unto said attorneys-in-fact and agents, and each of them, full power and authority to do and perform each and every act and thing requisite and necessary to be done in and about the premises, as fully to all intents and purposes as he or she might or could do in person, hereby ratifying and confirming all that said attorneys-in-fact and agents or any of them, or his, her or their substitute or substitutes, may lawfully do or cause to be done or by virtue hereof.
Pursuant to the requirements of the Securities Exchange Act of 1934, this report has been signed below by the following persons on behalf of the registrant and in the capacities and on the dates indicated.
57
EXCELSIOR LASALLE PROPERTY FUND, INC.
By: /S/ JAMES D. BOWDEN
Date: March 3, 2011
James D. Bowden President, Chief Executive Officer
Signature Title Date
/S/ JAMES D. BOWDEN
President, Chief Executive Officer and Director (Principal Executive Officer)
March 3, 2011
/S/ STEVEN L. SUSS
Chief Financial Officer (Principal Financial and Accounting Officer)
March 3, 2011
/S/ THOMAS F. MCDEVITT Chairman of the Board of Directors March 3, 2011
/S/ VIRGINIA G. BREEN Director March 3, 2011
/S/ JONATHAN B. BULKELEY Director March 3, 2011
/S/ PETER H. SCHAFF Director March 3, 2011

58
Exhibit Number Description
3.1
Amended and Restated Articles of Incorporation of Excelsior LaSalle Property Fund, Inc. (Incorporated by reference to Exhibit 3.1 to the Fund’s Registration Statement on Form 10 filed with the SEC on April 28, 2006).
3.2
Amended and Restated Bylaws of Excelsior LaSalle Property Fund, Inc., Adopted by the Board of Directors on December 18, 2006 (Incorporated by reference to Exhibit 3.2 to the Fund’s Annual Report on Form 10-K filed with the SEC on March 16, 2007).
4.1
Form of Subscription Agreement for Excelsior LaSalle Property Fund, Inc. (Incorporated by reference to Exhibit 4.1 to the Fund’s Annual Report on Form 10-K filed with the SEC on March 7, 2008).
10.1
Amended and Restated Management Agreement by and between Excelsior LaSalle Property Fund, Inc. and Bank of America Capital Advisors, Inc., dated as of June 19, 2007 (Incorporated by reference to Exhibit 10.1 to the Fund’s Annual Report on Form 10-K filed with the SEC on March 7, 2008).
10.2
Letter Agreement by and between Excelsior LaSalle Property Fund, Inc., U.S. Trust Company, N.A. and LaSalle Investment Management, Inc., dated as of June 16, 2004 (Incorporated by reference to Exhibit 10.3 to the Fund’s Annual Report on Form 10-K filed with the SEC on March 15, 2010).
10.3
Letter Agreement by and between Excelsior LaSalle Property Fund, Inc., U.S. Trust Company, N.A. and LaSalle Investment Management, Inc., dated as of September 8, 2004 (Incorporated by reference to Exhibit 10.4 to the Fund’s Registration Statement on Form 10 filed with the SEC on April 28, 2006).
10.4
Investment Advisory Agreement by and between Excelsior LaSalle Property Fund, Inc., U.S. Trust Company, N.A. and LaSalle Investment Management, Inc., dated as of December 23, 2004 (Incorporated by reference to Exhibit 10.5 to the Fund’s Annual Report on Form 10-K filed with the SEC on March 15, 2010).
10.5
Letter Agreement by and between Excelsior LaSalle Property Fund, Inc., U.S. Trust Company, N.A. and LaSalle Investment Management, Inc., dated as of December 23, 2004 (Incorporated by reference to Exhibit 10.6 to the Fund’s Annual Report on Form 10-K filed with the SEC on March 15, 2010).
10.6
Investment Advisory Agreement Assumption Agreement by and between Excelsior LaSalle Property Fund, Inc., U.S. Trust Company, N.A., LaSalle Investment Management, Inc. and UST Advisers, Inc. dated as of December 16, 2005 (Incorporated by reference to Exhibit 10.7 to the Fund’s Registration Statement on Form 10 filed with the SEC on April 28, 2006).
10.7
Excelsior LaSalle Property Fund, Inc. Expense Limitation and Reimbursement Agreement, by and between Excelsior LaSalle Property Fund, Inc. and Bank of America Capital Advisors LLC, dated as of January 7, 2010 (Incorporated by reference to Exhibit 99.1 to the Fund’s Current Report on Form 8-K filed with the SEC on January 8, 2010).
10.8
Purchase Agreement for Metropolitan Park North (Incorporated by reference to Exhibit 10.9 to the Fund’s Registration Statement on Form 10 filed with the SEC on April 28, 2006).
10.9
Purchase and Sale Agreement for The District at Howell Mill, dated May 13, 2007, by and among The District at Howell Mill, LLC, ELPF Howell Mill, LLC and Calloway Title and Escrow, L.L.C. (Incorporated by reference to Exhibit 10.10 to the Fund’s Quarterly Report on Form 10-Q filed with the SEC on August 9, 2007).
10.10*
Real Estate Purchase and Sale Agreement among Cabana Beach of San Marcos, L.P., Cabana South Beach Apartments LP and Excelsior LaSalle Property Fund, Inc. dated September 14, 2007 (the “Purchase and Sale Agreement”) (Incorporated by reference to Exhibit 10.1 to the Fund’s Quarterly Report on Form 10-Q filed with the SEC on November 7, 2007).

59
Exhibit Number Description
10.11
First Amendment to the Purchase and Sale Agreement dated October 1, 2007 (Incorporated by reference to Exhibit 10.2 to the Fund’s Quarterly Report on Form 10-Q filed with the SEC on November 7, 2007).
10.12*
Second Amendment to the Purchase and Sale Agreement dated October 9, 2007 (Incorporated by reference to Exhibit 10.3 to the Fund’s Quarterly Report on Form 10-Q filed with the SEC on November 7, 2007).
10.13
Third Amendment to the Purchase and Sale Agreement dated October 11, 2007 (Incorporated by reference to Exhibit 10.4 to the Fund’s Quarterly Report on Form 10-Q filed with the SEC on November 7, 2007).
10.14
Fourth Amendment to the Purchase and Sale Agreement dated October 12, 2007 (Incorporated by reference to Exhibit 10.5 to the Fund’s Quarterly Report on Form 10-Q filed with the SEC on November 7, 2007).
10.15
Amendment No. 1, dated December 4, 2009, to the Amended and Restated Management Agreement by and between Excelsior LaSalle Property Fund, Inc. and Bank of America Capital Advisors, Inc., dated as of June 19, 2007 (Incorporated by reference to Exhibit 10.15 to the Fund’s Annual Report on Form 10-K filed with the SEC on March 15, 2010).
10.16
Amendment to the Investment Advisory Agreement by and between Excelsior LaSalle Property Fund, Inc., U.S. Trust Company, N.A. and LaSalle Investment Management, Inc., dated as of September 15, 2005 (Incorporated by reference to Exhibit 10.16 to the Fund’s Annual Report on Form 10-K filed with the SEC on March 15, 2010).
14
Excelsior LaSalle Property Fund, Inc. Code of Business Conduct and Ethics Policy (Incorporated by reference to Exhibit 14 to the Fund’s Annual Report on Form 10-K filed with the SEC on March 7, 2008).
21 Subsidiaries of Excelsior LaSalle Property Fund, Inc.
24 Power of Attorney (see signature page to this Form 10-K)
31.1 Certification of Chief Executive Officer Pursuant to Section 302 of the Sarbanes-Oxley Act of 2002.
31.2 Certification of Chief Financial Officer Pursuant to Section 302 of the Sarbanes-Oxley Act of 2002.
32.1 Certification of Chief Executive Officer Pursuant to Section 906 of the Sarbanes-Oxley Act of 2002.
32.2 Certification of Chief Financial Officer Pursuant to Section 906 of the Sarbanes-Oxley Act of 2002.
* Portions of these exhibits have been omitted and filed separately with the Securities and Exchange Commission (the “SEC”) pursuant to confidential treatment requests filed with and approved by the SEC under Rule 24b-2 of the Securities Exchange Act of 1934, as amended.

Excelsior LaSalle Property Fund, Inc.
INDEX TO FINANCIAL STATEMENTS
F-1
PAGE
NUMBER
FINANCIAL STATEMENTS
Management’s Report on Internal Control over Financial Reporting F-2 Report of Independent Registered Public Accounting Firm F-3 Consolidated Balance Sheets as of December 31, 2010 and 2009 F-4 Consolidated Statements of Operations and Comprehensive Loss for the years ended December 31, 2010,
2009 and 2008 F-5 Consolidated Statements of Equity for the years ended December 31, 2010, 2009 and 2008 F-6 Consolidated Statements of Cash Flows for the years ended December 31, 2010, 2009 and 2008 F-7 Notes to Consolidated Financial Statements F-8
FINANCIAL STATEMENT SCHEDULE
Schedule III—Real Estate and Accumulated Depreciation as of December 31, 2010 F-29

MANAGEMENT’S REPORT ON INTERNAL CONTROL OVER FINANCIAL REPORTING
Our management is responsible for establishing and maintaining adequate internal control over financial reporting, as such term is defined in Exchange Act Rule 13a-15(f). Our internal control over financial reporting is a process designed under the supervision of our chief executive officer and chief financial officer to provide reasonable assurance regarding the reliability of financial reporting and preparation of our financial statements for external purposes in accordance with accounting principles generally accepted in the United States of America.
As of December 31, 2010, our management conducted an assessment of the effectiveness of our internal control over financial reporting based on criteria set forth by the Committee of Sponsoring Organizations of the Treadway Commission in “Internal Control—Integrated Framework”.
Based on the assessment, management has concluded that our internal control over financial reporting was effective as of December 31, 2010 to provide reasonable assurance regarding the reliability of financial reporting and the preparation of financial statements for external purposes in accordance with generally accepted accounting principles in the United States of America.
The effectiveness of our internal control over financial reporting has been audited by our independent registered public accounting firm, PricewaterhouseCoopers LLP, as stated in their report, which is included on page F-3 of this Form 10-K.
March 3, 2011
F-2
/S/ JAMES D. BOWDENJames D. Bowden
President and Chief Executive Officer
/S/ STEVEN SUSSSteven Suss
Chief Financial Officer

REPORT OF INDEPENDENT REGISTERED PUBLIC ACCOUNTING FIRM
To the Board of Directors and Stockholders of Excelsior LaSalle Property Fund, Inc.
In our opinion, the accompanying consolidated balance sheets and the related consolidated statements of operations and comprehensive loss, of equity, and of cash flows present fairly, in all material respects, the financial position of Excelsior LaSalle Property Fund, Inc. and its subsidiaries (collectively, the “Company”) at December 31, 2010 and 2009 and the results of their operations and their cash flows for each of the three years in the period ended December 31, 2010 in conformity with accounting principles generally accepted in the United States of America. In addition, in our opinion the financial statement schedule as of December 31, 2010 and for the two years then ended listed in the index appearing under Item 15(2) presents fairly, in all material respects, the information set forth therein when read in conjunction with the related consolidated financial statements. Also in our opinion, the Company maintained, in all material respects, effective internal control over financial reporting as of December 31, 2010, based on criteria established in Internal Control—Integrated Framework issued by the Committee of Sponsoring Organizations of the Treadway Commission (COSO). The Company’s management is responsible for these financial statements and financial statement schedule, for maintaining effective internal control over financial reporting and for its assessment of the effectiveness of internal control over financial reporting, included in the accompanying Management’s Report on Internal Control over Financial Reporting. Our responsibility is to express opinions on these financial statements, on the financial statement schedule, and on the Company’s internal control over financial reporting based on our integrated audits. We conducted our audits in accordance with the standards of the Public Company Accounting Oversight Board (United States). Those standards require that we plan and perform the audits to obtain reasonable assurance about whether the financial statements are free of material misstatement and whether effective internal control over financial reporting was maintained in all material respects. Our audits of the financial statements included examining, on a test basis, evidence supporting the amounts and disclosures in the financial statements, assessing the accounting principles used and significant estimates made by management, and evaluating the overall financial statement presentation. Our audit of internal control over financial reporting included obtaining an understanding of internal control over financial reporting, assessing the risk that a material weakness exists, and testing and evaluating the design and operating effectiveness of internal control based on the assessed risk. Our audits also included performing such other procedures as we considered necessary in the circumstances. We believe that our audits provide a reasonable basis for our opinions.
A company’s internal control over financial reporting is a process designed to provide reasonable assurance regarding the reliability of financial reporting and the preparation of financial statements for external purposes in accordance with generally accepted accounting principles. A company’s internal control over financial reporting includes those policies and procedures that (i) pertain to the maintenance of records that, in reasonable detail, accurately and fairly reflect the transactions and dispositions of the assets of the company; (ii) provide reasonable assurance that transactions are recorded as necessary to permit preparation of financial statements in accordance with generally accepted accounting principles, and that receipts and expenditures of the company are being made only in accordance with authorizations of management and directors of the company; and (iii) provide reasonable assurance regarding prevention or timely detection of unauthorized acquisition, use, or disposition of the company’s assets that could have a material effect on the financial statements.
Because of its inherent limitations, internal control over financial reporting may not prevent or detect misstatements. Also, projections of any evaluation of effectiveness to future periods are subject to the risk that controls may become inadequate because of changes in conditions, or that the degree of compliance with the policies or procedures may deteriorate.
/s/ PricewaterhouseCoopers LLP Chicago, Illinois March 3, 2011
F-3

EXCELSIOR LASALLE PROPERTY FUND, INC.
CONSOLIDATED BALANCE SHEETS $ in thousands, except per share amounts
The abbreviation “VIEs” above means Variable Interest Entities.
See notes to consolidated financial statements.
F-4
December 31, 2010 2009
ASSETS
Investments in real estate:
Land (including from VIEs of $32,593 and $43,579, respectively) $ 110,332 $ 125,108 Buildings and equipment (including from VIEs of $238,500 and $260,935, respectively) 709,408 750,419 Less accumulated depreciation (including from VIEs of $(24,846) and $(20,323), respectively) (76,028) (60,307)
Net property and equipment 743,712 815,220 Investments in unconsolidated real estate affiliates 27,675 29,851 Investments in real estate and other assets held for sale — 52,136
Net investments in real estate 771,387 897,207 Cash and cash equivalents (including from VIEs of $2,637 and $4,851, respectively) 33,431 44,258 Restricted cash (including from VIEs of $1,454 and $2,234, respectively) 11,751 6,574 Tenant accounts receivable, net (including from VIEs of $1,164 and $1,470, respectively) 2,254 3,717 Deferred expenses, net (including from VIEs of $1,113 and $1,707, respectively) 4,137 4,996 Acquired intangible assets, net (including from VIEs of $5,568 and $6,617, respectively) 42,097 53,548 Deferred rent receivable, net (including from VIEs of $711 and $1,472, respectively) 4,769 5,722 Prepaid expenses and other assets (including from VIEs of $442 and $572, respectively) 863 1,118
TOTAL ASSETS $ 870,689 $1,017,140
LIABILITIES AND EQUITY
Mortgage notes and other debt payable, net (including from VIEs of $191,288 and $225,363, respectively) $ 592,804 $ 654,086
Liabilities held for sale — 43,352 Accounts payable and other accrued expenses (including from VIEs of $2,536 and $3,157,
respectively) 10,377 9,557 Accrued interest (including from VIEs of $928 and $1,057, respectively) 2,541 3,055 Accrued real estate taxes (including from VIEs of $477 and $1,211, respectively) 2,162 4,243 Manager and advisor fees payable 777 1,405 Acquired intangible liabilities, net (including from VIEs of $0 and $82, respectively) 9,319 12,119
TOTAL LIABILITIES 617,980 727,817 Commitments and contingencies — — Equity:
Common stock: $0.01 par value; 100,000,000 shares authorized; 4,135,635 shares issued and outstanding at December 31, 2010 and 2009 41 41
Additional paid-in capital 453,244 453,244 Accumulated other comprehensive income 462 (39) Distributions to stockholders (78,361) (78,361) Accumulated deficit (133,939) (98,246)
Total Excelsior LaSalle Property Fund, Inc. stockholders’ equity 241,447 276,639
Noncontrolling interests 11,262 12,684
Total equity 252,709 289,323
TOTAL LIABILITIES AND EQUITY $ 870,689 $1,017,140

EXCELSIOR LASALLE PROPERTY FUND, INC.
CONSOLIDATED STATEMENTS OF OPERATIONS AND COMPREHENSIVE LOSS $ in thousands, except per share amounts
See notes to consolidated financial statements.
F-5
Year EndedDecember 31,
2010
Year Ended December 31,
2009
Year EndedDecember 31,
2008
Revenues:
Minimum rents $ 77,356 $ 76,726 $ 78,750 Tenant recoveries and other rental income 18,339 20,182 19,112
Total revenues 95,695 96,908 97,862 Operating expenses:
Real estate taxes 10,255 11,807 11,769 Property operating 24,038 24,268 23,453 Manager and advisor fees 3,264 6,413 9,035 Fund level expenses 1,822 2,354 2,444 Provision for doubtful accounts 889 861 935 General and administrative 1,036 1,518 1,000 Provision for impairment of real estate, net 27,201 7,312 — Depreciation and amortization 28,894 32,359 55,759
Total operating expenses 97,399 86,892 104,395
Operating (loss) income (1,704) 10,016 (6,533) Other income and (expenses):
Interest income 17 84 293 Interest expense (34,920) (34,931) (36,035) Loss on extinguishment of debt (73) — — Equity in (loss) income of unconsolidated affiliates (2,373) (8,277) 1,230 Gain on foreign currency derivative — — 1,492
Total other income and (expenses) (37,349) (43,124) (33,020)
Loss from continuing operations (39,053) (33,108) (39,553) Discontinued operations:
Income (loss) from discontinued operations 1,501 (11,238) 1,328 Gain on sale of discontinued operations 822 2,530 —
Total income (loss) from discontinued operations 2,323 (8,708) 1,328
Net loss (36,730) (41,816) (38,225)
Plus: Net loss attributable to the noncontrolling interests 1,090 2,205 5,651
Net loss attributable to Excelsior LaSalle Property Fund, Inc. (35,640) (39,611) (32,574) Other comprehensive income (loss):
Foreign currency translation adjustment 501 1,846 (2,848)
Total other comprehensive income (loss) 501 1,846 (2,848)
Net comprehensive loss $ (35,139) $ (37,765) $ (35,422)
Net (loss) income from continuing operations attributable to Excelsior LaSalle Property Fund, Inc. per share-basic and diluted $ (9.18) $ (7.49) $ (8.87)
Total income (loss) from discontinued operations per share-basic and diluted $ 0.56 $ (2.10) $ 0.35 Net loss attributable to Excelsior LaSalle Property Fund, Inc. per share-basic
and diluted $ (8.62) $ (9.59) $ (8.52)
Weighted average common stock outstanding-basic and diluted 4,135,635 4,128,290 3,822,484

EXCELSIOR LASALLE PROPERTY FUND, INC.
CONSOLIDATED STATEMENTS OF EQUITY $ in thousands, except per share amounts
See notes to consolidated financial statements.
F-6
Common Stock Additional
Paid In Capital
Other
ComprehensiveIncome (loss)
Distributionsto Stockholders
AccumulatedDeficit
NoncontrollingInterests
TotalEquity Shares Amount
Balance, December 31, 2007 3,586,850 $ 36 $ 386,527 $ 963 $ (48,323) $ (23,127) $ 15,519 $331,595 Issuance of common stock 654,450 6 79,872 — — — — 79,878 Repurchase of common stock (208,737) (2) (22,591) — — (2,934) — (25,527) Net loss — — — — — (32,574) (5,651) (38,225) Other comprehensive loss — — — (2,848) — — — (2,848) Cash contributed from
noncontrolling interests — — — — — — 5,964 5,964 Cash distributed to noncontrolling
interests — — — — — — (789) (789) Distributions declared ($7.00 per
share) — — — — (26,432) — — (26,432)
Balance, December 31, 2008 4,032,563 $ 40 $ 443,808 $ (1,885) $ (74,755) $ (58,635) $ 15,043 $323,616 Issuance of common stock 103,072 1 9,436 — — — — 9,437 Net loss — — — — — (39,611) (2,205) (41,816) Other comprehensive income — — — 1,846 — — — 1,846 Cash contributed from
noncontrolling interests — — — — — — 639 639 Cash distributed to noncontrolling
interests — — — — — — (793) (793) Distributions declared ($0.875 per
share) — — — — (3,606) — — (3,606)
Balance, December 31, 2009 (previously reported) 4,135,635 $ 41 $ 453,244 $ (39) $ (78,361) $ (98,246) $ 12,684 $289,323
Cumulative effect of change in accounting principle — — — — — (53) (104) (157)
Balance, January 1, 2010 4,135,635 $ 41 $ 453,244 $ (39) $ (78,361) $ (98,299) $ 12,580 $289,166 Issuance of common stock — — — — — — — — Net loss — — — — — (35,640) (1,090) (36,730) Other comprehensive income — — — 501 — — — 501 Cash contributed from
noncontrolling interests — — — — — — 529 529 Cash distributed to noncontrolling
interests — — — — — — (757) (757) Distributions declared ($0.00 per
share) — — — — — — — —
Balance, December 31, 2010 4,135,635 $ 41 $ 453,244 $ 462 $ (78,361) $ (133,939) $ 11,262 $252,709
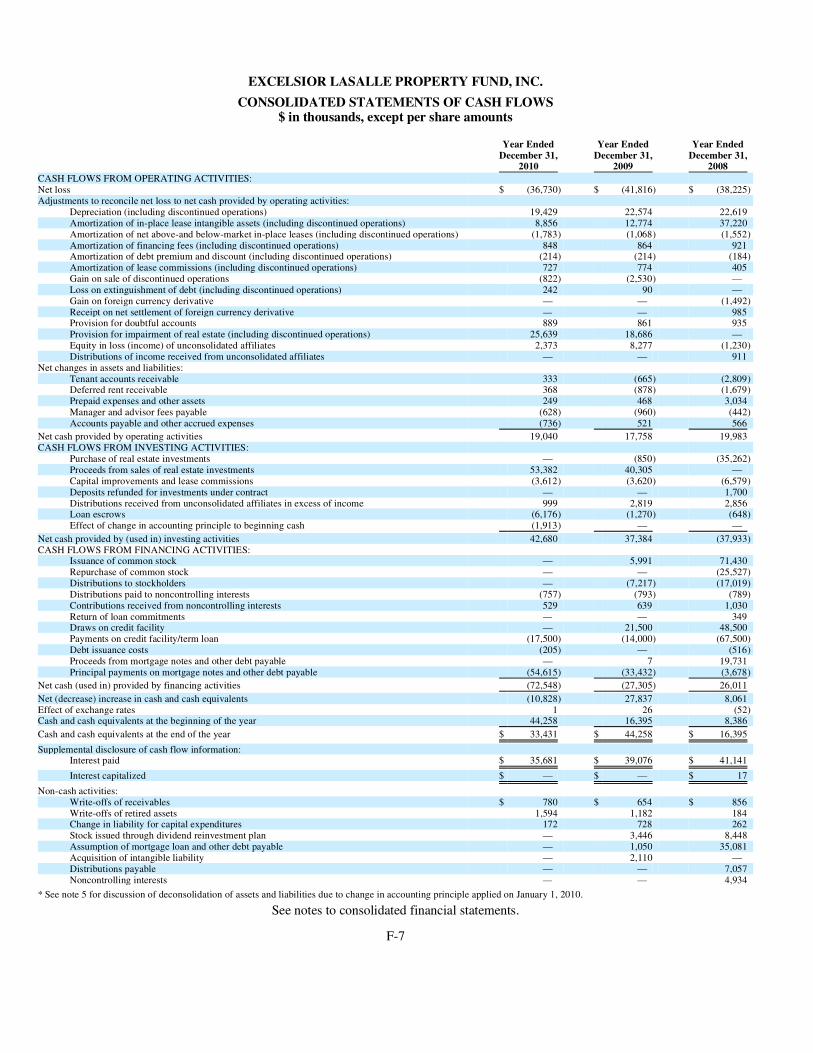
EXCELSIOR LASALLE PROPERTY FUND, INC.
CONSOLIDATED STATEMENTS OF CASH FLOWS $ in thousands, except per share amounts
See notes to consolidated financial statements.
F-7
Year EndedDecember 31,
2010
Year Ended December 31,
2009
Year EndedDecember 31,
2008CASH FLOWS FROM OPERATING ACTIVITIES: Net loss $ (36,730) $ (41,816) $ (38,225) Adjustments to reconcile net loss to net cash provided by operating activities:
Depreciation (including discontinued operations) 19,429 22,574 22,619 Amortization of in-place lease intangible assets (including discontinued operations) 8,856 12,774 37,220 Amortization of net above-and below-market in-place leases (including discontinued operations) (1,783) (1,068) (1,552) Amortization of financing fees (including discontinued operations) 848 864 921 Amortization of debt premium and discount (including discontinued operations) (214) (214) (184) Amortization of lease commissions (including discontinued operations) 727 774 405 Gain on sale of discontinued operations (822) (2,530) — Loss on extinguishment of debt (including discontinued operations) 242 90 — Gain on foreign currency derivative — — (1,492) Receipt on net settlement of foreign currency derivative — — 985 Provision for doubtful accounts 889 861 935 Provision for impairment of real estate (including discontinued operations) 25,639 18,686 — Equity in loss (income) of unconsolidated affiliates 2,373 8,277 (1,230) Distributions of income received from unconsolidated affiliates — — 911
Net changes in assets and liabilities: Tenant accounts receivable 333 (665) (2,809) Deferred rent receivable 368 (878) (1,679) Prepaid expenses and other assets 249 468 3,034 Manager and advisor fees payable (628) (960) (442) Accounts payable and other accrued expenses (736) 521 566
Net cash provided by operating activities 19,040 17,758 19,983 CASH FLOWS FROM INVESTING ACTIVITIES:
Purchase of real estate investments — (850) (35,262) Proceeds from sales of real estate investments 53,382 40,305 — Capital improvements and lease commissions (3,612) (3,620) (6,579) Deposits refunded for investments under contract — — 1,700 Distributions received from unconsolidated affiliates in excess of income 999 2,819 2,856 Loan escrows (6,176) (1,270) (648) Effect of change in accounting principle to beginning cash (1,913) — —
Net cash provided by (used in) investing activities 42,680 37,384 (37,933) CASH FLOWS FROM FINANCING ACTIVITIES:
Issuance of common stock — 5,991 71,430 Repurchase of common stock — — (25,527) Distributions to stockholders — (7,217) (17,019) Distributions paid to noncontrolling interests (757) (793) (789) Contributions received from noncontrolling interests 529 639 1,030 Return of loan commitments — — 349 Draws on credit facility — 21,500 48,500 Payments on credit facility/term loan (17,500) (14,000) (67,500) Debt issuance costs (205) — (516) Proceeds from mortgage notes and other debt payable — 7 19,731 Principal payments on mortgage notes and other debt payable (54,615) (33,432) (3,678)
Net cash (used in) provided by financing activities (72,548) (27,305) 26,011
Net (decrease) increase in cash and cash equivalents (10,828) 27,837 8,061 Effect of exchange rates 1 26 (52) Cash and cash equivalents at the beginning of the year 44,258 16,395 8,386
Cash and cash equivalents at the end of the year $ 33,431 $ 44,258 $ 16,395
Supplemental disclosure of cash flow information: Interest paid $ 35,681 $ 39,076 $ 41,141
Interest capitalized $ — $ — $ 17
Non-cash activities: Write-offs of receivables $ 780 $ 654 $ 856 Write-offs of retired assets 1,594 1,182 184 Change in liability for capital expenditures 172 728 262 Stock issued through dividend reinvestment plan — 3,446 8,448 Assumption of mortgage loan and other debt payable — 1,050 35,081 Acquisition of intangible liability — 2,110 — Distributions payable — — 7,057 Noncontrolling interests — — 4,934
* See note 5 for discussion of deconsolidation of assets and liabilities due to change in accounting principle applied on January 1, 2010.

EXCELSIOR LASALLE PROPERTY FUND, INC.
NOTES TO CONSOLIDATED FINANCIAL STATEMENTS $ in thousands, except per share amounts
NOTE 1—ORGANIZATION General
Except where the context suggests otherwise, the terms “we,” “us,” “our” and the “Fund” refer to Excelsior LaSalle Property Fund, Inc.
The Fund is a Maryland corporation and was incorporated on May 28, 2004. The Fund was created to provide accredited investors within the meaning of Regulation D promulgated under the Securities Act of 1933, as amended (the “Securities Act”), with an opportunity to participate in a private real estate investment fund that has elected to be taxed as a real estate investment trust (“REIT”) for federal income tax purposes. We are authorized to issue up to 100,000,000 of our Class A common stock, $0.01 par value per share (our “Common Stock” or “Shares”). Please note that while we use the term “Fund,” the Fund is not a mutual fund or any other type of “investment company” as that term is defined by the Investment Company Act of 1940, as amended (the “Investment Company Act”), and will not be registered under the Investment Company Act.
The Fund is managed by Bank of America Capital Advisors LLC (the “Manager”). The Manager is registered as an investment advisor with the Securities and Exchange Commission (the “SEC”). The Manager has the day-to-day responsibility for our management and administration pursuant to a management agreement between the Fund and the Manager (the “Management Agreement”).
LaSalle Investment Management, Inc. (“LaSalle”) acts as our investment advisor (the “Advisor”), pursuant to the advisory agreement between the Fund, LaSalle and the Manager (the “Advisory Agreement”). The Advisor is registered as an investment advisor with the SEC. The Advisor has broad discretion with respect to our investment decisions and is responsible for selecting our investments and for managing our investment portfolio pursuant to the terms of the Advisory Agreement. LaSalle is a wholly-owned but operationally independent subsidiary of Jones Lang LaSalle Incorporated, a New York Stock Exchange-listed real estate services and money management firm. We have no employees as all operations are overseen and undertaken by the Manager and Advisor. In accordance with Maryland law, the Fund does have certain officers who administer the Fund’s operations. These officers are employees of, and are compensated by, the Manager.
The Manager has retained The Townsend Group, at the expense of the Manager, to assist the Manager in reviewing the investment activities of the Advisor and the investment performance of the Fund’s assets and monitoring compliance with the Fund’s investment guidelines. The Townsend Group is a consulting firm whose exclusive focus is the asset class of real estate. Founded in 1983, and with offices in Cleveland, Denver, San Francisco and London, The Townsend Group is a provider of real estate consulting services to institutional investors in the United States.
Our primary business is the ownership and management of a diversified portfolio of retail, office, industrial and apartment properties primarily located in the United States. As of December 31, 2010, we wholly or majority owned and controlled 34 consolidated properties. As of December 31, 2010, we owned interests in two unconsolidated properties.
NOTE 2—SUMMARY OF SIGNIFICANT ACCOUNTING POLICIES Basis of Presentation and Principles of Consolidation
The accompanying consolidated financial statements have been prepared in accordance with accounting principles generally accepted in the United States of America (“GAAP”), the instructions to Form 10-K and Rule 10-01 of Regulation S-X and include the accounts of our wholly-owned subsidiaries, consolidated variable
F-8
interest entities and the unconsolidated investments in real estate affiliates accounted for under the equity method of accounting. We consider the authoritative guidance of accounting for investments in common stock, investments in real estate ventures, investors accounting for an investee when the investor has the majority of the voting interest but the minority partners have certain approval or veto rights, determining whether a general partner or general partners as a group controls a limited partnership or similar entity when the limited partners have certain rights, and the consolidation of variable interest entities in which we own less than a 100% interest. Prior to January 1, 2010, in determining whether we had a controlling interest in a non-wholly owned entity and the requirement to consolidate the accounts of that entity, we consider factors such as ownership interest, board representation, management representation, authority to make decisions, and contractual and substantive participating rights of the members as well as whether the entity was a variable interest entity in which the Fund would absorb the majority of the entity’s expected losses, if they occurred, or receive the majority of the expected residual returns, if they occurred, or both. On January 1, 2010, the Fund adopted revised guidance regarding the consolidation of variable interest entities (see Note 4). With respect to our 80% interest in 111 Sutter Street, we have concluded that we do not control the entity, despite having an ownership interest of 50% or greater, because the entity is not considered a variable interest entity and the approval of all of the members is contractually required with respect to major decisions, such as operating and capital budgets, the sale, exchange or other disposition of real property, the commencement, compromise or settlement of any lawsuit, legal proceeding or arbitration or the placement of new or additional financing collateralized by assets of the venture. All significant intercompany balances and transactions have been eliminated in consolidation.
Noncontrolling interests represent the minority members’ proportionate share of the equity in The District at Howell Mill, Cabana Beach San Marcos, Cabana Beach Gainesville, The Lodge of Athens, Campus Lodge Columbia, The Edge at Lafayette and Campus Lodge Tampa. At acquisition, we measured and recorded the assets, liabilities and non-controlling interests at the implied fair value, based on the purchase price. Noncontrolling interests will increase for the minority members’ share of net income of these entities and contributions and decrease for the minority members’ share of net loss and distributions. As of December 31, 2010, noncontrolling interests represented the minority members’ proportionate share of the equity of the entities listed above.
Certain of the Fund’s joint venture agreements include provisions whereby, at certain specified times, each party has the right to initiate a purchase or sale of its interest in the joint ventures at an agreed upon fair value. Under these provisions, the Fund is not obligated to purchase the interest of its outside joint venture partners.
Certain reclassifications of prior period amounts have been made to the consolidated balance sheets and consolidated statements of operations and comprehensive income. These reclassifications have been made to conform to the 2010 presentation. These reclassifications have not changed the Fund’s financial position as of December 31, 2010 and 2009 or consolidated results of operations or cash flows for the years ended December 31, 2010 and 2009.
Investments in Real Estate Real estate assets are stated at cost. Our real estate assets are reviewed for impairment whenever events or changes in
circumstances indicate that the carrying value may not be recoverable. A real estate asset is considered to be impaired when the estimated future undiscounted operating cash flow over the expected hold period is less than its carrying value in accordance with the authoritative guidance on accounting for the impairment or disposal of long-lived assets. To the extent impairment has occurred, the excess of carrying value of the asset over its estimated fair value will be charged to operations. Properties held-for-sale are carried at the lower of their carrying values (i.e., cost less accumulated depreciation and any impairment loss recognized, where applicable) or estimated fair values less costs to sell. Fair value is based upon the property’s most recent valuation. Carrying values are reassessed at each balance sheet date. Due to market fluctuation, actual proceeds realized on the ultimate sale of these properties may differ from estimates and such differences could be material. Depreciation and amortization cease once a property is classified as held-for-sale. The Fund recorded net
F-9

impairment charges on consolidated real estate properties for year ended 2010 and 2009 totaling $25,639 and $18,686, respectively, including discontinued operations.
Depreciation expense is computed using the straight-line method based upon the following estimated useful lives:
Starting in 2009, acquisition related costs are expensed as incurred. Previous treatment was to capitalize for successful acquisitions.
Maintenance and repairs are charged to expense when incurred. Expenditures for significant betterments and improvements are capitalized.
Investments in Unconsolidated Real Estate Affiliates We account for our investments in unconsolidated real estate affiliates using the equity method whereby the costs of the
investments are adjusted for our share of equity in net income or loss from the date of acquisition and reduced by distributions received and increased by contributions provided. The limited liability company agreements (“the Agreements”) with respect to the unconsolidated real estate affiliates provide that elements of assets, liabilities and funding obligations are shared in accordance with our ownership percentage. In addition, we share in the profits and losses, cash flows, distributions and other matters relating to our unconsolidated real estate affiliates in accordance with the Agreements.
To the extent that the Fund’s cost basis is different than the basis reflected at the joint venture level, the basis difference is amortized over the life of the related assets and liabilities included in the Fund’s share of equity in income (loss) of the unconsolidated affiliates.
The Fund evaluates the carrying value of its investments in unconsolidated joint ventures in accordance with the authoritative guidance on the equity method of accounting for investments in common stock. We analyze our investments in unconsolidated real estate affiliates when circumstances change and at every reporting period and determine if an “other-than-temporary” impairment exists and, if so, we assess our ability to recover our carrying cost of the investment. During 2009, we determined that an other than temporary decline in the value of our investment in Legacy Village existed and we recognized an impairment charge of $7,269. Due to the uncertain economic climate, we will continue to monitor this investment’s value on an on-going basis and will continue to assess the value of its investment in accordance with the authoritative guidance. The Fund concluded that it did not have a “other than temporary” impairment in any of its investments in unconsolidated joint ventures in 2010.
Revenue Recognition Minimum rent revenues are recognized on a straight-line basis over the terms of the related leases. For the years ended
December 31, 2010, 2009 and 2008, $751, $822 and $1,829, respectively, have been recognized as net straight-line rent revenue (representing rents recognized prior to being billed and collectible as provided by the terms of the leases). Also included, as an increase to rent revenue, for the years ended December 31, 2010, 2009 and 2008, are $1,783, $1,068 and $1,552, respectively, of net amortization related to above-and below-market in-place leases at properties acquired as provided by authoritative guidance on goodwill and intangible assets. Tenant recoveries are recognized as revenues in the period the applicable costs are incurred.
F-10
Asset Category Estimated Useful Life
Buildings and improvements 40-50 YearsTenant improvements Life of related leaseEquipment and fixtures 2-10 Years

Percentage rents are recognized when earned as certain tenant sales volume targets, as specified by the lease terms, are met. For the years ended December 31, 2010, 2009 and 2008, $133, $247 and $574 in the aggregate, respectively, have been recognized in tenant recoveries and other rental income.
Allowance for Doubtful Accounts We provide an allowance for doubtful accounts against the portion of accounts receivable and deferred rent receivable that is
estimated to be uncollectible. Such allowance is reviewed periodically based upon our recovery experience. At December 31, 2010 and 2009, our allowance for doubtful accounts was $819 and $710, respectively.
Cash and Cash Equivalents We consider all highly-liquid investments purchased with original maturities of three months or less to be cash equivalents. We
maintain a portion of our cash in bank deposit accounts, which, at times, may exceed the federally insured limits. No losses have been experienced related to such accounts. We believe we place our cash with quality financial institutions.
Restricted Cash Restricted cash includes amounts established pursuant to various agreements for loan escrow accounts and loan commitments.
Deferred Expenses Deferred expenses consist of debt issuance costs and lease commissions. Debt issuance costs are capitalized and amortized over
the terms of the respective agreements as a component of interest expense. Lease commissions are capitalized and are amortized over the term of the related lease as a component of depreciation and amortization expense. Deferred expenses accumulated amortization atDecember 31, 2010 and 2009 was $3,384 and $3,321, respectively.
Foreign Exchange We utilize the U.S. dollar as our functional currency, except for our Canadian operations, which use the Canadian dollar as the
functional currency. When preparing consolidated financial statements, assets and liabilities of foreign entities are translated at the exchange rates at the balance sheet date, while income and expense items are translated at average rates for the period. Foreign currency translation adjustments are recorded in accumulated other comprehensive income.
Derivative Instruments In August 2007, we entered into foreign currency forward contracts, to economically hedge our foreign exchange exposure, for
exchanges between United States Dollars and Canadian Dollars. We contracted to buy United States Dollars with Canadian Dollars at each quarter end through and ending on December 31, 2008. We did not designate these forward contracts as accounting hedges. In accordance with the authoritative guidance on accounting for derivative instruments and hedging activities, these derivatives were recorded at fair value within accounts payable and other accrued expenses on the Consolidated Balance Sheets with gains and losses reported in gain (loss) on foreign currency derivative in the Consolidated Statement of Operations and Comprehensive Loss. We do not enter into foreign exchange forward contracts for trading purposes. We settled the foreign currency forward contract on December 31, 2008 and realized a gain on foreign currency derivative of $1,492. We have not entered into any additional foreign currency forward contracts since December 31, 2008.
F-11

Acquisitions We use estimates of future cash flows and other valuation techniques to allocate the purchase price of acquired property among
land, building and other identifiable asset and liability intangibles. We record land and building values using an as-if-vacant methodology. We record above- and below-market in-place lease values for acquired properties based on the present value (using an interest rate which reflects the risks associated with the leases acquired) of the difference between (i) the contractual amounts to be paid pursuant to the in-place leases and (ii) our estimate of fair market lease rates for the corresponding in-place leases, measured over a period equal to the remaining non-cancelable term of the lease plus any below-market lease extension option periods. We amortize the capitalized above-market lease values as a reduction of minimum rents over the remaining non-cancelable terms of the respective leases. We amortize the capitalized below-market lease values as an increase to minimum rents over the term of the respective leases plus any below-market lease extension option terms. Should a tenant terminate its lease prior to the contractual expiration, the unamortized portion of the above-market and below-market in-place lease value is immediately charged to minimum rents.
We measure the aggregate value of other intangible assets acquired based on the difference between (i) the property valued with existing in-place leases and (ii) the property valued as-if-vacant. Our estimates of value are made using methods similar to those used by independent appraisers, primarily discounted cash flow analyses. Factors considered by us in our analysis include an estimate of carrying costs during the hypothetical expected lease-up periods considering current market conditions at the date of acquisition, and costs to execute similar leases. We also consider information obtained about each property as a result of the pre-acquisition due diligence, marketing and leasing activities in estimating the fair value of the tangible and intangible assets acquired. In estimating carrying costs, we will include estimates of lost rentals during the expected lease-up periods, which is expected to primarily range from one to two years, depending on specific local market conditions, and costs to execute similar leases, including leasing commissions, legal and other related expenses to the extent that such costs are not already incurred in connection with a new lease origination as part of the transaction.
The total amount of other intangible assets acquired is further allocated to in-place lease values and customer relationship intangible values based on our evaluation of the specific characteristics of each tenant’s lease and our overall relationship with that respective tenant. Characteristics considered by us in allocating these values include the nature and extent of our existing business relationships with the tenant, growth prospects for developing new business with the tenant, the tenant’s credit quality and expectations of lease renewals (including those existing under the terms of the lease agreement), among other factors. As of December 31, 2010, we have allocated no value to customer relationship value. We amortize the value of in-place leases to expense over the remaining initial terms of the respective leases, which generally range from 1 to 29 years.
We have allocated purchase price to acquired intangible assets, which include acquired in-place lease intangibles, acquired above-market in-place lease intangibles, acquired ground lease intangibles, and tenant improvements and lease commissions funding commitment, which are reported net of accumulated amortization of $41,737 and $45,414 at December 31, 2010 and 2009, respectively, on the accompanying Consolidated Balance Sheets. The acquired intangible liabilities represent acquired below-market in-place leases, which are reported net of accumulated amortization of $13,158 and $17,177 at December 31, 2010 and 2009, respectively, on the accompanying Consolidated Balance Sheets. Our amortizing intangible assets are reviewed for impairment whenever events or changes in circumstances indicate that the carrying value may not be recoverable. According to authoritative guidance, an amortizing intangible asset is considered to be impaired when the estimated future undiscounted operating cash flow is less than its carrying value. To the extent impairment has occurred, the excess of the carrying value of the amortizing intangible asset over its estimated fair value will be charged to operations.
F-12

Future amortization related to amortizing acquired intangible assets and liabilities as of December 31, 2010 is as follows:
Stock Redemptions The Fund retires common stock repurchased through the Share Repurchase Program (See Note 7). The excess of redemption
price over the stockholders’ cost basis in the underlying stock is charged to retained earnings.
Income Taxes We made the election to be taxed as a REIT under sections 856-860 of the Internal Revenue Code of 1986 (the “Code”) as of
December 23, 2004. To qualify as a REIT, we must meet a number of organizational and operational requirements, including requirements to distribute at least 90% of our ordinary taxable income and to distribute to stockholders or pay tax on 100% of capital gains and to meet certain quarterly and annual asset and income tests. It is our current intention to adhere to these requirements. As a REIT, we will generally not be subject to corporate-level federal income tax to the extent we distribute 100% of our taxable income to our stockholders. Accordingly, the consolidated statements of operations do not reflect a provision for income taxes. If we fail to qualify as a REIT in any taxable year, we will be subject to federal income taxes at regular corporate rates (including any applicable alternative minimum tax) and may not be able to qualify as a REIT for four subsequent taxable years. Even if we qualify for taxation as a REIT, we may be subject to certain state and local taxes on our income or property, and to federal income and excise taxes on our undistributed taxable income.
Earnings and profits, which determine the taxability of dividends to stockholders, differ from net income reported for financial reporting purposes due to differences for federal income tax reporting purposes in computing, among other things, estimated useful lives, depreciable basis of properties and permanent and timing differences on the inclusion or deductibility of elements of income and expense for such purposes.
Business Segments Guidance regarding the disclosures about segments of an enterprise and related information requires disclosure of certain
operating and financial data with respect to separate business activities within an enterprise. Our primary business is the ownership and operation of real estate investments. We evaluate cash flow and allocate resources on a property-by-property basis. We aggregate our properties into one reportable segment since all properties are institutional quality real estate. We do not distinguish or group our consolidated operations by property type or on a geographic basis. Accordingly, we have concluded that we currently have a single reportable segment.
At December 31, 2010 and 2009, we held one investment outside the United States. For the years ended December 31, 2010, 2009 and 2008, total revenues of this foreign investment were $4,274, $3,902 and $4,226,
F-13
Acquiredin-placeleases
Acquiredabove-marketleases
Below- market ground leases
Acquiredbelow-marketleases
2011 $ 7,372 $ 562 $ 146 $(2,548) 2012 5,149 333 146 (1,279) 2013 4,183 246 146 (1,063) 2014 3,379 179 146 (1,024) 2015 3,129 115 146 (977) Thereafter 7,423 123 9,174 (2,428)
$30,635 $ 1,558 $9,904 $(9,319)

respectively. For the years ended December 31, 2010, 2009 and 2008 total revenues of U.S. domiciled investments were $93,069, $106,582 and $109,208, respectively. At December 31, 2010 and 2009, total assets of our foreign investment were $41,388 and $40,878, respectively. The change in total assets from December 31, 2009 to December 31, 2010 at our foreign investment was mainly a result of the change in foreign currency rate on those dates. At December 31, 2010 and 2009, total assets of U.S domiciled investments were $829,301 and $976,262, respectively.
Assets and Liabilities Measured at Fair Value The FASB’s guidance for fair value measurement and disclosure states that fair value is an exit price, representing the amount
that would be received to sell an asset or paid to transfer a liability in an orderly transaction between market participants. As such, fair value is a market-based measurement that should be determined based on assumptions that market participants would use in pricing an asset or liability. As a basis for considering assumptions, authoritative guidance establishes a three-tier fair value hierarchy, which prioritizes the inputs used in measuring fair value as follows:
The authoritative guidance requires the disclosure of the fair value of our financial instruments for which it is practicable to estimate that value. The guidance does not apply to all balance sheet items. We have utilized market information as available or present value techniques to estimate the amounts required to be disclosed. Since such amounts are estimates, there can be no assurance that the disclosed value of any financial instrument could be realized by immediate settlement of the instrument. We consider the carrying value of our cash and cash equivalents to approximate their fair value due to the short maturity of these investments. The fair value of our notes receivable was approximately $762 higher than the aggregate carrying amount at December 31, 2009. We had no outstanding notes receivable at December 31, 2010. We have estimated the fair value of our mortgage notes and other debt payable reflected in the accompanying Consolidated Balance Sheets at amounts that are based upon an interpretation of available market information and valuation methodologies (including discounted cash flow analyses with regard to fixed rate debt) for similar loans made to borrowers with similar credit ratings and for the same maturities. The fair value of our mortgage notes and other debt payable was approximately $27,860 and $85,067 lower than the aggregate carrying amounts at December 31, 2010 and 2009, respectively. Such fair value estimates are not necessarily indicative of the amounts that would be realized upon disposition of our mortgage notes and other debt payable.
Use of Estimates The preparation of financial statements in conformity with GAAP requires us to make estimates and assumptions. These
estimates and assumptions affect the reported amounts of assets and liabilities and the disclosure of contingent assets and liabilities at the date of the financial statements and the reported amounts of revenues and expenses during the reporting period. For example, significant estimates and assumptions have been made with respect to useful lives of assets, recoverable amounts of receivables, initial valuations and related amortization periods of deferred costs and intangibles, particularly with respect to property acquisitions. Actual results could differ from those estimates.
F-14
• Level 1—Quoted unadjusted prices for identical instruments in active markets to which the Fund has access at the date of
measurement.
• Level 2—Quoted prices for similar instruments in active markets; quoted prices for identical or similar instruments in markets that are not active; and model-derived valuations in which all significant inputs and significant value drivers are observable in active markets. Level 2 inputs are those in markets for which there are few transactions, the prices are not current, little public information exists or instances where prices vary substantially over time or among brokered market makers.
• Level 3—Model derived valuations in which one or more significant inputs or significant value drivers are unobservable.
Unobservable inputs are those inputs that reflect the Fund’s own assumptions that market participants would use to price the asset or liability based on the best available information.

NOTE 3—PROPERTY The primary reason we make acquisitions of real estate investments in the retail, office, industrial, and apartment property
sectors is to invest capital contributed by accredited investors in a diversified portfolio of real estate. The consolidated properties held within the Fund as of December 31, 2010 were as follows:
Impairment of Investments in Real Estate previously held for sale In December 2009, we determined that five properties we designated as held for sale were impaired at the date the properties
were classified as held for sale. These properties included 25850 S. Ridgeland, Georgia Door Sales Distribution Center, 105 Kendall Park Lane, Havertys Furniture and 4001 North Norfleet Road. In accordance with the authoritative guidance for impairment of long-lived assets held for sale, we determined the carrying values of these investments exceeded their fair value less cost to sell and recorded impairment in the amount of $18,686 for the year ended December 31, 2009. At March 31, 2010, we reevaluated these assets for
F-15
Property Sector
SquareFeet
(Unaudited) Location Ownership
% Acquisition
Date Acquisition
Price
Monument IV at Worldgate Office 228,000 Herndon, VA 100% 8/27/2004 $ 59,608 Georgia Door Sales Distribution Center Industrial 254,000 Austell, GA 100% 2/10/2005 8,500 105 Kendall Park Lane Industrial 409,000 Atlanta, GA 100% 6/30/2005 18,781 Marketplace at Northglenn Retail 439,000 Northglenn, CO 100% 12/21/2005 91,476 CHW Medical Office Portfolio (1) Office 755,000 CA and AZ 100% 12/21/2005 136,761 Metropolitan Park North Office 187,000 Seattle, WA 100% 3/28/2006 89,179 Stirling Slidell Shopping Centre (2) Retail 139,000 Slidell, LA 100% 12/14/2006 23,367 4001 North Norfleet Road Industrial 702,000 Kansas City, MO 100% 2/27/2007 37,579 Station Nine Apartments Apartment 312,000 Durham, NC 100% 4/16/2007 56,417 4 Research Park Drive (3) Office 60,000 St. Charles, MO 100% 6/13/2007 11,330 36 Research Park Drive Office 81,000 St. Charles, MO 100% 6/13/2007 17,232 The District at Howell Mill (4) Retail 306,000 Atlanta, GA 87.85% 6/15/2007 78,661 Canyon Plaza (5) Office 199,000 San Diego, CA 100% 6/26/2007 54,973 Railway Street Corporate Centre Office 137,000 Calgary, Canada 100% 8/30/2007 42,614 Cabana Beach San Marcos (6) Apartment 278,000 San Marcos, TX 78% 11/21/2007 29,375 Cabana Beach Gainesville (6) Apartment 545,000 Gainesville, FL 78% 11/21/2007 74,277 Campus Lodge Athens (6) Apartment 229,000 Athens, GA 78% 11/21/2007 20,980 Campus Lodge Columbia (6) Apartment 256,000 Columbia, MO 78% 11/21/2007 24,852 The Edge at Lafayette (6) Apartment 207,000 Lafayette, LA 78% 1/15/2008 26,870 Campus Lodge Tampa (6) Apartment 431,000 Tampa, FL 78% 2/29/2008 46,787
(1) Consists of a portfolio of leasehold interests in fifteen medical office buildings located throughout Southern California and the greater Phoenix metropolitan area. The buildings are all subject to ground leases expiring in 2078. Acquisition price includes the assumption of four fixed-rate mortgage loans for approximately $84,300 at a weighted average interest rate of 5.77%, maturing in 2013 and 2014. From the acquisition date until December 31, 2007, we owned a 95% membership interest in the portfolio at which time we acquired the remaining 5% interest from an unrelated third party.
(2) Acquisition price includes the assumption of an approximate $14,000, 5.15% fixed-rate mortgage loan maturing in 2014. (3) Acquisition price includes the assumption of an approximate $7,400, 6.05% fixed-rate mortgage loan maturing in 2015. (4) The other owner, owning a 12.15% interest, is an unrelated third party. Acquisition price includes the assumption of an
approximate $35,000, 5.30% fixed-rate mortgage loan maturing in 2027. (5) Acquisition price includes the assumption of an approximate $31,000, 5.90% fixed-rate mortgage loan maturing in 2017. (6) The other owner, owning a 22% interest, is an investment fund advised by our Advisor and in which the parent company of our
Advisor owns a noncontrolling interest.

further impairment and determined that 25850 S. Ridgeland, Georgia Door Sales Distribution Center and 4001 North Norfleet Road were further impaired. As such, we recognized additional impairment charges of approximately $1,471. The impairment stemmed from continuing deterioration of real estate market fundamentals. Upon our reevaluation of 105 Kendall Park Lane and Havertys Furniture we determined that the fair values less costs to sell increased since our initial evaluation. As such, we recorded a recovery of previously recorded impairment of approximately $3,574. The additional impairment charges and the recovery of previously recorded impairment related to 25850 S. Ridgeland and Havertys Furniture are included within income from discontinued operations on the consolidated statements of operations and comprehensive loss.
On April 15, 2010, we removed Georgia Door Sales Distribution Center, 105 Kendall Park Lane and 4001 North Norfleet Road from held for sale and placed them into held for use status at their fair value on that date (which was less than reinstating these investments at cost less depreciation catch up). Upon recording the properties at the fair value on April 15, 2010, the Fund recorded a recovery of previously recorded provision for impairment of approximately $1,039.
Impairment of Investments in Real Estate held for use In December 2010, we determined that Metropolitan Park North was impaired. In accordance with the authoritative guidance for
impairment of long-lived assets held for use, we determined the carrying value of this investment exceeded the undiscounted cash flows over our expected hold period. As such, we recognized an impairment charge of approximately $28,781 on Metropolitan Park North, which represents the difference between the fair value and the carrying value of the property. The impairment stemmed from the near term debt maturity, the unwillingness of the lender to negotiate a material loan modification and the main tenant of the building not renewing their lease.
In September 2009, we determined that 9800 South Meridian was impaired. In accordance with the authoritative guidance for impairment of long-lived assets held for use, we determined the carrying value of this investment exceeded the undiscounted cash flows over our expected hold period. As such, we recognized an impairment charge of approximately $5,604 on 9800 South Meridian, which represents the difference between the fair value and the carrying value of the property. The impairment stemmed from the near term debt maturity coupled with deteriorating real estate market fundamentals. In December 2009, we determined that no additional indicators of impairment exist.
Measurement of Fair Value We were required to assess the value of our impaired assets in accordance with the guidance for long lived assets and equity
method investments, respectively. The valuation of these assets is determined using widely accepted valuation techniques including discounted cash flow analysis on the expected cash flows of each asset as well as the income capitalization approach considering prevailing market capitalization and discount rates. We review each investment based on the highest and best use of the investment and market participation assumptions. The significant assumptions included the capitalization rate used in the income capitalization valuation and projected property net operating income and net cash flows. Additionally, the valuation considered bid and ask prices for similar properties. We have determined that the significant inputs used to value the impaired assets fall within Level 3.
The valuation adjustments were calculated based on market conditions and assumptions made by management at the time the valuation adjustments were recorded, which may differ materially from actual results if market conditions or the underlying assumptions change in the future.
F-16

Discontinued Operations On June 26, 2009, we sold Hagemeyer Distribution Center, a 300,000 square foot industrial center located in Auburn, GA, for
$10,400, resulting in a gain of $911. On September 4, 2009, we sold Waipio Shopping Center, a 137,000 square foot retail center in Waipahu, HI, for $30,850, resulting in a gain of $1,619. The results of operations and gain on sale of the property are reported as discontinued operations for all periods presented.
On April 15, 2010, we sold Havertys Furniture, an 808,000 square foot industrial center located in Braselton, GA for $35,000 resulting in a gain of $113. On the same day, we also sold 25850 S. Ridgeland, a 719,000 square foot industrial center located in Monee, IL for $19,060 resulting in a gain of $709. The results of operations and gain on sale of the properties are reported as discontinued operations for all periods presented.
As of December 31, 2009, Havertys Furniture and 25850 S. Ridgeland were classified as held for sale. The Fund’s investment in real estate and other assets held for sale is comprised of:
The Fund’s disposed real estate investment liabilities were as follows:
The following table summarizes income (loss) from discontinued operations for the years ended December 31, 2010, 2009 and 2008:
F-17
Date of
Sale December 31,
2009
Land $ 6,478 $ 6,412 Buildings and equipment, net 36,007 34,768 Acquired intangible assets, net 5,144 5,119 Other assets, net 6,564 5,837
Total assets $54,193 $ 52,136
Date of
Sale December 31,
2009
Mortgage notes and other debt payable $42,029 $ 42,432 Other liabilities 948 920
Total liabilities $42,977 $ 43,352
Year Ended
December 31, 2010 Year Ended
December 31, 2009 (a) Year Ended
December 31, 2008 (a) Total revenue $ 1,647 $ 13,577 $ 15,572 Real estate taxes (290) (2,180) (1,960) Property operating (60) (1,865) (2,274) General and administrative (2) (107) (105) Net recovery of (provision) for impairment 1,562 (11,374) — Depreciation and amortization (118) (3,763) (4,485) Loss on extinguishment of debt (638) (1,003) — Interest income 89 327 350 Interest expense (689) (4,850) (5,770)
Income (loss) from discontinued operations $ 1,501 $ (11,238) $ 1,328
(a) 9800 South Meridian and 18922 Forge Drive were deconsolidated as of January 1, 2010 (see Note 5). For the years ending December 31, 2009 and 2008 these properties are included in discontinued operations above.

During the first quarter of 2008, the Advisor determined that the conditions in the capital markets were not opportune to dispose of Metropolitan Park North, which as of December 31, 2007 was classified as held for sale. The property was returned to continuing operations for all periods presented. During the quarter ended March 31, 2008, the Fund recorded catch up of depreciation and amortization of building and intangible assets and liabilities in the net amount of $1,414. The catch up related to the period that Metropolitan Park North was classified as held for sale during 2007.
During the second quarter of 2010, the Advisor determined that the conditions in the capital markets were not opportune to dispose of Georgia Door Sales Distribution Center, 105 Kendall Park Lane and 4001 North Norfleet Road, which as of December 15, 2009 were classified as held for sale. The properties were returned to continuing operations for all periods presented. On April 15, 2010, we placed the properties into held for use status at their fair value on that date, which was less than historical cost less catch up of depreciation. Upon recording the properties at the fair value on April 15, 2010, the Fund recorded a recovery of previously recorded provision for impairment of approximately $1,039.
NOTE 4—VARIABLE INTEREST ENTITIES In June 2009, the Financial Accounting Standards Board (“FASB”) issued amended guidance related to the consolidation of
variable-interest entities, which required the Fund to qualitatively assess the determination of the primary beneficiary of a variable interest entity (“VIE”) based on whether the entity (1) has the power to direct matters that most significantly impact the activities of the VIE, and (2) has the obligation to absorb losses or the right to receive benefits of the VIE that could potentially be significant to the VIE. The Fund has determined that the activities that most significantly impact the VIEs economic performance include, but are not limited to, decisions related to leasing, budgets, finance and selling. VIEs that have been consolidated have been determined by the Fund to either be under the control of the Fund due to its involvement in significant decisions or the power is shared by a related party and the Fund has the rights to substantially all of the economics of that VIE. VIEs in which the significant decisions require unanimous approval by all members are no longer consolidated despite the Fund having the rights to substantially all of the economics of the VIE, which previously required the Fund to consolidate these VIEs. The Fund adopted this guidance on January 1, 2010 and has determined to deconsolidate 9800 South Meridian and 18922 Forge Drive. In both of these cases, the Fund determined that its equity interest in the real estate assets represented a variable interest in a VIE, but it lacked the power to direct the activities that most significantly impact the VIE’s economic performance. The Fund recognized an impairment of approximately $53 to re-measure these investments to their values as of the deconsolidation date as if they had always been accounted for under the equity method of accounting. The write down was reported as a cumulative effect of a change of accounting principle, increasing the beginning accumulated deficit balance as of January 1, 2010, on the Consolidated Statements of Equity. Our adoption on January 1, 2010, resulted in the following impacts in our Consolidated Balance Sheets: (1) assets decreased by $34,198 primarily related to net investment in real estate; (2) liabilities decreased by $34,041 primarily related to mortgage notes payable; and (3) total equity decreased by $157. On September 30, 2010, the Fund assigned the interests in these investments to our operating partner (see Note 5).
The Fund’s involvement in its investment in The District at Howell Mill, Cabana Beach San Marcos, Cabana Beach Gainesville, The Lodge of Athens, Campus Lodge Columbia, The Edge at Lafayette, and Campus Lodge Tampa includes maintaining control over significant decisions, which began at the time of acquisition of the properties. The creditors of the Fund’s VIEs do not have general recourse to us.
Please also see the parenthetical disclosures on our Consolidated Balance Sheet regarding the amounts of variable interest entities’ assets and liabilities that are consolidated.
F-18

NOTE 5—UNCONSOLIDATED REAL ESTATE AFFILIATES
Legacy Village On August 25, 2004, we acquired a 46.5% membership interest in Legacy Village Investors, LLC which owns Legacy Village, a
595,000 square-foot lifestyle center in Lyndhurst, Ohio, built in 2003. The aggregate consideration for our 46.5% ownership interest was approximately $35,000.
111 Sutter Street On March 29, 2005, we acquired an 80% membership interest in CEP Investors XII LLC, which owns 111 Sutter Street in San
Francisco, California, a 286,000 square-foot, multi-tenant office building built in 1926 and renovated in 2001. The aggregate consideration paid for the 80% membership interest was approximately $24,646.
9800 South Meridian and 18922 Forge Drive At September 30, 2010, the Fund assigned its 90% interests in the 9800 South Meridian and 18922 Forge Drive investments to
our operating partner and subsequently received a distribution of $1,000 from property cash reserves. The Fund recorded a loss on the assignment of its interest in 18922 Forge Drive of $428 which is included in equity in loss of unconsolidated affiliates on the Consolidated Statement of Operations and Comprehensive Loss. The Fund recorded no loss on its assignment of interest in 9800 South Meridian as the investment was previously revalued to $0. The Fund has no further involvement in and no obligation to fund the investments in 9800 South Meridian and 18922 Forge Drive subsequent to assigning its interests.
Impairment of Investments in Unconsolidated Real Estate Affiliates In June 2009, due to the continued deterioration of the U.S. capital markets, the lack of liquidity and the related impact on the
real estate market and retail industry, we determined that one of our investments in unconsolidated real estate affiliates was impaired. As a result, we recorded an impairment charge of approximately $4,857 to our investment in Legacy Village, which is included within equity in (loss) income of unconsolidated affiliates on the consolidated statements of operations and comprehensive loss. The impairment was determined in accordance with the authoritative guidance for equity method investments. In December 2009, we determined that additional indicators of impairment existed for our investment in Legacy Village and we recorded an additional impairment charge of $2,412.
SUMMARIZED FINANCIAL INFORMATION OF INVESTMENTS IN UNCONSOLIDATED REAL ESTATE AFFILIATES
The following is summarized financial information for our unconsolidated real estate affiliates:
SUMMARIZED COMBINED BALANCE SHEETS—UNCONSOLIDATED REAL ESTATE AFFILIATES
F-19
December 31, 2010 December 31, 2009 ASSETS Investments in real estate, net $ 157,509 $ 160,803 Cash and cash equivalents 3,609 2,551 Other assets, net 16,567 18,893
TOTAL ASSETS $ 177,685 $ 182,247
LIABILITIES AND MEMBERS’ EQUITY Mortgage notes and other debt payable $ 147,197 $ 150,382 Other liabilities 9,496 9,200
TOTAL LIABILITIES 156,693 159,582 Members’ Equity 20,992 22,665
TOTAL LIABILITIES AND MEMBERS’ EQUITY $ 177,685 $ 182,247

FUND INVESTMENTS IN UNCONSOLIDATED REAL ESTATE AFFILIATES
SUMMARIZED COMBINED STATEMENTS OF OPERATIONS—UNCONSOLIDATED REAL ESTATE AFFILIATES
FUND EQUITY IN INCOME OF UNCONSOLIDATED REAL ESTATE AFFILIATES
F-20
December 31, 2010 December 31, 2009
Members’ equity $ 20,992 $ 22,665 Less: other members’ equity (8,217) (8,157) Basis differential in investment in unconsolidated real estate
affiliates, net (a) 14,900 15,343
Investments in unconsolidated real estate affiliates $ 27,675 $ 29,851
(a) The basis differential in investment in the equity of the unconsolidated real estate affiliates is attributable to a difference in the fair value of Legacy Village over its historical cost at acquisition plus the Fund’s own acquisition costs for Legacy Village and 111 Sutter Street. The Fund amortizes the basis differential over the lives of the related assets and liabilities that make up the fair value difference, primarily buildings and improvements. In some instances, the useful lives of these assets and liabilities differ from the useful lives being used to amortize the assets and liabilities by the other members. The basis differential allocated to land is not subject to amortization.
Year Ended
December 31, 2010 Year Ended
December 31, 2009 Year Ended
December 31, 2008
Total revenues $ 30,875 $ 28,292 $ 32,990 Total operating expenses 23,382 20,692 22,301
Operating income 7,493 7,600 10,689 Total other expenses 9,872 8,652 8,775
Net (loss) income $ (2,379) $ (1,052) $ 1,914
Year Ended
December 31, 2010 Year Ended
December 31, 2009 Year Ended
December 31, 2008
Net (loss) income of unconsolidated real estate affiliates $ (2,379) $ (1,052) $ 1,914
Other members’ share of net loss (income) 663 245 (317) Adjustment for basis differential in investment in
unconsolidated real estate affiliates (228) (197) (367) Other expense from unconsolidated real estate
affiliates (1) (4) — Impairment of investments in unconsolidated real
estate affiliates — (7,269) — Loss on assignment of 18922 Forge Drive (428) — —
Fund equity in (loss) income of unconsolidated real estate affiliates $ (2,373) $ (8,277) $ 1,230

NOTE 6—MORTGAGE NOTES AND OTHER DEBT PAYABLE
Mortgage notes payable have various maturities through 2027 and consist of the following:
F-21
Property
Maturity Date
Fixed /
Floating
Stated Rate
Amount payable as of
December 31,
2010 December 31,
2009
Monument IV at Worldgate September 1, 2011 Fixed 5.29% $ 35,616 $ 36,264 105 Kendall Park Lane September 1, 2012 Fixed 4.92% 12,659 12,9334001 North Norfleet Road March 1, 2013 Fixed 5.60% 24,230 24,230Metropolitan Park North April 1, 2013 Fixed 5.73% 60,480 61,000 36 Research Park Drive July 1, 2013 Fixed 5.60% 10,990 11,050 CHW Medical Office Portfolio November 1, 2013 Fixed 5.75% 16,627 16,949 CHW Medical Office Portfolio November 1, 2013 Fixed 5.75% 14,471 14,752 CHW Medical Office Portfolio November 1, 2013 Fixed 5.75% 14,986 15,276 CHW Medical Office Portfolio March 1, 2014 Fixed 5.79% 32,763 33,377 Stirling Slidell Shopping Centre April 1, 2014 Fixed 5.15% 13,059 13,326 Cabana Beach San Marcos December 1, 2014 Fixed 5.57% 19,404 19,650 Cabana Beach Gainesville December 1, 2014 Fixed 5.57% 48,493 49,108 Campus Lodge Athens December 1, 2014 Fixed 5.57% 13,551 13,723 Campus Lodge Columbia December 1, 2014 Fixed 5.57% 16,137 16,341 The Edge at Lafayette February 1, 2015 Fixed 5.57% 17,281 17,466 4 Research Park Drive March 1, 2015 Fixed 6.05% 6,794 6,966 Marketplace at Northglenn January 1, 2016 Fixed 5.50% 61,984 62,894 Campus Lodge Tampa October 1, 2016 Fixed 5.95% 33,500 33,500 Station Nine Apartments May 1, 2017 Fixed 5.50% 36,885 36,885 The District at Howell Mill June 1, 2017 Fixed 6.14% 10,000 10,000 Canyon Plaza June 1, 2017 Fixed 5.90% 29,883 30,289 Railway Street Corporate Centre (1) September 1, 2017 Fixed 5.16% 29,547 28,270 The District at Howell Mill March 1, 2027 Fixed 5.30% 35,000 35,000 9800 South Meridian (2) — Floating LIBOR + 3.50% — 13,611 18922 Forge Drive (2) — Fixed 6.24% — 19,050 Georgia Door Sales Distribution Center (3) — Fixed 5.31% — 4,948
TOTAL MORTGAGE NOTES OF HELD FOR USE PROPERTIES $ 594,340 $ 636,858
Line of Credit — Floating 2.24% — 17,500 Other debt payable — Fixed 7.00% — 1,050 Net debt discount on assumed debt (1,536) (1,322)
MORTGAGE NOTES AND OTHER DEBT PAYABLE, NET $ 592,804 $ 654,086
25850 S. Ridgeland (4) — Fixed 5.05% $ — $ 15,749Havertys Furniture (4) — Fixed 5.23% — 16,582Havertys Furniture (4) — Fixed 6.19% — 10,101
TOTAL MORTGAGE NOTES OF HELD FOR SALE PROPERTIES $ — $ 42,432
(1) This loan is denominated in Canadian dollars, but is reported in US dollars at the exchange rate in effect on the balance sheet date.
(2) This property and its related loan were deconsolidated January 1, 2010 (see Note 4) and then assigned to our operating partner on September 30, 2010 (see Note 5).
(3) The loan associated with this property was paid off using proceeds from properties sold April 15, 2010 resulting in a loss on early debt retirement of $73.
(4) The loan associated with this property was designated as held for sale on December 15, 2009.

We have recognized a premium or discount on debt we assumed with the following property acquisitions, the remaining premium or discount is as follows:
Aggregate principal payments of mortgage notes payable as of December 31, 2010 are as follows:
Land, buildings, equipment, and acquired intangible assets related to the mortgage notes payable, with an aggregate cost of approximately $955,000 and $1,071,000 at December 31, 2010 and 2009, respectively, have been pledged as collateral.
Covenants At December 31, 2010, we were in compliance with all debt covenants.
Line of Credit / Term Loan On February 19, 2010, we replaced our existing line of credit with a $17,000 term loan with a $6,000 letter of credit sub-limit
provided by PNC Bank, National Association. The term loan bore interest at LIBOR plus 3.75%, with a LIBOR floor of 1.00%. The term loan required quarterly principal amortization of $2,125 and could be prepaid without penalty. We fully paid the term loan on November 19, 2010.
Our previous $50,000 line of credit agreement, which expired in February 2010, was provided by PNC Bank, National Association BMO Capital Markets Financing, Inc. and Bank of America, N.A. (“BANA”), an affiliate of the Manager. The line of credit carried an interest rate that approximates LIBOR plus 1.50% to 2.00% based on certain covenant provisions or a base rate which was the greater of (i) the interest rate per annum announced from time to time by the lender, as its prime rate or (ii) the Federal Funds effective rate plus 0.75%. We had $17,500 borrowed at 2.24% at December 31, 2009.
NOTE 7—COMMON STOCK Share Price Calculation
The Current Share Price of the Common Stock (the “Current Share Price”) is established quarterly based on the following valuation methodology, which may be modified from time to time by our board of directors.
F-22
Property Debt Premium /
(Discount) Effective
Interest Rate
CHW Medical Office Portfolio $ 837 5.41% Stirling Slidell Shopping Centre (121) 5.57% 4 Research Park Drive (9) 6.17% The District at Howell Mill (3,137) 6.34% Canyon Plaza (165) 6.10% Campus Lodge Tampa 1,059 5.95%
Net debt discount on assumed debt $ (1,536)
Year Amount
2011 $ 41,930 2012 19,835 2013 143,618 2014 140,016 2015 25,677 Thereafter 223,264
Total $594,340

Net Asset Value Calculation. The NAV of the Fund is determined as of the end of each of the first three quarters of a fiscal year, within 45 calendar days following the end of such quarter. The Fund’s year-end NAV is determined after the completion of our year-end audit. NAV is determined as follows: (i) the aggregate fair value of (A) our interests in real estate investments (“Investments”) plus (B) all other assets of the Fund, minus (ii) the aggregate fair value of our indebtedness and other outstanding obligations as of the determination date.
We identify and retain independent third-party real estate appraisal firms that appraise each Investment not less than annually beginning one year after acquisition. During the first three quarters after acquisition, the Investment will be carried at capitalized cost and reviewed quarterly for material events at the property or market level that may require an adjustment of the Investment’s valuation.
For each of the three quarters following the independent appraisal of a particular Investment, we are responsible for determining the value of such Investment based on our review of the appraisal and material changes at the property or market level. We are also responsible for determining the value of the indebtedness related to each Investment beginning one year after acquisition of the encumbered property and on a quarterly basis thereafter.
Current Share Price Calculation. The Current Share Price equals the NAV as of the end of each quarter divided by the number of outstanding shares of all classes of common stock of the Fund at the end of such quarter.
Stock Subscriptions We have historically and may in the future sell additional Shares through private placements to accredited investors when and if
market conditions permit. All subscriptions are subject to the receipt of cleared funds from the investor prior to the applicable subscription date in the full amount of the subscription. The subscription amount paid by each prospective investor for Shares in the Fund will initially be held in an escrow account at an independent financial institution outside the Fund, for the benefit of the investors until such time as the funds are drawn into the Fund to purchase Shares at the Current Share Price (as defined under the heading “Current Share Price Calculation” in Item 5 of this Form 10-K). Subscription funds will be held in the escrow account for no more than 100 days before we are required to issue the subscribed Shares. At December 31, 2010 and December 31, 2009, no subscription commitments were held in escrow. For the year ended December 31, 2010, we sold no Shares. For the year ended December 31, 2009 we sold 63,871 Shares for $5,991 to subscribers whose funds were held in the escrow account. Subscription commitments for the issuance of new Shares held in escrow are not included in our balance sheets.
Share Repurchase Program Tender Offers. Pursuant to our Share Repurchase Program (the “Repurchase Program”), we may provide limited liquidity to our
stockholders by conducting tender offers pursuant to which we would offer to repurchase a specific percentage, number or dollar amount of outstanding Shares (“Tender Offer Amount”). The Tender Offer Amount for each tender offer, if any, will depend on a variety of factors, including our available liquidity, available borrowing under our credit facility and the amount of proceeds from our most recent offering of Shares, if any. Such determinations will be made by our board of directors prior to each tender offer and will be communicated to stockholders.
No Obligation to Repurchase Shares We will only offer to repurchase Shares through tender offers and then only to the extent that we have sufficient cash available
to repurchase Shares consistent with principles of prudent portfolio management and to the extent that such repurchases (i) are consistent with applicable REIT rules and federal securities laws and (ii) would not require the Fund to register as an investment company under the Investment Company Act. We do
F-23

not guarantee, however, that sufficient cash will be available at any particular time to fund repurchases of our Shares, and we will be under no obligation to conduct such tender offers or to make such cash available. In determining the Tender Offer Amount, we will act in the best interest of the stockholders and may take into account our need for cash to pay operating expenses, debt service, distributions to stockholders and other obligations. We did not conduct any tender offers during 2010 and 2009, and, in order to preserve cash given the current market environment, the Fund does not intend to repurchase shares for the immediate future.
Dividend Reinvestment Plan Stockholders may participate in a dividend reinvestment plan under which all dividends will automatically be reinvested in
additional Shares. The number of Shares issued under the dividend reinvestment plan will be determined based on the Current Share Price as of the reinvestment date. For the year ended December 31, 2010, we did not issue Shares under the dividend reinvestment plan. For the year ended December 31, 2009 we issued 39,201 Shares for approximately $3,446 under the plan.
Earnings Per Share (“EPS”) Basic per share amounts are based on the weighted average of shares outstanding of 4,135,635, 4,128,290 and 3,822,484 for the
years ended December 31, 2010, 2009 and 2008, respectively. We have no dilutive or potentially dilutive securities.
Dividends Earnings and profits, which determine the taxability of dividends to stockholders, will differ from income reported for financial
reporting purposes due to the differences for federal income tax purposes in the treatment of revenue and expense recognition, the estimated useful lives used to compute depreciation, and gains on the sale of real property.
The tax treatment of common dividends per share for federal income tax purposes is as follows:
NOTE 8—RENTALS UNDER OPERATING LEASES
We receive rental income from operating leases. The minimum future rentals from consolidated properties, including those listed as held for sale, based on operating leases in place at December 31, 2010 are as follows:
F-24
For the year ended December 31, 2010 2009 2008 Per Share % Per Share % Per Share %
Ordinary income —
— — — — —
Capital gains —
— — — — —
Return of capital —
— $ 2.625 100% $ 7.00 100%
Total —
— $ 2.625 100% $ 7.00 100%
Year Amount (1)
2011 $ 65,228 2012 35,988 2013 29,075 2014 24,271 2015 20,877 Thereafter 43,165
Total $218,604
(1) Amounts included related to Railway Street Corporate Centre have been converted from Canadian dollars to U.S. dollars using the appropriate exchange rate as of December 31, 2010.

Minimum future rentals do not include amounts payable by certain tenants based upon a percentage of their gross sales or as reimbursement of property operating expenses.
During the year ended December 31, 2010, 2009 and 2008, no individual tenant accounted for greater than 10% of minimum base rents.
The majority of the change from 2011 future rents to 2012 is the related to our apartment properties which usually have a one year lease life.
NOTE 9—RELATED PARTY TRANSACTIONS Under the terms of the Management and Advisory Agreements, we paid each of the Manager and Advisor an annual fixed fee
equal to 0.75% of the Fund’s net asset value (“NAV), calculated quarterly. Effective January 1, 2010, the Manager’s fixed fee was reduced from 0.75% of NAV to 0.10% of NAV. The fixed portion of the management and advisory fees for the years ended December 31, 2010, 2009 and 2008 were $1,868, $4,792 and $7,122, respectively. Included in Manager and Advisor fees payable at December 31, 2010 and 2009 was $468 and $1,017, respectively, of fixed fee expense.
To the extent that the Fund builds a cash reserve generated by capital raised through the sale of Shares to stockholders, the Manager and Advisor have agreed to waive 1.0% of their combined 1.5% fixed fee expense on that cash reserve to reduce the dilutive impact to stockholders created by maintaining cash reserves.
Under the terms of the Management and Advisory Agreements, we pay the Manager and Advisor an aggregate annual variable fee equal to 7.50% of the Variable Fee Base Amount based on cash flows, as defined in the Advisory Agreement, calculated quarterly. The Manager will be allocated an increasing proportion of the variable fee to the extent the Fund’s NAV increases, up to a maximum of 1.87% of the 7.50% fee paid to the Manager and the Advisor as the Fund’s NAV increases, up to a maximum of 1.87% of the 7.50% fee paid to the Manager and the Advisor if the Fund’s NAV is $850,000 or more. Effective January 1, 2010, the Manager waived its participation in the variable fee. The total variable fee for the years ended December 31, 2010, 2009 and 2008 was $1,396, $1,621 and $1,913, respectively. Included in manager and advisor fees payable at December 31, 2010 and 2009 was $252 and $388 of variable fee expense.
The Advisor receives an acquisition fee of 0.50% of the acquisition cost of each property acquired for us. Total acquisition fees for the years ended December 31, 2010, 2009 and 2008 were $0, $9 and $357, respectively. There were no acquisition fees included in manager and advisory fees payable at December 31, 2010 and 2009, respectively. The Advisor may pay certain third-party due diligence costs related to acquisitions or unsuccessful acquisitions, which are reimbursable by us. Total reimbursed due diligence costs related to successful investments made by us and unsuccessful acquisitions for the years ended December 31, 2010, 2009 and 2008 were $0, $0 and $243, respectively. There were no reimbursable due diligence costs included in accounts payable and other accrued expenses at December 31, 2010 and 2009, respectively. Beginning January 1, 2009, acquisition fees and due diligence costs for acquisitions were expensed as incurred. The Advisor does not receive a disposition fee for selling real estate investments.
On December 23, 2004, we entered into an expense limitation agreement (the “Expense Limitation Agreement”), which limits certain Fund expenses to 0.75% of NAV annually. The expenses subject to the limitation include fees paid to the various professional service providers, auditors, stockholder administrator, legal counsel related to the organization of the Fund or share offering, printing costs, mailing costs, fees associated with our board of directors, cost of maintaining directors and officers insurance, blue sky fees and all Fund-level organizational costs. Expenses in excess of the limitation will be carried forward for up to three years and may be reimbursed to the Manager in a year that Fund expenses are less than 0.75% of NAV, but only to the extent Fund expenses do not exceed the expense limitation. Fund expenses for the years ended December 31, 2010, 2009 and 2008 were limited to $1,648, $2,396 and $3,511, respectively. Actual Fund level expenses for the
F-25

year ended December 31, 2010 were $136 more than the amount allowed under the Expense Limitation Agreement and will be the responsibility of the Manager. The Expense Limitation Agreement expired on December 31, 2010, going forward, the Fund will be responsible for all expenses as incurred. Expenses subject to the Expense Limitation Agreement are included in the Fund level expenses line on the consolidated statements of operations along with certain other Fund level expenses not subject to the expense limitation agreement, such as expenses related to unsuccessful acquisitions and filing fees.
Jones Lang LaSalle Americas, Inc. (“JLL”), an affiliate of LaSalle, is paid for property management services performed at Monument IV at Worldgate, The District at Howell Mill, 4 Research Park Drive and 36 Research Park Drive. For the years ended December 31, 2010, 2009 and 2008, JLL was paid $165, $167 and $147, respectively, for property management services performed. In 2008, JLL was paid $61 in loan placement fees related to the mortgage debt on The Edge at Lafayette. JLL has been hired to perform leasing services for Canyon Plaza and 111 Sutter on a contingent fee basis. JLL was paid $137, $60 and $36 for leasing services for the years ending December 31, 2010, 2009 and 2008, respectively.
Merrill Lynch, Pierce, Fenner & Smith Incorporated (“MLPF&S”), an affiliate of the Manager, is the placement agent for the Fund. The placement agent receives no compensation from us for its services, but may receive compensation in the form of a placement fee from the purchasing shareholders. MLPF&S’s primary business address is: 4 World Financial Center, 250 Vesey Street, New York, NY 10080-6186. MLPF&S is an indirect, wholly-owned subsidiary of Bank of America Corporation (“BAC”).
The Fund has mortgage notes payable to BAC, an affiliate of the Manager, collateralized by Monument IV at Worldgate and Station Nine Apartments. BANA was the lender on up to $7,143 of the Fund’s old line of credit, which expired in February 2010. Interest and fees paid to BAC and BANA related to the loans for the year ended December 31, 2010, 2009 and 2008 were $3,998, $4,067 and $4,255, respectively. Included in mortgage notes and other debt payable at December 31, 2010 and 2009 was approximately $72,501 and $75,649 of debt payable to BAC and BANA, respectively.
NOTE 10—COMMITMENTS AND CONTINGENCIES The CHW Medical Office Portfolio mortgage debt requires that we deposit an annual amount of $855, up to a cumulative
maximum of $1,900, into an escrow account to fund future tenant improvements and leasing commissions. The amount of the escrow funded by each of the fifteen buildings in the portfolio is capped individually pursuant to each loan agreement. At December 31, 2010, we had approximately $1,046 deposited in this escrow, and we expect to fund approximately $855 during 2011. Additionally, we are required to deposit approximately $151 per year into an escrow account to fund capital expenditures. At December 31, 2010, our capital account escrow account balance was $359. These escrow accounts allow us to withdraw funds as we incur costs related to tenant improvements, leasing commissions and capital expenditures. Additionally, monthly we are required to fund an escrow account for the future payment of real estate taxes and insurance costs in an amount equal to 1/12 of the estimated insurance premium and real estate taxes. At December 31, 2010, our insurance and real estate tax escrow balance was $748. We expect to fund the escrow requirements with operating cash flows generated by the portfolio.
The mortgage loan collateralized by Metropolitan Park North required that on April 1, 2009 we post a $3,900 reserve in escrow to cover costs of certain tenant improvements, leasing commissions, rent concessions, and lost rental income in connection with re-leasing space currently occupied by Nordstrom, a major anchor tenant of the building. We satisfied this reserve requirement with a letter of credit, which was posted on March 23, 2009. Since Nordstrom has determined they will not renew their lease at Metropolitan Park North, we were obligated to post an additional $2,800 reserve into the escrow on September 30, 2010. We did not post the $2,800 reserve and have received an extension through February 9, 2011. See Note 12 regarding an amendment to the mortgage loan.
F-26
th

The mortgage loan collateralized by Monument IV at Worldgate requires that, should Fannie Mae, the sole tenant at this property, not renew its lease or the space not be leased to a new tenant(s), the Fund must reserve all rental payments received from Fannie Mae at the earlier of September 1, 2010 or upon the tenant delivering a notice of its intent not to renew the lease. We had not received Fannie Mae’s notice of intent to renew at September 1, 2010, and cash totaling $978 have been reserved in restricted cash. We expect to fund approximately $2,316 during 2011. The lender will return the reserve to the Fund if the following conditions are met: (1) no default has occurred and remains outstanding; and (2) either the tenant has renewed its lease or the space has been re-leased to a new tenants(s).
The debt associated with six of the Fund’s student-oriented apartment communities requires that we deposit a total of $224 per year into a replacement reserve to fund future furniture replacement costs. As of December 31, 2010, we had deposited approximately $191 into this escrow. We expect to fund the loan escrows from property operations. These reserve accounts allow us to withdraw funds as we incur costs related to furniture replacement.
As part of the lease with our single tenant at the 4001 North Norfleet Road property, we provided the tenant a right to expand thecurrent building by up to 286,000 square feet of space. If the tenant exercises this right, we will be obligated to construct this expansion space. The tenant has the right to notify us of their desire to expand at any time prior to February 28, 2016, (the end of the ninth year of the lease), or if the lease is extended, until any time prior to the end of the fourth year of any extension. As of December 31, 2010, we have not received an expansion notice from the tenant.
NOTE 11—QUARTERLY FINANCIAL INFORMATION
EXCELSIOR LASALLE PROPERTY FUND, INC. QUARTERLY FINANCIAL INFORMATION
(UNAUDITED)
F-27
Three MonthsEnded
March 31, 2010
Three MonthsEnded
June 30, 2010
Three Months Ended
September 30, 2010
Three MonthsEnded
December 31, 2010
Total revenues $ 23,841 $ 23,975 $ 23,907 $ 23,972 Operating income 7,306 7,274 5,296 (21,580) Loss from continuing operations (1,825) (1,781) (4,164) (31,283) Total Income from discontinued operations 2,012 311 — — Net income (loss) attributable to Excelsior
LaSalle Property Fund, Inc. 438 (1,196) (3,635) (31,247) Net loss attributable to Excelsior LaSalle
Property Fund, Inc. per share-basic and diluted $ 0.11 $ (0.29) $ (0.88) $ (7.56)
Weighted average common stock outstanding-basic and diluted 4,135,635 4,135,635 4,135,635 4,135,635
Three MonthsEnded
March 31, 2009
Three MonthsEnded
June 30, 2009
Three Months Ended
September 30, 2009
Three MonthsEnded
December 31, 2009
Total revenues $ 24,621 $ 23,900 $ 24,051 $ 24,336 Operating income 4,477 4,357 3,526 (2,344) Loss from continuing operations (4,035) (9,554) (5,483) (14,036) Total Income (loss) from discontinued
operations 466 1,034 (4,554) (5,654) Net loss attributable to Excelsior LaSalle
Property Fund, Inc. (3,305) (8,141) (8,775) (19,390) Net loss attributable to Excelsior LaSalle
Property Fund, Inc. per share-basic and diluted $ (0.81) $ (1.97) $ (2.12) $ (4.69)
Weighted average common stock outstanding-basic and diluted 4,110,725 4,130,811 4,135,635 4,135,635

All significant fluctuations between the quarters are attributable to dispositions made in 2010 and 2009, impairment charges taken during 2010 and 2009 as well as the deconsolidation of 9800 South Meridian and 18922 Forge Drive.
NOTE 12—SUBSEQUENT EVENTS On February 9, 2011, we amended the mortgage loan collateralized by Metropolitan Park North. The terms of the modification
include an agreement to sweep all future cash flow to the lender. Additionally, the borrower, a wholly owned entity of ours, was released from its obligation to post a $2,800 letter of credit (see Note 10). Other amendments include changing the loan to interest only until February 1, 2012, and granting the lender certain approval rights over various operating decisions.
* * * * * *
F-28
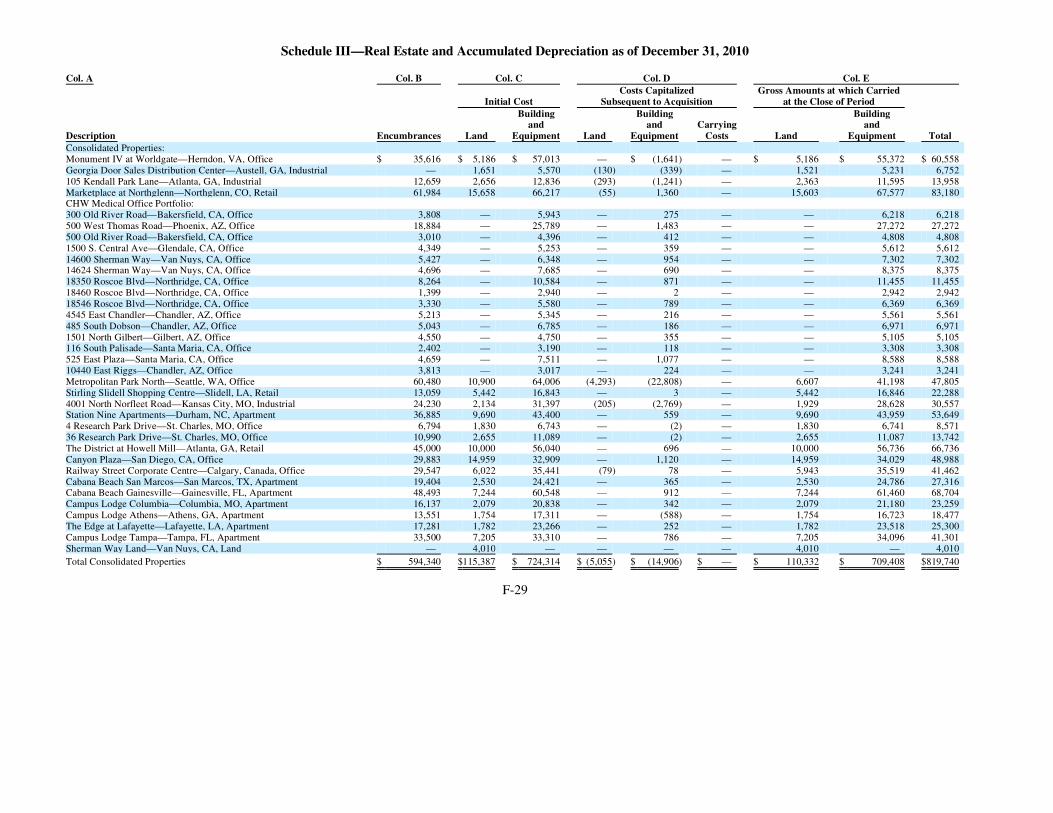
Schedule III—Real Estate and Accumulated Depreciation as of December 31, 2010
F-29
Col. A Col. B Col. C Col. D Col. E
Description
Encumbrances
Initial Cost Costs Capitalized
Subsequent to Acquisition Gross Amounts at which Carried
at the Close of Period
Total Land
Buildingand
Equipment Land
Building and
Equipment Carrying
Costs Land
Buildingand
Equipment Consolidated Properties: Monument IV at Worldgate—Herndon, VA, Office $ 35,616 $ 5,186 $ 57,013 — $ (1,641) — $ 5,186 $ 55,372 $ 60,558 Georgia Door Sales Distribution Center—Austell, GA, Industrial — 1,651 5,570 (130) (339) — 1,521 5,231 6,752 105 Kendall Park Lane—Atlanta, GA, Industrial 12,659 2,656 12,836 (293) (1,241) — 2,363 11,595 13,958 Marketplace at Northglenn—Northglenn, CO, Retail 61,984 15,658 66,217 (55) 1,360 — 15,603 67,577 83,180 CHW Medical Office Portfolio: 300 Old River Road—Bakersfield, CA, Office 3,808 — 5,943 — 275 — — 6,218 6,218 500 West Thomas Road—Phoenix, AZ, Office 18,884 — 25,789 — 1,483 — — 27,272 27,272 500 Old River Road—Bakersfield, CA, Office 3,010 — 4,396 — 412 — — 4,808 4,808 1500 S. Central Ave—Glendale, CA, Office 4,349 — 5,253 — 359 — — 5,612 5,612 14600 Sherman Way—Van Nuys, CA, Office 5,427 — 6,348 — 954 — — 7,302 7,302 14624 Sherman Way—Van Nuys, CA, Office 4,696 — 7,685 — 690 — — 8,375 8,375 18350 Roscoe Blvd—Northridge, CA, Office 8,264 — 10,584 — 871 — — 11,455 11,455 18460 Roscoe Blvd—Northridge, CA, Office 1,399 — 2,940 — 2 — — 2,942 2,942 18546 Roscoe Blvd—Northridge, CA, Office 3,330 — 5,580 — 789 — — 6,369 6,369 4545 East Chandler—Chandler, AZ, Office 5,213 — 5,345 — 216 — — 5,561 5,561 485 South Dobson—Chandler, AZ, Office 5,043 — 6,785 — 186 — — 6,971 6,971 1501 North Gilbert—Gilbert, AZ, Office 4,550 — 4,750 — 355 — — 5,105 5,105 116 South Palisade—Santa Maria, CA, Office 2,402 — 3,190 — 118 — — 3,308 3,308 525 East Plaza—Santa Maria, CA, Office 4,659 — 7,511 — 1,077 — — 8,588 8,588 10440 East Riggs—Chandler, AZ, Office 3,813 — 3,017 — 224 — — 3,241 3,241 Metropolitan Park North—Seattle, WA, Office 60,480 10,900 64,006 (4,293) (22,808) — 6,607 41,198 47,805 Stirling Slidell Shopping Centre—Slidell, LA, Retail 13,059 5,442 16,843 — 3 — 5,442 16,846 22,288 4001 North Norfleet Road—Kansas City, MO, Industrial 24,230 2,134 31,397 (205) (2,769) — 1,929 28,628 30,557 Station Nine Apartments—Durham, NC, Apartment 36,885 9,690 43,400 — 559 — 9,690 43,959 53,649 4 Research Park Drive—St. Charles, MO, Office 6,794 1,830 6,743 — (2) — 1,830 6,741 8,571 36 Research Park Drive—St. Charles, MO, Office 10,990 2,655 11,089 — (2) — 2,655 11,087 13,742 The District at Howell Mill—Atlanta, GA, Retail 45,000 10,000 56,040 — 696 — 10,000 56,736 66,736 Canyon Plaza—San Diego, CA, Office 29,883 14,959 32,909 — 1,120 — 14,959 34,029 48,988 Railway Street Corporate Centre—Calgary, Canada, Office 29,547 6,022 35,441 (79) 78 — 5,943 35,519 41,462 Cabana Beach San Marcos—San Marcos, TX, Apartment 19,404 2,530 24,421 — 365 — 2,530 24,786 27,316 Cabana Beach Gainesville—Gainesville, FL, Apartment 48,493 7,244 60,548 — 912 — 7,244 61,460 68,704 Campus Lodge Columbia—Columbia, MO, Apartment 16,137 2,079 20,838 — 342 — 2,079 21,180 23,259 Campus Lodge Athens—Athens, GA, Apartment 13,551 1,754 17,311 — (588) — 1,754 16,723 18,477 The Edge at Lafayette—Lafayette, LA, Apartment 17,281 1,782 23,266 — 252 — 1,782 23,518 25,300 Campus Lodge Tampa—Tampa, FL, Apartment 33,500 7,205 33,310 — 786 — 7,205 34,096 41,301 Sherman Way Land—Van Nuys, CA, Land — 4,010 — — — — 4,010 — 4,010
Total Consolidated Properties $ 594,340 $115,387 $ 724,314 $ (5,055) $ (14,906) $ — $ 110,332 $ 709,408 $819,740

Schedule III—Real Estate and Accumulated Depreciation as of December 31, 2010—(Continued)
F-30
Col. A Col. F Col. G Col. H Col. I
Description AccumulatedDepreciation
Date ofConstruction
Date of Acquisition
Life on whichdepreciation
in latest income
statement iscomputed
Consolidated Properties:
Monument IV at Worldgate—Herndon, VA, Office $ 6,883 2001 8/27/2004 50 years Georgia Door Sales Distribution Center—Austell, GA, Industrial 632 1994/1996 2/10/2005 50 years 105 Kendall Park Lane—Atlanta, GA, Industrial 1,334 2002 6/30/2005 50 years Marketplace at Northglenn—Northglenn, CO, Shopping Center 6,786 1999-2001 12/21/2005 50 years CHW Medical Office Portfolio:
300 Old River Road—Bakersfield, CA, Office 788 1992 12/21/2005 40 years 500 West Thomas Road—Phoenix, AZ, Office 3,968 1994 12/21/2005 40 years 500 Old River Road—Bakersfield, CA, Office 669 1992 12/21/2005 40 years 1500 S. Central Ave—Glendale, CA, Office 798 1980 12/21/2005 40 years 14600 Sherman Way—Van Nuys, CA, Office 1,064 1991 12/21/2005 40 years 14624 Sherman Way—Van Nuys, CA, Office 1,131 1981 12/21/2005 40 years 18350 Roscoe Blvd—Northridge, CA, Office 1,606 1979 12/21/2005 40 years 18460 Roscoe Blvd—Northridge, CA, Office 367 1991 12/21/2005 40 years 18546 Roscoe Blvd—Northridge, CA, Office 811 1991 12/21/2005 40 years 4545 East Chandler—Chandler, AZ, Office 753 1994 12/21/2005 40 years 485 South Dobson—Chandler, AZ, Office 917 1984 12/21/2005 40 years 1501 North Gilbert—Gilbert, AZ, Office 659 1997 12/21/2005 40 years 116 South Palisade—Santa Maria, CA, Office 449 1995 12/21/2005 40 years 525 East Plaza—Santa Maria, CA, Office 1,381 1995 12/21/2005 40 years 10440 East Riggs—Chandler, AZ, Office 423 1996 12/21/2005 40 years Metropolitan Park North—Seattle, WA, Office 6,081 2001 3/28/2006 50 years Stirling Slidell Shopping Centre—Slidell, LA, Shopping Center 1,376 2003 12/14/2006 50 years 4001 North Norfleet Road—Kansas City, MO, Industrial 2,212 2007 2/27/2007 50 years Station Nine Apartments—Durham, NC, Apartment 3,381 2005 4/16/2007 50 years 4 Research Park Drive—St. Charles, MO, Office 483 2000/2004 6/13/2007 50 years 36 Research Park Drive—St. Charles, MO, Office 795 2007 6/13/2007 50 years The District at Howell Mill—Atlanta, GA, Retail 4,065 2006 6/15/2007 50 years Canyon Plaza—San Diego, CA, Office 3,069 1986/1993 6/26/2007 40 years Railway Street Corporate Centre—Calgary, Canada, Office 2,367 2007 8/30/2007 50 years Cabana Beach San Marcos—San Marcos, TX, Apartment 3,682 2006 11/21/2007 50 years Cabana Beach Gainesville—Gainesville, FL, Apartment 7,779 2005/2007 11/21/2007 50 years Campus Lodge Columbia—Columbia, MO, Apartment 3,070 2005 11/21/2007 50 years Campus Lodge Athens—Athens, GA, Apartment 1,091 2003 11/21/2007 50 years The Edge at Lafayette—Lafayette, LA, Apartment 2,603 2007 1/15/2008 50 years Campus Lodge Tampa—Tampa, FL, Apartment 2,555 2001 2/29/2008 40 years Sherman Way Land—Van Nuys, CA, Land — — 8/28/2009 —
Total Consolidated Properties $ 76,028

Reconciliation of Real Estate
Reconciliation of Accumulated Depreciation
F-31
Consolidated Properties 2010 2009
Balance at beginning of year $875,527 $961,915 Additions 2,873 6,136 Deductions (1,594) (1,182) Write-downs for impairment charges (25,763) (17,308) Changes related to foreign currency 1,792 5,766 Dispositions — (34,550) Reclassified as held for sale — (45,250) Deconsolidation (33,095) —
Balance at close of year $819,740 $875,527
Consolidated Properties 2010 2009
Balance at beginning of year $60,307 $44,888 Additions 19,429 22,575 Deductions (1,594) (1,182) Changes related to foreign currency 91 189 Dispositions — (2,093) Reclassified as held for sale — (4,070) Deconsolidation (2,205) —
Balance at close of year $76,028 $60,307

Exhibit 21
ELPF Subsidiaries as of March 3, 2011
State or Jurisdiction orIncorporation
PercentOwned by the
Fund
Excelsior LaSalle Property Fund Inc. Maryland 100.00% Legacy Village Holdings III LLC Delaware 100.00% Legacy Village Holdings II LLC Delaware 100.00% Legacy Village Holdings LLC Delaware 100.00%
Legacy Village Investors LLC Delaware 46.50% Village Valet, LLC Delaware 46.50%
MIVPO Member LLC Delaware 100.00% MIVPO LLC Delaware 100.00%
ELPF Atlanta Member LLC Delaware 100.00% ELPF Jackson LLC Delaware 100.00% ELPF Cobb LLC Delaware 100.00%
LaSalle Monee Purchaser LLC Delaware 100.00% LaSalle Monee Lender LLC Delaware 100.00% ELPF / Sutter Holdings, LLC Delaware 100.00%
CEP XII Investors LLC Delaware 80.00% ELPF Kendall LLC Delaware 100.00% ELPF Northglenn Member LLC Delaware 100.00%
ELPF Northglenn LLC Delaware 100.00% ELPF Medical Holdings LLC Delaware 100.00%
ELPF Acquisitions #1 partners LLC Delaware 100.00% ELPF Chandler 485 South Dobson LLC Delaware 100.00% ELPF Northridge 18350 Roscoe LLC Delaware 100.00% ELPF Phoenix 4545 East Chandler LLC Delaware 100.00% ELPF Van Nuys 14624 Sherman LLC Delaware 100.00% ELPF Bakersfield 500 Old River LLC Delaware 100.00% ELPF Gilbert 1501 North Gilbert LLC Delaware 100.00% ELPF Northridge 18546 Roscoe LLC Delaware 100.00% ELPF Sun Lakes 10440 East Riggs LLC Delaware 100.00% ELPF Phoenix 500 West Thomas LLC Delaware 100.00% ELPF Santa Maria 116 South Palisade LLC Delaware 100.00% ELPF Glendale 1500 South Central LLC Delaware 100.00% ELPF Northridge 18460 Roscoe LLC Delaware 100.00% ELPF Van Nuys 14600 Sherman LLC Delaware 100.00% ELPF Bakersfield 300 Old River LLC Delaware 100.00% ELPF Santa Maria 525 East Plaza LLC Delaware 100.00% ELPF Sherman Way Parking LLC Delaware 100.00%
ELPF Met Park North LLC Delaware 100.00% ELPF Slidell Member, Inc. Delaware 100.00% ELPF Slidell LLC Delaware 100.00% ELPF Slidell Manager Inc. Delaware 100.00% ELPF Meridian LLC Delaware 90.00% ELPF Norfleet LLC Delaware 100.00% ELPF Station Nine LLC. Delaware 100.00% ELPF Missouri Research Park I LLC Delaware 100.00% ELPF Missouri Research Park II LLC Delaware 100.00% ELPF Howell Mill LLC Delaware 100.00% ELPF Scranton Road LP Delaware 100.00% ELPF Railway GP Inc. Alberta 100.00%

ELPF Railway LP Delaware 100.00% ELPF Canada Investors GP Inc. Delaware 100.00% ELPF Canada Investors LP Delaware 100.00% ELPF Canada Trust Delaware 100.00% ELPF 6807 Railway Street Inc Alberta 100.00% ELPF 6807 Railway Street Leasehold ULC Alberta 100.00% Holding Gainesville LLC Delaware 78.00% Investor Gainesville LLC Delaware 100.00% ELPF Gainesville LLC Delaware 100.00% Holding Athens LLC Delaware 78.00% Investor Athens LLC Delaware 100.00% ELPF Athens LLC Delaware 100.00% Holding Columbia LLC Delaware 78.00% Investor Columbia LLC Delaware 100.00% ELPF Columbia LLC Delaware 100.00% Holding San Marcos LLC Delaware 78.00% Investor San Marcos LLC Delaware 100.00% ELPF San Marcos LLC Delaware 100.00% ELPF Tampa Holding LLC Delaware 100.00% ELPF Tampa LLC Delaware 78.00% ELPF Lafayette Subsidiary, Inc. Delaware 100.00% Holding Lafayette LLC Delaware 78.00% ELPF Lafayette Member LLC Delaware 78.00% ELPF Lafayette LLC Delaware 78.00%

Exhibit 31.1
CERTIFICATION OF CHIEF EXECUTIVE OFFICER PURSUANT TO SECTION 302 OF THE SARBANES-OXLEY ACT OF 2002
I, James D. Bowden, certify that: 1. I have reviewed this annual report on Form 10-K of Excelsior LaSalle Property Fund, Inc.;
2. Based on my knowledge, this report does not contain any untrue statement of a material fact or omit to state a material fact necessary to make the statements made, in light of the circumstances under which such statements were made, not misleading with respect to the period covered by this report;
3. Based on my knowledge, the financial statements, and other financial information included in this report, fairly present in all material respects the financial condition, results of operations and cash flows of the registrant as of, and for, the periods presented in this report;
4. The registrant’s other certifying officer and I are responsible for establishing and maintaining disclosure controls and procedures (as defined in Exchange Act Rules 13a-15(e) and 15d-15(e)) and internal control over financial reporting (as defined in Exchange Act Rules 13a-15(f) and 15d-15(f)) for the registrant and have:
a) Designed such disclosure controls and procedures, or caused such disclosure controls and procedures to be designed under oursupervision, to ensure that material information relating to the registrant, including its consolidated subsidiaries, is made known to us by others within those entities, particularly during the period in which this report is being prepared; b) Designed such internal control over financial reporting, or caused such internal control over financial reporting to be designed under our supervision, to provide reasonable assurance regarding the reliability of financial reporting and the preparation of financial statements for external purposes in accordance with generally accepted accounting principles. c) Evaluated the effectiveness of the registrant’s disclosure controls and procedures and presented in this report our conclusions about the effectiveness of the disclosure controls and procedures, as of the end of the period covered by this report based on suchevaluation; and d) Disclosed in this report any change in the registrant’s internal control over financial reporting that occurred during the registrant’s most recent fiscal quarter (the registrant’s fourth fiscal quarter in the case of an annual report) that has materially affected, or is reasonably likely to materially affect, the registrant’s internal control over financial reporting; and
5. The registrant’s other certifying officer and I have disclosed, based on our most recent evaluation of internal control over financial reporting, to the registrant’s auditors and the audit committee of the registrant’s board of directors (or persons performing the equivalent functions):
a) All significant deficiencies and material weaknesses in the design or operation of internal control over financial reporting which are reasonably likely to adversely affect the registrant’s ability to record, process, summarize and report financial information; and b) Any fraud, whether or not material, that involves management or other employees who have a significant role in the registrant’s internal control over financial reporting.
Date: March 3, 2011 /s/ JAMES D. BOWDEN
James D. Bowden
President and Chief Executive Officer

Exhibit 31.2
CERTIFICATION OF CHIEF FINANCIAL OFFICER PURSUANT TO SECTION 302 OF THE SARBANES-OXLEY ACT OF 2002
I, Steven Suss, certify that: 1. I have reviewed this annual report on Form 10-K of Excelsior LaSalle Property Fund, Inc.;
2. Based on my knowledge, this report does not contain any untrue statement of a material fact or omit to state a material fact necessary to make the statements made, in light of the circumstances under which such statements were made, not misleading with respect to the period covered by this report;
3. Based on my knowledge, the financial statements, and other financial information included in this report, fairly present in all material respects the financial condition, results of operations and cash flows of the registrant as of, and for, the periods presented in this report;
4. The registrant’s other certifying officer and I are responsible for establishing and maintaining disclosure controls and procedures (as defined in Exchange Act Rules 13a-15(e) and 15d-15(e)) and internal control over financial reporting (as defined in Exchange Act Rules 13a-15(f) and 15d-15(f)) for the registrant and have:
a) Designed such disclosure controls and procedures, or caused such disclosure controls and procedures to be designed under oursupervision, to ensure that material information relating to the registrant, including its consolidated subsidiaries, is made known to us by others within those entities, particularly during the period in which this report is being prepared; b) Designed such internal control over financial reporting, or caused such internal control over financial reporting to be designed under our supervision, to provide reasonable assurance regarding the reliability of financial reporting and the preparation of financial statements for external purposes in accordance with generally accepted accounting principles. c) Evaluated the effectiveness of the registrant’s disclosure controls and procedures and presented in this report our conclusions about the effectiveness of the disclosure controls and procedures, as of the end of the period covered by this report based on suchevaluation; and d) Disclosed in this report any change in the registrant’s internal control over financial reporting that occurred during the registrant’s most recent fiscal quarter (the registrant’s fourth fiscal quarter in the case of an annual report) that has materially affected, or is reasonably likely to materially affect, the registrant’s internal control over financial reporting; and
5. The registrant’s other certifying officer and I have disclosed, based on our most recent evaluation of internal control over financial reporting, to the registrant’s auditors and the audit committee of the registrant’s board of directors (or persons performing the equivalent functions):
a) All significant deficiencies and material weaknesses in the design or operation of internal control over financial reporting which are reasonably likely to adversely affect the registrant’s ability to record, process, summarize and report financial information; and b) Any fraud, whether or not material, that involves management or other employees who have a significant role in the registrant’s internal control over financial reporting.
Date: March 3, 2011 /s/ STEVEN SUSS
Steven Suss
Chief Financial Officer

Exhibit 32.1
CERTIFICATION OF CHIEF EXECUTIVE OFFICER PURSUANT TO SECTION 906 OF THE SARBANES-OXLEY ACT OF 2002
In connection with the Annual Report of Excelsior LaSalle Property Fund, Inc. (the “Fund”) on Form 10-K for the period ending December 31, 2010, as filed with the Securities and Exchange Commission on the date hereof (the “Report”), I, James D. Bowden, in my capacity as Chief Executive Officer of the Fund, do hereby certify, pursuant to 18 U.S.C. Section 1350, as adopted pursuant to Section 906 of the Sarbanes-Oxley Act of 2002, that:
(1) The Report fully complies with the requirements of Section 13(a) or 15(d) of the Securities Exchange Act of 1934; and
(2) The information contained in the Report fairly presents, in all material respects, the financial condition and results of operations of the Fund.
March 3, 2011
/s/ JAMES D. BOWDEN James D. Bowden
President and Chief Executive Officer

Exhibit 32.2
CERTIFICATION OF CHIEF FINANCIAL OFFICER PURSUANT TO SECTION 906 OF THE SARBANES-OXLEY ACT OF 2002
In connection with the Annual Report of Excelsior LaSalle Property Fund, Inc. (the “Fund”) on Form 10-K for the period ending December 31, 2010, as filed with the Securities and Exchange Commission on the date hereof (the “Report”), I, Steven Suss, in my capacity as Chief Financial Officer of the Fund, do hereby certify, pursuant to 18 U.S.C. Section 1350, as adopted pursuant to Section 906 of the Sarbanes-Oxley Act of 2002, that:
(1) The Report fully complies with the requirements of Section 13(a) or 15(d) of the Securities Exchange Act of 1934; and
(2) The information contained in the Report fairly presents, in all material respects, the financial condition and results of operations of the Fund.
March 3, 2011
/s/ STEVEN SUSS Steven Suss
Chief Financial Officer