Embed Size (px)
Citation preview
Exchange Rates, Foreign Capital, and Development
Arvind SubramanianPeterson Institute for International Economics, Center for Global Development, and Johns Hopkins University
XXV Meeting of Latin American Network of Central Banks and Finance Ministries
May 17, 2007
Outline• What is development about?
• Modes of escape from under-development
• Exchange rate, especially avoiding overvaluation, can play a very useful role
• Foreign capital limits the ability to influence real exchange rate
• Other policies for boosting domestic savings?
What is Development?
• Development is ultimately about doing different and more sophisticated (high “value-added”) things
• Important stylized fact: Countries first diversify on their way to development and specialize only later, much later (Imbs and Wacziarg, 2003)
• And doing different things can itself boost growth (virtuous circle)
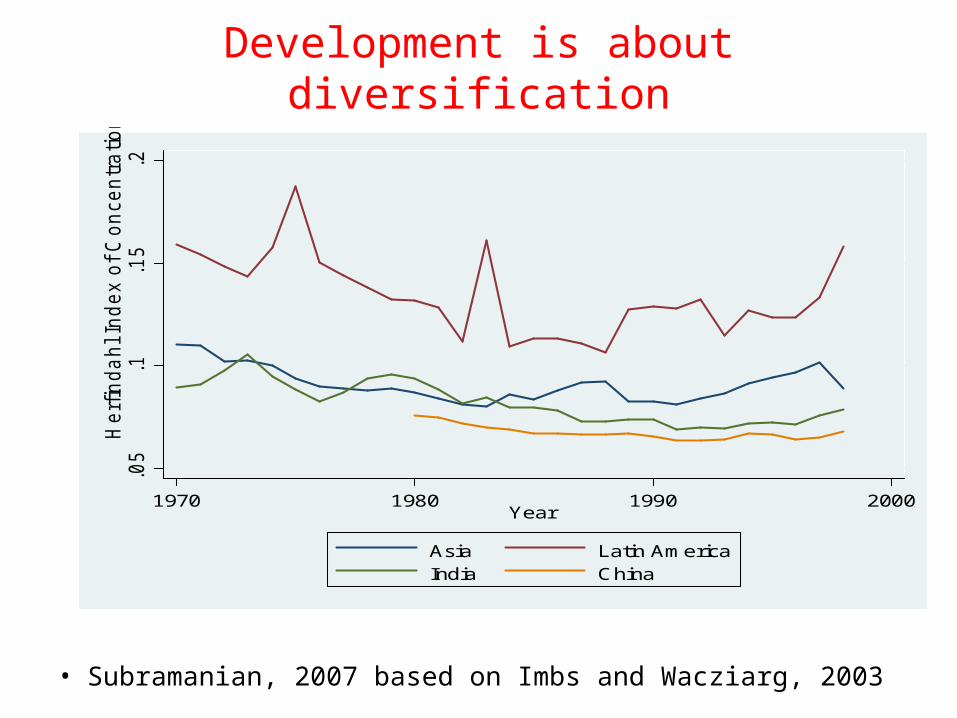
Development is about diversification
.05
.1.1
5.2
Herf
inda
hl In
dex o
f C
on
cen
tra
tion
1970 1980 1990 2000Year
Asia Latin AmericaIndia China
• Subramanian, 2007 based on Imbs and Wacziarg, 2003

And diversification can help growth
• Kochhar et. al., 2006
AP
AS
BH
DL
GJ
HY
JK
KK
KL
MH
MP
OR
PJRJTN
UPWB
0.1
.2.3
.4
Herf
inda
hl In
dex in
198
2
1 2 3 4 5Average annual growth rate of NSDP per capita 1980-2000(%)
Diversification Index

Modes of Escape• Three or four different patterns of escape from
underdevelopment
• Manufacturing– China, East Asia, Mauritius, Tunisia, Chile?
• Services – India
• Commodities (escaping the natural resource curse)– High endowment per capita (Dubai, Saudi Arabia, Brunei,
Kuwait)– Not very high endowment per capita but reasonable initial
institutions (Botswana, Chile?, Indonesia??)
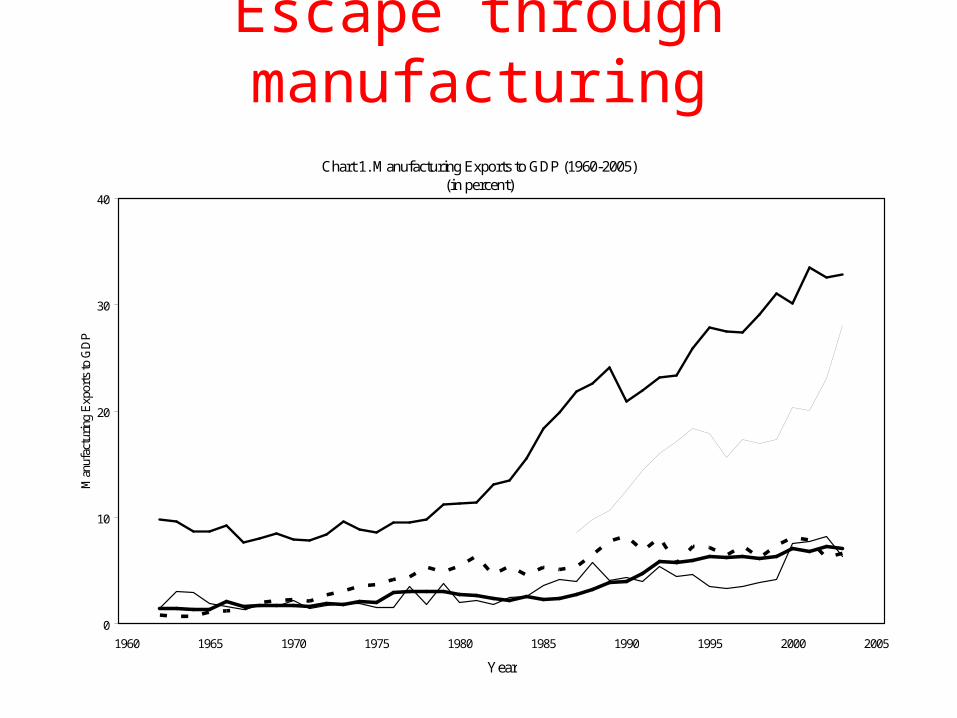
Escape through manufacturing
Chart 1. Manufacturing Exports to GDP (1960-2005)(in percent)
0
10
20
30
40
1960 1965 1970 1975 1980 1985 1990 1995 2000 2005
Year
Man
ufac
turi
ng E
xpor
ts to
GD
P
Asia
Latin America
China
Sub-Saharan AfricaIndia
Tradables and exchange rates• Combine diversification and modes of escape: Empirically, new and
different things are largely tradables, typically manufacturing but also agricultural (Chile) and services (India)
• Important distinction not necessarily manufacturing versus services but non-commodity tradables versus others
• Many reasons for why tradables might be important and why they are prone to being under-produced– Tradables are institutions-intensive
• What are the mechanisms for and determinants of doing new and different things, i.e. for tradable manufacturing and services?
• Many determinants: human capital; institutions etc. but exchange rate an important one
Alternative Instruments• Compare three policy instruments: industrial policy/protection; trade
preferences and exchange rates
• Conventional industrial policy: picking winners; rent-seeking and administrative costs; credible withdrawal; market test
• Trade preferences: minimizes rent-seeking and administrative; but uncertain value subject to depreciation based on external factors (Mauritius, Mexico)
• Exchange rate has the following virtues:– Helps all tradables not just import-competing of exports– Avoids costs (rent-seeking, corruption, picking winners and
losers) of industrial policies– Is self-targeting and rewards efficient performance– Is self-eliminating (trend appreciation)?
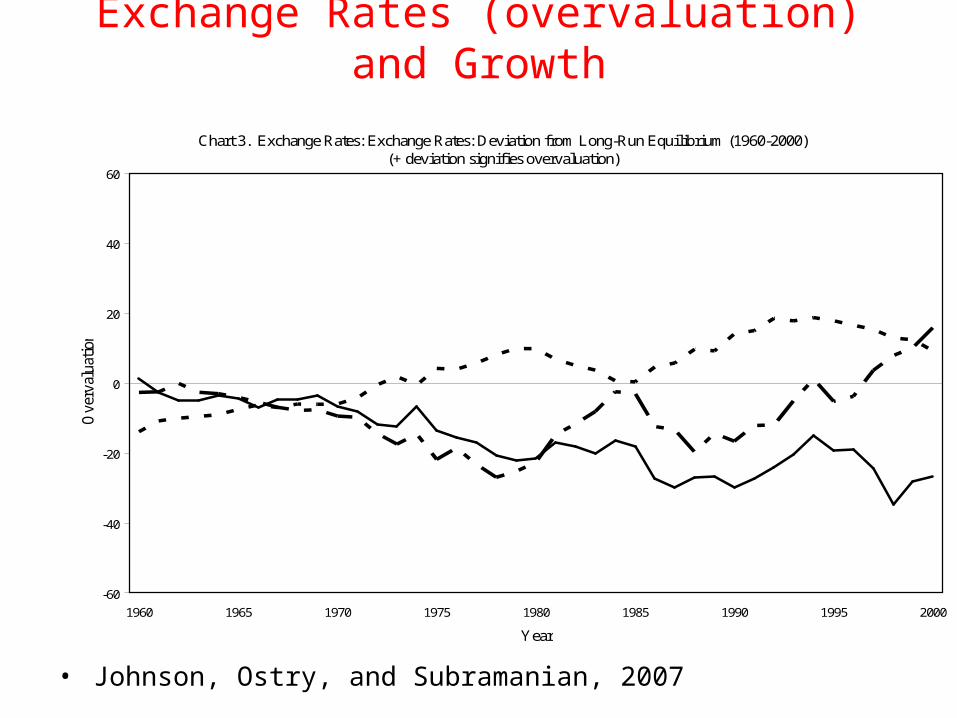
Exchange Rates (overvaluation) and Growth
Chart 3. Exchange Rates: Exchange Rates: Deviation from Long-Run Equilibrium (1960-2000)(+ deviation signifies overvaluation)
-60
-40
-20
0
20
40
60
1960 1965 1970 1975 1980 1985 1990 1995 2000
Year
Ove
rval
uati
on
Asia
Latin America
Sub-Saharan Africa
• Johnson, Ostry, and Subramanian, 2007

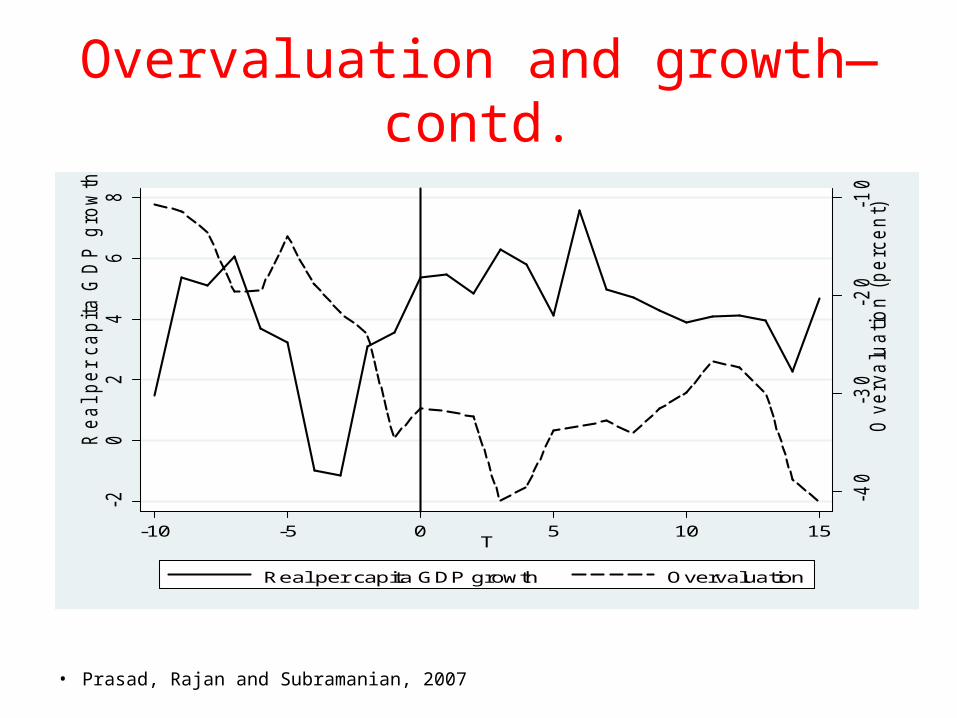
Overvaluation and growth—contd.• Defining overvaluation (Johnson, Ostry and
Subramanian, 2007)—departure of country’s exchange rate from very long run PPP rate
• Africa: Average overvaluation=18 percent compared with -17 percent for Sustained Growth countries
• Econometric evidence: – A 1 percentage point overvaluation reduces long run
growth by about 0.1 percent (Prasad, Rajan and Subramanian, 2007, and Rodrik, 2007). Symmetric?
– Overvaluation reduces the growth of manufacturing exports (Rajan and Subramanian, 2005 and Prasad, Rajan and Subramanian, 2007)
Overvaluation and growth—contd.
-40
-30
-20
-10
Overv
alu
atio
n (
pe
rcen
t)
-20
24
68
Rea
l pe
r ca
pita
GD
P g
row
th
-10 -5 0 5 10 15T
Real per capita GDP growth Overvaluation
• Prasad, Rajan and Subramanian, 2007
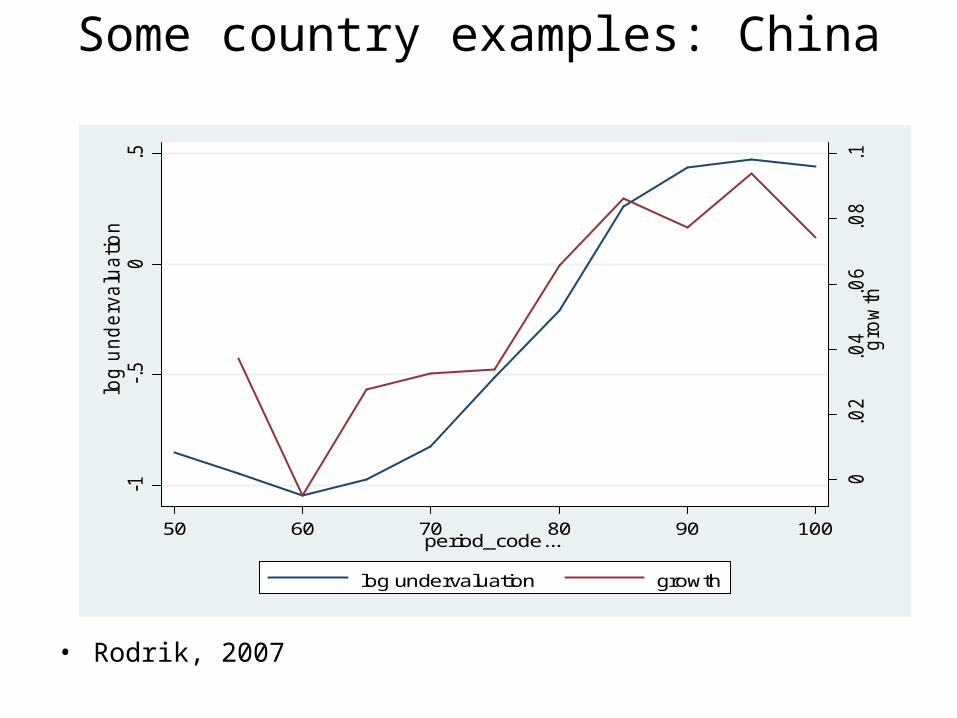
Some country examples: China
0.0
2.0
4.0
6.0
8.1
gro
wth
-1-.
50
.5lo
g u
nd
erv
alu
atio
n
50 60 70 80 90 100period_code...
log undervaluation growth
• Rodrik, 2007
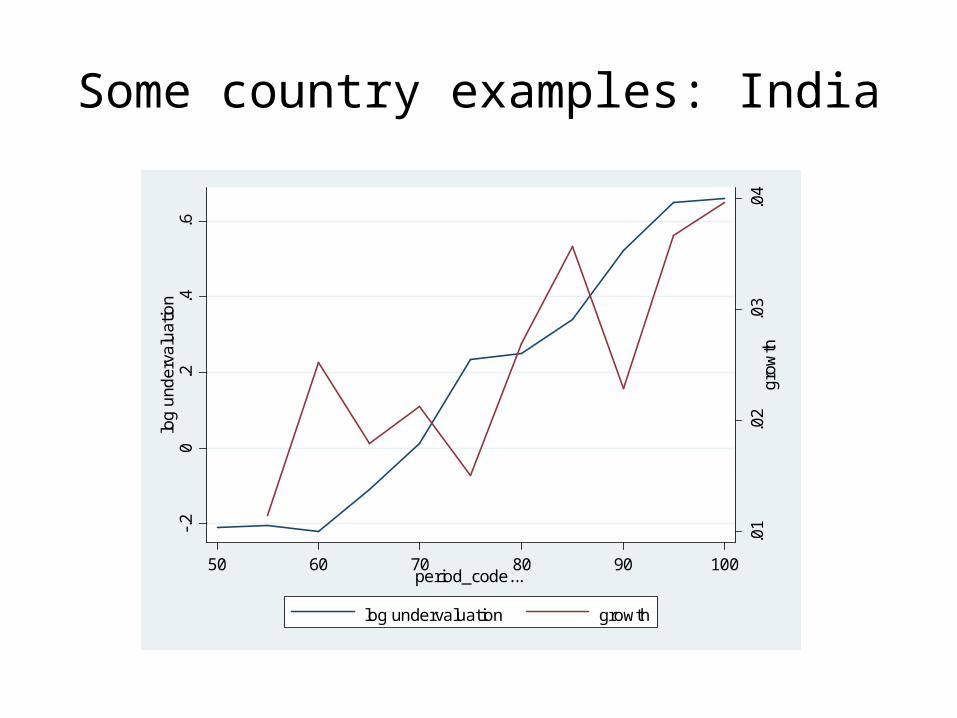
Some country examples: India
.01
.02
.03
.04
gro
wth
-.2
0.2
.4.6
log
und
erva
luat
ion
50 60 70 80 90 100period_code...
log undervaluation growth
Is the real exchange rate susceptible to policy?
• The RER is an endogenous variable: determined in equilibrium by the balance between saving and investment
• Less foreign savings and more domestic savings, the less overvalued the exchange rate and hence greater growth
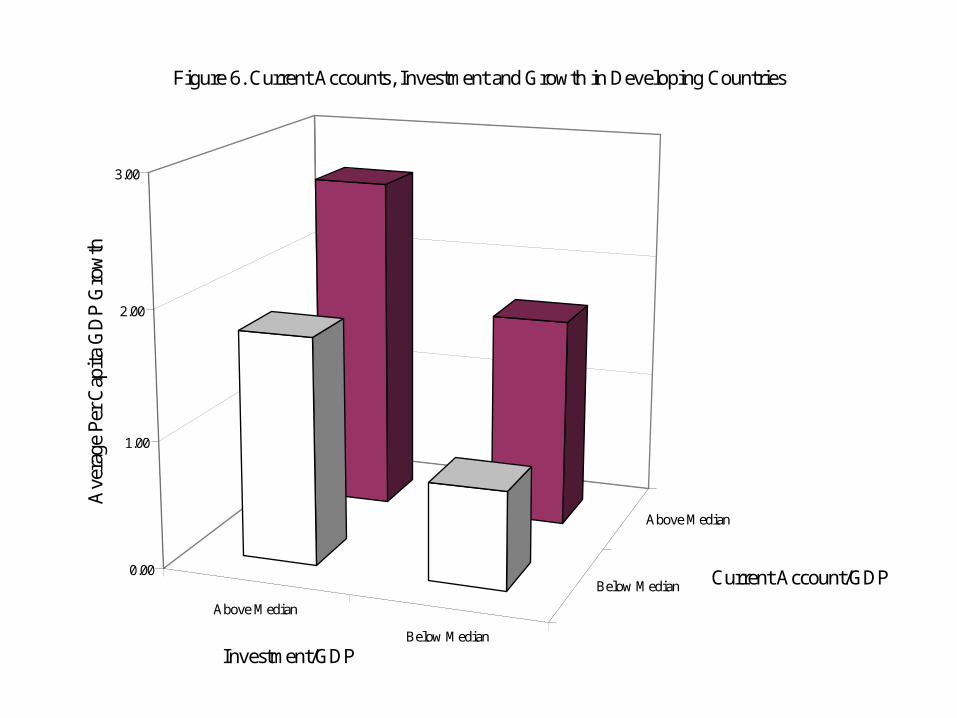
Above Median
Below Median
Below Median
Above Median
0.00
1.00
2.00
3.00
Ave
rage
Per
Cap
ita
GD
P G
row
th
Investment/GDP
Current Account/GDP
Figure 6. Current Accounts, Investment and Growth in Developing Countries
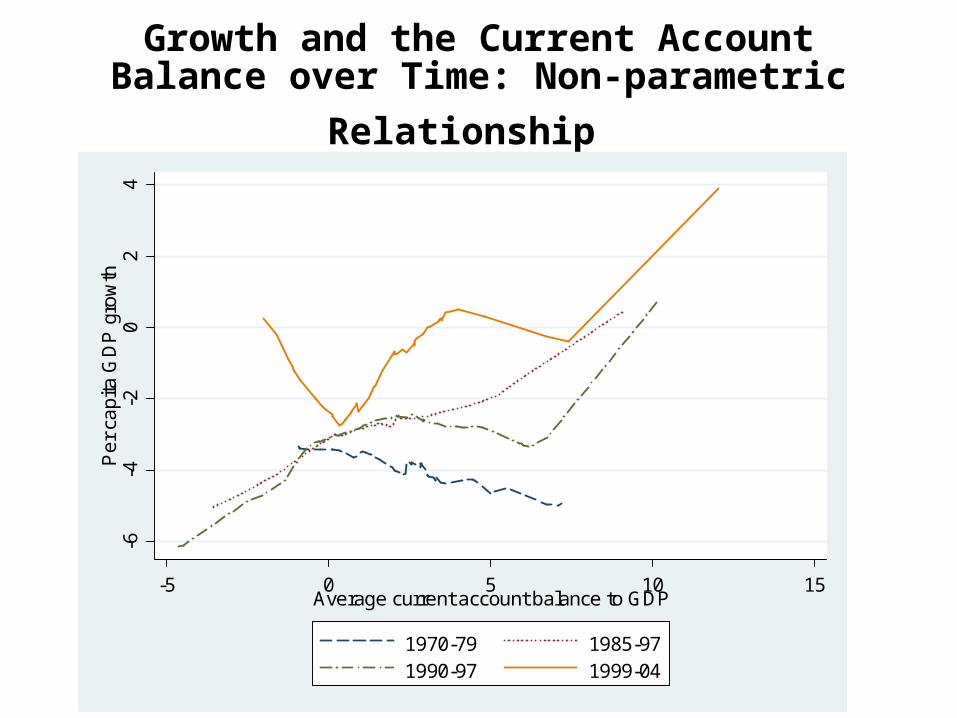
Growth and the Current Account Balance over
Time: Non-parametric Relationship
-6-4
-20
24
Pe
r ca
pita
GD
P g
row
th
-5 0 5 10 15Average current account balance to GDP
1970-79 1985-971990-97 1999-04
Foreign Savings and Growth
• Foreign capital makes real exchange rate management difficult (level not volatility). Leads to appreciation and lower growth– Impact of foreign aid on exchange rates and exports
(Rajan and Subramanian, 2005)– Impact of private capital on exchange rates and
exports (Prasad, Rajan and Subramanian, 2007)
• Sterilized intervention– Recent experiences of China and India
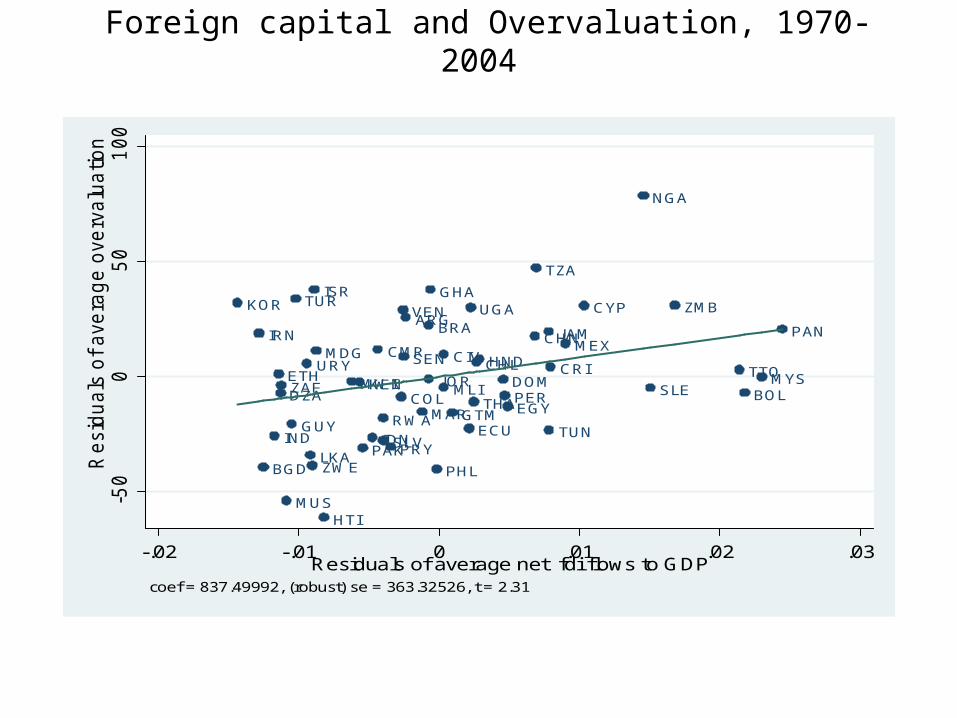
Foreign capital and Overvaluation, 1970-2004
KOR
IRN
BGD
IND
ETH
DZAZAF
MUS
GUY
TUR
URY
LKAZWE
ISR
MDG
HTI
MWIKEN
PAKIDN
CMR
SLV
RWA
PRY
COL
VEN
SEN
ARG
MAR
BRA
JOR
GHA
PHL
CIV
MLI
GTMECU
UGA
THA
CHLHND
DOMPEREGY
CHN
TZA
JAM
TUN
CRI
MEX
CYP
NGA
SLE
ZMB
TTO
BOLMYS
PAN
-50
05
01
00
Resid
uals
of ave
rag
e o
ve
rvalu
ation
-.02 -.01 0 .01 .02 .03Residuals of average net fdi flows to GDP
coef = 837.49992, (robust) se = 363.32526, t = 2.31

Domestic Savings
• For Latin America, genie is out of the bottle, so need to focus on domestic savings
• Government savings: Fiscal policies may need to be even stronger than suggested by normal macroeconomic/fiscal criteria
• Private savings
Conclusions
• Development—doing different things and fostering tradables--requires keeping an eye on the real exchange rate.
• Challenge is how? Probably a variety of things
• Especially challenging for Latin America with open capital accounts