Embed Size (px)
Citation preview

W P 1 2 - 1 9 R E V I S E D A U G U S T 2 0 1 3
Working Paper S e r i e s
1750 Massachusetts Avenue, NW Washington, DC 20036-1903 Tel: (202) 328-9000 Fax: (202) 659-3225 www.piie.com
The Renminbi Bloc Is Here: Asia Down, Rest of the World to Go?Arvind Subramanian and Martin Kessler
Abstract
A country’s rise to economic dominance tends to be accompanied by its currency becoming a reference point, with other currencies tracking it implicitly or explicitly. For a sample comprising emerging-market economies, we show that in the last three years, the renminbi (RMB) has increasingly become a reference currency, which we define as one that exhibits a high degree of co-movement with other currencies. In East Asia, there is already a RMB bloc, because the RMB has become the dominant reference currency, eclipsing the US dollar, which is a historic development. In this region, 7 currencies out of 10 co-move more closely with the RMB than with the dollar, with the average value of the co-movement coefficient relative to the RMB being about 60 percent greater than that for the dollar. We find that co-movements with a reference currency, especially for the RMB, are associated with trade integration. We draw some lessons for the prospects for the RMB bloc to move beyond Asia based on a comparison of the RMB’s situation today and that of the Japanese yen in the early 1990s. If trade were the sole driver, a more global RMB bloc could emerge by the mid-2030s, but complementary reforms of the financial and external sectors could considerably expedite the process.
JEL Codes: F31, F33Keywords: Exchange rates, China, renminbi, currency internationalization, reserve currency
Arvind Subramanian is the Dennis Weatherstone Senior Fellow at the Peterson Institute for International Economics and senior fellow at the Center for Global Development. Martin Kessler is a research analyst at the Peterson Institute for International Economics.
Authors’ Note: This working paper is forthcoming in the August/September 2013 issue of the Journal of Globalization and Development. It is an updated version of the paper of the same title first distributed in October 2012, available at https://docs.google.com/file/d/0B_faDyK5phT-c0E3NWZnVXVOOEU/edit?pli=1. We are grateful to Anders Åslund, C.Fred Bergsten, William Cline, Simon Cox, Joe Gagnon, Dong He, Randy Henning, Josh Felman, Jeff Frankel, Simon Johnson, Nick Lardy, Marcus Noland, Adam Posen, John Williamson, Daniel Xie, and especially Olivier Jeanne, as well as participants at seminars at the Peterson Institute for International Economics and the Hong Kong Monetary Authority and two anonymous referees for comments and discussions.
Copyright © 2013 by the Peterson Institute for International Economics. All rights reserved. No part of this working paper may be reproduced or utilized in any form or by any means, electronic or mechanical, including photocopying, recording,
or by information storage or retrieval system, without permission from the Institute.This publication has been subjected to a prepublication peer review intended to ensure analytical quality. The views expressed are those of the authors. This publication is part of the overall program of the Peterson Institute for International Economics, as endorsed by its Board of Directors, but it does not necessarily reflect the views of individual members of the Board or of the Institute's staff or management. The Institute is an independent, private, nonprofit institution for rigorous, intellectually honest
study and open discussion of international economic policy. Its work is made possible by financial support from a highly diverse group of philanthropic foundations, private corporations, and interested individuals, as well as by income
on its capital fund. For a list of Institute supporters, please see www.piie.com/supporters.cfm.
2
Is confidence based on a rate of exchange? We used to talk of sterling qualities. Have we got to talk now about a dollar love? A dollar love had good intentions, a clear conscience, and to hell with everybody.
—Graham Greene, The Quiet American, 1955
I Introduction
The economic rise of China raises the question whether the Chinese currency could become an international/reserve currency or possibly also the premier international currency, eclipsing the US dollar.1 Based on econometrics and history, in Subramanian (2011) one of us argued that the fundamental determinants of international currency status—not just the size of an economy but also the size of its trade and external financial strength—were moving strongly in China’s favor. If China could undertake the necessary reforms of its financial markets and allow greater access for foreigners to the renminbi (RMB) via capital account liberalization, the rise of the RMB to international currency status could be imminent, perhaps within the next 10 to 15 years.
A currency can become dominant when it acquires a heightened role and becomes the focus or a reference point for other currencies, leading to the formation of a currency bloc. This paper addresses the RMB’s rise as a reference currency and the creation of a RMB currency bloc.
Clarifying International and Reference Currencies
An international currency is one that is sought by foreigners (official and private) for three reasons: as a store of value, medium of exchange, and unit of account. This leads to the famous 3 x 2 taxonomy (3 functions for 2 types of foreign actors) elaborated by Peter Kenen (1983) and illustrated in table 1. This paper does not address the store of value and medium of exchange functions of an international currency (the top two rows of table 1). It addresses the situation when a currency becomes a reference point for other currencies, which is related more to the unit of account function described in the third row of table 1. One way it can become a reference point is when foreign governments and/or central banks often anchor/peg their currencies to a reserve currency. Another way is for foreign trade and financial transactions to be denominated/invoiced in the reference currency.
We study the case where a currency becomes a reference point as manifested in a greater degree of co-movement of other currencies with it. These co-movements could be the result of policy choices by countries to track the reference currency in the context of a fixed or semi-fixed exchange rate regime. Or, these movements could be market driven.
It is, of course, possible and perhaps even likely that being or becoming a reference currency will lead to its transition to an international currency: For example, if more countries track say the RMB, that stability in the bilateral exchange rate will be conducive to the private sector using the RMB as a unit of account in trade transactions. In this paper, we focus on establishing the fact
1 Sometimes a distinction is made between a reserve and an international currency to correspond, respectively, to official and private sector uses of a currency. We use the term “international” in an encompassing sense.
3
that the RMB has become one of the major global reference currencies, along with the US dollar and the euro.
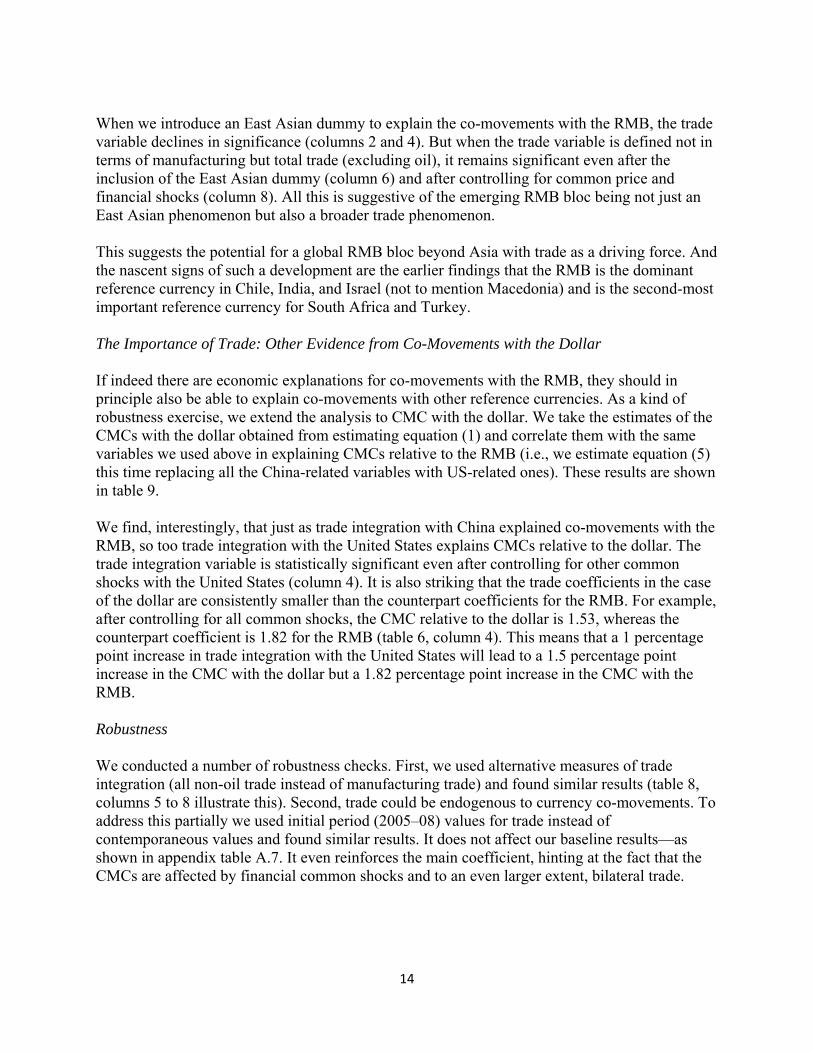
Figures 1a and 1b plot the exchange rates of a number of East Asian countries and the renminbi since 2004 and 2010, respectively. The pattern is one of East Asian currencies broadly following the RMB.
The underlying causes of such co-movements could be common trade, financial, or other real shocks. Central banks can wish to increase exchange rate stability with China to stabilize the trading environment of their domestic firms. Or co-movements could result from competitiveness concerns. For example, since China is a large trader, other countries at similar income and productivity levels fear that they will be outcompeted by China. A possible strategy for them is thus to minimize the cost-competitiveness difference with China and track the RMB more closely.2 In a context where the RMB appreciates, a flexible peg to the RMB can allow competitor countries to appreciate their currency in order to limit inflation, while retaining competitiveness.
Contributions/Findings3
First, this paper establishes that since mid-2010, the RMB has made dramatic strides as a reference currency compared with the dollar and euro. This is happening at the extensive margin: When compared with the first period of RMB managed flexibility (from mid-2005 to mid-2008), many more countries have seen an increase in the co-movements of their currencies with the RMB (32 out of 52 cases) than with the dollar (16) or the euro (19). And it is happening at the intensive margin: The average magnitude in co-movements has been increasing for the RMB (9 percentage points) and decreasing for both the dollar (–13 percentage points) and the euro (–9.1 percentage points). Second, and perhaps more dramatically, the RMB has now become the dominant reference currency in East Asia, eclipsing the dollar and the euro. There is now a de facto RMB currency bloc in East Asia In this region, more currencies now co-move (in a statistically significant manner) with the RMB (8 out of 10 cases) than with the dollar (6 out of 10) or the euro. And the magnitude of these co-movements is greatest for the RMB in 7 cases compared with 3 for the dollar (the average magnitude is 0.55 for the RMB and 0.34 for the dollar). Currencies of South Korea, Indonesia, Malaysia, the Philippines, Taiwan, Singapore, and Thailand now more closely track the RMB than the dollar. The dollar’s dominance as reference currency in East Asia is now limited to Hong Kong (by virtue of the peg), Vietnam, and Mongolia. Third, the RMB’s role as a reference currency is not restricted to East Asia. For Chile, India, and South Africa, the RMB is the dominant reference currency. For Israel and Turkey, the RMB is a
2 Mattoo, Mishra, and Subramanian (2012) quantify the extent to which China competes with other developing countries. 3 The findings reported in this working paper are an updated version of those in a previous research paper published in October 2012, available at https://docs.google.com/file/d/0B_faDyK5phT-c0E3NWZnVXVOOEU/edit?pli=1, which covered the period up to July 2012. This version includes an additional year’s data. The findings in this paper on the rising dominance of the RMB as a reference currency are stronger than those in the previous version.

4
more important reference currency than the dollar. Overall, 11 currencies out of 42 outside East Asia co-move significantly with the RMB. The dollar and the euro still play a greater role beyond their natural spheres of influence than does the RMB but that is changing in favor of the RMB. Fourth, and related to the above, while the rise of the RMB as a reference currency is especially prominent in East Asia, this is as much a trade phenomenon, reflecting the increasing trade presence of China, as a regional one. Consistent with the findings about the behavior of currencies outside East Asia such as South Africa, Israel, Chile, and India, it is possible for the RMB bloc to extend beyond East Asia. The RMB could become a global reference currency by the mid-2030s if trade were the sole driver and much sooner if China were to undertake broader reforms. The final contribution of the paper is more methodological. We are able to establish the emergence of the RMB as a reference currency using a simple and straightforward application of the basic technique due to Haldane and Hall (1991) and Frankel and Wei (1994). This allows us to run a straightforward horse race between the major reserve currencies including the RMB without having to resort to econometric techniques (such as orthogonalization as in Balasubramaniam, Patnaik, and Shah 2011 or Fratzscher and Mehl 2011), which militate against drawing simple inferences about the relative importance of the different reserve currencies. Moreover, unlike in the literature, we show that the correlates of currency co-movements such as trade integration are symmetric across reference currencies. That is, if trade integration with China is associated with greater co-movements with the RMB, then also trade integration with the United States is associated with greater co-movements with the US dollar. The paper is organized as follows. Section 2 describes our methodology. Section 3 presents the findings. Section 4 places our findings in the context of recent research on the RMB. Section 5 undertakes a brief historical comparison of the RMB today and the Japanese yen at a comparable point in time, the late 1980s, and provides some concluding thoughts.
II Quantifying and Explaining Reference Currencies: The Methodology
We adopt a two-stage methodology. In the first, we identify and quantify reference currencies, focusing on the shift across time. In the second stage, we use estimates from the first stage to explain the characteristics that are associated with reference currencies. Stage One: Identifying Reference Currencies In order to assess the importance of the RMB as a reference currency, we adapt the method developed by Frankel and Wei (1994, 2007). The basic idea is that countries that follow a peg to a basket of currencies often prefer not to disclose it. By regressing daily variations of the exchange rate against a limited number of candidate currencies, it is possible to recover the actual weight, and to assess the importance, of key international currencies in the exchange rate arrangements of other countries. Equation (1) is thus run for each country in the sample.
5
∗$
∗ ∗ ∗ (1)
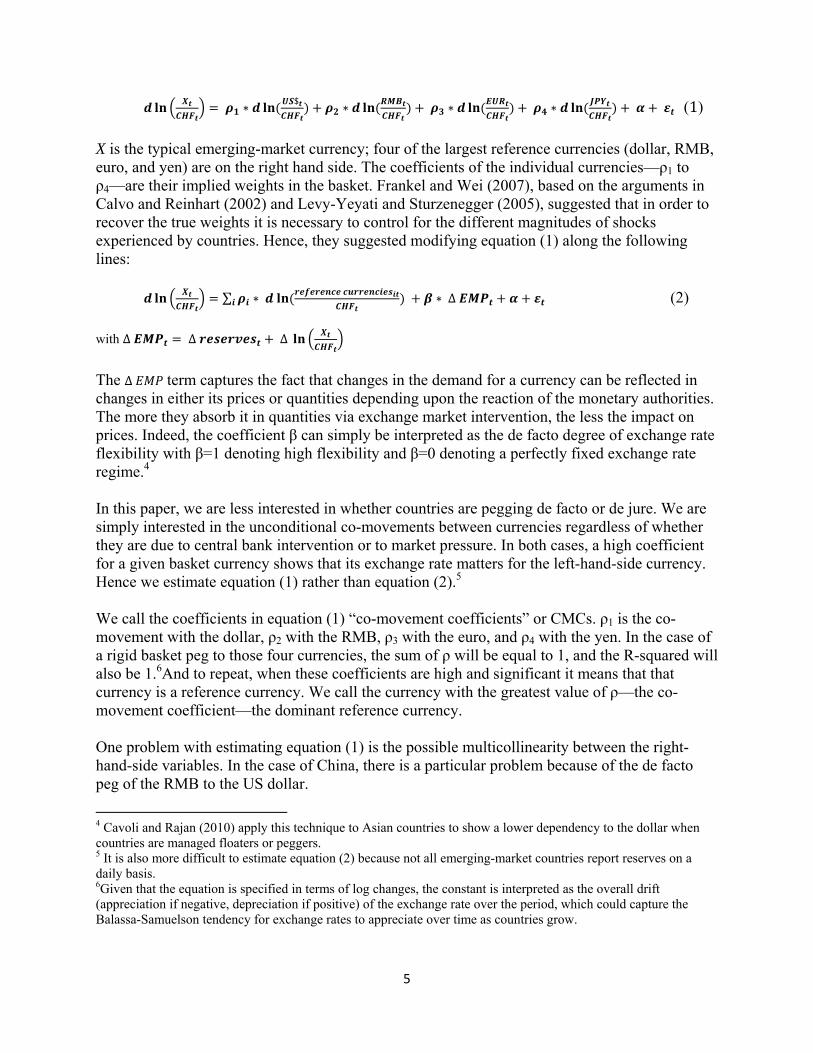
X is the typical emerging-market currency; four of the largest reference currencies (dollar, RMB, euro, and yen) are on the right hand side. The coefficients of the individual currencies—ρ1 to ρ4—are their implied weights in the basket. Frankel and Wei (2007), based on the arguments in Calvo and Reinhart (2002) and Levy-Yeyati and Sturzenegger (2005), suggested that in order to recover the true weights it is necessary to control for the different magnitudes of shocks experienced by countries. Hence, they suggested modifying equation (1) along the following lines: ∑ ∗
∗ ∆ (2)
with ∆ ∆ ∆
The ∆ term captures the fact that changes in the demand for a currency can be reflected in changes in either its prices or quantities depending upon the reaction of the monetary authorities. The more they absorb it in quantities via exchange market intervention, the less the impact on prices. Indeed, the coefficient β can simply be interpreted as the de facto degree of exchange rate flexibility with β=1 denoting high flexibility and β=0 denoting a perfectly fixed exchange rate regime.4 In this paper, we are less interested in whether countries are pegging de facto or de jure. We are simply interested in the unconditional co-movements between currencies regardless of whether they are due to central bank intervention or to market pressure. In both cases, a high coefficient for a given basket currency shows that its exchange rate matters for the left-hand-side currency. Hence we estimate equation (1) rather than equation (2).5 We call the coefficients in equation (1) “co-movement coefficients” or CMCs. ρ1 is the co-movement with the dollar, ρ2 with the RMB, ρ3 with the euro, and ρ4 with the yen. In the case of a rigid basket peg to those four currencies, the sum of ρ will be equal to 1, and the R-squared will also be 1.6And to repeat, when these coefficients are high and significant it means that that currency is a reference currency. We call the currency with the greatest value of ρ—the co-movement coefficient—the dominant reference currency. One problem with estimating equation (1) is the possible multicollinearity between the right-hand-side variables. In the case of China, there is a particular problem because of the de facto peg of the RMB to the US dollar.
4 Cavoli and Rajan (2010) apply this technique to Asian countries to show a lower dependency to the dollar when countries are managed floaters or peggers. 5 It is also more difficult to estimate equation (2) because not all emerging-market countries report reserves on a daily basis. 6Given that the equation is specified in terms of log changes, the constant is interpreted as the overall drift (appreciation if negative, depreciation if positive) of the exchange rate over the period, which could capture the Balassa-Samuelson tendency for exchange rates to appreciate over time as countries grow.

6
Most of the literature has addressed this problem in a way that entails costs that can be prohibitive. One strategy used, inter alia, by Balasubramaniam, Patnaik, and Shah (2011) and Fratzscher and Mehl (2011), measures the effect of the RMB by first removing the dollar component from the RMB movements. They run a first-stage variation: ∗
$ (3)
They then use the residual as a proxy for the autonomous RMB factor and plug it in a
second stage:
∗$
∗ ∗ ∗ (4)
where
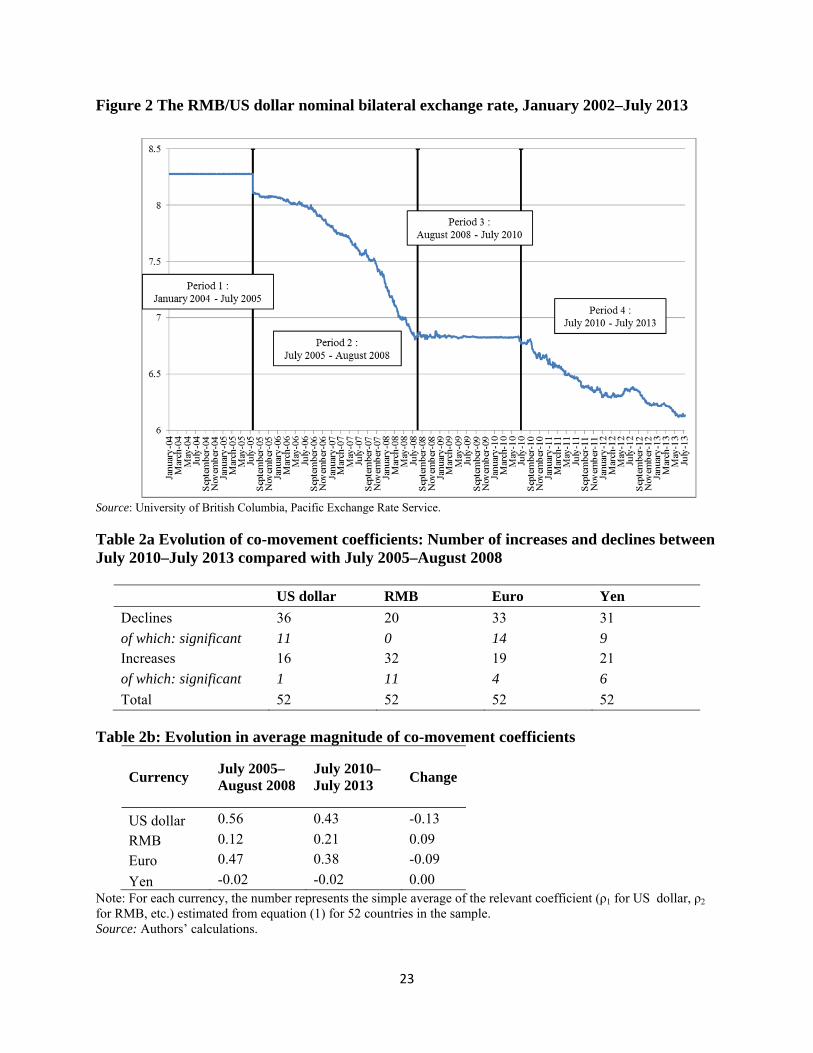
This method, however, does not allow for a clean comparison of coefficients across countries and time; moreover, it is not possible to recover the weights in the basket either, since the coefficients in equation (4) are no longer supposed to sum to 1 in the ideal case. In other words, estimating equation (4) does not amount to running a clean and transparent horse race between the different reference currencies on the right-hand side.7 We address this problem of multicollinearity in a different way. It turns out that there are two periods where the RMB exhibited a modicum of flexibility against the US dollar (figure 2). The first period of relative flexibility starts after the announcement of the People’s Bank of China on July 21, 20058 that the RMB would be allowed to float within a band against the dollar. Over approximately three years, the RMB appreciated by 17.5 percent. This policy of increased flexibility changed in the summer of 2008, leading to a quasi-fixed rate of 6.83 RMB/US dollar for the following two years. The following period started on June 19, 2010, when the People’s Bank of China announced that it would allow the RMB to go a back to a managed floating regime9 against a basket of currencies. Between this announcement and mid-July 2013, the RMB was revalued by a further 9.7 percent. In both these periods (“Period 2” and “Period 4” in figure 2) there is sufficient variation in the RMB/dollar rate to distinguish between the effect of the RMB variations and the US dollar variations on other currencies. That is why we are able to estimate equation (1), a pure horse race that allows us to interpret the magnitude of the coefficients as pure co-movements.10 7 In simpler terms, estimating equation (4) presumes that any collinearity between the dollar and the RMB should be resolved entirely in favor of the dollar, i.e., any effect that is hard to attribute to either the dollar or the RMB is attributed entirely to the dollar. 8 People’s Bank of China (2005) 9 People’s Bank of China (2010). 10 High multicollinearity between the RMB and US dollar does not pose an insurmountable problem as reflected in our findings below. Not only do we get reasonable standard errors, we get coefficient estimates that vary between Latin American and Asian countries that are a priori intuitive. Put differently, had multicollinearity been a serious problem, we would have seen unexpected/counterintuitive values for the RMB and dollar CMCs across all regions.
7
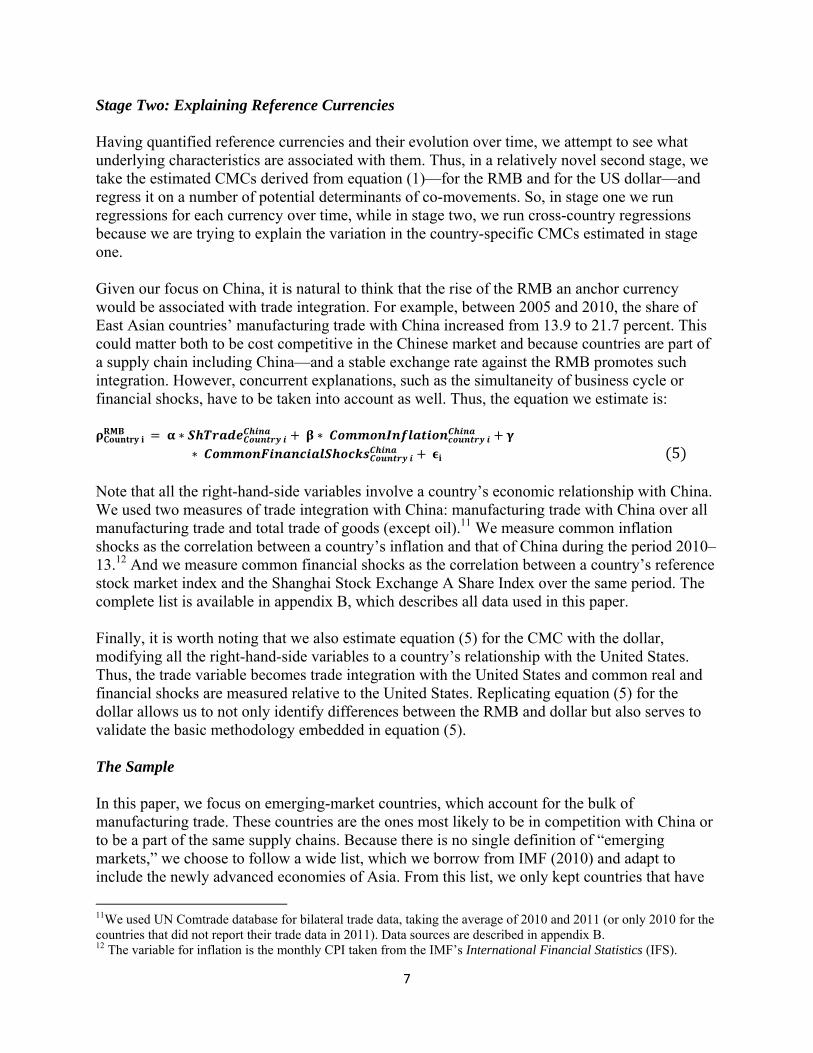
Stage Two: Explaining Reference Currencies Having quantified reference currencies and their evolution over time, we attempt to see what underlying characteristics are associated with them. Thus, in a relatively novel second stage, we take the estimated CMCs derived from equation (1)—for the RMB and for the US dollar—and regress it on a number of potential determinants of co-movements. So, in stage one we run regressions for each currency over time, while in stage two, we run cross-country regressions because we are trying to explain the variation in the country-specific CMCs estimated in stage one. Given our focus on China, it is natural to think that the rise of the RMB an anchor currency would be associated with trade integration. For example, between 2005 and 2010, the share of East Asian countries’ manufacturing trade with China increased from 13.9 to 21.7 percent. This could matter both to be cost competitive in the Chinese market and because countries are part of a supply chain including China—and a stable exchange rate against the RMB promotes such integration. However, concurrent explanations, such as the simultaneity of business cycle or financial shocks, have to be taken into account as well. Thus, the equation we estimate is:
∗ ∗
∗ 5
Note that all the right-hand-side variables involve a country’s economic relationship with China. We used two measures of trade integration with China: manufacturing trade with China over all manufacturing trade and total trade of goods (except oil).11 We measure common inflation shocks as the correlation between a country’s inflation and that of China during the period 2010–13.12 And we measure common financial shocks as the correlation between a country’s reference stock market index and the Shanghai Stock Exchange A Share Index over the same period. The complete list is available in appendix B, which describes all data used in this paper. Finally, it is worth noting that we also estimate equation (5) for the CMC with the dollar, modifying all the right-hand-side variables to a country’s relationship with the United States. Thus, the trade variable becomes trade integration with the United States and common real and financial shocks are measured relative to the United States. Replicating equation (5) for the dollar allows us to not only identify differences between the RMB and dollar but also serves to validate the basic methodology embedded in equation (5). The Sample In this paper, we focus on emerging-market countries, which account for the bulk of manufacturing trade. These countries are the ones most likely to be in competition with China or to be a part of the same supply chains. Because there is no single definition of “emerging markets,” we choose to follow a wide list, which we borrow from IMF (2010) and adapt to include the newly advanced economies of Asia. From this list, we only kept countries that have
11We used UN Comtrade database for bilateral trade data, taking the average of 2010 and 2011 (or only 2010 for the countries that did not report their trade data in 2011). Data sources are described in appendix B. 12 The variable for inflation is the monthly CPI taken from the IMF’s International Financial Statistics (IFS).
8
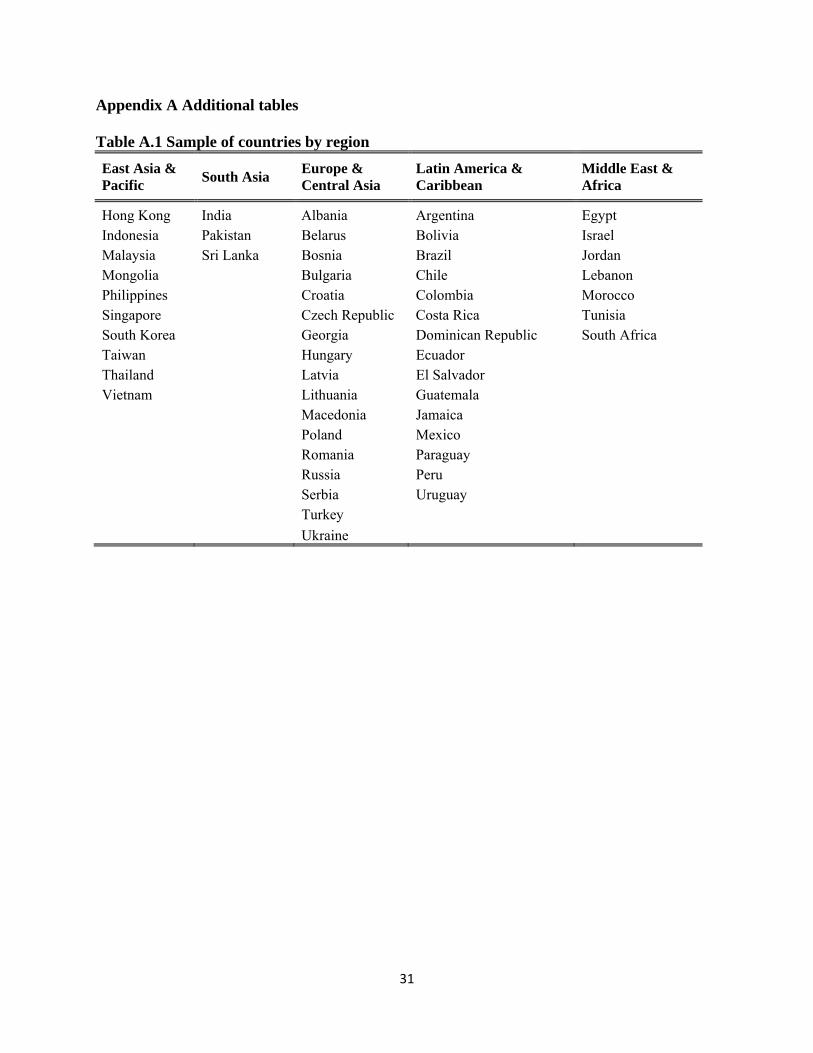
their own currency (e.g., excluding those fully dollarized such as Panama or the euro area countries such as Slovenia or Slovak Republic), and we excluded energy commodity exporters. The full list of 52 countries is presented in appendix table A.1. III Results Evolution in Reference Currency Status We first present results for stage one of the analysis, where we document the rise of the RMB as a reference currency. Overall Changes We first show the dramatic nature of changes involving the different currencies as reference currencies (tables 2a and b). The changes refer to the difference between the results in the second period (July 2005–August 2008) and the fourth period (July 2010–July 2013) in figure 2. These changes can be along the extensive margin (table 2a) and the intensive margin (table 2b). On the extensive margin, the first thing to note is that across the two periods, the largest increases (and hence the fewest decreases) in the CMCs occurred for the RMB. For 32 out of the 52 currencies, there were increases in the CMC relative to the RMB; the comparable numbers for the dollar and the euro were 16 and 19, respectively. In other words, whereas for the RMB nearly 70 percent of the time there was an increase in the CMC, for the dollar it was 25 percent and for the euro about 35 percent. Even if we restrict the comparison to the number of increases in the CMCs that are statistically significant (at the 10 percent level), the RMB comes out ahead with 11 instances compared with 4 for the euro and 1 for the dollar. Interestingly, there were no instances of statistically significant declines in the CMCs relative to the RMB, whereas there were 11 and 14 cases of statistically significant declines for the dollar and euro, respectively. On the intensive margin, we find that the magnitude of changes in the CMC is greater for the RMB than for the dollar and the euro (table 2b). For example, between the two periods the simple average of the changes was +9 percentage points for the RMB (the average value of the CMCs rose from 12 to 21 percent) while the weight on the dollar decreased by 13 percentage points (from 56 to 43 percent) and 9 percentage points for the euro (from 47 to 38 percent). The net differential thus swung 22 percentage points in favor of the RMB relative to the dollar and also 22 percentage points relative to the euro. Dominance in East Asia: The RMB Bloc The most dramatic finding is illustrated in tables 3a to 3c. In East Asia, the RMB not only has risen to be an important reference currency but also is the dominant reference currency, eclipsing the dollar. There is de facto an unambiguous RMB currency bloc in East Asia. Table 3a illustrates this. In the period 2005–08, the RMB was the dominant reference currency (in the sense of exhibiting the greatest co-movement amongst all possible reference currencies, dollar, euro, yen, and RMB) in 3 out of 10 cases compared with 6 for the dollar and 1 for the euro (in Singapore). In the period 2010–13, it had become the dominant reference currency in 7 out of 10

9
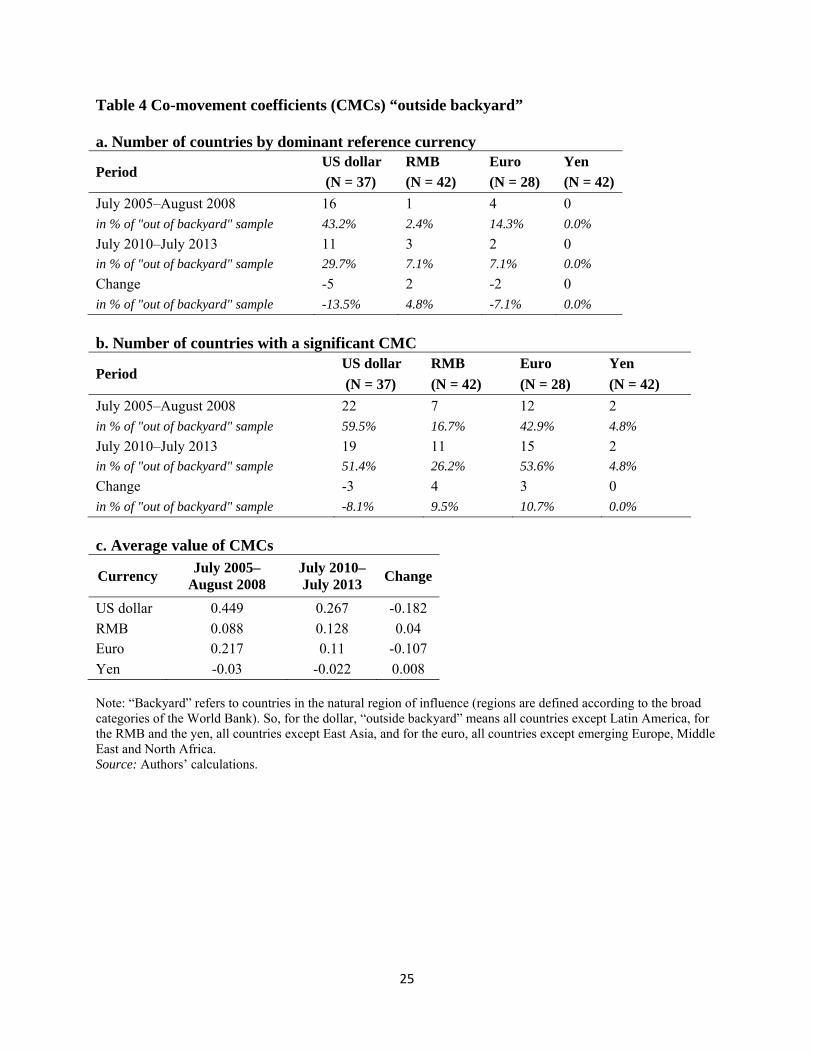
cases compared with 3 for the dollar (and none for the euro). Similarly, the number of CMCs that are statistically significant doubled from 4 to 8 countries for the RMB and declined from 9 to 6 countries for the dollar (table 3b). This eclipse has occurred not just in terms of the number of countries but also in the strength of the co-movement (table 3c). The average magnitude of the CMC for the RMB in the latest period was 55 percent compared with 34 percent for the dollar now, which represents, respectively, an increase of 29 percentage points and a decrease of 27 percentage points. It is interesting to identify the countries that co-move more with the RMB than the dollar and vice versa. It is now the case that the currencies of Korea, Indonesia, the Philippines, Taiwan, Singapore, Thailand, and Malaysia more closely track the RMB than the dollar. In a number of cases the co-movement is close to 1. The dollar’s dominance as reference currency is now limited to Hong Kong (by virtue of the currency board regime), Mongolia, and Vietnam. The RMB dominates in relation to the more economically significant countries while the dollar’s role is more important in the smaller countries. Regional Bloc or Global Bloc? Is the rise of the RMB as a reference currency confined to Asia? There is a strong regional pattern to reference currencies. We can think of the euro as the natural currency (for historic, political, and geographic reasons) for emerging-market countries in Europe and the Middle East and North Africa, the dollar as the natural currency for Latin America, and the RMB for East Asia. In the most recent period, for example, in emerging Europe, the euro is the dominant reference currency in 13 out of 17 cases (of course, all countries that have converted to the euro are excluded from this count); in Latin America, the dollar has this status in 12 out of 15 cases; and as discussed above the RMB has this status in Asia. The question then is how these respective reference currencies fare beyond their natural “backyards.” The dollar does best on this metric. As table 4a illustrates, the United States is the dominant reference currency in 11 out of a total of 37 possible extra-backyard cases; the euro is the dominant reference currency in 2 out of a total of 28 possible cases; and the RMB in 3 out of a total of 42 possible cases. But here too there has been some change over time. In the period 2005–08, the comparable numbers for extra-backyard dominance was 16 for the dollar, 4 for the euro, and 1 for the RMB. Another metric for assessing the geographical reach of the different currencies is to look not just at cases where a currency is numero uno but also at all cases where the co-movements are significant (table 4b). As a reference currency outside Asia, the RMB has increased its presence from 7 to 11 (out of 42) countries. In the case of the dollar, it has declined from 22 to 19 (out of 37) countries. The euro also increased its presence from 12 to 15 (out of 28) countries. In terms of the magnitude of the average CMC outside the “backyard,” the rise of the RMB appears modest (from .09 to .13), but this increase must be compared with a decline of 18 and 11 percentage points for the dollar and euro, respectively (table 4c). The net swing in favor of the RMB is thus not inconsiderable.

10
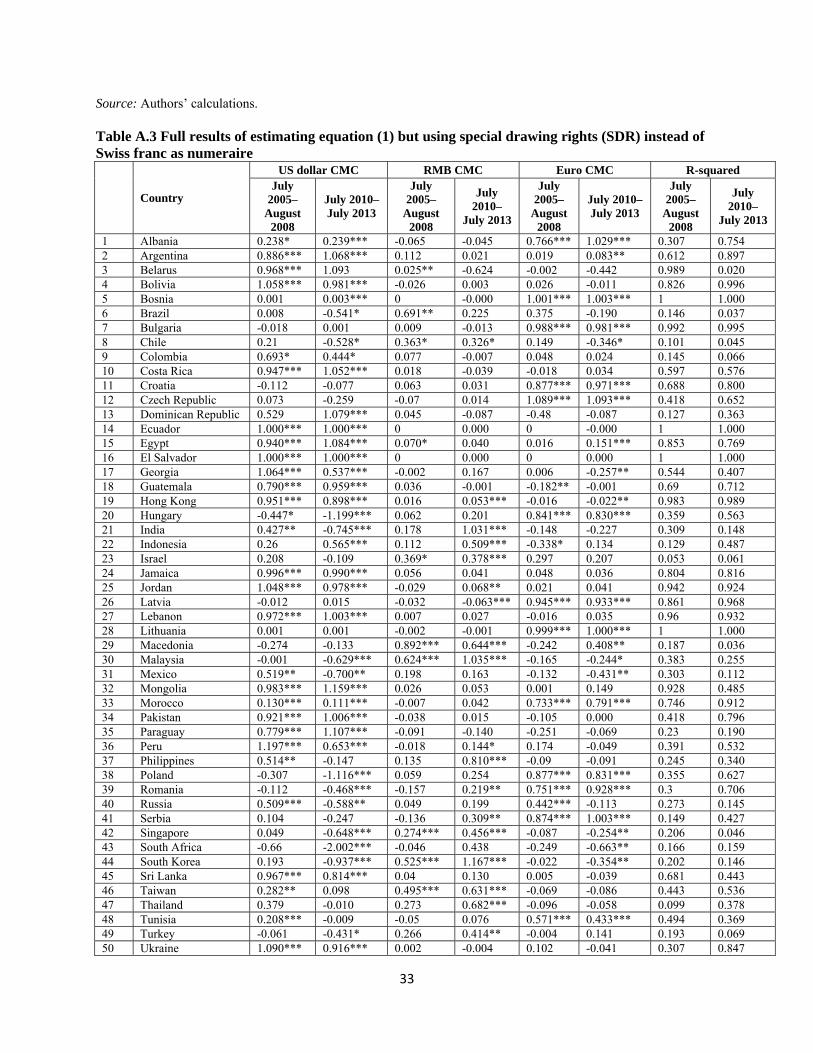
Robustness Checks We check the robustness of our results in several ways. Robustness to choice of numeraire. We have used the Swiss franc as the numeraire to express values of individual currencies. According to Frankel and Xie (2010), if the exchange rate is truly a basket peg, the choice of numeraire currency is immaterial. However, if the true regime is more variable than a rigid basket peg, then the choice of numeraire might matter and they argue in favor of using the special drawing rights (SDR) as the numeraire. But this is less important for us as our concern is more with co-movements and less with whether countries are explicitly pegging to individual reference currencies. In any event, we reestimated equation (1) using the SDR as numeraire. The results are presented in appendix table A.3 and are very similar. On average, the CMC for the RMB goes from .10 to .20 over the two periods, and the RMB is the dominant reference currency for 15 currencies, 6 of which are in East Asia. It is significant in 17 countries, 9 of which are outside the East Asian region. Robustness to external financial environment. One issue relating to the estimation of equation (1), especially in relation to comparisons across the two periods that we study, is the external environment. If this environment changed across the two periods, and in a way that would move the RMB and an individual country under consideration in the same way against the dollar (in market parlance this is known as risk-on/risk-off behavior), then our estimations would result in biases in a way that would render cross-period comparisons problematic. To guard against this, we need to control for the external environment. The idea is that all emerging-market economies have common features with China and that a rising tide might lift all exchange rate boats at the same time. This might especially be a risk given the daily frequency of our data: On a day when emerging market risk is apparently lower, the RMB will appreciate more, as well as all the other emerging markets, especially in Asia. To avoid this spurious correlation, we included several indicators of common emerging market risk to equation (1) as follows:
∗$
∗ ∗ ∗
(6) Four different risk indicators are considered: Fitch Solutions' Probability of Default Index (PDI) at 1 year and at 5 years (F1 and F5 in appendix table A.4), JP Morgan’s Emerging Markets Bond Index Global and JP Morgan Emerging Markets Bond Index Global Diversified, two indicators of the bond markets. Finally, we include the VXEEM indicator from the Chicago Board Options Exchange, which uses the VIX methodology to assess market uncertainty in emerging-market countries. We take VXEEM as the best indicator of the risk perception by the market but it is unfortunately only available from April 2011. The VXEEM is our preferred indicator, since it is interpreted as a global index of risk perception by the market. It should accurately capture movements in the exchange rates that are purely
11
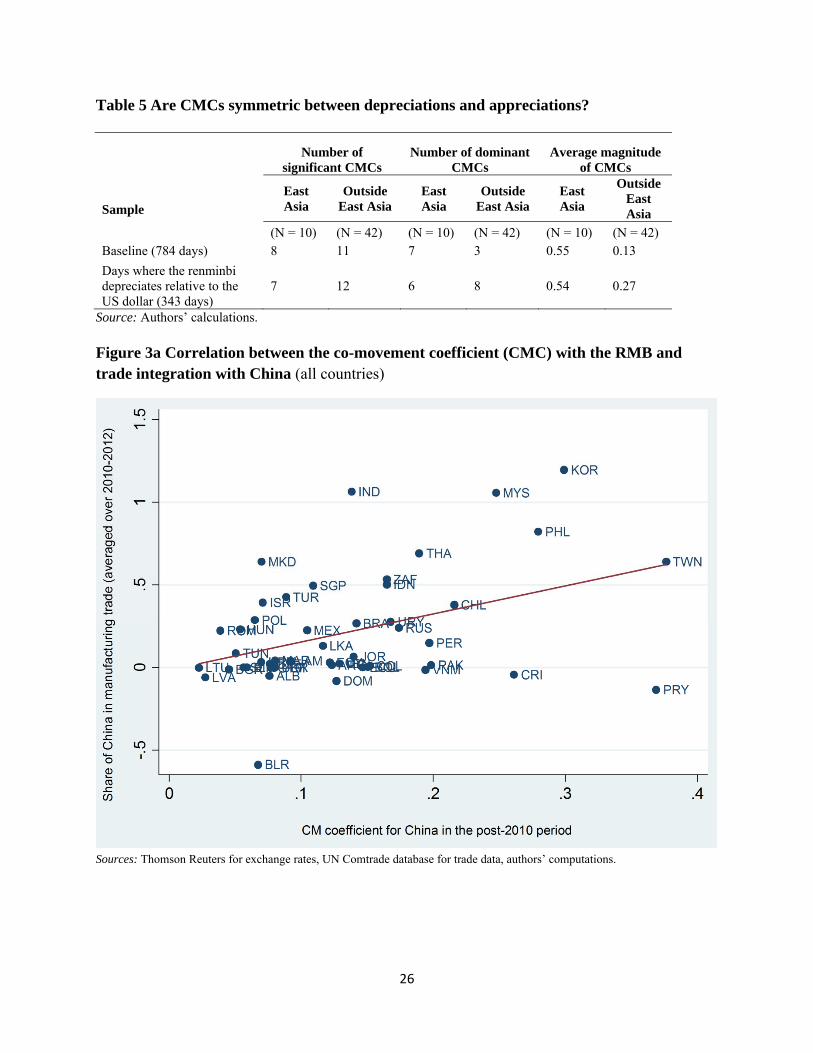
induced by risk-on/risk-off behavior. Overall, however, it seems to reinforce the magnitude of the RMB on the sample. There are some instances where the inclusion of the VXEEM sharply reduces the RMB CMC, such as Chile (–0.22) but also some important instances where the reverse happens (South Africa or Thailand). The equations where we include the JP Morgan’s Emerging Market Bond indices (Global and Global Diversified) show a significant weakening of the RMB CMC, and unsurprisingly, concentrated on the largest and the richest emerging markets (South Africa, Turkey, Brazil, inter alia). When we use Fitch’s Probability of Default Index, another indicator of general emerging market risk, the results are slightly weakened, but our conclusions remain valid. Overall, even with the indicator that reduces the most the RMB CMC, the RMB remains the reference currency in Asia in all specifications (see appendix table A.4 for details). Robustness to reverse causation. Another possible problem with our interpretation is that high CMCs for the RMB are the result of the People’s Bank of China actually tracking or targeting the East Asian currencies (individually or collectively). Now, causation cannot be easily established unless one deploys instrumental variables or looks at windows around surprise announcements by the People’s Bank of China to see if other currencies moved significantly just after these announcements. We do something different that is more suggestive than definitive. For each of those seven East Asian currencies where the RMB was the dominant reference currency (and had the highest CMC), we reestimate equation (1), but making the RMB exchange rate the dependent variable and East Asian currencies the independent variable. We then also reestimate the equation placing all the seven East Asian currencies on the right-hand side. These eight regressions are presented in appendix table A.5. The striking finding is that the CMC between the RMB and these individual currencies is substantially lower in every case than the CMC between these currencies and the RMB estimated in our baseline (for example, Korea: .048 versus 1.2; Malaysia: .08 versus 1.06, and so on). When all the East Asian currencies are introduced simultaneously (to capture the possible fact that the RMB is tracking a basket of currencies), only 4 of the 7 are significant and their magnitudes are small. Even if we added the coefficients of all the East Asian currencies, their magnitude is 0.18. These smaller coefficients that are obtained could simply reflect the fact that East Asian currencies are more volatile than the RMB. But had these reverse regressions yielded high estimates for the CMC, and say comparable to those obtained from the baseline regressions, there would have been much greater cause for concern about reverse causation. Robustness to direction of RMB movement. The sample for our baseline regressions comprises cases of both upward (appreciation) and downward (depreciation) movement in the RMB exchange rates. One natural question that arises is whether the co-movements that we observe are symmetric: Do other currencies track the RMB both when it appreciates and depreciates? To test this we split our sample into two (broadly the same size) and estimated equation (1) separately for cases of RMB depreciation and appreciation (relative to the dollar). We report the results in table 5. The results are broadly unchanged. There is a small decline (from 7 to 6) in the number of cases where the CMC coefficient is significant and dominant
12
when the RMB depreciates compared with the baseline. Outside Asia, though, there is an increase in the number of cases when the RMB becomes a stronger reference currency for episodes of depreciation, reflected not just in the number of cases (from 3 to 8) but also in the average magnitude of the CMC, which more than doubles from 0.13 to 0.27.13 Robustness to methodology. Our estimation methodology, in particular our ability to use the simple equation (1) rather than equation (4), relied on the fact that there were two time windows with sufficient variation in the dollar/RMB exchange rate to minimize the problem of multicollinearity. These windows were the periods July 2005–August 2008 and July 2010–July 2013. In other words, we avoided the period between August 2008 and July 2010 because of the RMB effectively being pegged to the dollar as figure 2 shows. During this period, the variables US dollar/Swiss franc and RMB/Swiss franc were almost de facto collinear. But is there some empirical validity for the assumption that those periods are markedly different? A way to answer this question is to estimate equation (1) for the period of RMB-dollar fixity. The results are reported in appendix table A.6. There are two notable and broad findings. First, and most important from the perspective of estimation methodology, we do find some imprints of the multicollinearity problem for the period of RMB-dollar fixity. For example, we find that there are many more cases of spurious coefficients; that is, where coefficients are significantly negative or significantly greater than 1 (see, for example, the CMCs for the dollar for Chile, Costa Rica, Mexico, Peru, South Korea, Indonesia, India, Singapore, and Ukraine). Second, in the cases where coefficients are stable, the dollar coefficient is higher in a majority of cases than in both periods of greater flexibility. Thus, our results are consistent with the proposition that multicollinearity is not a serious problem in the two windows that we have chosen for our analysis and that it is a bigger problem for the period when the RMB was de facto strongly pegged to the dollar.
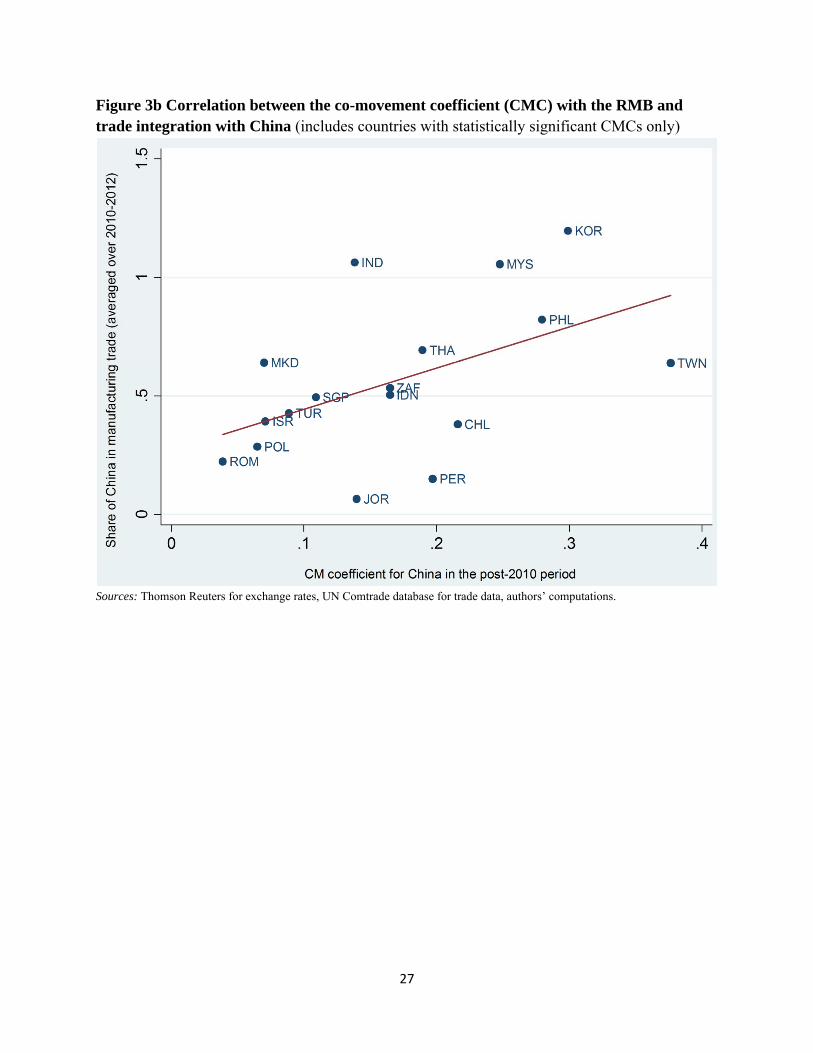
What Explains the Rise of the RMB Bloc (the Co-Movement Coefficient) In this section, we present the results of the second stage of the analysis, which are based on estimating equation (5) discussed earlier. Trade is the obvious candidate for explaining the rise of the RMB. Indeed, a simple scatter plot shows that the correlation between trade integration with China and the CMC with the RMB is positive and significant, when we take all data points but also when we restrict the sample to significant CMCs. Figures 3a and 3b show the positive relationship, with a significant slope of 1.69 when all countries are in the regression and 1.74 when restricted to countries with a statistically significant CMC in the first stage.
13 Pontines and Siregar (2010) make a similar point for Asian countries on monthly data: There seems to be a “fear of appreciation” relative to the RMB.

13
The more formal results are presented in table 6. We run equation (5) for two samples: The larger sample comprises the CMC for all available countries in the sample14; the smaller is restricted to those CMCs that are statistically significant. The table shows that there is a positive and significant relationship between countries’ CMC with China and their trade integration with China. The trade integration variable is significant in the larger sample when entered alone (column 1) and even after controlling for common price and financial market shocks (column 4) (in both cases at the 95 percent confidence level). For the much smaller sample too, the trade integration variable is significant but weaker after controlling for other shocks, but given the very small sample this is not surprising. Is the RMB Bloc Related to Trade Integration with or Competition against China? A currency could co-move with the RMB because it is integrated with China in terms of common supply chains. A related but distinctly different reason for co-movement could be if policy targets the RMB because countries do not want their domestic manufacturers to lose competitive advantage vis-à-vis Chinese exporters. In other words, the reason for the co-movement could be competition against rather than integration with China. How can we distinguish the two? One way of measuring competition is to see if a country exports products similar to China’s. Mattoo, Mishra, and Subramanian (2012) develop such an index of competition relative to China. Unfortunately, they compute this index for fewer emerging-market countries than contained in our sample. When we introduce this index of competition (which is country-specific), it has consistently the right sign (the more a country competes with China, the more likely its currency is to track the RMB). But it is not consistently significant in a statistical sense (in table 7, the index is statistically significant in column 2 but not in column 1). And when we run a horse race between this competition variable and a pure integration variable, the latter trumps the former. So, the evidence, albeit limited, favors an explanation for co-movement that is more related to trade integration than competition, although a role for the latter cannot be ruled out. One reason for that last caveat relates to the findings reported in table 5. It seems that outside East Asia, more countries track the RMB when it depreciates than when it appreciates. Moreover, the average magnitude of the CMCs outside East Asia more than doubles in such instances. So, we cannot rule out entirely a competitive pressure motivation for currencies to track the RMB. Is the RMB Bloc an East Asia Phenomenon or a Trade Phenomenon? Given the fact that the rise of the RMB has been strongest in East Asia, we need to probe further to check if the observed correlation between trade and currency co-movements with the RMB represents a pure trade phenomenon or a regional phenomenon that has to do with characteristics (political, for example) other than trade. We test this in table 8.
14 Our original 52 countries sample falls to 48 in this part because data on trade with China for Hong Kong, Mongolia, Serbia, and Uruguay are either missing or of bad quality (Hong Kong due to entrepôt trade).
14
When we introduce an East Asian dummy to explain the co-movements with the RMB, the trade variable declines in significance (columns 2 and 4). But when the trade variable is defined not in terms of manufacturing but total trade (excluding oil), it remains significant even after the inclusion of the East Asian dummy (column 6) and after controlling for common price and financial shocks (column 8). All this is suggestive of the emerging RMB bloc being not just an East Asian phenomenon but also a broader trade phenomenon. This suggests the potential for a global RMB bloc beyond Asia with trade as a driving force. And the nascent signs of such a development are the earlier findings that the RMB is the dominant reference currency in Chile, India, and Israel (not to mention Macedonia) and is the second-most important reference currency for South Africa and Turkey. The Importance of Trade: Other Evidence from Co-Movements with the Dollar If indeed there are economic explanations for co-movements with the RMB, they should in principle also be able to explain co-movements with other reference currencies. As a kind of robustness exercise, we extend the analysis to CMC with the dollar. We take the estimates of the CMCs with the dollar obtained from estimating equation (1) and correlate them with the same variables we used above in explaining CMCs relative to the RMB (i.e., we estimate equation (5) this time replacing all the China-related variables with US-related ones). These results are shown in table 9. We find, interestingly, that just as trade integration with China explained co-movements with the RMB, so too trade integration with the United States explains CMCs relative to the dollar. The trade integration variable is statistically significant even after controlling for other common shocks with the United States (column 4). It is also striking that the trade coefficients in the case of the dollar are consistently smaller than the counterpart coefficients for the RMB. For example, after controlling for all common shocks, the CMC relative to the dollar is 1.53, whereas the counterpart coefficient is 1.82 for the RMB (table 6, column 4). This means that a 1 percentage point increase in trade integration with the United States will lead to a 1.5 percentage point increase in the CMC with the dollar but a 1.82 percentage point increase in the CMC with the RMB. Robustness We conducted a number of robustness checks. First, we used alternative measures of trade integration (all non-oil trade instead of manufacturing trade) and found similar results (table 8, columns 5 to 8 illustrate this). Second, trade could be endogenous to currency co-movements. To address this partially we used initial period (2005–08) values for trade instead of contemporaneous values and found similar results. It does not affect our baseline results—as shown in appendix table A.7. It even reinforces the main coefficient, hinting at the fact that the CMCs are affected by financial common shocks and to an even larger extent, bilateral trade.

15
IV Comparison with Other Recent Findings The literature on the internationalization of the RMB has grown very large over the last couple of years.15 But the relevant literature for us relates to currency movements. We are not the first to look at the rise of the RMB through the method of Haldane and Hall (1991) and Frankel and Wei (1994). Chen, Peng, and Shu (2009) analyze the inclusion of the RMB in a potential basket for Asian countries. They first remove the dollar component from the RMB exchange rate (as shown in equations (2) and (3), and over a sample of 9 East Asian countries, they find significant positive coefficients for the period after July 2005 until mid-2009. Park and Song (2011) prefer to neutralize the dollar effect by regressing the exchange rate of various Asian currencies to the dollar over the RMB/dollar exchange rate, and show a high degree of correlation. Pontines and Siregar (2010) find that the RMB has triggered a “fear of appreciating” for Indonesia, Korea, Philippines, and Thailand. Henning (2012) uses the four different periods in RMB regime evolution in the last seven years to assess the weight of the RMB and confirms this evolution for eight Asian countries, especially in the most recent period, as does Ito (2012). In a more elaborate approach, Balasubramaniam, Patnaik, and Shah (2011) observe a large number of currencies and find that the RMB has played a significant role over several countries, both inside and outside Asia (with a concentration in East Asia). However, they see this role as quantitatively small. An interesting innovation in their work is that they try to detect structural breaks (following Frankel and Xie 2010) in their sample and obtain 375 currency-period observations for which only a small subset outside Asia reveal a significant RMB effect. In a similar spirit, Fang, Huang, and Niu (2012) estimate a time-varying coefficient version of the de facto currency basket regression. They observe significant and continuously rising weights of the RMB over the period from 2005 to mid-2011 for five Asian currencies. Drawing on those consistent results, there is a rich literature concerned with the consequences of an Asian exchange rate convergence. For example, Kawai (2012) draws lessons from the Japanese experience for the internationalization of the RMB. He also argues for regional cooperation: “strategic regional cooperation could facilitate, and mitigate obstacles to, RMB internationalization” and the creation of an Asian Currency Unit. More technically, Girardin (2011) argues that Asian currencies have been targeting a synthetic composite exchange rate of various Asian currencies rather than a given dominant currency. Finally, in a recent paper, most close to our approach, Fratzscher and Mehl (2011) analyze in depth the role of the RMB in various countries. They analyze a set of 48 currencies and show in a first step that a synthetic “regional exchange rate” has acquired a significant and rising importance in the determination of various countries’ exchange rate in Asia and then use a Granger causation approach to determine that RMB movements have an impact on regional 15 In addition to Subramanian (2011), see also Frankel (2012), Eichengreen (2010), Yu Yongding (2012), Ito (2011), Ma and McCauley (2010) and Mallaby and Wethington (2012). Most papers conclude that the Chinese currency will not be a significant player before China liberalizes its capital account and before significant progress is made in reforming its domestic financial markets. Yu (2012) worries about a possible backlash if internationalization were to precede domestic liberalization. Gao and Yu (2011) analyze the benefits and costs of the internationalization of the RMB, positing in particular the huge costs for China of holding reserves in US dollars. Most recently, Vallée (2012) takes stock of the steps already taken by Chinese authorities in setting a market for RMB assets.

16
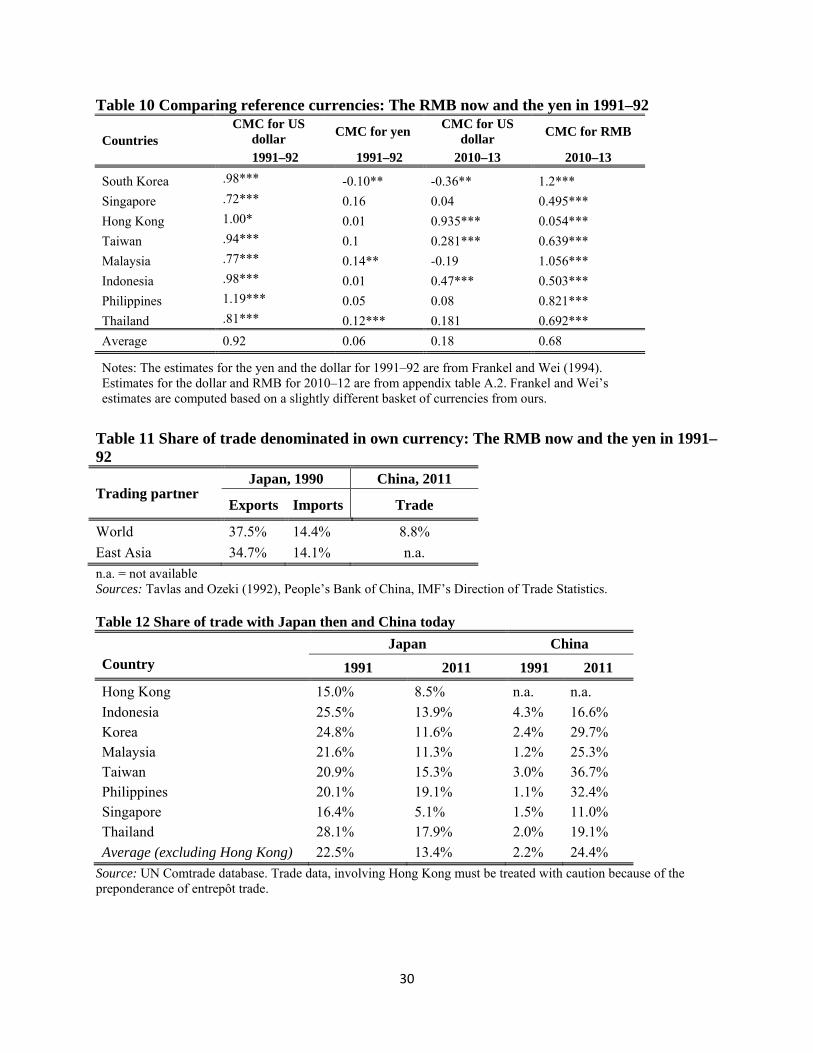
exchange rates. They also analyze announcements by officials from the People’s Bank of China to assess whether they could have an effect on other countries’ currencies through their impact on the RMB. In the last step, they show that the level of real and financial linkages with China matter for monetary influence. Fratzscher and Mehl thus claim to have found a “tri-polar currency system,” with the US dollar, the RMB, and the euro all having a region of dominance. However, as discussed earlier, one drawback is that their approach has the effect of assuming dollar dominance without allowing a fair horse race to be run between the dollar and other currencies, including the RMB. One consequence is that it is not possible to compare the effects of the different currencies.16 Thus, while the general trend toward a rising role of the RMB has been detected in the literature, ours is the first to compare clearly and directly their respective importance and to draw sharp conclusions, including the fact that the RMB has eclipsed the dollar in East Asia and is showing signs of moving beyond. V History and a Projection The rise of the yen in the late 1980s offers a close historical precedent for the rise of the RMB today.17 For East Asian countries, Japan accounted for 22.5 percent of total trade in 1991 compared with 24.4 percent today for trade with China. But the interesting contrast is this: The yen was never a reference currency and there was no yen bloc then like there seems to be today with the RMB as we have shown. On the other hand, the extent to which East Asian trade with Japan was denominated and settled in yen was far greater than China’s trade today. Take currency first. Frankel and Wei (1994) estimated regressions very similar to equation (1) for eight Asian countries (Thailand, Malaysia, Singapore, Korea, Hong Kong, Indonesia, the Philippines, and Hong Kong). The average value of the CMC relative to the dollar for these countries (for the period 1991–92, which was in some ways the apogee of the Japan miracle) was 0.92 compared with 0.06 for the yen. The comparable numbers from our analysis today are 0.18 for the dollar and 0.68 for the RMB (table 10). In other words, the yen at the peak of the Japanese miracle was not a significant reference currency at all even in neighboring East Asia and the dollar reigned supreme; in contrast, today, the RMB has eclipsed the dollar as the dominant reference currency. In contrast, on an important metric of currency internationalization, namely the extent to which international trade is denominated in that currency, the yen then far surpassed the RMB today. Krugman (1984) has noted three rules with respect to denomination of trade. First, a higher share of exports than imports is denominated in home currency. Second, all else being equal the country that is larger in size tends to see its currency used as the unit of account Third, for homogenous commodities and financial transactions the dominant global international currency tends to be used overwhelmingly.
16 In other words, they estimate equation (4) rather than equation (1) shown above. 17 See in particular Takagi (2011) for an account of the failed attempt to internationalize the yen.

17
Certainly, the Japanese yen even as a unit of account was never as pervasive as the Deutsche mark or the dollar. But for our purposes, the interesting evidence from table 11 is that the yen was used to a much greater extent as a vehicle for trade transactions in the 1990s (one-third of Japanese exports and about 15 percent of Japanese imports were invoiced in yen) than the renminbi is today (less than 10 percent). A number of reasons could explain the contrasting developments of the yen and the RMB as reference currencies and units of account. Overall trade can be dismissed as an explanation of the differences between the behavior of the yen and RMB as reference currencies. As table 12 shows, the overall share of trade of East Asian countries with Japan in 1991 was very similar to the share of these countries’ trade with China today. Of course, it is possible that the nature of trade differed: Although our results do not provide strong evidence, East Asian countries perhaps compete more with China today than they did with Japan in the early 1990s because Japan’s productivity differential with East Asian countries was far greater and hence the scope for competition more limited.18 And two reasons for the greater use of the yen in trade transactions could be that Japan’s capital account was more open then than China’s is today; and second, Japan had more multinational firms engaged in trade than China does today. For large firms with cross-border activities, accounting becomes easier if done in the home currency. In other words, China’s financial and external sector opening may be a condition for a more rapid use of the RMB as a unit of account and medium of exchange.1920 What about the future? Our estimates suggest that the average value of the CMCs across all 52 countries is 0.43 for the dollar and 0.21 for the RMB. Can the RMB overtake the dollar as a global reference currency and if so when? In terms of our estimates that amounts to asking when the average CMC for the RMB will overtake that for the dollar. Suppose, for example, that trade is a key driver of the CMC. Based on our results, we can make a prediction, admittedly rough. In the core specifications, as described earlier, the coefficient of trade integration for the RMB is 1.82 while that for the dollar is 1.53. In our sample, the average trade share with China and the United States are, respectively, 13.4 and 12.8 percent. Based on simple gravity-based trade projections, and assuming future growth rates of GDP as in Subramanian (2011), the share of China in these countries’ trade will increase by about 6 percentage points and that of the United States will decline by about 4 percentage points. Applying these changes to the coefficient estimates suggest that by 2030 the average CMC for
18 It is worth noting that since 1991, trade with Japan declined sharply as Japan’s growth decelerated sharply. 19 It is possible that if we were to include countries in Central Asia or sub-Saharan Africa where China has been acquiring a significant trade, finance, and investment presence, there would be greater signs of RMB use as a conventional reserve currency. 20 It is interesting to note that a lot of the discussion in the late 1980s and early 1990s was about why the yen had not assumed as large an international presence as say the Deutsche mark despite the size of Japan’s economy and trade (Kawai 2012). Invoicing in yen was lower than that for the mark and also as noted above the yen had did not become a reference currency in East Asia. In this paper we highlight a different contrast, where on trade invoicing the RMB has not even acquired the presence that Japan had at the time of Japan’s rise.

18
China (0.33) will approach that of the United States (0.37) but will not surpass it.21 Extending these projections yields 2037 as the date when the global RMB currency bloc emerges. In other words, while trade has been and can be an important driver for the rise of the RMB as a reference currency, it cannot on its own ensure the eclipse of the dollar globally until the mid-2030s. However, if China reforms its financial and external sectors consistent with ensuring the rise of the RMB as the preeminent reserve currency within the next 10 to 15 years, that would also bring forward the date for the emergence of a global RMB currency bloc, eclipsing the dollar. At that point—to paraphrase Graham Greene’s quote—one might ask whether we have to start talking of a renminbi rather than dollar love. References Balasubramaniam, Vimal, Ila Patnaik, and Ajay Shah. 2011. Who Cares about the Chinese Yuan? NIPFP Working Paper No. 89. New Delhi: National Institute of Public Finance and Policy. Calvo, G., and C. Reinhart. 2002. Fear of Floating. Quarterly Journal of Economics 107 (May): 379–408. Cavoli, Tony, and Ramkishen Rajan. 2010. A Note on Exchange Rate Regimes in Asia: Are they Really What They Claim to Be? Economics Bulletin 30, no.4 (November): 2864–76. Chen H., W. Peng, and C. Shu. 2009. The Potential of the Renminbi as an International Currency. BIS Asian Research Program Research Papers. Basel: Bank for International Settlements. Eichengreen, Barry. 2010. The Renminbi as an International Currency. Policy Paper, January. Mimeo. Fang, Ying, Shicheng Huang, and Linlin Niu. 2012. De Facto Currency Baskets of China and East Asian Economies: The Rising Weights. Mimeo. Fitch Solutions. 2008. FitchSolutions’ Probability of Default Index. Quantitative Research Note. Available at www.fitchratings.com/web_content/product/pdindex_methodology.pdf Frankel, Jeffrey. 2012. Internationalization of the RMB and Historical Precedents. Journal of Economic Integration 27, no. 3: 329–65. Frankel, Jeffrey, and Shang-Jin Wei. 1994. Yen Bloc or Dollar Bloc? Exchange Rate Policies of the East Asian Economies. In Macroeconomic Linkages: Savings, Exchange Rates and Capital Flows, eds. Takatoshi Ito and Anne O. Krueger. Chicago: University of Chicago Press.
21 We assume the following annual GDP growth rates for the next 20 years for this calculation: China (6.5 percent); United States (2.5 percent); sample countries and rest of the world (4 percent).
19
Frankel, Jeffrey, and Shang-Jin Wei. 2007. Assessing China’s Exchange Rate Regime. Economic Policy 22, no. 51: 575–614. Frankel, Jeffrey, and Daniel Xie. 2010. Estimation of De Facto Flexibility Parameter and Basket Weights in Evolving Exchange Rate Regimes. American Economic Review 100 (May): 568–72. Fratzscher, Marcel, and Arnaud Mehl. 2011. China’s Dominance Hypothesis and the Emergence of a Tri-polar Global Currency System. CEPR Discussion Paper No. 8671. Washington: Center for Economic and Policy Research. Gao, Haihong, and Yongding Yu. 2011. Internationalisation of the Renminbi. In Currency internationalisation: Lessons from the global financial crisis and prospects for the future in Asia and the Pacific 61: 105–124. Basel: Bank for International Settlements. Girardin, Eric. 2011. A De Facto Asian-Currency Unit Bloc in East Asia: It Has Been There but We Did Not Look for It. Working Paper Series 11/262. Tokyo: Asian Development Bank Institute. Haldane, A. G., and S. G. Hall. 1991. Sterling’s relationship with the dollar and the Deutschemark: 1976–89. Economic Journal 101: 436–43. Henning, C. Randall. 2012. Choice and Coercion in East Asian Exchange Rate Regimes. Working Paper 12-15. Washington: Peterson Institute for International Economics. IMF (International Monetary Fund). 2010. How Did Emerging Market Countries Fare during the Crisis? IMF Policy Paper. Available at www.imf.org/external/np/pp/eng/2010/061510.pdf Ito, Takatoshi. 2011. The Internationalization of the RMB: Opportunities and Pitfalls. CGS/IIGG Working Paper. New York: Council on Foreign Relations. Kawai, Masahiro. 2012. Renminbi (RMB) Internationalization: Japan and China. Presentation at the Renminbi Internationalization: Japan and the People’s Republic of China event, Beijing, People’s Bank of China, May 21. Available at www.adbi.org/conf-seminarpapers/2012/05/29/5072.renminbi.internationalization.japan.prc/30 Kenen, Peter. 1983. The Role of the Dollar as an International Currency. Occasional Papers No. 13. New York: Group of Thirty. Krugman, Paul. 1984. The International Role of the Dollar: Theory and Prospect. In Exchange Rate Theory and Practice, eds., J. Bilson and R. Marston. Chicago: University of Chicago Press. Levy-Yeyati, Eduardo, and Federico Sturzenegger. 2005. Classifying Exchange Rate Regimes: Deeds vs. Words. European Economic Review 49, no. 6 (August): 1603–35.
20
Ma, Guonan, and Robert McCauley. 2010. The Evolving Renminbi Regime and Implications for Asian Currency Stability. BIS Working Paper No. 312. Basel: Bank for International Settlements. Mallaby, Sebastian, and Olin Wethington. 2012. The Future of the Yuan: China’s Struggle to Internationalize Its Currency. Foreign Affairs (January/February). Mattoo, Aaditya, Prachi Mishra, and Arvind Subramanian. 2012. Spillover Effects of Exchange Rates: A Study of the Renminbi. IMF Working Paper 12/88. Washington: International Monetary Fund. Park, Yung Chul, and Chi-Young Song. 2011. Renminbi Internationalization: Prospects and Implications for Economic Integration in East Asia. Asian Economic Papers 10, no. 3: 42–72. People’s Bank of China. 2005. Public Announcement of the People’s Bank of China on Reforming the RMB Exchange Rate Regime. Beijing. Available at www.pbc.gov.cn/publish/english/955/2001/20014/20014_.html. People’s Bank of China. 2010. People’s Bank of China Statement on Yuan Exchange-Rate Flexibility. Beijing. Available at www.pbc.gov.cn/english/detail.asp?col=6400&id=1488. Pontines, V., and R. Siregar. 2010. Fear of Appreciation in East and Southeast Asia: The Role of the Chinese Renminbi. SEACEN Research and Training Centre Working Paper No. sp78. Kuala Lumpur: South East Asian Central Banks. Subramanian, Arvind. 2011. Eclipse: Living in the Shadow of China’s Economic Dominance. Washington: Peterson Institute for International Economics. Takagi, Shinji. 2011. Internationalising the yen, 1984–2003: Unfinished agenda or mission impossible? In Currency internationalisation: Lessons from the global financial crisis and prospects for the future in Asia and the Pacific 61: 75–92. Basel: Bank for International Settlements. Tavlas, George S., and Yuzuru Ozeki. 1992. The Internationalization of Currencies: An Appraisal of the Japanese Yen. IMF Occasional Paper No. 90. Washington: International Monetary Fund. Vallée, Shahin. 2012. The Internationalization Path of the Renminbi. Bruegel Working Paper 2012/05. Brussels: Bruegel. Yu, Yongding. 2012. Revisiting the Internationalization of the Renminbi. ADBI Working Paper No. 366. Manila: Asian Development Bank Institute.

21
Table 1 Roles of an international currency Function Use by governments Use by private agents Store of value (allows transactions to be conducted over long periods and geographical distances)
International reserves Foreign currencies become substitutes for a domestic currency because the latter is prone to inflation and volatility. In the extreme, foreign currencies can even become legal tender
Medium of exchange (avoids inefficiencies of barter)
Vehicle for foreign exchange intervention
Settling trade and financial transactions
Unit of account (facilitates valuation and calculation)
Anchor for pegging local currency
Denominating/invoicing trade and financial transactions
Source: Adapted from Kenen (1983). Figure 1a Exchange rate of selected East Asian currencies, January 2004–July 2013 (nominal bilateral rate versus US dollar; normalized at 100 in July 2005)
Source: University of British Columbia, Pacific Exchange Rate Service, authors’ computations.
22
Figure 1b Exchange rate of selected East Asian currencies, January 2010–July 2013 (nominal bilateral rate versus US dollar; normalized at 100 in July 2010)
Source: University of British Columbia, Pacific Exchange Rate Service, authors’ computations.
23
Figure 2 The RMB/US dollar nominal bilateral exchange rate, January 2002–July 2013
Source: University of British Columbia, Pacific Exchange Rate Service.
Table 2a Evolution of co-movement coefficients: Number of increases and declines between July 2010–July 2013 compared with July 2005–August 2008
US dollar RMB Euro Yen
Declines 36 20 33 31
of which: significant 11 0 14 9 Increases 16 32 19 21
of which: significant 1 11 4 6
Total 52 52 52 52 Table 2b: Evolution in average magnitude of co-movement coefficients
Currency July 2005– August 2008
July 2010– July 2013
Change
US dollar 0.56 0.43 -0.13
RMB 0.12 0.21 0.09
Euro 0.47 0.38 -0.09
Yen -0.02 -0.02 0.00 Note: For each currency, the number represents the simple average of the relevant coefficient (ρ1 for US dollar, ρ2 for RMB, etc.) estimated from equation (1) for 52 countries in the sample. Source: Authors’ calculations.

24
Table 3 Co-movement coefficients (CMCs) in East Asia
a. Number of countries by dominant reference currency
b. Number of countries with a significant CMC
Currency July 2005–
August 2008 July 2010– July 2013
Change
US dollar 9 6 -3
RMB 4 8 4 Euro 7 8 1
Yen 4 1 -3
Total 10 10 n.a.
c. Average magnitude of CMCs
Currency July 2005–
August 2008 July 2010– July 2013
Change
RMB 0.26 0.55 0.29
US dollar 0.61 0.34 -0.27 Euro 0.25 0.12 -0.13
Yen 0.04 -0.01 -0.05
Note: In tables 3a and 3b, the number in each cell represents the number of countries for which the reference currency has the highest value of CMC for that period or has a significant CMC. In table 3c, the number is the average (across all 10 East Asian countries) value of the CMC. Source: Authors’ calculations.
Currency July 2005–
August 2008 July 2010– July 2013
Change
US dollar 6 3 -3
RMB 3 7 4 Euro 1 0 -1 Yen 0 0 0
Total 10 10 n.a.
25
Table 4 Co-movement coefficients (CMCs) “outside backyard” a. Number of countries by dominant reference currency
Period US dollar RMB Euro Yen
(N = 37) (N = 42) (N = 28) (N = 42)
July 2005–August 2008 16 1 4 0 in % of "out of backyard" sample 43.2% 2.4% 14.3% 0.0%
July 2010–July 2013 11 3 2 0 in % of "out of backyard" sample 29.7% 7.1% 7.1% 0.0%
Change -5 2 -2 0 in % of "out of backyard" sample -13.5% 4.8% -7.1% 0.0%
b. Number of countries with a significant CMC
Period US dollar RMB Euro Yen
(N = 37) (N = 42) (N = 28) (N = 42)
July 2005–August 2008 22 7 12 2 in % of "out of backyard" sample 59.5% 16.7% 42.9% 4.8%
July 2010–July 2013 19 11 15 2 in % of "out of backyard" sample 51.4% 26.2% 53.6% 4.8%
Change -3 4 3 0 in % of "out of backyard" sample -8.1% 9.5% 10.7% 0.0%
c. Average value of CMCs
Currency July 2005–
August 2008 July 2010– July 2013
Change
US dollar 0.449 0.267 -0.182
RMB 0.088 0.128 0.04 Euro 0.217 0.11 -0.107
Yen -0.03 -0.022 0.008 Note: “Backyard” refers to countries in the natural region of influence (regions are defined according to the broad categories of the World Bank). So, for the dollar, “outside backyard” means all countries except Latin America, for the RMB and the yen, all countries except East Asia, and for the euro, all countries except emerging Europe, Middle East and North Africa. Source: Authors’ calculations.
26
Table 5 Are CMCs symmetric between depreciations and appreciations?
Number of significant CMCs
Number of dominant CMCs
Average magnitude of CMCs
Sample
East Asia
Outside East Asia
East Asia
Outside East Asia
East Asia
Outside East Asia
(N = 10) (N = 42) (N = 10) (N = 42) (N = 10) (N = 42) Baseline (784 days) 8 11 7 3 0.55 0.13
Days where the renminbi depreciates relative to the US dollar (343 days)
7 12 6 8 0.54 0.27
Source: Authors’ calculations. Figure 3a Correlation between the co-movement coefficient (CMC) with the RMB and trade integration with China (all countries)
Sources: Thomson Reuters for exchange rates, UN Comtrade database for trade data, authors’ computations.
27
Figure 3b Correlation between the co-movement coefficient (CMC) with the RMB and trade integration with China (includes countries with statistically significant CMCs only)
Sources: Thomson Reuters for exchange rates, UN Comtrade database for trade data, authors’ computations.

28
Table 6 Correlation between co-movement coefficients (CMCs) with RMB and country’s relationship with China
1 2 3 4 5 6 7 8
All countries Countries with significant CMCs only
Share of China in manufacturing trade
1.692** 1.819** 1.736** 1.220
[0.777] [0.696] [0.714] [0.914]
Co-movement of inflation with China
-0.115** -0.117*** 0.066 0.022
[0.048] [0.041] [0.295] [0.261]
Co-movement of stock market index with China
1.573*** 1.100*** 1.534* 0.923
[0.417] [0.404] [0.725] [0.935] Observations 48 50 39 39 17 17 17 17 Adjusted R-squared 0.150 0.074 0.254 0.427 0.202 -0.061 0.168 0.152
Standard errors in brackets
* p<0.10, ** p<0.05, *** p<0.01 Note: Share of China in manufacturing trade is an average taken over 2010 and 2012. Co-movements of inflation are constructed by regressing the consumer price index (CPI) in each country in the sample over Chinese CPI (CPI data come from the IMF's International Financial Statistics). The same is done for stock market index (Shanghai Stock Exchange A Share Index for China and reference index for other countries where such data was available: see full description in the appendix B). Source: Authors’ calculations.
Table 7 Correlation between co-movement coefficients (CMCs) with RMB and country’s relationship with China: Is it trade with or competition against China? 1 2 3
All countries
Index of competition with China 1.184 2.143** 0.901
[1.139] [0.932] [0.979]
Co-movement of inflation with China -0.157***
-0.153***
[0.042] [0.044]
Co-movement of stock market index with China
1.656*** 1.244**
[0.426] [0.517]
Share of China in manufacturing trade 1.513
[1.007]
Observations 43 32 32 Adjusted R-squared 0.009 0.333 0.366
Standard errors in brackets
* p<0.10, ** p<0.05, *** p<0.01 Note: Index of competition with China is taken from Mattoo, Mishra, and Subramanian (2012). See note to table 6 for the other variables. Source: Authors’ calculations.

29
Table 8 Correlation between co-movement coefficients (CMCs) with RMB and country’s relationship with China: Is it trade or East Asia?
1 2 3 4 5 6 7 8 All countries
Share of China in manufacturing trade 1.692** 0.519 1.819** 0.853 [0.777] [0.578] [0.696] [0.583]
Share of China in total trade 2.291*** 1.246** 1.836*** 1.071** [0.593] [0.526] [0.653] [0.456]
Co-movement of inflation -0.117***
-0.156*** -0.109**
-0.153***
[0.041] [0.044] [0.041] [0.046]
Co-movement of stock market index 1.100*** 0.774* 0.980** 0.627 [0.404] [0.414] [0.411] [0.411]
East Asia & Pacific dummy 0.491*** 0.359*** 0.413*** 0.363*** [0.148] [0.123] [0.136] [0.110]
Constant -0.014 0.062 -0.090 0.022 -0.061 -0.005 -0.057 0.025 [0.092] [0.073] [0.080] [0.080] [0.067] [0.063] [0.066] [0.064]
Observations 48 48 39 39 48 48 39 39 Adjusted R-squared 0.150 0.346 0.427 0.509 0.259 0.396 0.425 0.529 Standard errors in brackets * p<0.10, ** p<0.05, *** p<0.01 Note: See notes to table 6. Source: Authors’ calculations.
Table 9 Correlation between co-movement coefficients (CMCs) with dollar and country’s relationship with the United States 1 2 3 4 5 6 7 8
All countries Countries with significant CMC for United States only
Share of US in manufacturing trade 1.301*** 1.525** 0.542 0.481
[0.367] [0.607] [0.383] [0.766]
Co-movement of inflation with US 0.056*** 0.068 0.039*** 0.046
[0.009] [0.056] [0.005] [0.039]
Co-movement of stock market index with the Dow Jones
-0.225 -0.290 0.129 0.080
[0.298] [0.323] [0.221] [0.262] Observations 48 50 39 39 29 31 20 20 Adjusted R-squared 0.128 0.101 -0.007 0.084 0.031 0.147 -0.043 -0.114
Standard errors in brackets, * p<0.10, ** p<0.05, *** p<0.01 Notes: See notes to table 6. Source: Authors’ calculations.
30
Table 10 Comparing reference currencies: The RMB now and the yen in 1991–92
Countries CMC for US
dollar CMC for yen
CMC for US dollar
CMC for RMB
1991–92 1991–92 2010–13 2010–13
South Korea .98*** -0.10** -0.36** 1.2***
Singapore .72*** 0.16 0.04 0.495***
Hong Kong 1.00* 0.01 0.935*** 0.054***
Taiwan .94*** 0.1 0.281*** 0.639***
Malaysia .77*** 0.14** -0.19 1.056***
Indonesia .98*** 0.01 0.47*** 0.503***
Philippines 1.19*** 0.05 0.08 0.821***
Thailand .81*** 0.12*** 0.181 0.692***
Average 0.92 0.06 0.18 0.68
Notes: The estimates for the yen and the dollar for 1991–92 are from Frankel and Wei (1994). Estimates for the dollar and RMB for 2010–12 are from appendix table A.2. Frankel and Wei’s estimates are computed based on a slightly different basket of currencies from ours.
Table 11 Share of trade denominated in own currency: The RMB now and the yen in 1991–92
Trading partner Japan, 1990 China, 2011
Exports Imports Trade
World 37.5% 14.4% 8.8%
East Asia 34.7% 14.1% n.a.
n.a. = not available Sources: Tavlas and Ozeki (1992), People’s Bank of China, IMF’s Direction of Trade Statistics. Table 12 Share of trade with Japan then and China today
Country
Japan China
1991 2011 1991 2011
Hong Kong 15.0% 8.5% n.a. n.a.
Indonesia 25.5% 13.9% 4.3% 16.6% Korea 24.8% 11.6% 2.4% 29.7% Malaysia 21.6% 11.3% 1.2% 25.3% Taiwan 20.9% 15.3% 3.0% 36.7% Philippines 20.1% 19.1% 1.1% 32.4% Singapore 16.4% 5.1% 1.5% 11.0% Thailand 28.1% 17.9% 2.0% 19.1%
Average (excluding Hong Kong) 22.5% 13.4% 2.2% 24.4%
Source: UN Comtrade database. Trade data, involving Hong Kong must be treated with caution because of the preponderance of entrepôt trade.
31
Appendix A Additional tables Table A.1 Sample of countries by region
East Asia & Pacific
South Asia Europe & Central Asia
Latin America & Caribbean
Middle East & Africa
Hong Kong India Albania Argentina Egypt Indonesia Pakistan Belarus Bolivia Israel Malaysia Sri Lanka Bosnia Brazil Jordan Mongolia Bulgaria Chile Lebanon Philippines Croatia Colombia Morocco Singapore Czech Republic Costa Rica Tunisia South Korea Georgia Dominican Republic South Africa Taiwan Hungary Ecuador Thailand Latvia El Salvador Vietnam Lithuania Guatemala
Macedonia Jamaica Poland Mexico Romania Paraguay Russia Peru Serbia Uruguay Turkey
Ukraine

32
Table A.2 Full results of estimating equation (1) in text
Country
US dollar CMC RMB CMC Euro CMC R-squared July
2005–August
2008
July 2010–
July 2013
July 2005–
August 2008
July 2010–
July 2013
July 2005–
August 2008
July 2010–
July 2013
July 2005–
August 2008
July 2010–July 2013
1 Albania 0.266*** 0.122* -0.067 -0.050 0.776*** 0.916*** 0.608 0.917 2 Argentina 0.888*** 0.983*** 0.113 0.014 0.031 0.009 0.89 0.983 3 Belarus 0.972*** 1.521** 0.026** -0.587 0.008 -0.091 0.998 0.098 4 Bolivia 1.031*** 0.994*** -0.026 0.004 -0.006 0.001 0.96 0.999 5 Bosnia 0 0.000 0 -0.000 1.000*** 1.000*** 1 1.000 6 Brazil -0.101 0.231 0.827*** 0.267 1.343*** 0.538*** 0.426 0.488 7 Bulgaria -0.006 0.017* 0.008 -0.012 0.997*** 0.997*** 0.993 0.998 8 Chile 0.31 0.259 0.414** 0.379** 0.673*** 0.356*** 0.489 0.552 9 Colombia 0.707*** 0.730*** 0.174 0.009 0.845*** 0.294*** 0.472 0.639 10 Costa Rica 0.980*** 1.030*** 0.016 -0.045 0.001 0.031* 0.884 0.906 11 Croatia -0.049 -0.046 0.07 0.034 0.999*** 0.995*** 0.742 0.917 12 Czech Republic -0.005 -0.186 -0.061 0.022 1.077*** 1.145*** 0.398 0.777 13 Dominican Republic 0.988*** 1.118*** 0.039 -0.080 -0.024 -0.067** 0.416 0.761 14 Ecuador 1.000*** 1.000*** -0.000* 0.000 0 -0.000 1 1.000 15 Egypt 0.936*** 0.938*** 0.068 0.032 -0.004 0.015 0.967 0.958 16 El Salvador 1.000*** 1.000*** 0 -0.000*** 0 0.000 1 1.000 17 Georgia 1.021*** 0.827*** 0.008 0.183 0.042 0.016 0.851 0.825 18 Guatemala 0.966*** 0.976*** 0.03 -0.001 -0.035 0.019 0.919 0.946 19 Hong Kong 0.976*** 0.935*** 0.014 0.054*** -0.004 0.016*** 0.997 0.998 20 Hungary -0.228 -0.543*** 0.141 0.232 1.716*** 1.465*** 0.462 0.644 21 India 0.645*** -0.245 0.211* 1.063*** 0.359*** 0.228*** 0.766 0.680 22 Indonesia 0.621*** 0.473*** 0.162 0.503*** 0.467*** 0.049** 0.567 0.877 23 Israel 0.212 0.164 0.408** 0.393*** 0.618*** 0.464*** 0.457 0.737 24 Jamaica 0.944*** 0.954*** 0.06 0.040 0.023 -0.000 0.954 0.967 25 Jordan 1.027*** 0.935*** -0.027 0.066** 0.012 -0.000 0.988 0.988 26 Latvia 0.035 0.073*** -0.032 -0.060*** 0.997*** 0.988*** 0.872 0.989 27 Lebanon 0.987*** 0.972*** 0.009 0.024 0.015 0.009 0.992 0.989 28 Lithuania 0.002 0.001 -0.002 -0.001 1.001*** 1.000*** 1 1.000 29 Macedonia 0.066 -0.084 0.877*** 0.641*** 0.015 0.477*** 0.566 0.598 30 Malaysia 0.214** -0.188 0.653*** 1.056*** 0.312*** 0.181*** 0.811 0.791 31 Mexico 0.668*** 0.364* 0.258* 0.225 0.519*** 0.556*** 0.716 0.531 32 Mongolia 0.972*** 0.979*** 0.029 0.044 0.018 -0.022 0.985 0.851 33 Morocco 0.200*** 0.139*** -0.007 0.043 0.806*** 0.821*** 0.907 0.983 34 Pakistan 1.046*** 1.000*** -0.045 0.015 -0.027 -0.007 0.786 0.961 35 Paraguay 1.105*** 1.143*** -0.12 -0.134 -0.12 -0.052 0.618 0.577 36 Peru 0.997*** 0.786*** 0.001 0.150* 0.102 0.081*** 0.761 0.909 37 Philippines 0.696*** 0.076 0.163 0.821*** 0.334*** 0.121*** 0.701 0.837 38 Poland -0.166 -0.546*** 0.097 0.286* 1.347*** 1.363*** 0.413 0.707 39 Romania 0.093 -0.285*** -0.085 0.223** 1.557*** 1.118*** 0.455 0.851 40 Russia 0.506*** 0.219 0.053 0.240 0.466*** 0.658*** 0.906 0.639 41 Serbia 0.201 -0.266* -0.141 0.307** 0.943*** 0.987*** 0.195 0.687 42 Singapore 0.343*** 0.039 0.300*** 0.495*** 0.445*** 0.387*** 0.828 0.820 43 South Africa 0.271 -0.379 0.078 0.533* 1.782*** 0.842*** 0.362 0.358 44 South Korea 0.261 -0.359** 0.580*** 1.196*** 0.498*** 0.197*** 0.647 0.662 45 Sri Lanka 0.973*** 0.855*** 0.036 0.131 -0.023 0.003 0.915 0.844 46 Taiwan 0.359*** 0.281*** 0.519*** 0.639*** 0.205*** 0.092*** 0.84 0.914 47 Thailand 0.522** 0.181* 0.29 0.692*** 0.201* 0.121*** 0.464 0.867 48 Tunisia 0.328*** 0.228*** -0.056 0.087 0.662*** 0.662*** 0.884 0.900 49 Turkey 0.259 0.035 0.432 0.427*** 1.681*** 0.624*** 0.464 0.656 50 Ukraine 0.959*** 0.977*** 0.019 -0.001 0.091 0.015* 0.696 0.975 51 Uruguay 1.125*** 0.730*** -0.101 0.277 -0.074 -0.064* 0.793 0.634 52 Vietnam 1.112*** 1.008*** -0.113** -0.013 0.024 0.014 0.962 0.892
33
Source: Authors’ calculations. Table A.3 Full results of estimating equation (1) but using special drawing rights (SDR) instead of Swiss franc as numeraire
Country
US dollar CMC RMB CMC Euro CMC R-squared July
2005– August
2008
July 2010– July 2013
July 2005–
August 2008
July 2010–
July 2013
July 2005–
August 2008
July 2010–July 2013
July 2005–
August 2008
July 2010–
July 2013
1 Albania 0.238* 0.239*** -0.065 -0.045 0.766*** 1.029*** 0.307 0.754 2 Argentina 0.886*** 1.068*** 0.112 0.021 0.019 0.083** 0.612 0.897 3 Belarus 0.968*** 1.093 0.025** -0.624 -0.002 -0.442 0.989 0.020 4 Bolivia 1.058*** 0.981*** -0.026 0.003 0.026 -0.011 0.826 0.996 5 Bosnia 0.001 0.003*** 0 -0.000 1.001*** 1.003*** 1 1.000 6 Brazil 0.008 -0.541* 0.691** 0.225 0.375 -0.190 0.146 0.037 7 Bulgaria -0.018 0.001 0.009 -0.013 0.988*** 0.981*** 0.992 0.995 8 Chile 0.21 -0.528* 0.363* 0.326* 0.149 -0.346* 0.101 0.045 9 Colombia 0.693* 0.444* 0.077 -0.007 0.048 0.024 0.145 0.066 10 Costa Rica 0.947*** 1.052*** 0.018 -0.039 -0.018 0.034 0.597 0.576 11 Croatia -0.112 -0.077 0.063 0.031 0.877*** 0.971*** 0.688 0.800 12 Czech Republic 0.073 -0.259 -0.07 0.014 1.089*** 1.093*** 0.418 0.652 13 Dominican Republic 0.529 1.079*** 0.045 -0.087 -0.48 -0.087 0.127 0.363 14 Ecuador 1.000*** 1.000*** 0 0.000 0 -0.000 1 1.000 15 Egypt 0.940*** 1.084*** 0.070* 0.040 0.016 0.151*** 0.853 0.769 16 El Salvador 1.000*** 1.000*** 0 0.000 0 0.000 1 1.000 17 Georgia 1.064*** 0.537*** -0.002 0.167 0.006 -0.257** 0.544 0.407 18 Guatemala 0.790*** 0.959*** 0.036 -0.001 -0.182** -0.001 0.69 0.712 19 Hong Kong 0.951*** 0.898*** 0.016 0.053*** -0.016 -0.022** 0.983 0.989 20 Hungary -0.447* -1.199*** 0.062 0.201 0.841*** 0.830*** 0.359 0.563 21 India 0.427** -0.745*** 0.178 1.031*** -0.148 -0.227 0.309 0.148 22 Indonesia 0.26 0.565*** 0.112 0.509*** -0.338* 0.134 0.129 0.487 23 Israel 0.208 -0.109 0.369* 0.378*** 0.297 0.207 0.053 0.061 24 Jamaica 0.996*** 0.990*** 0.056 0.041 0.048 0.036 0.804 0.816 25 Jordan 1.048*** 0.978*** -0.029 0.068** 0.021 0.041 0.942 0.924 26 Latvia -0.012 0.015 -0.032 -0.063*** 0.945*** 0.933*** 0.861 0.968 27 Lebanon 0.972*** 1.003*** 0.007 0.027 -0.016 0.035 0.96 0.932 28 Lithuania 0.001 0.001 -0.002 -0.001 0.999*** 1.000*** 1 1.000 29 Macedonia -0.274 -0.133 0.892*** 0.644*** -0.242 0.408** 0.187 0.036 30 Malaysia -0.001 -0.629*** 0.624*** 1.035*** -0.165 -0.244* 0.383 0.255 31 Mexico 0.519** -0.700** 0.198 0.163 -0.132 -0.431** 0.303 0.112 32 Mongolia 0.983*** 1.159*** 0.026 0.053 0.001 0.149 0.928 0.485 33 Morocco 0.130*** 0.111*** -0.007 0.042 0.733*** 0.791*** 0.746 0.912 34 Pakistan 0.921*** 1.006*** -0.038 0.015 -0.105 0.000 0.418 0.796 35 Paraguay 0.779*** 1.107*** -0.091 -0.140 -0.251 -0.069 0.23 0.190 36 Peru 1.197*** 0.653*** -0.018 0.144* 0.174 -0.049 0.391 0.532 37 Philippines 0.514** -0.147 0.135 0.810*** -0.09 -0.091 0.245 0.340 38 Poland -0.307 -1.116*** 0.059 0.254 0.877*** 0.831*** 0.355 0.627 39 Romania -0.112 -0.468*** -0.157 0.219** 0.751*** 0.928*** 0.3 0.706 40 Russia 0.509*** -0.588** 0.049 0.199 0.442*** -0.113 0.273 0.145 41 Serbia 0.104 -0.247 -0.136 0.309** 0.874*** 1.003*** 0.149 0.427 42 Singapore 0.049 -0.648*** 0.274*** 0.456*** -0.087 -0.254** 0.206 0.046 43 South Africa -0.66 -2.002*** -0.046 0.438 -0.249 -0.663** 0.166 0.159 44 South Korea 0.193 -0.937*** 0.525*** 1.167*** -0.022 -0.354** 0.202 0.146 45 Sri Lanka 0.967*** 0.814*** 0.04 0.130 0.005 -0.039 0.681 0.443 46 Taiwan 0.282** 0.098 0.495*** 0.631*** -0.069 -0.086 0.443 0.536 47 Thailand 0.379 -0.010 0.273 0.682*** -0.096 -0.058 0.099 0.378 48 Tunisia 0.208*** -0.009 -0.05 0.076 0.571*** 0.433*** 0.494 0.369 49 Turkey -0.061 -0.431* 0.266 0.414** -0.004 0.141 0.193 0.069 50 Ukraine 1.090*** 0.916*** 0.002 -0.004 0.102 -0.041 0.307 0.847

34
51 Uruguay 1.338*** 0.265 -0.094 0.229 0.217* -0.421** 0.451 0.220 52 Vietnam 1.162*** 0.906*** -0.118*** -0.018 0.038 -0.087 0.837 0.546
Source: Authors’ calculations. Table A.4 Robustness of co-movement coefficient (CMC) estimates: Controlling for external financial environment
a. Significant CMCs
Currency Period Baseline Including Fitch PD 1
year
Including Fitch PD 5
year
JP Morgan's
EMBI Global
JP Morgan's
EMBI Global
Diversified
VXEEM
RMB 07/2005 - 08/2008 11 11 11 11 9 n.a.
07/2010 - 07/2013 19 19 19 13 15 16
US dollar 07/2005 - 08/2008 35 36 36 39 39 NA
07/2010 - 07/2013 32 32 32 39 39 29 n.a. = not available Note: This table compares the co-movement coefficients (CMCs) obtained from estimating equation (1) (column 1) with those obtained from estimating equation (6) in the text (last 5 columns). The numbers denote the number of cases in which the CMC coefficient is statistically significant (at the 10 percent confidence interval). Fitch PDI 1 year and Fitch PDI 5 year are Fitch Solutions’ Probability of Default Index for Emerging Markets, respectively, at one year and five years. Both indices are interpreted as the likelihood of a default event occurring at a specified horizon (1-year or 5-year), aggregating over 25,000 entities in all sectors of the economy. See full description in Fitch Solutions (2008). JP Morgan Emerging Market Bond Index (EMBI) Global and Global Diversified are bond indices across emerging-market countries. The VXEEM—the equivalent of an Emerging Markets VIX index—is produced by the Chicago Board Options Exchange (CBOE) and tracks the market perception of risk through a variety of futures. As it is only available since April 2011, the equation including VXEEM is run only for the shorter period April 2011–August 2012. Source: Thomson Reuters Datastream. b. Magnitude of CMCs relative to RMB
Baseline
Fitch PD 1 year
Fitch PD 5 year
JP Morgan EMBI Global
JP Morgan EMBI Global
Diversified
VXEEM
Average CMC for US dollar 0.426 0.430 0.426 0.535 0.500 0.421
Largest deviation from baseline 0.002 0.001 0.036 0.029 0.283
Country with largest downward deviation from baseline
Czech Republic
South Korea
Costa Rica Costa Rica Malaysia
Note: The only difference with table 4a is that the numbers here represent the average CMC.

35
c. Magnitude of CMCs relative to US dollar
Baseline Fitch PD 1 year
Fitch PD 5 year
JP Morgan EMBI Global
JP Morgan EMBI Global
Diversified
VXEEM
Average CMC for RMB 0.201 0.206 0.207 0.127 0.160 0.218
Largest deviation from baseline 0.116 0.008 0.460 0.281 0.412
Country with largest downward deviation from baseline
South Korea
South Korea
South Africa
South Africa
Belarus
Table A.5 Is RMB tracking East Asian Currencies?
Currency (1) (2) (3) (4) (5) (6) (7) (8)
US dollar 0.935*** 0.909*** 0.902*** 0.941*** 0.861*** 0.909*** 0.897*** 0.821*** [0.009] [0.014] [0.012] [0.010] [0.016] [0.011] [0.013] [0.020]
Euro 0.020*** 0.027*** 0.020*** 0.007 0.018** 0.015** 0.019*** 0.009 [0.007] [0.007] [0.007] [0.009] [0.007] [0.007] [0.007] [0.008]
Japanese yen 0.001 0.001 0.001 -0.004 -0.000 0.002 -0.001 0.001 [0.006] [0.006] [0.006] [0.006] [0.006] [0.006] [0.006] [0.006]
Korean won 0.048*** -0.005 [0.007] [0.010]
Indonesian rupiah 0.067*** 0.019 [0.013] [0.014]
Philippine peso 0.081*** 0.026* [0.011] [0.015]
Singaporian dollar 0.062*** 0.002 [0.012] [0.015]
Taiwanese dollar 0.125*** 0.073*** [0.015] [0.020]
Malaysian ringgit 0.077*** 0.027** [0.009] [0.014]
Thai baht 0.089*** 0.031**
[0.012] [0.015] Observations 784 784 784 784 784 784 784 784 Adjusted R-squared 0.982 0.982 0.983 0.982 0.983 0.983 0.983 0.984
Note: In appendix tables A.2 and A.3, the dependent variable was the exchange rate of emerging-market currencies with the RMB featuring as an independent variable on the right-hand side. In this table, the RMB is the dependent variable, with the individual East Asian currencies on the right-hand side individually (columns 1 to 7) and collectively (column 8).
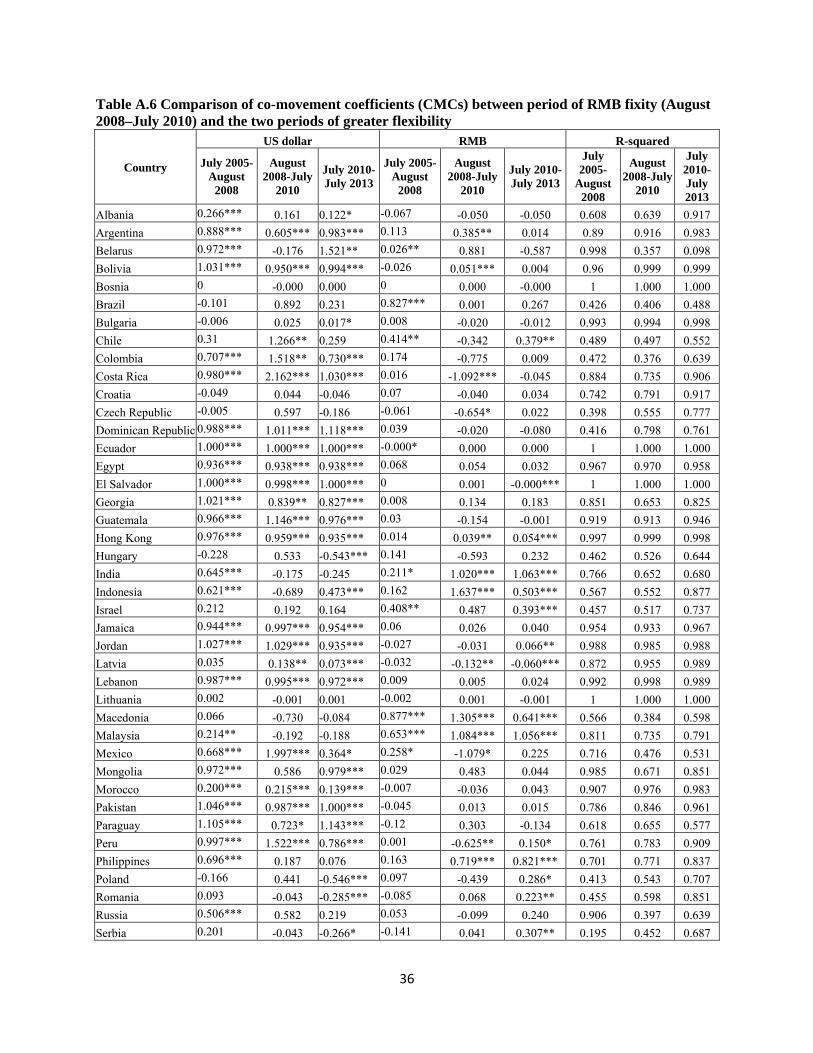
36
Table A.6 Comparison of co-movement coefficients (CMCs) between period of RMB fixity (August 2008–July 2010) and the two periods of greater flexibility
Country
US dollar RMB R-squared
July 2005-August
2008
August 2008-July
2010
July 2010-July 2013
July 2005-August
2008
August 2008-July
2010
July 2010-July 2013
July 2005-
August 2008
August 2008-July
2010
July 2010-July 2013
Albania 0.266*** 0.161 0.122* -0.067 -0.050 -0.050 0.608 0.639 0.917
Argentina 0.888*** 0.605*** 0.983*** 0.113 0.385** 0.014 0.89 0.916 0.983
Belarus 0.972*** -0.176 1.521** 0.026** 0.881 -0.587 0.998 0.357 0.098
Bolivia 1.031*** 0.950*** 0.994*** -0.026 0.051*** 0.004 0.96 0.999 0.999
Bosnia 0 -0.000 0.000 0 0.000 -0.000 1 1.000 1.000
Brazil -0.101 0.892 0.231 0.827*** 0.001 0.267 0.426 0.406 0.488
Bulgaria -0.006 0.025 0.017* 0.008 -0.020 -0.012 0.993 0.994 0.998
Chile 0.31 1.266** 0.259 0.414** -0.342 0.379** 0.489 0.497 0.552
Colombia 0.707*** 1.518** 0.730*** 0.174 -0.775 0.009 0.472 0.376 0.639
Costa Rica 0.980*** 2.162*** 1.030*** 0.016 -1.092*** -0.045 0.884 0.735 0.906
Croatia -0.049 0.044 -0.046 0.07 -0.040 0.034 0.742 0.791 0.917
Czech Republic -0.005 0.597 -0.186 -0.061 -0.654* 0.022 0.398 0.555 0.777
Dominican Republic 0.988*** 1.011*** 1.118*** 0.039 -0.020 -0.080 0.416 0.798 0.761
Ecuador 1.000*** 1.000*** 1.000*** -0.000* 0.000 0.000 1 1.000 1.000
Egypt 0.936*** 0.938*** 0.938*** 0.068 0.054 0.032 0.967 0.970 0.958
El Salvador 1.000*** 0.998*** 1.000*** 0 0.001 -0.000*** 1 1.000 1.000
Georgia 1.021*** 0.839** 0.827*** 0.008 0.134 0.183 0.851 0.653 0.825
Guatemala 0.966*** 1.146*** 0.976*** 0.03 -0.154 -0.001 0.919 0.913 0.946
Hong Kong 0.976*** 0.959*** 0.935*** 0.014 0.039** 0.054*** 0.997 0.999 0.998
Hungary -0.228 0.533 -0.543*** 0.141 -0.593 0.232 0.462 0.526 0.644
India 0.645*** -0.175 -0.245 0.211* 1.020*** 1.063*** 0.766 0.652 0.680
Indonesia 0.621*** -0.689 0.473*** 0.162 1.637*** 0.503*** 0.567 0.552 0.877
Israel 0.212 0.192 0.164 0.408** 0.487 0.393*** 0.457 0.517 0.737
Jamaica 0.944*** 0.997*** 0.954*** 0.06 0.026 0.040 0.954 0.933 0.967
Jordan 1.027*** 1.029*** 0.935*** -0.027 -0.031 0.066** 0.988 0.985 0.988
Latvia 0.035 0.138** 0.073*** -0.032 -0.132** -0.060*** 0.872 0.955 0.989
Lebanon 0.987*** 0.995*** 0.972*** 0.009 0.005 0.024 0.992 0.998 0.989
Lithuania 0.002 -0.001 0.001 -0.002 0.001 -0.001 1 1.000 1.000
Macedonia 0.066 -0.730 -0.084 0.877*** 1.305*** 0.641*** 0.566 0.384 0.598
Malaysia 0.214** -0.192 -0.188 0.653*** 1.084*** 1.056*** 0.811 0.735 0.791
Mexico 0.668*** 1.997*** 0.364* 0.258* -1.079* 0.225 0.716 0.476 0.531
Mongolia 0.972*** 0.586 0.979*** 0.029 0.483 0.044 0.985 0.671 0.851
Morocco 0.200*** 0.215*** 0.139*** -0.007 -0.036 0.043 0.907 0.976 0.983
Pakistan 1.046*** 0.987*** 1.000*** -0.045 0.013 0.015 0.786 0.846 0.961
Paraguay 1.105*** 0.723* 1.143*** -0.12 0.303 -0.134 0.618 0.655 0.577
Peru 0.997*** 1.522*** 0.786*** 0.001 -0.625** 0.150* 0.761 0.783 0.909
Philippines 0.696*** 0.187 0.076 0.163 0.719*** 0.821*** 0.701 0.771 0.837
Poland -0.166 0.441 -0.546*** 0.097 -0.439 0.286* 0.413 0.543 0.707
Romania 0.093 -0.043 -0.285*** -0.085 0.068 0.223** 0.455 0.598 0.851
Russia 0.506*** 0.582 0.219 0.053 -0.099 0.240 0.906 0.397 0.639
Serbia 0.201 -0.043 -0.266* -0.141 0.041 0.307** 0.195 0.452 0.687
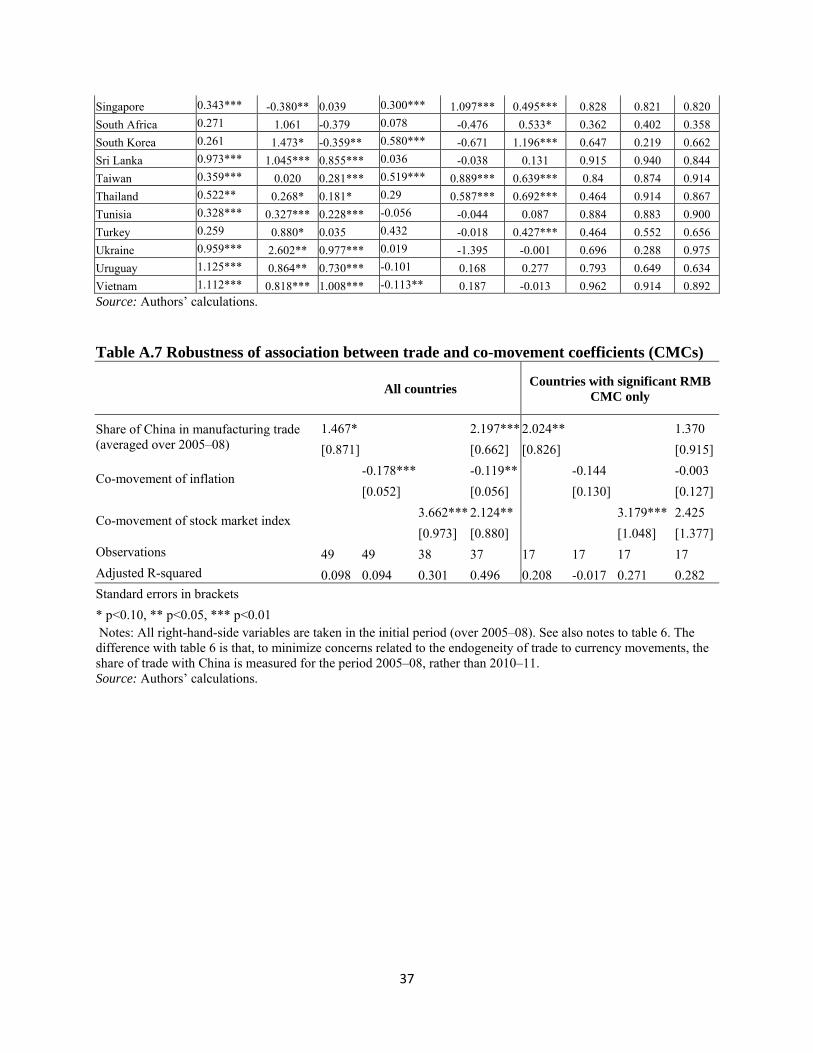
37
Singapore 0.343*** -0.380** 0.039 0.300*** 1.097*** 0.495*** 0.828 0.821 0.820
South Africa 0.271 1.061 -0.379 0.078 -0.476 0.533* 0.362 0.402 0.358
South Korea 0.261 1.473* -0.359** 0.580*** -0.671 1.196*** 0.647 0.219 0.662
Sri Lanka 0.973*** 1.045*** 0.855*** 0.036 -0.038 0.131 0.915 0.940 0.844
Taiwan 0.359*** 0.020 0.281*** 0.519*** 0.889*** 0.639*** 0.84 0.874 0.914
Thailand 0.522** 0.268* 0.181* 0.29 0.587*** 0.692*** 0.464 0.914 0.867
Tunisia 0.328*** 0.327*** 0.228*** -0.056 -0.044 0.087 0.884 0.883 0.900
Turkey 0.259 0.880* 0.035 0.432 -0.018 0.427*** 0.464 0.552 0.656
Ukraine 0.959*** 2.602** 0.977*** 0.019 -1.395 -0.001 0.696 0.288 0.975
Uruguay 1.125*** 0.864** 0.730*** -0.101 0.168 0.277 0.793 0.649 0.634
Vietnam 1.112*** 0.818*** 1.008*** -0.113** 0.187 -0.013 0.962 0.914 0.892 Source: Authors’ calculations. Table A.7 Robustness of association between trade and co-movement coefficients (CMCs)
All countries Countries with significant RMB
CMC only
Share of China in manufacturing trade (averaged over 2005–08)
1.467* 2.197*** 2.024** 1.370
[0.871] [0.662] [0.826] [0.915]
Co-movement of inflation -0.178*** -0.119** -0.144 -0.003
[0.052] [0.056] [0.130] [0.127]
Co-movement of stock market index 3.662*** 2.124** 3.179*** 2.425
[0.973] [0.880] [1.048] [1.377]
Observations 49 49 38 37 17 17 17 17
Adjusted R-squared 0.098 0.094 0.301 0.496 0.208 -0.017 0.271 0.282
Standard errors in brackets
* p<0.10, ** p<0.05, *** p<0.01 Notes: All right-hand-side variables are taken in the initial period (over 2005–08). See also notes to table 6. The difference with table 6 is that, to minimize concerns related to the endogeneity of trade to currency movements, the share of trade with China is measured for the period 2005–08, rather than 2010–11. Source: Authors’ calculations.

38
Appendix B Data sources
1. Exchange rate data All exchange rate data come from Thomson Reuters Datastream.
2. Trade data Trade data are from the United Nations’ Comtrade database. We use data from the import side because they are considered more reliable to distortions due to entrepôt trade. The two measures used in the paper are manufacturing trade (under SITC 2) and total non-oil trade. Three countries were excluded from the sample because Comtrade did not report their trade data for 2010–11: Mongolia, Serbia, and Uruguay. Hong Kong was also excluded; its entrepôt trade with China makes it difficult to construct a reliable measure of “actual” trade with China.
3. Financial data Data for inflation are consumer price index (CPI) monthly data from the IMF’s International Financial Statistics (IFS). Data on stock price indices were collected from Thomson Reuters Datastream, as the key index for each country. Here is the list of indices by country:
Country Name of Stock Exchange index Country Name of Stock Exchange index
Argentina ARGENTINA MERVAL Malaysia FTSE BURSA MALAYSIA KLCI
Brazil BRAZIL BOVESPA Morocco MOROCCO ALL SHARE (MASI)
Bulgaria BULGARIA SE SOFIX Pakistan KARACHI SE 100
Chile CHILE SANTIAGO SE GENERAL (IGPA) Peru LIMA SE GENERAL(IGBL)
China SHANGHAI SE A SHARE Philippines PHILIPPINE SE I(PSEi)
Colombia COLOMBIA IGBC INDEX Poland WARSAW GENERAL INDEX
Croatia CROATIA CROBEX Romania ROMANIA BET (L)
Czech Republic PRAGUE SE PX Russia RUSSIA RTS INDEX
Ecuador ECUADOR ECU (U$) South Korea KOREA SE COMPOSITE (KOSPI)
Egypt EGYPT HERMES FINANCIAL Singapore STRAITS TIMES INDEX L
Hong Kong HANG SENG Sri Lanka COLOMBO SE ALL SHARE
Hungary BUDAPEST (BUX) Taiwan TAIWAN SE WEIGHED TAIEX
India INDIA BSE (100) NATIONAL Thailand BANGKOK S.E.T.
Indonesia IDX COMPOSITE Tunisia TUNISIA TUNINDEX
Israel ISRAEL TA 100 Turkey ISTANBUL SE NATIONAL 100
Jamaica JAMAICA SE MAIN INDEX US DOW JONES INDUSTRIALS
Japan NIKKEI 225 STOCK AVERAGE Serbia BELGRADE BELEX 15
Jordan AMMAN SE FINANCIAL MARKET Ukraine MSCI UKRAINE
Latvia OMX RIGA (OMXR) Vietnam MSCI VIETNAM
Lebanon LEBANON BLOM Bosnia and Herzegovina MSCI BOSNIA AND HERZEGOVINA
Lithuania OMX VILNIUS (OMXV) Macedonia MACEDONIAN SE MBI 10
Mexico MEXICO IPC (BOLSA)