Embed Size (px)
Citation preview
Exchange Traded Funds (ETFs) 2013 J.P. Morgan Global ETF Handbook
This is intended for informational use only and is not intended as an offer to sell or buy shares of any ETF listed herein. Copyright 2013 JPMorgan Chase & Co. All rights reserved.
2
March 2011
ETFs allow an investor to quickly and easily obtain a desired market or benchmark exposure, by trading just a single security. ETF shares may offer intraday liquidity, and continuous, real-time trading and pricing.
ETFs are designed to allow an investor to quickly and easily obtain a desired market or benchmark exposure, by trading just a single security. ETF shares may offer intraday liquidity, and continuous, real-time trading and pricing.
May 2013
3
Exchange Traded Funds – ETFs ..................................... 4
ETF Market Overview ...................................................... 6
Quant-Based ETFs .......................................................... 8
China Equity Markets and the QFII Program ................. 13
Enhanced ETF Analytics ............................................... 17
Endnotes ....................................................................... 19
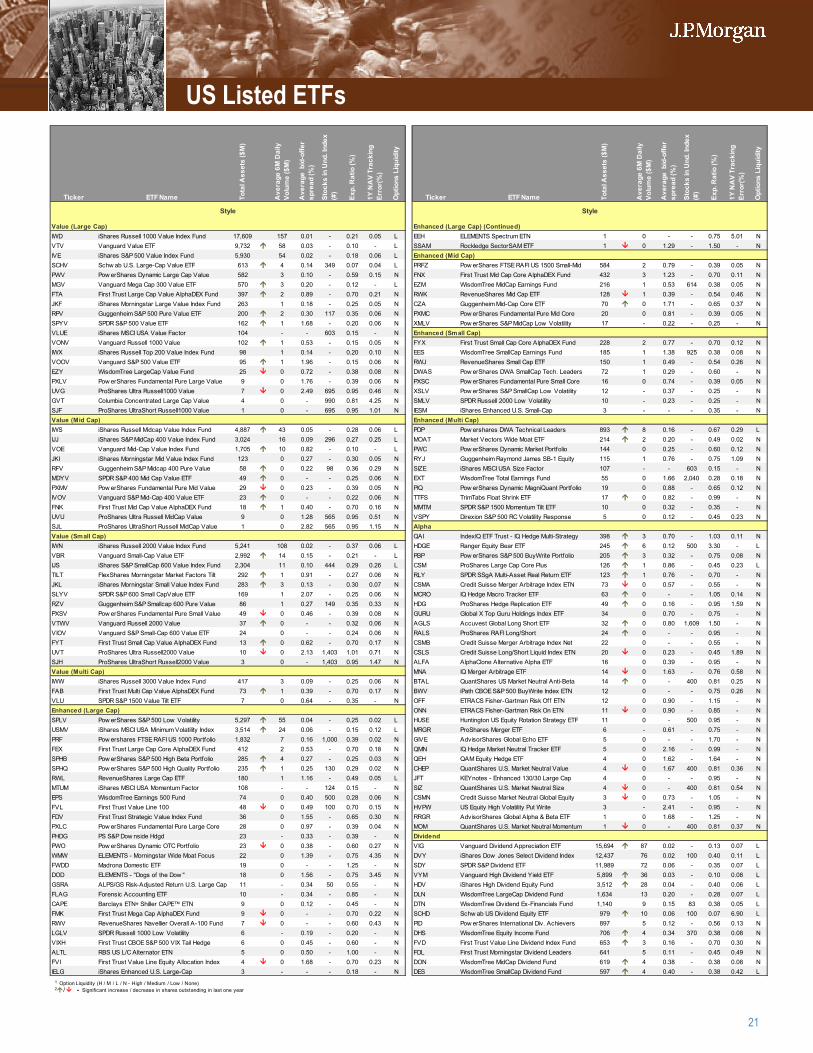
US Listed ETFs ............................................................. 20
Canada & Latin America Listed ETFs ............................ 30
EMEA Listed ETFs ........................................................ 36
Asia-Pacific Listed ETFs ................................................ 58
Contacts, Disclaimer & Disclosures ............................... 63
Table of Contents
4
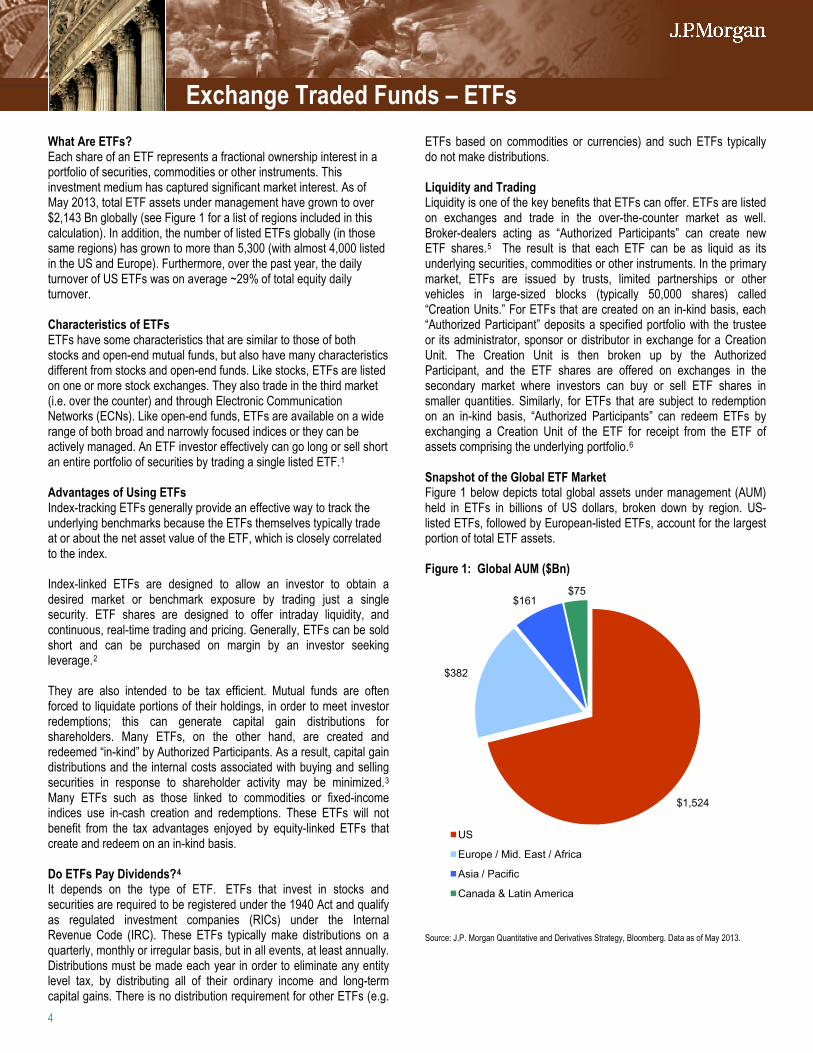
What Are ETFs? Each share of an ETF represents a fractional ownership interest in a portfolio of securities, commodities or other instruments. This investment medium has captured significant market interest. As of May 2013, total ETF assets under management have grown to over $2,143 Bn globally (see Figure 1 for a list of regions included in this calculation). In addition, the number of listed ETFs globally (in those same regions) has grown to more than 5,300 (with almost 4,000 listed in the US and Europe). Furthermore, over the past year, the daily turnover of US ETFs was on average ~29% of total equity daily turnover. Characteristics of ETFs ETFs have some characteristics that are similar to those of both stocks and open-end mutual funds, but also have many characteristics different from stocks and open-end funds. Like stocks, ETFs are listed on one or more stock exchanges. They also trade in the third market (i.e. over the counter) and through Electronic Communication Networks (ECNs). Like open-end funds, ETFs are available on a wide range of both broad and narrowly focused indices or they can be actively managed. An ETF investor effectively can go long or sell short an entire portfolio of securities by trading a single listed ETF.1
Advantages of Using ETFs Index-tracking ETFs generally provide an effective way to track the underlying benchmarks because the ETFs themselves typically trade at or about the net asset value of the ETF, which is closely correlated to the index.
Index-linked ETFs are designed to allow an investor to obtain a desired market or benchmark exposure by trading just a single security. ETF shares are designed to offer intraday liquidity, and continuous, real-time trading and pricing. Generally, ETFs can be sold short and can be purchased on margin by an investor seeking leverage.2
They are also intended to be tax efficient. Mutual funds are often forced to liquidate portions of their holdings, in order to meet investor redemptions; this can generate capital gain distributions for shareholders. Many ETFs, on the other hand, are created and redeemed “in-kind” by Authorized Participants. As a result, capital gain distributions and the internal costs associated with buying and selling securities in response to shareholder activity may be minimized.3 Many ETFs such as those linked to commodities or fixed-income indices use in-cash creation and redemptions. These ETFs will not benefit from the tax advantages enjoyed by equity-linked ETFs that create and redeem on an in-kind basis. Do ETFs Pay Dividends?4
It depends on the type of ETF. ETFs that invest in stocks and securities are required to be registered under the 1940 Act and qualify as regulated investment companies (RICs) under the Internal Revenue Code (IRC). These ETFs typically make distributions on a quarterly, monthly or irregular basis, but in all events, at least annually. Distributions must be made each year in order to eliminate any entity level tax, by distributing all of their ordinary income and long-term capital gains. There is no distribution requirement for other ETFs (e.g.
ETFs based on commodities or currencies) and such ETFs typically do not make distributions.
Liquidity and Trading Liquidity is one of the key benefits that ETFs can offer. ETFs are listed on exchanges and trade in the over-the-counter market as well. Broker-dealers acting as “Authorized Participants” can create new ETF shares.5 The result is that each ETF can be as liquid as its underlying securities, commodities or other instruments. In the primary market, ETFs are issued by trusts, limited partnerships or other vehicles in large-sized blocks (typically 50,000 shares) called “Creation Units.” For ETFs that are created on an in-kind basis, each “Authorized Participant” deposits a specified portfolio with the trustee or its administrator, sponsor or distributor in exchange for a Creation Unit. The Creation Unit is then broken up by the Authorized Participant, and the ETF shares are offered on exchanges in the secondary market where investors can buy or sell ETF shares in smaller quantities. Similarly, for ETFs that are subject to redemption on an in-kind basis, “Authorized Participants” can redeem ETFs by exchanging a Creation Unit of the ETF for receipt from the ETF of assets comprising the underlying portfolio.6
Snapshot of the Global ETF Market Figure 1 below depicts total global assets under management (AUM) held in ETFs in billions of US dollars, broken down by region. US-listed ETFs, followed by European-listed ETFs, account for the largest portion of total ETF assets. Figure 1: Global AUM ($Bn)
Source: J.P. Morgan Quantitative and Derivatives Strategy, Bloomberg. Data as of May 2013.
$1,524
$382
$161 $75
US
Europe / Mid. East / Africa
Asia / Pacific
Canada & Latin America
Exchange Traded Funds – ETFs
March 2011
ETFs allow an investor to quickly and easily obtain a desired market or benchmark exposure, by trading just a single security. ETF shares may offer intraday liquidity, and continuous, real-time trading and pricing.
5
Risks and Considerations ETF shareholders are subject to risks similar to those of holders of other portfolios of securities or commodities. A primary consideration is that the general level of prices within the portfolio may decline, adversely affecting the value of each ETF share for ETFs that provide long exposure. For ETFs providing inverse or “short” exposure, the value of the ETF will go down as the prices of the instruments in the underlying portfolio increases. In addition, ETF shares may decline in value if the overall depth and liquidity of the secondary market decreases. A sector-focused ETF may be adversely affected by the specific performance of its targeted benchmark. International investments may involve the risk of capital loss as a result of unfavorable fluctuations in currency values, differences in generally accepted accounting principles, or economic and political instability in the nations represented by issuers of the underlying securities or other countries. Actively managed ETFs may perform better or worse than the benchmark or market sector they are designed to beat. Although the net asset values of index-linked ETFs typically correlate closely to the underlying indices, the market prices for these ETFs (particularly in the case of certain fixed income index-linked ETFs) may be discounted as compared to the ETF's net asset value (NAV). Although index-linked ETFs are designed to provide investment results that generally correspond to the price and yield performance of their respective underlying indices, ETF managers may not be able to exactly replicate the performance of the indices because of expenses and other factors. ETF shareholders are typically subject to expense fees charged by the issuer, and transactions are subject to standard brokerage commissions and markups/markdowns. For a more comprehensive list of other risk factors, see the “Possible Risks of Investing in ETFs” section at the end of this document.
Exchange Traded Funds – ETFs
6
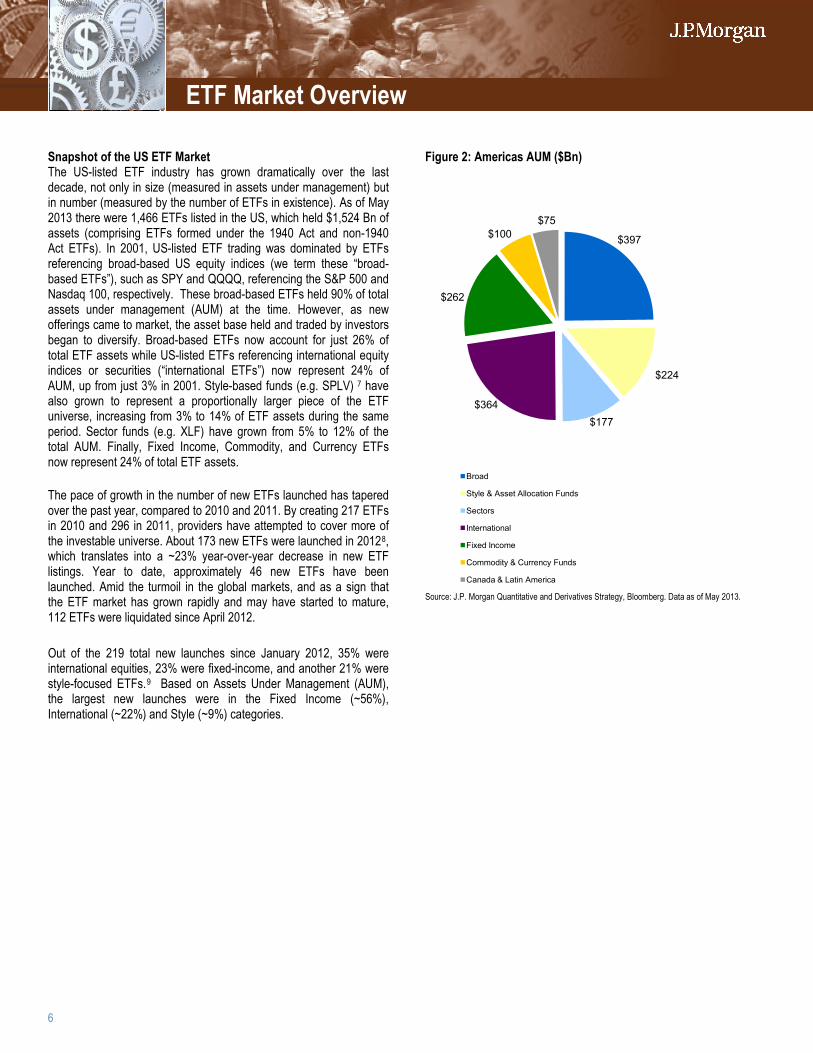
Snapshot of the US ETF Market The US-listed ETF industry has grown dramatically over the last decade, not only in size (measured in assets under management) but in number (measured by the number of ETFs in existence). As of May 2013 there were 1,466 ETFs listed in the US, which held $1,524 Bn of assets (comprising ETFs formed under the 1940 Act and non-1940 Act ETFs). In 2001, US-listed ETF trading was dominated by ETFs referencing broad-based US equity indices (we term these “broad-based ETFs”), such as SPY and QQQQ, referencing the S&P 500 and Nasdaq 100, respectively. These broad-based ETFs held 90% of total assets under management (AUM) at the time. However, as new offerings came to market, the asset base held and traded by investors began to diversify. Broad-based ETFs now account for just 26% of total ETF assets while US-listed ETFs referencing international equity indices or securities (“international ETFs”) now represent 24% of AUM, up from just 3% in 2001. Style-based funds (e.g. SPLV) 7
have also grown to represent a proportionally larger piece of the ETF universe, increasing from 3% to 14% of ETF assets during the same period. Sector funds (e.g. XLF) have grown from 5% to 12% of the total AUM. Finally, Fixed Income, Commodity, and Currency ETFs now represent 24% of total ETF assets.
The pace of growth in the number of new ETFs launched has tapered over the past year, compared to 2010 and 2011. By creating 217 ETFs in 2010 and 296 in 2011, providers have attempted to cover more of the investable universe. About 173 new ETFs were launched in 20128
, which translates into a ~23% year-over-year decrease in new ETF listings. Year to date, approximately 46 new ETFs have been launched. Amid the turmoil in the global markets, and as a sign that the ETF market has grown rapidly and may have started to mature, 112 ETFs were liquidated since April 2012.
Out of the 219 total new launches since January 2012, 35% were international equities, 23% were fixed-income, and another 21% were style-focused ETFs.9
Based on Assets Under Management (AUM), the largest new launches were in the Fixed Income (~56%), International (~22%) and Style (~9%) categories.
Figure 2: Americas AUM ($Bn)
Source: J.P. Morgan Quantitative and Derivatives Strategy, Bloomberg. Data as of May 2013.
$397
$224
$177 $364
$262
$100 $75
Broad
Style & Asset Allocation Funds
Sectors
International
Fixed Income
Commodity & Currency Funds
Canada & Latin America
ETF Market Overview
7
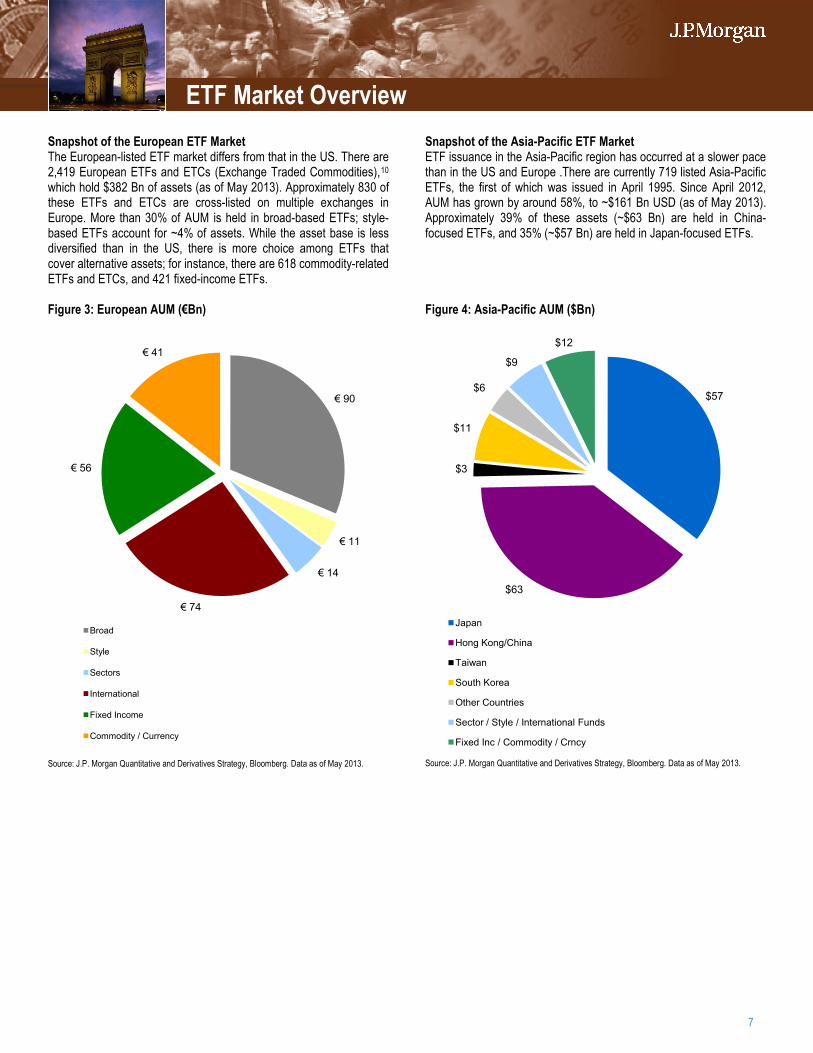
Snapshot of the European ETF Market The European-listed ETF market differs from that in the US. There are 2,419 European ETFs and ETCs (Exchange Traded Commodities),10
which hold $382 Bn of assets (as of May 2013). Approximately 830 of these ETFs and ETCs are cross-listed on multiple exchanges in Europe. More than 30% of AUM is held in broad-based ETFs; style-based ETFs account for ~4% of assets. While the asset base is less diversified than in the US, there is more choice among ETFs that cover alternative assets; for instance, there are 618 commodity-related ETFs and ETCs, and 421 fixed-income ETFs. Figure 3: European AUM (€Bn)
Source: J.P. Morgan Quantitative and Derivatives Strategy, Bloomberg. Data as of May 2013.
Snapshot of the Asia-Pacific ETF Market ETF issuance in the Asia-Pacific region has occurred at a slower pace than in the US and Europe .There are currently 719 listed Asia-Pacific ETFs, the first of which was issued in April 1995. Since April 2012, AUM has grown by around 58%, to ~$161 Bn USD (as of May 2013). Approximately 39% of these assets (~$63 Bn) are held in China-focused ETFs, and 35% (~$57 Bn) are held in Japan-focused ETFs. Figure 4: Asia-Pacific AUM ($Bn)
Source: J.P. Morgan Quantitative and Derivatives Strategy, Bloomberg. Data as of May 2013.
€ 90
€ 11
€ 14
€ 74
€ 56
€ 41
Broad
Style
Sectors
International
Fixed Income
Commodity / Currency
$57
$63
$3
$11
$6
$9
$12
Japan
Hong Kong/China
Taiwan
South Korea
Other Countries
Sector / Style / International Funds
Fixed Inc / Commodity / Crncy
ETF Market Overview
8
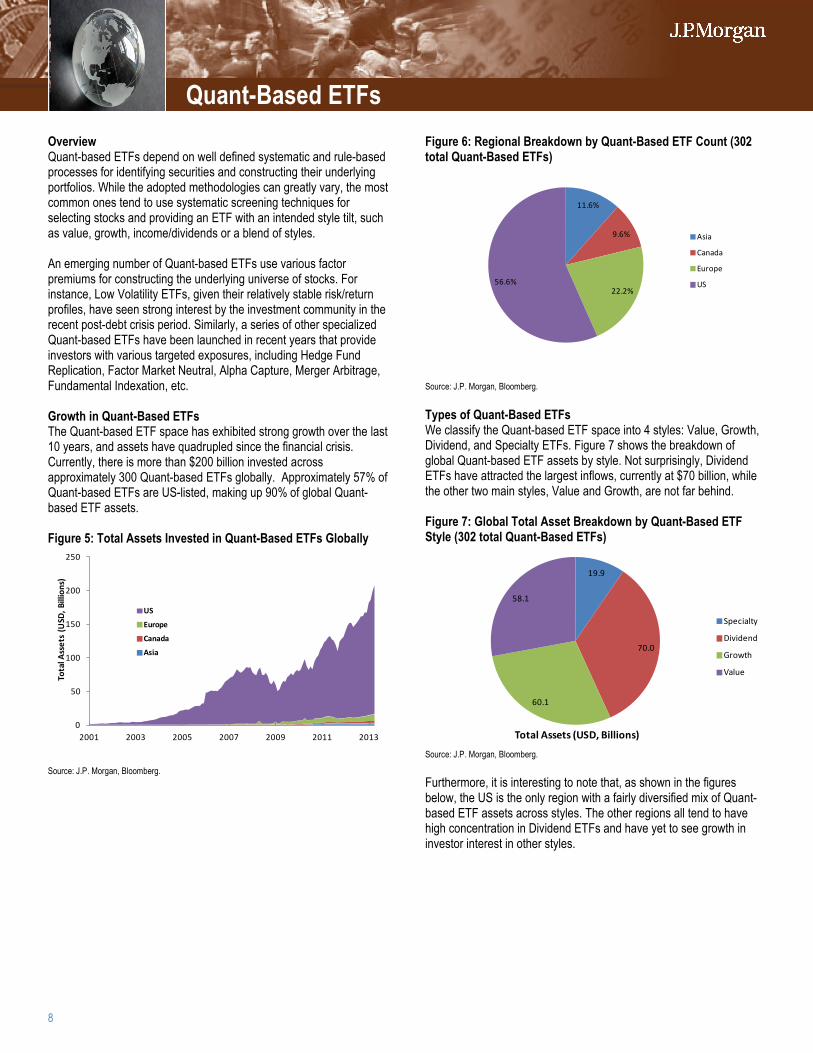
Overview Quant-based ETFs depend on well defined systematic and rule-based processes for identifying securities and constructing their underlying portfolios. While the adopted methodologies can greatly vary, the most common ones tend to use systematic screening techniques for selecting stocks and providing an ETF with an intended style tilt, such as value, growth, income/dividends or a blend of styles. An emerging number of Quant-based ETFs use various factor premiums for constructing the underlying universe of stocks. For instance, Low Volatility ETFs, given their relatively stable risk/return profiles, have seen strong interest by the investment community in the recent post-debt crisis period. Similarly, a series of other specialized Quant-based ETFs have been launched in recent years that provide investors with various targeted exposures, including Hedge Fund Replication, Factor Market Neutral, Alpha Capture, Merger Arbitrage, Fundamental Indexation, etc. Growth in Quant-Based ETFs
The Quant-based ETF space has exhibited strong growth over the last 10 years, and assets have quadrupled since the financial crisis. Currently, there is more than $200 billion invested across approximately 300 Quant-based ETFs globally. Approximately 57% of Quant-based ETFs are US-listed, making up 90% of global Quant-based ETF assets. Figure 5: Total Assets Invested in Quant-Based ETFs Globally
Source: J.P. Morgan, Bloomberg.
Figure 6: Regional Breakdown by Quant-Based ETF Count (302 total Quant-Based ETFs)
Source: J.P. Morgan, Bloomberg. Types of Quant-Based ETFs We classify the Quant-based ETF space into 4 styles: Value, Growth, Dividend, and Specialty ETFs. Figure 7 shows the breakdown of global Quant-based ETF assets by style. Not surprisingly, Dividend ETFs have attracted the largest inflows, currently at $70 billion, while the other two main styles, Value and Growth, are not far behind. Figure 7: Global Total Asset Breakdown by Quant-Based ETF Style (302 total Quant-Based ETFs)
Source: J.P. Morgan, Bloomberg. Furthermore, it is interesting to note that, as shown in the figures below, the US is the only region with a fairly diversified mix of Quant-based ETF assets across styles. The other regions all tend to have high concentration in Dividend ETFs and have yet to see growth in investor interest in other styles.
0
50
100
150
200
250
2001 2003 2005 2007 2009 2011 2013
Tota
l Ass
ets
(USD
, Bill
ions
)
US
Europe
Canada
Asia
11.6%
9.6%
22.2%56.6%
Asia
Canada
Europe
US
19.9
70.0
60.1
58.1
Total Assets (USD, Billions)
Specialty
Dividend
Growth
Value
Quant-Based ETFs
9
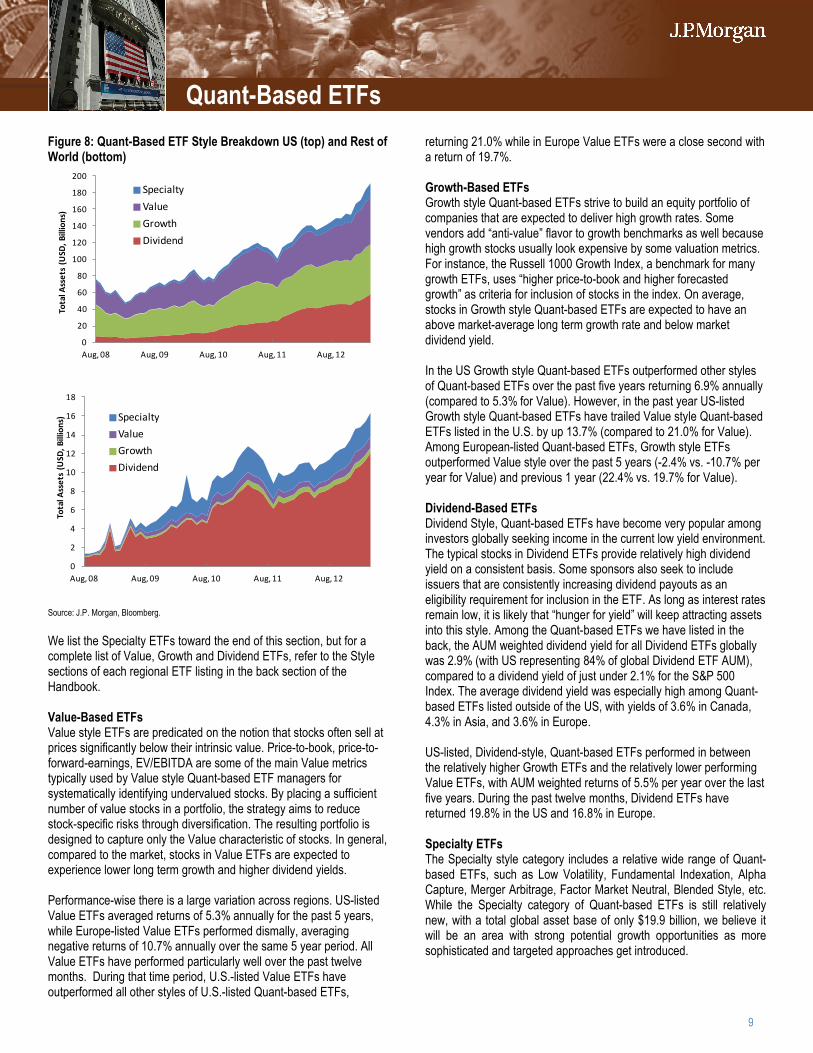
Figure 8: Quant-Based ETF Style Breakdown US (top) and Rest of World (bottom)
Source: J.P. Morgan, Bloomberg. We list the Specialty ETFs toward the end of this section, but for a complete list of Value, Growth and Dividend ETFs, refer to the Style sections of each regional ETF listing in the back section of the Handbook. Value-Based ETFs Value style ETFs are predicated on the notion that stocks often sell at prices significantly below their intrinsic value. Price-to-book, price-to-forward-earnings, EV/EBITDA are some of the main Value metrics typically used by Value style Quant-based ETF managers for systematically identifying undervalued stocks. By placing a sufficient number of value stocks in a portfolio, the strategy aims to reduce stock-specific risks through diversification. The resulting portfolio is designed to capture only the Value characteristic of stocks. In general, compared to the market, stocks in Value ETFs are expected to experience lower long term growth and higher dividend yields. Performance-wise there is a large variation across regions. US-listed Value ETFs averaged returns of 5.3% annually for the past 5 years, while Europe-listed Value ETFs performed dismally, averaging negative returns of 10.7% annually over the same 5 year period. All Value ETFs have performed particularly well over the past twelve months. During that time period, U.S.-listed Value ETFs have outperformed all other styles of U.S.-listed Quant-based ETFs,
returning 21.0% while in Europe Value ETFs were a close second with a return of 19.7%. Growth-Based ETFs Growth style Quant-based ETFs strive to build an equity portfolio of companies that are expected to deliver high growth rates. Some vendors add “anti-value” flavor to growth benchmarks as well because high growth stocks usually look expensive by some valuation metrics. For instance, the Russell 1000 Growth Index, a benchmark for many growth ETFs, uses “higher price-to-book and higher forecasted growth” as criteria for inclusion of stocks in the index. On average, stocks in Growth style Quant-based ETFs are expected to have an above market-average long term growth rate and below market dividend yield. In the US Growth style Quant-based ETFs outperformed other styles of Quant-based ETFs over the past five years returning 6.9% annually (compared to 5.3% for Value). However, in the past year US-listed Growth style Quant-based ETFs have trailed Value style Quant-based ETFs listed in the U.S. by up 13.7% (compared to 21.0% for Value). Among European-listed Quant-based ETFs, Growth style ETFs outperformed Value style over the past 5 years (-2.4% vs. -10.7% per year for Value) and previous 1 year (22.4% vs. 19.7% for Value). Dividend-Based ETFs Dividend Style, Quant-based ETFs have become very popular among investors globally seeking income in the current low yield environment. The typical stocks in Dividend ETFs provide relatively high dividend yield on a consistent basis. Some sponsors also seek to include issuers that are consistently increasing dividend payouts as an eligibility requirement for inclusion in the ETF. As long as interest rates remain low, it is likely that “hunger for yield” will keep attracting assets into this style. Among the Quant-based ETFs we have listed in the back, the AUM weighted dividend yield for all Dividend ETFs globally was 2.9% (with US representing 84% of global Dividend ETF AUM), compared to a dividend yield of just under 2.1% for the S&P 500 Index. The average dividend yield was especially high among Quant-based ETFs listed outside of the US, with yields of 3.6% in Canada, 4.3% in Asia, and 3.6% in Europe. US-listed, Dividend-style, Quant-based ETFs performed in between the relatively higher Growth ETFs and the relatively lower performing Value ETFs, with AUM weighted returns of 5.5% per year over the last five years. During the past twelve months, Dividend ETFs have returned 19.8% in the US and 16.8% in Europe. Specialty ETFs The Specialty style category includes a relative wide range of Quant-based ETFs, such as Low Volatility, Fundamental Indexation, Alpha Capture, Merger Arbitrage, Factor Market Neutral, Blended Style, etc. While the Specialty category of Quant-based ETFs is still relatively new, with a total global asset base of only $19.9 billion, we believe it will be an area with strong potential growth opportunities as more sophisticated and targeted approaches get introduced.
0
20
40
60
80
100
120
140
160
180
200
Aug, 08 Aug, 09 Aug, 10 Aug, 11 Aug, 12
Tota
l Ass
ets
(USD
, Bill
ions
)
SpecialtyValueGrowthDividend
0
2
4
6
8
10
12
14
16
18
Aug, 08 Aug, 09 Aug, 10 Aug, 11 Aug, 12
Tota
l Ass
ets
(USD
, Bill
ions
) SpecialtyValueGrowthDividend
Quant-Based ETFs
10
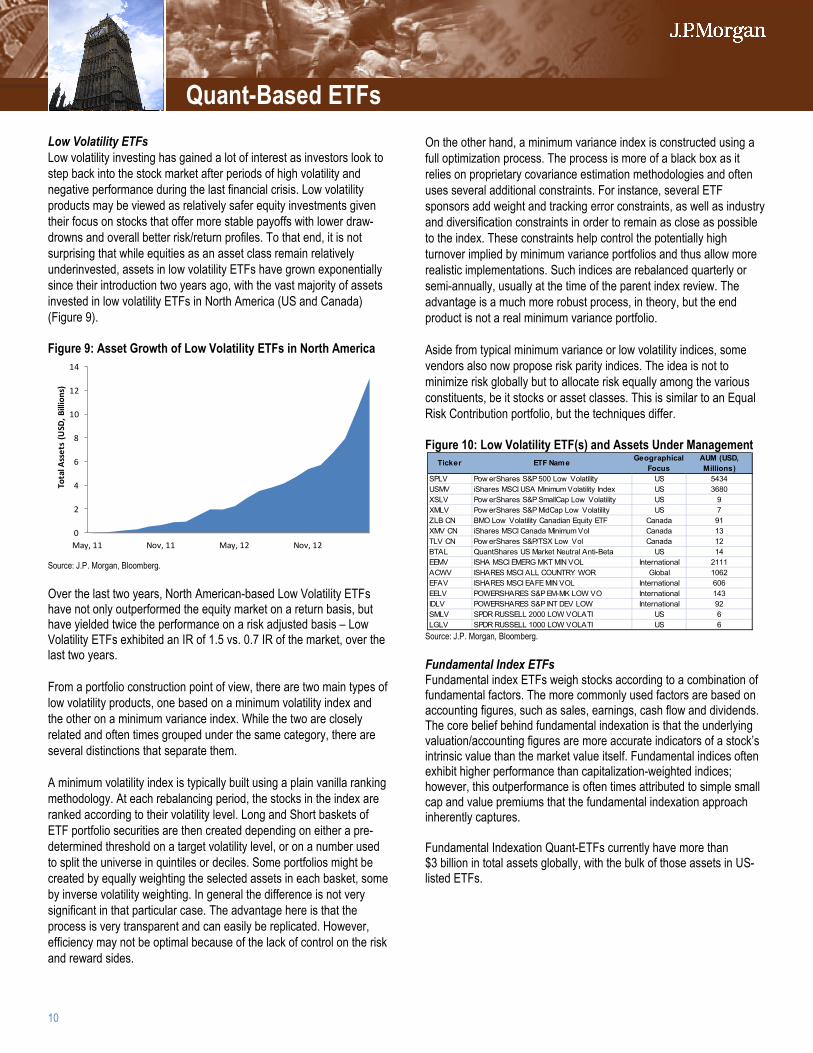
Low Volatility ETFs Low volatility investing has gained a lot of interest as investors look to step back into the stock market after periods of high volatility and negative performance during the last financial crisis. Low volatility products may be viewed as relatively safer equity investments given their focus on stocks that offer more stable payoffs with lower draw-drowns and overall better risk/return profiles. To that end, it is not surprising that while equities as an asset class remain relatively underinvested, assets in low volatility ETFs have grown exponentially since their introduction two years ago, with the vast majority of assets invested in low volatility ETFs in North America (US and Canada) (Figure 9). Figure 9: Asset Growth of Low Volatility ETFs in North America
Source: J.P. Morgan, Bloomberg. Over the last two years, North American-based Low Volatility ETFs have not only outperformed the equity market on a return basis, but have yielded twice the performance on a risk adjusted basis – Low Volatility ETFs exhibited an IR of 1.5 vs. 0.7 IR of the market, over the last two years. From a portfolio construction point of view, there are two main types of low volatility products, one based on a minimum volatility index and the other on a minimum variance index. While the two are closely related and often times grouped under the same category, there are several distinctions that separate them. A minimum volatility index is typically built using a plain vanilla ranking methodology. At each rebalancing period, the stocks in the index are ranked according to their volatility level. Long and Short baskets of ETF portfolio securities are then created depending on either a pre-determined threshold on a target volatility level, or on a number used to split the universe in quintiles or deciles. Some portfolios might be created by equally weighting the selected assets in each basket, some by inverse volatility weighting. In general the difference is not very significant in that particular case. The advantage here is that the process is very transparent and can easily be replicated. However, efficiency may not be optimal because of the lack of control on the risk and reward sides.
On the other hand, a minimum variance index is constructed using a full optimization process. The process is more of a black box as it relies on proprietary covariance estimation methodologies and often uses several additional constraints. For instance, several ETF sponsors add weight and tracking error constraints, as well as industry and diversification constraints in order to remain as close as possible to the index. These constraints help control the potentially high turnover implied by minimum variance portfolios and thus allow more realistic implementations. Such indices are rebalanced quarterly or semi-annually, usually at the time of the parent index review. The advantage is a much more robust process, in theory, but the end product is not a real minimum variance portfolio.
Aside from typical minimum variance or low volatility indices, some vendors also now propose risk parity indices. The idea is not to minimize risk globally but to allocate risk equally among the various constituents, be it stocks or asset classes. This is similar to an Equal Risk Contribution portfolio, but the techniques differ.
Figure 10: Low Volatility ETF(s) and Assets Under Management
Source: J.P. Morgan, Bloomberg. Fundamental Index ETFs Fundamental index ETFs weigh stocks according to a combination of fundamental factors. The more commonly used factors are based on accounting figures, such as sales, earnings, cash flow and dividends. The core belief behind fundamental indexation is that the underlying valuation/accounting figures are more accurate indicators of a stock’s intrinsic value than the market value itself. Fundamental indices often exhibit higher performance than capitalization-weighted indices; however, this outperformance is often times attributed to simple small cap and value premiums that the fundamental indexation approach inherently captures. Fundamental Indexation Quant-ETFs currently have more than $3 billion in total assets globally, with the bulk of those assets in US-listed ETFs.
0
2
4
6
8
10
12
14
May, 11 Nov, 11 May, 12 Nov, 12
Tota
l Ass
ets
(USD
, Bill
ions
)
Ticker ETF Name Geographical Focus
AUM (USD, Millions)
SPLV Pow erShares S&P 500 Low Volatility US 5434USMV iShares MSCI USA Minimum Volatility Index US 3680XSLV Pow erShares S&P SmallCap Low Volatility US 9XMLV Pow erShares S&P MidCap Low Volatility US 7ZLB CN BMO Low Volatility Canadian Equity ETF Canada 91XMV CN iShares MSCI Canada Minimum Vol Canada 13TLV CN Pow erShares S&P/TSX Low Vol Canada 12BTAL QuantShares US Market Neutral Anti-Beta US 14EEMV ISHA MSCI EMERG MKT MIN VOL International 2111ACWV ISHARES MSCI ALL COUNTRY WOR Global 1062EFAV ISHARES MSCI EAFE MIN VOL International 606EELV POWERSHARES S&P EM-MK LOW VO International 143IDLV POWERSHARES S&P INT DEV LOW International 92SMLV SPDR RUSSELL 2000 LOW VOLATI US 6LGLV SPDR RUSSELL 1000 LOW VOLATI US 6
Quant-Based ETFs
11
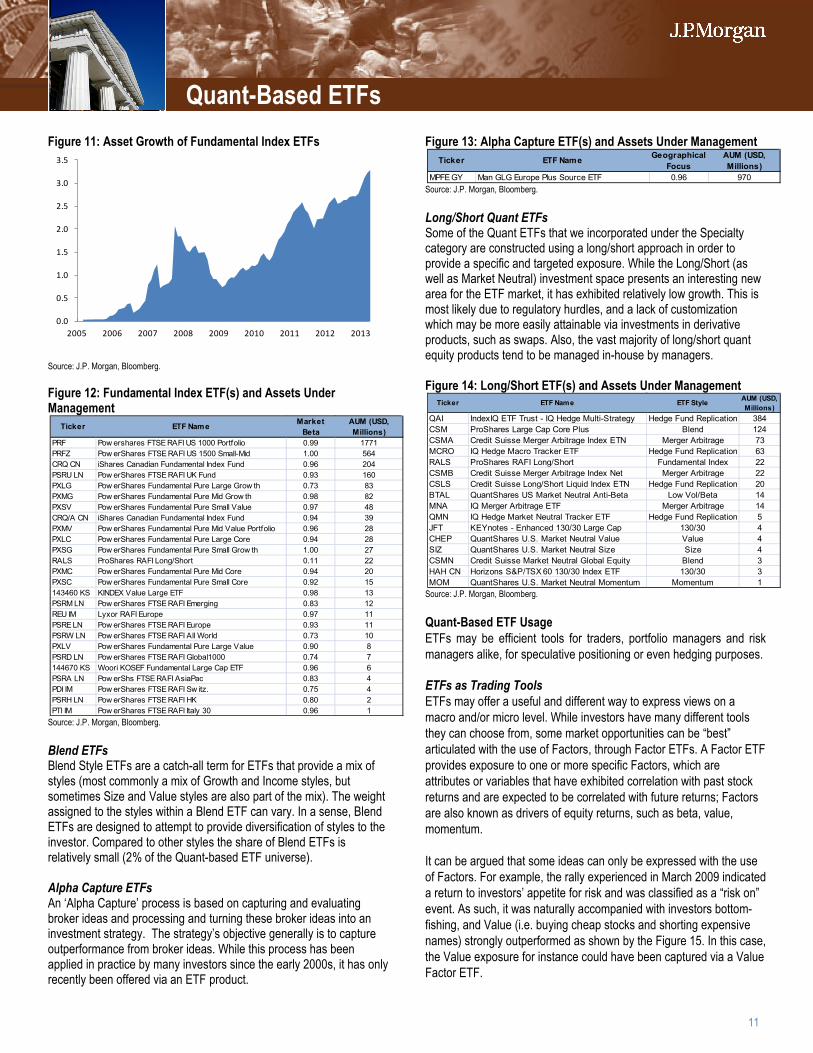
Figure 11: Asset Growth of Fundamental Index ETFs
Source: J.P. Morgan, Bloomberg. Figure 12: Fundamental Index ETF(s) and Assets Under Management
Source: J.P. Morgan, Bloomberg. Blend ETFs Blend Style ETFs are a catch-all term for ETFs that provide a mix of styles (most commonly a mix of Growth and Income styles, but sometimes Size and Value styles are also part of the mix). The weight assigned to the styles within a Blend ETF can vary. In a sense, Blend ETFs are designed to attempt to provide diversification of styles to the investor. Compared to other styles the share of Blend ETFs is relatively small (2% of the Quant-based ETF universe). Alpha Capture ETFs An ‘Alpha Capture’ process is based on capturing and evaluating broker ideas and processing and turning these broker ideas into an investment strategy. The strategy’s objective generally is to capture outperformance from broker ideas. While this process has been applied in practice by many investors since the early 2000s, it has only recently been offered via an ETF product.
Figure 13: Alpha Capture ETF(s) and Assets Under Management
Source: J.P. Morgan, Bloomberg. Long/Short Quant ETFs Some of the Quant ETFs that we incorporated under the Specialty category are constructed using a long/short approach in order to provide a specific and targeted exposure. While the Long/Short (as well as Market Neutral) investment space presents an interesting new area for the ETF market, it has exhibited relatively low growth. This is most likely due to regulatory hurdles, and a lack of customization which may be more easily attainable via investments in derivative products, such as swaps. Also, the vast majority of long/short quant equity products tend to be managed in-house by managers. Figure 14: Long/Short ETF(s) and Assets Under Management
Source: J.P. Morgan, Bloomberg. Quant-Based ETF Usage ETFs may be efficient tools for traders, portfolio managers and risk managers alike, for speculative positioning or even hedging purposes.
ETFs as Trading Tools ETFs may offer a useful and different way to express views on a macro and/or micro level. While investors have many different tools they can choose from, some market opportunities can be “best” articulated with the use of Factors, through Factor ETFs. A Factor ETF provides exposure to one or more specific Factors, which are attributes or variables that have exhibited correlation with past stock returns and are expected to be correlated with future returns; Factors are also known as drivers of equity returns, such as beta, value, momentum. It can be argued that some ideas can only be expressed with the use of Factors. For example, the rally experienced in March 2009 indicated a return to investors’ appetite for risk and was classified as a “risk on” event. As such, it was naturally accompanied with investors bottom-fishing, and Value (i.e. buying cheap stocks and shorting expensive names) strongly outperformed as shown by the Figure 15. In this case, the Value exposure for instance could have been captured via a Value Factor ETF.
0.0
0.5
1.0
1.5
2.0
2.5
3.0
3.5
2005 2006 2007 2008 2009 2010 2011 2012 2013
Ticker ETF Name Market Beta
AUM (USD, Millions)
PRF Pow ershares FTSE RAFI US 1000 Portfolio 0.99 1771PRFZ Pow erShares FTSE RAFI US 1500 Small-Mid 1.00 564CRQ CN iShares Canadian Fundamental Index Fund 0.96 204PSRU LN Pow erShares FTSE RAFI UK Fund 0.93 160PXLG Pow erShares Fundamental Pure Large Grow th 0.73 83PXMG Pow erShares Fundamental Pure Mid Grow th 0.98 82PXSV Pow erShares Fundamental Pure Small Value 0.97 48CRQ/A CN iShares Canadian Fundamental Index Fund 0.94 39PXMV Pow erShares Fundamental Pure Mid Value Portfolio 0.96 28PXLC Pow erShares Fundamental Pure Large Core 0.94 28PXSG Pow erShares Fundamental Pure Small Grow th 1.00 27RALS ProShares RAFI Long/Short 0.11 22PXMC Pow erShares Fundamental Pure Mid Core 0.94 20PXSC Pow erShares Fundamental Pure Small Core 0.92 15143460 KS KINDEX Value Large ETF 0.98 13PSRM LN Pow erShares FTSE RAFI Emerging 0.83 12REU IM Lyxor RAFI Europe 0.97 11PSRE LN Pow erShares FTSE RAFI Europe 0.93 11PSRW LN Pow erShares FTSE RAFI All World 0.73 10PXLV Pow erShares Fundamental Pure Large Value 0.90 8PSRD LN Pow erShares FTSE RAFI Global1000 0.74 7144670 KS Woori KOSEF Fundamental Large Cap ETF 0.96 6PSRA LN Pow erShs FTSE RAFI AsiaPac 0.83 4PDI IM Pow erShares FTSE RAFI Sw itz. 0.75 4PSRH LN Pow erShares FTSE RAFI HK 0.80 2PTI IM Pow erShares FTSE RAFI Italy 30 0.96 1
Ticker ETF Name Geographical Focus
AUM (USD, Millions)
MPFE GY Man GLG Europe Plus Source ETF 0.96 970
Ticker ETF Name ETF Style AUM (USD, Millions)
QAI IndexIQ ETF Trust - IQ Hedge Multi-Strategy Hedge Fund Replication 384CSM ProShares Large Cap Core Plus Blend 124CSMA Credit Suisse Merger Arbitrage Index ETN Merger Arbitrage 73MCRO IQ Hedge Macro Tracker ETF Hedge Fund Replication 63RALS ProShares RAFI Long/Short Fundamental Index 22CSMB Credit Suisse Merger Arbitrage Index Net Merger Arbitrage 22CSLS Credit Suisse Long/Short Liquid Index ETN Hedge Fund Replication 20BTAL QuantShares US Market Neutral Anti-Beta Low Vol/Beta 14MNA IQ Merger Arbitrage ETF Merger Arbitrage 14QMN IQ Hedge Market Neutral Tracker ETF Hedge Fund Replication 5JFT KEYnotes - Enhanced 130/30 Large Cap 130/30 4CHEP QuantShares U.S. Market Neutral Value Value 4SIZ QuantShares U.S. Market Neutral Size Size 4CSMN Credit Suisse Market Neutral Global Equity Blend 3HAH CN Horizons S&P/TSX 60 130/30 Index ETF 130/30 3MOM QuantShares U.S. Market Neutral Momentum Momentum 1
Quant-Based ETFs
12
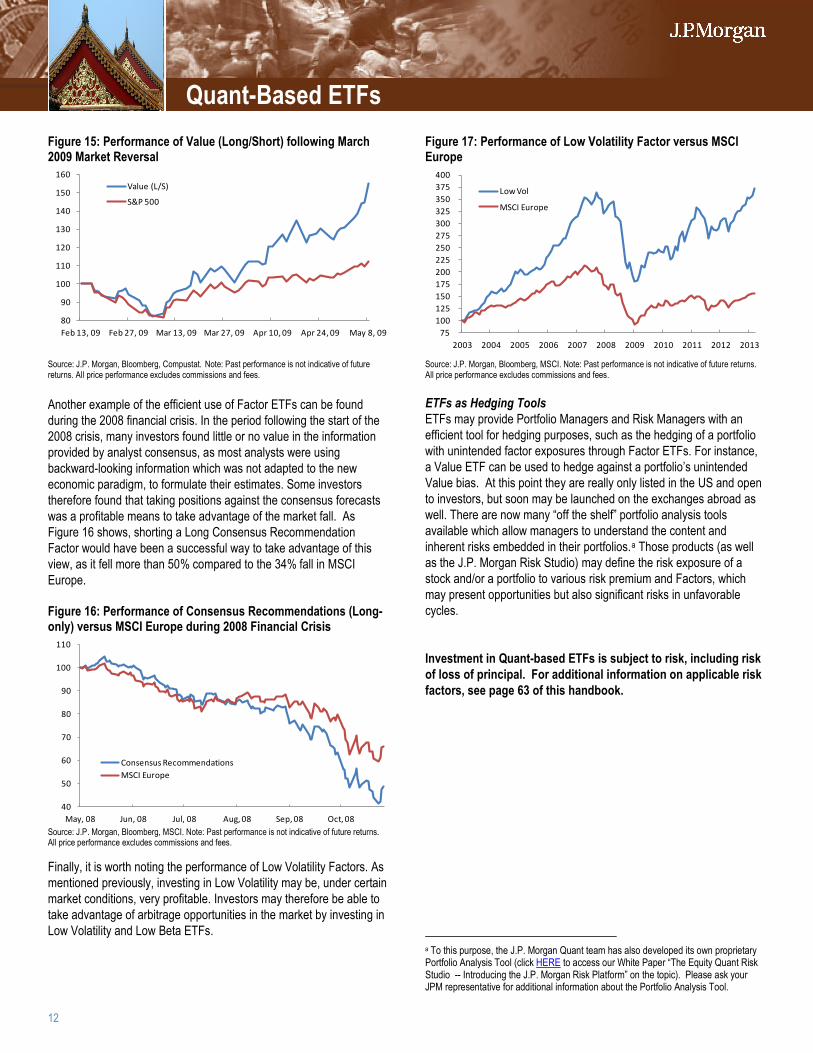
Figure 15: Performance of Value (Long/Short) following March 2009 Market Reversal
Source: J.P. Morgan, Bloomberg, Compustat. Note: Past performance is not indicative of future returns. All price performance excludes commissions and fees. Another example of the efficient use of Factor ETFs can be found during the 2008 financial crisis. In the period following the start of the 2008 crisis, many investors found little or no value in the information provided by analyst consensus, as most analysts were using backward-looking information which was not adapted to the new economic paradigm, to formulate their estimates. Some investors therefore found that taking positions against the consensus forecasts was a profitable means to take advantage of the market fall. As Figure 16 shows, shorting a Long Consensus Recommendation Factor would have been a successful way to take advantage of this view, as it fell more than 50% compared to the 34% fall in MSCI Europe. Figure 16: Performance of Consensus Recommendations (Long-only) versus MSCI Europe during 2008 Financial Crisis
Source: J.P. Morgan, Bloomberg, MSCI. Note: Past performance is not indicative of future returns. All price performance excludes commissions and fees. Finally, it is worth noting the performance of Low Volatility Factors. As mentioned previously, investing in Low Volatility may be, under certain market conditions, very profitable. Investors may therefore be able to take advantage of arbitrage opportunities in the market by investing in Low Volatility and Low Beta ETFs.
Figure 17: Performance of Low Volatility Factor versus MSCI Europe
Source: J.P. Morgan, Bloomberg, MSCI. Note: Past performance is not indicative of future returns. All price performance excludes commissions and fees. ETFs as Hedging Tools ETFs may provide Portfolio Managers and Risk Managers with an efficient tool for hedging purposes, such as the hedging of a portfolio with unintended factor exposures through Factor ETFs. For instance, a Value ETF can be used to hedge against a portfolio’s unintended Value bias. At this point they are really only listed in the US and open to investors, but soon may be launched on the exchanges abroad as well. There are now many “off the shelf” portfolio analysis tools available which allow managers to understand the content and inherent risks embedded in their portfolios.a
Those products (as well as the J.P. Morgan Risk Studio) may define the risk exposure of a stock and/or a portfolio to various risk premium and Factors, which may present opportunities but also significant risks in unfavorable cycles.
Investment in Quant-based ETFs is subject to risk, including risk of loss of principal. For additional information on applicable risk factors, see page 63 of this handbook.
a To this purpose, the J.P. Morgan Quant team has also developed its own proprietary Portfolio Analysis Tool (click HERE to access our White Paper “The Equity Quant Risk Studio -- Introducing the J.P. Morgan Risk Platform” on the topic). Please ask your JPM representative for additional information about the Portfolio Analysis Tool.
80
90
100
110
120
130
140
150
160
Feb 13, 09 Feb 27, 09 Mar 13, 09 Mar 27, 09 Apr 10, 09 Apr 24, 09 May 8, 09
Value (L/S)
S&P 500
40
50
60
70
80
90
100
110
May, 08 Jun, 08 Jul, 08 Aug, 08 Sep, 08 Oct, 08
Consensus RecommendationsMSCI Europe
75 100 125 150 175 200 225 250 275 300 325 350 375 400
2003 2004 2005 2006 2007 2008 2009 2010 2011 2012 2013
Low Vol
MSCI Europe
Quant-Based ETFs Quant-Based ETFs
13
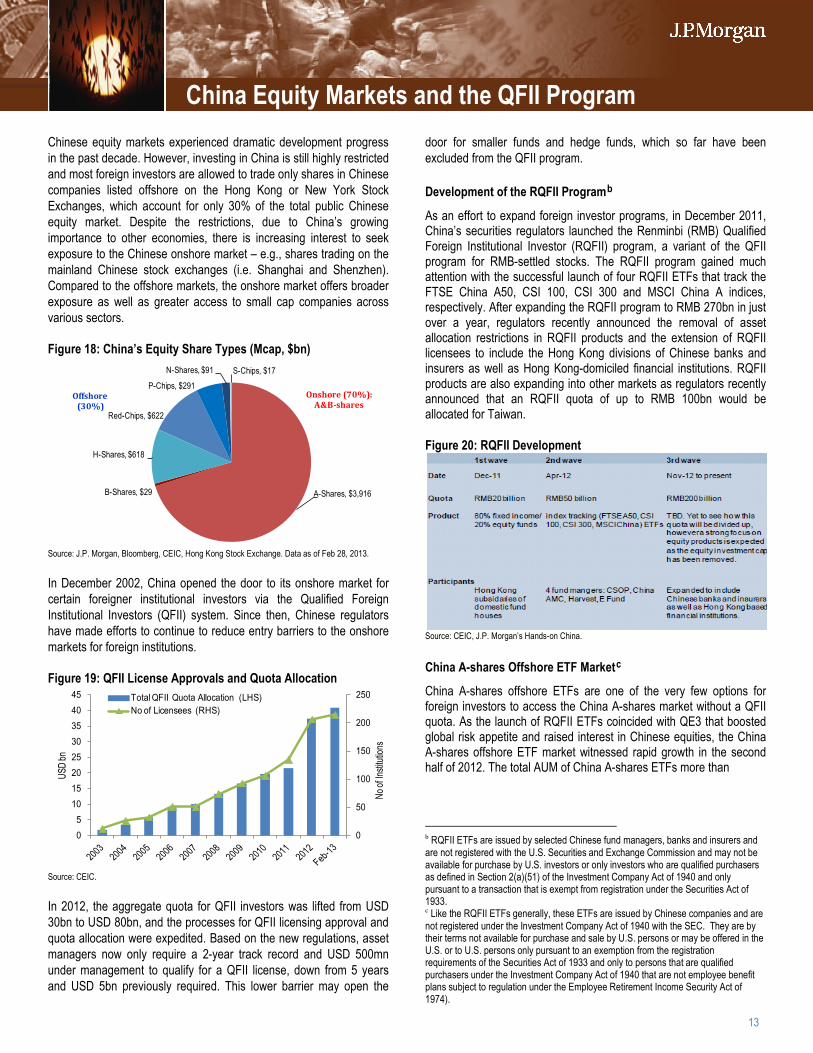
Chinese equity markets experienced dramatic development progress in the past decade. However, investing in China is still highly restricted and most foreign investors are allowed to trade only shares in Chinese companies listed offshore on the Hong Kong or New York Stock Exchanges, which account for only 30% of the total public Chinese equity market. Despite the restrictions, due to China’s growing importance to other economies, there is increasing interest to seek exposure to the Chinese onshore market – e.g., shares trading on the mainland Chinese stock exchanges (i.e. Shanghai and Shenzhen). Compared to the offshore markets, the onshore market offers broader exposure as well as greater access to small cap companies across various sectors.
Figure 18: China’s Equity Share Types (Mcap, $bn)
Source: J.P. Morgan, Bloomberg, CEIC, Hong Kong Stock Exchange. Data as of Feb 28, 2013.
In December 2002, China opened the door to its onshore market for certain foreigner institutional investors via the Qualified Foreign Institutional Investors (QFII) system. Since then, Chinese regulators have made efforts to continue to reduce entry barriers to the onshore markets for foreign institutions.
Figure 19: QFII License Approvals and Quota Allocation
Source: CEIC.
In 2012, the aggregate quota for QFII investors was lifted from USD 30bn to USD 80bn, and the processes for QFII licensing approval and quota allocation were expedited. Based on the new regulations, asset managers now only require a 2-year track record and USD 500mn under management to qualify for a QFII license, down from 5 years and USD 5bn previously required. This lower barrier may open the
door for smaller funds and hedge funds, which so far have been excluded from the QFII program.
Development of the RQFII Programb
As an effort to expand foreign investor programs, in December 2011, China’s securities regulators launched the Renminbi (RMB) Qualified Foreign Institutional Investor (RQFII) program, a variant of the QFII program for RMB-settled stocks. The RQFII program gained much attention with the successful launch of four RQFII ETFs that track the FTSE China A50, CSI 100, CSI 300 and MSCI China A indices, respectively. After expanding the RQFII program to RMB 270bn in just over a year, regulators recently announced the removal of asset allocation restrictions in RQFII products and the extension of RQFII licensees to include the Hong Kong divisions of Chinese banks and insurers as well as Hong Kong-domiciled financial institutions. RQFII products are also expanding into other markets as regulators recently announced that an RQFII quota of up to RMB 100bn would be allocated for Taiwan.
Figure 20: RQFII Development
Source: CEIC, J.P. Morgan’s Hands-on China.
China A-shares Offshore ETF Marketc
China A-shares offshore ETFs are one of the very few options for foreign investors to access the China A-shares market without a QFII quota. As the launch of RQFII ETFs coincided with QE3 that boosted global risk appetite and raised interest in Chinese equities, the China A-shares offshore ETF market witnessed rapid growth in the second half of 2012. The total AUM of China A-shares ETFs more than
b RQFII ETFs are issued by selected Chinese fund managers, banks and insurers and are not registered with the U.S. Securities and Exchange Commission and may not be available for purchase by U.S. investors or only investors who are qualified purchasers as defined in Section 2(a)(51) of the Investment Company Act of 1940 and only pursuant to a transaction that is exempt from registration under the Securities Act of 1933. c Like the RQFII ETFs generally, these ETFs are issued by Chinese companies and are not registered under the Investment Company Act of 1940 with the SEC. They are by their terms not available for purchase and sale by U.S. persons or may be offered in the U.S. or to U.S. persons only pursuant to an exemption from the registration requirements of the Securities Act of 1933 and only to persons that are qualified purchasers under the Investment Company Act of 1940 that are not employee benefit plans subject to regulation under the Employee Retirement Income Security Act of 1974).
A-Shares, $3,916 B-Shares, $29
H-Shares, $618
Red-Chips, $622
P-Chips, $291
N-Shares, $91 S-Chips, $17
Onshore (70%): A&B-shares
Offshore(30%)
0
50
100
150
200
250
05
1015202530354045
No of
Insti
tution
s
USD
bn
Total QFII Quota Allocation (LHS)No of Licensees (RHS)
China Equity Markets and the QFII Program
14
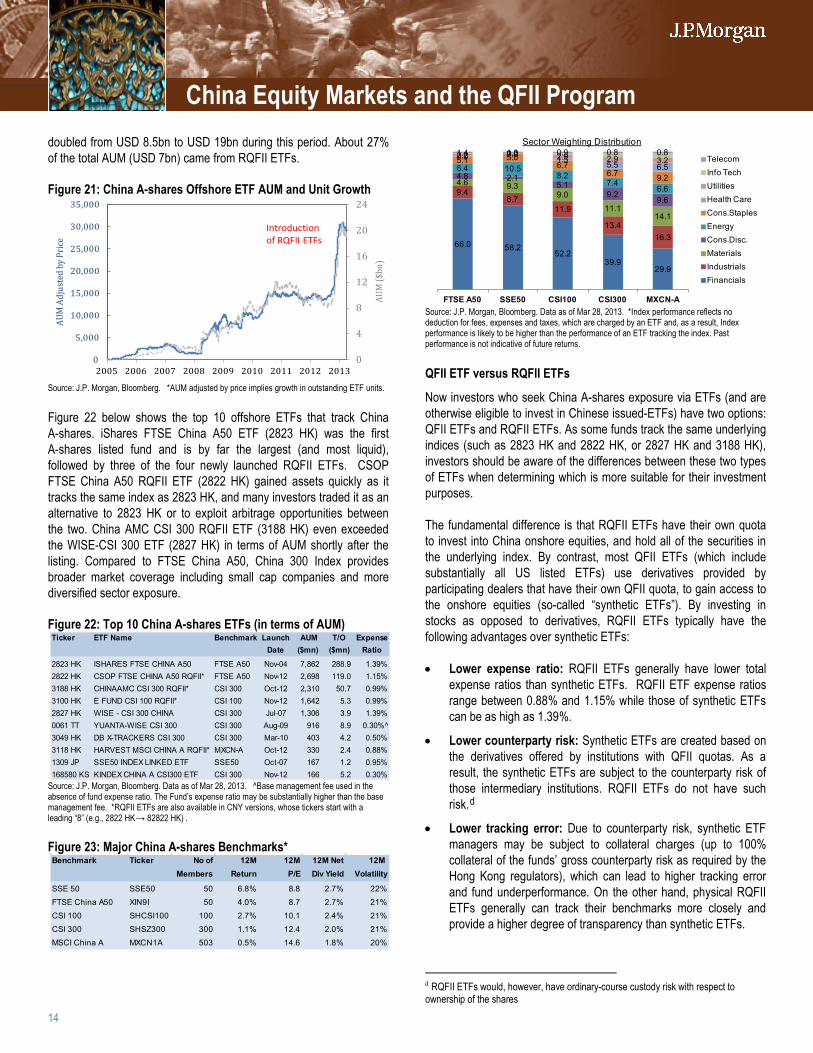
doubled from USD 8.5bn to USD 19bn during this period. About 27% of the total AUM (USD 7bn) came from RQFII ETFs.
Figure 21: China A-shares Offshore ETF AUM and Unit Growth
Source: J.P. Morgan, Bloomberg. *AUM adjusted by price implies growth in outstanding ETF units.
Figure 22 below shows the top 10 offshore ETFs that track China A-shares. iShares FTSE China A50 ETF (2823 HK) was the first A-shares listed fund and is by far the largest (and most liquid), followed by three of the four newly launched RQFII ETFs. CSOP FTSE China A50 RQFII ETF (2822 HK) gained assets quickly as it tracks the same index as 2823 HK, and many investors traded it as an alternative to 2823 HK or to exploit arbitrage opportunities between the two. China AMC CSI 300 RQFII ETF (3188 HK) even exceeded the WISE-CSI 300 ETF (2827 HK) in terms of AUM shortly after the listing. Compared to FTSE China A50, China 300 Index provides broader market coverage including small cap companies and more diversified sector exposure.
Figure 22: Top 10 China A-shares ETFs (in terms of AUM)
Source: J.P. Morgan, Bloomberg. Data as of Mar 28, 2013. ^Base management fee used in the absence of fund expense ratio. The Fund’s expense ratio may be substantially higher than the base management fee. *RQFII ETFs are also available in CNY versions, whose tickers start with a leading “8” (e.g., 2822 HK → 82822 HK) .
Figure 23: Major China A-shares Benchmarks*
Source: J.P. Morgan, Bloomberg. Data as of Mar 28, 2013. *Index performance reflects no deduction for fees, expenses and taxes, which are charged by an ETF and, as a result, Index performance is likely to be higher than the performance of an ETF tracking the index. Past performance is not indicative of future returns.
QFII ETF versus RQFII ETFs
Now investors who seek China A-shares exposure via ETFs (and are otherwise eligible to invest in Chinese issued-ETFs) have two options: QFII ETFs and RQFII ETFs. As some funds track the same underlying indices (such as 2823 HK and 2822 HK, or 2827 HK and 3188 HK), investors should be aware of the differences between these two types of ETFs when determining which is more suitable for their investment purposes.
The fundamental difference is that RQFII ETFs have their own quota to invest into China onshore equities, and hold all of the securities in the underlying index. By contrast, most QFII ETFs (which include substantially all US listed ETFs) use derivatives provided by participating dealers that have their own QFII quota, to gain access to the onshore equities (so-called “synthetic ETFs”). By investing in stocks as opposed to derivatives, RQFII ETFs typically have the following advantages over synthetic ETFs:
• Lower expense ratio: RQFII ETFs generally have lower total expense ratios than synthetic ETFs. RQFII ETF expense ratios range between 0.88% and 1.15% while those of synthetic ETFs can be as high as 1.39%.
• Lower counterparty risk: Synthetic ETFs are created based on the derivatives offered by institutions with QFII quotas. As a result, the synthetic ETFs are subject to the counterparty risk of those intermediary institutions. RQFII ETFs do not have such risk.d
• Lower tracking error: Due to counterparty risk, synthetic ETF managers may be subject to collateral charges (up to 100% collateral of the funds’ gross counterparty risk as required by the Hong Kong regulators), which can lead to higher tracking error and fund underperformance. On the other hand, physical RQFII ETFs generally can track their benchmarks more closely and provide a higher degree of transparency than synthetic ETFs.
d RQFII ETFs would, however, have ordinary-course custody risk with respect to ownership of the shares
0
4
8
12
16
20
24
0
5,000
10,000
15,000
20,000
25,000
30,000
35,000
2005 2006 2007 2008 2009 2010 2011 2012 2013AU
M ($
bn)
AUM
Adj
uste
d by
Pric
e
Introductionof RQFII ETFs
Ticker ETF Name Benchmark Launch AUM T/O ExpenseDate ($mn) ($mn) Ratio
2823 HK ISHARES FTSE CHINA A50 FTSE A50 Nov-04 7,862 288.9 1.39%2822 HK CSOP FTSE CHINA A50 RQFII* FTSE A50 Nov-12 2,698 119.0 1.15%3188 HK CHINAAMC CSI 300 RQFII* CSI 300 Oct-12 2,310 50.7 0.99%3100 HK E FUND CSI 100 RQFII* CSI 100 Nov-12 1,642 5.3 0.99%2827 HK WISE - CSI 300 CHINA CSI 300 Jul-07 1,306 3.9 1.39%0061 TT YUANTA-WISE CSI 300 CSI 300 Aug-09 916 8.9 0.30%^3049 HK DB X-TRACKERS CSI 300 CSI 300 Mar-10 403 4.2 0.50%3118 HK HARVEST MSCI CHINA A RQFII* MXCN-A Oct-12 330 2.4 0.88%1309 JP SSE50 INDEX LINKED ETF SSE50 Oct-07 167 1.2 0.95%168580 KS KINDEX CHINA A CSI300 ETF CSI 300 Nov-12 166 5.2 0.30%
Benchmark Ticker No of 12M 12M 12M Net 12M Members Return P/E Div Yield Volatility
SSE 50 SSE50 50 6.8% 8.8 2.7% 22%
FTSE China A50 XIN9I 50 4.0% 8.7 2.7% 21%
CSI 100 SHCSI100 100 2.7% 10.1 2.4% 21%
CSI 300 SHSZ300 300 1.1% 12.4 2.0% 21%
MSCI China A MXCN1A 503 0.5% 14.6 1.8% 20%
66.0 58.252.2
39.929.9
9.48.7
11.9
13.416.3
4.6 9.39.0
11.114.1
4.8 2.15.1
9.29.6
6.4 10.58.2
7.46.6
5.1 5.06.7
6.7 9.2
0.0 0.01.5 5.5 6.5
2.2 0.0 2.9 2.9 3.21.4 1.3 0.9 0.8 0.8
FTSE A50 SSE50 CSI100 CSI300 MXCN-A
Sector Weighting Distribution
TelecomInfo TechUtilitiesHealth CareCons.StaplesEnergyCons.Disc.MaterialsIndustrialsFinancials
China Equity Markets and the QFII Program
15
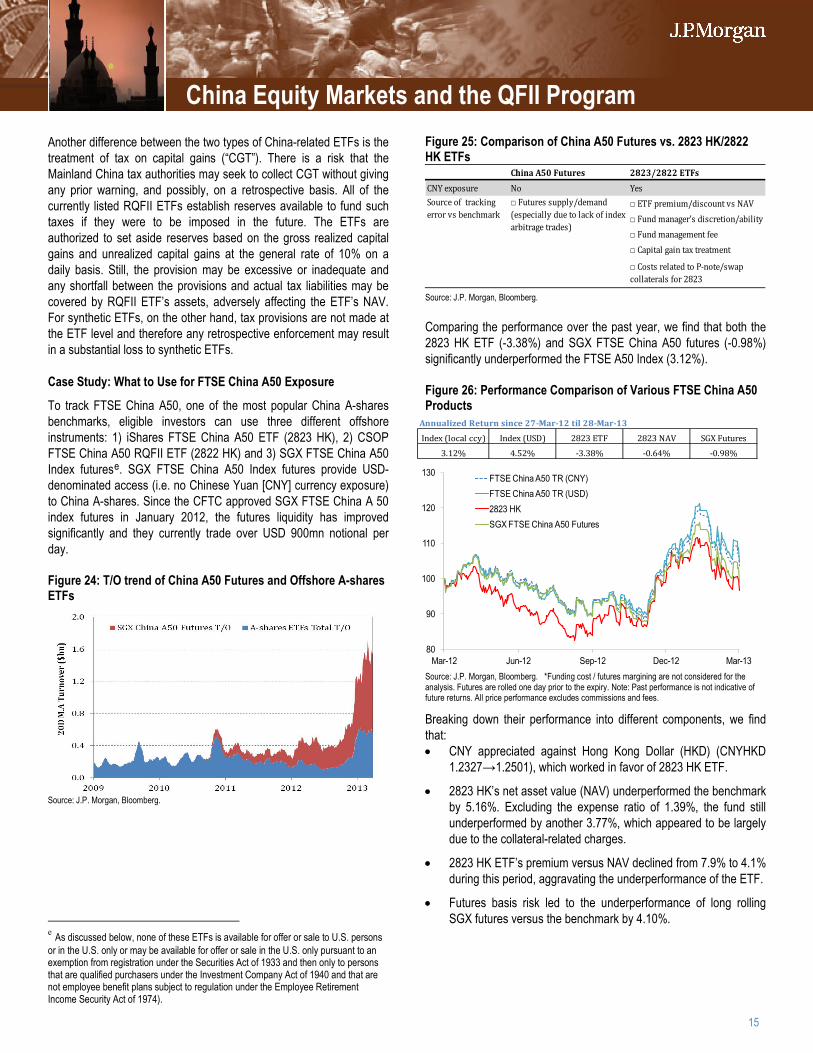
China A50 Futures 2823/2822 ETFsCNY exposure No Yes
□ ETF premium/discount vs NAV□ Fund manager's discretion/ability□ Fund management fee□ Capital gain tax treatment
□ Costs related to P-note/swap collaterals for 2823
Source of tracking error vs benchmark
□ Futures supply/demand (especially due to lack of index arbitrage trades)
80
90
100
110
120
130
Mar-12 Jun-12 Sep-12 Dec-12 Mar-13
FTSE China A50 TR (CNY)FTSE China A50 TR (USD)2823 HKSGX FTSE China A50 Futures
Annualized Return since 27-Mar-12 til 28-Mar-13
Index (local ccy) Index (USD) 2823 ETF 2823 NAV SGX Futures
3.12% 4.52% -3.38% -0.64% -0.98%
Another difference between the two types of China-related ETFs is the treatment of tax on capital gains (“CGT”). There is a risk that the Mainland China tax authorities may seek to collect CGT without giving any prior warning, and possibly, on a retrospective basis. All of the currently listed RQFII ETFs establish reserves available to fund such taxes if they were to be imposed in the future. The ETFs are authorized to set aside reserves based on the gross realized capital gains and unrealized capital gains at the general rate of 10% on a daily basis. Still, the provision may be excessive or inadequate and any shortfall between the provisions and actual tax liabilities may be covered by RQFII ETF’s assets, adversely affecting the ETF’s NAV. For synthetic ETFs, on the other hand, tax provisions are not made at the ETF level and therefore any retrospective enforcement may result in a substantial loss to synthetic ETFs.
Case Study: What to Use for FTSE China A50 Exposure
To track FTSE China A50, one of the most popular China A-shares benchmarks, eligible investors can use three different offshore instruments: 1) iShares FTSE China A50 ETF (2823 HK), 2) CSOP FTSE China A50 RQFII ETF (2822 HK) and 3) SGX FTSE China A50 Index futurese
Figure 24: T/O trend of China A50 Futures and Offshore A-shares ETFs
. SGX FTSE China A50 Index futures provide USD-denominated access (i.e. no Chinese Yuan [CNY] currency exposure) to China A-shares. Since the CFTC approved SGX FTSE China A 50 index futures in January 2012, the futures liquidity has improved significantly and they currently trade over USD 900mn notional per day.
Source: J.P. Morgan, Bloomberg.
e As discussed below, none of these ETFs is available for offer or sale to U.S. persons or in the U.S. only or may be available for offer or sale in the U.S. only pursuant to an exemption from registration under the Securities Act of 1933 and then only to persons that are qualified purchasers under the Investment Company Act of 1940 and that are not employee benefit plans subject to regulation under the Employee Retirement Income Security Act of 1974).
Figure 25: Comparison of China A50 Futures vs. 2823 HK/2822 HK ETFs
Source: J.P. Morgan, Bloomberg.
Comparing the performance over the past year, we find that both the 2823 HK ETF (-3.38%) and SGX FTSE China A50 futures (-0.98%) significantly underperformed the FTSE A50 Index (3.12%).
Figure 26: Performance Comparison of Various FTSE China A50 Products
Source: J.P. Morgan, Bloomberg. *Funding cost / futures margining are not considered for the analysis. Futures are rolled one day prior to the expiry. Note: Past performance is not indicative of future returns. All price performance excludes commissions and fees.
Breaking down their performance into different components, we find that: • CNY appreciated against Hong Kong Dollar (HKD) (CNYHKD
1.2327→1.2501), which worked in favor of 2823 HK ETF.
• 2823 HK’s net asset value (NAV) underperformed the benchmark by 5.16%. Excluding the expense ratio of 1.39%, the fund still underperformed by another 3.77%, which appeared to be largely due to the collateral-related charges.
• 2823 HK ETF’s premium versus NAV declined from 7.9% to 4.1% during this period, aggravating the underperformance of the ETF.
• Futures basis risk led to the underperformance of long rolling SGX futures versus the benchmark by 4.10%.
China Equity Markets and the QFII Program
16
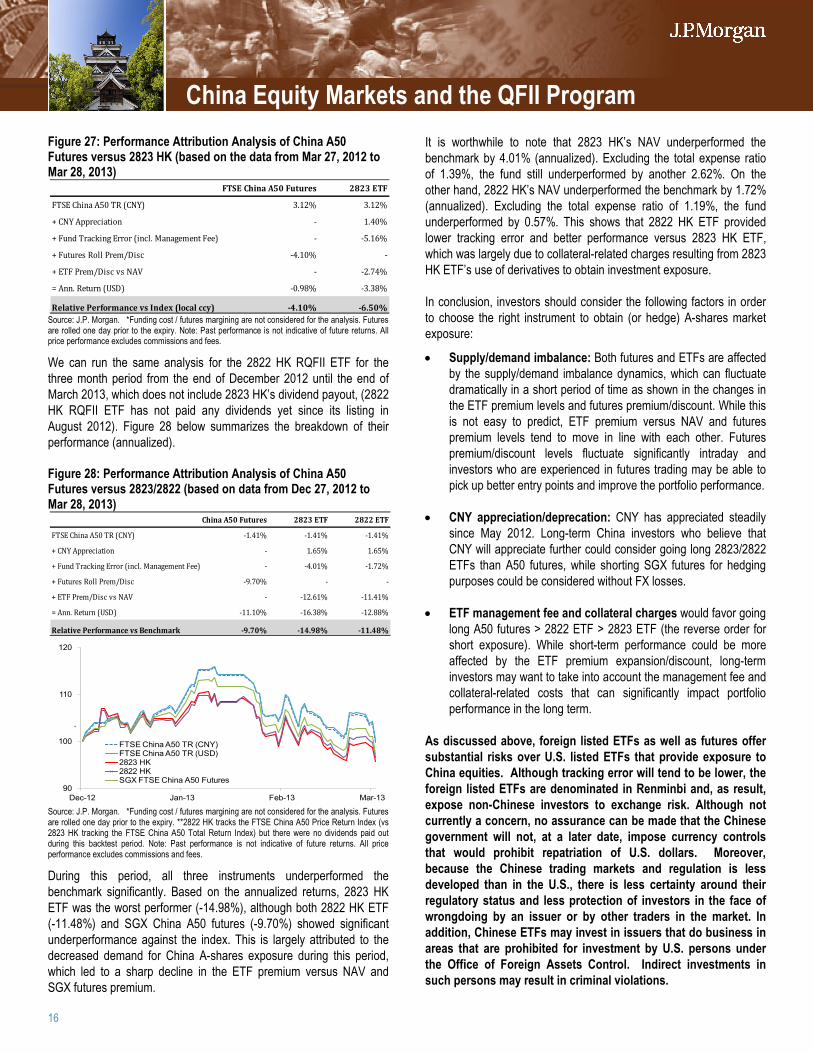
Figure 27: Performance Attribution Analysis of China A50 Futures versus 2823 HK (based on the data from Mar 27, 2012 to Mar 28, 2013)
Source: J.P. Morgan. *Funding cost / futures margining are not considered for the analysis. Futures are rolled one day prior to the expiry. Note: Past performance is not indicative of future returns. All price performance excludes commissions and fees.
We can run the same analysis for the 2822 HK RQFII ETF for the three month period from the end of December 2012 until the end of March 2013, which does not include 2823 HK’s dividend payout, (2822 HK RQFII ETF has not paid any dividends yet since its listing in August 2012). Figure 28 below summarizes the breakdown of their performance (annualized).
Figure 28: Performance Attribution Analysis of China A50 Futures versus 2823/2822 (based on data from Dec 27, 2012 to Mar 28, 2013)
Source: J.P. Morgan. *Funding cost / futures margining are not considered for the analysis. Futures are rolled one day prior to the expiry. **2822 HK tracks the FTSE China A50 Price Return Index (vs 2823 HK tracking the FTSE China A50 Total Return Index) but there were no dividends paid out during this backtest period. Note: Past performance is not indicative of future returns. All price performance excludes commissions and fees.
During this period, all three instruments underperformed the benchmark significantly. Based on the annualized returns, 2823 HK ETF was the worst performer (-14.98%), although both 2822 HK ETF (-11.48%) and SGX China A50 futures (-9.70%) showed significant underperformance against the index. This is largely attributed to the decreased demand for China A-shares exposure during this period, which led to a sharp decline in the ETF premium versus NAV and SGX futures premium.
It is worthwhile to note that 2823 HK’s NAV underperformed the benchmark by 4.01% (annualized). Excluding the total expense ratio of 1.39%, the fund still underperformed by another 2.62%. On the other hand, 2822 HK’s NAV underperformed the benchmark by 1.72% (annualized). Excluding the total expense ratio of 1.19%, the fund underperformed by 0.57%. This shows that 2822 HK ETF provided lower tracking error and better performance versus 2823 HK ETF, which was largely due to collateral-related charges resulting from 2823 HK ETF’s use of derivatives to obtain investment exposure.
In conclusion, investors should consider the following factors in order to choose the right instrument to obtain (or hedge) A-shares market exposure:
• Supply/demand imbalance: Both futures and ETFs are affected by the supply/demand imbalance dynamics, which can fluctuate dramatically in a short period of time as shown in the changes in the ETF premium levels and futures premium/discount. While this is not easy to predict, ETF premium versus NAV and futures premium levels tend to move in line with each other. Futures premium/discount levels fluctuate significantly intraday and investors who are experienced in futures trading may be able to pick up better entry points and improve the portfolio performance.
• CNY appreciation/deprecation: CNY has appreciated steadily since May 2012. Long-term China investors who believe that CNY will appreciate further could consider going long 2823/2822 ETFs than A50 futures, while shorting SGX futures for hedging purposes could be considered without FX losses.
• ETF management fee and collateral charges would favor going long A50 futures > 2822 ETF > 2823 ETF (the reverse order for short exposure). While short-term performance could be more affected by the ETF premium expansion/discount, long-term investors may want to take into account the management fee and collateral-related costs that can significantly impact portfolio performance in the long term.
As discussed above, foreign listed ETFs as well as futures offer substantial risks over U.S. listed ETFs that provide exposure to China equities. Although tracking error will tend to be lower, the foreign listed ETFs are denominated in Renminbi and, as result, expose non-Chinese investors to exchange risk. Although not currently a concern, no assurance can be made that the Chinese government will not, at a later date, impose currency controls that would prohibit repatriation of U.S. dollars. Moreover, because the Chinese trading markets and regulation is less developed than in the U.S., there is less certainty around their regulatory status and less protection of investors in the face of wrongdoing by an issuer or by other traders in the market. In addition, Chinese ETFs may invest in issuers that do business in areas that are prohibited for investment by U.S. persons under the Office of Foreign Assets Control. Indirect investments in such persons may result in criminal violations.
0 FTSE China A50 Futures 2823 ETF
FTSE China A50 TR (CNY) 3.12% 3.12%
+ CNY Appreciation - 1.40%
+ Fund Tracking Error (incl. Management Fee) - -5.16%
+ Futures Roll Prem/Disc -4.10% -
+ ETF Prem/Disc vs NAV - -2.74%
= Ann. Return (USD) -0.98% -3.38%
Relative Performance vs Index (local ccy) -4.10% -6.50%
0 China A50 Futures 2823 ETF 2822 ETF
FTSE China A50 TR (CNY) -1.41% -1.41% -1.41%
+ CNY Appreciation - 1.65% 1.65%
+ Fund Tracking Error (incl. Management Fee) - -4.01% -1.72%
+ Futures Roll Prem/Disc -9.70% - -
+ ETF Prem/Disc vs NAV - -12.61% -11.41%
= Ann. Return (USD) -11.10% -16.38% -12.88%
Relative Performance vs Benchmark -9.70% -14.98% -11.48%
90
100
110
120
Dec-12 Jan-13 Feb-13 Mar-13
FTSE China A50 TR (CNY)FTSE China A50 TR (USD)2823 HK2822 HKSGX FTSE China A50 Futures
China Equity Markets and the QFII Program
17
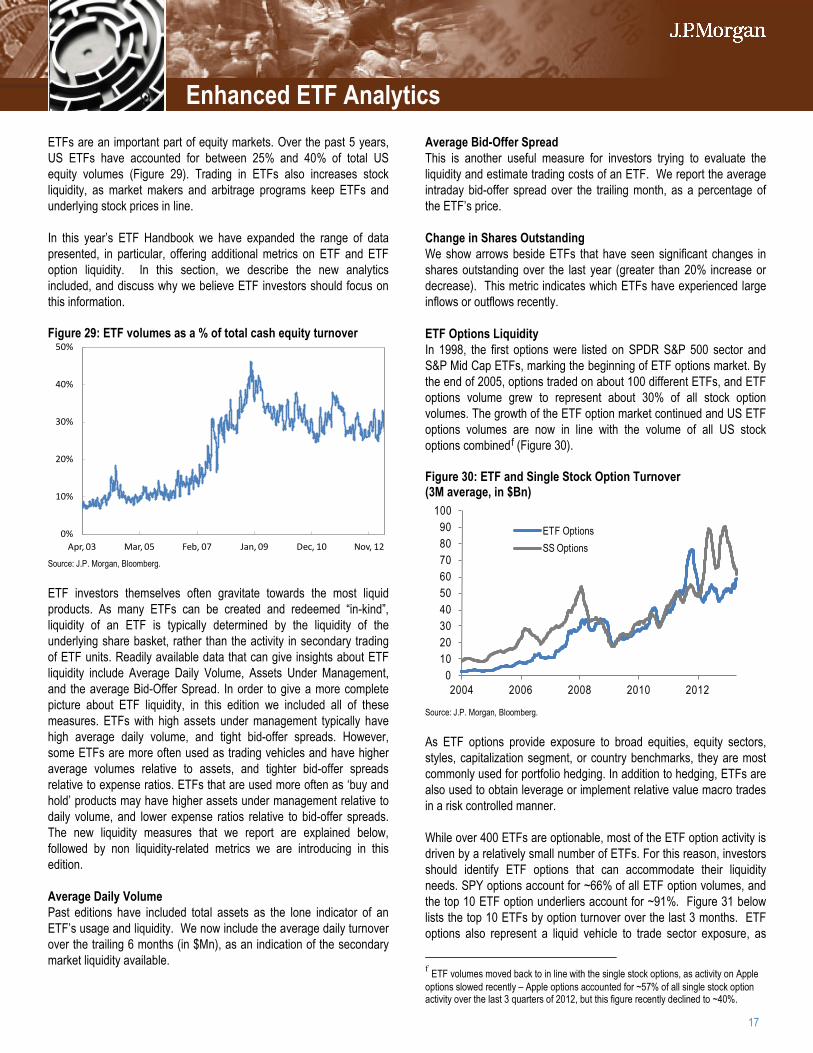
ETFs are an important part of equity markets. Over the past 5 years, US ETFs have accounted for between 25% and 40% of total US equity volumes (Figure 29). Trading in ETFs also increases stock liquidity, as market makers and arbitrage programs keep ETFs and underlying stock prices in line. In this year’s ETF Handbook we have expanded the range of data presented, in particular, offering additional metrics on ETF and ETF option liquidity. In this section, we describe the new analytics included, and discuss why we believe ETF investors should focus on this information. Figure 29: ETF volumes as a % of total cash equity turnover
Source: J.P. Morgan, Bloomberg.
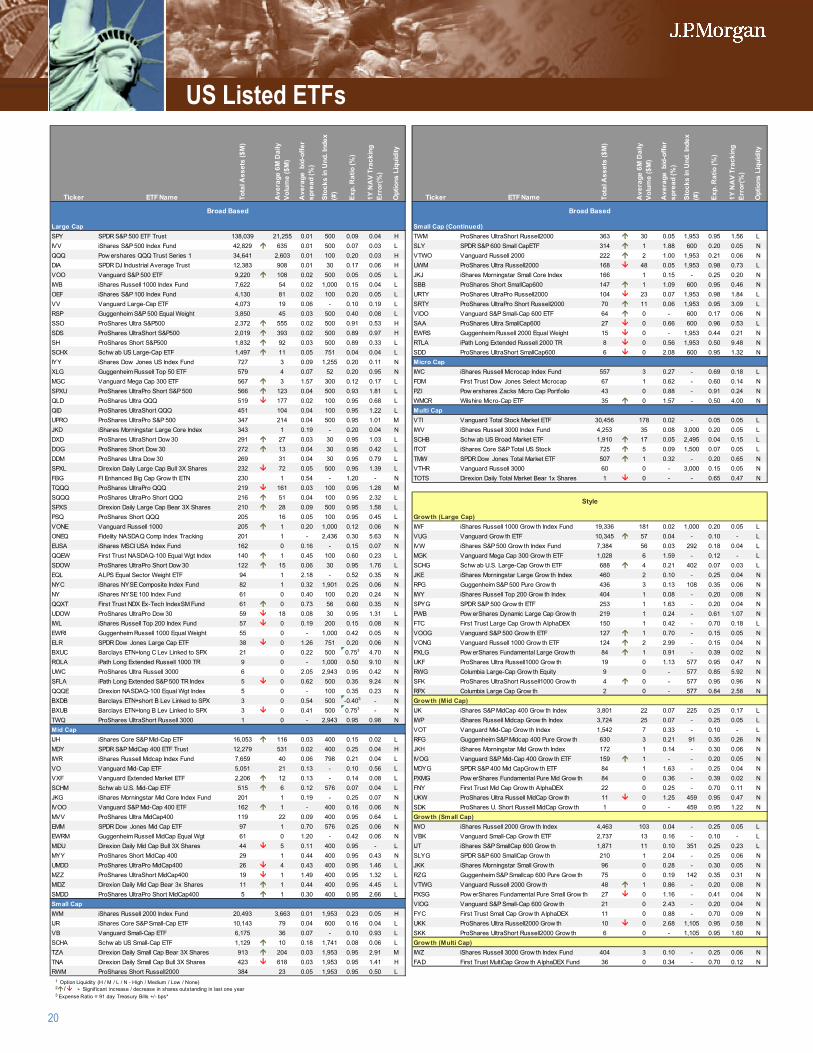
ETF investors themselves often gravitate towards the most liquid products. As many ETFs can be created and redeemed “in-kind”, liquidity of an ETF is typically determined by the liquidity of the underlying share basket, rather than the activity in secondary trading of ETF units. Readily available data that can give insights about ETF liquidity include Average Daily Volume, Assets Under Management, and the average Bid-Offer Spread. In order to give a more complete picture about ETF liquidity, in this edition we included all of these measures. ETFs with high assets under management typically have high average daily volume, and tight bid-offer spreads. However, some ETFs are more often used as trading vehicles and have higher average volumes relative to assets, and tighter bid-offer spreads relative to expense ratios. ETFs that are used more often as ‘buy and hold’ products may have higher assets under management relative to daily volume, and lower expense ratios relative to bid-offer spreads. The new liquidity measures that we report are explained below, followed by non liquidity-related metrics we are introducing in this edition. Average Daily Volume Past editions have included total assets as the lone indicator of an ETF’s usage and liquidity. We now include the average daily turnover over the trailing 6 months (in $Mn), as an indication of the secondary market liquidity available.
Average Bid-Offer Spread This is another useful measure for investors trying to evaluate the liquidity and estimate trading costs of an ETF. We report the average intraday bid-offer spread over the trailing month, as a percentage of the ETF’s price. Change in Shares Outstanding We show arrows beside ETFs that have seen significant changes in shares outstanding over the last year (greater than 20% increase or decrease). This metric indicates which ETFs have experienced large inflows or outflows recently. ETF Options Liquidity In 1998, the first options were listed on SPDR S&P 500 sector and S&P Mid Cap ETFs, marking the beginning of ETF options market. By the end of 2005, options traded on about 100 different ETFs, and ETF options volume grew to represent about 30% of all stock option volumes. The growth of the ETF option market continued and US ETF options volumes are now in line with the volume of all US stock options combinedf Figure 30 ( ). Figure 30: ETF and Single Stock Option Turnover (3M average, in $Bn)
Source: J.P. Morgan, Bloomberg.
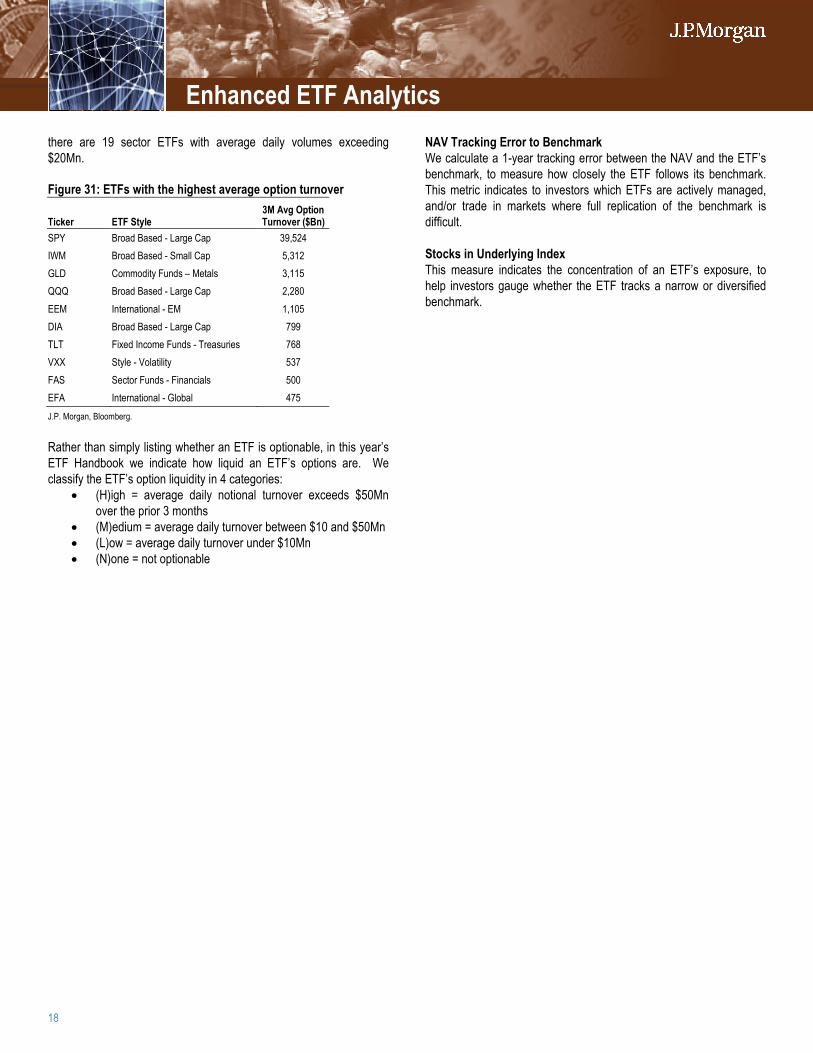
As ETF options provide exposure to broad equities, equity sectors, styles, capitalization segment, or country benchmarks, they are most commonly used for portfolio hedging. In addition to hedging, ETFs are also used to obtain leverage or implement relative value macro trades in a risk controlled manner. While over 400 ETFs are optionable, most of the ETF option activity is driven by a relatively small number of ETFs. For this reason, investors should identify ETF options that can accommodate their liquidity needs. SPY options account for ~66% of all ETF option volumes, and the top 10 ETF option underliers account for ~91%. Figure 31 below lists the top 10 ETFs by option turnover over the last 3 months. ETF options also represent a liquid vehicle to trade sector exposure, as
f ETF volumes moved back to in line with the single stock options, as activity on Apple options slowed recently – Apple options accounted for ~57% of all single stock option activity over the last 3 quarters of 2012, but this figure recently declined to ~40%.
0%
10%
20%
30%
40%
50%
Apr, 03 Mar, 05 Feb, 07 Jan, 09 Dec, 10 Nov, 12
0102030405060708090
100
2004 2006 2008 2010 2012
ETF OptionsSS Options
Enhanced ETF Analytics
18
there are 19 sector ETFs with average daily volumes exceeding $20Mn. Figure 31: ETFs with the highest average option turnover
Ticker ETF Style 3M Avg Option Turnover ($Bn)
SPY Broad Based - Large Cap 39,524 IWM Broad Based - Small Cap 5,312 GLD Commodity Funds – Metals 3,115 QQQ Broad Based - Large Cap 2,280 EEM International - EM 1,105 DIA Broad Based - Large Cap 799 TLT Fixed Income Funds - Treasuries 768 VXX Style - Volatility 537 FAS Sector Funds - Financials 500 EFA International - Global 475 J.P. Morgan, Bloomberg. Rather than simply listing whether an ETF is optionable, in this year’s ETF Handbook we indicate how liquid an ETF’s options are. We classify the ETF’s option liquidity in 4 categories:
• (H)igh = average daily notional turnover exceeds $50Mn over the prior 3 months
• (M)edium = average daily turnover between $10 and $50Mn • (L)ow = average daily turnover under $10Mn • (N)one = not optionable
NAV Tracking Error to Benchmark We calculate a 1-year tracking error between the NAV and the ETF’s benchmark, to measure how closely the ETF follows its benchmark. This metric indicates to investors which ETFs are actively managed, and/or trade in markets where full replication of the benchmark is difficult. Stocks in Underlying Index This measure indicates the concentration of an ETF’s exposure, to help investors gauge whether the ETF tracks a narrow or diversified benchmark.
Enhanced ETF Analytics
19
1 Unlike mutual funds, however, ETFs are not redeemed by general holders. Moreover, unlike mutual funds, which must be transferred at their net asset values, ETFs trade at market prices which may differ from their NAVs. Similarly, unlike most stocks, most ETFs are in continuous offering. 2 Unlike the exemption that was previously available for short sales of ETFs in Rule 10a-1 under Securities Exchange Act of 1934, under current Rule 201 of Regulation SHO ETFs are deemed to be “covered securities” and, thus, subject to the price tests developed by exchanges for execution of short sales upon price decreases of 10% or more from the prior day’s close price. In addition, although ETFs are marginable securities, broker-dealers are restricted from providing financing on the shares under Section 11(d)(1) of the Securities Exchange Act of 1934 if the broker-dealer or its affiliates or personnel receive compensation or economic benefit to promote or sell the ETF. 3 There are many factors which could impact this; one factor depends on how creation and redemption baskets are structured. 4 ETFs that are formed under the Investment Company Act of 1940 and qualify as “RICs” for tax purposes make distributions that are treated as ordinary dividends which, in general, reflects such RICs’ receipt of dividends and interest from its investments and gains from its short-term capital gain transactions. Long-term capital gain distributions are also distributed to shareholders, reflecting such RICs’ long-term capital gains from disposition of investments. ETFs taxable as RICs typically make distributions on a quarterly basis, but in all events, at least annually, in order to distribute all of their ordinary and capital gain distributions to avoid an otherwise applicable excise tax. ETFs formed as grantor trusts, which include metal-based ETFs, generally do not make distributions, and income and expenses are treated as if investors directly owned the underlying metals. Other types of ETFs (such as commodity-linked ETFs formed as limited partnerships) distribute earnings in accordance with general tax rules applicable to that type of entity. 5 ETF shares can be created on a T+3 basis provided the authorized participant delivers in payment for the ETF shares the portfolio basket underlying an aggregation of ETF shares (known as a “Creation Unit”) whose size is specified by the issuer, as well as a designated amount of cash. 6 ETFs that are subject to cash creation and redemption also require such creations and redemptions to be carried out through an “Authorized Participant” in Creation Unit size. Although there are designated market makers for ETFs on exchanges, some ETFs trade infrequently and have sizeable spreads between the bid and ask prices. ETF issuers have complained for a number of years that market makers need to be incented to make tighter spreads. The NASDAQ and NYSE Arca reportedly are preparing rules that seek to overturn existing rules that prohibit payments by an issuer to a market maker to reduce spreads. The SEC has not yet disclosed whether they would support these rules. 7 “Style-based” ETFs are those structured to provide investors an investment vehicle based on investing style (e.g., value, growth or a combination). International ETFs refer generally to ETFs investing in securities based on geographic focus.
8 Source: J.P. Morgan Securities, Bloomberg 9 Actively managed ETFs are included in our list of ETFs. Out of 132 US listed ETFs issued in 2009, 8 US listed ETFs are actively managed. Out of 217 ETFs issued in 2010, 11 ETFs are actively managed. In 2011, 9 out of 296 newly issued are actively managed. Overall, there are 61 actively managed US listed ETFs. In our entire universe of ETFs, there are 118 actively managed ETFs (61 in US, 24 in Canada, 23 in EMEA and 10 in Asia). 10 An ETC is an investment vehicle, including a type of fund, partnership, trust or other collective investment entity, that tracks the performance of an underlying commodity or basket of commodities. It is a variation on ETFs. “Single commodity ETCs” typically follow the spot-price of a single commodity, whereas “index-tracking ETCs” follow the movement of an index or grouping of commodities, such as futures on oil or livestock.
Endnotes
20
Ticker ETF Name Tota
l Ass
ets
($M
)
Ave
rage
6M
Dai
ly
Volu
me
($M
)
Ave
rage
bid
-offe
r sp
read
(%)
Stoc
ks in
Und
. Ind
ex
(#)
Exp.
Rat
io (%
)
1Y N
AV
Trac
king
Er
ror(
%)
Opt
ions
Liq
uidi
ty
Ticker ETF Name Tota
l Ass
ets
($M
)
Ave
rage
6M
Dai
ly
Volu
me
($M
)
Ave
rage
bid
-offe
r sp
read
(%)
Stoc
ks in
Und
. Ind
ex
(#)
Exp.
Rat
io (%
)
1Y N
AV
Trac
king
Er
ror(
%)
Opt
ions
Liq
uidi
ty
1
2
Large Cap 3 Small Cap (Continued)SPY SPDR S&P 500 ETF Trust 138,039 21,255 0.01 500 0.09 0.04 H 4 TWM ProShares UltraShort Russell2000 363 30 0.05 1,953 0.95 1.56 LIVV iShares S&P 500 Index Fund 42,829 635 0.01 500 0.07 0.03 L 5 SLY SPDR S&P 600 Small CapETF 314 1 1.88 600 0.20 0.05 NQQQ Pow ershares QQQ Trust Series 1 34,641 2,603 0.01 100 0.20 0.03 H 6 VTWO Vanguard Russell 2000 222 2 1.00 1,953 0.21 0.06 NDIA SPDR DJ Industrial Average Trust 12,383 908 0.01 30 0.17 0.06 H 7 UWM ProShares Ultra Russell2000 168 48 0.05 1,953 0.98 0.73 LVOO Vanguard S&P 500 ETF 9,220 108 0.02 500 0.05 0.05 L 8 JKJ iShares Morningstar Small Core Index 166 1 0.15 - 0.25 0.20 NIWB iShares Russell 1000 Index Fund 7,622 54 0.02 1,000 0.15 0.04 L 9 SBB ProShares Short SmallCap600 147 1 1.09 600 0.95 0.46 NOEF iShares S&P 100 Index Fund 4,130 81 0.02 100 0.20 0.05 L # URTY ProShares UltraPro Russell2000 104 23 0.07 1,953 0.98 1.84 LVV Vanguard Large-Cap ETF 4,073 19 0.06 - 0.10 0.19 L 11 SRTY ProShares UltraPro Short Russell2000 70 11 0.06 1,953 0.95 3.09 LRSP Guggenheim S&P 500 Equal Weight 3,850 45 0.03 500 0.40 0.08 L # VIOO Vanguard S&P Small-Cap 600 ETF 64 0 - 600 0.17 0.06 NSSO ProShares Ultra S&P500 2,372 555 0.02 500 0.91 0.53 H # SAA ProShares Ultra SmallCap600 27 0 0.66 600 0.96 0.53 LSDS ProShares UltraShort S&P500 2,019 393 0.02 500 0.89 0.97 H # EWRS Guggenheim Russell 2000 Equal Weight 15 0 - 1,953 0.44 0.21 NSH ProShares Short S&P500 1,832 92 0.03 500 0.89 0.33 L # RTLA iPath Long Extended Russell 2000 TR 8 0 0.56 1,953 0.50 9.48 NSCHX Schw ab US Large-Cap ETF 1,497 11 0.05 751 0.04 0.04 L # SDD ProShares UltraShort SmallCap600 6 0 2.08 600 0.95 1.32 NIYY iShares Dow Jones US Index Fund 727 3 0.09 1,255 0.20 0.11 N # Micro CapXLG Guggenheim Russell Top 50 ETF 579 4 0.07 52 0.20 0.95 N # IWC iShares Russell Microcap Index Fund 557 3 0.27 - 0.69 0.18 LMGC Vanguard Mega Cap 300 ETF 567 3 1.57 300 0.12 0.17 L # FDM First Trust Dow Jones Select Microcap 67 1 0.62 - 0.60 0.14 NSPXU ProShares UltraPro Short S&P 500 566 123 0.04 500 0.93 1.81 L # PZI Pow ershares Zacks Micro Cap Portfolio 43 0 0.88 - 0.91 0.24 NQLD ProShares Ultra QQQ 519 177 0.02 100 0.95 0.68 L # WMCR Wilshire Micro-Cap ETF 35 0 1.57 - 0.50 4.00 NQID ProShares UltraShort QQQ 451 104 0.04 100 0.95 1.22 L # Multi CapUPRO ProShares UltraPro S&P 500 347 214 0.04 500 0.95 1.01 M # VTI Vanguard Total Stock Market ETF 30,456 178 0.02 - 0.05 0.05 LJKD iShares Morningstar Large Core Index 343 1 0.19 - 0.20 0.04 N # IWV iShares Russell 3000 Index Fund 4,253 35 0.08 3,000 0.20 0.05 LDXD ProShares UltraShort Dow 30 291 27 0.03 30 0.95 1.03 L # SCHB Schw ab US Broad Market ETF 1,910 17 0.05 2,495 0.04 0.15 LDOG ProShares Short Dow 30 272 13 0.04 30 0.95 0.42 L # ITOT iShares Core S&P Total US Stock 725 5 0.09 1,500 0.07 0.05 LDDM ProShares Ultra Dow 30 269 31 0.04 30 0.95 0.79 L # TMW SPDR Dow Jones Total Market ETF 507 1 0.32 - 0.20 0.65 NSPXL Direxion Daily Large Cap Bull 3X Shares 232 72 0.05 500 0.95 1.39 L # VTHR Vanguard Russell 3000 60 0 - 3,000 0.15 0.05 NFBG FI Enhanced Big Cap Grow th ETN 230 1 0.54 - 1.20 - N # TOTS Direxion Daily Total Market Bear 1x Shares 1 0 - - 0.65 0.47 NTQQQ ProShares UltraPro QQQ 219 161 0.03 100 0.95 1.28 M #
SQQQ ProShares UltraPro Short QQQ 216 51 0.04 100 0.95 2.32 L #
SPXS Direxion Daily Large Cap Bear 3X Shares 210 28 0.09 500 0.95 1.58 L #
PSQ ProShares Short QQQ 205 16 0.05 100 0.95 0.45 L # Growth (Large Cap)VONE Vanguard Russell 1000 205 1 0.20 1,000 0.12 0.06 N # IWF iShares Russell 1000 Grow th Index Fund 19,336 181 0.02 1,000 0.20 0.05 LONEQ Fidelity NASDAQ Comp Index Tracking 201 1 - 2,436 0.30 5.63 N # VUG Vanguard Grow th ETF 10,345 57 0.04 - 0.10 - LEUSA iShares MSCI USA Index Fund 162 0 0.16 - 0.15 0.07 N # IVW iShares S&P 500 Grow th Index Fund 7,384 56 0.03 292 0.18 0.04 LQQEW First Trust NASDAQ-100 Equal Wgt Index 140 1 0.45 100 0.60 0.23 L # MGK Vanguard Mega Cap 300 Grow th ETF 1,028 6 1.59 - 0.12 - LSDOW ProShares UltraPro Short Dow 30 122 15 0.06 30 0.95 1.76 L # SCHG Schw ab U.S. Large-Cap Grow th ETF 688 4 0.21 402 0.07 0.03 LEQL ALPS Equal Sector Weight ETF 94 1 2.18 - 0.52 0.35 N # JKE iShares Morningstar Large Grow th Index 460 2 0.10 - 0.25 0.04 NNYC iShares NYSE Composite Index Fund 82 1 0.32 1,901 0.25 0.06 N # RPG Guggenheim S&P 500 Pure Grow th 436 3 0.13 108 0.35 0.06 NNY iShares NYSE 100 Index Fund 61 0 0.40 100 0.20 0.24 N # IWY iShares Russell Top 200 Grow th Index 404 1 0.08 - 0.20 0.08 NQQXT First Trust NDX Ex-Tech IndexSM Fund 61 0 0.73 56 0.60 0.35 N # SPYG SPDR S&P 500 Grow th ETF 253 1 1.63 - 0.20 0.04 NUDOW ProShares UltraPro Dow 30 59 18 0.08 30 0.95 1.31 L # PWB Pow erShares Dynamic Large Cap Grow th 219 1 0.24 - 0.61 1.07 NIWL iShares Russell Top 200 Index Fund 57 0 0.19 200 0.15 0.08 N # FTC First Trust Large Cap Grow th AlphaDEX 150 1 0.42 - 0.70 0.18 LEWRI Guggenheim Russell 1000 Equal Weight 55 0 - 1,000 0.42 0.05 N # VOOG Vanguard S&P 500 Grow th ETF 127 1 0.70 - 0.15 0.05 NELR SPDR Dow Jones Large Cap ETF 38 0 1.26 751 0.20 0.06 N # VONG Vanguard Russell 1000 Grow th ETF 124 2 2.99 - 0.15 0.04 NBXUC Barclays ETN+long C Lev Linked to SPX 21 0 0.22 500 0.753 4.70 N # PXLG Pow erShares Fundamental Large Grow th 84 1 0.91 - 0.39 0.02 NROLA iPath Long Extended Russell 1000 TR 9 0 - 1,000 0.50 9.10 N # UKF ProShares Ultra Russell1000 Grow th 19 0 1.13 577 0.95 0.47 NUWC ProShares Ultra Russell 3000 6 0 2.05 2,943 0.95 0.42 N # RWG Columbia Large-Cap Grow th Equity 9 0 - 577 0.85 5.92 NSFLA iPath Long Extended S&P 500 TR Index 5 0 0.62 500 0.35 9.24 N # SFK ProShares UltraShort Russell1000 Grow th 4 0 - 577 0.95 0.96 NQQQE Direxion NASDAQ-100 Equal Wgt Index 5 0 - 100 0.35 0.23 N # RPX Columbia Large Cap Grow th 2 0 - 577 0.84 2.58 NBXDB Barclays ETN+short B Lev Linked to SPX 3 0 0.54 500 -0.403 - N # Growth (Mid Cap)BXUB Barclays ETN+long B Lev Linked to SPX 3 0 0.41 500 0.753 - N # IJK iShares S&P MidCap 400 Grow th Index 3,801 22 0.07 225 0.25 0.17 LTWQ ProShares UltraShort Russell 3000 1 0 - 2,943 0.95 0.98 N # IWP iShares Russell Midcap Grow th Index 3,724 25 0.07 - 0.25 0.05 LMid Cap # VOT Vanguard Mid-Cap Grow th Index 1,542 7 0.33 - 0.10 - LIJH iShares Core S&P Mid-Cap ETF 16,053 116 0.03 400 0.15 0.02 L # RFG Guggenheim S&P Midcap 400 Pure Grow th 630 3 0.21 91 0.35 0.26 NMDY SPDR S&P MidCap 400 ETF Trust 12,279 531 0.02 400 0.25 0.04 H # JKH iShares Morningstar Mid Grow th Index 172 1 0.14 - 0.30 0.06 NIWR iShares Russell Midcap Index Fund 7,659 40 0.06 798 0.21 0.04 L # IVOG Vanguard S&P Mid-Cap 400 Grow th ETF 159 1 - - 0.20 0.05 NVO Vanguard Mid-Cap ETF 5,051 21 0.13 - 0.10 0.56 L # MDYG SPDR S&P 400 Mid CapGrow th ETF 84 1 1.63 - 0.25 0.04 NVXF Vanguard Extended Market ETF 2,206 12 0.13 - 0.14 0.08 L # PXMG Pow erShares Fundamental Pure Mid Grow th 84 0 0.36 - 0.39 0.02 NSCHM Schw ab U.S. Mid-Cap ETF 515 6 0.12 576 0.07 0.04 L # FNY First Trust Mid Cap Grow th AlphaDEX 22 0 0.25 - 0.70 0.11 NJKG iShares Morningstar Mid Core Index Fund 201 1 0.19 - 0.25 0.07 N # UKW ProShares Ultra Russell MidCap Grow th 11 0 1.25 459 0.95 0.47 NIVOO Vanguard S&P Mid-Cap 400 ETF 162 1 - 400 0.16 0.06 N # SDK ProShares U. Short Russell MidCap Grow th 1 0 - 459 0.95 1.22 NMVV ProShares Ultra MidCap400 119 22 0.09 400 0.95 0.64 L # Growth (Small Cap)EMM SPDR Dow Jones Mid Cap ETF 97 1 0.70 576 0.25 0.06 N # IWO iShares Russell 2000 Grow th Index 4,463 103 0.04 - 0.25 0.05 LEWRM Guggenheim Russell MidCap Equal Wgt 61 0 1.20 - 0.42 0.06 N # VBK Vanguard Small-Cap Grow th ETF 2,737 13 0.16 - 0.10 - LMIDU Direxion Daily Mid Cap Bull 3X Shares 44 5 0.11 400 0.95 - L # IJT iShares S&P SmallCap 600 Grow th 1,871 11 0.10 351 0.25 0.23 LMYY ProShares Short MidCap 400 29 1 0.44 400 0.95 0.43 N # SLYG SPDR S&P 600 SmallCap Grow th 210 1 2.04 - 0.25 0.06 NUMDD ProShares UltraPro MidCap400 26 4 0.43 400 0.95 1.46 L # JKK iShares Morningstar Small Grow th 96 0 0.28 - 0.30 0.05 NMZZ ProShares UltraShort MidCap400 19 1 1.49 400 0.95 1.32 L # RZG Guggenheim S&P Smallcap 600 Pure Grow th 75 0 0.19 142 0.35 0.31 NMIDZ Direxion Daily Mid Cap Bear 3x Shares 11 1 0.44 400 0.95 4.45 L # VTWG Vanguard Russell 2000 Grow th 48 1 0.86 - 0.20 0.08 NSMDD ProShares UltraPro Short MidCap400 5 1 0.30 400 0.95 2.66 L # PXSG Pow erShares Fundamental Pure Small Grow th 27 0 1.16 - 0.41 0.04 NSmall Cap # VIOG Vanguard S&P Small-Cap 600 Grow th 21 0 2.43 - 0.20 0.04 NIWM iShares Russell 2000 Index Fund 20,493 3,663 0.01 1,953 0.23 0.05 H # FYC First Trust Small Cap Grow th AlphaDEX 11 0 0.88 - 0.70 0.09 NIJR iShares Core S&P Small-Cap ETF 10,143 79 0.04 600 0.16 0.04 L # UKK ProShares Ultra Russell2000 Grow th 10 0 2.68 1,105 0.95 0.58 NVB Vanguard Small-Cap ETF 6,175 36 0.07 - 0.10 0.93 L # SKK ProShares UltraShort Russell2000 Grow th 6 0 - 1,105 0.95 1.60 NSCHA Schw ab US Small-Cap ETF 1,129 10 0.18 1,741 0.08 0.06 L # Growth (Multi Cap)TZA Direxion Daily Small Cap Bear 3X Shares 913 204 0.03 1,953 0.95 2.91 M # IWZ iShares Russell 3000 Grow th Index Fund 404 3 0.10 - 0.25 0.06 NTNA Direxion Daily Small Cap Bull 3X Shares 423 618 0.03 1,953 0.95 1.41 H # FAD First Trust MultiCap Grow th AlphaDEX Fund 36 0 0.34 - 0.70 0.12 NRWM ProShares Short Russell2000 384 23 0.05 1,953 0.95 0.50 L #
Broad Based Broad Based
Style
1 Option Liquidity (H / M / L / N - High / Medium / Low / None)2 / - Significant increase / decrease in shares outstanding in last one year3 Expense Ratio = 91 day Treasury Bills +/- bps*
US Listed ETFs
21
Ticker ETF Name Tota
l Ass
ets
($M
)
Ave
rage
6M
Dai
ly
Volu
me
($M
)
Ave
rage
bid
-offe
r sp
read
(%)
Stoc
ks in
Und
. Ind
ex
(#)
Exp.
Rat
io (%
)
1Y N
AV
Trac
king
Er
ror(
%)
Opt
ions
Liq
uidi
ty
Ticker ETF Name Tota
l Ass
ets
($M
)
Ave
rage
6M
Dai
ly
Volu
me
($M
)
Ave
rage
bid
-offe
r sp
read
(%)
Stoc
ks in
Und
. Ind
ex
(#)
Exp.
Rat
io (%
)
1Y N
AV
Trac
king
Er
ror(
%)
Opt
ions
Liq
uidi
ty
1
2
Value (Large Cap) 3 Enhanced (Large Cap) (Continued)IWD iShares Russell 1000 Value Index Fund 17,609 157 0.01 - 0.21 0.05 L 4 EEH ELEMENTS Spectrum ETN 1 0 - - 0.75 5.01 NVTV Vanguard Value ETF 9,732 58 0.03 - 0.10 - L 5 SSAM Rockledge SectorSAM ETF 1 0 1.29 - 1.50 - NIVE iShares S&P 500 Value Index Fund 5,930 54 0.02 - 0.18 0.06 L 6 Enhanced (Mid Cap)SCHV Schw ab U.S. Large-Cap Value ETF 613 4 0.14 349 0.07 0.04 L 7 PRFZ Pow erShares FTSE RAFI US 1500 Small-Mid 584 2 0.79 - 0.39 0.05 NPWV Pow erShares Dynamic Large Cap Value 582 3 0.10 - 0.59 0.15 N 8 FNX First Trust Mid Cap Core AlphaDEX Fund 432 3 1.23 - 0.70 0.11 NMGV Vanguard Mega Cap 300 Value ETF 570 3 0.20 - 0.12 - L 9 EZM WisdomTree MidCap Earnings Fund 216 1 0.53 614 0.38 0.05 NFTA First Trust Large Cap Value AlphaDEX Fund 397 2 0.89 - 0.70 0.21 N # RWK RevenueShares Mid Cap ETF 128 1 0.39 - 0.54 0.46 NJKF iShares Morningstar Large Value Index Fund 263 1 0.18 - 0.25 0.05 N 11 CZA Guggenheim Mid-Cap Core ETF 70 0 1.71 - 0.65 0.37 NRPV Guggenheim S&P 500 Pure Value ETF 200 2 0.30 117 0.35 0.06 N # PXMC Pow erShares Fundamental Pure Mid Core 20 0 0.81 - 0.39 0.05 NSPYV SPDR S&P 500 Value ETF 162 1 1.68 - 0.20 0.06 N # XMLV Pow erShares S&P MidCap Low Volatility 17 - 0.22 - 0.25 - NVLUE iShares MSCI USA Value Factor 104 - - 603 0.15 - N # Enhanced (Small Cap)VONV Vanguard Russell 1000 Value 102 1 0.53 - 0.15 0.05 N # FYX First Trust Small Cap Core AlphaDEX Fund 228 2 0.77 - 0.70 0.12 NIWX iShares Russell Top 200 Value Index Fund 98 1 0.14 - 0.20 0.10 N # EES WisdomTree SmallCap Earnings Fund 185 1 1.38 925 0.38 0.08 NVOOV Vanguard S&P 500 Value ETF 95 1 1.96 - 0.15 0.06 N # RWJ RevenueShares Small Cap ETF 150 1 0.49 - 0.54 0.26 NEZY WisdomTree LargeCap Value Fund 25 0 0.72 - 0.38 0.08 N # DWAS Pow erShares DWA SmallCap Tech. Leaders 72 1 0.29 - 0.60 - NPXLV Pow erShares Fundamental Pure Large Value 9 0 1.76 - 0.39 0.06 N # PXSC Pow erShares Fundamental Pure Small Core 16 0 0.74 - 0.39 0.05 NUVG ProShares Ultra Russell1000 Value 7 0 2.49 695 0.95 0.46 N # XSLV Pow erShares S&P SmallCap Low Volatility 12 - 0.37 - 0.25 - NGVT Columbia Concentrated Large Cap Value 4 0 - 990 0.81 4.25 N # SMLV SPDR Russell 2000 Low Volatility 10 - 0.23 - 0.25 - NSJF ProShares UltraShort Russell1000 Value 1 0 - 695 0.95 1.01 N # IESM iShares Enhanced U.S. Small-Cap 3 - - - 0.35 - NValue (Mid Cap) # Enhanced (Multi Cap)IWS iShares Russell Midcap Value Index Fund 4,887 43 0.05 - 0.28 0.06 L # PDP Pow ershares DWA Technical Leaders 893 8 0.16 - 0.67 0.29 LIJJ iShares S&P MidCap 400 Value Index Fund 3,024 16 0.09 296 0.27 0.25 L # MOAT Market Vectors Wide Moat ETF 214 2 0.20 - 0.49 0.02 NVOE Vanguard Mid-Cap Value Index Fund 1,705 10 0.82 - 0.10 - L # PWC Pow erShares Dynamic Market Portfolio 144 0 0.25 - 0.60 0.12 NJKI iShares Morningstar Mid Value Index Fund 123 0 0.27 - 0.30 0.05 N # RYJ Guggenheim Raymond James SB-1 Equity 115 1 0.76 - 0.75 1.09 NRFV Guggenheim S&P Midcap 400 Pure Value 58 0 0.22 98 0.36 0.29 N # SIZE iShares MSCI USA Size Factor 107 - - 603 0.15 - NMDYV SPDR S&P 400 Mid Cap Value ETF 49 0 - - 0.25 0.06 N # EXT WisdomTree Total Earnings Fund 55 0 1.66 2,040 0.28 0.18 NPXMV Pow erShares Fundamental Pure Mid Value 29 0 0.23 - 0.39 0.05 N # PIQ Pow erShares Dynamic MagniQuant Portfolio 19 0 0.88 - 0.65 0.12 NIVOV Vanguard S&P Mid-Cap 400 Value ETF 23 0 - - 0.22 0.06 N # TTFS TrimTabs Float Shrink ETF 17 0 0.82 - 0.99 - NFNK First Trust Mid Cap Value AlphaDEX Fund 18 1 0.40 - 0.70 0.16 N # MMTM SPDR S&P 1500 Momentum Tilt ETF 10 0 0.32 - 0.35 - NUVU ProShares Ultra Russell MidCap Value 9 0 1.28 565 0.95 0.51 N # VSPY Direxion S&P 500 RC Volatility Response 5 0 0.12 - 0.45 0.23 NSJL ProShares UltraShort Russell MidCap Value 1 0 2.82 565 0.95 1.15 N # AlphaValue (Small Cap) # QAI IndexIQ ETF Trust - IQ Hedge Multi-Strategy 398 3 0.70 - 1.03 0.11 NIWN iShares Russell 2000 Value Index Fund 5,241 108 0.02 - 0.37 0.06 L # HDGE Ranger Equity Bear ETF 245 6 0.12 500 3.30 - LVBR Vanguard Small-Cap Value ETF 2,992 14 0.15 - 0.21 - L # PBP Pow erShares S&P 500 BuyWrite Portfolio 205 3 0.32 - 0.75 0.08 NIJS iShares S&P SmallCap 600 Value Index Fund 2,304 11 0.10 444 0.29 0.26 L # CSM ProShares Large Cap Core Plus 126 1 0.86 - 0.45 0.23 LTILT FlexShares Morningstar Market Factors Tilt 292 1 0.91 - 0.27 0.06 N # RLY SPDR SSgA Multi-Asset Real Return ETF 123 1 0.76 - 0.70 - NJKL iShares Morningstar Small Value Index Fund 283 3 0.13 - 0.30 0.07 N # CSMA Credit Suisse Merger Arbitrage Index ETN 73 0 0.57 - 0.55 - NSLYV SPDR S&P 600 Small CapValue ETF 169 1 2.07 - 0.25 0.06 N # MCRO IQ Hedge Macro Tracker ETF 63 0 - - 1.05 0.14 NRZV Guggenheim S&P Smallcap 600 Pure Value 86 1 0.27 149 0.35 0.33 N # HDG ProShares Hedge Replication ETF 49 0 0.16 - 0.95 1.59 NPXSV Pow erShares Fundamental Pure Small Value 49 0 0.46 - 0.39 0.08 N # GURU Global X Top Guru Holdings Index ETF 34 0 0.70 - 0.75 - NVTWV Vanguard Russell 2000 Value 37 0 - - 0.32 0.06 N # AGLS Accuvest Global Long Short ETF 32 0 0.80 1,609 1.50 - NVIOV Vanguard S&P Small-Cap 600 Value ETF 24 0 - - 0.24 0.06 N # RALS ProShares RAFI Long/Short 24 0 - - 0.95 - NFYT First Trust Small Cap Value AlphaDEX Fund 13 0 0.62 - 0.70 0.17 N # CSMB Credit Suisse Merger Arbitrage Index Net 22 0 - - 0.55 - NUVT ProShares Ultra Russell2000 Value 10 0 2.13 1,403 1.01 0.71 N # CSLS Credit Suisse Long/Short Liquid Index ETN 20 0 0.23 - 0.45 1.89 NSJH ProShares UltraShort Russell2000 Value 3 0 - 1,403 0.95 1.47 N # ALFA AlphaClone Alternative Alpha ETF 16 0 0.39 - 0.95 - NValue (Multi Cap) # MNA IQ Merger Arbitrage ETF 14 0 1.63 - 0.76 0.58 NIWW iShares Russell 3000 Value Index Fund 417 3 0.09 - 0.25 0.06 N # BTAL QuantShares US Market Neutral Anti-Beta 14 0 - 400 0.81 0.25 NFAB First Trust Multi Cap Value AlphaDEX Fund 73 1 0.39 - 0.70 0.17 N # BWV iPath CBOE S&P 500 BuyWrite Index ETN 12 0 - - 0.75 0.26 NVLU SPDR S&P 1500 Value Tilt ETF 7 0 0.64 - 0.35 - N # OFF ETRACS Fisher-Gartman Risk Off ETN 12 0 0.90 - 1.15 - NEnhanced (Large Cap) # ONN ETRACS Fisher-Gartman Risk On ETN 11 0 0.90 - 0.85 - NSPLV Pow erShares S&P 500 Low Volatility 5,297 55 0.04 - 0.25 0.02 L # HUSE Huntington US Equity Rotation Strategy ETF 11 0 - 500 0.95 - NUSMV iShares MSCI USA Minimum Volatility Index 3,514 24 0.06 - 0.15 0.12 L # MRGR ProShares Merger ETF 6 - 0.61 - 0.75 - NPRF Pow ershares FTSE RAFI US 1000 Portfolio 1,832 7 0.16 1,000 0.39 0.02 N # GIVE AdvisorShares Global Echo ETF 5 0 - - 1.70 - NFEX First Trust Large Cap Core AlphaDEX Fund 412 2 0.53 - 0.70 0.18 N # QMN IQ Hedge Market Neutral Tracker ETF 5 0 2.16 - 0.99 - NSPHB Pow erShares S&P 500 High Beta Portfolio 285 4 0.27 - 0.25 0.03 N # QEH QAM Equity Hedge ETF 4 0 1.62 - 1.64 - NSPHQ Pow erShares S&P 500 High Quality Portfolio 235 1 0.25 130 0.29 0.02 N # CHEP QuantShares U.S. Market Neutral Value 4 0 1.67 400 0.81 0.36 NRWL RevenueShares Large Cap ETF 180 1 1.16 - 0.49 0.05 L # JFT KEYnotes - Enhanced 130/30 Large Cap 4 0 - - 0.95 - NMTUM iShares MSCI USA Momentum Factor 108 - - 124 0.15 - N # SIZ QuantShares U.S. Market Neutral Size 4 0 - 400 0.81 0.54 NEPS WisdomTree Earnings 500 Fund 74 0 0.40 500 0.28 0.06 N # CSMN Credit Suisse Market Neutral Global Equity 3 0 0.73 - 1.05 - NFVL First Trust Value Line 100 48 0 0.49 100 0.70 0.15 N # HVPW US Equity High Volatility Put Write 3 - 2.41 - 0.95 - NFDV First Trust Strategic Value Index Fund 36 0 1.55 - 0.65 0.30 N # RRGR AdvisorShares Global Alpha & Beta ETF 1 0 1.68 - 1.25 - NPXLC Pow erShares Fundamental Pure Large Core 28 0 0.97 - 0.39 0.04 N # MOM QuantShares U.S. Market Neutral Momentum 1 0 - 400 0.81 0.37 NPHDG PS S&P Dow nside Hdgd 23 - 0.33 - 0.39 - N # DividendPWO Pow erShares Dynamic OTC Portfolio 23 0 0.38 - 0.60 0.27 N # VIG Vanguard Dividend Appreciation ETF 15,694 87 0.02 - 0.13 0.07 LWMW ELEMENTS - Morningstar Wide Moat Focus 22 0 1.39 - 0.75 4.35 N # DVY iShares Dow Jones Select Dividend Index 12,437 76 0.02 100 0.40 0.11 LFWDD Madrona Domestic ETF 19 0 - - 1.25 - N # SDY SPDR S&P Dividend ETF 11,989 72 0.06 - 0.35 0.07 LDOD ELEMENTS - "Dogs of the Dow " 18 0 1.56 - 0.75 3.45 N # VYM Vanguard High Dividend Yield ETF 5,899 36 0.03 - 0.10 0.08 LGSRA ALPS/GS Risk-Adjusted Return U.S. Large Cap 11 - 0.34 50 0.55 - N # HDV iShares High Dividend Equity Fund 3,512 28 0.04 - 0.40 0.06 LFLAG Forensic Accounting ETF 10 - 0.34 - 0.85 - N # DLN WisdomTree LargeCap Dividend Fund 1,634 13 0.20 - 0.28 0.07 LCAPE Barclays ETN+ Shiller CAPE™ ETN 9 0 0.12 - 0.45 - N # DTN WisdomTree Dividend Ex-Financials Fund 1,140 9 0.15 83 0.38 0.05 LFMK First Trust Mega Cap AlphaDEX Fund 9 0 - - 0.70 0.22 N # SCHD Schw ab US Dividend Equity ETF 979 10 0.06 100 0.07 6.90 LRWV RevenueShares Navellier Overall A-100 Fund 7 0 - - 0.60 0.43 N # PID Pow erShares International Div. Achievers 897 5 0.12 - 0.56 0.13 NLGLV SPDR Russell 1000 Low Volatility 6 - 0.19 - 0.20 - N # DHS WisdomTree Equity Income Fund 706 4 0.34 370 0.38 0.08 NVIXH First Trust CBOE S&P 500 VIX Tail Hedge 6 0 0.45 - 0.60 - N # FVD First Trust Value Line Dividend Index Fund 653 3 0.16 - 0.70 0.30 NALTL RBS US L/C Alternator ETN 5 0 0.50 - 1.00 - N # FDL First Trust Morningstar Dividend Leaders 641 5 0.11 - 0.45 0.49 NFVI First Trust Value Line Equity Allocation Index 4 0 1.68 - 0.70 0.23 N # DON WisdomTree MidCap Dividend Fund 619 4 0.38 - 0.38 0.08 NIELG iShares Enhanced U.S. Large-Cap 3 - - - 0.18 - N # DES WisdomTree SmallCap Dividend Fund 597 4 0.40 - 0.38 0.42 L
Style Style
1 Option Liquidity (H / M / L / N - High / Medium / Low / None)2 / - Significant increase / decrease in shares outstanding in last one year
US Listed ETFs
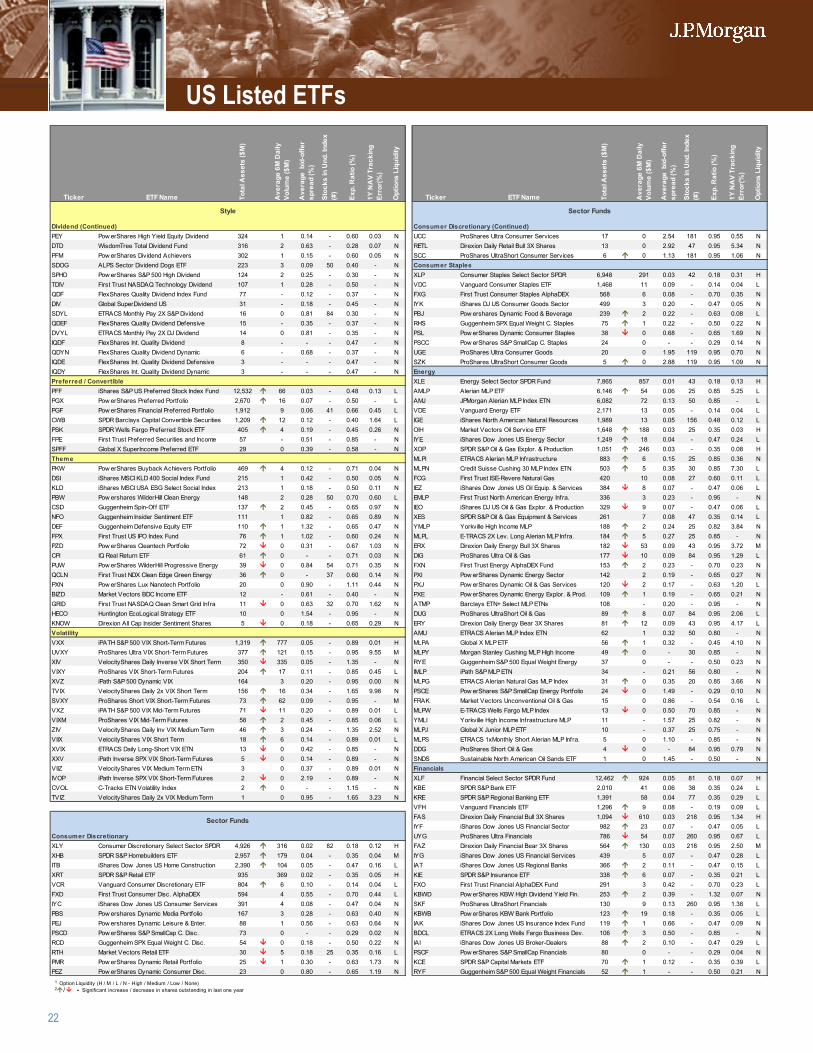
22
Ticker ETF Name Tota
l Ass
ets
($M
)
Ave
rage
6M
Dai
ly
Volu
me
($M
)
Ave
rage
bid
-offe
r sp
read
(%)
Stoc
ks in
Und
. Ind
ex
(#)
Exp.
Rat
io (%
)
1Y N
AV
Trac
king
Er
ror(
%)
Opt
ions
Liq
uidi
ty
Ticker ETF Name Tota
l Ass
ets
($M
)
Ave
rage
6M
Dai
ly
Volu
me
($M
)
Ave
rage
bid
-offe
r sp
read
(%)
Stoc
ks in
Und
. Ind
ex
(#)
Exp.
Rat
io (%
)
1Y N
AV
Trac
king
Er
ror(
%)
Opt
ions
Liq
uidi
ty
1
2
Dividend (Continued) 3 Consumer Discretionary (Continued)PEY Pow erShares High Yield Equity Dividend 324 1 0.14 - 0.60 0.03 N 4 UCC ProShares Ultra Consumer Services 17 0 2.54 181 0.95 0.55 NDTD WisdomTree Total Dividend Fund 316 2 0.63 - 0.28 0.07 N 5 RETL Direxion Daily Retail Bull 3X Shares 13 0 2.92 47 0.95 5.34 NPFM Pow erShares Dividend Achievers 302 1 0.15 - 0.60 0.05 N 6 SCC ProShares UltraShort Consumer Services 6 0 1.13 181 0.95 1.06 NSDOG ALPS Sector Dividend Dogs ETF 223 3 0.09 50 0.40 - N 7 Consumer StaplesSPHD Pow erShares S&P 500 High Dividend 124 2 0.25 - 0.30 - N 8 XLP Consumer Staples Select Sector SPDR 6,948 291 0.03 42 0.18 0.31 HTDIV First Trust NASDAQ Technology Dividend 107 1 0.28 - 0.50 - N 9 VDC Vanguard Consumer Staples ETF 1,468 11 0.09 - 0.14 0.04 LQDF FlexShares Quality Dividend Index Fund 77 - 0.12 - 0.37 - N # FXG First Trust Consumer Staples AlphaDEX 568 6 0.08 - 0.70 0.35 NDIV Global SuperDividend US 31 - 0.18 - 0.45 - N 11 IYK iShares DJ US Consumer Goods Sector 499 3 0.20 - 0.47 0.05 NSDYL ETRACS Monthly Pay 2X S&P Dividend 16 0 0.81 84 0.30 - N # PBJ Pow ershares Dynamic Food & Beverage 239 2 0.22 - 0.63 0.08 LQDEF FlexShares Quality Dividend Defensive 15 - 0.35 - 0.37 - N # RHS Guggenheim SPX Equal Weight C. Staples 75 1 0.22 - 0.50 0.22 NDVYL ETRACS Monthly Pay 2X DJ Dividend 14 0 0.81 - 0.35 - N # PSL Pow erShares Dynamic Consumer Staples 38 0 0.68 - 0.65 1.69 NIQDF FlexShares Int. Quality Dividend 8 - - - 0.47 - N # PSCC Pow erShares S&P SmallCap C. Staples 24 0 - - 0.29 0.14 NQDYN FlexShares Quality Dividend Dynamic 6 - 0.68 - 0.37 - N # UGE ProShares Ultra Consumer Goods 20 0 1.95 119 0.95 0.70 NIQDE FlexShares Int. Quality Dividend Defensive 3 - - - 0.47 - N # SZK ProShares UltraShort Consumer Goods 5 0 2.88 119 0.95 1.09 NIQDY FlexShares Int. Quality Dividend Dynamic 3 - - - 0.47 - N # EnergyPreferred / Convertible # XLE Energy Select Sector SPDR Fund 7,865 857 0.01 43 0.18 0.13 HPFF iShares S&P US Preferred Stock Index Fund 12,532 66 0.03 - 0.48 0.13 L # AMLP Alerian MLP ETF 6,146 54 0.06 25 0.85 5.25 LPGX Pow erShares Preferred Portfolio 2,670 16 0.07 - 0.50 - L # AMJ JPMorgan Alerian MLP Index ETN 6,082 72 0.13 50 0.85 - LPGF Pow erShares Financial Preferred Portfolio 1,912 9 0.06 41 0.66 0.45 L # VDE Vanguard Energy ETF 2,171 13 0.05 - 0.14 0.04 LCWB SPDR Barclays Capital Convertible Securities 1,209 12 0.12 - 0.40 1.64 L # IGE iShares North American Natural Resources 1,989 13 0.05 156 0.48 0.12 LPSK SPDR Wells Fargo Preferred Stock ETF 405 4 0.19 - 0.45 0.26 N # OIH Market Vectors Oil Service ETF 1,648 188 0.03 25 0.35 0.03 HFPE First Trust Preferred Securities and Income 57 - 0.51 - 0.85 - N # IYE iShares Dow Jones US Energy Sector 1,249 18 0.04 - 0.47 0.24 LSPFF Global X SuperIncome Preferred ETF 29 0 0.39 - 0.58 - N # XOP SPDR S&P Oil & Gas Explor. & Production 1,051 246 0.03 - 0.35 0.08 HTheme # MLPI ETRACS Alerian MLP Infrastructure 883 6 0.15 25 0.85 0.36 NPKW Pow erShares Buyback Achievers Portfolio 469 4 0.12 - 0.71 0.04 N # MLPN Credit Suisse Cushing 30 MLP Index ETN 503 5 0.35 30 0.85 7.30 LDSI iShares MSCI KLD 400 Social Index Fund 215 1 0.42 - 0.50 0.05 N # FCG First Trust ISE-Revere Natural Gas 420 10 0.08 27 0.60 0.11 LKLD iShares MSCI USA ESG Select Social Index 213 1 0.18 - 0.50 0.11 N # IEZ iShares Dow Jones US Oil Equip. & Services 384 8 0.07 - 0.47 0.06 LPBW Pow ershares WilderHill Clean Energy 148 2 0.28 50 0.70 0.60 L # EMLP First Trust North American Energy Infra. 336 3 0.23 - 0.95 - NCSD Guggenheim Spin-Off ETF 137 2 0.45 - 0.65 0.97 N # IEO iShares DJ US Oil & Gas Explor. & Production 329 9 0.07 - 0.47 0.06 LNFO Guggenheim Insider Sentiment ETF 111 1 0.82 - 0.65 0.89 N # XES SPDR S&P Oil & Gas Equipment & Services 261 7 0.08 47 0.35 0.14 LDEF Guggenheim Defensive Equity ETF 110 1 1.32 - 0.65 0.47 N # YMLP Yorkville High Income MLP 188 2 0.24 25 0.82 3.84 NFPX First Trust US IPO Index Fund 76 1 1.02 - 0.60 0.24 N # MLPL E-TRACS 2X Lev. Long Alerian MLP Infra. 184 5 0.27 25 0.85 - NPZD Pow erShares Cleantech Portfolio 72 0 0.31 - 0.67 1.03 N # ERX Direxion Daily Energy Bull 3X Shares 182 53 0.09 43 0.95 3.72 MCPI IQ Real Return ETF 61 0 - - 0.71 0.03 N # DIG ProShares Ultra Oil & Gas 177 10 0.09 84 0.95 1.29 LPUW Pow erShares WilderHill Progressive Energy 39 0 0.84 54 0.71 0.35 N # FXN First Trust Energy AlphaDEX Fund 153 2 0.23 - 0.70 0.23 NQCLN First Trust NDX Clean Edge Green Energy 36 0 - 37 0.60 0.14 N # PXI Pow erShares Dynamic Energy Sector 142 2 0.19 - 0.65 0.27 NPXN Pow erShares Lux Nanotech Portfolio 20 0 0.90 - 1.11 0.44 N # PXJ Pow erShares Dynamic Oil & Gas Services 120 2 0.17 - 0.63 1.20 LBIZD Market Vectors BDC Income ETF 12 - 0.61 - 0.40 - N # PXE Pow erShares Dynamic Energy Explor. & Prod. 109 1 0.19 - 0.65 0.21 NGRID First Trust NASDAQ Clean Smart Grid Infra 11 0 0.63 32 0.70 1.62 N # ATMP Barclays ETN+ Select MLP ETNs 108 - 0.20 - 0.95 - NHECO Huntington EcoLogical Strategy ETF 10 0 1.54 - 0.95 - N # DUG ProShares UltraShort Oil & Gas 89 8 0.07 84 0.95 2.06 LKNOW Direxion All Cap Insider Sentiment Shares 5 0 0.18 - 0.65 0.29 N # ERY Direxion Daily Energy Bear 3X Shares 81 12 0.09 43 0.95 4.17 LVolatility # AMU ETRACS Alerian MLP Index ETN 62 1 0.32 50 0.80 - NVXX iPATH S&P 500 VIX Short-Term Futures 1,319 777 0.05 - 0.89 0.01 H # MLPA Global X MLP ETF 56 1 0.32 - 0.45 4.10 NUVXY ProShares Ultra VIX Short-Term Futures 377 121 0.15 - 0.95 9.55 M # MLPY Morgan Stanley Cushing MLP High Income 49 0 - 30 0.85 - NXIV VelocityShares Daily Inverse VIX Short Term 350 335 0.05 - 1.35 - N # RYE Guggenheim S&P 500 Equal Weight Energy 37 0 - - 0.50 0.23 NVIXY ProShares VIX Short-Term Futures 204 17 0.11 - 0.85 0.45 L # IMLP iPath S&P MLP ETN 34 - 0.21 56 0.80 - NXVZ iPath S&P 500 Dynamic VIX 164 3 0.20 - 0.95 0.00 N # MLPG ETRACS Alerian Natural Gas MLP Index 31 0 0.35 20 0.85 3.66 NTVIX VelocityShares Daily 2x VIX Short Term 156 16 0.34 - 1.65 9.98 N # PSCE Pow erShares S&P SmallCap Energy Portfolio 24 0 1.49 - 0.29 0.10 NSVXY ProShares Short VIX Short-Term Futures 73 62 0.09 - 0.95 - M # FRAK Market Vectors Unconventional Oil & Gas 15 0 0.86 - 0.54 0.16 LVXZ iPATH S&P 500 VIX Mid-Term Futures 71 11 0.20 - 0.89 0.01 L # MLPW E-TRACS Wells Fargo MLP Index 13 0 0.50 70 0.85 - NVIXM ProShares VIX Mid-Term Futures 58 2 0.45 - 0.85 0.06 L # YMLI Yorkville High Income Infrastructure MLP 11 - 1.57 25 0.82 - NZIV VelocityShares Daily Inv VIX Medium Term 46 3 0.24 - 1.35 2.52 N # MLPJ Global X Junior MLP ETF 10 - 0.37 25 0.75 - NVIIX VelocityShares VIX Short Term 18 6 0.14 - 0.89 0.01 L # MLPS ETRACS 1xMonthly Short Alerian MLP Infra. 5 0 1.10 - 0.85 - NXVIX ETRACS Daily Long-Short VIX ETN 13 0 0.42 - 0.85 - N # DDG ProShares Short Oil & Gas 4 0 - 84 0.95 0.79 NXXV iPath Inverse SPX VIX Short-Term Futures 5 0 0.14 - 0.89 - N # SNDS Sustainable North American Oil Sands ETF 1 0 1.45 - 0.50 - NVIIZ VelocityShares VIX Medium Term ETN 3 0 0.37 - 0.89 0.01 N # FinancialsIVOP iPath Inverse SPX VIX Short-Term Futures 2 0 2.19 - 0.89 - N # XLF Financial Select Sector SPDR Fund 12,462 924 0.05 81 0.18 0.07 HCVOL C-Tracks ETN Volatility Index 2 0 - - 1.15 - N # KBE SPDR S&P Bank ETF 2,010 41 0.06 38 0.35 0.24 LTVIZ VelocityShares Daily 2x VIX Medium Term 1 0 0.95 - 1.65 3.23 N # KRE SPDR S&P Regional Banking ETF 1,391 58 0.04 77 0.35 0.29 L
# VFH Vanguard Financials ETF 1,296 9 0.08 - 0.19 0.09 L# FAS Direxion Daily Financial Bull 3X Shares 1,094 610 0.03 218 0.95 1.34 H# IYF iShares Dow Jones US Financial Sector 982 23 0.07 - 0.47 0.05 L
Consumer Discretionary # UYG ProShares Ultra Financials 786 54 0.07 260 0.95 0.67 LXLY Consumer Discretionary Select Sector SPDR 4,926 316 0.02 82 0.18 0.12 H # FAZ Direxion Daily Financial Bear 3X Shares 564 130 0.03 218 0.95 2.50 MXHB SPDR S&P Homebuilders ETF 2,957 179 0.04 - 0.35 0.04 M # IYG iShares Dow Jones US Financial Services 439 5 0.07 - 0.47 0.28 LITB iShares Dow Jones US Home Construction 2,390 104 0.05 - 0.47 0.16 L # IAT iShares Dow Jones US Regional Banks 366 2 0.11 - 0.47 0.15 LXRT SPDR S&P Retail ETF 935 369 0.02 - 0.35 0.05 H # KIE SPDR S&P Insurance ETF 338 6 0.07 - 0.35 0.21 LVCR Vanguard Consumer Discretionary ETF 804 6 0.10 - 0.14 0.04 L # FXO First Trust Financial AlphaDEX Fund 291 3 0.42 - 0.70 0.23 LFXD First Trust Consumer Disc. AlphaDEX 594 4 0.55 - 0.70 0.44 L # KBWD Pow erShares KBW High Dividend Yield Fin. 253 2 0.39 - 1.32 0.07 NIYC iShares Dow Jones US Consumer Services 391 4 0.08 - 0.47 0.04 N # SKF ProShares UltraShort Financials 130 9 0.13 260 0.95 1.38 LPBS Pow ershares Dynamic Media Portfolio 167 3 0.28 - 0.63 0.40 N # KBWB Pow erShares KBW Bank Portfolio 123 19 0.18 - 0.35 0.05 LPEJ Pow ershares Dynamic Leisure & Enter. 88 1 0.56 - 0.63 0.64 N # IAK iShares Dow Jones US Insurance Index Fund 119 1 0.66 - 0.47 0.09 NPSCD Pow erShares S&P SmallCap C. Disc. 73 0 - - 0.29 0.02 N # BDCL ETRACS 2X Long Wells Fargo Business Dev. 106 3 0.50 - 0.85 - NRCD Guggenheim SPX Equal Weight C. Disc. 54 0 0.18 - 0.50 0.22 N # IAI iShares Dow Jones US Broker-Dealers 88 2 0.10 - 0.47 0.29 LRTH Market Vectors Retail ETF 30 5 0.18 25 0.35 0.16 L # PSCF Pow erShares S&P SmallCap Financials 80 0 - - 0.29 0.04 NPMR Pow erShares Dynamic Retail Portfolio 25 1 0.30 - 0.63 1.73 N # KCE SPDR S&P Capital Markets ETF 70 1 0.12 - 0.35 0.39 LPEZ Pow erShares Dynamic Consumer Disc. 23 0 0.80 - 0.65 1.19 N # RYF Guggenheim S&P 500 Equal Weight Financials 52 1 - - 0.50 0.21 N
Style Sector Funds
Sector Funds
1 Option Liquidity (H / M / L / N - High / Medium / Low / None)2 / - Significant increase / decrease in shares outstanding in last one year
US Listed ETFs
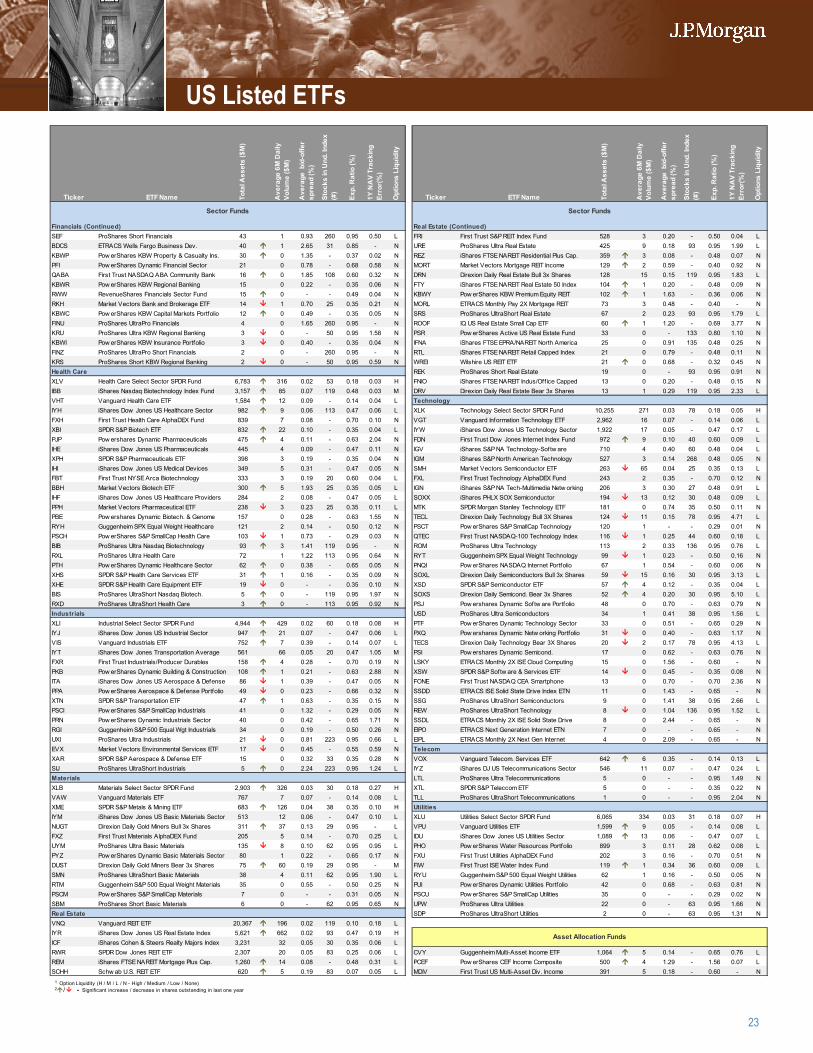
23
US Listed ETFs
Ticker ETF Name Tota
l Ass
ets
($M
)
Ave
rage
6M
Dai
ly
Volu
me
($M
)
Ave
rage
bid
-offe
r sp
read
(%)
Stoc
ks in
Und
. Ind
ex
(#)
Exp.
Rat
io (%
)
1Y N
AV
Trac
king
Er
ror(
%)
Opt
ions
Liq
uidi
ty
Ticker ETF Name Tota
l Ass
ets
($M
)
Ave
rage
6M
Dai
ly
Volu
me
($M
)
Ave
rage
bid
-offe
r sp
read
(%)
Stoc
ks in
Und
. Ind
ex
(#)
Exp.
Rat
io (%
)
1Y N
AV
Trac
king
Er
ror(
%)
Opt
ions
Liq
uidi
ty
1
2
Financials (Continued) 3 Real Estate (Continued)SEF ProShares Short Financials 43 1 0.93 260 0.95 0.50 L 4 FRI First Trust S&P REIT Index Fund 528 3 0.20 - 0.50 0.04 LBDCS ETRACS Wells Fargo Business Dev. 40 1 2.65 31 0.85 - N 5 URE ProShares Ultra Real Estate 425 9 0.18 93 0.95 1.99 LKBWP Pow erShares KBW Property & Casualty Ins. 30 0 1.35 - 0.37 0.02 N 6 REZ iShares FTSE NAREIT Residential Plus Cap. 359 3 0.08 - 0.48 0.07 NPFI Pow erShares Dynamic Financial Sector 21 0 0.78 - 0.68 0.58 N 7 MORT Market Vectors Mortgage REIT Income 129 2 0.59 - 0.40 0.92 NQABA First Trust NASDAQ ABA Community Bank 16 0 1.85 108 0.60 0.32 N 8 DRN Direxion Daily Real Estate Bull 3x Shares 128 15 0.15 119 0.95 1.83 LKBWR Pow erShares KBW Regional Banking 15 0 0.22 - 0.35 0.06 N 9 FTY iShares FTSE NAREIT Real Estate 50 Index 104 1 0.20 - 0.48 0.09 NRWW RevenueShares Financials Sector Fund 15 0 - - 0.49 0.04 N # KBWY Pow erShares KBW Premium Equity REIT 102 1 1.63 - 0.36 0.06 NRKH Market Vectors Bank and Brokerage ETF 14 1 0.70 25 0.35 0.21 N 11 MORL ETRACS Monthly Pay 2X Mortgage REIT 73 3 0.48 - 0.40 - NKBWC Pow erShares KBW Capital Markets Portfolio 12 0 0.49 - 0.35 0.05 N # SRS ProShares UltraShort Real Estate 67 2 0.23 93 0.95 1.79 LFINU ProShares UltraPro Financials 4 0 1.65 260 0.95 - N # ROOF IQ US Real Estate Small Cap ETF 60 1 1.20 - 0.69 3.77 NKRU ProShares Ultra KBW Regional Banking 3 0 - 50 0.95 1.58 N # PSR Pow erShares Active US Real Estate Fund 33 0 - 133 0.80 1.10 NKBWI Pow erShares KBW Insurance Portfolio 3 0 0.40 - 0.35 0.04 N # IFNA iShares FTSE EPRA/NAREIT North America 25 0 0.91 135 0.48 0.25 NFINZ ProShares UltraPro Short Financials 2 0 - 260 0.95 - N # RTL iShares FTSE NAREIT Retail Capped Index 21 0 0.79 - 0.48 0.11 NKRS ProShares Short KBW Regional Banking 2 0 - 50 0.95 0.59 N # WREI Wilshire US REIT ETF 21 0 0.68 - 0.32 0.45 NHealth Care # REK ProShares Short Real Estate 19 0 - 93 0.95 0.91 NXLV Health Care Select Sector SPDR Fund 6,783 316 0.02 53 0.18 0.03 H # FNIO iShares FTSE NAREIT Indus/Office Capped 13 0 0.20 - 0.48 0.15 NIBB iShares Nasdaq Biotechnology Index Fund 3,157 85 0.07 119 0.48 0.03 M # DRV Direxion Daily Real Estate Bear 3x Shares 13 1 0.29 119 0.95 2.33 LVHT Vanguard Health Care ETF 1,584 12 0.09 - 0.14 0.04 L # TechnologyIYH iShares Dow Jones US Healthcare Sector 982 9 0.06 113 0.47 0.06 L # XLK Technology Select Sector SPDR Fund 10,255 271 0.03 78 0.18 0.05 HFXH First Trust Health Care AlphaDEX Fund 839 7 0.08 - 0.70 0.10 N # VGT Vanguard Information Technology ETF 2,962 16 0.07 - 0.14 0.06 LXBI SPDR S&P Biotech ETF 832 22 0.10 - 0.35 0.04 L # IYW iShares Dow Jones US Technology Sector 1,922 17 0.05 - 0.47 0.17 LPJP Pow ershares Dynamic Pharmaceuticals 475 4 0.11 - 0.63 2.04 N # FDN First Trust Dow Jones Internet Index Fund 972 9 0.10 40 0.60 0.09 LIHE iShares Dow Jones US Pharmaceuticals 445 4 0.09 - 0.47 0.11 N # IGV iShares S&P NA Technology-Softw are 710 4 0.40 60 0.48 0.04 LXPH SPDR S&P Pharmaceuticals ETF 398 3 0.19 - 0.35 0.04 N # IGM iShares S&P North American Technology 527 3 0.14 268 0.48 0.05 NIHI iShares Dow Jones US Medical Devices 349 5 0.31 - 0.47 0.05 N # SMH Market Vectors Semiconductor ETF 263 65 0.04 25 0.35 0.13 LFBT First Trust NYSE Arca Biotechnology 333 3 0.19 20 0.60 0.04 L # FXL First Trust Technology AlphaDEX Fund 243 2 0.35 - 0.70 0.12 NBBH Market Vectors Biotech ETF 300 5 1.93 25 0.35 0.05 L # IGN iShares S&P NA Tech-Multimedia Netw orking 206 3 0.30 27 0.48 0.91 LIHF iShares Dow Jones US Healthcare Providers 284 2 0.08 - 0.47 0.05 L # SOXX iShares PHLX SOX Semiconductor 194 13 0.12 30 0.48 0.09 LPPH Market Vectors Pharmaceutical ETF 238 3 0.23 25 0.35 0.11 L # MTK SPDR Morgan Stanley Technology ETF 181 0 0.74 35 0.50 0.11 NPBE Pow ershares Dynamic Biotech. & Genome 157 0 0.28 - 0.63 1.55 N # TECL Direxion Daily Technology Bull 3X Shares 124 11 0.15 78 0.95 4.71 LRYH Guggenheim SPX Equal Weight Healthcare 121 2 0.14 - 0.50 0.12 N # PSCT Pow erShares S&P SmallCap Technology 120 1 - - 0.29 0.01 NPSCH Pow erShares S&P SmallCap Health Care 103 1 0.73 - 0.29 0.03 N # QTEC First Trust NASDAQ-100 Technology Index 116 1 0.25 44 0.60 0.18 LBIB ProShares Ultra Nasdaq Biotechnology 93 3 1.41 119 0.95 - N # ROM ProShares Ultra Technology 113 2 0.33 136 0.95 0.76 LRXL ProShares Ultra Health Care 72 1 1.22 113 0.95 0.64 N # RYT Guggenheim SPX Equal Weight Technology 99 1 0.23 - 0.50 0.16 NPTH Pow erShares Dynamic Healthcare Sector 62 0 0.38 - 0.65 0.05 N # PNQI Pow erShares NASDAQ Internet Portfolio 67 1 0.54 - 0.60 0.06 NXHS SPDR S&P Health Care Services ETF 31 1 0.16 - 0.35 0.09 N # SOXL Direxion Daily Semiconductors Bull 3x Shares 59 15 0.16 30 0.95 3.13 LXHE SPDR S&P Health Care Equipment ETF 19 0 - - 0.35 0.10 N # XSD SPDR S&P Semiconductor ETF 57 4 0.12 - 0.35 0.04 LBIS ProShares UltraShort Nasdaq Biotech. 5 0 - 119 0.95 1.97 N # SOXS Direxion Daily Semicond. Bear 3x Shares 52 4 0.20 30 0.95 5.10 LRXD ProShares UltraShort Health Care 3 0 - 113 0.95 0.92 N # PSJ Pow ershares Dynamic Softw are Portfolio 48 0 0.70 - 0.63 0.79 NIndustrials # USD ProShares Ultra Semiconductors 34 1 0.41 38 0.95 1.56 LXLI Industrial Select Sector SPDR Fund 4,944 429 0.02 60 0.18 0.08 H # PTF Pow erShares Dynamic Technology Sector 33 0 0.51 - 0.65 0.29 NIYJ iShares Dow Jones US Industrial Sector 947 21 0.07 - 0.47 0.06 L # PXQ Pow ershares Dynamic Netw orking Portfolio 31 0 0.40 - 0.63 1.17 NVIS Vanguard Industrials ETF 752 7 0.39 - 0.14 0.07 L # TECS Direxion Daily Technology Bear 3X Shares 20 2 0.17 78 0.95 4.13 LIYT iShares Dow Jones Transportation Average 561 66 0.05 20 0.47 1.05 M # PSI Pow ershares Dynamic Semicond. 17 0 0.62 - 0.63 0.76 NFXR First Trust Industrials/Producer Durables 158 4 0.28 - 0.70 0.19 N # LSKY ETRACS Monthly 2X ISE Cloud Computing 15 0 1.56 - 0.60 - NPKB Pow erShares Dynamic Building & Construction 108 1 0.21 - 0.63 2.88 N # XSW SPDR S&P Softw are & Services ETF 14 0 0.45 - 0.35 0.08 NITA iShares Dow Jones US Aerospace & Defense 86 1 0.39 - 0.47 0.05 N # FONE First Trust NASDAQ CEA Smartphone 13 0 0.70 - 0.70 2.36 NPPA Pow erShares Aerospace & Defense Portfolio 49 0 0.23 - 0.66 0.32 N # SSDD ETRACS ISE Solid State Drive Index ETN 11 0 1.43 - 0.65 - NXTN SPDR S&P Transportation ETF 47 1 0.63 - 0.35 0.15 N # SSG ProShares UltraShort Semiconductors 9 0 1.41 38 0.95 2.66 LPSCI Pow erShares S&P SmallCap Industrials 41 0 1.32 - 0.29 0.05 N # REW ProShares UltraShort Technology 8 0 1.04 136 0.95 1.52 LPRN Pow erShares Dynamic Industrials Sector 40 0 0.42 - 0.65 1.71 N # SSDL ETRACS Monthly 2X ISE Solid State Drive 8 0 2.44 - 0.65 - NRGI Guggenheim S&P 500 Equal Wgt Industrials 34 0 0.19 - 0.50 0.26 N # EIPO ETRACS Next Generation Internet ETN 7 0 - - 0.65 - NUXI ProShares Ultra Industrials 21 0 0.81 223 0.95 0.66 L # EIPL ETRACS Monthly 2X Next Gen Internet 4 0 2.09 - 0.65 - NEVX Market Vectors Environmental Services ETF 17 0 0.45 - 0.55 0.59 N # TelecomXAR SPDR S&P Aerospace & Defense ETF 15 0 0.32 33 0.35 0.28 N # VOX Vanguard Telecom. Services ETF 642 6 0.35 - 0.14 0.13 LSIJ ProShares UltraShort Industrials 5 0 2.24 223 0.95 1.24 L # IYZ iShares DJ US Telecommunications Sector 546 11 0.07 - 0.47 0.24 LMaterials # LTL ProShares Ultra Telecommunications 5 0 - - 0.95 1.49 NXLB Materials Select Sector SPDR Fund 2,903 326 0.03 30 0.18 0.27 H # XTL SPDR S&P Teleccom ETF 5 0 - - 0.35 0.22 NVAW Vanguard Materials ETF 767 7 0.07 - 0.14 0.08 L # TLL ProShares UltraShort Telecommunications 1 0 - - 0.95 2.04 NXME SPDR S&P Metals & Mining ETF 683 126 0.04 38 0.35 0.10 H # UtilitiesIYM iShares Dow Jones US Basic Materials Sector 513 12 0.06 - 0.47 0.10 L # XLU Utilities Select Sector SPDR Fund 6,065 334 0.03 31 0.18 0.07 HNUGT Direxion Daily Gold Miners Bull 3x Shares 311 37 0.13 29 0.95 - L # VPU Vanguard Utilities ETF 1,599 9 0.05 - 0.14 0.08 LFXZ First Trust Materials AlphaDEX Fund 205 5 0.14 - 0.70 0.25 L # IDU iShares Dow Jones US Utilities Sector 1,089 13 0.06 - 0.47 0.07 LUYM ProShares Ultra Basic Materials 135 8 0.10 62 0.95 0.95 L # PHO Pow erShares Water Resources Portfolio 899 3 0.11 28 0.62 0.08 LPYZ Pow erShares Dynamic Basic Materials Sector 80 1 0.22 - 0.65 0.17 N # FXU First Trust Utilities AlphaDEX Fund 202 3 0.16 - 0.70 0.51 NDUST Direxion Daily Gold Miners Bear 3x Shares 75 60 0.19 29 0.95 - M # FIW First Trust ISE Water Index Fund 119 1 0.34 36 0.60 0.09 LSMN ProShares UltraShort Basic Materials 38 4 0.11 62 0.95 1.90 L # RYU Guggenheim S&P 500 Equal Weight Utilities 62 1 0.16 - 0.50 0.05 NRTM Guggenheim S&P 500 Equal Weight Materials 35 0 0.55 - 0.50 0.25 N # PUI Pow erShares Dynamic Utilities Portfolio 42 0 0.68 - 0.63 0.81 NPSCM Pow erShares S&P SmallCap Materials 7 0 - - 0.31 0.05 N # PSCU Pow erShares S&P SmallCap Utilities 35 0 - - 0.29 0.02 NSBM ProShares Short Basic Materials 6 0 - 62 0.95 0.65 N # UPW ProShares Ultra Utilities 22 0 - 63 0.95 1.66 NReal Estate # SDP ProShares UltraShort Utilities 2 0 - 63 0.95 1.31 NVNQ Vanguard REIT ETF 20,367 196 0.02 119 0.10 0.18 L #
IYR iShares Dow Jones US Real Estate Index 5,621 662 0.02 93 0.47 0.19 H #
ICF iShares Cohen & Steers Realty Majors Index 3,231 32 0.05 30 0.35 0.06 L #
RWR SPDR Dow Jones REIT ETF 2,307 20 0.05 83 0.25 0.06 L # CVY Guggenheim Multi-Asset Income ETF 1,064 5 0.14 - 0.65 0.76 LREM iShares FTSE NAREIT Mortgage Plus Cap. 1,260 14 0.08 - 0.48 0.31 L # PCEF Pow erShares CEF Income Composite 500 4 1.29 - 1.56 0.07 LSCHH Schw ab U.S. REIT ETF 620 5 0.19 83 0.07 0.05 L # MDIV First Trust US Multi-Asset Div. Income 391 5 0.18 - 0.60 - N
Sector Funds Sector Funds
Asset Allocation Funds
1 Option Liquidity (H / M / L / N - High / Medium / Low / None)2 / - Significant increase / decrease in shares outstanding in last one year
US Listed ETFs
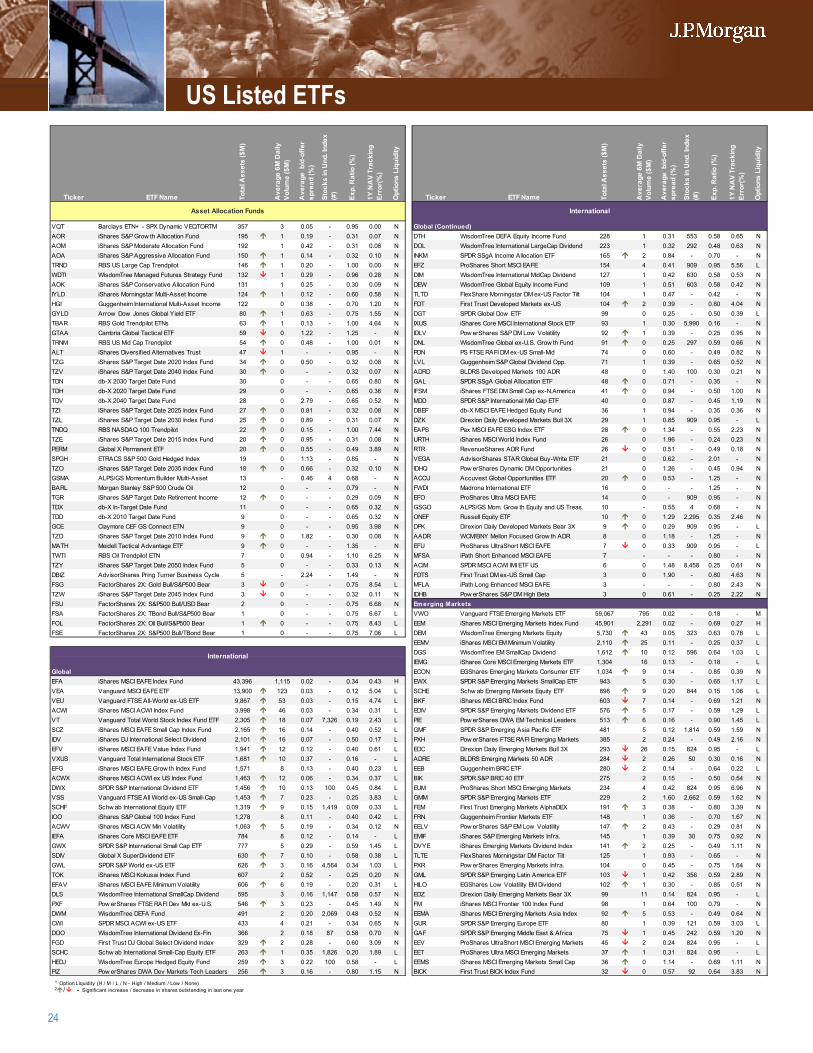
24
Ticker ETF Name Tota
l Ass
ets
($M
)
Ave
rage
6M
Dai
ly
Volu
me
($M
)
Ave
rage
bid
-offe
r sp
read
(%)
Stoc
ks in
Und
. Ind
ex
(#)
Exp.
Rat
io (%
)
1Y N
AV
Trac
king
Er
ror(
%)
Opt
ions
Liq
uidi
ty
Ticker ETF Name Tota
l Ass
ets
($M
)
Ave
rage
6M
Dai
ly
Volu
me
($M
)
Ave
rage
bid
-offe
r sp
read
(%)
Stoc
ks in
Und
. Ind
ex
(#)
Exp.
Rat
io (%
)
1Y N
AV
Trac
king
Er
ror(
%)
Opt
ions
Liq
uidi
ty
1
2
VQT Barclays ETN+ - SPX Dynamic VEQTORTM 357 3 0.05 - 0.95 0.00 N 3 Global (Continued)AOR iShares S&P Grow th Allocation Fund 195 1 0.19 - 0.31 0.07 N 4 DTH WisdomTree DEFA Equity Income Fund 228 1 0.31 553 0.58 0.65 NAOM iShares S&P Moderate Allocation Fund 192 1 0.42 - 0.31 0.08 N 5 DOL WisdomTree International LargeCap Dividend 223 1 0.32 292 0.48 0.63 NAOA iShares S&P Aggressive Allocation Fund 150 1 0.14 - 0.32 0.10 N 6 INKM SPDR SSgA Income Allocation ETF 165 2 0.84 - 0.70 - NTRND RBS US Large Cap Trendpilot 146 1 0.20 - 1.00 0.00 N 7 EFZ ProShares Short MSCI EAFE 154 4 0.41 909 0.95 5.56 LWDTI WisdomTree Managed Futures Strategy Fund 132 1 0.29 - 0.96 0.28 N 8 DIM WisdomTree International MidCap Dividend 127 1 0.42 630 0.58 0.53 NAOK iShares S&P Conservative Allocation Fund 131 1 0.25 - 0.30 0.09 N 9 DEW WisdomTree Global Equity Income Fund 109 1 0.51 603 0.58 0.42 NIYLD iShares Morningstar Multi-Asset Income 124 1 0.12 - 0.60 0.58 N # TLTD FlexShare Morningstar DM ex-US Factor Tilt 104 1 0.47 - 0.42 - NHGI Guggenheim International Multi-Asset Income 122 0 0.38 - 0.70 1.20 N 11 FDT First Trust Developed Markets ex-US 104 2 0.39 - 0.80 4.04 NGYLD Arrow Dow Jones Global Yield ETF 80 1 0.63 - 0.75 1.55 N # DGT SPDR Global Dow ETF 99 0 0.25 - 0.50 0.39 LTBAR RBS Gold Trendpilot ETNs 63 1 0.13 - 1.00 4.64 N # IXUS iShares Core MSCI International Stock ETF 93 1 0.30 5,990 0.16 - NGTAA Cambria Global Tactical ETF 59 0 1.22 - 1.25 - N # IDLV Pow erShares S&P DM Low Volatility 92 1 0.39 - 0.25 0.95 NTRNM RBS US Mid Cap Trendpilot 54 0 0.48 - 1.00 0.01 N # DNL WisdomTree Global ex-U.S. Grow th Fund 91 0 0.25 297 0.59 0.66 NALT iShares Diversif ied Alternatives Trust 47 1 - - 0.95 - N # PDN PS FTSE RAFI DM ex-US Small-Mid 74 0 0.60 - 0.49 0.82 NTZG iShares S&P Target Date 2020 Index Fund 34 0 0.50 - 0.32 0.08 N # LVL Guggenheim S&P Global Dividend Opp. 71 1 0.39 - 0.65 0.52 NTZV iShares S&P Target Date 2040 Index Fund 30 0 - - 0.32 0.07 N # ADRD BLDRS Developed Markets 100 ADR 48 0 1.40 100 0.30 0.21 NTDN db-X 2030 Target Date Fund 30 0 - - 0.65 0.80 N # GAL SPDR SSgA Global Allocation ETF 48 0 0.71 - 0.35 - NTDH db-X 2020 Target Date Fund 29 0 - - 0.65 0.36 N # IFSM iShares FTSE DM Small Cap ex-N.America 41 0 0.94 - 0.50 1.00 NTDV db-X 2040 Target Date Fund 28 0 2.79 - 0.65 0.52 N # MDD SPDR S&P International Mid Cap ETF 40 0 0.87 - 0.45 1.19 NTZI iShares S&P Target Date 2025 Index Fund 27 0 0.81 - 0.32 0.08 N # DBEF db-X MSCI EAFE Hedged Equity Fund 36 1 0.94 - 0.35 0.36 NTZL iShares S&P Target Date 2030 Index Fund 25 0 0.89 - 0.31 0.07 N # DZK Direxion Daily Developed Markets Bull 3X 29 1 0.85 909 0.95 - LTNDQ RBS NASDAQ 100 Trendpilot 22 0 0.15 - 1.00 7.44 N # EAPS Pax MSCI EAFE ESG Index ETF 28 0 1.34 - 0.55 2.23 NTZE iShares S&P Target Date 2015 Index Fund 20 0 0.95 - 0.31 0.08 N # URTH iShares MSCI World Index Fund 26 0 1.96 - 0.24 0.23 NPERM Global X Permanent ETF 20 0 0.55 - 0.49 3.89 N # RTR RevenueShares ADR Fund 26 0 0.51 - 0.49 0.18 NSPGH ETRACS S&P 500 Gold Hedged Index 19 0 1.13 - 0.85 - N # VEGA AdvisorShares STAR Global Buy-Write ETF 21 0 0.62 - 2.01 - NTZO iShares S&P Target Date 2035 Index Fund 18 0 0.66 - 0.32 0.10 N # IDHQ Pow erShares Dynamic DM Opportunities 21 0 1.26 - 0.45 0.94 NGSMA ALPS/GS Momentum Builder Multi-Asset 13 - 0.46 4 0.68 - N # ACCU Accuvest Global Opportunities ETF 20 0 0.53 - 1.25 - NBARL Morgan Stanley S&P 500 Crude Oil 12 0 - - 0.79 - N # FWDI Madrona International ETF 16 0 - - 1.25 - NTGR iShares S&P Target Date Retirement Income 12 0 - - 0.29 0.09 N # EFO ProShares Ultra MSCI EAFE 14 0 - 909 0.95 - NTDX db-X In-Target Date Fund 11 0 - - 0.65 0.32 N # GSGO ALPS/GS Mom. Grow th Equity and US Treas. 10 - 0.55 4 0.68 - NTDD db-X 2010 Target Date Fund 9 0 - - 0.65 0.32 N # ONEF Russell Equity ETF 10 0 1.29 2,295 0.35 2.46 NGCE Claymore CEF GS Connect ETN 9 0 - - 0.95 3.98 N # DPK Direxion Daily Developed Markets Bear 3X 9 0 0.29 909 0.95 - LTZD iShares S&P Target Date 2010 Index Fund 9 0 1.82 - 0.30 0.08 N # AADR WCM/BNY Mellon Focused Grow th ADR 8 0 1.18 - 1.25 - NMATH Meidell Tactical Advantage ETF 9 0 - - 1.35 - N # EFU ProShares UltraShort MSCI EAFE 7 0 0.33 909 0.95 - LTWTI RBS Oil Trendpilot ETN 7 0 0.94 - 1.10 6.25 N # MFSA iPath Short Enhanced MSCI EAFE 7 - - - 0.80 - NTZY iShares S&P Target Date 2050 Index Fund 5 0 - - 0.33 0.13 N # ACIM SPDR MSCI ACWI IMI ETF US 6 0 1.48 8,458 0.25 0.61 NDBIZ AdvisorShares Pring Turner Business Cycle 5 - 2.24 - 1.49 - N # FDTS First Trust DM ex-US Small Cap 3 0 1.90 - 0.80 4.63 NFSG FactorShares 2X: Gold Bull/S&P500 Bear 3 0 - - 0.75 8.54 L # MFLA iPath Long Enhanced MSCI EAFE 3 - - - 0.80 2.43 NTZW iShares S&P Target Date 2045 Index Fund 3 0 - - 0.32 0.11 N # IDHB Pow erShares S&P DM High Beta 3 0 0.61 - 0.25 2.22 NFSU FactorShares 2X: S&P500 Bull/USD Bear 2 0 - - 0.75 6.68 N # Emerging MarketsFSA FactorShares 2X: TBond Bull/S&P500 Bear 1 0 - - 0.75 6.67 L # VWO Vanguard FTSE Emerging Markets ETF 59,067 795 0.02 - 0.18 - MFOL FactorShares 2X: Oil Bull/S&P500 Bear 1 0 - - 0.75 8.43 L # EEM iShares MSCI Emerging Markets Index Fund 45,901 2,291 0.02 - 0.69 0.27 HFSE FactorShares 2X: S&P500 Bull/TBond Bear 1 0 - - 0.75 7.06 L # DEM WisdomTree Emerging Markets Equity 5,730 43 0.05 323 0.63 0.78 L
# EEMV iShares MSCI EM Minimum Volatility 2,110 25 0.11 - 0.25 0.37 L# DGS WisdomTree EM SmallCap Dividend 1,612 10 0.12 596 0.64 1.03 L# IEMG iShares Core MSCI Emerging Markets ETF 1,304 16 0.13 - 0.18 - L
Global # ECON EGShares Emerging Markets Consumer ETF 1,034 9 0.14 - 0.85 0.39 NEFA iShares MSCI EAFE Index Fund 43,396 1,115 0.02 - 0.34 0.43 H # EWX SPDR S&P Emerging Markets SmallCap ETF 943 5 0.30 - 0.65 1.17 LVEA Vanguard MSCI EAFE ETF 13,900 123 0.03 - 0.12 5.04 L # SCHE Schw ab Emerging Markets Equity ETF 898 9 0.20 844 0.15 1.06 LVEU Vanguard FTSE All-World ex-US ETF 9,867 53 0.03 - 0.15 4.74 L # BKF iShares MSCI BRIC Index Fund 603 7 0.14 - 0.69 1.21 NACWI iShares MSCI ACWI Index Fund 3,998 46 0.03 - 0.34 0.31 L # EDIV SPDR S&P Emerging Markets Dividend ETF 576 5 0.17 - 0.59 1.29 LVT Vanguard Total World Stock Index Fund ETF 2,305 18 0.07 7,326 0.19 2.43 L # PIE Pow erShares DWA EM Technical Leaders 513 6 0.16 - 0.90 1.45 LSCZ iShares MSCI EAFE Small Cap Index Fund 2,165 16 0.14 - 0.40 0.52 L # GMF SPDR S&P Emerging Asia Pacif ic ETF 481 5 0.12 1,814 0.59 1.59 NIDV iShares DJ International Select Dividend 2,101 16 0.07 - 0.50 0.17 L # PXH Pow erShares FTSE RAFI Emerging Markets 385 2 0.24 - 0.49 2.16 NEFV iShares MSCI EAFE Value Index Fund 1,941 12 0.12 - 0.40 0.61 L # EDC Direxion Daily Emerging Markets Bull 3X 293 26 0.15 824 0.95 - LVXUS Vanguard Total International Stock ETF 1,681 10 0.37 - 0.16 - L # ADRE BLDRS Emerging Markets 50 ADR 284 2 0.26 50 0.30 0.16 NEFG iShares MSCI EAFE Grow th Index Fund 1,571 8 0.13 - 0.40 0.23 L # EEB Guggenheim BRIC ETF 280 2 0.14 - 0.64 0.22 LACWX iShares MSCI ACWI ex US Index Fund 1,463 12 0.06 - 0.34 0.37 L # BIK SPDR S&P BRIC 40 ETF 275 2 0.15 - 0.50 0.54 NDWX SPDR S&P International Dividend ETF 1,456 10 0.13 100 0.45 0.84 L # EUM ProShares Short MSCI Emerging Markets 234 4 0.42 824 0.95 6.96 NVSS Vanguard FTSE All World ex-US Small-Cap 1,453 7 0.23 - 0.25 3.83 L # GMM SPDR S&P Emerging Markets ETF 229 2 1.60 2,662 0.59 1.62 NSCHF Schw ab International Equity ETF 1,319 9 0.15 1,419 0.09 0.33 L # FEM First Trust Emerging Markets AlphaDEX 191 3 0.38 - 0.80 3.39 NIOO iShares S&P Global 100 Index Fund 1,278 8 0.11 - 0.40 0.42 L # FRN Guggenheim Frontier Markets ETF 148 1 0.36 - 0.70 1.67 NACWV iShares MSCI ACW Min Volatility 1,063 5 0.19 - 0.34 0.12 N # EELV Pow erShares S&P EM Low Volatility 147 2 0.43 - 0.29 0.81 NIEFA iShares Core MSCI EAFE ETF 784 8 0.12 - 0.14 - L # EMIF iShares S&P Emerging Markets Infra. 145 1 0.39 30 0.75 0.92 NGWX SPDR S&P International Small Cap ETF 777 5 0.29 - 0.59 1.45 L # DVYE iShares Emerging Markets Dividend Index 141 2 0.25 - 0.49 1.11 NSDIV Global X SuperDividend ETF 630 7 0.10 - 0.58 0.38 L # TLTE FlexShares Morningstar DM Factor Tilt 125 1 0.93 - 0.65 - NGWL SPDR S&P World ex-US ETF 626 3 0.16 4,564 0.34 1.03 L # PXR Pow erShares Emerging Markets Infra. 104 0 0.45 - 0.75 1.64 NTOK iShares MSCI Kokusai Index Fund 607 2 0.52 - 0.25 0.20 N # GML SPDR S&P Emerging Latin America ETF 103 1 0.42 356 0.59 2.89 NEFAV iShares MSCI EAFE Minimum Volatility 606 6 0.19 - 0.20 0.31 L # HILO EGShares Low Volatility EM Dividend 102 1 0.30 - 0.85 0.51 NDLS WisdomTree International SmallCap Dividend 595 3 0.16 1,147 0.58 0.57 N # EDZ Direxion Daily Emerging Markets Bear 3X 99 11 0.14 824 0.95 - LPXF Pow erShares FTSE RAFI Dev Mkt ex-U.S. 546 3 0.23 - 0.45 1.49 N # FM iShares MSCI Frontier 100 Index Fund 98 1 0.64 100 0.79 - NDWM WisdomTree DEFA Fund 491 2 0.20 2,069 0.48 0.52 N # EEMA iShares MSCI Emerging Markets Asia Index 92 5 0.53 - 0.49 0.64 NCWI SPDR MSCI ACWI ex-US ETF 433 4 0.21 - 0.34 0.65 N # GUR SPDR S&P Emerging Europe ETF 80 1 0.39 121 0.59 3.03 LDOO WisdomTree International Dividend Ex-Fin 366 2 0.18 87 0.58 0.70 N # GAF SPDR S&P Emerging Middle East & Africa 75 1 0.45 242 0.59 1.20 NFGD First Trust DJ Global Select Dividend Index 329 2 0.28 - 0.60 3.09 N # EEV ProShares UltraShort MSCI Emerging Markets 45 2 0.24 824 0.95 - LSCHC Schw ab International Small-Cap Equity ETF 263 1 0.35 1,826 0.20 1.89 L # EET ProShares Ultra MSCI Emerging Markets 37 1 0.31 824 0.95 - LHEDJ WisdomTree Europe Hedged Equity Fund 259 3 0.22 100 0.58 - L # EEMS iShares MSCI Emerging Markets Small Cap 36 0 1.14 - 0.69 1.11 NPIZ Pow erShares DWA Dev Markets Tech Leaders 256 3 0.16 - 0.80 1.15 N # BICK First Trust BICK Index Fund 32 0 0.57 92 0.64 3.83 N
Asset Allocation Funds International
International
1 Option Liquidity (H / M / L / N - High / Medium / Low / None)2 / - Significant increase / decrease in shares outstanding in last one year
US Listed ETFs
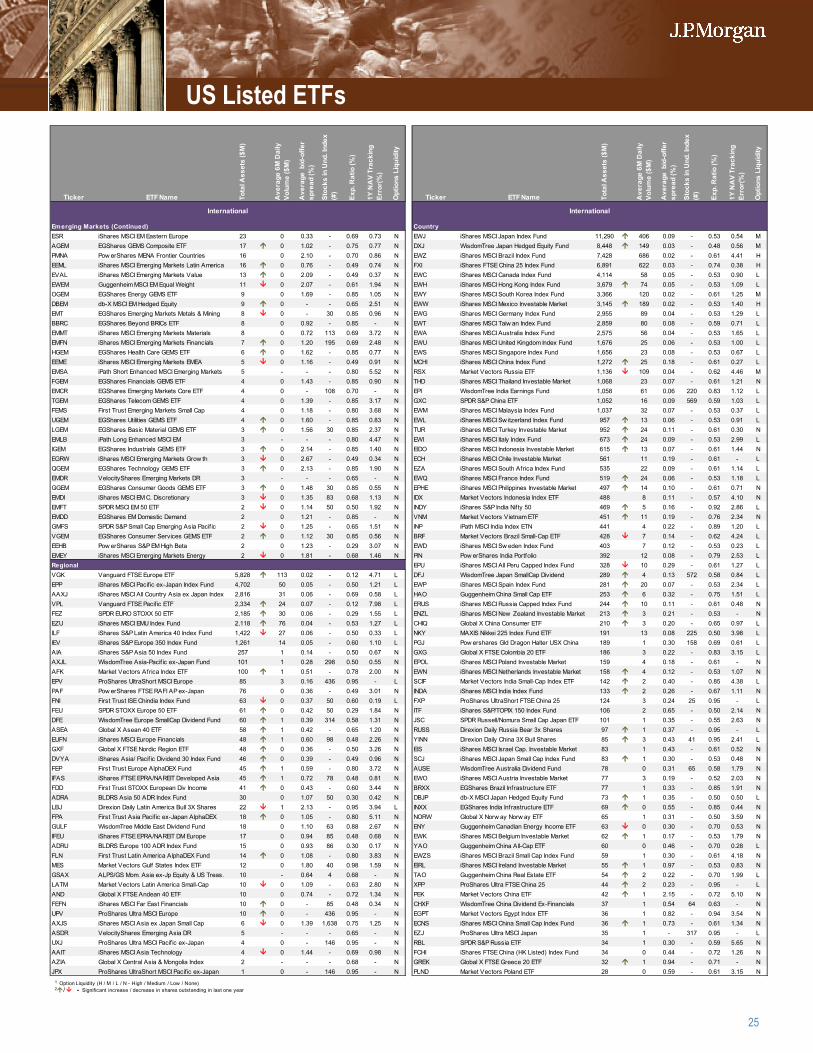
25
Ticker ETF Name Tota
l Ass
ets
($M
)
Ave
rage
6M
Dai
ly
Volu
me
($M
)
Ave
rage
bid
-offe
r sp
read
(%)
Stoc
ks in
Und
. Ind
ex
(#)
Exp.
Rat
io (%
)
1Y N
AV
Trac
king
Er
ror(
%)
Opt
ions
Liq
uidi
ty
Ticker ETF Name Tota
l Ass
ets
($M
)
Ave
rage
6M
Dai
ly
Volu
me
($M
)
Ave
rage
bid
-offe
r sp
read
(%)
Stoc
ks in
Und
. Ind
ex
(#)
Exp.
Rat
io (%
)
1Y N
AV
Trac
king
Er
ror(
%)
Opt
ions
Liq
uidi
ty
1
2
Emerging Markets (Continued) 3 CountryESR iShares MSCI EM Eastern Europe 23 0 0.33 - 0.69 0.73 N 4 EWJ iShares MSCI Japan Index Fund 11,290 406 0.09 - 0.53 0.54 MAGEM EGShares GEMS Composite ETF 17 0 1.02 - 0.75 0.77 N 5 DXJ WisdomTree Japan Hedged Equity Fund 8,448 149 0.03 - 0.48 0.56 MPMNA Pow erShares MENA Frontier Countries 16 0 2.10 - 0.70 0.86 N 6 EWZ iShares MSCI Brazil Index Fund 7,428 686 0.02 - 0.61 4.41 HEEML iShares MSCI Emerging Markets Latin America 16 0 0.76 - 0.49 0.74 N 7 FXI iShares FTSE China 25 Index Fund 6,891 622 0.03 - 0.74 0.38 HEVAL iShares MSCI Emerging Markets Value 13 0 2.09 - 0.49 0.37 N 8 EWC iShares MSCI Canada Index Fund 4,114 58 0.05 - 0.53 0.90 LEWEM Guggenheim MSCI EM Equal Weight 11 0 2.07 - 0.61 1.94 N 9 EWH iShares MSCI Hong Kong Index Fund 3,679 74 0.05 - 0.53 1.09 LOGEM EGShares Energy GEMS ETF 9 0 1.69 - 0.85 1.05 N # EWY iShares MSCI South Korea Index Fund 3,366 120 0.02 - 0.61 1.25 MDBEM db-X MSCI EM Hedged Equity 9 0 - - 0.65 2.51 N 11 EWW iShares MSCI Mexico Investable Market 3,145 189 0.02 - 0.53 1.40 HEMT EGShares Emerging Markets Metals & Mining 8 0 - 30 0.85 0.96 N # EWG iShares MSCI Germany Index Fund 2,955 89 0.04 - 0.53 1.29 LBBRC EGShares Beyond BRICs ETF 8 0 0.92 - 0.85 - N # EWT iShares MSCI Taiw an Index Fund 2,859 80 0.08 - 0.59 0.71 LEMMT iShares MSCI Emerging Markets Materials 8 0 0.72 113 0.69 3.72 N # EWA iShares MSCI Australia Index Fund 2,575 56 0.04 - 0.53 1.65 LEMFN iShares MSCI Emerging Markets Financials 7 0 1.20 195 0.69 2.48 N # EWU iShares MSCI United Kingdom Index Fund 1,676 25 0.06 - 0.53 1.00 LHGEM EGShares Health Care GEMS ETF 6 0 1.62 - 0.85 0.77 N # EWS iShares MSCI Singapore Index Fund 1,656 23 0.08 - 0.53 0.67 LEEME iShares MSCI Emerging Markets EMEA 5 0 1.16 - 0.49 0.91 N # MCHI iShares MSCI China Index Fund 1,272 25 0.18 - 0.61 0.27 LEMSA iPath Short Enhanced MSCI Emerging Markets 5 - - - 0.80 5.52 N # RSX Market Vectors Russia ETF 1,136 109 0.04 - 0.62 4.46 MFGEM EGShares Financials GEMS ETF 4 0 1.43 - 0.85 0.90 N # THD iShares MSCI Thailand Investable Market 1,068 23 0.07 - 0.61 1.21 NEMCR EGShares Emerging Markets Core ETF 4 0 - 108 0.70 - N # EPI WisdomTree India Earnings Fund 1,058 61 0.06 220 0.83 1.12 LTGEM EGShares Telecom GEMS ETF 4 0 1.39 - 0.85 3.17 N # GXC SPDR S&P China ETF 1,052 16 0.09 569 0.59 1.03 LFEMS First Trust Emerging Markets Small Cap 4 0 1.18 - 0.80 3.68 N # EWM iShares MSCI Malaysia Index Fund 1,037 32 0.07 - 0.53 0.37 LUGEM EGShares Utilities GEMS ETF 4 0 1.60 - 0.85 0.83 N # EWL iShares MSCI Sw itzerland Index Fund 957 13 0.06 - 0.53 0.91 LLGEM EGShares Basic Material GEMS ETF 3 0 1.56 30 0.85 2.37 N # TUR iShares MSCI Turkey Investable Market 952 24 0.11 - 0.61 0.30 NEMLB iPath Long Enhanced MSCI EM 3 - - - 0.80 4.47 N # EWI iShares MSCI Italy Index Fund 673 24 0.09 - 0.53 2.99 LIGEM EGShares Industrials GEMS ETF 3 0 2.14 - 0.85 1.40 N # EIDO iShares MSCI Indonesia Investable Market 615 13 0.07 - 0.61 1.44 NEGRW iShares MSCI Emerging Markets Grow th 3 0 2.67 - 0.49 0.34 N # ECH iShares MSCI Chile Investable Market 561 11 0.19 - 0.61 - LQGEM EGShares Technology GEMS ETF 3 0 2.13 - 0.85 1.90 N # EZA iShares MSCI South Africa Index Fund 535 22 0.09 - 0.61 1.14 LEMDR VelocityShares Emerging Markets DR 3 - - - 0.65 - N # EWQ iShares MSCI France Index Fund 519 24 0.06 - 0.53 1.18 LGGEM EGShares Consumer Goods GEMS ETF 3 0 1.48 30 0.85 0.55 N # EPHE iShares MSCI Philippines Investable Market 497 14 0.10 - 0.61 0.71 NEMDI iShares MSCI EM C. Discretionary 3 0 1.35 83 0.68 1.13 N # IDX Market Vectors Indonesia Index ETF 488 8 0.11 - 0.57 4.10 NEMFT SPDR MSCI EM 50 ETF 2 0 1.14 50 0.50 1.92 N # INDY iShares S&P India Nifty 50 469 5 0.16 - 0.92 2.86 LEMDD EGShares EM Domestic Demand 2 0 1.21 - 0.85 - N # VNM Market Vectors Vietnam ETF 451 11 0.19 - 0.76 2.34 NGMFS SPDR S&P Small Cap Emerging Asia Pacif ic 2 0 1.25 - 0.65 1.51 N # INP iPath MSCI India Index ETN 441 4 0.22 - 0.89 1.20 LVGEM EGShares Consumer Services GEMS ETF 2 0 1.12 30 0.85 0.56 N # BRF Market Vectors Brazil Small-Cap ETF 428 7 0.14 - 0.62 4.24 LEEHB Pow erShares S&P EM High Beta 2 0 1.23 - 0.29 3.07 N # EWD iShares MSCI Sw eden Index Fund 403 7 0.12 - 0.53 0.23 LEMEY iShares MSCI Emerging Markets Energy 2 0 1.81 - 0.68 1.46 N # PIN Pow erShares India Portfolio 392 12 0.08 - 0.79 2.53 LRegional # EPU iShares MSCI All Peru Capped Index Fund 328 10 0.29 - 0.61 1.27 LVGK Vanguard FTSE Europe ETF 5,828 113 0.02 - 0.12 4.71 L # DFJ WisdomTree Japan SmallCap Dividend 289 4 0.13 572 0.58 0.84 LEPP iShares MSCI Pacif ic ex-Japan Index Fund 4,702 50 0.05 - 0.50 1.21 L # EWP iShares MSCI Spain Index Fund 281 20 0.07 - 0.53 2.34 LAAXJ iShares MSCI All Country Asia ex Japan Index 2,816 31 0.06 - 0.69 0.58 L # HAO Guggenheim China Small Cap ETF 253 6 0.32 - 0.75 1.51 LVPL Vanguard FTSE Pacif ic ETF 2,334 24 0.07 - 0.12 7.98 L # ERUS iShares MSCI Russia Capped Index Fund 244 10 0.11 - 0.61 0.48 NFEZ SPDR EURO STOXX 50 ETF 2,185 30 0.06 - 0.29 1.55 L # ENZL iShares MSCI New Zealand Investable Market 213 3 0.21 - 0.53 - NEZU iShares MSCI EMU Index Fund 2,118 76 0.04 - 0.53 1.27 L # CHIQ Global X China Consumer ETF 210 3 0.20 - 0.65 0.97 LILF iShares S&P Latin America 40 Index Fund 1,422 27 0.06 - 0.50 0.33 L # NKY MAXIS Nikkei 225 Index Fund ETF 191 13 0.08 225 0.50 3.98 LIEV iShares S&P Europe 350 Index Fund 1,261 14 0.05 - 0.60 1.10 L # PGJ Pow ershares Gld Dragon Halter USX China 189 1 0.30 158 0.69 0.61 LAIA iShares S&P Asia 50 Index Fund 257 1 0.14 - 0.50 0.67 N # GXG Global X FTSE Colombia 20 ETF 186 3 0.22 - 0.83 3.15 LAXJL WisdomTree Asia-Pacif ic ex-Japan Fund 101 1 0.28 298 0.50 0.55 N # EPOL iShares MSCI Poland Investable Market 159 4 0.18 - 0.61 - NAFK Market Vectors Africa Index ETF 100 1 0.51 - 0.78 2.00 N # EWN iShares MSCI Netherlands Investable Market 158 4 0.12 - 0.53 1.07 NEPV ProShares UltraShort MSCI Europe 85 3 0.16 436 0.95 - L # SCIF Market Vectors India Small-Cap Index ETF 142 2 0.40 - 0.85 4.38 LPAF Pow erShares FTSE RAFI AP ex-Japan 76 0 0.36 - 0.49 3.01 N # INDA iShares MSCI India Index Fund 133 2 0.26 - 0.67 1.11 NFNI First Trust ISE Chindia Index Fund 63 0 0.37 50 0.60 0.19 L # FXP ProShares UltraShort FTSE China 25 124 3 0.24 25 0.95 - LFEU SPDR STOXX Europe 50 ETF 61 0 0.42 50 0.29 1.84 N # ITF iShares S&P/TOPIX 150 Index Fund 106 2 0.65 - 0.50 2.14 NDFE WisdomTree Europe SmallCap Dividend Fund 60 1 0.39 314 0.58 1.31 N # JSC SPDR Russell/Nomura Small Cap Japan ETF 101 1 0.35 - 0.55 2.63 NASEA Global X Asean 40 ETF 58 1 0.42 - 0.65 1.20 N # RUSS Direxion Daily Russia Bear 3x Shares 97 1 0.37 - 0.95 - LEUFN iShares MSCI Europe Financials 48 1 0.60 98 0.48 2.26 N # YINN Direxion Daily China 3X Bull Shares 85 3 0.43 41 0.95 2.41 LGXF Global X FTSE Nordic Region ETF 48 0 0.36 - 0.50 3.26 N # EIS iShares MSCI Israel Cap. Investable Market 83 1 0.43 - 0.61 0.52 NDVYA iShares Asia/ Pacif ic Dividend 30 Index Fund 46 0 0.39 - 0.49 0.96 N # SCJ iShares MSCI Japan Small Cap Index Fund 83 1 0.30 - 0.53 0.48 NFEP First Trust Europe AlphaDEX Fund 45 1 0.59 - 0.80 3.72 N # AUSE WisdomTree Australia Dividend Fund 78 0 0.31 65 0.58 1.79 NIFAS iShares FTSE EPRA/NAREIT Developed Asia 45 1 0.72 78 0.48 0.81 N # EWO iShares MSCI Austria Investable Market 77 3 0.19 - 0.52 2.03 NFDD First Trust STOXX European Div Income 41 0 0.43 - 0.60 3.44 N # BRXX EGShares Brazil Infrastructure ETF 77 1 0.33 - 0.85 1.91 NADRA BLDRS Asia 50 ADR Index Fund 30 0 1.07 50 0.30 0.42 N # DBJP db-X MSCI Japan Hedged Equity Fund 73 1 0.35 - 0.50 0.50 LLBJ Direxion Daily Latin America Bull 3X Shares 22 1 2.13 - 0.95 3.94 L # INXX EGShares India Infrastructure ETF 69 0 0.55 - 0.85 0.44 NFPA First Trust Asia Pacif ic ex-Japan AlphaDEX 18 0 1.05 - 0.80 5.11 N # NORW Global X Norw ay Norw ay ETF 65 1 0.31 - 0.50 3.59 NGULF WisdomTree Middle East Dividend Fund 18 0 1.10 63 0.88 2.67 N # ENY Guggenheim Canadian Energy Income ETF 63 0 0.30 - 0.70 0.53 NIFEU iShares FTSE EPRA/NAREIT DM Europe 17 0 0.94 85 0.48 0.68 N # EWK iShares MSCI Belgium Investable Market 62 1 0.17 - 0.53 1.79 NADRU BLDRS Europe 100 ADR Index Fund 15 0 0.93 86 0.30 0.17 N # YAO Guggenheim China All-Cap ETF 60 0 0.46 - 0.70 0.28 LFLN First Trust Latin America AlphaDEX Fund 14 0 1.08 - 0.80 3.83 N # EWZS iShares MSCI Brazil Small Cap Index Fund 59 1 0.30 - 0.61 4.18 NMES Market Vectors Gulf States Index ETF 12 0 1.80 40 0.98 1.59 N # EIRL iShares MSCI Ireland Investable Market 55 1 0.97 - 0.53 0.83 NGSAX ALPS/GS Mom. Asia ex-Jp Equity & US Treas. 10 - 0.64 4 0.68 - N # TAO Guggenheim China Real Estate ETF 54 2 0.22 - 0.70 1.99 LLATM Market Vectors Latin America Small-Cap 10 0 1.09 - 0.63 2.80 N # XPP ProShares Ultra FTSE China 25 44 2 0.23 - 0.95 - LAND Global X FTSE Andean 40 ETF 10 0 0.74 - 0.72 1.34 N # PEK Market Vectors China ETF 42 1 2.15 - 0.72 5.10 NFEFN iShares MSCI Far East Financials 10 0 - 85 0.48 0.34 N # CHXF WisdomTree China Dividend Ex-Financials 37 1 0.54 64 0.63 - NUPV ProShares Ultra MSCI Europe 10 0 - 436 0.95 - N # EGPT Market Vectors Egypt Index ETF 36 1 0.82 - 0.94 3.54 NAXJS iShares MSCI Asia ex Japan Small Cap 6 0 1.39 1,638 0.75 1.25 N # ECNS iShares MSCI China Small Cap Index Fund 36 1 0.73 - 0.61 1.34 NASDR VelocityShares Emerging Asia DR 5 - - - 0.65 - N # EZJ ProShares Ultra MSCI Japan 35 1 - 317 0.95 - LUXJ ProShares Ultra MSCI Pacif ic ex-Japan 4 0 - 146 0.95 - N # RBL SPDR S&P Russia ETF 34 1 0.30 - 0.59 5.65 NAAIT iShares MSCI Asia Technology 4 0 1.44 - 0.69 0.98 N # FCHI iShares FTSE China (HK Listed) Index Fund 34 0 0.44 - 0.72 1.26 NAZIA Global X Central Asia & Mongolia Index 2 - - - 0.68 - N # GREK Global X FTSE Greece 20 ETF 32 1 0.94 - 0.71 - NJPX ProShares UltraShort MSCI Pacif ic ex-Japan 1 0 - 146 0.95 - N # PLND Market Vectors Poland ETF 28 0 0.59 - 0.61 3.15 N
International International
1 Option Liquidity (H / M / L / N - High / Medium / Low / None)2 / - Significant increase / decrease in shares outstanding in last one year
US Listed ETFs
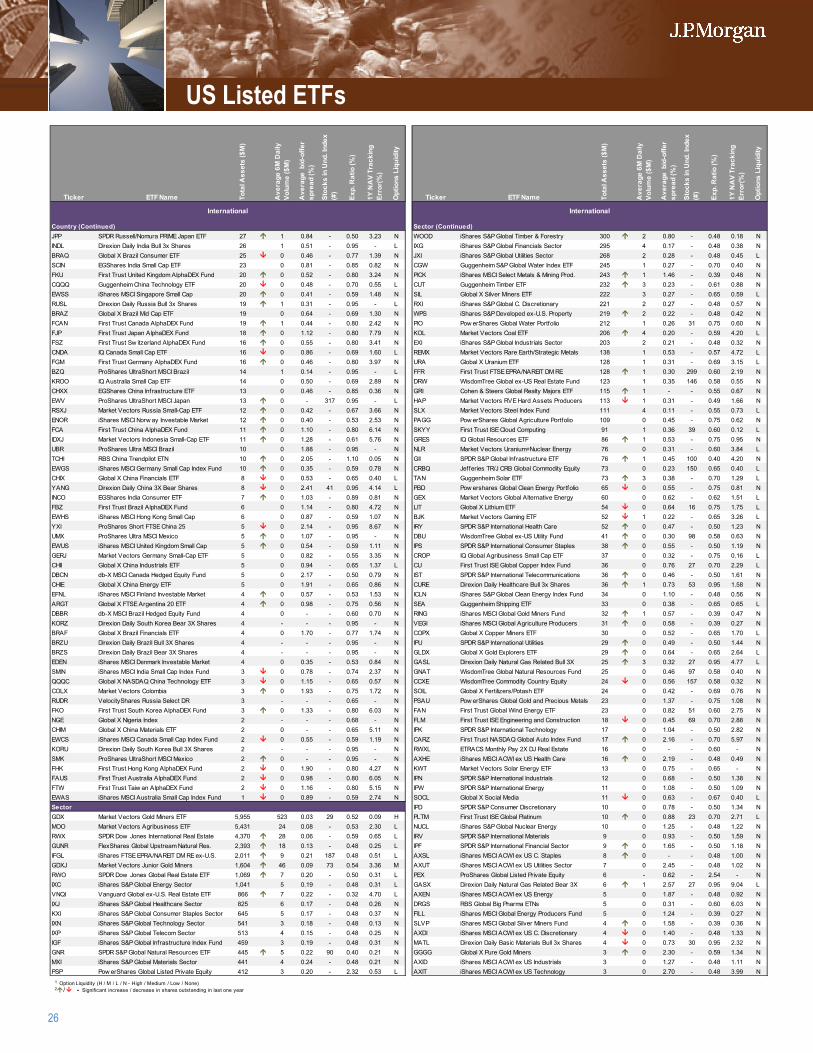
26
Ticker ETF Name Tota
l Ass
ets
($M
)
Ave
rage
6M
Dai
ly
Volu
me
($M
)
Ave
rage
bid
-offe
r sp
read
(%)
Stoc
ks in
Und
. Ind
ex
(#)
Exp.
Rat
io (%
)
1Y N
AV
Trac
king
Er
ror(
%)
Opt
ions
Liq
uidi
ty
Ticker ETF Name Tota
l Ass
ets
($M
)
Ave
rage
6M
Dai
ly
Volu
me
($M
)
Ave
rage
bid
-offe
r sp
read
(%)
Stoc
ks in
Und
. Ind
ex
(#)
Exp.
Rat
io (%
)
1Y N
AV
Trac
king
Er
ror(
%)
Opt
ions
Liq
uidi
ty
1
2
Country (Continued) 3 Sector (Continued)JPP SPDR Russell/Nomura PRIME Japan ETF 27 1 0.84 - 0.50 3.23 N 4 WOOD iShares S&P Global Timber & Forestry 300 2 0.80 - 0.48 0.18 NINDL Direxion Daily India Bull 3x Shares 26 1 0.51 - 0.95 - L 5 IXG iShares S&P Global Financials Sector 295 4 0.17 - 0.48 0.38 NBRAQ Global X Brazil Consumer ETF 25 0 0.46 - 0.77 1.39 N 6 JXI iShares S&P Global Utilities Sector 268 2 0.28 - 0.48 0.45 LSCIN EGShares India Small Cap ETF 23 0 0.81 - 0.85 0.82 N 7 CGW Guggenheim S&P Global Water Index ETF 245 1 0.27 - 0.70 0.40 NFKU First Trust United Kingdom AlphaDEX Fund 20 0 0.52 - 0.80 3.24 N 8 PICK iShares MSCI Select Metals & Mining Prod. 243 1 1.46 - 0.39 0.48 NCQQQ Guggenheim China Technology ETF 20 0 0.48 - 0.70 0.55 L 9 CUT Guggenheim Timber ETF 232 3 0.23 - 0.61 0.88 NEWSS iShares MSCI Singapore Small Cap 20 0 0.41 - 0.59 1.48 N # SIL Global X Silver Miners ETF 222 3 0.27 - 0.65 0.59 LRUSL Direxion Daily Russia Bull 3x Shares 19 1 0.31 - 0.95 - L 11 RXI iShares S&P Global C. Discretionary 221 2 0.27 - 0.48 0.57 NBRAZ Global X Brazil Mid Cap ETF 19 0 0.64 - 0.69 1.30 N # WPS iShares S&P Developed ex-U.S. Property 219 2 0.22 - 0.48 0.42 NFCAN First Trust Canada AlphaDEX Fund 19 1 0.44 - 0.80 2.42 N # PIO Pow erShares Global Water Portfolio 212 1 0.26 31 0.75 0.60 NFJP First Trust Japan AlphaDEX Fund 18 0 1.12 - 0.80 7.79 N # KOL Market Vectors Coal ETF 206 4 0.20 - 0.59 4.20 LFSZ First Trust Sw itzerland AlphaDEX Fund 16 0 0.55 - 0.80 3.41 N # EXI iShares S&P Global Industrials Sector 203 2 0.21 - 0.48 0.32 NCNDA IQ Canada Small Cap ETF 16 0 0.86 - 0.69 1.60 L # REMX Market Vectors Rare Earth/Strategic Metals 138 1 0.53 - 0.57 4.72 LFGM First Trust Germany AlphaDEX Fund 16 0 0.46 - 0.80 3.97 N # URA Global X Uranium ETF 128 1 0.31 - 0.69 3.15 LBZQ ProShares UltraShort MSCI Brazil 14 1 0.14 - 0.95 - L # FFR First Trust FTSE EPRA/NAREIT DM RE 128 1 0.30 299 0.60 2.19 NKROO IQ Australia Small Cap ETF 14 0 0.50 - 0.69 2.89 N # DRW WisdomTree Global ex-US Real Estate Fund 123 1 0.35 146 0.58 0.55 NCHXX EGShares China Infrastructure ETF 13 0 0.46 - 0.85 0.36 N # GRI Cohen & Steers Global Realty Majors ETF 115 1 - - 0.55 0.67 NEWV ProShares UltraShort MSCI Japan 13 0 - 317 0.95 - L # HAP Market Vectors RVE Hard Assets Producers 113 1 0.31 - 0.49 1.66 NRSXJ Market Vectors Russia Small-Cap ETF 12 0 0.42 - 0.67 3.66 N # SLX Market Vectors Steel Index Fund 111 4 0.11 - 0.55 0.73 LENOR iShares MSCI Norw ay Investable Market 12 0 0.40 - 0.53 2.53 N # PAGG Pow erShares Global Agriculture Portfolio 109 0 0.45 - 0.75 0.62 NFCA First Trust China AlphaDEX Fund 11 0 1.10 - 0.80 6.14 N # SKYY First Trust ISE Cloud Computing 91 1 0.36 39 0.60 0.12 LIDXJ Market Vectors Indonesia Small-Cap ETF 11 0 1.28 - 0.61 5.76 N # GRES IQ Global Resources ETF 86 1 0.53 - 0.75 0.95 NUBR ProShares Ultra MSCI Brazil 10 0 1.88 - 0.95 - N # NLR Market Vectors Uranium+Nuclear Energy 76 0 0.31 - 0.60 3.84 LTCHI RBS China Trendpilot ETN 10 0 2.05 - 1.10 0.05 N # GII SPDR S&P Global Infrastructure ETF 76 1 0.45 100 0.40 4.20 NEWGS iShares MSCI Germany Small Cap Index Fund 10 0 0.35 - 0.59 0.78 N # CRBQ Jefferies TR/J CRB Global Commodity Equity 73 0 0.23 150 0.65 0.40 LCHIX Global X China Financials ETF 8 0 0.53 - 0.65 0.40 L # TAN Guggenheim Solar ETF 73 3 0.38 - 0.70 1.29 LYANG Direxion Daily China 3X Bear Shares 8 0 2.41 41 0.95 4.14 L # PBD Pow ershares Global Clean Energy Portfolio 65 0 0.55 - 0.75 0.81 NINCO EGShares India Consumer ETF 7 0 1.03 - 0.89 0.81 N # GEX Market Vectors Global Alternative Energy 60 0 0.62 - 0.62 1.51 LFBZ First Trust Brazil AlphaDEX Fund 6 0 1.14 - 0.80 4.72 N # LIT Global X Lithium ETF 54 0 0.64 16 0.75 1.75 LEWHS iShares MSCI Hong Kong Small Cap 6 0 0.87 - 0.59 1.07 N # BJK Market Vectors Gaming ETF 52 1 0.22 - 0.65 3.26 LYXI ProShares Short FTSE China 25 5 0 2.14 - 0.95 8.67 N # IRY SPDR S&P International Health Care 52 0 0.47 - 0.50 1.23 NUMX ProShares Ultra MSCI Mexico 5 0 1.07 - 0.95 - N # DBU WisdomTree Global ex-US Utility Fund 41 0 0.30 98 0.58 0.63 NEWUS iShares MSCI United Kingdom Small Cap 5 0 0.54 - 0.59 1.11 N # IPS SPDR S&P International Consumer Staples 38 0 0.55 - 0.50 1.19 NGERJ Market Vectors Germany Small-Cap ETF 5 0 0.82 - 0.55 3.35 N # CROP IQ Global Agribusiness Small Cap ETF 37 0 0.32 - 0.75 0.16 LCHII Global X China Industrials ETF 5 0 0.94 - 0.65 1.37 L # CU First Trust ISE Global Copper Index Fund 36 0 0.76 27 0.70 2.29 LDBCN db-X MSCI Canada Hedged Equity Fund 5 0 2.17 - 0.50 0.79 N # IST SPDR S&P International Telecommunications 36 0 0.46 - 0.50 1.61 NCHIE Global X China Energy ETF 5 0 1.91 - 0.65 0.86 N # CURE Direxion Daily Healthcare Bull 3x Shares 36 1 0.73 53 0.95 1.58 NEFNL iShares MSCI Finland Investable Market 4 0 0.57 - 0.53 1.53 N # ICLN iShares S&P Global Clean Energy Index Fund 34 0 1.10 - 0.48 0.56 NARGT Global X FTSE Argentina 20 ETF 4 0 0.98 - 0.75 0.56 N # SEA Guggenheim Shipping ETF 33 0 0.38 - 0.65 0.65 LDBBR db-X MSCI Brazil Hedged Equity Fund 4 0 - - 0.60 0.70 N # RING iShares MSCI Global Gold Miners Fund 32 1 0.57 - 0.39 0.47 NKORZ Direxion Daily South Korea Bear 3X Shares 4 - - - 0.95 - N # VEGI iShares MSCI Global Agriculture Producers 31 0 0.58 - 0.39 0.27 NBRAF Global X Brazil Financials ETF 4 0 1.70 - 0.77 1.74 N # COPX Global X Copper Miners ETF 30 0 0.52 - 0.65 1.70 LBRZU Direxion Daily Brazil Bull 3X Shares 4 - - - 0.95 - N # IPU SPDR S&P International Utilities 29 0 0.49 - 0.50 1.44 NBRZS Direxion Daily Brazil Bear 3X Shares 4 - - - 0.95 - N # GLDX Global X Gold Explorers ETF 29 0 0.64 - 0.65 2.64 LEDEN iShares MSCI Denmark Investable Market 4 0 0.35 - 0.53 0.84 N # GASL Direxion Daily Natural Gas Related Bull 3X 25 3 0.32 27 0.95 4.77 LSMIN iShares MSCI India Small Cap Index Fund 3 0 0.78 - 0.74 2.37 N # GNAT WisdomTree Global Natural Resources Fund 25 0 0.46 97 0.58 0.40 NQQQC Global X NASDAQ China Technology ETF 3 0 1.15 - 0.65 0.57 N # CCXE WisdomTree Commodity Country Equity 24 0 0.56 157 0.58 0.32 NCOLX Market Vectors Colombia 3 0 1.93 - 0.75 1.72 N # SOIL Global X Fertilizers/Potash ETF 24 0 0.42 - 0.69 0.76 NRUDR VelocityShares Russia Select DR 3 - - - 0.65 - N # PSAU Pow erShares Global Gold and Precious Metals 23 0 1.37 - 0.75 1.08 NFKO First Trust South Korea AlphaDEX Fund 3 0 1.33 - 0.80 6.03 N # FAN First Trust Global Wind Energy ETF 23 0 0.82 51 0.60 2.75 NNGE Global X Nigeria Index 2 - - - 0.68 - N # FLM First Trust ISE Engineering and Construction 18 0 0.45 69 0.70 2.88 NCHIM Global X China Materials ETF 2 0 - - 0.65 5.11 N # IPK SPDR S&P International Technology 17 0 1.04 - 0.50 2.82 NEWCS iShares MSCI Canada Small Cap Index Fund 2 0 0.55 - 0.59 1.19 N # CARZ First Trust NASDAQ Global Auto Index Fund 17 0 2.16 - 0.70 5.97 NKORU Direxion Daily South Korea Bull 3X Shares 2 - - - 0.95 - N # RWXL ETRACS Monthly Pay 2X DJ Real Estate 16 0 - - 0.60 - NSMK ProShares UltraShort MSCI Mexico 2 0 - - 0.95 - N # AXHE iShares MSCI ACWI ex US Health Care 16 0 2.19 - 0.48 0.49 NFHK First Trust Hong Kong AlphaDEX Fund 2 0 1.90 - 0.80 4.27 N # KWT Market Vectors Solar Energy ETF 13 0 0.75 - 0.65 - NFAUS First Trust Australia AlphaDEX Fund 2 0 0.98 - 0.80 6.05 N # IPN SPDR S&P International Industrials 12 0 0.68 - 0.50 1.38 NFTW First Trust Taiw an AlphaDEX Fund 2 0 1.16 - 0.80 5.15 N # IPW SPDR S&P International Energy 11 0 1.08 - 0.50 1.09 NEWAS iShares MSCI Australia Small Cap Index Fund 1 0 0.89 - 0.59 2.74 N # SOCL Global X Social Media 11 0 0.63 - 0.67 0.40 LSector # IPD SPDR S&P Consumer Discretionary 10 0 0.78 - 0.50 1.34 NGDX Market Vectors Gold Miners ETF 5,955 523 0.03 29 0.52 0.09 H # PLTM First Trust ISE Global Platinum 10 0 0.88 23 0.70 2.71 LMOO Market Vectors Agribusiness ETF 5,431 24 0.08 - 0.53 2.30 L # NUCL iShares S&P Global Nuclear Energy 10 0 1.25 - 0.48 1.22 NRWX SPDR Dow Jones International Real Estate 4,370 28 0.06 - 0.59 0.65 L # IRV SPDR S&P International Materials 9 0 0.93 - 0.50 1.59 NGUNR FlexShares Global Upstream Natural Res. 2,393 18 0.13 - 0.48 0.25 L # IPF SPDR S&P International Financial Sector 9 0 1.65 - 0.50 1.18 NIFGL iShares FTSE EPRA/NAREIT DM RE ex-U.S. 2,011 9 0.21 187 0.48 0.51 L # AXSL iShares MSCI ACWI ex US C. Staples 8 0 - - 0.48 1.00 NGDXJ Market Vectors Junior Gold Miners 1,604 46 0.09 73 0.54 3.36 M # AXUT iShares MSCI ACWI ex US Utilities Sector 7 0 2.45 - 0.48 1.02 NRWO SPDR Dow Jones Global Real Estate ETF 1,069 7 0.20 - 0.50 0.31 L # PEX ProShares Global Listed Private Equity 6 - 0.62 - 2.54 - NIXC iShares S&P Global Energy Sector 1,041 5 0.19 - 0.48 0.31 L # GASX Direxion Daily Natural Gas Related Bear 3X 6 1 2.57 27 0.95 9.04 LVNQI Vanguard Global ex-U.S. Real Estate ETF 866 7 0.22 - 0.32 4.70 L # AXEN iShares MSCI ACWI ex US Energy 5 0 1.87 - 0.48 0.92 NIXJ iShares S&P Global Healthcare Sector 825 6 0.17 - 0.48 0.26 N # DRGS RBS Global Big Pharma ETNs 5 0 0.31 - 0.60 6.03 NKXI iShares S&P Global Consumer Staples Sector 645 5 0.17 - 0.48 0.37 N # FILL iShares MSCI Global Energy Producers Fund 5 0 1.24 - 0.39 0.27 NIXN iShares S&P Global Technology Sector 541 3 0.18 - 0.48 0.13 N # SLVP iShares MSCI Global Silver Miners Fund 4 0 1.58 - 0.39 0.36 NIXP iShares S&P Global Telecom Sector 513 4 0.15 - 0.48 0.25 N # AXDI iShares MSCI ACWI ex US C. Discretionary 4 0 1.40 - 0.48 1.33 NIGF iShares S&P Global Infrastructure Index Fund 459 3 0.19 - 0.48 0.31 N # MATL Direxion Daily Basic Materials Bull 3x Shares 4 0 0.73 30 0.95 2.32 NGNR SPDR S&P Global Natural Resources ETF 445 5 0.22 90 0.40 0.21 N # GGGG Global X Pure Gold Miners 3 0 2.30 - 0.59 1.34 NMXI iShares S&P Global Materials Sector 441 4 0.24 - 0.48 0.21 N # AXID iShares MSCI ACWI ex US Industrials 3 0 1.27 - 0.48 1.11 NPSP Pow erShares Global Listed Private Equity 412 3 0.20 - 2.32 0.53 L # AXIT iShares MSCI ACWI ex US Technology 3 0 2.70 - 0.48 3.99 N
International International
1 Option Liquidity (H / M / L / N - High / Medium / Low / None)2 / - Significant increase / decrease in shares outstanding in last one year
US Listed ETFs
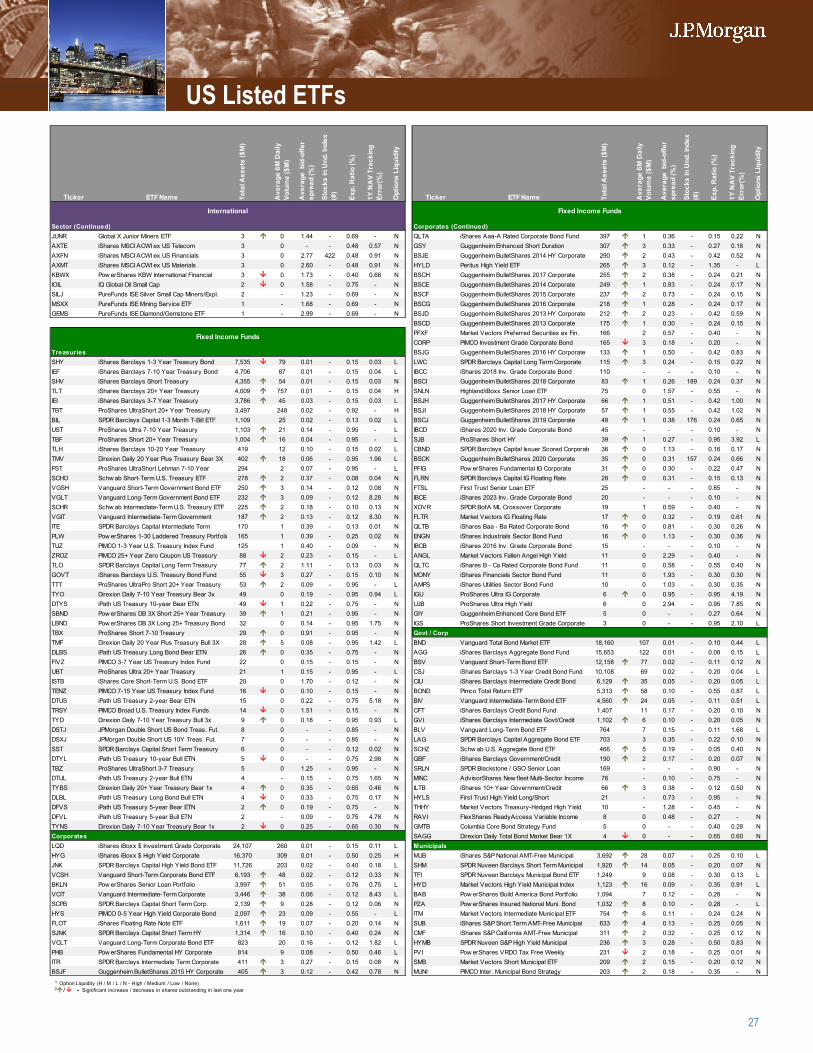
27
Ticker ETF Name Tota
l Ass
ets
($M
)
Ave
rage
6M
Dai
ly
Volu
me
($M
)
Ave
rage
bid
-offe
r sp
read
(%)
Stoc
ks in
Und
. Ind
ex
(#)
Exp.
Rat
io (%
)
1Y N
AV
Trac
king
Er
ror(
%)
Opt
ions
Liq
uidi
ty
Ticker ETF Name Tota
l Ass
ets
($M
)
Ave
rage
6M
Dai
ly
Volu
me
($M
)
Ave
rage
bid
-offe
r sp
read
(%)
Stoc
ks in
Und
. Ind
ex
(#)
Exp.
Rat
io (%
)
1Y N
AV
Trac
king
Er
ror(
%)
Opt
ions
Liq
uidi
ty
1
2
Sector (Continued) 3 Corporates (Continued)JUNR Global X Junior Miners ETF 3 0 1.44 - 0.69 - N 4 QLTA iShares Aaa-A Rated Corporate Bond Fund 397 1 0.36 - 0.15 0.22 NAXTE iShares MSCI ACWI ex US Telecom 3 0 - - 0.48 0.57 N 5 GSY Guggenheim Enhanced Short Duration 307 3 0.33 - 0.27 0.18 NAXFN iShares MSCI ACWI ex US Financials 3 0 2.77 422 0.48 0.91 N 6 BSJE Guggenheim BulletShares 2014 HY Corporate 290 2 0.43 - 0.42 0.52 NAXMT iShares MSCI ACWI ex US Materials 3 0 2.60 - 0.48 0.91 N 7 HYLD Peritus High Yield ETF 265 3 0.12 - 1.35 - LKBWX Pow erShares KBW International Financial 3 0 1.73 - 0.40 0.66 N 8 BSCH Guggenheim BulletShares 2017 Corporate 255 2 0.38 - 0.24 0.21 NIOIL IQ Global Oil Small Cap 2 0 1.58 - 0.75 - N 9 BSCE Guggenheim BulletShares 2014 Corporate 249 1 0.83 - 0.24 0.17 NSILJ PureFunds ISE Silver Small Cap Miners/Expl. 2 - 1.23 - 0.69 - N # BSCF Guggenheim BulletShares 2015 Corporate 237 2 0.73 - 0.24 0.15 NMSXX PureFunds ISE Mining Service ETF 1 - 1.68 - 0.69 - N 11 BSCG Guggenheim BulletShares 2016 Corporate 218 1 0.28 - 0.24 0.17 NGEMS PureFunds ISE Diamond/Gemstone ETF 1 - 2.99 - 0.69 - N # BSJD Guggenheim BulletShares 2013 HY Corporate 212 2 0.23 - 0.42 0.59 N
# BSCD Guggenheim BulletShares 2013 Corporate 175 1 0.30 - 0.24 0.15 N# PFXF Market Vectors Preferred Securities ex Fin. 166 2 0.57 - 0.40 - N# CORP PIMCO Investment Grade Corporate Bond 165 3 0.18 - 0.20 - N
Treasuries # BSJG Guggenheim BulletShares 2016 HY Corporate 133 1 0.50 - 0.42 0.83 NSHY iShares Barclays 1-3 Year Treasury Bond 7,535 79 0.01 - 0.15 0.03 L # LWC SPDR Barclays Capital Long Term Corporate 115 3 0.24 - 0.15 0.22 NIEF iShares Barclays 7-10 Year Treasury Bond 4,706 87 0.01 - 0.15 0.04 L # IBCC iShares 2018 Inv. Grade Corporate Bond 110 - - - 0.10 - NSHV iShares Barclays Short Treasury 4,355 54 0.01 - 0.15 0.03 N # BSCI Guggenheim BulletShares 2018 Corporate 83 1 0.26 189 0.24 0.37 NTLT iShares Barclays 20+ Year Treasury 4,009 757 0.01 - 0.15 0.04 H # SNLN Highland/iBoxx Senior Loan ETF 75 0 1.57 - 0.55 - NIEI iShares Barclays 3-7 Year Treasury 3,786 45 0.03 - 0.15 0.03 L # BSJH Guggenheim BulletShares 2017 HY Corporate 66 1 0.51 - 0.42 1.00 NTBT ProShares UltraShort 20+ Year Treasury 3,497 248 0.02 - 0.92 - H # BSJI Guggenheim BulletShares 2018 HY Corporate 57 1 0.55 - 0.42 1.02 NBIL SPDR Barclays Capital 1-3 Month T-Bill ETF 1,109 25 0.02 - 0.13 0.02 L # BSCJ Guggenheim BulletShares 2019 Corporate 48 1 0.38 176 0.24 0.65 NUST ProShares Ultra 7-10 Year Treasury 1,103 21 0.14 - 0.95 - L # IBCD iShares 2020 Inv. Grade Corporate Bond 45 - - - 0.10 - NTBF ProShares Short 20+ Year Treasury 1,004 16 0.04 - 0.95 - L # SJB ProShares Short HY 39 1 0.27 - 0.95 3.92 LTLH iShares Barclays 10-20 Year Treasury 419 12 0.10 - 0.15 0.02 L # CBND SPDR Barclays Capital Issuer Scored Corporate 36 0 1.13 - 0.16 0.17 NTMV Direxion Daily 20 Year Plus Treasury Bear 3X 402 18 0.06 - 0.95 1.96 L # BSCK Guggenheim BulletShares 2020 Corporate 35 0 0.31 157 0.24 0.66 NPST ProShares UltraShort Lehman 7-10 Year 294 2 0.07 - 0.95 - L # PFIG Pow erShares Fundamental IG Corporate 31 0 0.30 - 0.22 0.47 NSCHO Schw ab Short-Term U.S. Treasury ETF 278 2 0.37 - 0.08 0.04 N # FLRN SPDR Barclays Capital IG Floating Rate 28 0 0.31 - 0.15 0.13 NVGSH Vanguard Short-Term Government Bond ETF 250 3 0.14 - 0.12 0.08 N # FTSL First Trust Senior Loan ETF 25 - - - 0.85 - NVGLT Vanguard Long-Term Government Bond ETF 232 3 0.09 - 0.12 8.28 N # IBCE iShares 2023 Inv. Grade Corporate Bond 20 - - - 0.10 - NSCHR Schw ab Intermediate-Term U.S. Treasury ETF 225 2 0.18 - 0.10 0.13 N # XOVR SPDR BofA ML Crossover Corporate 19 1 0.59 - 0.40 - NVGIT Vanguard Intermediate-Term Government 187 2 0.13 - 0.12 8.30 N # FLTR Market Vectors IG Floating Rate 17 0 0.32 - 0.19 0.61 NITE SPDR Barclays Capital Intermediate Term 170 1 0.39 - 0.13 0.01 N # QLTB iShares Baa - Ba Rated Corporate Bond 16 0 0.81 - 0.30 0.26 NPLW Pow erShares 1-30 Laddered Treasury Portfolio 165 1 0.39 - 0.25 0.02 N # ENGN iShares Industrials Sector Bond Fund 16 0 1.13 - 0.30 0.36 NTUZ PIMCO 1-3 Year U.S. Treasury Index Fund 125 1 0.40 - 0.09 - N # IBCB iShares 2016 Inv. Grade Corporate Bond 15 - - - 0.10 - NZROZ PIMCO 25+ Year Zero Coupon US Treasury 88 2 0.23 - 0.15 - L # ANGL Market Vectors Fallen Angel High Yield 11 0 2.29 - 0.40 - NTLO SPDR Barclays Capital Long Term Treasury 77 2 1.11 - 0.13 0.03 N # QLTC iShares B - Ca Rated Corporate Bond Fund 11 0 0.58 - 0.55 0.40 NGOVT iShares Barclays U.S. Treasury Bond Fund 55 3 0.27 - 0.15 0.10 N # MONY iShares Financials Sector Bond Fund 11 0 1.93 - 0.30 0.30 NTTT ProShares UltraPro Short 20+ Year Treasury 53 2 0.09 - 0.95 - L # AMPS iShares Utilities Sector Bond Fund 10 0 1.03 - 0.30 0.35 NTYO Direxion Daily 7-10 Year Treasury Bear 3x 49 0 0.19 - 0.95 0.94 L # IGU ProShares Ultra IG Corporate 6 0 0.95 - 0.95 4.19 NDTYS iPath US Treasury 10-year Bear ETN 49 1 0.22 - 0.75 - N # UJB ProShares Ultra High Yield 6 0 2.94 - 0.95 7.85 NSBND Pow erShares DB 3X Short 25+ Year Treasury 39 1 0.21 - 0.95 - N # GIY Guggenheim Enhanced Core Bond ETF 5 0 - - 0.27 0.64 NLBND Pow erShares DB 3X Long 25+ Treasury Bond 32 0 0.14 - 0.95 1.75 N # IGS ProShares Short Investment Grade Corporate 3 0 - - 0.95 2.10 LTBX ProShares Short 7-10 Treasury 29 0 0.91 - 0.95 - N # Govt / CorpTMF Direxion Daily 20 Year Plus Treasury Bull 3X 28 5 0.08 - 0.95 1.42 L # BND Vanguard Total Bond Market ETF 18,160 107 0.01 - 0.10 0.44 LDLBS iPath US Treasury Long Bond Bear ETN 26 0 0.35 - 0.75 - N # AGG iShares Barclays Aggregate Bond Fund 15,653 122 0.01 - 0.08 0.15 LFIVZ PIMCO 3-7 Year US Treasury Index Fund 22 0 0.15 - 0.15 - N # BSV Vanguard Short-Term Bond ETF 12,158 77 0.02 - 0.11 0.12 NUBT ProShares Ultra 20+ Year Treasury 21 1 0.15 - 0.95 - L # CSJ iShares Barclays 1-3 Year Credit Bond Fund 10,108 69 0.02 - 0.20 0.04 LISTB iShares Core Short-Term U.S. Bond ETF 20 0 1.70 - 0.12 - N # CIU iShares Barclays Intermediate Credit Bond 6,129 35 0.05 - 0.20 0.05 LTENZ PIMCO 7-15 Year US Treasury Index Fund 16 0 0.10 - 0.15 - N # BOND Pimco Total Return ETF 5,313 58 0.10 - 0.55 0.87 LDTUS iPath US Treasury 2-year Bear ETN 15 0 0.22 - 0.75 5.18 N # BIV Vanguard Intermediate-Term Bond ETF 4,560 24 0.05 - 0.11 0.51 LTRSY PIMCO Broad U.S. Treasury Index Funds 14 0 1.51 - 0.15 - N # CFT iShares Barclays Credit Bond Fund 1,407 11 0.17 - 0.20 0.10 NTYD Direxion Daily 7-10 Year Treasury Bull 3x 9 0 0.18 - 0.95 0.93 L # GVI iShares Barclays Intermediate Govt/Credit 1,102 6 0.10 - 0.20 0.05 NDSTJ JPMorgan Double Short US Bond Treas. Fut. 8 0 - - 0.85 - N # BLV Vanguard Long-Term Bond ETF 764 7 0.15 - 0.11 1.68 LDSXJ JPMorgan Double Short US 10Y Treas. Fut. 7 0 - - 0.85 - N # LAG SPDR Barclays Capital Aggregate Bond ETF 703 3 0.35 - 0.22 0.10 NSST SPDR Barclays Capital Short Term Treasury 6 0 - - 0.12 0.02 N # SCHZ Schw ab U.S. Aggregate Bond ETF 466 5 0.19 - 0.05 0.40 NDTYL iPath US Treasury 10-year Bull ETN 5 0 - - 0.75 2.98 N # GBF iShares Barclays Government/Credit 190 2 0.17 - 0.20 0.07 NTBZ ProShares UltraShort 3-7 Treasury 5 0 1.25 - 0.95 - N # SRLN SPDR Blackstone / GSO Senior Loan 169 - - - 0.90 - NDTUL iPath US Treasury 2-year Bull ETN 4 - 0.15 - 0.75 1.65 N # MINC AdvisorShares New fleet Multi-Sector Income 76 - 0.10 - 0.75 - NTYBS Direxion Daily 20+ Year Treasury Bear 1x 4 0 0.35 - 0.65 0.46 N # ILTB iShares 10+ Year Government/Credit 66 3 0.38 - 0.12 0.50 NDLBL iPath US Treasury Long Bond Bull ETN 4 0 0.33 - 0.75 0.17 N # HYLS First Trust High Yield Long/Short 21 - 0.73 - 0.95 - NDFVS iPath US Treasury 5-year Bear ETN 2 0 0.19 - 0.75 - N # THHY Market Vectors Treasury-Hedged High Yield 10 - 1.28 - 0.45 - NDFVL iPath US Treasury 5-year Bull ETN 2 - 0.09 - 0.75 4.78 N # RAVI FlexShares ReadyAccess Variable Income 8 0 0.48 - 0.27 - NTYNS Direxion Daily 7-10 Year Treasury Bear 1x 2 0 0.25 - 0.65 0.30 N # GMTB Columbia Core Bond Strategy Fund 5 0 - - 0.40 0.28 NCorporates # SAGG Direxion Daily Total Bond Market Bear 1X 4 0 - - 0.65 0.60 NLQD iShares iBoxx $ Investment Grade Corporate 24,107 260 0.01 - 0.15 0.11 L # MunicipalsHYG iShares iBoxx $ High Yield Corporate 16,370 309 0.01 - 0.50 0.25 H # MUB iShares S&P National AMT-Free Municipal 3,692 28 0.07 - 0.25 0.10 LJNK SPDR Barclays Capital High Yield Bond ETF 11,726 203 0.02 - 0.40 0.18 L # SHM SPDR Nuveen Barclays Short Term Municipal 1,920 14 0.05 - 0.20 0.07 NVCSH Vanguard Short-Term Corporate Bond ETF 6,193 48 0.02 - 0.12 0.33 N # TFI SPDR Nuveen Barclays Municipal Bond ETF 1,249 9 0.08 - 0.30 0.13 LBKLN Pow erShares Senior Loan Portfolio 3,997 51 0.05 - 0.76 0.75 L # HYD Market Vectors High Yield Municipal Index 1,123 16 0.09 - 0.35 0.91 LVCIT Vanguard Intermediate-Term Corporate 3,446 38 0.06 - 0.12 8.43 L # BAB Pow erShares Build America Bond Portfolio 1,094 7 0.12 - 0.28 - NSCPB SPDR Barclays Capital Short Term Corp. 2,139 9 0.28 - 0.12 0.06 N # PZA Pow erShares Insured National Muni. Bond 1,032 8 0.10 - 0.28 - LHYS PIMCO 0-5 Year High Yield Corporate Bond 2,097 23 0.09 - 0.55 - L # ITM Market Vectors Intermediate Municipal ETF 754 6 0.11 - 0.24 0.24 NFLOT iShares Floating Rate Note ETF 1,611 19 0.07 - 0.20 0.14 N # SUB iShares S&P Short Term AMT-Free Municipal 633 4 0.13 - 0.25 0.05 NSJNK SPDR Barclays Capital Short Term HY 1,314 16 0.10 - 0.40 0.24 N # CMF iShares S&P California AMT-Free Municipal 311 2 0.32 - 0.25 0.12 NVCLT Vanguard Long-Term Corporate Bond ETF 823 20 0.16 - 0.12 1.82 L # HYMB SPDR Nuveen S&P High Yield Municipal 236 3 0.28 - 0.50 0.83 NPHB Pow erShares Fundamental HY Corporate 814 9 0.08 - 0.50 0.46 L # PVI Pow erShares VRDO Tax Free Weekly 231 2 0.18 - 0.25 0.01 NITR SPDR Barclays Intermediate Term Corporate 411 3 0.27 - 0.15 0.08 N # SMB Market Vectors Short Municipal ETF 209 2 0.15 - 0.20 0.12 NBSJF Guggenheim BulletShares 2015 HY Corporate 405 3 0.12 - 0.42 0.78 N # MUNI PIMCO Inter. Municipal Bond Strategy 203 2 0.18 - 0.35 - N
International Fixed Income Funds
Fixed Income Funds
1 Option Liquidity (H / M / L / N - High / Medium / Low / None)2 / - Significant increase / decrease in shares outstanding in last one year
US Listed ETFs
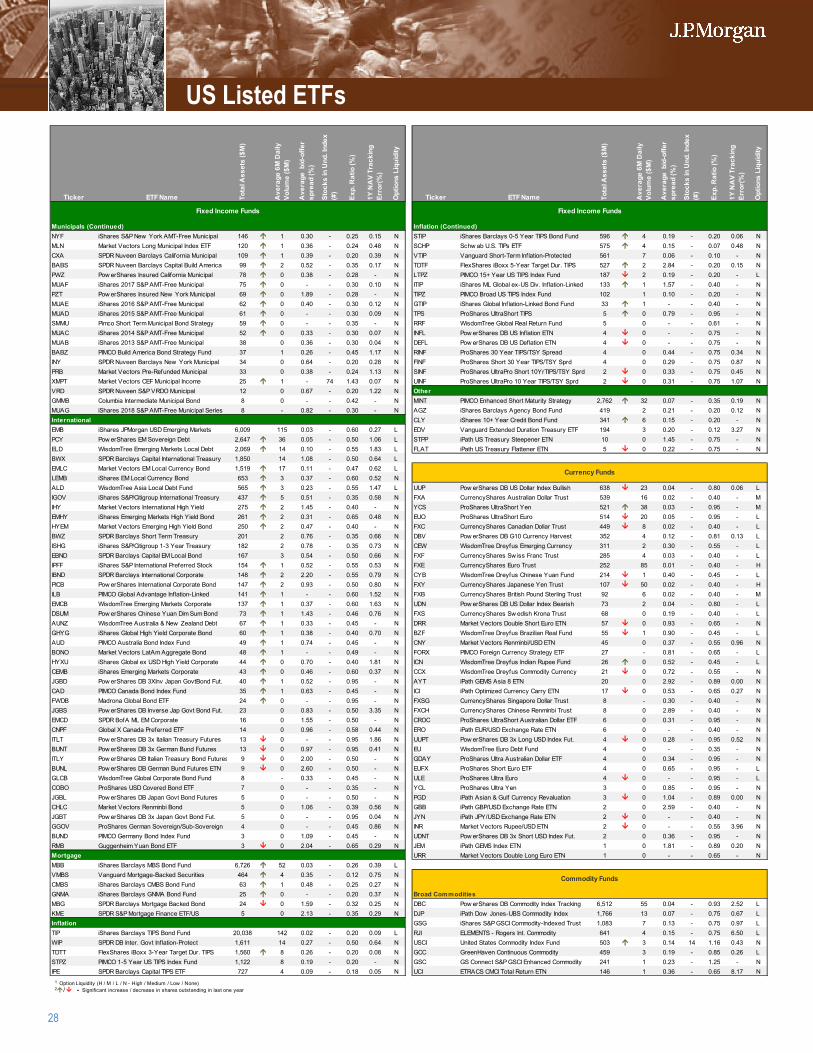
28
Ticker ETF Name Tota
l Ass
ets
($M
)
Ave
rage
6M
Dai
ly
Volu
me
($M
)
Ave
rage
bid
-offe
r sp
read
(%)
Stoc
ks in
Und
. Ind
ex
(#)
Exp.
Rat
io (%
)
1Y N
AV
Trac
king
Er
ror(
%)
Opt
ions
Liq
uidi
ty
Ticker ETF Name Tota
l Ass
ets
($M
)
Ave
rage
6M
Dai
ly
Volu
me
($M
)
Ave
rage
bid
-offe
r sp
read
(%)
Stoc
ks in
Und
. Ind
ex
(#)
Exp.
Rat
io (%
)
1Y N
AV
Trac
king
Er
ror(
%)
Opt
ions
Liq
uidi
ty
1
2
Municipals (Continued) 3 Inflation (Continued)NYF iShares S&P New York AMT-Free Municipal 146 1 0.30 - 0.25 0.15 N 4 STIP iShares Barclays 0-5 Year TIPS Bond Fund 596 4 0.19 - 0.20 0.06 NMLN Market Vectors Long Municipal Index ETF 120 1 0.36 - 0.24 0.48 N 5 SCHP Schw ab U.S. TIPs ETF 575 4 0.15 - 0.07 0.48 NCXA SPDR Nuveen Barclays California Municipal 109 1 0.39 - 0.20 0.39 N 6 VTIP Vanguard Short-Term Inflation-Protected 561 7 0.06 - 0.10 - NBABS SPDR Nuveen Barclays Capital Build America 99 2 0.52 - 0.35 0.17 N 7 TDTF FlexShares iBoxx 5-Year Target Dur. TIPS 527 2 2.84 - 0.20 0.15 NPWZ Pow erShares Insured California Municipal 78 0 0.38 - 0.28 - N 8 LTPZ PIMCO 15+ Year US TIPS Index Fund 187 2 0.19 - 0.20 - LMUAF iShares 2017 S&P AMT-Free Municipal 75 0 - - 0.30 0.10 N 9 ITIP iShares ML Global ex-US Div. Inflation-Linked 133 1 1.57 - 0.40 - NPZT Pow erShares Insured New York Municipal 69 0 1.89 - 0.28 - N # TIPZ PIMCO Broad US TIPS Index Fund 102 1 0.10 - 0.20 - NMUAE iShares 2016 S&P AMT-Free Municipal 62 0 0.40 - 0.30 0.12 N 11 GTIP iShares Global Inflation-Linked Bond Fund 33 1 - - 0.40 - NMUAD iShares 2015 S&P AMT-Free Municipal 61 0 - - 0.30 0.09 N # TPS ProShares UltraShort TIPS 5 0 0.79 - 0.95 - NSMMU Pimco Short Term Municipal Bond Strategy 59 0 - - 0.35 - N # RRF WisdomTree Global Real Return Fund 5 0 - - 0.61 - NMUAC iShares 2014 S&P AMT-Free Municipal 52 0 0.33 - 0.30 0.07 N # INFL Pow erShares DB US Inflation ETN 4 0 - - 0.75 - NMUAB iShares 2013 S&P AMT-Free Municipal 38 0 0.36 - 0.30 0.04 N # DEFL Pow erShares DB US Deflation ETN 4 0 - - 0.75 - NBABZ PIMCO Build America Bond Strategy Fund 37 1 0.26 - 0.45 1.17 N # RINF ProShares 30 Year TIPS/TSY Spread 4 0 0.44 - 0.75 0.34 NINY SPDR Nuveen Barclays New York Municipal 34 0 0.64 - 0.20 0.28 N # FINF ProShares Short 30 Year TIPS/TSY Sprd 4 0 0.29 - 0.75 0.87 NPRB Market Vectors Pre-Refunded Municipal 33 0 0.38 - 0.24 1.13 N # SINF ProShares UltraPro Short 10YrTIPS/TSY Sprd 2 0 0.33 - 0.75 0.45 NXMPT Market Vectors CEF Municipal Income 25 1 - 74 1.43 0.07 N # UINF ProShares UltraPro 10 Year TIPS/TSY Sprd 2 0 0.31 - 0.75 1.07 NVRD SPDR Nuveen S&P VRDO Municipal 12 0 0.67 - 0.20 1.22 N # OtherGMMB Columbia Intermediate Municipal Bond 8 0 - - 0.42 - N # MINT PIMCO Enhanced Short Maturity Strategy 2,762 32 0.07 - 0.35 0.19 NMUAG iShares 2018 S&P AMT-Free Municipal Series 8 - 0.82 - 0.30 - N # AGZ iShares Barclays Agency Bond Fund 419 2 0.21 - 0.20 0.12 NInternational # CLY iShares 10+ Year Credit Bond Fund 341 6 0.15 - 0.20 - NEMB iShares JPMorgan USD Emerging Markets 6,009 115 0.03 - 0.60 0.27 L # EDV Vanguard Extended Duration Treasury ETF 194 3 0.20 - 0.12 3.27 NPCY Pow erShares EM Sovereign Debt 2,647 36 0.05 - 0.50 1.06 L # STPP iPath US Treasury Steepener ETN 10 0 1.45 - 0.75 - NELD WisdomTree Emerging Markets Local Debt 2,069 14 0.10 - 0.55 1.83 L # FLAT iPath US Treasury Flattener ETN 5 0 0.22 - 0.75 - NBWX SPDR Barclays Capital International Treasury 1,850 14 1.08 - 0.50 0.64 L #
EMLC Market Vectors EM Local Currency Bond 1,519 17 0.11 - 0.47 0.62 L #
LEMB iShares EM Local Currency Bond 653 3 0.37 - 0.60 0.52 N #
ALD WisdomTree Asia Local Debt Fund 565 3 0.23 - 0.55 1.47 L # UUP Pow erShares DB US Dollar Index Bullish 638 23 0.04 - 0.80 0.06 LIGOV iShares S&P/Citigroup International Treasury 437 5 0.51 - 0.35 0.58 N # FXA CurrencyShares Australian Dollar Trust 539 16 0.02 - 0.40 - MIHY Market Vectors International High Yield 275 2 1.45 - 0.40 - N # YCS ProShares UltraShort Yen 521 38 0.03 - 0.95 - MEMHY iShares Emerging Markets High Yield Bond 261 2 0.31 - 0.65 0.48 N # EUO ProShares UltraShort Euro 514 20 0.05 - 0.95 - LHYEM Market Vectors Emerging High Yield Bond 250 2 0.47 - 0.40 - N # FXC CurrencyShares Canadian Dollar Trust 449 8 0.02 - 0.40 - LBWZ SPDR Barclays Short Term Treasury 201 2 0.76 - 0.35 0.66 N # DBV Pow erShares DB G10 Currency Harvest 352 4 0.12 - 0.81 0.13 LISHG iShares S&P/Citigroup 1-3 Year Treasury 182 2 0.78 - 0.35 0.73 N # CEW WisdomTree Dreyfus Emerging Currency 311 2 0.30 - 0.55 - LEBND SPDR Barclays Capital EM Local Bond 167 3 0.54 - 0.50 0.66 N # FXF CurrencyShares Sw iss Franc Trust 285 4 0.03 - 0.40 - LIPFF iShares S&P International Preferred Stock 154 1 0.52 - 0.55 0.53 N # FXE CurrencyShares Euro Trust 252 85 0.01 - 0.40 - HIBND SPDR Barclays International Corporate 148 2 2.20 - 0.55 0.79 N # CYB WisdomTree Dreyfus Chinese Yuan Fund 214 1 0.40 - 0.45 - LPICB Pow erShares International Corporate Bond 147 2 0.93 - 0.50 0.80 N # FXY CurrencyShares Japanese Yen Trust 107 50 0.02 - 0.40 - HILB PIMCO Global Advantage Inflation-Linked 141 1 - - 0.60 1.52 N # FXB CurrencyShares British Pound Sterling Trust 92 6 0.02 - 0.40 - MEMCB WisdomTree Emerging Markets Corporate 137 1 0.37 - 0.60 1.63 N # UDN Pow erShares DB US Dollar Index Bearish 73 2 0.04 - 0.80 - LDSUM Pow erShares Chinese Yuan Dim Sum Bond 73 1 1.43 - 0.46 0.76 N # FXS CurrencyShares Sw edish Krona Trust 68 0 0.19 - 0.40 - LAUNZ WisdomTree Australia & New Zealand Debt 67 1 0.33 - 0.45 - N # DRR Market Vectors Double Short Euro ETN 57 0 0.93 - 0.65 - NGHYG iShares Global High Yield Corporate Bond 60 1 0.38 - 0.40 0.70 N # BZF WisdomTree Dreyfus Brazilian Real Fund 55 1 0.90 - 0.45 - LAUD PIMCO Australia Bond Index Fund 49 1 0.74 - 0.45 - N # CNY Market Vectors Renminbi/USD ETN 45 0 0.37 - 0.55 0.96 NBONO Market Vectors LatAm Aggregate Bond 48 1 - - 0.49 - N # FORX PIMCO Foreign Currency Strategy ETF 27 - 0.81 - 0.65 - LHYXU iShares Global ex USD High Yield Corporate 44 0 0.70 - 0.40 1.81 N # ICN WisdomTree Dreyfus Indian Rupee Fund 26 0 0.52 - 0.45 - LCEMB iShares Emerging Markets Corporate 43 0 0.46 - 0.60 0.37 N # CCX WisdomTree Dreyfus Commodity Currency 21 0 0.72 - 0.55 - NJGBD Pow erShares DB 3XInv Japan GovtBond Fut. 40 1 0.52 - 0.95 - N # AYT iPath GEMS Asia 8 ETN 20 0 2.92 - 0.89 0.00 NCAD PIMCO Canada Bond Index Fund 35 1 0.63 - 0.45 - N # ICI iPath Optimized Currency Carry ETN 17 0 0.53 - 0.65 0.27 NFWDB Madrona Global Bond ETF 24 0 - - 0.95 - N # FXSG CurrencyShares Singapore Dollar Trust 8 - 0.30 - 0.40 - NJGBS Pow erShares DB Inverse Jap Govt Bond Fut. 23 0 0.83 - 0.50 3.35 N # FXCH CurrencyShares Chinese Renminbi Trust 8 0 2.89 - 0.40 - NEMCD SPDR BofA ML EM Corporate 16 0 1.55 - 0.50 - N # CROC ProShares UltraShort Australian Dollar ETF 6 0 0.31 - 0.95 - NCNPF Global X Canada Preferred ETF 14 0 0.96 - 0.58 0.44 N # ERO iPath EUR/USD Exchange Rate ETN 6 0 - - 0.40 - NITLT Pow erShares DB 3x Italian Treasury Futures 13 0 - - 0.95 1.86 N # UUPT Pow erShares DB 3x Long USD Index Fut. 4 0 0.28 - 0.95 0.52 NBUNT Pow erShares DB 3x German Bund Futures 13 0 0.97 - 0.95 0.41 N # EU WisdomTree Euro Debt Fund 4 0 - - 0.35 - NITLY Pow erShares DB Italian Treasury Bond Futures 9 0 2.00 - 0.50 - N # GDAY ProShares Ultra Australian Dollar ETF 4 0 0.34 - 0.95 - NBUNL Pow erShares DB German Bund Futures ETN 9 0 2.60 - 0.50 - N # EUFX ProShares Short Euro ETF 4 0 0.65 - 0.95 - LGLCB WisdomTree Global Corporate Bond Fund 8 - 0.33 - 0.45 - N # ULE ProShares Ultra Euro 4 0 - - 0.95 - LCOBO ProShares USD Covered Bond ETF 7 0 - - 0.35 - N # YCL ProShares Ultra Yen 3 0 0.85 - 0.95 - NJGBL Pow erShares DB Japan Govt Bond Futures 5 0 - - 0.50 - N # PGD iPath Asian & Gulf Currency Revaluation 3 0 1.04 - 0.89 0.00 NCHLC Market Vectors Renminbi Bond 5 0 1.06 - 0.39 0.56 N # GBB iPath GBP/USD Exchange Rate ETN 2 0 2.59 - 0.40 - NJGBT Pow erShares DB 3x Japan Govt Bond Fut. 5 0 - - 0.95 0.04 N # JYN iPath JPY/USD Exchange Rate ETN 2 0 - - 0.40 - NGGOV ProShares German Sovereign/Sub-Sovereign 4 0 - - 0.45 0.86 N # INR Market Vectors Rupee/USD ETN 2 0 - - 0.55 3.96 NBUND PIMCO Germany Bond Index Fund 3 0 1.09 - 0.45 - N # UDNT Pow erShares DB 3x Short USD Index Fut. 2 0 0.36 - 0.95 - NRMB Guggenheim Yuan Bond ETF 3 0 2.04 - 0.65 0.29 N # JEM iPath GEMS Index ETN 1 0 1.81 - 0.89 0.20 NMortgage # URR Market Vectors Double Long Euro ETN 1 0 - - 0.65 - NMBB iShares Barclays MBS Bond Fund 6,726 52 0.03 - 0.26 0.39 L #
VMBS Vanguard Mortgage-Backed Securities 464 4 0.35 - 0.12 0.75 N #
CMBS iShares Barclays CMBS Bond Fund 63 1 0.48 - 0.25 0.27 N #
GNMA iShares Barclays GNMA Bond Fund 25 0 - - 0.20 0.37 N # Broad CommoditiesMBG SPDR Barclays Mortgage Backed Bond 24 0 1.59 - 0.32 0.25 N # DBC Pow erShares DB Commodity Index Tracking 6,512 55 0.04 - 0.93 2.52 LKME SPDR S&P Mortgage Finance ETF/US 5 0 2.13 - 0.35 0.29 N # DJP iPath Dow Jones-UBS Commodity Index 1,766 13 0.07 - 0.75 0.67 LInflation # GSG iShares S&P GSCI Commodity-Indexed Trust 1,083 7 0.13 - 0.75 0.97 LTIP iShares Barclays TIPS Bond Fund 20,038 142 0.02 - 0.20 0.09 L # RJI ELEMENTS - Rogers Int. Commodity 641 4 0.15 - 0.75 6.50 LWIP SPDR DB Inter. Govt Inflation-Protect 1,611 14 0.27 - 0.50 0.64 N # USCI United States Commodity Index Fund 503 3 0.14 14 1.16 0.43 NTDTT FlexShares iBoxx 3-Year Target Dur. TIPS 1,560 8 0.26 - 0.20 0.08 N # GCC GreenHaven Continuous Commodity 459 3 0.19 - 0.85 0.26 LSTPZ PIMCO 1-5 Year US TIPS Index Fund 1,122 8 0.19 - 0.20 - N # GSC GS Connect S&P GSCI Enhanced Commodity 241 1 0.23 - 1.25 - NIPE SPDR Barclays Capital TIPS ETF 727 4 0.09 - 0.18 0.05 N # UCI ETRACS CMCI Total Return ETN 146 1 0.36 - 0.65 8.17 N
Fixed Income Funds Fixed Income Funds
Currency Funds
Commodity Funds
1 Option Liquidity (H / M / L / N - High / Medium / Low / None)2 / - Significant increase / decrease in shares outstanding in last one year
US Listed ETFs
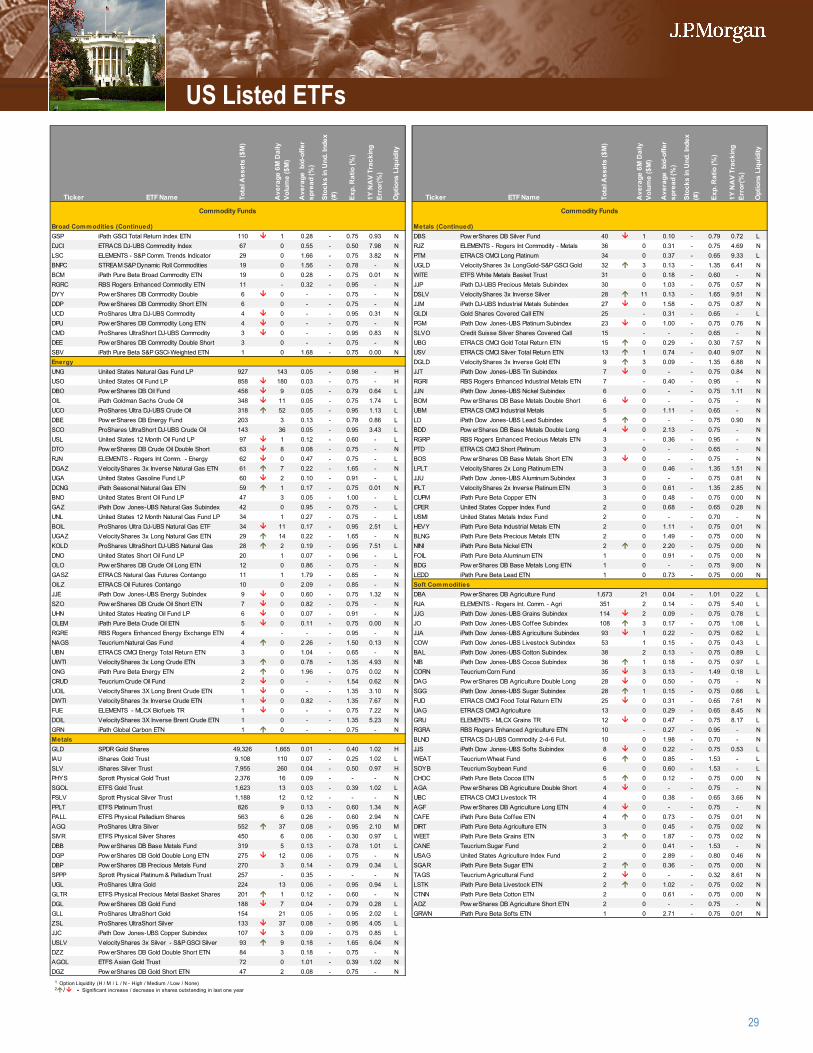
29
Ticker ETF Name Tota
l Ass
ets
($M
)
Ave
rage
6M
Dai
ly
Volu
me
($M
)
Ave
rage
bid
-offe
r sp
read
(%)
Stoc
ks in
Und
. Ind
ex
(#)
Exp.
Rat
io (%
)
1Y N
AV
Trac
king
Er
ror(
%)
Opt
ions
Liq
uidi
ty
Ticker ETF Name Tota
l Ass
ets
($M
)
Ave
rage
6M
Dai
ly
Volu
me
($M
)
Ave
rage
bid
-offe
r sp
read
(%)
Stoc
ks in
Und
. Ind
ex
(#)
Exp.
Rat
io (%
)
1Y N
AV
Trac
king
Er
ror(
%)
Opt
ions
Liq
uidi
ty
1
2
Broad Commodities (Continued) 3 Metals (Continued)GSP iPath GSCI Total Return Index ETN 110 1 0.28 - 0.75 0.93 N 4 DBS Pow erShares DB Silver Fund 40 1 0.10 - 0.79 0.72 LDJCI ETRACS DJ-UBS Commodity Index 67 0 0.55 - 0.50 7.98 N 5 RJZ ELEMENTS - Rogers Int Commodity - Metals 36 0 0.31 - 0.75 4.69 NLSC ELEMENTS - S&P Comm. Trends Indicator 29 0 1.66 - 0.75 3.82 N 6 PTM ETRACS CMCI Long Platinum 34 0 0.37 - 0.65 9.33 LBNPC STREAM S&P Dynamic Roll Commodities 19 0 1.56 - 0.78 - N 7 UGLD VelocityShares 3x LongGold-S&P GSCI Gold 32 3 0.13 - 1.35 6.41 NBCM iPath Pure Beta Broad Commodity ETN 19 0 0.28 - 0.75 0.01 N 8 WITE ETFS White Metals Basket Trust 31 0 0.18 - 0.60 - NRGRC RBS Rogers Enhanced Commodity ETN 11 - 0.32 - 0.95 - N 9 JJP iPath DJ-UBS Precious Metals Subindex 30 0 1.03 - 0.75 0.57 NDYY Pow erShares DB Commodity Double 6 0 - - 0.75 - N # DSLV VelocityShares 3x Inverse Silver 28 11 0.13 - 1.65 9.51 NDDP Pow erShares DB Commodity Short ETN 6 0 - - 0.75 - N 11 JJM iPath DJ-UBS Industrial Metals Subindex 27 0 1.58 - 0.75 0.87 NUCD ProShares Ultra DJ-UBS Commodity 4 0 - - 0.95 0.31 N # GLDI Gold Shares Covered Call ETN 25 - 0.31 - 0.65 - LDPU Pow erShares DB Commodity Long ETN 4 0 - - 0.75 - N # PGM iPath Dow Jones-UBS Platinum Subindex 23 0 1.00 - 0.75 0.76 NCMD ProShares UltraShort DJ-UBS Commodity 3 0 - - 0.95 0.83 N # SLVO Credit Suisse Silver Shares Covered Call 15 - - - 0.65 - NDEE Pow erShares DB Commodity Double Short 3 0 - - 0.75 - N # UBG ETRACS CMCI Gold Total Return ETN 15 0 0.29 - 0.30 7.57 NSBV iPath Pure Beta S&P GSCI-Weighted ETN 1 0 1.68 - 0.75 0.00 N # USV ETRACS CMCI Silver Total Return ETN 13 1 0.74 - 0.40 9.07 NEnergy # DGLD VelocityShares 3x Inverse Gold ETN 9 3 0.09 - 1.35 6.88 NUNG United States Natural Gas Fund LP 927 143 0.05 - 0.98 - H # JJT iPath Dow Jones-UBS Tin Subindex 7 0 - - 0.75 0.84 NUSO United States Oil Fund LP 858 180 0.03 - 0.75 - H # RGRI RBS Rogers Enhanced Industrial Metals ETN 7 - 0.40 - 0.95 - NDBO Pow erShares DB Oil Fund 458 9 0.05 - 0.79 0.64 L # JJN iPath Dow Jones-UBS Nickel Subindex 6 0 - - 0.75 1.11 NOIL iPath Goldman Sachs Crude Oil 348 11 0.05 - 0.75 1.74 L # BOM Pow erShares DB Base Metals Double Short 6 0 - - 0.75 - NUCO ProShares Ultra DJ-UBS Crude Oil 318 52 0.05 - 0.95 1.13 L # UBM ETRACS CMCI Industrial Metals 5 0 1.11 - 0.65 - NDBE Pow erShares DB Energy Fund 203 3 0.13 - 0.78 0.86 L # LD iPath Dow Jones-UBS Lead Subindex 5 0 - - 0.75 0.90 NSCO ProShares UltraShort DJ-UBS Crude Oil 143 36 0.05 - 0.95 3.43 L # BDD Pow erShares DB Base Metals Double Long 4 0 2.13 - 0.75 - NUSL United States 12 Month Oil Fund LP 97 1 0.12 - 0.60 - L # RGRP RBS Rogers Enhanced Precious Metals ETN 3 - 0.36 - 0.95 - NDTO Pow erShares DB Crude Oil Double Short 63 8 0.08 - 0.75 - N # PTD ETRACS CMCI Short Platinum 3 0 - - 0.65 - NRJN ELEMENTS - Rogers Int Comm. - Energy 62 0 0.47 - 0.75 - L # BOS Pow erShares DB Base Metals Short ETN 3 0 - - 0.75 - NDGAZ VelocityShares 3x Inverse Natural Gas ETN 61 7 0.22 - 1.65 - N # LPLT VelocityShares 2x Long Platinum ETN 3 0 0.46 - 1.35 1.51 NUGA United States Gasoline Fund LP 60 2 0.10 - 0.91 - L # JJU iPath Dow Jones-UBS Aluminum Subindex 3 0 - - 0.75 0.81 NDCNG iPath Seasonal Natural Gas ETN 59 1 0.17 - 0.75 0.01 N # IPLT VelocityShares 2x Inverse Platinum ETN 3 0 0.61 - 1.35 2.85 NBNO United States Brent Oil Fund LP 47 3 0.05 - 1.00 - L # CUPM iPath Pure Beta Copper ETN 3 0 0.48 - 0.75 0.00 NGAZ iPath Dow Jones-UBS Natural Gas Subindex 42 0 0.95 - 0.75 - L # CPER United States Copper Index Fund 2 0 0.68 - 0.65 0.28 NUNL United States 12 Month Natural Gas Fund LP 34 1 0.27 - 0.75 - L # USMI United States Metals Index Fund 2 0 - - 0.70 - NBOIL ProShares Ultra DJ-UBS Natural Gas ETF 34 11 0.17 - 0.95 2.51 L # HEVY iPath Pure Beta Industrial Metals ETN 2 0 1.11 - 0.75 0.01 NUGAZ VelocityShares 3x Long Natural Gas ETN 29 14 0.22 - 1.65 - N # BLNG iPath Pure Beta Precious Metals ETN 2 0 1.49 - 0.75 0.00 NKOLD ProShares UltraShort DJ-UBS Natural Gas 28 2 0.19 - 0.95 7.51 L # NINI iPath Pure Beta Nickel ETN 2 0 2.20 - 0.75 0.00 NDNO United States Short Oil Fund LP 20 1 0.07 - 0.96 - L # FOIL iPath Pure Beta Aluminum ETN 1 0 0.91 - 0.75 0.00 NOLO Pow erShares DB Crude Oil Long ETN 12 0 0.86 - 0.75 - N # BDG Pow erShares DB Base Metals Long ETN 1 0 - - 0.75 9.00 NGASZ ETRACS Natural Gas Futures Contango 11 1 1.79 - 0.85 - N # LEDD iPath Pure Beta Lead ETN 1 0 0.73 - 0.75 0.00 NOILZ ETRACS Oil Futures Contango 10 0 2.09 - 0.85 - N # Soft CommoditiesJJE iPath Dow Jones-UBS Energy Subindex 9 0 0.60 - 0.75 1.32 N # DBA Pow erShares DB Agriculture Fund 1,673 21 0.04 - 1.01 0.22 LSZO Pow erShares DB Crude Oil Short ETN 7 0 0.82 - 0.75 - N # RJA ELEMENTS - Rogers Int. Comm. - Agri 351 2 0.14 - 0.75 5.40 LUHN United States Heating Oil Fund LP 6 0 0.07 - 0.91 - N # JJG iPath Dow Jones-UBS Grains Subindex 114 2 0.09 - 0.75 0.78 LOLEM iPath Pure Beta Crude Oil ETN 5 0 0.11 - 0.75 0.00 N # JO iPath Dow Jones-UBS Coffee Subindex 108 3 0.17 - 0.75 1.08 LRGRE RBS Rogers Enhanced Energy Exchange ETN 4 - - - 0.95 - N # JJA iPath Dow Jones-UBS Agriculture Subindex 93 1 0.22 - 0.75 0.62 LNAGS Teucrium Natural Gas Fund 4 0 2.26 - 1.50 0.13 N # COW iPath Dow Jones-UBS Livestock Subindex 53 1 0.15 - 0.75 0.43 LUBN ETRACS CMCI Energy Total Return ETN 3 0 1.04 - 0.65 - N # BAL iPath Dow Jones-UBS Cotton Subindex 38 2 0.13 - 0.75 0.89 LUWTI VelocityShares 3x Long Crude ETN 3 0 0.78 - 1.35 4.93 N # NIB iPath Dow Jones-UBS Cocoa Subindex 36 1 0.18 - 0.75 0.97 LONG iPath Pure Beta Energy ETN 2 0 1.96 - 0.75 0.02 N # CORN Teucrium Corn Fund 35 3 0.13 - 1.49 0.18 LCRUD Teucrium Crude Oil Fund 2 0 - - 1.54 0.62 N # DAG Pow erShares DB Agriculture Double Long 28 0 0.50 - 0.75 - NUOIL VelocityShares 3X Long Brent Crude ETN 1 0 - - 1.35 3.10 N # SGG iPath Dow Jones-UBS Sugar Subindex 28 1 0.15 - 0.75 0.66 LDWTI VelocityShares 3x Inverse Crude ETN 1 0 0.82 - 1.35 7.67 N # FUD ETRACS CMCI Food Total Return ETN 25 0 0.31 - 0.65 7.61 NFUE ELEMENTS - MLCX Biofuels TR 1 0 - - 0.75 7.22 N # UAG ETRACS CMCI Agriculture 13 0 0.29 - 0.65 8.45 NDOIL VelocityShares 3X Inverse Brent Crude ETN 1 0 - - 1.35 5.23 N # GRU ELEMENTS - MLCX Grains TR 12 0 0.47 - 0.75 8.17 LGRN iPath Global Carbon ETN 1 0 - - 0.75 - N # RGRA RBS Rogers Enhanced Agriculture ETN 10 - 0.27 - 0.95 - NMetals # BLND ETRACS DJ-UBS Commodity 2-4-6 Fut. 10 0 1.98 - 0.70 - NGLD SPDR Gold Shares 49,326 1,665 0.01 - 0.40 1.02 H # JJS iPath Dow Jones-UBS Softs Subindex 8 0 0.22 - 0.75 0.53 LIAU iShares Gold Trust 9,108 110 0.07 - 0.25 1.02 L # WEAT Teucrium Wheat Fund 6 0 0.85 - 1.53 - LSLV iShares Silver Trust 7,955 260 0.04 - 0.50 0.97 H # SOYB Teucrium Soybean Fund 6 0 0.60 - 1.53 - LPHYS Sprott Physical Gold Trust 2,376 16 0.09 - - - N # CHOC iPath Pure Beta Cocoa ETN 5 0 0.12 - 0.75 0.00 NSGOL ETFS Gold Trust 1,623 13 0.03 - 0.39 1.02 L # AGA Pow erShares DB Agriculture Double Short 4 0 - - 0.75 - NPSLV Sprott Physical Silver Trust 1,188 12 0.12 - - - N # UBC ETRACS CMCI Livestock TR 4 0 0.38 - 0.65 3.66 NPPLT ETFS Platinum Trust 826 9 0.13 - 0.60 1.34 N # AGF Pow erShares DB Agriculture Long ETN 4 0 - - 0.75 - NPALL ETFS Physical Palladium Shares 563 6 0.26 - 0.60 2.94 N # CAFE iPath Pure Beta Coffee ETN 4 0 0.73 - 0.75 0.01 NAGQ ProShares Ultra Silver 552 37 0.08 - 0.95 2.10 M # DIRT iPath Pure Beta Agriculture ETN 3 0 0.45 - 0.75 0.02 NSIVR ETFS Physical Silver Shares 450 6 0.06 - 0.30 0.97 L # WEET iPath Pure Beta Grains ETN 3 0 1.87 - 0.75 0.02 NDBB Pow erShares DB Base Metals Fund 319 5 0.13 - 0.78 1.01 L # CANE Teucrium Sugar Fund 2 0 0.41 - 1.53 - NDGP Pow erShares DB Gold Double Long ETN 275 12 0.06 - 0.75 - N # USAG United States Agriculture Index Fund 2 0 2.89 - 0.80 0.46 NDBP Pow erShares DB Precious Metals Fund 270 3 0.14 - 0.79 0.34 L # SGAR iPath Pure Beta Sugar ETN 2 0 0.36 - 0.75 0.00 NSPPP Sprott Physical Platinum & Palladium Trust 257 - 0.35 - - - N # TAGS Teucrium Agricultural Fund 2 0 - - 0.32 8.61 NUGL ProShares Ultra Gold 224 13 0.06 - 0.95 0.94 L # LSTK iPath Pure Beta Livestock ETN 2 0 1.02 - 0.75 0.02 NGLTR ETFS Physical Precious Metal Basket Shares 201 1 0.12 - 0.60 - N # CTNN iPath Pure Beta Cotton ETN 2 0 0.61 - 0.75 0.00 NDGL Pow erShares DB Gold Fund 188 7 0.04 - 0.79 0.28 L # ADZ Pow erShares DB Agriculture Short ETN 2 0 - - 0.75 - NGLL ProShares UltraShort Gold 154 21 0.05 - 0.95 2.02 L # GRWN iPath Pure Beta Softs ETN 1 0 2.71 - 0.75 0.01 NZSL ProShares UltraShort Silver 133 37 0.08 - 0.95 4.05 L #
JJC iPath Dow Jones-UBS Copper Subindex 107 3 0.09 - 0.75 0.85 L #
USLV VelocityShares 3x Silver - S&P GSCI Silver 93 9 0.18 - 1.65 6.04 N #
DZZ Pow erShares DB Gold Double Short ETN 84 3 0.18 - 0.75 - N #
AGOL ETFS Asian Gold Trust 72 0 1.01 - 0.39 1.02 N #
DGZ Pow erShares DB Gold Short ETN 47 2 0.08 - 0.75 - N #
Commodity Funds Commodity Funds
1 Option Liquidity (H / M / L / N - High / Medium / Low / None)2 / - Significant increase / decrease in shares outstanding in last one year
US Listed ETFs
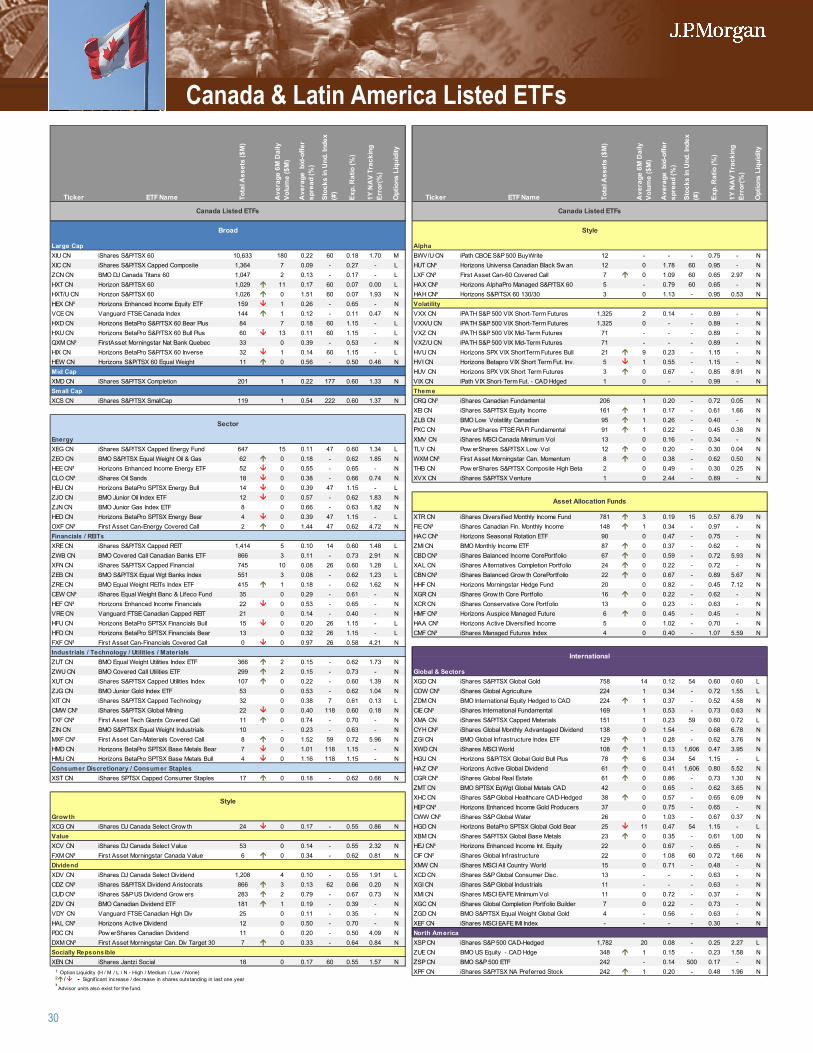
30
Ticker ETF Name Tota
l Ass
ets
($M
)
Ave
rage
6M
Dai
ly
Volu
me
($M
)
Ave
rage
bid
-offe
r sp
read
(%)
Stoc
ks in
Und
. Ind
ex
(#)
Exp.
Rat
io (%
)
1Y N
AV
Trac
king
Er
ror(
%)
Opt
ions
Liq
uidi
ty
Ticker ETF Name Tota
l Ass
ets
($M
)
Ave
rage
6M
Dai
ly
Volu
me
($M
)
Ave
rage
bid
-offe
r sp
read
(%)
Stoc
ks in
Und
. Ind
ex
(#)
Exp.
Rat
io (%
)
1Y N
AV
Trac
king
Er
ror(
%)
Opt
ions
Liq
uidi
ty
1
2
3
4
Large Cap 5 AlphaXIU CN iShares S&P/TSX 60 10,633 180 0.22 60 0.18 1.70 M 6 BWV/U CN iPath CBOE S&P 500 BuyWrite 12 - - - 0.75 - NXIC CN iShares S&P/TSX Capped Composite 1,364 7 0.09 - 0.27 - L 7 HUT CN³ Horizons Universa Canadian Black Sw an 12 0 1.78 60 0.95 - NZCN CN BMO DJ Canada Titans 60 1,047 2 0.13 - 0.17 - L 8 LXF CN³ First Asset Can-60 Covered Call 7 0 1.09 60 0.65 2.97 NHXT CN Horizon S&P/TSX 60 1,029 11 0.17 60 0.07 0.00 L 9 HAX CN³ Horizons AlphaPro Managed S&P/TSX 60 5 - 0.79 60 0.65 - NHXT/U CN Horizon S&P/TSX 60 1,026 0 1.51 60 0.07 1.93 N # HAH CN³ Horizons S&P/TSX 60 130/30 3 0 1.13 - 0.95 0.53 NHEX CN³ Horizons Enhanced Income Equity ETF 159 1 0.26 - 0.65 - N 11 VolatilityVCE CN Vanguard FTSE Canada Index 144 1 0.12 - 0.11 0.47 N # VXX CN iPATH S&P 500 VIX Short-Term Futures 1,325 2 0.14 - 0.89 - NHXD CN Horizons BetaPro S&P/TSX 60 Bear Plus 84 7 0.18 60 1.15 - L # VXX/U CN iPATH S&P 500 VIX Short-Term Futures 1,325 0 - - 0.89 - NHXU CN Horizons BetaPro S&P/TSX 60 Bull Plus 60 13 0.11 60 1.15 - L # VXZ CN iPATH S&P 500 VIX Mid-Term Futures 71 - - - 0.89 - NQXM CN³ FirstAsset Morningstar Nat Bank Quebec 33 0 0.39 - 0.53 - N # VXZ/U CN iPATH S&P 500 VIX Mid-Term Futures 71 - - - 0.89 - NHIX CN Horizons BetaPro S&P/TSX 60 Inverse 32 1 0.14 60 1.15 - L # HVU CN Horizons SPX VIX ShortTerm Futures Bull 21 9 0.23 - 1.15 - NHEW CN Horizons S&P/TSX 60 Equal Weight 11 0 0.56 - 0.50 0.46 N # HVI CN Horizons Betapro VIX Short Term Fut. Inv. 5 1 0.55 - 1.15 - NMid Cap # HUV CN Horizons SPX VIX Short Term Futures 3 0 0.67 - 0.85 8.91 NXMD CN iShares S&P/TSX Completion 201 1 0.22 177 0.60 1.33 N # VIX CN iPath VIX Short-Term Fut. - CAD Hdged 1 0 - - 0.99 - NSmall Cap # ThemeXCS CN iShares S&P/TSX SmallCap 119 1 0.54 222 0.60 1.37 N # CRQ CN³ iShares Canadian Fundamental 206 1 0.20 - 0.72 0.05 N
# XEI CN iShares S&P/TSX Equity Income 161 1 0.17 - 0.61 1.66 N# ZLB CN BMO Low Volatility Canadian 95 1 0.26 - 0.40 - N# PXC CN Pow erShares FTSE RAFI Fundamental 91 1 0.22 - 0.45 0.38 N
Energy # XMV CN iShares MSCI Canada Minimum Vol 13 0 0.16 - 0.34 - NXEG CN iShares S&P/TSX Capped Energy Fund 647 15 0.11 47 0.60 1.34 L # TLV CN Pow erShares S&P/TSX Low Vol 12 0 0.20 - 0.30 0.04 NZEO CN BMO S&P/TSX Equal Weight Oil & Gas 62 0 0.18 - 0.62 1.85 N # WXM CN³ First Asset Morningstar Can. Momentum 8 0 0.38 - 0.62 0.50 NHEE CN³ Horizons Enhanced Income Energy ETF 52 0 0.55 - 0.65 - N # THB CN Pow erShares S&P/TSX Composite High Beta 2 0 0.49 - 0.30 0.25 NCLO CN³ iShares Oil Sands 18 0 0.38 - 0.66 0.74 N # XVX CN iShares S&P/TSX Venture 1 0 2.44 - 0.89 - NHEU CN Horizons BetaPro SPTSX Energy Bull 14 0 0.39 47 1.15 - L #
ZJO CN BMO Junior Oil Index ETF 12 0 0.57 - 0.62 1.83 N #
ZJN CN BMO Junior Gas Index ETF 8 0 0.66 - 0.63 1.82 N #
HED CN Horizons BetaPro SPTSX Energy Bear 4 0 0.39 47 1.15 - L # XTR CN iShares Diversif ied Monthly Income Fund 781 3 0.19 15 0.57 6.79 NOXF CN³ First Asset Can-Energy Covered Call 2 0 1.44 47 0.62 4.72 N # FIE CN³ iShares Canadian Fin. Monthly Income 148 1 0.34 - 0.97 - NFinancials / REITs # HAC CN³ Horizons Seasonal Rotation ETF 90 0 0.47 - 0.75 - NXRE CN iShares S&P/TSX Capped REIT 1,414 5 0.10 14 0.60 1.48 L # ZMI CN BMO Monthly Income ETF 87 0 0.37 - 0.62 - NZWB CN BMO Covered Call Canadian Banks ETF 866 3 0.11 - 0.73 2.91 N # CBD CN³ iShares Balanced Income CorePortfolio 67 0 0.59 - 0.72 5.93 NXFN CN iShares S&P/TSX Capped Financial 745 10 0.08 26 0.60 1.28 L # XAL CN iShares Alternatives Completion Portfolio 24 0 0.22 - 0.72 - NZEB CN BMO S&P/TSX Equal Wgt Banks Index 551 3 0.08 - 0.62 1.23 L # CBN CN³ iShares Balanced Grow th CorePortfolio 22 0 0.67 - 0.89 5.67 NZRE CN BMO Equal Weight REITs Index ETF 415 1 0.18 - 0.62 1.62 N # HHF CN Horizons Morningstar Hedge Fund 20 0 0.82 - 0.45 7.12 NCEW CN³ iShares Equal Weight Banc & Lifeco Fund 35 0 0.29 - 0.61 - N # XGR CN iShares Grow th Core Portfolio 16 0 0.22 - 0.62 - NHEF CN³ Horizons Enhanced Income Financials 22 0 0.53 - 0.65 - N # XCR CN iShares Conservative Core Portfolio 13 0 0.23 - 0.63 - NVRE CN Vanguard FTSE Canadian Capped REIT 21 0 0.14 - 0.40 - N # HMF CN³ Horizons Auspice Managed Future 6 0 0.45 - 0.45 - NHFU CN Horizons BetaPro SPTSX Financials Bull 15 0 0.20 26 1.15 - L # HAA CN³ Horizons Active Diversif ied Income 5 0 1.02 - 0.70 - NHFD CN Horizons BetaPro SPTSX Financials Bear 13 0 0.32 26 1.15 - L # CMF CN³ iShares Managed Futures Index 4 0 0.40 - 1.07 5.59 NFXF CN³ First Asset Can-Financials Covered Call 0 0 0.97 26 0.58 4.21 N #
Industrials / Technology / Utilities / Materials #
ZUT CN BMO Equal Weight Utilities Index ETF 366 2 0.15 - 0.62 1.73 N #
ZWU CN BMO Covered Call Utilities ETF 299 2 0.15 - 0.73 - N # Global & SectorsXUT CN iShares S&P/TSX Capped Utilities Index 107 0 0.22 - 0.60 1.39 N # XGD CN iShares S&P/TSX Global Gold 758 14 0.12 54 0.60 0.60 LZJG CN BMO Junior Gold Index ETF 53 0 0.53 - 0.62 1.04 N # COW CN³ iShares Global Agriculture 224 1 0.34 - 0.72 1.55 LXIT CN iShares S&P/TSX Capped Technology 32 0 0.38 7 0.61 0.13 L # ZDM CN BMO International Equity Hedged to CAD 224 1 0.37 - 0.52 4.58 NCMW CN³ iShares S&P/TSX Global Mining 22 0 0.40 118 0.60 0.18 N # CIE CN³ iShares International Fundamental 169 1 0.53 - 0.73 0.63 NTXF CN³ First Asset Tech Giants Covered Call 11 0 0.74 - 0.70 - N # XMA CN iShares S&P/TSX Capped Materials 151 1 0.23 59 0.60 0.72 LZIN CN BMO S&P/TSX Equal Weight Industrials 10 - 0.23 - 0.63 - N # CYH CN³ iShares Global Monthly Advantaged Dividend 138 0 1.54 - 0.68 6.78 NMXF CN³ First Asset Can-Materials Covered Call 8 0 1.52 59 0.72 5.96 N # ZGI CN BMO Global Infrastructure Index ETF 129 1 0.28 - 0.62 3.76 NHMD CN Horizons BetaPro SPTSX Base Metals Bear 7 0 1.01 118 1.15 - N # XWD CN iShares MSCI World 108 1 0.13 1,606 0.47 3.95 NHMU CN Horizons BetaPro SPTSX Base Metals Bull 4 0 1.16 118 1.15 - N # HGU CN Horizons S&P/TSX Global Gold Bull Plus 78 6 0.34 54 1.15 - LConsumer Discretionary / Consumer Staples # HAZ CN³ Horizons Active Global Dividend 61 0 0.41 1,606 0.80 5.52 NXST CN iShares SPTSX Capped Consumer Staples 17 0 0.18 - 0.62 0.66 N # CGR CN³ iShares Global Real Estate 61 0 0.86 - 0.73 1.30 N
# ZMT CN BMO SPTSX EqWgt Global Metals CAD 42 0 0.65 - 0.62 3.65 N# XHC CN iShares S&P Global Healthcare CAD-Hedged 38 0 0.57 - 0.65 6.09 N# HEP CN³ Horizons Enhanced Income Gold Producers 37 0 0.75 - 0.65 - N
Growth # CWW CN³ iShares S&P Global Water 26 0 1.03 - 0.67 0.37 NXCG CN iShares DJ Canada Select Grow th 24 0 0.17 - 0.55 0.86 N # HGD CN Horizons BetaPro SPTSX Global Gold Bear 25 11 0.47 54 1.15 - LValue # XBM CN iShares S&P/TSX Global Base Metals 23 0 0.35 - 0.61 1.00 NXCV CN iShares DJ Canada Select Value 53 0 0.14 - 0.55 2.32 N # HEJ CN³ Horizons Enhanced Income Int. Equity 22 0 0.67 - 0.65 - NFXM CN³ First Asset Morningstar Canada Value 6 0 0.34 - 0.62 0.81 N # CIF CN³ iShares Global Infrastructure 22 0 1.08 60 0.72 1.66 NDividend # XMW CN iShares MSCI All Country World 15 0 0.71 - 0.48 - NXDV CN iShares DJ Canada Select Dividend 1,208 4 0.10 - 0.55 1.91 L # XCD CN iShares S&P Global Consumer Disc. 13 - - - 0.63 - NCDZ CN³ iShares S&P/TSX Dividend Aristocrats 866 3 0.13 62 0.66 0.20 N # XGI CN iShares S&P Global Industrials 11 - - - 0.63 - NCUD CN³ iShares S&P US Dividend Grow ers 283 2 0.79 - 0.67 0.73 N # XMI CN iShares MSCI EAFE Minimum Vol 11 0 0.72 - 0.37 - NZDV CN BMO Canadian Dividend ETF 181 1 0.19 - 0.39 - N # XGC CN iShares Global Completion Portfolio Builder 7 0 0.22 - 0.73 - NVDY CN Vanguard FTSE Canadian High Div 25 0 0.11 - 0.35 - N # ZGD CN BMO S&P/TSX Equal Weight Global Gold 4 - 0.56 - 0.63 - NHAL CN³ Horizons Active Dividend 12 0 0.50 - 0.70 - N # XEF CN iShares MSCI EAFE IMI Index - - - - 0.30 - NPDC CN Pow erShares Canadian Dividend 11 0 0.20 - 0.50 4.09 N # North AmericaDXM CN³ First Asset Morningstar Can. Div Target 30 7 0 0.33 - 0.64 0.84 N # XSP CN iShares S&P 500 CAD-Hedged 1,782 20 0.08 - 0.25 2.27 LSocially Repsonsible # ZUE CN BMO US Equity - CAD Hdge 348 1 0.15 - 0.23 1.58 NXEN CN iShares Jantzi Social 18 0 0.17 60 0.55 1.57 N # ZSP CN BMO S&P 500 ETF 242 - 0.14 500 0.17 - N
# XPF CN iShares S&P/TSX NA Preferred Stock 242 1 0.20 - 0.48 1.96 N
Asset Allocation Funds
Canada Listed ETFs Canada Listed ETFs
Broad Style
Sector
International
Style
1 Option Liquidity (H / M / L / N - High / Medium / Low / None)2 / - Significant increase / decrease in shares outstanding in last one year³ Advisor units also exist for the fund.
Canada & Latin America Listed ETFs
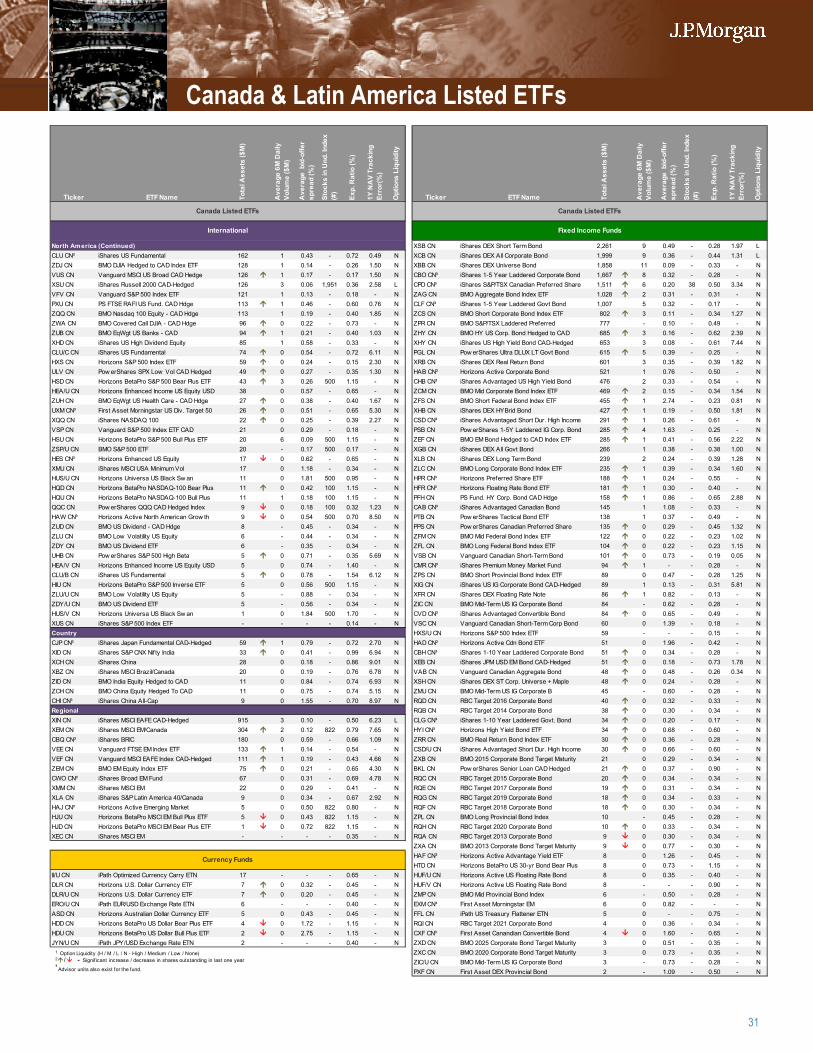
31
Ticker ETF Name Tota
l Ass
ets
($M
)
Ave
rage
6M
Dai
ly
Volu
me
($M
)
Ave
rage
bid
-offe
r sp
read
(%)
Stoc
ks in
Und
. Ind
ex
(#)
Exp.
Rat
io (%
)
1Y N
AV
Trac
king
Er
ror(
%)
Opt
ions
Liq
uidi
ty
Ticker ETF Name Tota
l Ass
ets
($M
)
Ave
rage
6M
Dai
ly
Volu
me
($M
)
Ave
rage
bid
-offe
r sp
read
(%)
Stoc
ks in
Und
. Ind
ex
(#)
Exp.
Rat
io (%
)
1Y N
AV
Trac
king
Er
ror(
%)
Opt
ions
Liq
uidi
ty
1
2
3
4
North America (Continued) 5 XSB CN iShares DEX Short Term Bond 2,261 9 0.49 - 0.28 1.97 LCLU CN³ iShares US Fundamental 162 1 0.43 - 0.72 0.49 N 6 XCB CN iShares DEX All Corporate Bond 1,999 9 0.36 - 0.44 1.31 LZDJ CN BMO DJIA Hedged to CAD Index ETF 128 1 0.14 - 0.26 1.50 N 7 XBB CN iShares DEX Universe Bond 1,858 11 0.09 - 0.33 - NVUS CN Vanguard MSCI US Broad CAD Hedge 126 1 0.17 - 0.17 1.50 N 8 CBO CN³ iShares 1-5 Year Laddered Corporate Bond 1,667 8 0.32 - 0.28 - NXSU CN iShares Russell 2000 CAD-Hedged 126 3 0.06 1,951 0.36 2.58 L 9 CPD CN³ iShares S&P/TSX Canadian Preferred Share 1,511 6 0.20 38 0.50 3.34 NVFV CN Vanguard S&P 500 Index ETF 121 1 0.13 - 0.18 - N # ZAG CN BMO Aggregate Bond Index ETF 1,028 2 0.31 - 0.31 - NPXU CN PS FTSE RAFI US Fund. CAD Hdge 113 1 0.46 - 0.60 0.76 N 11 CLF CN³ iShares 1-5 Year Laddered Govt Bond 1,007 5 0.32 - 0.17 - NZQQ CN BMO Nasdaq 100 Equity - CAD Hdge 113 1 0.19 - 0.40 1.85 N # ZCS CN BMO Short Corporate Bond Index ETF 802 3 0.11 - 0.34 1.27 NZWA CN BMO Covered Call DJIA - CAD Hdge 96 0 0.22 - 0.73 - N # ZPR CN BMO S&P/TSX Laddered Preferred 777 - 0.10 - 0.49 - NZUB CN BMO EqWgt US Banks - CAD 94 1 0.21 - 0.40 1.03 N # ZHY CN BMO HY US Corp. Bond Hedged to CAD 685 3 0.16 - 0.62 2.39 NXHD CN iShares US High Dividend Equity 85 1 0.58 - 0.33 - N # XHY CN iShares US High Yield Bond CAD-Hedged 653 3 0.08 - 0.61 7.44 NCLU/C CN iShares US Fundamental 74 0 0.54 - 0.72 6.11 N # PGL CN Pow erShares Ultra DLUX LT Govt Bond 615 5 0.39 - 0.25 - NHXS CN Horizons S&P 500 Index ETF 59 0 0.24 - 0.15 2.30 N # XRB CN iShares DEX Real Return Bond 601 3 0.35 - 0.39 1.82 NULV CN Pow erShares SPX Low Vol CAD Hedged 49 0 0.27 - 0.35 1.30 N # HAB CN³ Horizons Active Corporate Bond 521 1 0.76 - 0.50 - NHSD CN Horizons BetaPro S&P 500 Bear Plus ETF 43 3 0.26 500 1.15 - N # CHB CN³ iShares Advantaged US High Yield Bond 476 2 0.33 - 0.54 - NHEA/U CN Horizons Enhanced Income US Equity USD 38 0 0.57 - 0.65 - N # ZCM CN BMO Mid Corporate Bond Index ETF 469 2 0.15 - 0.34 1.54 NZUH CN BMO EqWgt US Health Care - CAD Hdge 27 0 0.38 - 0.40 1.67 N # ZFS CN BMO Short Federal Bond Index ETF 455 1 2.74 - 0.23 0.81 NUXM CN³ First Asset Morningstar US Div. Target 50 26 0 0.51 - 0.65 5.30 N # XHB CN iShares DEX HYBrid Bond 427 1 0.19 - 0.50 1.81 NXQQ CN iShares NASDAQ 100 22 0 0.25 - 0.39 2.27 N # CSD CN³ iShares Advantaged Short Dur. High Income 291 1 0.26 - 0.61 - NVSP CN Vanguard S&P 500 Index ETF CAD 21 0 0.29 - 0.18 - N # PSB CN Pow erShares 1-5Y Laddered IG Corp. Bond 285 4 1.63 - 0.25 - NHSU CN Horizons BetaPro S&P 500 Bull Plus ETF 20 6 0.09 500 1.15 - N # ZEF CN BMO EM Bond Hedged to CAD Index ETF 285 1 0.41 - 0.56 2.22 NZSP/U CN BMO S&P 500 ETF 20 - 0.17 500 0.17 - N # XGB CN iShares DEX All Govt Bond 266 1 0.38 - 0.38 1.00 NHES CN³ Horizons Enhanced US Equity 17 0 0.62 - 0.65 - N # XLB CN iShares DEX Long Term Bond 239 2 0.24 - 0.39 1.28 NXMU CN iShares MSCI USA Minimum Vol 17 0 1.18 - 0.34 - N # ZLC CN BMO Long Corporate Bond Index ETF 235 1 0.39 - 0.34 1.60 NHUS/U CN Horizons Universa US Black Sw an 11 0 1.81 500 0.95 - N # HPR CN³ Horizons Preferred Share ETF 188 1 0.24 - 0.55 - NHQD CN Horizons BetaPro NASDAQ-100 Bear Plus 11 0 0.42 100 1.15 - N # HFR CN³ Horizons Floating Rate Bond ETF 181 1 0.30 - 0.40 - NHQU CN Horizons BetaPro NASDAQ-100 Bull Plus 11 1 0.18 100 1.15 - N # PFH CN PS Fund. HY Corp. Bond CAD Hdge 158 1 0.86 - 0.65 2.88 NQQC CN Pow erShares QQQ CAD Hedged Index 9 0 0.18 100 0.32 1.23 N # CAB CN³ iShares Advantaged Canadian Bond 145 1 1.08 - 0.33 - NHAW CN³ Horizons Active North American Grow th 9 0 0.54 500 0.70 8.50 N # PTB CN Pow erShares Tactical Bond ETF 138 1 0.37 - 0.49 - NZUD CN BMO US Dividend - CAD Hdge 8 - 0.45 - 0.34 - N # PPS CN Pow erShares Canadian Preferred Share 135 0 0.29 - 0.45 1.32 NZLU CN BMO Low Volatility US Equity 6 - 0.44 - 0.34 - N # ZFM CN BMO Mid Federal Bond Index ETF 122 0 0.22 - 0.23 1.02 NZDY CN BMO US Dividend ETF 6 - 0.35 - 0.34 - N # ZFL CN BMO Long Federal Bond Index ETF 104 0 0.22 - 0.23 1.15 NUHB CN Pow erShares S&P 500 High Beta 5 0 0.71 - 0.35 5.69 N # VSB CN Vanguard Canadian Short-Term Bond 101 0 0.73 - 0.19 0.05 NHEA/V CN Horizons Enhanced Income US Equity USD 5 0 0.74 - 1.40 - N # CMR CN³ iShares Premium Money Market Fund 94 1 - - 0.28 - NCLU/B CN iShares US Fundamental 5 0 0.78 - 1.54 6.12 N # ZPS CN BMO Short Provincial Bond Index ETF 89 0 0.47 - 0.28 1.25 NHIU CN Horizons BetaPro S&P 500 Inverse ETF 5 0 0.56 500 1.15 - N # XIG CN iShares US IG Corporate Bond CAD-Hedged 89 1 0.13 - 0.31 5.81 NZLU/U CN BMO Low Volatility US Equity 5 - 0.88 - 0.34 - N # XFR CN iShares DEX Floating Rate Note 86 1 0.82 - 0.13 - NZDY/U CN BMO US Dividend ETF 5 - 0.56 - 0.34 - N # ZIC CN BMO Mid-Term US IG Corporate Bond 84 - 0.62 - 0.28 - NHUS/V CN Horizons Universa US Black Sw an 1 0 1.84 500 1.70 - N # CVD CN³ iShares Advantaged Convertible Bond 84 0 0.65 - 0.49 - NXUS CN iShares S&P 500 Index ETF - - - - 0.14 - N # VSC CN Vanguard Canadian Short-Term Corp Bond 60 0 1.39 - 0.18 - NCountry # HXS/U CN Horizons S&P 500 Index ETF 59 - - - 0.15 - NCJP CN³ iShares Japan Fundamental CAD-Hedged 59 1 0.79 - 0.72 2.70 N # HAD CN³ Horizons Active Cdn Bond ETF 51 0 1.96 - 0.42 - NXID CN iShares S&P CNX Nifty India 33 0 0.41 - 0.99 6.94 N # CBH CN³ iShares 1-10 Year Laddered Corporate Bond 51 0 0.34 - 0.28 - NXCH CN iShares China 28 0 0.18 - 0.86 9.01 N # XEB CN iShares JPM USD EM Bond CAD-Hedged 51 0 0.18 - 0.73 1.78 NXBZ CN iShares MSCI Brazil/Canada 20 0 0.19 - 0.76 6.78 N # VAB CN Vanguard Canadian Aggregate Bond 48 0 0.48 - 0.26 0.34 NZID CN BMO India Equity Hedged to CAD 11 0 0.84 - 0.74 6.93 N # XSH CN iShares DEX ST Corp. Universe + Maple 48 0 0.24 - 0.28 - NZCH CN BMO China Equity Hedged To CAD 11 0 0.75 - 0.74 5.15 N # ZMU CN BMO Mid-Term US IG Corporate B 45 - 0.60 - 0.28 - NCHI CN³ iShares China All-Cap 9 0 1.55 - 0.70 8.97 N # RQD CN RBC Target 2016 Corporate Bond 40 0 0.32 - 0.33 - NRegional # RQB CN RBC Target 2014 Corporate Bond 38 0 0.30 - 0.34 - NXIN CN iShares MSCI EAFE CAD-Hedged 915 3 0.10 - 0.50 6.23 L # CLG CN³ iShares 1-10 Year Laddered Govt. Bond 34 0 0.20 - 0.17 - NXEM CN iShares MSCI EM/Canada 304 2 0.12 822 0.79 7.65 N # HYI CN³ Horizons High Yield Bond ETF 34 0 0.68 - 0.60 - NCBQ CN³ iShares BRIC 180 0 0.59 - 0.66 1.09 N # ZRR CN BMO Real Return Bond Index ETF 30 0 0.36 - 0.28 - NVEE CN Vanguard FTSE EM Index ETF 133 1 0.14 - 0.54 - N # CSD/U CN iShares Advantaged Short Dur. High Income 30 0 0.66 - 0.60 - NVEF CN Vanguard MSCI EAFE Index CAD-Hedged 111 1 0.19 - 0.43 4.66 N # ZXB CN BMO 2015 Corporate Bond Target Maturity 21 0 0.29 - 0.34 - NZEM CN BMO EM Equity Index ETF 75 0 0.21 - 0.65 4.30 N # BKL CN Pow erShares Senior Loan CAD Hedged 21 0 0.37 - 0.90 - NCWO CN³ iShares Broad EM Fund 67 0 0.31 - 0.69 4.78 N # RQC CN RBC Target 2015 Corporate Bond 20 0 0.34 - 0.34 - NXMM CN iShares MSCI EM 22 0 0.29 - 0.41 - N # RQE CN RBC Target 2017 Corporate Bond 19 0 0.31 - 0.34 - NXLA CN iShares S&P Latin America 40/Canada 9 0 0.34 - 0.67 2.92 N # RQG CN RBC Target 2019 Corporate Bond 18 0 0.34 - 0.33 - NHAJ CN³ Horizons Active Emerging Market 5 0 0.50 822 0.80 - N # RQF CN RBC Target 2018 Corporate Bond 18 0 0.30 - 0.34 - NHJU CN Horizons BetaPro MSCI EM Bull Plus ETF 5 0 0.43 822 1.15 - N # ZPL CN BMO Long Provincial Bond Index 10 - 0.45 - 0.28 - NHJD CN Horizons BetaPro MSCI EM Bear Plus ETF 1 0 0.72 822 1.15 - N # RQH CN RBC Target 2020 Corporate Bond 10 0 0.33 - 0.34 - NXEC CN iShares MSCI EM - - - - 0.35 - N # RQA CN RBC Target 2013 Corporate Bond 9 0 0.30 - 0.34 - N
# ZXA CN BMO 2013 Corporate Bond Target Maturity 9 0 0.77 - 0.30 - N# HAF CN³ Horizons Active Advantage Yield ETF 8 0 1.26 - 0.45 - N# HTD CN Horizons BetaPro US 30-yr Bond Bear Plus 8 0 0.73 - 1.15 - N
II/U CN iPath Optimized Currency Carry ETN 17 - - - 0.65 - N # HUF/U CN Horizons Active US Floating Rate Bond 8 0 0.35 - 0.40 - NDLR CN Horizons U.S. Dollar Currency ETF 7 0 0.32 - 0.45 - N # HUF/V CN Horizons Active US Floating Rate Bond 8 - - - 0.90 - NDLR/U CN Horizons U.S. Dollar Currency ETF 7 0 0.20 - 0.45 - N # ZMP CN BMO Mid Provincial Bond Index 6 - 0.50 - 0.28 - NERO/U CN iPath EUR/USD Exchange Rate ETN 6 - - - 0.40 - N # EXM CN³ First Asset Morningstar EM 6 0 0.82 - - - NASD CN Horizons Australian Dollar Currency ETF 5 0 0.43 - 0.45 - N # FFL CN iPath US Treasury Flattener ETN 5 0 - - 0.75 - NHDD CN Horizons BetaPro US Dollar Bear Plus ETF 4 0 1.72 - 1.15 - N # RQI CN RBC Target 2021 Corporate Bond 4 0 0.36 - 0.34 - NHDU CN Horizons BetaPro US Dollar Bull Plus ETF 2 0 2.75 - 1.15 - N # CXF CN³ First Asset Canandian Convertible Bond 4 0 1.60 - 0.65 - NJYN/U CN iPath JPY/USD Exchange Rate ETN 2 - - - 0.40 - N # ZXD CN BMO 2025 Corporate Bond Target Maturity 3 0 0.51 - 0.35 - N
# ZXC CN BMO 2020 Corporate Bond Target Maturity 3 0 0.73 - 0.35 - N# ZIC/U CN BMO Mid-Term US IG Corporate Bond 3 - 0.73 - 0.28 - N# PXF CN First Asset DEX Provincial Bond 2 - 1.09 - 0.50 - N
Canada Listed ETFs Canada Listed ETFs
International Fixed Income Funds
Currency Funds
1 Option Liquidity (H / M / L / N - High / Medium / Low / None)2 / - Significant increase / decrease in shares outstanding in last one year³ Advisor units also exist for the fund.
Canada & Latin America Listed ETFs
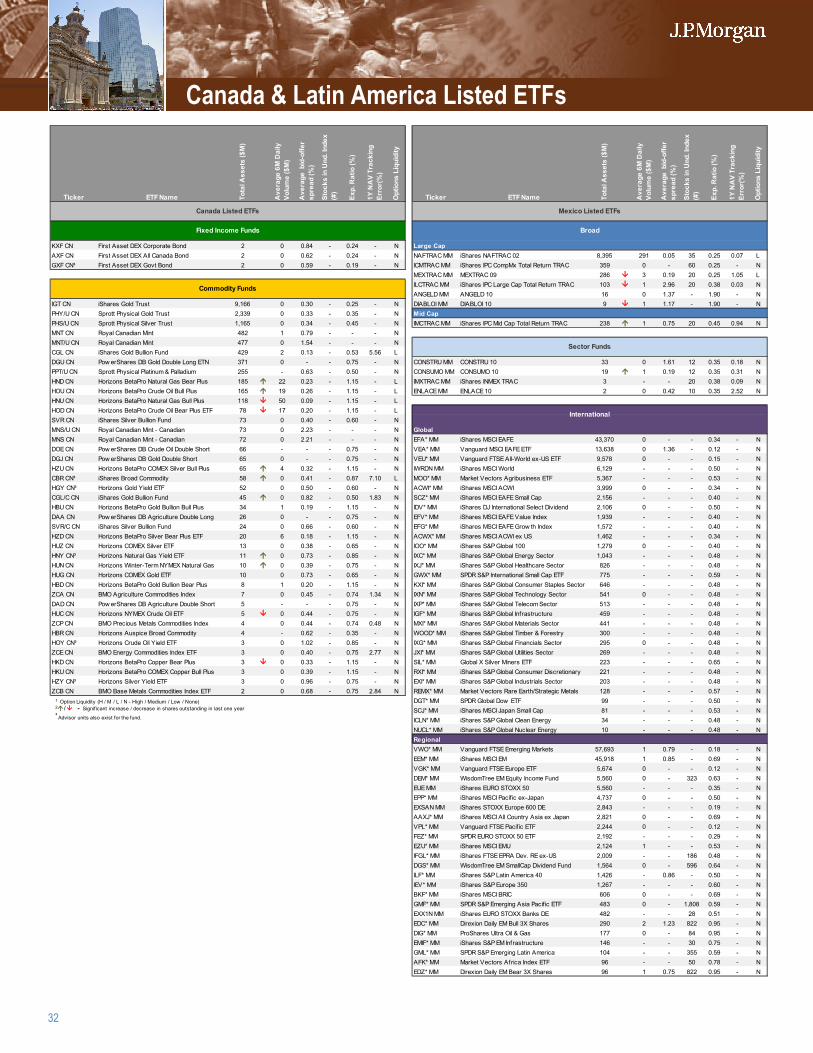
32
Ticker ETF Name Tota
l Ass
ets
($M
)
Ave
rage
6M
Dai
ly
Volu
me
($M
)
Ave
rage
bid
-offe
r sp
read
(%)
Stoc
ks in
Und
. Ind
ex
(#)
Exp.
Rat
io (%
)
1Y N
AV
Trac
king
Er
ror(
%)
Opt
ions
Liq
uidi
ty
Ticker ETF Name Tota
l Ass
ets
($M
)
Ave
rage
6M
Dai
ly
Volu
me
($M
)
Ave
rage
bid
-offe
r sp
read
(%)
Stoc
ks in
Und
. Ind
ex
(#)
Exp.
Rat
io (%
)
1Y N
AV
Trac
king
Er
ror(
%)
Opt
ions
Liq
uidi
ty
1
2
3
4
KXF CN First Asset DEX Corporate Bond 2 0 0.84 - 0.24 - N 5 Large CapAXF CN First Asset DEX All Canada Bond 2 0 0.62 - 0.24 - N 6 NAFTRAC MM iShares NAFTRAC 02 8,395 291 0.05 35 0.25 0.07 LGXF CN³ First Asset DEX Govt Bond 2 0 0.59 - 0.19 - N 7 ICMTRAC MM iShares IPC CompMx Total Return TRAC 359 0 - 60 0.25 - N
8 MEXTRAC MM MEXTRAC 09 286 3 0.19 20 0.25 1.05 L9 ILCTRAC MM iShares IPC Large Cap Total Return TRAC 103 1 2.96 20 0.38 0.03 N# ANGELD MM ANGELD 10 16 0 1.37 - 1.90 - N
IGT CN iShares Gold Trust 9,166 0 0.30 - 0.25 - N 11 DIABLOI MM DIABLOI 10 9 1 1.17 - 1.90 - NPHY/U CN Sprott Physical Gold Trust 2,339 0 0.33 - 0.35 - N # Mid CapPHS/U CN Sprott Physical Silver Trust 1,165 0 0.34 - 0.45 - N # IMCTRAC MM iShares IPC Mid Cap Total Return TRAC 238 1 0.75 20 0.45 0.94 NMNT CN Royal Canadian Mint 482 1 0.79 - - - N #
MNT/U CN Royal Canadian Mint 477 0 1.54 - - - N #
CGL CN iShares Gold Bullion Fund 429 2 0.13 - 0.53 5.56 L #
DGU CN Pow erShares DB Gold Double Long ETN 371 0 - - 0.75 - N # CONSTRU MM CONSTRU 10 33 0 1.61 12 0.35 0.18 NPPT/U CN Sprott Physical Platinum & Palladium 255 - 0.63 - 0.50 - N # CONSUMO MM CONSUMO 10 19 1 0.19 12 0.35 0.31 NHND CN Horizons BetaPro Natural Gas Bear Plus 185 22 0.23 - 1.15 - L # IMXTRAC MM iShares INMEX TRAC 3 - - 20 0.38 0.09 NHOU CN Horizons BetaPro Crude Oil Bull Plus 165 19 0.26 - 1.15 - L # ENLACE MM ENLACE 10 2 0 0.42 10 0.35 2.52 NHNU CN Horizons BetaPro Natural Gas Bull Plus 118 50 0.09 - 1.15 - L #
HOD CN Horizons BetaPro Crude Oil Bear Plus ETF 78 17 0.20 - 1.15 - L #
SVR CN iShares Silver Bullion Fund 73 0 0.40 - 0.60 - N #
MNS/U CN Royal Canadian Mint - Canadian 73 0 2.23 - - - N # GlobalMNS CN Royal Canadian Mint - Canadian 72 0 2.21 - - - N # EFA* MM iShares MSCI EAFE 43,370 0 - - 0.34 - NDOE CN Pow erShares DB Crude Oil Double Short 66 - - - 0.75 - N # VEA* MM Vanguard MSCI EAFE ETF 13,638 0 1.36 - 0.12 - NDGJ CN Pow erShares DB Gold Double Short 65 0 - - 0.75 - N # VEU* MM Vanguard FTSE All-World ex-US ETF 9,578 0 - - 0.15 - NHZU CN Horizons BetaPro COMEX Silver Bull Plus 65 4 0.32 - 1.15 - N # IWRDN MM iShares MSCI World 6,129 - - - 0.50 - NCBR CN³ iShares Broad Commodity 58 0 0.41 - 0.87 7.10 L # MOO* MM Market Vectors Agribusiness ETF 5,367 - - - 0.53 - NHGY CN³ Horizons Gold Yield ETF 52 0 0.50 - 0.60 - N # ACWI* MM iShares MSCI ACWI 3,999 0 - - 0.34 - NCGL/C CN iShares Gold Bullion Fund 45 0 0.82 - 0.50 1.83 N # SCZ* MM iShares MSCI EAFE Small Cap 2,156 - - - 0.40 - NHBU CN Horizons BetaPro Gold Bullion Bull Plus 34 1 0.19 - 1.15 - N # IDV* MM iShares DJ International Select Dividend 2,106 0 - - 0.50 - NDAA CN Pow erShares DB Agriculture Double Long 26 0 - - 0.75 - N # EFV* MM iShares MSCI EAFE Value Index 1,939 - - - 0.40 - NSVR/C CN iShares Silver Bullion Fund 24 0 0.66 - 0.60 - N # EFG* MM iShares MSCI EAFE Grow th Index 1,572 - - - 0.40 - NHZD CN Horizons BetaPro Silver Bear Plus ETF 20 6 0.18 - 1.15 - N # ACWX* MM iShares MSCI ACWI ex US 1,462 - - - 0.34 - NHUZ CN Horizons COMEX Silver ETF 13 0 0.38 - 0.65 - N # IOO* MM iShares S&P Global 100 1,279 0 - - 0.40 - NHNY CN³ Horizons Natural Gas Yield ETF 11 0 0.73 - 0.85 - N # IXC* MM iShares S&P Global Energy Sector 1,043 - - - 0.48 - NHUN CN Horizons Winter-Term NYMEX Natural Gas 10 0 0.39 - 0.75 - N # IXJ* MM iShares S&P Global Healthcare Sector 826 - - - 0.48 - NHUG CN Horizons COMEX Gold ETF 10 0 0.73 - 0.65 - N # GWX* MM SPDR S&P International Small Cap ETF 775 - - - 0.59 - NHBD CN Horizons BetaPro Gold Bullion Bear Plus 8 1 0.20 - 1.15 - N # KXI* MM iShares S&P Global Consumer Staples Sector 646 - - - 0.48 - NZCA CN BMO Agriculture Commodities Index 7 0 0.45 - 0.74 1.34 N # IXN* MM iShares S&P Global Technology Sector 541 0 - - 0.48 - NDAD CN Pow erShares DB Agriculture Double Short 5 - - - 0.75 - N # IXP* MM iShares S&P Global Telecom Sector 513 - - - 0.48 - NHUC CN Horizons NYMEX Crude Oil ETF 5 0 0.44 - 0.75 - N # IGF* MM iShares S&P Global Infrastructure 459 - - - 0.48 - NZCP CN BMO Precious Metals Commodities Index 4 0 0.44 - 0.74 0.48 N # MXI* MM iShares S&P Global Materials Sector 441 - - - 0.48 - NHBR CN Horizons Auspice Broad Commodity 4 - 0.62 - 0.35 - N # WOOD* MM iShares S&P Global Timber & Forestry 300 - - - 0.48 - NHOY CN³ Horizons Crude Oil Yield ETF 3 0 1.02 - 0.85 - N # IXG* MM iShares S&P Global Financials Sector 295 0 - - 0.48 - NZCE CN BMO Energy Commodities Index ETF 3 0 0.40 - 0.75 2.77 N # JXI* MM iShares S&P Global Utilities Sector 269 - - - 0.48 - NHKD CN Horizons BetaPro Copper Bear Plus 3 0 0.33 - 1.15 - N # SIL* MM Global X Silver Miners ETF 223 - - - 0.65 - NHKU CN Horizons BetaPro COMEX Copper Bull Plus 3 0 0.39 - 1.15 - N # RXI* MM iShares S&P Global Consumer Discretionary 221 - - - 0.48 - NHZY CN³ Horizons Silver Yield ETF 3 0 0.96 - 0.75 - N # EXI* MM iShares S&P Global Industrials Sector 203 - - - 0.48 - NZCB CN BMO Base Metals Commodities Index ETF 2 0 0.68 - 0.75 2.84 N # REMX* MM Market Vectors Rare Earth/Strategic Metals 128 - - - 0.57 - N
# DGT* MM SPDR Global Dow ETF 99 - - - 0.50 - N# SCJ* MM iShares MSCI Japan Small Cap 81 - - - 0.53 - N# ICLN* MM iShares S&P Global Clean Energy 34 - - - 0.48 - N# NUCL* MM iShares S&P Global Nuclear Energy 10 - - - 0.48 - N# Regional# VWO* MM Vanguard FTSE Emerging Markets 57,693 1 0.79 - 0.18 - N# EEM* MM iShares MSCI EM 45,918 1 0.85 - 0.69 - N# VGK* MM Vanguard FTSE Europe ETF 5,674 0 - - 0.12 - N# DEM* MM WisdomTree EM Equity Income Fund 5,560 0 - 323 0.63 - N# EUE MM iShares EURO STOXX 50 5,560 - - - 0.35 - N# EPP* MM iShares MSCI Pacif ic ex-Japan 4,737 0 - - 0.50 - N# EXSAN MM iShares STOXX Europe 600 DE 2,843 - - - 0.19 - N# AAXJ* MM iShares MSCI All Country Asia ex Japan 2,821 0 - - 0.69 - N# VPL* MM Vanguard FTSE Pacif ic ETF 2,244 0 - - 0.12 - N# FEZ* MM SPDR EURO STOXX 50 ETF 2,192 - - - 0.29 - N# EZU* MM iShares MSCI EMU 2,124 1 - - 0.53 - N# IFGL* MM iShares FTSE EPRA Dev. RE ex-US 2,009 - - 186 0.48 - N# DGS* MM WisdomTree EM SmallCap Dividend Fund 1,564 0 - 596 0.64 - N# ILF* MM iShares S&P Latin America 40 1,426 - 0.86 - 0.50 - N# IEV* MM iShares S&P Europe 350 1,267 - - - 0.60 - N# BKF* MM iShares MSCI BRIC 606 0 - - 0.69 - N# GMF* MM SPDR S&P Emerging Asia Pacif ic ETF 483 0 - 1,808 0.59 - N# EXX1N MM iShares EURO STOXX Banks DE 482 - - 28 0.51 - N# EDC* MM Direxion Daily EM Bull 3X Shares 290 2 1.23 822 0.95 - N# DIG* MM ProShares Ultra Oil & Gas 177 0 - 84 0.95 - N# EMIF* MM iShares S&P EM Infrastructure 146 - - 30 0.75 - N# GML* MM SPDR S&P Emerging Latin America 104 - - 355 0.59 - N# AFK* MM Market Vectors Africa Index ETF 96 - - 50 0.78 - N# EDZ* MM Direxion Daily EM Bear 3X Shares 96 1 0.75 822 0.95 - N
Canada Listed ETFs Mexico Listed ETFs
Fixed Income Funds Broad
Commodity Funds
Sector Funds
International
1 Option Liquidity (H / M / L / N - High / Medium / Low / None)2 / - Significant increase / decrease in shares outstanding in last one year³ Advisor units also exist for the fund.
Canada & Latin America Listed ETFs
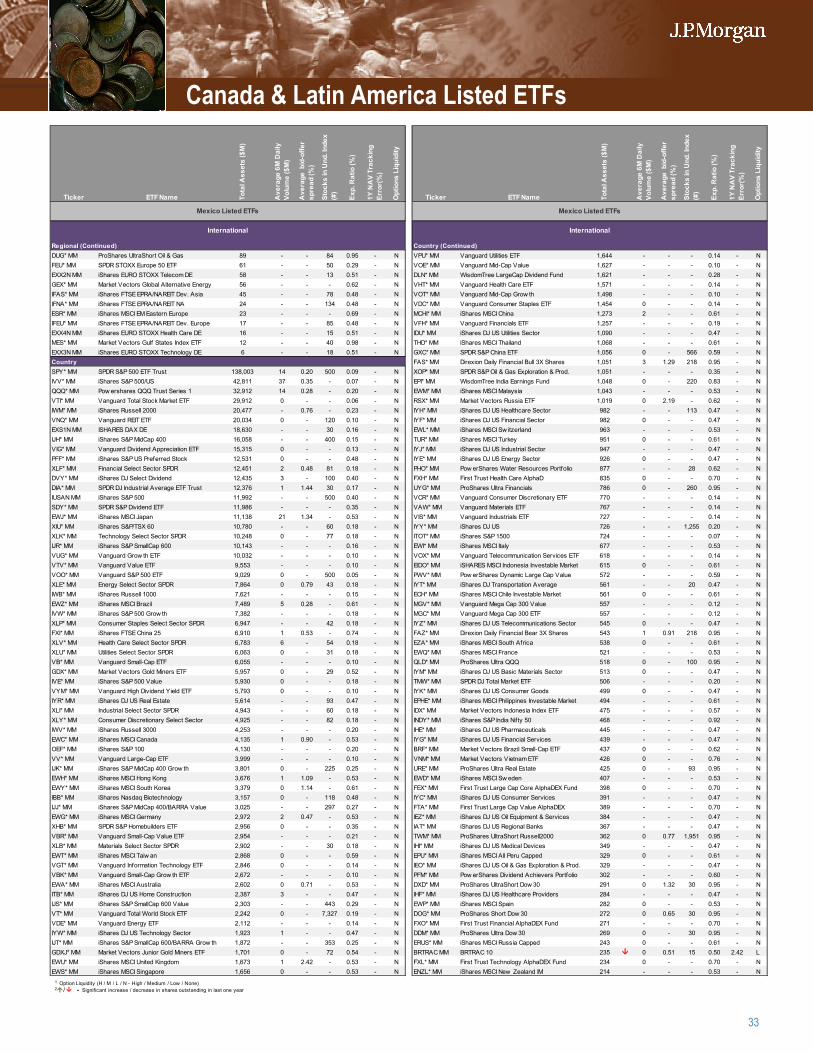
33
Ticker ETF Name Tota
l Ass
ets
($M
)
Ave
rage
6M
Dai
ly
Volu
me
($M
)
Ave
rage
bid
-offe
r sp
read
(%)
Stoc
ks in
Und
. Ind
ex
(#)
Exp.
Rat
io (%
)
1Y N
AV
Trac
king
Er
ror(
%)
Opt
ions
Liq
uidi
ty
Ticker ETF Name Tota
l Ass
ets
($M
)
Ave
rage
6M
Dai
ly
Volu
me
($M
)
Ave
rage
bid
-offe
r sp
read
(%)
Stoc
ks in
Und
. Ind
ex
(#)
Exp.
Rat
io (%
)
1Y N
AV
Trac
king
Er
ror(
%)
Opt
ions
Liq
uidi
ty
1
2
3
4
Regional (Continued) 5 Country (Continued)DUG* MM ProShares UltraShort Oil & Gas 89 - - 84 0.95 - N 6 VPU* MM Vanguard Utilities ETF 1,644 - - - 0.14 - NFEU* MM SPDR STOXX Europe 50 ETF 61 - - 50 0.29 - N 7 VOE* MM Vanguard Mid-Cap Value 1,627 - - - 0.10 - NEXX2N MM iShares EURO STOXX Telecom DE 58 - - 13 0.51 - N 8 DLN* MM WisdomTree LargeCap Dividend Fund 1,621 - - - 0.28 - NGEX* MM Market Vectors Global Alternative Energy 56 - - - 0.62 - N 9 VHT* MM Vanguard Health Care ETF 1,571 - - - 0.14 - NIFAS* MM iShares FTSE EPRA/NAREIT Dev. Asia 45 - - 78 0.48 - N # VOT* MM Vanguard Mid-Cap Grow th 1,498 - - - 0.10 - NIFNA* MM iShares FTSE EPRA/NAREIT NA 24 - - 134 0.48 - N 11 VDC* MM Vanguard Consumer Staples ETF 1,454 0 - - 0.14 - NESR* MM iShares MSCI EM Eastern Europe 23 - - - 0.69 - N # MCHI* MM iShares MSCI China 1,273 2 - - 0.61 - NIFEU* MM iShares FTSE EPRA/NAREIT Dev. Europe 17 - - 85 0.48 - N # VFH* MM Vanguard Financials ETF 1,257 - - - 0.19 - NEXX4N MM iShares EURO STOXX Health Care DE 16 - - 15 0.51 - N # IDU* MM iShares DJ US Utilities Sector 1,090 - - - 0.47 - NMES* MM Market Vectors Gulf States Index ETF 12 - - 40 0.98 - N # THD* MM iShares MSCI Thailand 1,068 - - - 0.61 - NEXX3N MM iShares EURO STOXX Technology DE 6 - - 18 0.51 - N # GXC* MM SPDR S&P China ETF 1,056 0 - 566 0.59 - NCountry # FAS* MM Direxion Daily Financial Bull 3X Shares 1,051 3 1.29 218 0.95 - NSPY* MM SPDR S&P 500 ETF Trust 138,003 14 0.20 500 0.09 - N # XOP* MM SPDR S&P Oil & Gas Exploration & Prod. 1,051 - - - 0.35 - NIVV* MM iShares S&P 500/US 42,811 37 0.35 - 0.07 - N # EPI* MM WisdomTree India Earnings Fund 1,048 0 - 220 0.83 - NQQQ* MM Pow ershares QQQ Trust Series 1 32,912 14 0.28 - 0.20 - N # EWM* MM iShares MSCI Malaysia 1,043 - - - 0.53 - NVTI* MM Vanguard Total Stock Market ETF 29,912 0 - - 0.06 - N # RSX* MM Market Vectors Russia ETF 1,019 0 2.19 - 0.62 - NIWM* MM iShares Russell 2000 20,477 - 0.76 - 0.23 - N # IYH* MM iShares DJ US Healthcare Sector 982 - - 113 0.47 - NVNQ* MM Vanguard REIT ETF 20,034 0 - 120 0.10 - N # IYF* MM iShares DJ US Financial Sector 982 0 - - 0.47 - NEXS1N MM ISHARES DAX DE 18,630 - - 30 0.16 - N # EWL* MM iShares MSCI Sw itzerland 963 - - - 0.53 - NIJH* MM iShares S&P MidCap 400 16,058 - - 400 0.15 - N # TUR* MM iShares MSCI Turkey 951 0 - - 0.61 - NVIG* MM Vanguard Dividend Appreciation ETF 15,315 0 - - 0.13 - N # IYJ* MM iShares DJ US Industrial Sector 947 - - - 0.47 - NPFF* MM iShares S&P US Preferred Stock 12,531 0 - - 0.48 - N # IYE* MM iShares DJ US Energy Sector 926 0 - - 0.47 - NXLF* MM Financial Select Sector SPDR 12,451 2 0.48 81 0.18 - N # PHO* MM Pow erShares Water Resources Portfolio 877 - - 28 0.62 - NDVY* MM iShares DJ Select Dividend 12,435 3 - 100 0.40 - N # FXH* MM First Trust Health Care AlphaD 835 0 - - 0.70 - NDIA* MM SPDR DJ Industrial Average ETF Trust 12,376 1 1.44 30 0.17 - N # UYG* MM ProShares Ultra Financials 786 0 - 260 0.95 - NIUSAN MM iShares S&P 500 11,992 - - 500 0.40 - N # VCR* MM Vanguard Consumer Discretionary ETF 770 - - - 0.14 - NSDY* MM SPDR S&P Dividend ETF 11,986 - - - 0.35 - N # VAW* MM Vanguard Materials ETF 767 - - - 0.14 - NEWJ* MM iShares MSCI Japan 11,138 21 1.34 - 0.53 - N # VIS* MM Vanguard Industrials ETF 727 - - - 0.14 - NXIU* MM iShares S&P/TSX 60 10,780 - - 60 0.18 - N # IYY* MM iShares DJ US 726 - - 1,255 0.20 - NXLK* MM Technology Select Sector SPDR 10,248 0 - 77 0.18 - N # ITOT* MM iShares S&P 1500 724 - - - 0.07 - NIJR* MM iShares S&P SmallCap 600 10,143 - - - 0.16 - N # EWI* MM iShares MSCI Italy 677 - - - 0.53 - NVUG* MM Vanguard Grow th ETF 10,032 - - - 0.10 - N # VOX* MM Vanguard Telecommunication Services ETF 618 - - - 0.14 - NVTV* MM Vanguard Value ETF 9,553 - - - 0.10 - N # EIDO* MM iSHARES MSCI Indonesia Investable Market 615 0 - - 0.61 - NVOO* MM Vanguard S&P 500 ETF 9,029 0 - 500 0.05 - N # PWV* MM Pow erShares Dynamic Large Cap Value 572 - - - 0.59 - NXLE* MM Energy Select Sector SPDR 7,864 0 0.79 43 0.18 - N # IYT* MM iShares DJ Transportation Average 561 - - 20 0.47 - NIWB* MM iShares Russell 1000 7,621 - - - 0.15 - N # ECH* MM iShares MSCI Chile Investable Market 561 0 - - 0.61 - NEWZ* MM iShares MSCI Brazil 7,489 5 0.28 - 0.61 - N # MGV* MM Vanguard Mega Cap 300 Value 557 - - - 0.12 - NIVW* MM iShares S&P 500 Grow th 7,382 - - - 0.18 - N # MGC* MM Vanguard Mega Cap 300 ETF 557 - - - 0.12 - NXLP* MM Consumer Staples Select Sector SPDR 6,947 - - 42 0.18 - N # IYZ* MM iShares DJ US Telecommunications Sector 545 0 - - 0.47 - NFXI* MM iShares FTSE China 25 6,910 1 0.53 - 0.74 - N # FAZ* MM Direxion Daily Financial Bear 3X Shares 543 1 0.91 218 0.95 - NXLV* MM Health Care Select Sector SPDR 6,783 6 - 54 0.18 - N # EZA* MM iShares MSCI South Africa 538 0 - - 0.61 - NXLU* MM Utilities Select Sector SPDR 6,063 0 - 31 0.18 - N # EWQ* MM iShares MSCI France 521 - - - 0.53 - NVB* MM Vanguard Small-Cap ETF 6,055 - - - 0.10 - N # QLD* MM ProShares Ultra QQQ 518 0 - 100 0.95 - NGDX* MM Market Vectors Gold Miners ETF 5,957 0 - 29 0.52 - N # IYM* MM iShares DJ US Basic Materials Sector 513 0 - - 0.47 - NIVE* MM iShares S&P 500 Value 5,930 0 - - 0.18 - N # TMW* MM SPDR DJ Total Market ETF 506 - - - 0.20 - NVYM* MM Vanguard High Dividend Yield ETF 5,793 0 - - 0.10 - N # IYK* MM iShares DJ US Consumer Goods 499 0 - - 0.47 - NIYR* MM iShares DJ US Real Estate 5,614 - - 93 0.47 - N # EPHE* MM iShares MSCI Philippines Investable Market 494 - - - 0.61 - NXLI* MM Industrial Select Sector SPDR 4,943 - - 60 0.18 - N # IDX* MM Market Vectors Indonesia Index ETF 475 - - - 0.57 - NXLY* MM Consumer Discretionary Select Sector 4,925 - - 82 0.18 - N # INDY* MM iShares S&P India Nifty 50 468 - - - 0.92 - NIWV* MM iShares Russell 3000 4,253 - - - 0.20 - N # IHE* MM iShares DJ US Pharmaceuticals 445 - - - 0.47 - NEWC* MM iShares MSCI Canada 4,135 1 0.90 - 0.53 - N # IYG* MM iShares DJ US Financial Services 439 - - - 0.47 - NOEF* MM iShares S&P 100 4,130 - - - 0.20 - N # BRF* MM Market Vectors Brazil Small-Cap ETF 437 0 - - 0.62 - NVV* MM Vanguard Large-Cap ETF 3,999 - - - 0.10 - N # VNM* MM Market Vectors Vietnam ETF 426 0 - - 0.76 - NIJK* MM iShares S&P MidCap 400 Grow th 3,801 0 - 225 0.25 - N # URE* MM ProShares Ultra Real Estate 425 0 - 93 0.95 - NEWH* MM iShares MSCI Hong Kong 3,676 1 1.09 - 0.53 - N # EWD* MM iShares MSCI Sw eden 407 - - - 0.53 - NEWY* MM iShares MSCI South Korea 3,379 0 1.14 - 0.61 - N # FEX* MM First Trust Large Cap Core AlphaDEX Fund 398 0 - - 0.70 - NIBB* MM iShares Nasdaq Biotechnology 3,157 0 - 118 0.48 - N # IYC* MM iShares DJ US Consumer Services 391 - - - 0.47 - NIJJ* MM iShares S&P MidCap 400/BARRA Value 3,025 - - 297 0.27 - N # FTA* MM First Trust Large Cap Value AlphaDEX 389 - - - 0.70 - NEWG* MM iShares MSCI Germany 2,972 2 0.47 - 0.53 - N # IEZ* MM iShares DJ US Oil Equipment & Services 384 - - - 0.47 - NXHB* MM SPDR S&P Homebuilders ETF 2,956 0 - - 0.35 - N # IAT* MM iShares DJ US Regional Banks 367 - - - 0.47 - NVBR* MM Vanguard Small-Cap Value ETF 2,954 - - - 0.21 - N # TWM* MM ProShares UltraShort Russell2000 362 0 0.77 1,951 0.95 - NXLB* MM Materials Select Sector SPDR 2,902 - - 30 0.18 - N # IHI* MM iShares DJ US Medical Devices 349 - - - 0.47 - NEWT* MM iShares MSCI Taiw an 2,868 0 - - 0.59 - N # EPU* MM iShares MSCI All Peru Capped 329 0 - - 0.61 - NVGT* MM Vanguard Information Technology ETF 2,846 0 - - 0.14 - N # IEO* MM iShares DJ US Oil & Gas Exploration & Prod. 329 - - - 0.47 - NVBK* MM Vanguard Small-Cap Grow th ETF 2,672 - - - 0.10 - N # PFM* MM Pow erShares Dividend Achievers Portfolio 302 - - - 0.60 - NEWA* MM iShares MSCI Australia 2,602 0 0.71 - 0.53 - N # DXD* MM ProShares UltraShort Dow 30 291 0 1.32 30 0.95 - NITB* MM iShares DJ US Home Construction 2,387 3 - - 0.47 - N # IHF* MM iShares DJ US Healthcare Providers 284 - - - 0.47 - NIJS* MM iShares S&P SmallCap 600 Value 2,303 - - 443 0.29 - N # EWP* MM iShares MSCI Spain 282 0 - - 0.53 - NVT* MM Vanguard Total World Stock ETF 2,242 0 - 7,327 0.19 - N # DOG* MM ProShares Short Dow 30 272 0 0.65 30 0.95 - NVDE* MM Vanguard Energy ETF 2,112 - - - 0.14 - N # FXO* MM First Trust Financial AlphaDEX Fund 271 - - - 0.70 - NIYW* MM iShares DJ US Technology Sector 1,923 1 - - 0.47 - N # DDM* MM ProShares Ultra Dow 30 269 0 - 30 0.95 - NIJT* MM iShares S&P SmallCap 600/BARRA Grow th 1,872 - - 353 0.25 - N # ERUS* MM iShares MSCI Russia Capped 243 0 - - 0.61 - NGDXJ* MM Market Vectors Junior Gold Miners ETF 1,701 0 - 72 0.54 - N # BRTRAC MM BRTRAC 10 235 0 0.51 15 0.50 2.42 LEWU* MM iShares MSCI United Kingdom 1,673 1 2.42 - 0.53 - N # FXL* MM First Trust Technology AlphaDEX Fund 234 0 - - 0.70 - NEWS* MM iShares MSCI Singapore 1,656 0 - - 0.53 - N # ENZL* MM iShares MSCI New Zealand IM 214 - - - 0.53 - N
International International
Mexico Listed ETFs Mexico Listed ETFs
1 Option Liquidity (H / M / L / N - High / Medium / Low / None)2 / - Significant increase / decrease in shares outstanding in last one year
Canada & Latin America Listed ETFs
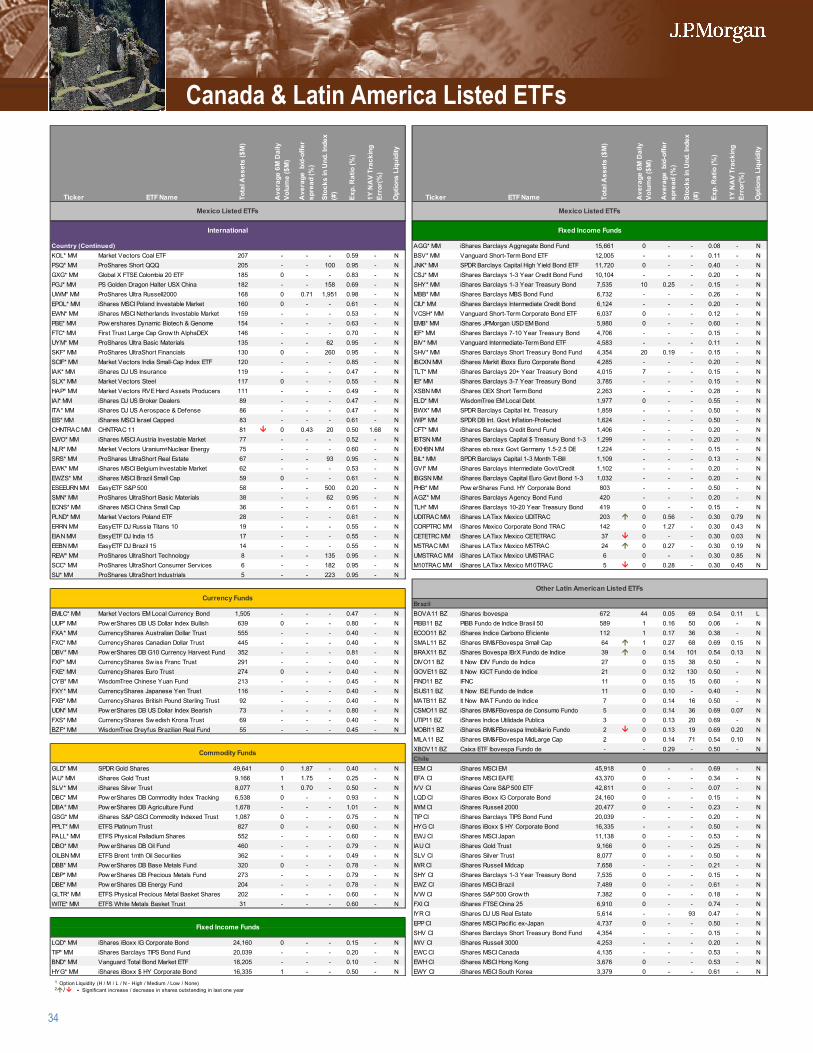
34
Ticker ETF Name Tota
l Ass
ets
($M
)
Ave
rage
6M
Dai
ly
Volu
me
($M
)
Ave
rage
bid
-offe
r sp
read
(%)
Stoc
ks in
Und
. Ind
ex
(#)
Exp.
Rat
io (%
)
1Y N
AV
Trac
king
Er
ror(
%)
Opt
ions
Liq
uidi
ty
Ticker ETF Name Tota
l Ass
ets
($M
)
Ave
rage
6M
Dai
ly
Volu
me
($M
)
Ave
rage
bid
-offe
r sp
read
(%)
Stoc
ks in
Und
. Ind
ex
(#)
Exp.
Rat
io (%
)
1Y N
AV
Trac
king
Er
ror(
%)
Opt
ions
Liq
uidi
ty
1
2
3
4
Country (Continued) 5 AGG* MM iShares Barclays Aggregate Bond Fund 15,661 0 - - 0.08 - NKOL* MM Market Vectors Coal ETF 207 - - - 0.59 - N 6 BSV* MM Vanguard Short-Term Bond ETF 12,005 - - - 0.11 - NPSQ* MM ProShares Short QQQ 205 - - 100 0.95 - N 7 JNK* MM SPDR Barclays Capital High Yield Bond ETF 11,720 0 - - 0.40 - NGXG* MM Global X FTSE Colombia 20 ETF 185 0 - - 0.83 - N 8 CSJ* MM iShares Barclays 1-3 Year Credit Bond Fund 10,104 - - - 0.20 - NPGJ* MM PS Golden Dragon Halter USX China 182 - - 158 0.69 - N 9 SHY* MM iShares Barclays 1-3 Year Treasury Bond 7,535 10 0.25 - 0.15 - NUWM* MM ProShares Ultra Russell2000 168 0 0.71 1,951 0.98 - N # MBB* MM iShares Barclays MBS Bond Fund 6,732 - - - 0.26 - NEPOL* MM iShares MSCI Poland Investable Market 160 0 - - 0.61 - N 11 CIU* MM iShares Barclays Intermediate Credit Bond 6,124 - - - 0.20 - NEWN* MM iShares MSCI Netherlands Investable Market 159 - - - 0.53 - N # VCSH* MM Vanguard Short-Term Corporate Bond ETF 6,037 0 - - 0.12 - NPBE* MM Pow ershares Dynamic Biotech & Genome 154 - - - 0.63 - N # EMB* MM iShares JPMorgan USD EM Bond 5,980 0 - - 0.60 - NFTC* MM First Trust Large Cap Grow th AlphaDEX 146 - - - 0.70 - N # IEF* MM iShares Barclays 7-10 Year Treasury Bond 4,706 - - - 0.15 - NUYM* MM ProShares Ultra Basic Materials 135 - - 62 0.95 - N # BIV* MM Vanguard Intermediate-Term Bond ETF 4,583 - - - 0.11 - NSKF* MM ProShares UltraShort Financials 130 0 - 260 0.95 - N # SHV* MM iShares Barclays Short Treasury Bond Fund 4,354 20 0.19 - 0.15 - NSCIF* MM Market Vectors India Small-Cap Index ETF 120 - - - 0.85 - N # IBCXN MM iShares Markit iBoxx Euro Corporate Bond 4,285 - - - 0.20 - NIAK* MM iShares DJ US Insurance 119 - - - 0.47 - N # TLT* MM iShares Barclays 20+ Year Treasury Bond 4,015 7 - - 0.15 - NSLX* MM Market Vectors Steel 117 0 - - 0.55 - N # IEI* MM iShares Barclays 3-7 Year Treasury Bond 3,785 - - - 0.15 - NHAP* MM Market Vectors RVE Hard Assets Producers 111 - - - 0.49 - N # XSBN MM iShares DEX Short Term Bond 2,263 - - - 0.28 - NIAI* MM iShares DJ US Broker Dealers 89 - - - 0.47 - N # ELD* MM WisdomTree EM Local Debt 1,977 0 - - 0.55 - NITA* MM iShares DJ US Aerospace & Defense 86 - - - 0.47 - N # BWX* MM SPDR Barclays Capital Int. Treasury 1,859 - - - 0.50 - NEIS* MM iShares MSCI Israel Capped 83 - - - 0.61 - N # WIP* MM SPDR DB Int. Govt Inflation-Protected 1,624 - - - 0.50 - NCHNTRAC MM CHNTRAC 11 81 0 0.43 20 0.50 1.68 N # CFT* MM iShares Barclays Credit Bond Fund 1,406 - - - 0.20 - NEWO* MM iShares MSCI Austria Investable Market 77 - - - 0.52 - N # IBTSN MM iShares Barclays Capital $ Treasury Bond 1-3 1,299 - - - 0.20 - NNLR* MM Market Vectors Uranium+Nuclear Energy 75 - - - 0.60 - N # EXHBN MM iShares eb.rexx Govt Germany 1.5-2.5 DE 1,224 - - - 0.15 - NSRS* MM ProShares UltraShort Real Estate 67 - - 93 0.95 - N # BIL* MM SPDR Barclays Capital 1-3 Month T-Bill 1,109 - - - 0.13 - NEWK* MM iShares MSCI Belgium Investable Market 62 - - - 0.53 - N # GVI* MM iShares Barclays Intermediate Govt/Credit 1,102 - - - 0.20 - NEWZS* MM iShares MSCI Brazil Small Cap 59 0 - - 0.61 - N # IBGSN MM iShares Barclays Capital Euro Govt Bond 1-3 1,032 - - - 0.20 - NESEEURN MM EasyETF S&P 500 58 - - 500 0.20 - N # PHB* MM Pow erShares Fund. HY Corporate Bond 803 - - - 0.50 - NSMN* MM ProShares UltraShort Basic Materials 38 - - 62 0.95 - N # AGZ* MM iShares Barclays Agency Bond Fund 420 - - - 0.20 - NECNS* MM iShares MSCI China Small Cap 36 - - - 0.61 - N # TLH* MM iShares Barclays 10-20 Year Treasury Bond 419 0 - - 0.15 - NPLND* MM Market Vectors Poland ETF 28 - - - 0.61 - N # UDITRAC MM iShares LATixx Mexico UDITRAC 203 0 0.56 - 0.30 0.79 NERRN MM EasyETF DJ Russia Titans 10 19 - - - 0.55 - N # CORPTRC MM iShares Mexico Corporate Bond TRAC 142 0 1.27 - 0.30 0.43 NEIAN MM EasyETF DJ India 15 17 - - - 0.55 - N # CETETRC MM iShares LATixx Mexico CETETRAC 37 0 - - 0.30 0.03 NEEBN MM EasyETF DJ Brazil 15 14 - - - 0.55 - N # M5TRAC MM iShares LATixx Mexico M5TRAC 24 0 0.27 - 0.30 0.19 NREW* MM ProShares UltraShort Technology 8 - - 135 0.95 - N # UMSTRAC MM iShares LATixx Mexico UMSTRAC 6 0 - - 0.30 0.85 NSCC* MM ProShares UltraShort Consumer Services 6 - - 182 0.95 - N # M10TRAC MM iShares LATixx Mexico M10TRAC 5 0 0.28 - 0.30 0.45 NSIJ* MM ProShares UltraShort Industrials 5 - - 223 0.95 - N #
#
#
# BrazilEMLC* MM Market Vectors EM Local Currency Bond 1,505 - - - 0.47 - N # BOVA11 BZ iShares Ibovespa 672 44 0.05 69 0.54 0.11 LUUP* MM Pow erShares DB US Dollar Index Bullish 639 0 - - 0.80 - N # PIBB11 BZ PIBB Fundo de Indice Brasil 50 589 1 0.16 50 0.06 - NFXA* MM CurrencyShares Australian Dollar Trust 555 - - - 0.40 - N # ECOO11 BZ iShares Indice Carbono Eficiente 112 1 0.17 36 0.38 - NFXC* MM CurrencyShares Canadian Dollar Trust 445 - - - 0.40 - N # SMAL11 BZ iShares BM&FBovespa Small Cap 64 1 0.27 68 0.69 0.15 NDBV* MM Pow erShares DB G10 Currency Harvest Fund 352 - - - 0.81 - N # BRAX11 BZ iShares Bovespa IBrX Fundo de Indice 39 0 0.14 101 0.54 0.13 NFXF* MM CurrencyShares Sw iss Franc Trust 291 - - - 0.40 - N # DIVO11 BZ It Now IDIV Fundo de Indice 27 0 0.15 38 0.50 - NFXE* MM CurrencyShares Euro Trust 274 0 - - 0.40 - N # GOVE11 BZ It Now IGCT Fundo de Indice 21 0 0.12 130 0.50 - NCYB* MM WisdomTree Chinese Yuan Fund 213 - - - 0.45 - N # FIND11 BZ IFNC 11 0 0.15 15 0.60 - NFXY* MM CurrencyShares Japanese Yen Trust 116 - - - 0.40 - N # ISUS11 BZ It Now ISE Fundo de Indice 11 0 0.10 - 0.40 - NFXB* MM CurrencyShares British Pound Sterling Trust 92 - - - 0.40 - N # MATB11 BZ It Now IMAT Fundo de Indice 7 0 0.14 16 0.50 - NUDN* MM Pow erShares DB US Dollar Index Bearish 73 - - - 0.80 - N # CSMO11 BZ iShares BM&FBovespa de Consumo Fundo 5 0 0.14 36 0.69 0.07 NFXS* MM CurrencyShares Sw edish Krona Trust 69 - - - 0.40 - N # UTIP11 BZ iShares Indice Utilidade Publica 3 0 0.13 20 0.69 - NBZF* MM WisdomTree Dreyfus Brazilian Real Fund 55 - - - 0.45 - N # MOBI11 BZ iShares BM&FBovespa Imobiliario Fundo 2 0 0.13 19 0.69 0.20 N
# MILA11 BZ iShares BM&FBovespa MidLarge Cap 2 0 0.14 71 0.54 0.10 N# XBOV11 BZ Caixa ETF Ibovespa Fundo de - - 0.29 - 0.50 - N# Chile
GLD* MM SPDR Gold Shares 49,641 0 1.87 - 0.40 - N # EEM CI iShares MSCI EM 45,918 0 - - 0.69 - NIAU* MM iShares Gold Trust 9,166 1 1.75 - 0.25 - N # EFA CI iShares MSCI EAFE 43,370 0 - - 0.34 - NSLV* MM iShares Silver Trust 8,077 1 0.70 - 0.50 - N # IVV CI iShares Core S&P 500 ETF 42,811 0 - - 0.07 - NDBC* MM Pow erShares DB Commodity Index Tracking 6,538 0 - - 0.93 - N # LQD CI iShares iBoxx IG Corporate Bond 24,160 0 - - 0.15 - NDBA* MM Pow erShares DB Agriculture Fund 1,678 - - - 1.01 - N # IWM CI iShares Russell 2000 20,477 0 - - 0.23 - NGSG* MM iShares S&P GSCI Commodity Indexed Trust 1,087 0 - - 0.75 - N # TIP CI iShares Barclays TIPS Bond Fund 20,039 - - - 0.20 - NPPLT* MM ETFS Platinum Trust 827 0 - - 0.60 - N # HYG CI iShares iBoxx $ HY Corporate Bond 16,335 - - - 0.50 - NPALL* MM ETFS Physical Palladium Shares 552 - - - 0.60 - N # EWJ CI iShares MSCI Japan 11,138 0 - - 0.53 - NDBO* MM Pow erShares DB Oil Fund 460 - - - 0.79 - N # IAU CI iShares Gold Trust 9,166 0 - - 0.25 - NOILBN MM ETFS Brent 1mth Oil Securities 362 - - - 0.49 - N # SLV CI iShares Silver Trust 8,077 0 - - 0.50 - NDBB* MM Pow erShares DB Base Metals Fund 320 0 - - 0.78 - N # IWR CI iShares Russell Midcap 7,658 - - - 0.21 - NDBP* MM Pow erShares DB Precious Metals Fund 273 - - - 0.79 - N # SHY CI iShares Barclays 1-3 Year Treasury Bond 7,535 0 - - 0.15 - NDBE* MM Pow erShares DB Energy Fund 204 - - - 0.78 - N # EWZ CI iShares MSCI Brazil 7,489 0 - - 0.61 - NGLTR* MM ETFS Physical Precious Metal Basket Shares 202 - - - 0.60 - N # IVW CI iShares S&P 500 Grow th 7,382 0 - - 0.18 - NWITE* MM ETFS White Metals Basket Trust 31 - - - 0.60 - N # FXI CI iShares FTSE China 25 6,910 0 - - 0.74 - N
# IYR CI iShares DJ US Real Estate 5,614 - - 93 0.47 - N# EPP CI iShares MSCI Pacif ic ex-Japan 4,737 0 - - 0.50 - N# SHV CI iShares Barclays Short Treasury Bond Fund 4,354 - - - 0.15 - N
LQD* MM iShares iBoxx IG Corporate Bond 24,160 0 - - 0.15 - N # IWV CI iShares Russell 3000 4,253 - - - 0.20 - NTIP* MM iShares Barclays TIPS Bond Fund 20,039 - - - 0.20 - N # EWC CI iShares MSCI Canada 4,135 - - - 0.53 - NBND* MM Vanguard Total Bond Market ETF 18,205 - - - 0.10 - N # EWH CI iShares MSCI Hong Kong 3,676 0 - - 0.53 - NHYG* MM iShares iBoxx $ HY Corporate Bond 16,335 1 - - 0.50 - N # EWY CI iShares MSCI South Korea 3,379 0 - - 0.61 - N
Mexico Listed ETFs
International Fixed Income Funds
Other Latin American Listed ETFsCurrency Funds
Commodity Funds
Fixed Income Funds
Mexico Listed ETFs
1 Option Liquidity (H / M / L / N - High / Medium / Low / None)2 / - Significant increase / decrease in shares outstanding in last one year
Canada & Latin America Listed ETFs
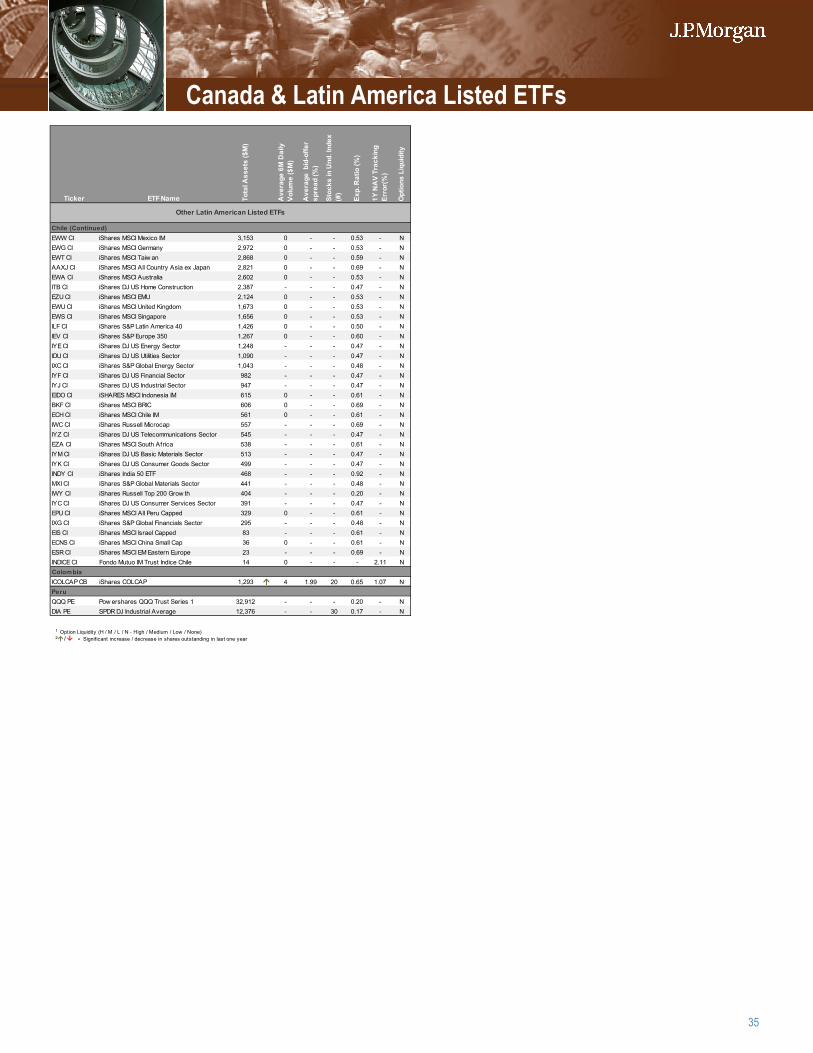
35
Ticker ETF Name Tota
l Ass
ets
($M
)
Ave
rage
6M
Dai
ly
Volu
me
($M
)
Ave
rage
bid
-offe
r sp
read
(%)
Stoc
ks in
Und
. Ind
ex
(#)
Exp.
Rat
io (%
)
1Y N
AV
Trac
king
Er
ror(
%)
Opt
ions
Liq
uidi
ty
Chile (Continued)EWW CI iShares MSCI Mexico IM 3,153 0 - - 0.53 - NEWG CI iShares MSCI Germany 2,972 0 - - 0.53 - NEWT CI iShares MSCI Taiw an 2,868 0 - - 0.59 - NAAXJ CI iShares MSCI All Country Asia ex Japan 2,821 0 - - 0.69 - NEWA CI iShares MSCI Australia 2,602 0 - - 0.53 - NITB CI iShares DJ US Home Construction 2,387 - - - 0.47 - NEZU CI iShares MSCI EMU 2,124 0 - - 0.53 - NEWU CI iShares MSCI United Kingdom 1,673 0 - - 0.53 - NEWS CI iShares MSCI Singapore 1,656 0 - - 0.53 - NILF CI iShares S&P Latin America 40 1,426 0 - - 0.50 - NIEV CI iShares S&P Europe 350 1,267 0 - - 0.60 - NIYE CI iShares DJ US Energy Sector 1,248 - - - 0.47 - NIDU CI iShares DJ US Utilities Sector 1,090 - - - 0.47 - NIXC CI iShares S&P Global Energy Sector 1,043 - - - 0.48 - NIYF CI iShares DJ US Financial Sector 982 - - - 0.47 - NIYJ CI iShares DJ US Industrial Sector 947 - - - 0.47 - NEIDO CI iSHARES MSCI Indonesia IM 615 0 - - 0.61 - NBKF CI iShares MSCI BRIC 606 0 - - 0.69 - NECH CI iShares MSCI Chile IM 561 0 - - 0.61 - NIWC CI iShares Russell Microcap 557 - - - 0.69 - NIYZ CI iShares DJ US Telecommunications Sector 545 - - - 0.47 - NEZA CI iShares MSCI South Africa 538 - - - 0.61 - NIYM CI iShares DJ US Basic Materials Sector 513 - - - 0.47 - NIYK CI iShares DJ US Consumer Goods Sector 499 - - - 0.47 - NINDY CI iShares India 50 ETF 468 - - - 0.92 - NMXI CI iShares S&P Global Materials Sector 441 - - - 0.48 - NIWY CI iShares Russell Top 200 Grow th 404 - - - 0.20 - NIYC CI iShares DJ US Consumer Services Sector 391 - - - 0.47 - NEPU CI iShares MSCI All Peru Capped 329 0 - - 0.61 - NIXG CI iShares S&P Global Financials Sector 295 - - - 0.48 - NEIS CI iShares MSCI Israel Capped 83 - - - 0.61 - NECNS CI iShares MSCI China Small Cap 36 0 - - 0.61 - NESR CI iShares MSCI EM Eastern Europe 23 - - - 0.69 - NINDICE CI Fondo Mutuo IM Trust Indice Chile 14 0 - - - 2.11 NColombiaICOLCAP CB iShares COLCAP 1,293 4 1.99 20 0.65 1.07 NPeruQQQ PE Pow ershares QQQ Trust Series 1 32,912 - - - 0.20 - NDIA PE SPDR DJ Industrial Average 12,376 - - 30 0.17 - N
Other Latin American Listed ETFs
1 Option Liquidity (H / M / L / N - High / Medium / Low / None)2 / - Significant increase / decrease in shares outstanding in last one year
Canada & Latin America Listed ETFs
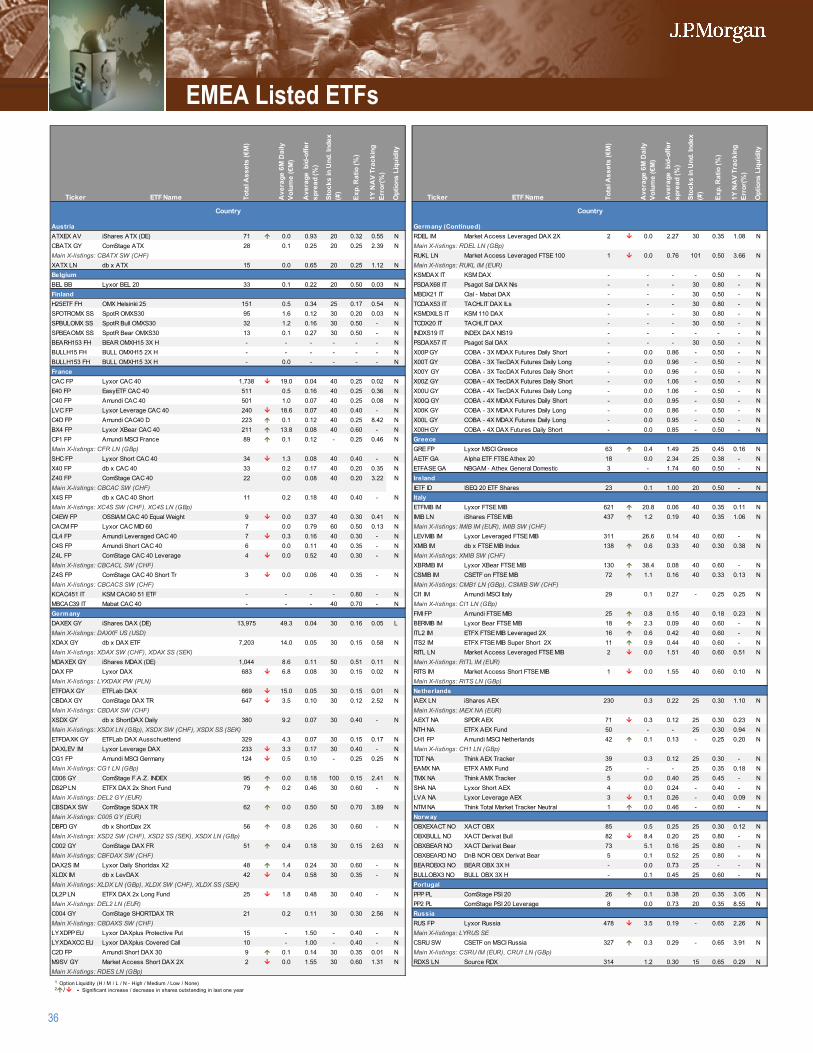
36
Ticker ETF Name Tota
l Ass
ets
(€M
)
Ave
rage
6M
Dai
ly
Volu
me
(€M
)
Ave
rage
bid
-offe
r sp
read
(%)
Stoc
ks in
Und
. Ind
ex
(#)
Exp.
Rat
io (%
)
1Y N
AV
Trac
king
Er
ror(
%)
Opt
ions
Liq
uidi
ty
Ticker ETF Name Tota
l Ass
ets
(€M
)
Ave
rage
6M
Dai
ly
Volu
me
(€M
)
Ave
rage
bid
-offe
r sp
read
(%)
Stoc
ks in
Und
. Ind
ex
(#)
Exp.
Rat
io (%
)
1Y N
AV
Trac
king
Er
ror(
%)
Opt
ions
Liq
uidi
ty
Austria Germany (Continued)ATXEX AV iShares ATX (DE) 71 0.0 0.93 20 0.32 0.55 N RDEL IM Market Access Leveraged DAX 2X 2 0.0 2.27 30 0.35 1.08 NCBATX GY ComStage ATX 28 0.1 0.25 20 0.25 2.39 N Main X-listings: RDEL LN (GBp)Main X-listings: CBATX SW (CHF) RUKL LN Market Access Leveraged FTSE 100 1 0.0 0.76 101 0.50 3.66 NXATX LN db x ATX 15 0.0 0.65 20 0.25 1.12 N Main X-listings: RUKL IM (EUR)Belgium KSMDAX IT KSM DAX - - - - 0.50 - NBEL BB Lyxor BEL 20 33 0.1 0.22 20 0.50 0.03 N PSDAX68 IT Psagot Sal DAX Nis - - - 30 0.80 - NFinland MBDX21 IT Clal - Mabat DAX - - - 30 0.50 - NH25ETF FH OMX Helsinki 25 151 0.5 0.34 25 0.17 0.54 N TCDAX53 IT TACHLIT DAX ILs - - - 30 0.80 - NSPOTROMX SS SpotR OMXS30 95 1.6 0.12 30 0.20 0.03 N KSMDXILS IT KSM 110 DAX - - - 30 0.80 - NSPBULOMX SS SpotR Bull OMXS30 32 1.2 0.16 30 0.50 - N TCDX20 IT TACHLIT DAX - - - 30 0.50 - NSPBEAOMX SS SpotR Bear OMXS30 13 0.1 0.27 30 0.50 - N INDXS19 IT INDEX DAX NIS19 - - - - - - NBEARH153 FH BEAR OMXH15 3X H - - - - - - N PSDAX57 IT Psagot Sal DAX - - - 30 0.50 - NBULLH15 FH BULL OMXH15 2X H - - - - - - N X00P GY COBA - 3X MDAX Futures Daily Short - 0.0 0.86 - 0.50 - NBULLH153 FH BULL OMXH15 3X H - 0.0 - - - - N X00T GY COBA - 3X TecDAX Futures Daily Long - 0.0 0.96 - 0.50 - NFrance X00Y GY COBA - 3X TecDAX Futures Daily Short - 0.0 0.96 - 0.50 - NCAC FP Lyxor CAC 40 1,738 19.0 0.04 40 0.25 0.02 N X00Z GY COBA - 4X TecDAX Futures Daily Short - 0.0 1.06 - 0.50 - NE40 FP EasyETF CAC 40 511 0.5 0.16 40 0.25 0.36 N X00U GY COBA - 4X TecDAX Futures Daily Long - 0.0 1.06 - 0.50 - NC40 FP Amundi CAC 40 501 1.0 0.07 40 0.25 0.08 N X00Q GY COBA - 4X MDAX Futures Daily Short - 0.0 0.95 - 0.50 - NLVC FP Lyxor Leverage CAC 40 240 18.6 0.07 40 0.40 - N X00K GY COBA - 3X MDAX Futures Daily Long - 0.0 0.86 - 0.50 - NC4D FP Amundi CAC40 D 223 0.1 0.12 40 0.25 8.42 N X00L GY COBA - 4X MDAX Futures Daily Long - 0.0 0.95 - 0.50 - NBX4 FP Lyxor XBear CAC 40 211 13.8 0.08 40 0.60 - N X00H GY COBA - 4X DAX Futures Daily Short - 0.0 0.85 - 0.50 - NCF1 FP Amundi MSCI France 89 0.1 0.12 - 0.25 0.46 N GreeceMain X-listings: CFR LN (GBp) GRE FP Lyxor MSCI Greece 63 0.4 1.49 25 0.45 0.16 NSHC FP Lyxor Short CAC 40 34 1.3 0.08 40 0.40 - N AETF GA Alpha ETF FTSE Athex 20 18 0.0 2.34 25 0.38 - NX40 FP db x CAC 40 33 0.2 0.17 40 0.20 0.35 N ETFASE GA NBGAM - Athex General Domestic 3 - 1.74 60 0.50 - NZ40 FP ComStage CAC 40 22 0.0 0.08 40 0.20 3.22 N IrelandMain X-listings: CBCAC SW (CHF) IETF ID ISEQ 20 ETF Shares 23 0.1 1.00 20 0.50 - NX4S FP db x CAC 40 Short 11 0.2 0.18 40 0.40 - N ItalyMain X-listings: XC4S SW (CHF), XC4S LN (GBp) ETFMIB IM Lyxor FTSE MIB 621 20.8 0.06 40 0.35 0.11 NC4EW FP OSSIAM CAC 40 Equal Weight 9 0.0 0.37 40 0.30 0.41 N IMIB LN iShares FTSE MIB 437 1.2 0.19 40 0.35 1.06 NCACM FP Lyxor CAC MID 60 7 0.0 0.79 60 0.50 0.13 N Main X-listings: IMIB IM (EUR), IMIB SW (CHF)CL4 FP Amundi Leveraged CAC 40 7 0.3 0.16 40 0.30 - N LEVMIB IM Lyxor Leveraged FTSE MIB 311 26.6 0.14 40 0.60 - NC4S FP Amundi Short CAC 40 6 0.0 0.11 40 0.35 - N XMIB IM db x FTSE MIB Index 138 0.6 0.33 40 0.30 0.38 NZ4L FP ComStage CAC 40 Leverage 4 0.0 0.52 40 0.30 - N Main X-listings: XMIB SW (CHF)Main X-listings: CBCACL SW (CHF) XBRMIB IM Lyxor XBear FTSE MIB 130 38.4 0.08 40 0.60 - NZ4S FP ComStage CAC 40 Short Tr 3 0.0 0.06 40 0.35 - N CSMIB IM CSETF on FTSE MIB 72 1.1 0.16 40 0.33 0.13 NMain X-listings: CBCACS SW (CHF) Main X-listings: CMB1 LN (GBp), CSMIB SW (CHF)KCAC451 IT KSM CAC40 51 ETF - - - - 0.80 - N CI1 IM Amundi MSCI Italy 29 0.1 0.27 - 0.25 0.25 NMBCAC39 IT Mabat CAC 40 - - - 40 0.70 - N Main X-listings: CI1 LN (GBp)Germany FMI FP Amundi FTSE MIB 25 0.8 0.15 40 0.18 0.23 NDAXEX GY iShares DAX (DE) 13,975 49.3 0.04 30 0.16 0.05 L BERMIB IM Lyxor Bear FTSE MIB 18 2.3 0.09 40 0.60 - NMain X-listings: DAXXF US (USD) ITL2 IM ETFX FTSE MIB Leveraged 2X 16 0.6 0.42 40 0.60 - NXDAX GY db x DAX ETF 7,203 14.0 0.05 30 0.15 0.58 N ITS2 IM ETFX FTSE MIB Super Short 2X 11 0.9 0.44 40 0.60 - NMain X-listings: XDAX SW (CHF), XDAX SS (SEK) RITL LN Market Access Leveraged FTSE MIB 2 0.0 1.51 40 0.60 0.51 NMDAXEX GY iShares MDAX (DE) 1,044 8.6 0.11 50 0.51 0.11 N Main X-listings: RITL IM (EUR)DAX FP Lyxor DAX 683 6.8 0.08 30 0.15 0.02 N RITS IM Market Access Short FTSE MIB 1 0.0 1.55 40 0.60 0.10 NMain X-listings: LYXDAX PW (PLN) Main X-listings: RITS LN (GBp)ETFDAX GY ETFLab DAX 669 15.0 0.05 30 0.15 0.01 N NetherlandsCBDAX GY ComStage DAX TR 647 3.5 0.10 30 0.12 2.52 N IAEX LN iShares AEX 230 0.3 0.22 25 0.30 1.10 NMain X-listings: CBDAX SW (CHF) Main X-listings: IAEX NA (EUR)XSDX GY db x ShortDAX Daily 380 9.2 0.07 30 0.40 - N AEXT NA SPDR AEX 71 0.3 0.12 25 0.30 0.23 NMain X-listings: XSDX LN (GBp), XSDX SW (CHF), XSDX SS (SEK) NTH NA ETFX AEX Fund 50 - - 25 0.30 0.94 NETFDAXK GY ETFLab DAX Ausschuettend 329 4.3 0.07 30 0.15 0.17 N CH1 FP Amundi MSCI Netherlands 42 0.1 0.13 - 0.25 0.20 NDAXLEV IM Lyxor Leverage DAX 233 3.3 0.17 30 0.40 - N Main X-listings: CH1 LN (GBp)CG1 FP Amundi MSCI Germany 124 0.5 0.10 - 0.25 0.25 N TDT NA Think AEX Tracker 39 0.3 0.12 25 0.30 - NMain X-listings: CG1 LN (GBp) EAMX NA ETFX AMX Fund 25 - - 25 0.35 0.18 NC006 GY ComStage F.A.Z. INDEX 95 0.0 0.18 100 0.15 2.41 N TMX NA Think AMX Tracker 5 0.0 0.40 25 0.45 - NDS2P LN ETFX DAX 2x Short Fund 79 0.2 0.46 30 0.60 - N SHA NA Lyxor Short AEX 4 0.0 0.24 - 0.40 - NMain X-listings: DEL2 GY (EUR) LVA NA Lyxor Leverage AEX 3 0.1 0.26 - 0.40 0.09 NCBSDAX SW ComStage SDAX TR 62 0.0 0.50 50 0.70 3.89 N NTM NA Think Total Market Tracker Neutral 1 0.0 0.46 - 0.60 - NMain X-listings: C005 GY (EUR) NorwayDBPD GY db x ShortDax 2X 56 0.8 0.26 30 0.60 - N OBXEXACT NO XACT OBX 85 0.5 0.25 25 0.30 0.12 NMain X-listings: XSD2 SW (CHF), XSD2 SS (SEK), XSDX LN (GBp) OBXBULL NO XACT Derivat Bull 82 8.4 0.20 25 0.80 - NC002 GY ComStage DAX FR 51 0.4 0.18 30 0.15 2.63 N OBXBEAR NO XACT Derivat Bear 73 5.1 0.16 25 0.80 - NMain X-listings: CBFDAX SW (CHF) OBXBEARD NO DnB NOR OBX Derivat Bear 5 0.1 0.52 25 0.80 - NDAX2S IM Lyxor Daily Shortdax X2 48 1.4 0.24 30 0.60 - N BEAROBX3 NO BEAR OBX 3X H - 0.0 0.73 25 - - NXLDX IM db x LevDAX 42 0.4 0.58 30 0.35 - N BULLOBX3 NO BULL OBX 3X H - 0.1 0.45 25 0.60 - NMain X-listings: XLDX LN (GBp), XLDX SW (CHF), XLDX SS (SEK) PortugalDL2P LN ETFX DAX 2x Long Fund 25 1.8 0.48 30 0.40 - N PPP PL ComStage PSI 20 26 0.1 0.38 20 0.35 3.05 NMain X-listings: DEL2 LN (EUR) PP2 PL ComStage PSI 20 Leverage 8 0.0 0.73 20 0.35 8.55 NC004 GY ComStage SHORTDAX TR 21 0.2 0.11 30 0.30 2.56 N RussiaMain X-listings: CBDAXS SW (CHF) RUS FP Lyxor Russia 478 3.5 0.19 - 0.65 2.26 NLYXDPP EU Lyxor DAXplus Protective Put 15 - 1.50 - 0.40 - N Main X-listings: LYRUS SELYXDAXCC EU Lyxor DAXplus Covered Call 10 - 1.00 - 0.40 - N CSRU SW CSETF on MSCI Russia 327 0.3 0.29 - 0.65 3.91 NC2D FP Amundi Short DAX 30 9 0.1 0.14 30 0.35 0.01 N Main X-listings: CSRU IM (EUR), CRU1 LN (GBp)M9SV GY Market Access Short DAX 2X 2 0.0 1.55 30 0.60 1.31 N RDXS LN Source RDX 314 1.2 0.30 15 0.65 0.29 NMain X-listings: RDES LN (GBp)
Country Country
1 Option Liquidity (H / M / L / N - High / Medium / Low / None)2 / - Significant increase / decrease in shares outstanding in last one year
EMEA Listed ETFs
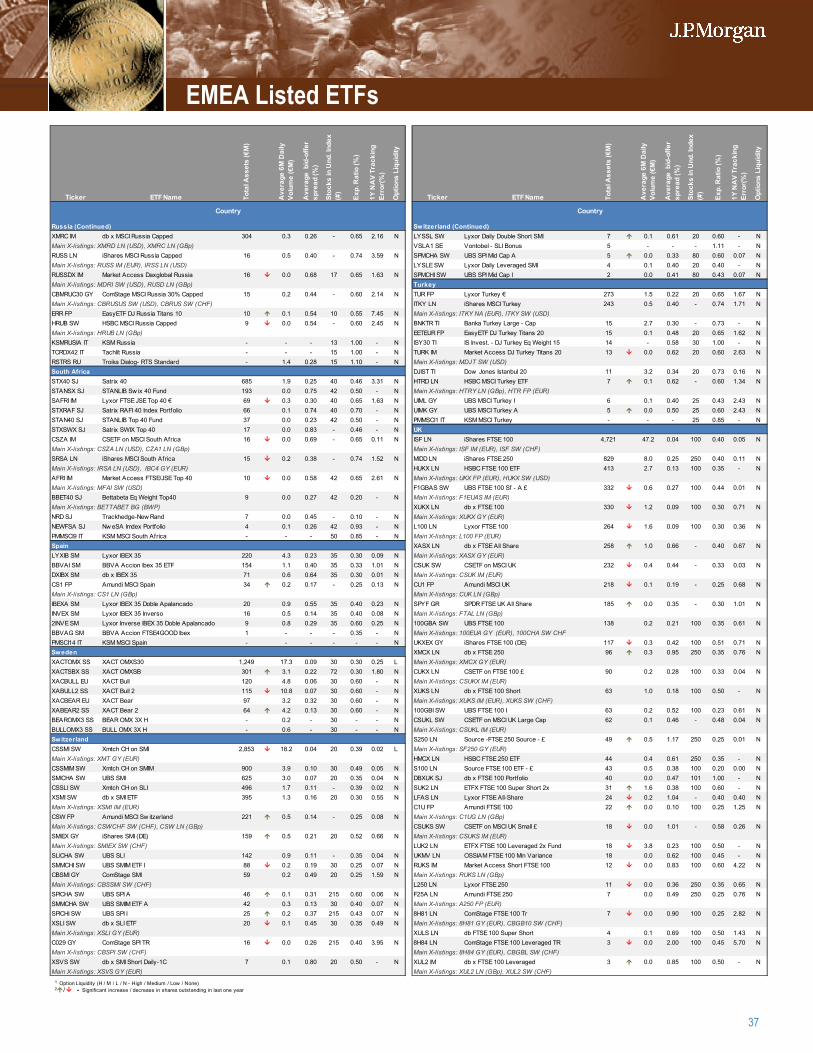
37
Ticker ETF Name Tota
l Ass
ets
(€M
)
Ave
rage
6M
Dai
ly
Volu
me
(€M
)
Ave
rage
bid
-offe
r sp
read
(%)
Stoc
ks in
Und
. Ind
ex
(#)
Exp.
Rat
io (%
)
1Y N
AV
Trac
king
Er
ror(
%)
Opt
ions
Liq
uidi
ty
Ticker ETF Name Tota
l Ass
ets
(€M
)
Ave
rage
6M
Dai
ly
Volu
me
(€M
)
Ave
rage
bid
-offe
r sp
read
(%)
Stoc
ks in
Und
. Ind
ex
(#)
Exp.
Rat
io (%
)
1Y N
AV
Trac
king
Er
ror(
%)
Opt
ions
Liq
uidi
ty
Russia (Continued) Switzerland (Continued)XMRC IM db x MSCI Russia Capped 304 0.3 0.26 - 0.65 2.16 N LYSSL SW Lyxor Daily Double Short SMI 7 0.1 0.61 20 0.60 - NMain X-listings: XMRD LN (USD), XMRC LN (GBp) VSLA1 SE Vontobel - SLI Bonus 5 - - - 1.11 - NRUSS LN iShares MSCI Russia Capped 16 0.5 0.40 - 0.74 3.59 N SPMCHA SW UBS SPI Mid Cap A 5 0.0 0.33 80 0.60 0.07 NMain X-listings: RUSS IM (EUR), IRSS LN (USD) LYSLE SW Lyxor Daily Leveraged SMI 4 0.1 0.40 20 0.40 - NRUSSDX IM Market Access Daxglobal Russia 16 0.0 0.68 17 0.65 1.63 N SPMCHI SW UBS SPI Mid Cap I 2 0.0 0.41 80 0.43 0.07 NMain X-listings: MDRI SW (USD), RUSD LN (GBp) TurkeyCBMRUC30 GY ComStage MSCI Russia 30% Capped 15 0.2 0.44 - 0.60 2.14 N TUR FP Lyxor Turkey € 273 1.5 0.22 20 0.65 1.67 NMain X-listings: CBRUSUS SW (USD), CBRUS SW (CHF) ITKY LN iShares MSCI Turkey 243 0.5 0.40 - 0.74 1.71 NERR FP EasyETF DJ Russia Titans 10 10 0.1 0.54 10 0.55 7.45 N Main X-listings: ITKY NA (EUR), ITKY SW (USD)HRUB SW HSBC MSCI Russia Capped 9 0.0 0.54 - 0.60 2.45 N BNKTR TI Banka Turkey Large - Cap 15 2.7 0.30 - 0.73 - NMain X-listings: HRUB LN (GBp) EETEUR FP EasyETF DJ Turkey Titans 20 15 0.1 0.48 20 0.65 1.62 NKSMRUSIA IT KSM Russia - - - 13 1.00 - N ISY30 TI IS Invest. - DJ Turkey Eq Weight 15 14 - 0.58 30 1.00 - NTCRDX42 IT Tachlit Russia - - - 15 1.00 - N TURK IM Market Access DJ Turkey Titans 20 13 0.0 0.62 20 0.60 2.63 NRSTRS RU Troika Dialog- RTS Standard - 1.4 0.28 15 1.10 - N Main X-listings: MDJT SW (USD)South Africa DJIST TI Dow Jones Istanbul 20 11 3.2 0.34 20 0.73 0.16 NSTX40 SJ Satrix 40 685 1.9 0.25 40 0.46 3.31 N HTRD LN HSBC MSCI Turkey ETF 7 0.1 0.62 - 0.60 1.34 NSTANSX SJ STANLIB Sw ix 40 Fund 193 0.0 0.75 42 0.50 - N Main X-listings: HTRY LN (GBp), HTR FP (EUR)SAFRI IM Lyxor FTSE JSE Top 40 € 69 0.3 0.30 40 0.65 1.63 N UIML GY UBS MSCI Turkey I 6 0.1 0.40 25 0.43 2.43 NSTXRAF SJ Satrix RAFI 40 Index Portfolio 66 0.1 0.74 40 0.70 - N UIMK GY UBS MSCI Turkey A 5 0.0 0.50 25 0.60 2.43 NSTAN40 SJ STANLIB Top 40 Fund 37 0.0 0.23 42 0.50 - N PMMSCI1 IT KSM MSCI Turkey - - - 25 0.85 - NSTXSWX SJ Satrix SWIX Top 40 17 0.0 0.83 - 0.46 - N UKCSZA IM CSETF on MSCI South Africa 16 0.0 0.69 - 0.65 0.11 N ISF LN iShares FTSE 100 4,721 47.2 0.04 100 0.40 0.05 NMain X-listings: CSZA LN (USD), CZA1 LN (GBp) Main X-listings: ISF IM (EUR), ISF SW (CHF)SRSA LN iShares MSCI South Africa 15 0.2 0.38 - 0.74 1.52 N MIDD LN iShares FTSE 250 829 8.0 0.25 250 0.40 0.11 NMain X-listings: IRSA LN (USD), IBC4 GY (EUR) HUKX LN HSBC FTSE 100 ETF 413 2.7 0.13 100 0.35 - NAFRI IM Market Access FTSE/JSE Top 40 10 0.0 0.58 42 0.65 2.61 N Main X-listings: UKX FP (EUR), HUKX SW (USD)Main X-listings: MFAI SW (USD) F1GBAS SW UBS FTSE 100 Sf - A £ 332 0.6 0.27 100 0.44 0.01 NBBET40 SJ Bettabeta Eq Weight Top40 9 0.0 0.27 42 0.20 - N Main X-listings: F1EUAS IM (EUR)Main X-listings: BETTABET BG (BWP) XUKX LN db x FTSE 100 330 1.2 0.09 100 0.30 0.71 NNRD SJ Trackhedge-New Rand 7 0.0 0.45 - 0.10 - N Main X-listings: XUKX GY (EUR)NEWFSA SJ Nw eSA Imdex Portfolio 4 0.1 0.26 42 0.93 - N L100 LN Lyxor FTSE 100 264 1.6 0.09 100 0.30 0.36 NPMMSCI9 IT KSM MSCI South Africa - - - 50 0.85 - N Main X-listings: L100 FP (EUR)Spain XASX LN db x FTSE All Share 258 1.0 0.66 - 0.40 0.67 NLYXIB SM Lyxor IBEX 35 220 4.3 0.23 35 0.30 0.09 N Main X-listings: XASX GY (EUR)BBVAI SM BBVA Accion Ibex 35 ETF 154 1.1 0.40 35 0.33 1.01 N CSUK SW CSETF on MSCI UK 232 0.4 0.44 - 0.33 0.03 NDXIBX SM db x IBEX 35 71 0.6 0.64 35 0.30 0.01 N Main X-listings: CSUK IM (EUR)CS1 FP Amundi MSCI Spain 34 0.2 0.17 - 0.25 0.13 N CU1 FP Amundi MSCI UK 218 0.1 0.19 - 0.25 0.68 NMain X-listings: CS1 LN (GBp) Main X-listings: CUK LN (GBp)IBEXA SM Lyxor IBEX 35 Doble Apalancado 20 0.9 0.55 35 0.40 0.23 N SPYF GR SPDR FTSE UK All Share 185 0.0 0.35 - 0.30 1.01 NINVEX SM Lyxor IBEX 35 Inverso 16 0.5 0.14 35 0.40 0.08 N Main X-listings: FTAL LN (GBp)2INVE SM Lyxor Inverse IBEX 35 Doble Apalancado 9 0.8 0.29 35 0.60 0.25 N 100GBA SW UBS FTSE 100 138 0.2 0.21 100 0.35 0.61 NBBVAG SM BBVA Accion FTSE4GOOD Ibex 1 - - - 0.35 - N Main X-listings: 100EUA GY (EUR), 100CHA SW CHFPMSCI14 IT KSM MSCI Spain - - - - - - N UKXEX GY iShares FTSE 100 (DE) 117 0.3 0.42 100 0.51 0.71 NSweden XMCX LN db x FTSE 250 96 0.3 0.95 250 0.35 0.76 NXACTOMX SS XACT OMXS30 1,249 17.3 0.09 30 0.30 0.25 L Main X-listings: XMCX GY (EUR)XACTSBX SS XACT OMXSB 301 3.1 0.22 72 0.30 1.80 N CUKX LN CSETF on FTSE 100 £ 90 0.2 0.28 100 0.33 0.04 NXACBULL EU XACT Bull 120 4.8 0.06 30 0.60 - N Main X-listings: CSUKX IM (EUR)XABULL2 SS XACT Bull 2 115 10.8 0.07 30 0.60 - N XUKS LN db x FTSE 100 Short 63 1.0 0.18 100 0.50 - NXACBEAR EU XACT Bear 97 3.2 0.32 30 0.60 - N Main X-listings: XUKS IM (EUR), XUKS SW (CHF)XABEAR2 SS XACT Bear 2 64 4.2 0.13 30 0.60 - N 100GBI SW UBS FTSE 100 I 63 0.2 0.52 100 0.23 0.61 NBEAROMX3 SS BEAR OMX 3X H - 0.2 - 30 - - N CSUKL SW CSETF on MSCI UK Large Cap 62 0.1 0.46 - 0.48 0.04 NBULLOMX3 SS BULL OMX 3X H - 0.6 - 30 - - N Main X-listings: CSUKL IM (EUR)Switzerland S250 LN Source -FTSE 250 Source - £ 49 0.5 1.17 250 0.25 0.01 NCSSMI SW Xmtch CH on SMI 2,853 18.2 0.04 20 0.39 0.02 L Main X-listings: SF250 GY (EUR)Main X-listings: XMT GY (EUR) HMCX LN HSBC FTSE 250 ETF 44 0.4 0.61 250 0.35 - NCSSMIM SW Xmtch CH on SMIM 900 3.9 0.10 30 0.49 0.05 N S100 LN Source FTSE 100 ETF - £ 43 0.5 0.38 100 0.20 0.00 NSMICHA SW UBS SMI 625 3.0 0.07 20 0.35 0.04 N DBXUK SJ db x FTSE 100 Portfolio 40 0.0 0.47 101 1.00 - NCSSLI SW Xmtch CH on SLI 496 1.7 0.11 - 0.39 0.02 N SUK2 LN ETFX FTSE 100 Super Short 2x 31 1.6 0.38 100 0.60 - NXSMI SW db x SMI ETF 395 1.3 0.16 20 0.30 0.55 N LFAS LN Lyxor FTSE All-Share 24 0.2 1.04 - 0.40 0.40 NMain X-listings: XSMI IM (EUR) C1U FP Amundi FTSE 100 22 0.0 0.10 100 0.25 1.25 NCSW FP Amundi MSCI Sw itzerland 221 0.5 0.14 - 0.25 0.08 N Main X-listings: C1UG LN (GBp)Main X-listings: CSWCHF SW (CHF), CSW LN (GBp) CSUKS SW CSETF on MSCI UK Small £ 18 0.0 1.01 - 0.58 0.26 NSMIEX GY iShares SMI (DE) 159 0.5 0.21 20 0.52 0.66 N Main X-listings: CSUKS IM (EUR)Main X-listings: SMIEX SW (CHF) LUK2 LN ETFX FTSE 100 Leveraged 2x Fund 18 3.8 0.23 100 0.50 - NSLICHA SW UBS SLI 142 0.9 0.11 - 0.35 0.04 N UKMV LN OSSIAM FTSE 100 Min Variance 18 0.0 0.62 100 0.45 - NSMMCHI SW UBS SMIM ETF I 88 0.2 0.19 30 0.25 0.07 N RUKS IM Market Access Short FTSE 100 12 0.0 0.83 100 0.60 4.22 NCBSMI GY ComStage SMI 59 0.2 0.49 20 0.25 1.59 N Main X-listings: RUKS LN (GBp)Main X-listings: CBSSMI SW (CHF) L250 LN Lyxor FTSE 250 11 0.0 0.36 250 0.35 0.65 NSPICHA SW UBS SPI A 46 0.1 0.31 215 0.60 0.06 N F25A LN Amundi FTSE 250 7 0.0 0.49 250 0.25 0.76 NSMMCHA SW UBS SMIM ETF A 42 0.3 0.13 30 0.40 0.07 N Main X-listings: A250 FP (EUR)SPICHI SW UBS SPI I 25 0.2 0.37 215 0.43 0.07 N 8H81 LN ComStage FTSE 100 Tr 7 0.0 0.90 100 0.25 2.82 NXSLI SW db x SLI ETF 20 0.1 0.45 30 0.35 0.49 N Main X-listings: 8H81 GY (EUR), CBGB10 SW (CHF)Main X-listings: XSLI GY (EUR) XULS LN db FTSE 100 Super Short 4 0.1 0.69 100 0.50 1.43 NC029 GY ComStage SPI TR 16 0.0 0.26 215 0.40 3.95 N 8H84 LN ComStage FTSE 100 Leveraged TR 3 0.0 2.00 100 0.45 5.70 NMain X-listings: CBSPI SW (CHF) Main X-listings: 8H84 GY (EUR), CBGBL SW (CHF)XSVS SW db x SMI Short Daily-1C 7 0.1 0.80 20 0.50 - N XUL2 IM db x FTSE 100 Leveraged 3 0.0 0.85 100 0.50 - NMain X-listings: XSVS GY (EUR) Main X-listings: XUL2 LN (GBp), XUL2 SW (CHF)
Country Country
1 Option Liquidity (H / M / L / N - High / Medium / Low / None)2 / - Significant increase / decrease in shares outstanding in last one year
EMEA Listed ETFs
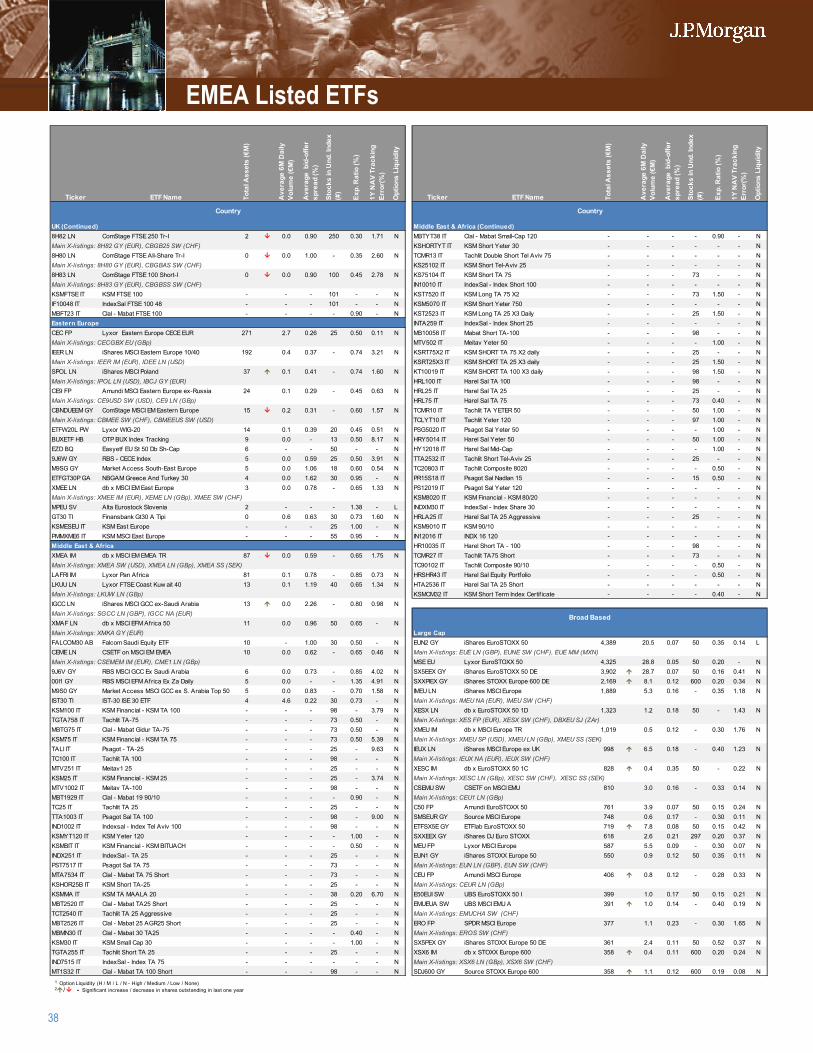
38
Ticker ETF Name Tota
l Ass
ets
(€M
)
Ave
rage
6M
Dai
ly
Volu
me
(€M
)
Ave
rage
bid
-offe
r sp
read
(%)
Stoc
ks in
Und
. Ind
ex
(#)
Exp.
Rat
io (%
)
1Y N
AV
Trac
king
Er
ror(
%)
Opt
ions
Liq
uidi
ty
Ticker ETF Name Tota
l Ass
ets
(€M
)
Ave
rage
6M
Dai
ly
Volu
me
(€M
)
Ave
rage
bid
-offe
r sp
read
(%)
Stoc
ks in
Und
. Ind
ex
(#)
Exp.
Rat
io (%
)
1Y N
AV
Trac
king
Er
ror(
%)
Opt
ions
Liq
uidi
ty
UK (Continued) Middle East & Africa (Continued)8H82 LN ComStage FTSE 250 Tr-I 2 0.0 0.90 250 0.30 1.71 N MBTYT38 IT Clal - Mabat Small-Cap 120 - - - - 0.90 - NMain X-listings: 8H82 GY (EUR), CBGB25 SW (CHF) KSHORTYT IT KSM Short Yeter 30 - - - - - - N8H80 LN ComStage FTSE All-Share Tr-I 0 0.0 1.00 - 0.35 2.60 N TCMR13 IT Tachlit Double Short Tel Aviv 75 - - - - - - NMain X-listings: 8H80 GY (EUR), CBGBAS SW (CHF) KS25102 IT KSM Short Tel-Aviv 25 - - - - - - N8H83 LN ComStage FTSE 100 Short-I 0 0.0 0.90 100 0.45 2.78 N KS75104 IT KSM Short TA 75 - - - 73 - - NMain X-listings: 8H83 GY (EUR), CBGBSS SW (CHF) IN10010 IT IndexSal - Index Short 100 - - - - - - NKSMFTSE IT KSM FTSE 100 - - - 101 - - N KST7520 IT KSM Long TA 75 X2 - - - 73 1.50 - NIF10048 IT IndexSal FTSE 100 48 - - - 101 - - N KSM5070 IT KSM Short Yeter 750 - - - - - - NMBFT23 IT Clal - Mabat FTSE 100 - - - - 0.90 - N KST2523 IT KSM Long TA 25 X3 Daily - - - 25 1.50 - NEastern Europe INTA259 IT IndexSal - Index Short 25 - - - - - - NCEC FP Lyxor Eastern Europe CECE EUR 271 2.7 0.26 25 0.50 0.11 N MB10058 IT Mabat Short TA-100 - - - 98 - - NMain X-listings: CECGBX EU (GBp) MTV502 IT Meitav Yeter 50 - - - - 1.00 - NIEER LN iShares MSCI Eastern Europe 10/40 192 0.4 0.37 - 0.74 3.21 N KSRT75X2 IT KSM SHORT TA 75 X2 daily - - - 25 - - NMain X-listings: IEER IM (EUR), IDEE LN (USD) KSRT25X3 IT KSM SHORT TA 25 X3 daily - - - 25 1.50 - NSPOL LN iShares MSCI Poland 37 0.1 0.41 - 0.74 1.60 N KT10019 IT KSM SHORT TA 100 X3 daily - - - 98 1.50 - NMain X-listings: IPOL LN (USD), IBCJ GY (EUR) HRL100 IT Harel Sal TA 100 - - - 98 - - NCE9 FP Amundi MSCI Eastern Europe ex-Russia 24 0.1 0.29 - 0.45 0.63 N HRL25 IT Harel Sal TA 25 - - - 25 - - NMain X-listings: CE9USD SW (USD), CE9 LN (GBp) HRL75 IT Harel Sal TA 75 - - - 73 0.40 - NCBNDUEEM GY ComStage MSCI EM Eastern Europe 15 0.2 0.31 - 0.60 1.57 N TCMR10 IT Tachlit TA YETER 50 - - - 50 1.00 - NMain X-listings: CBMEE SW (CHF), CBMEEUS SW (USD) TCLYT10 IT Tachlit Yeter 120 - - - 97 1.00 - NETFW20L PW Lyxor WIG-20 14 0.1 0.39 20 0.45 0.51 N PSG5020 IT Psagot Sal Yeter 50 - - - - 1.00 - NBUXETF HB OTP BUX Index Tracking 9 0.0 - 13 0.50 8.17 N HRY5014 IT Harel Sal Yeter 50 - - - 50 1.00 - NEZD BQ Easyetf EU St 50 Db Sh-Cap 6 - - 50 - - N HY12018 IT Harel Sal Mid-Cap - - - - 1.00 - N9J6W GY RBS - CECE Index 5 0.0 0.59 25 0.50 3.91 N TTA2532 IT Tachlit Short Tel-Aviv 25 - - - 25 - - NM9SG GY Market Access South-East Europe 5 0.0 1.06 18 0.60 0.54 N TC20803 IT Tachlit Composite 8020 - - - - 0.50 - NETFGT30P GA NBGAM Greece And Turkey 30 4 0.0 1.62 30 0.95 - N PR15S18 IT Psagot Sal Nadlan 15 - - - 15 0.50 - NXMEE LN db x MSCI EM East Europe 3 0.0 0.78 - 0.65 1.33 N PS12019 IT Psagot Sal Yeter 120 - - - - - - NMain X-listings: XMEE IM (EUR), XEME LN (GBp), XMEE SW (CHF) KSM8020 IT KSM Financial - KSM 80/20 - - - - - - NMPEU SV Alta Eurostock Slovenia 2 - - - 1.38 - L INDXM30 IT IndexSal - Index Share 30 - - - - - - NGT30 TI Finansbank Gt30 A Tipi 0 0.6 0.63 30 0.73 1.60 N HRLA25 IT Harel Sal TA 25 Aggressive - - - 25 - - NKSMESEU IT KSM East Europe - - - 25 1.00 - N KSM9010 IT KSM 90/10 - - - - - - NPMMXME6 IT KSM MSCI East Europe - - - 55 0.95 - N IN12016 IT INDX 16 120 - - - - - - NMiddle East & Africa HR10035 IT Harel Short TA - 100 - - - 98 - - NXMEA IM db x MSCI EM EMEA TR 87 0.0 0.59 - 0.65 1.75 N TCMR27 IT Tachlit TA75 Short - - - 73 - - NMain X-listings: XMEA SW (USD), XMEA LN (GBp), XMEA SS (SEK) TC90102 IT Tachlit Composite 90/10 - - - - 0.50 - NLAFRI IM Lyxor Pan Africa 81 0.1 0.78 - 0.85 0.73 N HRSHR43 IT Harel Sal Equity Portfolio - - - - 0.50 - NLKUU LN Lyxor FTSE Coast Kuw ait 40 13 0.1 1.19 40 0.65 1.34 N HTA2536 IT Harel Sal TA 25 Short - - - - - - NMain X-listings: LKUW LN (GBp) KSMCM32 IT KSM Short Term Index Certif icate - - - - 0.40 - NIGCC LN iShares MSCI GCC ex-Saudi Arabia 13 0.0 2.26 - 0.80 0.98 NMain X-listings: SGCC LN (GBP), IGCC NA (EUR)XMAF LN db x MSCI EFM Africa 50 11 0.0 0.96 50 0.65 - NMain X-listings: XMKA GY (EUR) Large CapFALCOM30 AB Falcom Saudi Equity ETF 10 - 1.00 30 0.50 - N EUN2 GY iShares EuroSTOXX 50 4,389 20.5 0.07 50 0.35 0.14 LCEME LN CSETF on MSCI EM EMEA 10 0.0 0.62 - 0.65 0.46 N Main X-listings: EUE LN (GBP), EUNE SW (CHF), EUE MM (MXN)Main X-listings: CSEMEM IM (EUR), CME1 LN (GBp) MSE EU Lyxor EuroSTOXX 50 4,325 28.8 0.05 50 0.20 - N9J6V GY RBS MSCI GCC Ex Saudi Arabia 6 0.0 0.73 - 0.85 4.02 N SX5EEX GY iShares EuroSTOXX 50 DE 3,902 28.7 0.07 50 0.16 0.41 N00I1 GY RBS MSCI EFM Africa Ex Za Daily 5 0.0 - - 1.35 4.91 N SXXPIEX GY iShares STOXX Europe 600 DE 2,169 8.1 0.12 600 0.20 0.34 NM9S0 GY Market Access MSCI GCC ex S. Arabia Top 50 5 0.0 0.83 - 0.70 1.58 N IMEU LN iShares MSCI Europe 1,889 5.3 0.16 - 0.35 1.18 NIST30 TI IST-30 ISE 30 ETF 4 4.6 0.22 30 0.73 - N Main X-listings: IMEU NA (EUR), IMEU SW (CHF)KSM100 IT KSM Financial - KSM TA 100 - - - 98 - 3.79 N XESX LN db x EuroSTOXX 50 1D 1,323 1.2 0.18 50 - 1.43 NTGTA758 IT Tachlit TA-75 - - - 73 0.50 - N Main X-listings: XES FP (EUR), XESX SW (CHF), DBXEU SJ (ZAr)MBTG75 IT Clal - Mabat Gidur TA-75 - - - 73 0.50 - N XMEU IM db x MSCI Europe TR 1,019 0.5 0.12 - 0.30 1.76 NKSM75 IT KSM Financial - KSM TA 75 - - - 73 0.50 5.39 N Main X-listings: XMEU SP (USD), XMEU LN (GBp), XMEU SS (SEK)TALI IT Psagot - TA-25 - - - 25 - 9.63 N IEUX LN iShares MSCI Europe ex UK 998 6.5 0.18 - 0.40 1.23 NTC100 IT Tachlit TA 100 - - - 98 - - N Main X-listings: IEUX NA (EUR), IEUX SW (CHF)MTV251 IT Meitav1 25 - - - 25 - - N XESC IM db x EuroSTOXX 50 1C 828 0.4 0.35 50 - 0.22 NKSM25 IT KSM Financial - KSM 25 - - - 25 - 3.74 N Main X-listings: XESC LN (GBp), XESC SW (CHF), XESC SS (SEK)MTV1002 IT Meitav TA-100 - - - 98 - - N CSEMU SW CSETF on MSCI EMU 810 3.0 0.16 - 0.33 0.14 NMBT1929 IT Clal - Mabat 19 90/10 - - - - 0.90 - N Main X-listings: CEU1 LN (GBp)TC25 IT Tachlit TA 25 - - - 25 - - N C50 FP Amundi EuroSTOXX 50 761 3.9 0.07 50 0.15 0.24 NTTA1003 IT Psagot Sal TA 100 - - - 98 - 9.00 N SMSEUR GY Source MSCI Europe 748 0.6 0.17 - 0.30 0.11 NIND1002 IT Indexsal - Index Tel Aviv 100 - - - 98 - - N ETFSX5E GY ETFlab EuroSTOXX 50 719 7.8 0.08 50 0.15 0.42 NKSMYT120 IT KSM Yeter 120 - - - - 1.00 - N SXXEEX GY iShares DJ Euro STOXX 618 2.6 0.21 297 0.20 0.37 NKSMBIT IT KSM Financial - KSM BITUACH - - - - 0.50 - N MEU FP Lyxor MSCI Europe 587 5.5 0.09 - 0.30 0.07 NINDX251 IT IndexSal - TA 25 - - - 25 - - N EUN1 GY iShares STOXX Europe 50 550 0.9 0.12 50 0.35 0.11 NPST7517 IT Psagot Sal TA 75 - - - 73 - - N Main X-listings: EUN LN (GBP), EUN SW (CHF)MTA7534 IT Clal - Mabat TA 75 Short - - - 73 - - N CEU FP Amundi MSCI Europe 406 0.8 0.12 - 0.28 0.33 NKSHOR25B IT KSM Short TA-25 - - - 25 - - N Main X-listings: CEUR LN (GBp)KSMMA IT KSM TA MAALA 20 - - - 38 0.20 6.70 N E50EUI SW UBS EuroSTOXX 50 I 399 1.0 0.17 50 0.15 0.21 NMBT2520 IT Clal - Mabat TA25 Short - - - 25 - - N EMUEUA SW UBS MSCI EMU A 391 1.0 0.14 - 0.40 0.19 NTCT2540 IT Tachlit TA 25 Aggressive - - - 25 - - N Main X-listings: EMUCHA SW (CHF)MBT2526 IT Clal - Mabat 25 AGR25 Short - - - 25 - - N ERO FP SPDR MSCI Europe 377 1.1 0.23 - 0.30 1.65 NMBMN30 IT Clal - Mabat 30 TA25 - - - - 0.40 - N Main X-listings: EROS SW (CHF)KSM30 IT KSM Small Cap 30 - - - - 1.00 - N SX5PEX GY iShares STOXX Europe 50 DE 361 2.4 0.11 50 0.52 0.37 NTGTA255 IT Tachlit Short TA 25 - - - 25 - - N XSX6 IM db x STOXX Europe 600 358 0.4 0.11 600 0.20 0.24 NIND7515 IT IndexSal - Index TA 75 - - - - - - N Main X-listings: XSX6 LN (GBp), XSX6 SW (CHF)MT1S32 IT Clal - Mabat TA 100 Short - - - 98 - - N SDJ600 GY Source STOXX Europe 600 358 1.1 0.12 600 0.19 0.08 N
Broad Based
Country Country
1 Option Liquidity (H / M / L / N - High / Medium / Low / None)2 / - Significant increase / decrease in shares outstanding in last one year
EMEA Listed ETFs
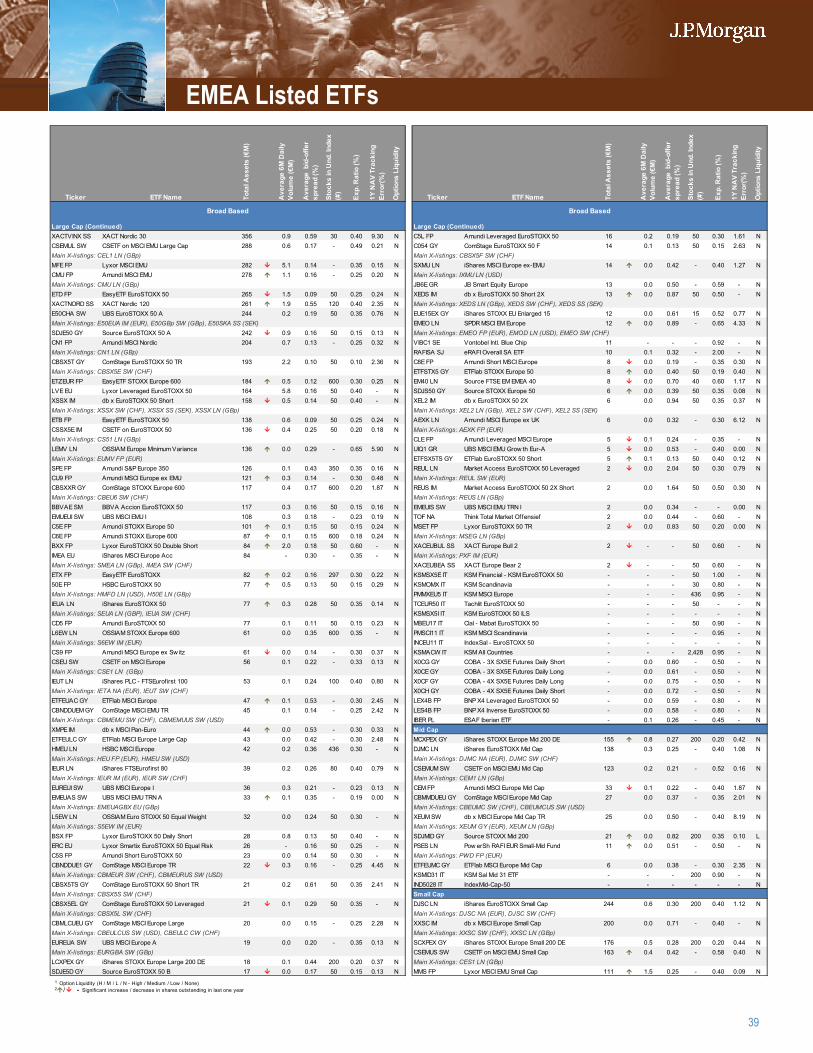
39
Ticker ETF Name Tota
l Ass
ets
(€M
)
Ave
rage
6M
Dai
ly
Volu
me
(€M
)
Ave
rage
bid
-offe
r sp
read
(%)
Stoc
ks in
Und
. Ind
ex
(#)
Exp.
Rat
io (%
)
1Y N
AV
Trac
king
Er
ror(
%)
Opt
ions
Liq
uidi
ty
Ticker ETF Name Tota
l Ass
ets
(€M
)
Ave
rage
6M
Dai
ly
Volu
me
(€M
)
Ave
rage
bid
-offe
r sp
read
(%)
Stoc
ks in
Und
. Ind
ex
(#)
Exp.
Rat
io (%
)
1Y N
AV
Trac
king
Er
ror(
%)
Opt
ions
Liq
uidi
ty
Large Cap (Continued) Large Cap (Continued)XACTVINX SS XACT Nordic 30 356 0.9 0.59 30 0.40 9.30 N C5L FP Amundi Leveraged EuroSTOXX 50 16 0.2 0.19 50 0.30 1.61 NCSEMUL SW CSETF on MSCI EMU Large Cap 288 0.6 0.17 - 0.49 0.21 N C054 GY ComStage EuroSTOXX 50 F 14 0.1 0.13 50 0.15 2.63 NMain X-listings: CEL1 LN (GBp) Main X-listings: CBSX5F SW (CHF)MFE FP Lyxor MSCI EMU 282 5.1 0.14 - 0.35 0.15 N SXMU LN iShares MSCI Europe ex-EMU 14 0.0 0.42 - 0.40 1.27 NCMU FP Amundi MSCI EMU 278 1.1 0.16 - 0.25 0.20 N Main X-listings: IXMU LN (USD)Main X-listings: CMU LN (GBp) JB6E GR JB Smart Equity Europe 13 0.0 0.50 - 0.59 - NETD FP EasyETF EuroSTOXX 50 265 1.5 0.09 50 0.25 0.24 N XEDS IM db x EuroSTOXX 50 Short 2X 13 0.0 0.87 50 0.50 - NXACTNORD SS XACT Nordic 120 261 1.9 0.55 120 0.40 2.35 N Main X-listings: XEDS LN (GBp), XEDS SW (CHF), XEDS SS (SEK)E50CHA SW UBS EuroSTOXX 50 A 244 0.2 0.19 50 0.35 0.76 N EUE15EX GY iShares STOXX EU Enlarged 15 12 0.0 0.61 15 0.52 0.77 NMain X-listings: E50EUA IM (EUR), E50GBp SW (GBp), E50SKA SS (SEK) EMEO LN SPDR MSCI EM Europe 12 0.0 0.89 - 0.65 4.33 NSDJE50 GY Source EuroSTOXX 50 A 242 0.9 0.16 50 0.15 0.13 N Main X-listings: EMEO FP (EUR), EMOD LN (USD), EMEO SW (CHF)CN1 FP Amundi MSCI Nordic 204 0.7 0.13 - 0.25 0.32 N VIBC1 SE Vontobel Intl. Blue Chip 11 - - - 0.92 - NMain X-listings: CN1 LN (GBp) RAFISA SJ eRAFI Overall SA ETF 10 0.1 0.32 - 2.00 - NCBSX5T GY ComStage EuroSTOXX 50 TR 193 2.2 0.10 50 0.10 2.36 N C8E FP Amundi Short MSCI Europe 8 0.0 0.19 - 0.35 0.30 NMain X-listings: CBSX5E SW (CHF) ETFSTX5 GY ETFlab STOXX Europe 50 8 0.0 0.40 50 0.19 0.40 NETZEUR FP EasyETF STOXX Europe 600 184 0.5 0.12 600 0.30 0.25 N EM40 LN Source FTSE EM EMEA 40 8 0.0 0.70 40 0.60 1.17 NLVE EU Lyxor Leveraged EuroSTOXX 50 164 5.8 0.16 50 0.40 - N SDJS50 GY Source STOXX Europe 50 6 0.0 0.39 50 0.35 0.08 NXSSX IM db x EuroSTOXX 50 Short 158 0.5 0.14 50 0.40 - N XEL2 IM db x EuroSTOXX 50 2X 6 0.0 0.94 50 0.35 0.37 NMain X-listings: XSSX SW (CHF), XSSX SS (SEK), XSSX LN (GBp) Main X-listings: XEL2 LN (GBp), XEL2 SW (CHF), XEL2 SS (SEK)ETB FP EasyETF EuroSTOXX 50 138 0.6 0.09 50 0.25 0.24 N AEXK LN Amundi MSCI Europe ex UK 6 0.0 0.32 - 0.30 6.12 NCSSX5E IM CSETF on EuroSTOXX 50 136 0.4 0.25 50 0.20 0.18 N Main X-listings: AEXK FP (EUR)Main X-listings: CS51 LN (GBp) CLE FP Amundi Leveraged MSCI Europe 5 0.1 0.24 - 0.35 - NLEMV LN OSSIAM Europe Minimum Variance 136 0.0 0.29 - 0.65 5.90 N UIQ1 GR UBS MSCI EMU Grow th Eur-A 5 0.0 0.53 - 0.40 0.00 NMain X-listings: EUMV FP (EUR) ETFSX5TS GY ETFlab EuroSTOXX 50 Short 5 0.1 0.13 50 0.40 0.12 NSPE FP Amundi S&P Europe 350 126 0.1 0.43 350 0.35 0.16 N REUL LN Market Access EuroSTOXX 50 Leveraged 2 0.0 2.04 50 0.30 0.79 NCU9 FP Amundi MSCI Europe ex EMU 121 0.3 0.14 - 0.30 0.48 N Main X-listings: REUL SW (EUR)CBSXXR GY ComStage STOXX Europe 600 117 0.4 0.17 600 0.20 1.87 N REUS IM Market Access EuroSTOXX 50 2X Short 2 0.0 1.64 50 0.50 0.30 NMain X-listings: CBEU6 SW (CHF) Main X-listings: REUS LN (GBp)BBVAE SM BBVA Accion EuroSTOXX 50 117 0.3 0.16 50 0.15 0.16 N EMEUIS SW UBS MSCI EMU TRN I 2 0.0 0.34 - - 0.00 NEMUEUI SW UBS MSCI EMU I 108 0.3 0.18 - 0.23 0.19 N TOF NA Think Total Market Offensief 2 0.0 0.44 - 0.60 - NC5E FP Amundi STOXX Europe 50 101 0.1 0.15 50 0.15 0.24 N MSET FP Lyxor EuroSTOXX 50 TR 2 0.0 0.83 50 0.20 0.00 NC6E FP Amundi STOXX Europe 600 87 0.1 0.15 600 0.18 0.24 N Main X-listings: MSEG LN (GBp)BXX FP Lyxor EuroSTOXX 50 Double Short 84 2.0 0.18 50 0.60 - N XACEUBUL SS XACT Europe Bull 2 2 - - 50 0.60 - NIMEA EU iShares MSCI Europe Acc 84 - 0.30 - 0.35 - N Main X-listings: PXF IM (EUR)Main X-listings: SMEA LN (GBp), IMEA SW (CHF) XACEUBEA SS XACT Europe Bear 2 2 - - 50 0.60 - NETX FP EasyETF EuroSTOXX 82 0.2 0.16 297 0.30 0.22 N KSMSX5E IT KSM Financial - KSM EuroSTOXX 50 - - - 50 1.00 - N50E FP HSBC EuroSTOXX 50 77 0.5 0.13 50 0.15 0.29 N KSMOMX IT KSM Scandinavia - - - 30 0.80 - NMain X-listings: HMFD LN (USD), H50E LN (GBp) PMMXEU5 IT KSM MSCI Europe - - - 436 0.95 - NIEUA LN iShares EuroSTOXX 50 77 0.3 0.28 50 0.35 0.14 N TCEUR50 IT Tachlit EuroSTOXX 50 - - - 50 - - NMain X-listings: SEUA LN (GBP), IEUA SW (CHF) KSMSX5I IT KSM EuroSTOXX 50 ILS - - - - - - NCD5 FP Amundi EuroSTOXX 50 77 0.1 0.11 50 0.15 0.23 N MBEU17 IT Clal - Mabat EuroSTOXX 50 - - - 50 0.90 - NL6EW LN OSSIAM STOXX Europe 600 61 0.0 0.35 600 0.35 - N PMSCI11 IT KSM MSCI Scandinavia - - - - 0.95 - NMain X-listings: S6EW IM (EUR) INCEU11 IT IndexSal - EuroSTOXX 50 - - - - - - NCS9 FP Amundi MSCI Europe ex Sw itz 61 0.0 0.14 - 0.30 0.37 N KSMACW IT KSM All Countries - - - 2,428 0.95 - NCSEU SW CSETF on MSCI Europe 56 0.1 0.22 - 0.33 0.13 N X0CG GY COBA - 3X SX5E Futures Daily Short - 0.0 0.60 - 0.50 - NMain X-listings: CSE1 LN (GBp) X0CE GY COBA - 3X SX5E Futures Daily Long - 0.0 0.61 - 0.50 - NIEUT LN iShares PLC - FTSEurofirst 100 53 0.1 0.24 100 0.40 0.80 N X0CF GY COBA - 4X SX5E Futures Daily Long - 0.0 0.75 - 0.50 - NMain X-listings: IETA NA (EUR), IEUT SW (CHF) X0CH GY COBA - 4X SX5E Futures Daily Short - 0.0 0.72 - 0.50 - NETFEUAC GY ETFlab MSCI Europe 47 0.1 0.53 - 0.30 2.45 N LEX4B FP BNP X4 Leveraged EuroSTOXX 50 - 0.0 0.59 - 0.80 - NCBNDDUEM GY ComStage MSCI EMU TR 45 0.1 0.14 - 0.25 2.42 N LES4B FP BNP X4 Inverse EuroSTOXX 50 - 0.0 0.58 - 0.80 - NMain X-listings: CBMEMU SW (CHF), CBMEMUUS SW (USD) IBER PL ESAF Iberian ETF - 0.1 0.26 - 0.45 - NXMPE IM db x MSCI Pan-Euro 44 0.0 0.53 - 0.30 0.33 N Mid CapETFEULC GY ETFlab MSCI Europe Large Cap 43 0.0 0.42 - 0.30 2.48 N MCXPEX GY iShares STOXX Europe Mid 200 DE 155 0.8 0.27 200 0.20 0.42 NHMEU LN HSBC MSCI Europe 42 0.2 0.36 436 0.30 - N DJMC LN iShares EuroSTOXX Mid Cap 138 0.3 0.25 - 0.40 1.08 NMain X-listings: HEU FP (EUR), HMEU SW (USD) Main X-listings: DJMC NA (EUR), DJMC SW (CHF)IEUR LN iShares FTSEurofirst 80 39 0.2 0.26 80 0.40 0.79 N CSEMUM SW CSETF on MSCI EMU Mid Cap 123 0.2 0.21 - 0.52 0.16 NMain X-listings: IEUR IM (EUR), IEUR SW (CHF) Main X-listings: CEM1 LN (GBp)EUREUI SW UBS MSCI Europe I 36 0.3 0.21 - 0.23 0.13 N CEM FP Amundi MSCI Europe Mid Cap 33 0.1 0.22 - 0.40 1.87 NEMEUAS SW UBS MSCI EMU TRN A 33 0.1 0.35 - 0.19 0.00 N CBMMDUEU GY ComStage MSCI Europe Mid Cap 27 0.0 0.37 - 0.35 2.01 NMain X-listings: EMEUAGBX EU (GBp) Main X-listings: CBEUMC SW (CHF), CBEUMCUS SW (USD)L5EW LN OSSIAM Euro STOXX 50 Equal Weight 32 0.0 0.24 50 0.30 - N XEUM SW db x MSCI Europe Mid Cap TR 25 0.0 0.50 - 0.40 8.19 NMain X-listings: S5EW IM (EUR) Main X-listings: XEUM GY (EUR), XEUM LN (GBp)BSX FP Lyxor EuroSTOXX 50 Daily Short 28 0.8 0.13 50 0.40 - N SDJMID GY Source STOXX Mid 200 21 0.0 0.82 200 0.35 0.10 LERC EU Lyxor Smartix EuroSTOXX 50 Equal Risk 26 - 0.16 50 0.25 - N PSES LN Pow erSh RAFI EUR Small-Mid Fund 11 0.0 0.51 - 0.50 - NC5S FP Amundi Short EuroSTOXX 50 23 0.0 0.14 50 0.30 - N Main X-listings: PWD FP (EUR)CBNDDUE1 GY ComStage MSCI Europe TR 22 0.3 0.16 - 0.25 4.45 N ETFEUMC GY ETFlab MSCI Europe Mid Cap 6 0.0 0.38 - 0.30 2.35 NMain X-listings: CBMEUR SW (CHF), CBMEURUS SW (USD) KSMID31 IT KSM Sal Mid 31 ETF - - - 200 0.90 - NCBSX5TS GY ComStage EuroSTOXX 50 Short TR 21 0.2 0.61 50 0.35 2.41 N IND5028 IT IndexMid-Cap-50 - - - - - - NMain X-listings: CBSX5S SW (CHF) Small CapCBSX5EL GY ComStage EuroSTOXX 50 Leveraged 21 0.1 0.29 50 0.35 - N DJSC LN iShares EuroSTOXX Small Cap 244 0.6 0.30 200 0.40 1.12 NMain X-listings: CBSX5L SW (CHF) Main X-listings: DJSC NA (EUR), DJSC SW (CHF)CBMLCUEU GY ComStage MSCI Europe Large 20 0.0 0.15 - 0.25 2.28 N XXSC IM db x MSCI Europe Small Cap 200 0.0 0.71 - 0.40 - NMain X-listings: CBEULCUS SW (USD), CBEULC CW (CHF) Main X-listings: XXSC SW (CHF), XXSC LN (GBp)EUREUA SW UBS MSCI Europe A 19 0.0 0.20 - 0.35 0.13 N SCXPEX GY iShares STOXX Europe Small 200 DE 176 0.5 0.28 200 0.20 0.44 NMain X-listings: EURGBA SW (GBp) CSEMUS SW CSETF on MSCI EMU Small Cap 163 0.4 0.42 - 0.58 0.40 NLCXPEX GY iShares STOXX Europe Large 200 DE 18 0.1 0.44 200 0.20 0.37 N Main X-listings: CES1 LN (GBp)SDJE5D GY Source EuroSTOXX 50 B 17 0.0 0.17 50 0.15 0.13 N MMS FP Lyxor MSCI EMU Small Cap 111 1.5 0.25 - 0.40 0.09 N
Broad Based Broad Based
1 Option Liquidity (H / M / L / N - High / Medium / Low / None)2 / - Significant increase / decrease in shares outstanding in last one year
EMEA Listed ETFs
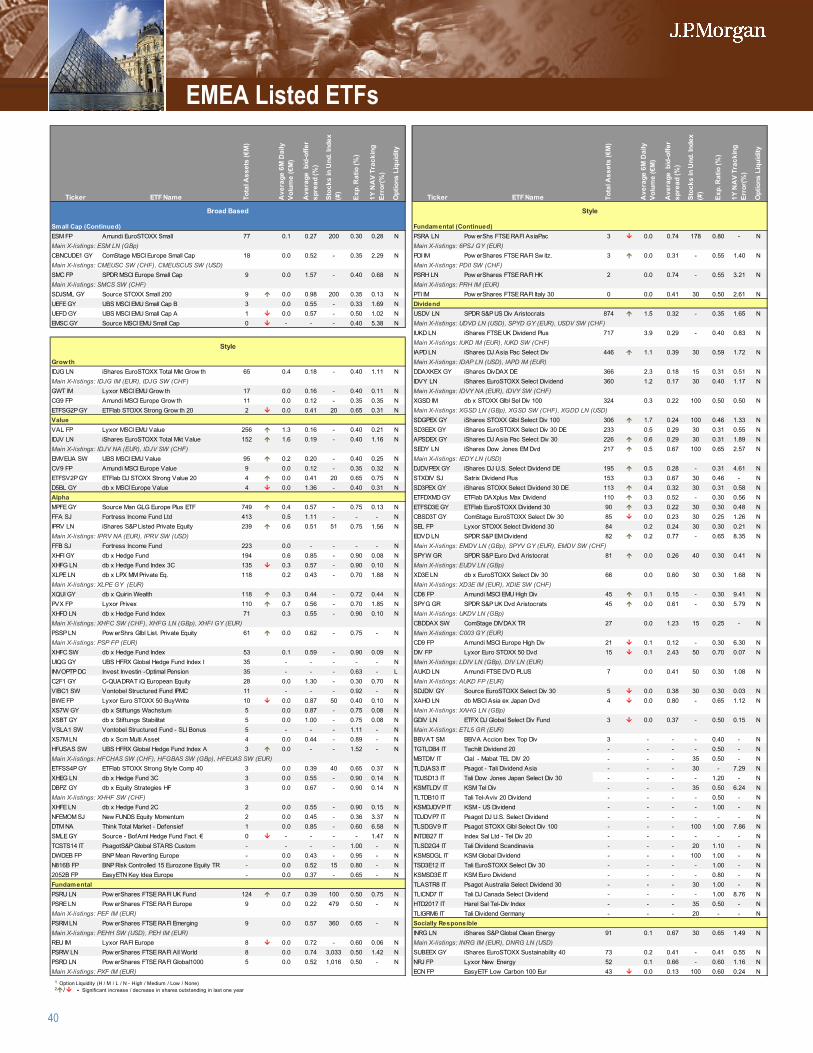
40
Ticker ETF Name Tota
l Ass
ets
(€M
)
Ave
rage
6M
Dai
ly
Volu
me
(€M
)
Ave
rage
bid
-offe
r sp
read
(%)
Stoc
ks in
Und
. Ind
ex
(#)
Exp.
Rat
io (%
)
1Y N
AV
Trac
king
Er
ror(
%)
Opt
ions
Liq
uidi
ty
Ticker ETF Name Tota
l Ass
ets
(€M
)
Ave
rage
6M
Dai
ly
Volu
me
(€M
)
Ave
rage
bid
-offe
r sp
read
(%)
Stoc
ks in
Und
. Ind
ex
(#)
Exp.
Rat
io (%
)
1Y N
AV
Trac
king
Er
ror(
%)
Opt
ions
Liq
uidi
ty
Small Cap (Continued) Fundamental (Continued)ESM FP Amundi EuroSTOXX Small 77 0.1 0.27 200 0.30 0.28 N PSRA LN Pow erShs FTSE RAFI AsiaPac 3 0.0 0.74 178 0.80 - NMain X-listings: ESM LN (GBp) Main X-listings: 6PSJ GY (EUR)CBNCUDE1 GY ComStage MSCI Europe Small Cap 18 0.0 0.52 - 0.35 2.29 N PDI IM Pow erShares FTSE RAFI Sw itz. 3 0.0 0.31 - 0.55 1.40 NMain X-listings: CMEUSC SW (CHF), CMEUSCUS SW (USD) Main X-listings: PDII SW (CHF)SMC FP SPDR MSCI Europe Small Cap 9 0.0 1.57 - 0.40 0.68 N PSRH LN Pow erShares FTSE RAFI HK 2 0.0 0.74 - 0.55 3.21 NMain X-listings: SMCS SW (CHF) Main X-listings: PRH IM (EUR)SDJSML GY Source STOXX Small 200 9 0.0 0.98 200 0.35 0.13 N PTI IM Pow erShares FTSE RAFI Italy 30 0 0.0 0.41 30 0.50 2.61 NUEFE GY UBS MSCI EMU Small Cap B 3 0.0 0.55 - 0.33 1.69 N DividendUEFD GY UBS MSCI EMU Small Cap A 1 0.0 0.57 - 0.50 1.02 N USDV LN SPDR S&P US Div Aristocrats 874 1.5 0.32 - 0.35 1.65 NEMSC GY Source MSCI EMU Small Cap 0 - - - 0.40 5.38 N Main X-listings: UDVD LN (USD), SPYD GY (EUR), USDV SW (CHF)
IUKD LN iShares FTSE UK Dividend Plus 717 3.9 0.29 - 0.40 0.83 NMain X-listings: IUKD IM (EUR), IUKD SW (CHF)IAPD LN iShares DJ Asia Pac Select Div 446 1.1 0.39 30 0.59 1.72 N
Growth Main X-listings: IDAP LN (USD), IAPD IM (EUR)IDJG LN iShares EuroSTOXX Total Mkt Grow th 65 0.4 0.18 - 0.40 1.11 N DDAXKEX GY iShares DivDAX DE 366 2.3 0.18 15 0.31 0.51 NMain X-listings: IDJG IM (EUR), IDJG SW (CHF) IDVY LN iShares EuroSTOXX Select Dividend 360 1.2 0.17 30 0.40 1.17 NGWT IM Lyxor MSCI EMU Grow th 17 0.0 0.16 - 0.40 0.11 N Main X-listings: IDVY NA (EUR), IDVY SW (CHF)CG9 FP Amundi MSCI Europe Grow th 11 0.0 0.12 - 0.35 0.35 N XGSD IM db x STOXX Glbl Sel Div 100 324 0.3 0.22 100 0.50 0.50 NETFSG2P GY ETFlab STOXX Strong Grow th 20 2 0.0 0.41 20 0.65 0.31 N Main X-listings: XGSD LN (GBp), XGSD SW (CHF), XGDD LN (USD)Value SDGPEX GY iShares STOXX Glbl Select Div 100 306 1.7 0.24 100 0.46 1.33 NVAL FP Lyxor MSCI EMU Value 256 1.3 0.16 - 0.40 0.21 N SD3EEX GY iShares EuroSTOXX Select Div 30 DE 233 0.5 0.29 30 0.31 0.55 NIDJV LN iShares EuroSTOXX Total Mkt Value 152 1.6 0.19 - 0.40 1.16 N APSDEX GY iShares DJ Asia Pac Select Div 30 226 0.6 0.29 30 0.31 1.89 NMain X-listings: IDJV NA (EUR), IDJV SW (CHF) SEDY LN iShares Dow Jones EM Dvd 217 0.5 0.67 100 0.65 2.57 NEMVEUA SW UBS MSCI EMU Value 95 0.2 0.20 - 0.40 0.25 N Main X-listings: IEDY LN (USD)CV9 FP Amundi MSCI Europe Value 9 0.0 0.12 - 0.35 0.32 N DJDVPEX GY iShares DJ U.S. Select Dividend DE 195 0.5 0.28 - 0.31 4.61 NETFSV2P GY ETFlab DJ STOXX Strong Value 20 4 0.0 0.41 20 0.65 0.75 N STXDIV SJ Satrix Dividend Plus 153 0.3 0.67 30 0.46 - ND5BL GY db x MSCI Europe Value 4 0.0 1.36 - 0.40 0.31 N SD3PEX GY iShares STOXX Select Dividend 30 DE 113 0.4 0.32 30 0.31 0.58 NAlpha ETFDXMD GY ETFlab DAXplus Max Dividend 110 0.3 0.52 - 0.30 0.56 NMPFE GY Source Man GLG Europe Plus ETF 749 0.4 0.57 - 0.75 0.13 N ETFSD3E GY ETFlab EuroSTOXX Dividend 30 90 0.3 0.22 30 0.30 0.48 NFFA SJ Fortress Income Fund Ltd 413 0.5 1.11 - - - N CBSD3T GY ComStage EuroSTOXX Select Div 30 85 0.0 0.23 30 0.25 1.26 NIPRV LN iShares S&P Listed Private Equity 239 0.6 0.51 51 0.75 1.56 N SEL FP Lyxor STOXX Select Dividend 30 84 0.2 0.24 30 0.30 0.21 NMain X-listings: IPRV NA (EUR), IPRV SW (USD) EDVD LN SPDR S&P EM Dividend 82 0.2 0.77 - 0.65 8.35 NFFB SJ Fortress Income Fund 223 0.0 - - - - N Main X-listings: EMDV LN (GBp), SPYV GY (EUR), EMDV SW (CHF)XHFI GY db x Hedge Fund 194 0.6 0.85 - 0.90 0.08 N SPYW GR SPDR S&P Euro Dvd Aristocrat 81 0.0 0.26 40 0.30 0.41 NXHFG LN db x Hedge Fund Index 3C 135 0.3 0.57 - 0.90 0.10 N Main X-listings: EUDV LN (GBp)XLPE LN db x LPX MM Private Eq. 118 0.2 0.43 - 0.70 1.88 N XD3E LN db x EuroSTOXX Select Div 30 66 0.0 0.60 30 0.30 1.68 NMain X-listings: XLPE GY (EUR) Main X-listings: XD3E IM (EUR), XDIE SW (CHF)XQUI GY db x Quirin Wealth 118 0.3 0.44 - 0.72 0.44 N CD8 FP Amundi MSCI EMU High Div 45 0.1 0.15 - 0.30 9.41 NPVX FP Lyxor Privex 110 0.7 0.56 - 0.70 1.85 N SPYG GR SPDR S&P UK Dvd Aristocrats 45 0.0 0.61 - 0.30 5.79 NXHFD LN db x Hedge Fund Index 71 0.3 0.55 - 0.90 0.10 N Main X-listings: UKDV LN (GBp)Main X-listings: XHFC SW (CHF), XHFG LN (GBp), XHFI GY (EUR) CBDDAX SW ComStage DIVDAX TR 27 0.0 1.23 15 0.25 - NPSSP LN Pow erShrs Glbl List. Private Equity 61 0.0 0.62 - 0.75 - N Main X-listings: C003 GY (EUR)Main X-listings: PSP FP (EUR) CD9 FP Amundi MSCI Europe High Div 21 0.1 0.12 - 0.30 6.30 NXHFC SW db x Hedge Fund Index 53 0.1 0.59 - 0.90 0.09 N DIV FP Lyxor Euro STOXX 50 Dvd 15 0.1 2.43 50 0.70 0.07 NUIQG GY UBS HFRX Global Hedge Fund Index I 35 - - - - - N Main X-listings: LDIV LN (GBp), DIV LN (EUR)INVOPTP DC Invest Investin -Optimal Pension 35 - - - 0.63 - L AUKD LN Amundi FTSE DVD PLUS 7 0.0 0.41 50 0.30 1.08 NC2F1 GY C-QUADRAT iQ European Equity 28 0.0 1.30 - 0.30 0.70 N Main X-listings: AUKD FP (EUR)VIBC1 SW Vontobel Structured Fund IPMC 11 - - - 0.92 - N SDJDIV GY Source EuroSTOXX Select Div 30 5 0.0 0.38 30 0.30 0.03 NBWE FP Lyxor Euro STOXX 50 BuyWrite 10 0.0 0.87 50 0.40 0.10 N XAHD LN db MSCI Asia ex Japan Dvd 4 0.0 0.80 - 0.65 1.12 NXS7W GY db x Stif tungs Wachstum 5 0.0 0.87 - 0.75 0.08 N Main X-listings: XAHG LN (GBp)XSBT GY db x Stif tungs Stabilitat 5 0.0 1.00 - 0.75 0.08 N GDIV LN ETFX DJ Global Select Div Fund 3 0.0 0.37 - 0.50 0.15 NVSLA1 SW Vontobel Structured Fund - SLI Bonus 5 - - - 1.11 - N Main X-listings: ETL5 GR (EUR)XS7M LN db x Scm Multi Asset 4 0.0 0.44 - 0.89 - N BBVAT SM BBVA Accion Ibex Top Div 3 - - - 0.40 - NHFUSAS SW UBS HFRX Global Hedge Fund Index A 3 0.0 - - 1.52 - N TGTLDB4 IT Tachlit Dividend 20 - - - - 0.50 - NMain X-listings: HFCHAS SW (CHF), HFGBAS SW (GBp), HFEUAS SW (EUR) MBTDIV IT Clal - Mabat TEL DIV 20 - - - 35 0.50 - NETFSS4P GY ETFlab STOXX Strong Style Comp 40 3 0.0 0.39 40 0.65 0.37 N TLDJAS3 IT Psagot - Tali Dividend Asia - - - 30 - 7.29 NXHEG LN db x Hedge Fund 3C 3 0.0 0.55 - 0.90 0.14 N TDJSD13 IT Tali Dow Jones Japan Select Div 30 - - - - 1.20 - NDBPZ GY db x Equity Strategies HF 3 0.0 0.67 - 0.90 0.14 N KSMTLDV IT KSM Tel Div - - - 35 0.50 6.24 NMain X-listings: XHHF SW (CHF) TLTDB10 IT Tali Tel-Aviv 20 Dividend - - - - 0.50 - NXHFE LN db x Hedge Fund 2C 2 0.0 0.55 - 0.90 0.15 N KSMDJDVP IT KSM - US Dividend - - - - 1.00 - NNFEMOM SJ New FUNDS Equity Momentum 2 0.0 0.45 - 0.36 3.37 N TDJDVP7 IT Psagot DJ U.S. Select Dividend - - - - - - NDTM NA Think Total Market - Defensief 1 0.0 0.85 - 0.60 6.58 N TLSDGV9 IT Psagot STOXX Glbl Select Div 100 - - - 100 1.00 7.86 NSMLE GY Source - BofAml Hedge Fund Fact. € 0 - - - - 1.47 N INTDB27 IT Index Sal Ltd - Tel Div 20 - - - - - - NTCSTS14 IT PsagotS&P Global STARS Custom - - - - 1.00 - N TLSD2G4 IT Tali Dividend Scandinavia - - - 20 1.10 - NDWDEB FP BNP Mean Reverting Europe - 0.0 0.43 - 0.95 - N KSMSDGL IT KSM Global Dividend - - - 100 1.00 - NN816B FP BNP Risk Controlled 15 Eurozone Equity TR - 0.0 0.52 15 0.80 - N TSD3E12 IT Tali EuroSTOXX Select Div 30 - - - - 1.00 - N2052B FP EasyETN Key Idea Europe - 0.0 0.37 - 0.65 - N KSMSD3E IT KSM Euro Dividend - - - - 0.80 - NFundamental TLASTR8 IT Psagot Australia Select Dividend 30 - - - 30 1.00 - NPSRU LN Pow erShares FTSE RAFI UK Fund 124 0.7 0.39 100 0.50 0.75 N TLICND7 IT Tali DJ Canada Select Dividend - - - - 1.00 8.76 NPSRE LN Pow erShares FTSE RAFI Europe 9 0.0 0.22 479 0.50 - N HTD2017 IT Harel Sal Tel-Div Index - - - 35 0.50 - NMain X-listings: PEF IM (EUR) TLIGRM6 IT Tali Dividend Germany - - - 20 - - NPSRM LN Pow erShares FTSE RAFI Emerging 9 0.0 0.57 360 0.65 - N Socially ResponsibleMain X-listings: PEHH SW (USD), PEH IM (EUR) INRG LN iShares S&P Global Clean Energy 91 0.1 0.67 30 0.65 1.49 NREU IM Lyxor RAFI Europe 8 0.0 0.72 - 0.60 0.06 N Main X-listings: INRG IM (EUR), DNRG LN (USD)PSRW LN Pow erShares FTSE RAFI All World 8 0.0 0.74 3,033 0.50 1.42 N SUBEEX GY iShares EuroSTOXX Sustainability 40 73 0.2 0.41 - 0.41 0.55 NPSRD LN Pow erShares FTSE RAFI Global1000 5 0.0 0.52 1,016 0.50 - N NRJ FP Lyxor New Energy 52 0.1 0.66 - 0.60 1.16 NMain X-listings: PXF IM (EUR) ECN FP EasyETF Low Carbon 100 Eur 43 0.0 0.13 100 0.60 0.24 N
Broad Based Style
Style
1 Option Liquidity (H / M / L / N - High / Medium / Low / None)2 / - Significant increase / decrease in shares outstanding in last one year
EMEA Listed ETFs
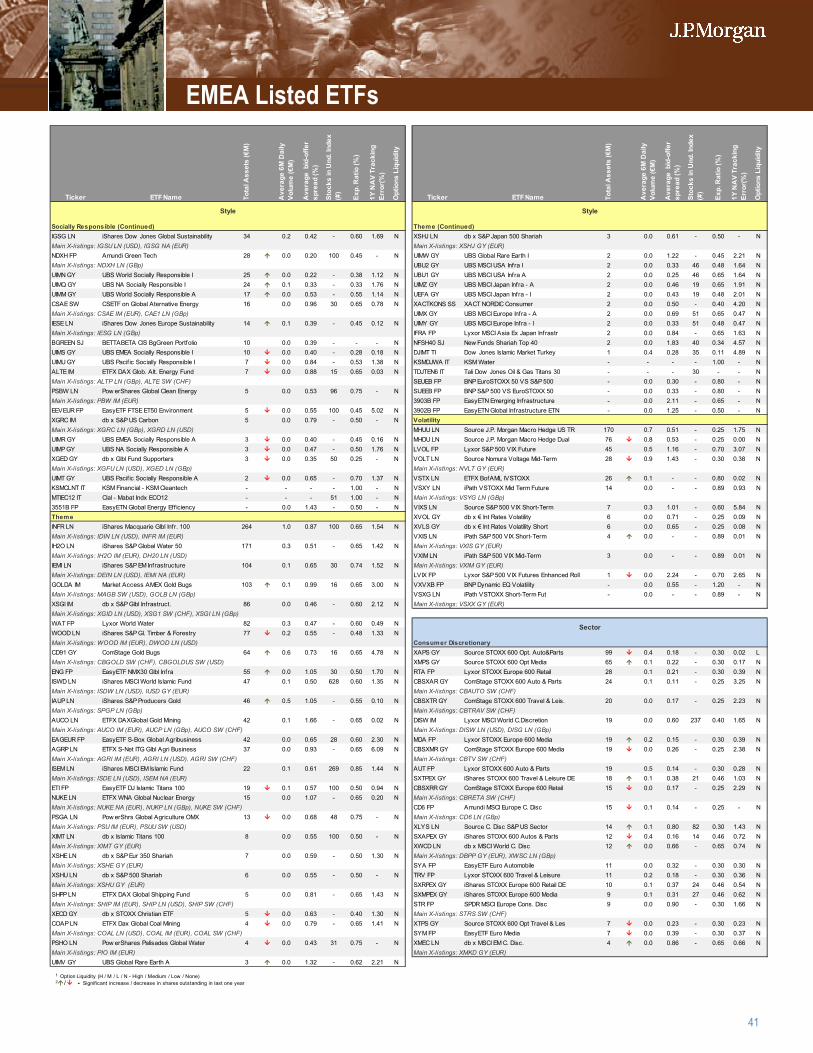
41
Ticker ETF Name Tota
l Ass
ets
(€M
)
Ave
rage
6M
Dai
ly
Volu
me
(€M
)
Ave
rage
bid
-offe
r sp
read
(%)
Stoc
ks in
Und
. Ind
ex
(#)
Exp.
Rat
io (%
)
1Y N
AV
Trac
king
Er
ror(
%)
Opt
ions
Liq
uidi
ty
Ticker ETF Name Tota
l Ass
ets
(€M
)
Ave
rage
6M
Dai
ly
Volu
me
(€M
)
Ave
rage
bid
-offe
r sp
read
(%)
Stoc
ks in
Und
. Ind
ex
(#)
Exp.
Rat
io (%
)
1Y N
AV
Trac
king
Er
ror(
%)
Opt
ions
Liq
uidi
ty
Socially Responsible (Continued) Theme (Continued)IGSG LN iShares Dow Jones Global Sustainability 34 0.2 0.42 - 0.60 1.69 N XSHJ LN db x S&P Japan 500 Shariah 3 0.0 0.61 - 0.50 - NMain X-listings: IGSU LN (USD), IGSG NA (EUR) Main X-listings: XSHJ GY (EUR)NDXH FP Amundi Green Tech 28 0.0 0.20 100 0.45 - N UIMW GY UBS Global Rare Earth I 2 0.0 1.22 - 0.45 2.21 NMain X-listings: NDXH LN (GBp) UBU2 GY UBS MSCI USA Infra I 2 0.0 0.33 46 0.48 1.64 NUIMN GY UBS World Socially Responsible I 25 0.0 0.22 - 0.38 1.12 N UBU1 GY UBS MSCI USA Infra A 2 0.0 0.25 46 0.65 1.64 NUIMQ GY UBS NA Socially Responsible I 24 0.1 0.33 - 0.33 1.76 N UIMZ GY UBS MSCI Japan Infra - A 2 0.0 0.46 19 0.65 1.91 NUIMM GY UBS World Socially Responsible A 17 0.0 0.53 - 0.55 1.14 N UEFA GY UBS MSCI Japan Infra - I 2 0.0 0.43 19 0.48 2.01 NCSAE SW CSETF on Global Aternative Energy 16 0.0 0.96 30 0.65 0.78 N XACTKONS SS XACT NORDIC Consumer 2 0.0 0.50 - 0.40 4.20 NMain X-listings: CSAE IM (EUR), CAE1 LN (GBp) UIMX GY UBS MSCI Europe Infra - A 2 0.0 0.69 51 0.65 0.47 NIESE LN iShares Dow Jones Europe Sustainability 14 0.1 0.39 - 0.45 0.12 N UIMY GY UBS MSCI Europe Infra - I 2 0.0 0.33 51 0.48 0.47 NMain X-listings: IESG LN (GBp) IFRA FP Lyxor MSCI Asia Ex Japan Infrastr 2 0.0 0.84 - 0.65 1.63 NBGREEN SJ BETTABETA CIS BgGreen Portfolio 10 0.0 0.39 - - - N NFSH40 SJ New Funds Shariah Top 40 2 0.0 1.83 40 0.34 4.57 NUIMS GY UBS EMEA Socially Responsible I 10 0.0 0.40 - 0.28 0.18 N DJIMT TI Dow Jones Islamic Market Turkey 1 0.4 0.28 35 0.11 4.89 NUIMU GY UBS Pacif ic Socially Responsible I 7 0.0 0.84 - 0.53 1.38 N KSMDJWA IT KSM Water - - - - 1.00 - NALTE IM ETFX DAX Glob. Alt. Energy Fund 7 0.0 0.88 15 0.65 0.03 N TDJTEN6 IT Tali Dow Jones Oil & Gas Titans 30 - - - 30 - - NMain X-listings: ALTP LN (GBp), ALTE SW (CHF) SEUEB FP BNP EuroSTOXX 50 VS S&P 500 - 0.0 0.30 - 0.80 - NPSBW LN Pow erShares Global Clean Energy 5 0.0 0.53 96 0.75 - N SUEEB FP BNP S&P 500 VS EuroSTOXX 50 - 0.0 0.33 - 0.80 - NMain X-listings: PBW IM (EUR) 3903B FP EasyETN Emerging Infrastructure - 0.0 2.11 - 0.65 - NEEVEUR FP EasyETF FTSE ET50 Environment 5 0.0 0.55 100 0.45 5.02 N 3902B FP EasyETN Global Infrastructure ETN - 0.0 1.25 - 0.50 - NXGRC IM db x S&P US Carbon 5 0.0 0.79 - 0.50 - N VolatilityMain X-listings: XGRC LN (GBp), XGRD LN (USD) MHUU LN Source J.P. Morgan Macro Hedge US TR 170 0.7 0.51 - 0.25 1.75 NUIMR GY UBS EMEA Socially Responsible A 3 0.0 0.40 - 0.45 0.16 N MHDU LN Source J.P. Morgan Macro Hedge Dual 76 0.8 0.53 - 0.25 0.00 NUIMP GY UBS NA Socially Responsible A 3 0.0 0.47 - 0.50 1.76 N LVOL FP Lyxor S&P 500 VIX Future 45 0.5 1.16 - 0.70 3.07 NXGED GY db x Glbl Fund Supporters 3 0.0 0.35 50 0.25 - N VOLT LN Source Nomura Voltage Mid-Term 28 0.9 1.43 - 0.30 0.38 NMain X-listings: XGFU LN (USD), XGED LN (GBp) Main X-listings: NVLT GY (EUR)UIMT GY UBS Pacif ic Socially Responsible A 2 0.0 0.65 - 0.70 1.37 N VSTX LN ETFX BofAML IVSTOXX 26 0.1 - - 0.80 0.02 NKSMCLNT IT KSM Financial - KSM Cleantech - - - - 1.00 - N VSXY LN iPath VSTOXX Mid Term Future 14 0.0 - - 0.89 0.93 NMTIEC12 IT Clal - Mabat Indx ECO12 - - - 51 1.00 - N Main X-listings: VSYG LN (GBp)3551B FP EasyETN Global Energy Eff iciency - 0.0 1.43 - 0.50 - N VIXS LN Source S&P 500 VIX Short-Term 7 0.3 1.01 - 0.60 5.84 NTheme XVOL GY db x € Int Rates Volatility 6 0.0 0.71 - 0.25 0.09 NINFR LN iShares Macquarie Glbl Infr. 100 264 1.0 0.87 100 0.65 1.54 N XVLS GY db x € Int Rates Volatility Short 6 0.0 0.65 - 0.25 0.08 NMain X-listings: IDIN LN (USD), INFR IM (EUR) VXIS LN iPath S&P 500 VIX Short-Term 4 0.0 - - 0.89 0.01 NIH2O LN iShares S&P Global Water 50 171 0.3 0.51 - 0.65 1.42 N Main X-listings: VXIS GY (EUR)Main X-listings: IH2O IM (EUR), DH20 LN (USD) VXIM LN iPath S&P 500 VIX Mid-Term 3 0.0 - - 0.89 0.01 NIEMI LN iShares S&P EM Infrastructure 104 0.1 0.65 30 0.74 1.52 N Main X-listings: VXIM GY (EUR)Main X-listings: DEIN LN (USD), IEMI NA (EUR) LVIX FP Lyxor S&P 500 VIX Futures Enhanced Roll 1 0.0 2.24 - 0.70 2.65 NGOLDA IM Market Access AMEX Gold Bugs 103 0.1 0.99 16 0.65 3.00 N VXVXB FP BNP Dynamic EQ Volatility - 0.0 0.55 - 1.20 - NMain X-listings: MAGB SW (USD), GOLB LN (GBp) VSXG LN iPath VSTOXX Short-Term Fut - 0.0 - - 0.89 - NXSGI IM db x S&P Glbl Infrastruct. 86 0.0 0.46 - 0.60 2.12 N Main X-listings: VSXX GY (EUR)Main X-listings: XGID LN (USD), XSG1 SW (CHF), XSGI LN (GBp)WAT FP Lyxor World Water 82 0.3 0.47 - 0.60 0.49 NWOOD LN iShares S&P Gl. Timber & Forestry 77 0.2 0.55 - 0.48 1.33 NMain X-listings: WOOD IM (EUR), DWOD LN (USD) Consumer DiscretionaryCD91 GY ComStage Gold Bugs 64 0.6 0.73 16 0.65 4.78 N XAPS GY Source STOXX 600 Opt. Auto&Parts 99 0.4 0.18 - 0.30 0.02 LMain X-listings: CBGOLD SW (CHF), CBGOLDUS SW (USD) XMPS GY Source STOXX 600 Opt Media 65 0.1 0.22 - 0.30 0.17 NENG FP EasyETF NMX30 Glbl Infra 55 0.0 1.05 30 0.50 1.70 N RTA FP Lyxor STOXX Europe 600 Retail 28 0.1 0.21 - 0.30 0.39 NISWD LN iShares MSCI World Islamic Fund 47 0.1 0.50 628 0.60 1.35 N CBSXAR GY ComStage STOXX 600 Auto & Parts 24 0.1 0.11 - 0.25 3.25 NMain X-listings: ISDW LN (USD), IUSD GY (EUR) Main X-listings: CBAUTO SW (CHF)IAUP LN iShares S&P Producers Gold 46 0.5 1.05 - 0.55 0.10 N CBSXTR GY ComStage STOXX 600 Travel & Leis. 20 0.0 0.17 - 0.25 2.23 NMain X-listings: SPGP LN (GBp) Main X-listings: CBTRAV SW (CHF)AUCO LN ETFX DAXGlobal Gold Mining 42 0.1 1.66 - 0.65 0.02 N DISW IM Lyxor MSCI World C.Discretion 19 0.0 0.60 237 0.40 1.65 NMain X-listings: AUCO IM (EUR), AUCP LN (GBp), AUCO SW (CHF) Main X-listings: DISW LN (USD), DISG LN (GBp)EAGEUR FP EasyETF S-Box Global Agribusiness 42 0.0 0.65 28 0.60 2.30 N MDA FP Lyxor STOXX Europe 600 Media 19 0.2 0.15 - 0.30 0.39 NAGRP LN ETFX S-Net ITG Glbl Agri Business 37 0.0 0.93 - 0.65 6.09 N CBSXMR GY ComStage STOXX Europe 600 Media 19 0.0 0.26 - 0.25 2.38 NMain X-listings: AGRI IM (EUR), AGRI LN (USD), AGRI SW (CHF) Main X-listings: CBTV SW (CHF)ISEM LN iShares MSCI EM Islamic Fund 22 0.1 0.61 269 0.85 1.44 N AUT FP Lyxor STOXX 600 Auto & Parts 19 0.5 0.14 - 0.30 0.28 NMain X-listings: ISDE LN (USD), ISEM NA (EUR) SXTPEX GY iShares STOXX 600 Travel & Leisure DE 18 0.1 0.38 21 0.46 1.03 NETI FP EasyETF DJ Islamic Titans 100 19 0.1 0.57 100 0.50 0.94 N CBSXRR GY ComStage STOXX Europe 600 Retail 15 0.0 0.17 - 0.25 2.29 NNUKE LN ETFX WNA Global Nuclear Energy 15 0.0 1.07 - 0.65 0.20 N Main X-listings: CBRETA SW (CHF)Main X-listings: NUKE NA (EUR), NUKP LN (GBp), NUKE SW (CHF) CD6 FP Amundi MSCI Europe C. Disc 15 0.1 0.14 - 0.25 - NPSGA LN Pow erShrs Global Agriculture OMX 13 0.0 0.68 48 0.75 - N Main X-listings: CD6 LN (GBp)Main X-listings: PSU IM (EUR), PSUU SW (USD) XLYS LN Source C. Disc S&P US Sector 14 0.1 0.80 82 0.30 1.43 NXIMT LN db x Islamic Titans 100 8 0.0 0.55 100 0.50 - N SXAPEX GY iShares STOXX 600 Autos & Parts 12 0.4 0.16 14 0.46 0.72 NMain X-listings: XIMT GY (EUR) XWCD LN db x MSCI World C. Disc 12 0.0 0.66 - 0.65 0.74 NXSHE LN db x S&P Eur 350 Shariah 7 0.0 0.59 - 0.50 1.30 N Main X-listings: DBPP GY (EUR), XWSC LN (GBp)Main X-listings: XSHE GY (EUR) SYA FP EasyETF Euro Automobile 11 0.0 0.32 - 0.30 0.30 NXSHU LN db x S&P 500 Shariah 6 0.0 0.55 - 0.50 - N TRV FP Lyxor STOXX 600 Travel & Leisure 11 0.2 0.18 - 0.30 0.36 NMain X-listings: XSHU GY (EUR) SXRPEX GY iShares STOXX Europe 600 Retail DE 10 0.1 0.37 24 0.46 0.54 NSHPP LN ETFX DAX Global Shipping Fund 5 0.0 0.81 - 0.65 1.43 N SXMPEX GY iShares STOXX Europe 600 Media 9 0.1 0.31 27 0.46 0.62 NMain X-listings: SHIP IM (EUR), SHIP LN (USD), SHIP SW (CHF) STR FP SPDR MSCI Europe Cons. Disc 9 0.0 0.90 - 0.30 1.66 NXECD GY db x STOXX Christian ETF 5 0.0 0.63 - 0.40 1.30 N Main X-listings: STRS SW (CHF)COAP LN ETFX Dax Global Coal Mining 4 0.0 0.79 - 0.65 1.41 N XTPS GY Source STOXX 600 Opt Travel & Les 7 0.0 0.23 - 0.30 0.23 NMain X-listings: COAL LN (USD), COAL IM (EUR), COAL SW (CHF) SYM FP EasyETF Euro Media 7 0.0 0.39 - 0.30 0.37 NPSHO LN Pow erShares Palisades Global Water 4 0.0 0.43 31 0.75 - N XMEC LN db x MSCI EM C. Disc. 4 0.0 0.86 - 0.65 0.66 NMain X-listings: PIO IM (EUR) Main X-listings: XMKD GY (EUR)UIMV GY UBS Global Rare Earth A 3 0.0 1.32 - 0.62 2.21 N
Style Style
Sector
1 Option Liquidity (H / M / L / N - High / Medium / Low / None)2 / - Significant increase / decrease in shares outstanding in last one year
EMEA Listed ETFs
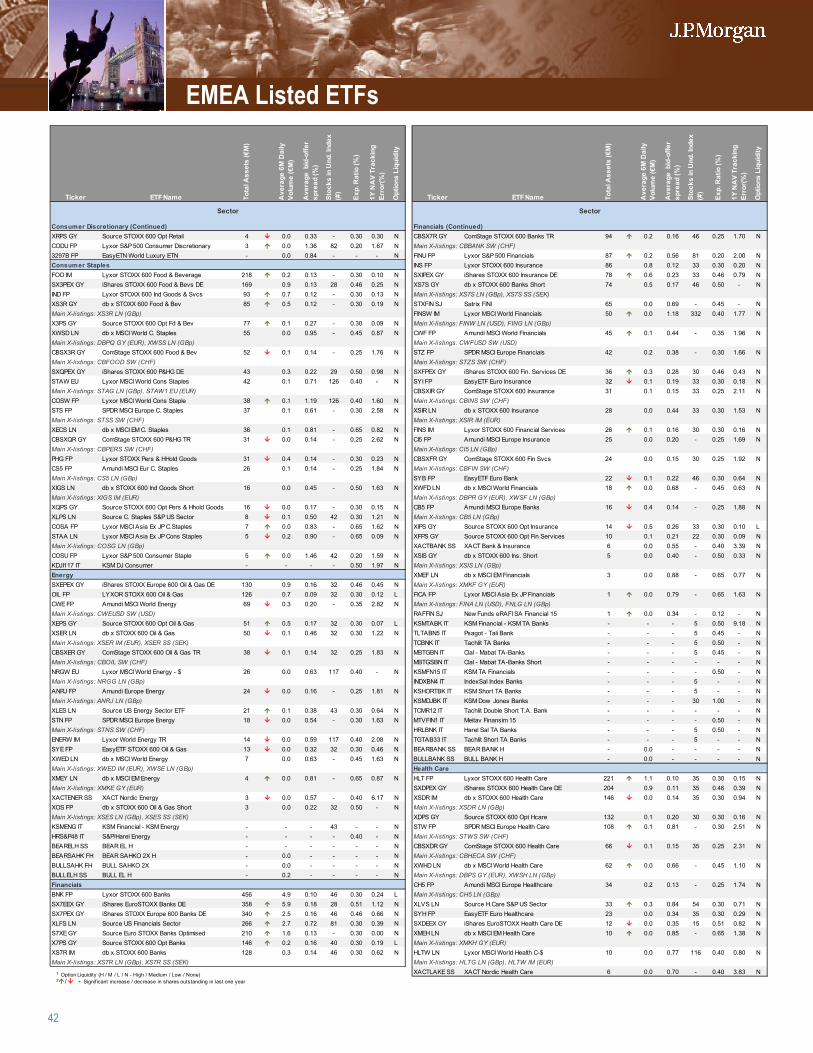
42
Ticker ETF Name Tota
l Ass
ets
(€M
)
Ave
rage
6M
Dai
ly
Volu
me
(€M
)
Ave
rage
bid
-offe
r sp
read
(%)
Stoc
ks in
Und
. Ind
ex
(#)
Exp.
Rat
io (%
)
1Y N
AV
Trac
king
Er
ror(
%)
Opt
ions
Liq
uidi
ty
Ticker ETF Name Tota
l Ass
ets
(€M
)
Ave
rage
6M
Dai
ly
Volu
me
(€M
)
Ave
rage
bid
-offe
r sp
read
(%)
Stoc
ks in
Und
. Ind
ex
(#)
Exp.
Rat
io (%
)
1Y N
AV
Trac
king
Er
ror(
%)
Opt
ions
Liq
uidi
ty
Consumer Discretionary (Continued) Financials (Continued)XRPS GY Source STOXX 600 Opt Retail 4 0.0 0.33 - 0.30 0.30 N CBSX7R GY ComStage STOXX 600 Banks TR 94 0.2 0.16 46 0.25 1.70 NCODU FP Lyxor S&P 500 Consumer Discretionary 3 0.0 1.36 82 0.20 1.67 N Main X-listings: CBBANK SW (CHF)3297B FP EasyETN World Luxury ETN - 0.0 0.84 - - - N FINU FP Lyxor S&P 500 Financials 87 0.2 0.56 81 0.20 2.00 NConsumer Staples INS FP Lyxor STOXX 600 Insurance 86 0.8 0.12 33 0.30 0.20 NFOO IM Lyxor STOXX 600 Food & Beverage 218 0.2 0.13 - 0.30 0.10 N SXIPEX GY iShares STOXX 600 Insurance DE 78 0.6 0.23 33 0.46 0.79 NSX3PEX GY iShares STOXX 600 Food & Bevs DE 169 0.9 0.13 28 0.46 0.25 N XS7S GY db x STOXX 600 Banks Short 74 0.5 0.17 46 0.50 - NIND FP Lyxor STOXX 600 Ind Goods & Svcs 93 0.7 0.12 - 0.30 0.13 N Main X-listings: XS7S LN (GBp), XS7S SS (SEK)XS3R GY db x STOXX 600 Food & Bev 85 0.5 0.12 - 0.30 0.19 N STXFIN SJ Satrix FINI 65 0.0 0.69 - 0.45 - NMain X-listings: XS3R LN (GBp) FINSW IM Lyxor MSCI World Financials 50 0.0 1.18 332 0.40 1.77 NX3PS GY Source STOXX 600 Opt Fd & Bev 77 0.1 0.27 - 0.30 0.09 N Main X-listings: FINW LN (USD), FING LN (GBp)XWSD LN db x MSCI World C. Staples 55 0.0 0.95 - 0.45 0.87 N CWF FP Amundi MSCI World Financials 45 0.1 0.44 - 0.35 1.96 NMain X-listings: DBPQ GY (EUR), XWSS LN (GBp) Main X-listings: CWFUSD SW (USD)CBSX3R GY ComStage STOXX 600 Food & Bev 52 0.1 0.14 - 0.25 1.76 N STZ FP SPDR MSCI Europe Financials 42 0.2 0.38 - 0.30 1.66 NMain X-listings: CBFOOD SW (CHF) Main X-listings: STZS SW (CHF)SXQPEX GY iShares STOXX 600 P&HG DE 43 0.3 0.22 29 0.50 0.98 N SXFPEX GY iShares STOXX 600 Fin. Services DE 36 0.3 0.28 30 0.46 0.43 NSTAW EU Lyxor MSCI World Cons Staples 42 0.1 0.71 126 0.40 - N SYI FP EasyETF Euro Insurance 32 0.1 0.19 33 0.30 0.18 NMain X-listings: STAG LN (GBp), STAW1 EU (EUR) CBSXIR GY ComStage STOXX 600 Insurance 31 0.1 0.15 33 0.25 2.11 NCOSW FP Lyxor MSCI World Cons Staple 38 0.1 1.19 126 0.40 1.60 N Main X-listings: CBINS SW (CHF)STS FP SPDR MSCI Europe C. Staples 37 0.1 0.61 - 0.30 2.58 N XSIR LN db x STOXX 600 Insurance 28 0.0 0.44 33 0.30 1.53 NMain X-listings: STSS SW (CHF) Main X-listings: XSIR IM (EUR)XECS LN db x MSCI EM C. Staples 36 0.1 0.81 - 0.65 0.82 N FINS IM Lyxor STOXX 600 Financial Services 26 0.1 0.16 30 0.30 0.16 NCBSXQR GY ComStage STOXX 600 P&HG TR 31 0.0 0.14 - 0.25 2.62 N CI5 FP Amundi MSCI Europe Insurance 25 0.0 0.20 - 0.25 1.69 NMain X-listings: CBPERS SW (CHF) Main X-listings: CI5 LN (GBp)PHG FP Lyxor STOXX Pers & HHold Goods 31 0.4 0.14 - 0.30 0.23 N CBSXFR GY ComStage STOXX 600 Fin Svcs 24 0.0 0.15 30 0.25 1.92 NCS5 FP Amundi MSCI Eur C. Staples 26 0.1 0.14 - 0.25 1.84 N Main X-listings: CBFIN SW (CHF)Main X-listings: CS5 LN (GBp) SYB FP EasyETF Euro Bank 22 0.1 0.22 46 0.30 0.64 NXIGS LN db x STOXX 600 Ind Goods Short 16 0.0 0.45 - 0.50 1.63 N XWFD LN db x MSCI World Financials 18 0.0 0.68 - 0.45 0.63 NMain X-listings: XIGS IM (EUR) Main X-listings: DBPR GY (EUR), XWSF LN (GBp)XQPS GY Source STOXX 600 Opt Pers & Hhold Goods 16 0.0 0.17 - 0.30 0.15 N CB5 FP Amundi MSCI Europe Banks 16 0.4 0.14 - 0.25 1.88 NXLPS LN Source C. Staples S&P US Sector 8 0.1 0.50 42 0.30 1.21 N Main X-listings: CB5 LN (GBp)COSA FP Lyxor MSCI Asia Ex JP C.Staples 7 0.0 0.83 - 0.65 1.62 N XIPS GY Source STOXX 600 Opt Insurance 14 0.5 0.26 33 0.30 0.10 LSTAA LN Lyxor MSCI Asia Ex JP Cons Staples 5 0.2 0.90 - 0.65 0.09 N XFPS GY Source STOXX 600 Opt Fin Services 10 0.1 0.21 22 0.30 0.09 NMain X-listings: COSG LN (GBp) XACTBANK SS XACT Bank & Insurance 6 0.0 0.55 - 0.40 3.39 NCOSU FP Lyxor S&P 500 Consumer Staple 5 0.0 1.46 42 0.20 1.59 N XSIS GY db x STOXX 600 Ins. Short 5 0.0 0.40 - 0.50 0.33 NKDJI117 IT KSM DJ Consumer - - - - 0.50 1.97 N Main X-listings: XSIS LN (GBp)Energy XMEF LN db x MSCI EM Financials 3 0.0 0.88 - 0.65 0.77 NSXEPEX GY iShares STOXX Europe 600 Oil & Gas DE 130 0.9 0.16 32 0.46 0.45 N Main X-listings: XMKF GY (EUR)OIL FP LYXOR STOXX 600 Oil & Gas 126 0.7 0.09 32 0.30 0.12 L FICA FP Lyxor MSCI Asia Ex JP Financials 1 0.0 0.79 - 0.65 1.63 NCWE FP Amundi MSCI World Energy 69 0.3 0.20 - 0.35 2.82 N Main X-listings: FINA LN (USD), FNLG LN (GBp)Main X-listings: CWEUSD SW (USD) RAFFIN SJ New Funds eRAFI SA Financial 15 1 0.0 0.34 - 0.12 - NXEPS GY Source STOXX 600 Opt Oil & Gas 51 0.5 0.17 32 0.30 0.07 L KSMTABK IT KSM Financial - KSM TA Banks - - - 5 0.50 9.18 NXSER LN db x STOXX 600 Oil & Gas 50 0.1 0.46 32 0.30 1.22 N TLTABN5 IT Psagot - Tali Bank - - - 5 0.45 - NMain X-listings: XSER IM (EUR), XSER SS (SEK) TCBNK IT Tachlit TA Banks - - - 5 0.50 - NCBSXER GY ComStage STOXX 600 Oil & Gas TR 38 0.1 0.14 32 0.25 1.83 N MBTGBN IT Clal - Mabat TA-Banks - - - 5 0.45 - NMain X-listings: CBOIL SW (CHF) MBTGSBN IT Clal - Mabat TA-Banks Short - - - - - - NNRGW EU Lyxor MSCI World Energy - $ 26 0.0 0.63 117 0.40 - N KSMFN15 IT KSM TA Financials - - - - 0.50 - NMain X-listings: NRGG LN (GBp) INDXBN4 IT IndexSal Index Banks - - - 5 - - NANRJ FP Amundi Europe Energy 24 0.0 0.16 - 0.25 1.81 N KSHORTBK IT KSM Short TA Banks - - - 5 - - NMain X-listings: ANRJ LN (GBp) KSMDJBK IT KSM Dow Jones Banks - - - 30 1.00 - NXLES LN Source US Energy Sector ETF 21 0.1 0.38 43 0.30 0.64 N TCMR12 IT Tachlit Double Short T.A. Bank - - - - - - NSTN FP SPDR MSCI Europe Energy 18 0.0 0.54 - 0.30 1.63 N MTVFIN1 IT Meitav Finansim 15 - - - - 0.50 - NMain X-listings: STNS SW (CHF) HRLBNK IT Harel Sal TA Banks - - - 5 0.50 - NENERW IM Lyxor World Energy TR 14 0.0 0.59 117 0.40 2.08 N TGTAB33 IT Tachlit Short TA Banks - - - 5 - - NSYE FP EasyETF STOXX 600 Oil & Gas 13 0.0 0.32 32 0.30 0.46 N BEARBANK SS BEAR BANK H - 0.0 - - - - NXWED LN db x MSCI World Energy 7 0.0 0.63 - 0.45 1.63 N BULLBANK SS BULL BANK H - 0.0 - - - - NMain X-listings: XWED IM (EUR), XWSE LN (GBp) Health CareXMEY LN db x MSCI EM Energy 4 0.0 0.81 - 0.65 0.87 N HLT FP Lyxor STOXX 600 Health Care 221 1.1 0.10 35 0.30 0.15 NMain X-listings: XMKE GY (EUR) SXDPEX GY iShares STOXX 600 Health Care DE 204 0.9 0.11 35 0.46 0.39 NXACTENER SS XACT Nordic Energy 3 0.0 0.57 - 0.40 6.17 N XSDR IM db x STOXX 600 Health Care 146 0.0 0.14 35 0.30 0.94 NXOS FP db x STOXX 600 Oil & Gas Short 3 0.0 0.22 32 0.50 - N Main X-listings: XSDR LN (GBp)Main X-listings: XSES LN (GBp), XSES SS (SEK) XDPS GY Source STOXX 600 Opt Hcare 132 0.1 0.20 30 0.30 0.16 NKSMENG IT KSM Financial - KSM Energy - - - 43 - - N STW FP SPDR MSCI Europe Health Care 108 0.1 0.81 - 0.30 2.51 NHRS&P48 IT S&P/Harel Energy - - - - 0.40 - N Main X-listings: STWS SW (CHF)BEARELH SS BEAR EL H - - - - - - N CBSXDR GY ComStage STOXX 600 Health Care 66 0.1 0.15 35 0.25 2.31 NBEARSAHK FH BEAR SAHKO 2X H - 0.0 - - - - N Main X-listings: CBHECA SW (CHF)BULLSAHK FH BULL SAHKO 2X - 0.0 - - - - N XWHD LN db x MSCI World Health Care 62 0.0 0.66 - 0.45 1.10 NBULLELH SS BULL EL H - 0.2 - - - - N Main X-listings: DBPS GY (EUR), XWSH LN (GBp)Financials CH5 FP Amundi MSCI Europe Healthcare 34 0.2 0.13 - 0.25 1.74 NBNK FP Lyxor STOXX 600 Banks 456 4.9 0.10 46 0.30 0.24 L Main X-listings: CH5 LN (GBp)SX7EEX GY iShares EuroSTOXX Banks DE 358 5.9 0.18 28 0.51 1.12 N XLVS LN Source H.Care S&P US Sector 33 0.3 0.84 54 0.30 0.71 NSX7PEX GY iShares STOXX Europe 600 Banks DE 340 2.5 0.16 46 0.46 0.66 N SYH FP EasyETF Euro Healthcare 23 0.0 0.34 35 0.30 0.29 NXLFS LN Source US Financials Sector 266 2.7 0.72 81 0.30 0.39 N SXDEEX GY iShares EuroSTOXX Health Care DE 12 0.0 0.35 15 0.51 0.82 NS7XE GY Source Euro STOXX Banks Optimised 210 1.6 0.13 - 0.30 0.00 N XMEH LN db x MSCI EM Health Care 10 0.0 0.85 - 0.65 1.38 NX7PS GY Source STOXX 600 Opt Banks 146 0.2 0.16 40 0.30 0.19 L Main X-listings: XMKH GY (EUR)XS7R IM db x STOXX 600 Banks 128 0.3 0.14 46 0.30 0.62 N HLTW LN Lyxor MSCI World Health C-$ 10 0.0 0.77 116 0.40 0.80 NMain X-listings: XS7R LN (GBp), XS7R SS (SEK) Main X-listings: HLTG LN (GBp), HLTW IM (EUR)
XACTLAKE SS XACT Nordic Health Care 6 0.0 0.70 - 0.40 3.83 N
Sector Sector
1 Option Liquidity (H / M / L / N - High / Medium / Low / None)2 / - Significant increase / decrease in shares outstanding in last one year
EMEA Listed ETFs
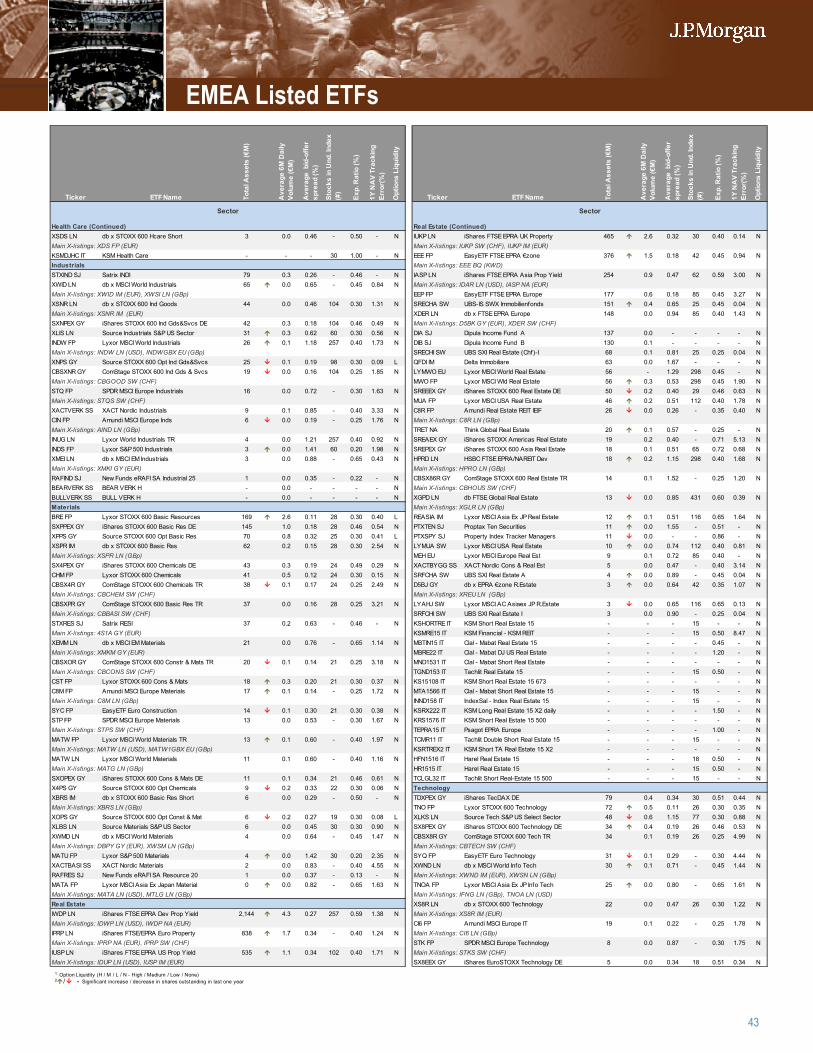
43
Ticker ETF Name Tota
l Ass
ets
(€M
)
Ave
rage
6M
Dai
ly
Volu
me
(€M
)
Ave
rage
bid
-offe
r sp
read
(%)
Stoc
ks in
Und
. Ind
ex
(#)
Exp.
Rat
io (%
)
1Y N
AV
Trac
king
Er
ror(
%)
Opt
ions
Liq
uidi
ty
Ticker ETF Name Tota
l Ass
ets
(€M
)
Ave
rage
6M
Dai
ly
Volu
me
(€M
)
Ave
rage
bid
-offe
r sp
read
(%)
Stoc
ks in
Und
. Ind
ex
(#)
Exp.
Rat
io (%
)
1Y N
AV
Trac
king
Er
ror(
%)
Opt
ions
Liq
uidi
ty
Health Care (Continued) Real Estate (Continued)XSDS LN db x STOXX 600 Hcare Short 3 0.0 0.46 - 0.50 - N IUKP LN iShares FTSE EPRA UK Property 465 2.6 0.32 30 0.40 0.14 NMain X-listings: XDS FP (EUR) Main X-listings: IUKP SW (CHF), IUKP IM (EUR)KSMDJHC IT KSM Health Care - - - 30 1.00 - N EEE FP EasyETF FTSE EPRA €zone 376 1.5 0.18 42 0.45 0.94 NIndustrials Main X-listings: EEE BQ (KWD)STXIND SJ Satrix INDI 79 0.3 0.26 - 0.46 - N IASP LN iShares FTSE EPRA Asia Prop Yield 254 0.9 0.47 62 0.59 3.00 NXWID LN db x MSCI World Industrials 65 0.0 0.65 - 0.45 0.84 N Main X-listings: IDAR LN (USD), IASP NA (EUR)Main X-listings: XWID IM (EUR), XWSI LN (GBp) EEP FP EasyETF FTSE EPRA Europe 177 0.6 0.18 85 0.45 3.27 NXSNR LN db x STOXX 600 Ind Goods 44 0.0 0.46 104 0.30 1.31 N SRECHA SW UBS-IS SWX Immobilienfonds 151 0.4 0.65 25 0.45 0.04 NMain X-listings: XSNR IM (EUR) XDER LN db x FTSE EPRA Europe 148 0.0 0.94 85 0.40 1.43 NSXNPEX GY iShares STOXX 600 Ind Gds&Svcs DE 42 0.3 0.18 104 0.46 0.49 N Main X-listings: D5BK GY (EUR), XDER SW (CHF)XLIS LN Source Industrials S&P US Sector 31 0.3 0.62 60 0.30 0.56 N DIA SJ Dipula Income Fund A 137 0.0 - - - - NINDW FP Lyxor MSCI World Industrials 26 0.1 1.18 257 0.40 1.73 N DIB SJ Dipula Income Fund B 130 0.1 - - - - NMain X-listings: INDW LN (USD), INDWGBX EU (GBp) SRECHI SW UBS SXI Real Estate (Chf)-I 68 0.1 0.81 25 0.25 0.04 NXNPS GY Source STOXX 600 Opt Ind Gds&Svcs 25 0.1 0.19 98 0.30 0.09 L QFDI IM Delta Immobiliare 63 0.0 1.67 - - - NCBSXNR GY ComStage STOXX 600 Ind Gds & Svcs 19 0.0 0.16 104 0.25 1.85 N LYMWO EU Lyxor MSCI World Real Estate 56 - 1.29 298 0.45 - NMain X-listings: CBGOOD SW (CHF) MWO FP Lyxor MSCI Wld Real Estate 56 0.3 0.53 298 0.45 1.90 NSTQ FP SPDR MSCI Europe Industrials 16 0.0 0.72 - 0.30 1.63 N SREEEX GY iShares STOXX 600 Real Estate DE 50 0.2 0.40 29 0.46 0.63 NMain X-listings: STQS SW (CHF) MUA FP Lyxor MSCI USA Real Estate 46 0.2 0.51 112 0.40 1.78 NXACTVERK SS XACT Nordic Industrials 9 0.1 0.85 - 0.40 3.33 N C8R FP Amundi Real Estate REIT IEIF 26 0.0 0.26 - 0.35 0.40 NCIN FP Amundi MSCI Europe Inds 6 0.0 0.19 - 0.25 1.76 N Main X-listings: C8R LN (GBp)Main X-listings: AIND LN (GBp) TRET NA Think Global Real Estate 20 0.1 0.57 - 0.25 - NINUG LN Lyxor World Industrials TR 4 0.0 1.21 257 0.40 0.92 N SREAEX GY iShares STOXX Americas Real Estate 19 0.2 0.40 - 0.71 5.13 NINDS FP Lyxor S&P 500 Industrials 3 0.0 1.41 60 0.20 1.98 N SREPEX GY iShares STOXX 600 Asia Real Estate 18 0.1 0.51 65 0.72 0.68 NXMEI LN db x MSCI EM Industrials 3 0.0 0.88 - 0.65 0.43 N HPRD LN HSBC FTSE EPRA/NAREIT Dev 18 0.2 1.15 298 0.40 1.68 NMain X-listings: XMKI GY (EUR) Main X-listings: HPRO LN (GBp)RAFIND SJ New Funds eRAFI SA Industrial 25 1 0.0 0.35 - 0.22 - N CBSX86R GY ComStage STOXX 600 Real Estate TR 14 0.1 1.52 - 0.25 1.20 NBEARVERK SS BEAR VERK H - 0.0 - - - - N Main X-listings: CBHOUS SW (CHF)BULLVERK SS BULL VERK H - 0.0 - - - - N XGPD LN db FTSE Global Real Estate 13 0.0 0.85 431 0.60 0.39 NMaterials Main X-listings: XGLR LN (GBp)BRE FP Lyxor STOXX 600 Basic Resources 169 2.6 0.11 28 0.30 0.40 L REASIA IM Lyxor MSCI Asia Ex JP Real Estate 12 0.1 0.51 116 0.65 1.64 NSXPPEX GY iShares STOXX 600 Basic Res DE 145 1.0 0.18 28 0.46 0.54 N PTXTEN SJ Proptax Ten Securities 11 0.0 1.55 - 0.51 - NXPPS GY Source STOXX 600 Opt Basic Res 70 0.8 0.32 25 0.30 0.41 L PTXSPY SJ Property Index Tracker Managers 11 0.0 - - 0.86 - NXSPR IM db x STOXX 600 Basic Res 62 0.2 0.15 28 0.30 2.54 N LYMUA SW Lyxor MSCI USA Real Estate 10 0.0 0.74 112 0.40 0.81 NMain X-listings: XSPR LN (GBp) MEH EU Lyxor MSCI Europe Real Est 9 0.1 0.72 85 0.40 - NSX4PEX GY iShares STOXX 600 Chemicals DE 43 0.3 0.19 24 0.49 0.29 N XACTBYGG SS XACT Nordic Cons & Real Est 5 0.0 0.47 - 0.40 3.14 NCHM FP Lyxor STOXX 600 Chemicals 41 0.5 0.12 24 0.30 0.15 N SRFCHA SW UBS SXI Real Estate A 4 0.0 0.89 - 0.45 0.04 NCBSX4R GY ComStage STOXX 600 Chemicals TR 38 0.1 0.17 24 0.25 2.49 N D5BJ GY db x EPRA €zone R.Estate 3 0.0 0.64 42 0.35 1.07 NMain X-listings: CBCHEM SW (CHF) Main X-listings: XREU LN (GBp)CBSXPR GY ComStage STOXX 600 Basic Res TR 37 0.0 0.16 28 0.25 3.21 N LYAHJ SW Lyxor MSCI AC Asiaex JP R.Estate 3 0.0 0.65 116 0.65 0.13 NMain X-listings: CBBASI SW (CHF) SRFCHI SW UBS SXI Real Estate I 3 0.0 0.90 - 0.25 0.04 NSTXRES SJ Satrix RESI 37 0.2 0.63 - 0.46 - N KSHORTRE IT KSM Short Real Estate 15 - - - 15 - - NMain X-listings: 4S1A GY (EUR) KSMRE15 IT KSM Financial - KSM REIT - - - 15 0.50 8.47 NXEMM LN db x MSCI EM Materials 21 0.0 0.76 - 0.65 1.14 N MBTIN15 IT Clal - Mabat Real Estate 15 - - - - 0.45 - NMain X-listings: XMKM GY (EUR) MBRE22 IT Clal - Mabat DJ US Real Estate - - - - 1.20 - NCBSXOR GY ComStage STOXX 600 Constr & Mats TR 20 0.1 0.14 21 0.25 3.18 N MND1531 IT Clal - Mabat Short Real Estate - - - - - - NMain X-listings: CBCONS SW (CHF) TGND153 IT Tachlit Real Estate 15 - - - 15 0.50 - NCST FP Lyxor STOXX 600 Cons & Mats 18 0.3 0.20 21 0.30 0.37 N KS15108 IT KSM Short Real Estate 15 673 - - - - - - NC8M FP Amundi MSCI Europe Materials 17 0.1 0.14 - 0.25 1.72 N MTA1566 IT Clal - Mabat Short Real Estate 15 - - - 15 - - NMain X-listings: C8M LN (GBp) INND158 IT IndexSal - Index Real Estate 15 - - - 15 - - NSYC FP EasyETF Euro Construction 14 0.1 0.30 21 0.30 0.38 N KSRX222 IT KSM Long Real Estate 15 X2 daily - - - - 1.50 - NSTP FP SPDR MSCI Europe Materials 13 0.0 0.53 - 0.30 1.67 N KRS1576 IT KSM Short Real Estate 15 500 - - - - - - NMain X-listings: STPS SW (CHF) TEPRA15 IT Psagot EPRA Europe - - - - 1.00 - NMATW FP Lyxor MSCI World Materials TR 13 0.1 0.60 - 0.40 1.97 N TCMR11 IT Tachlit Double Short Real Estate 15 - - - 15 - - NMain X-listings: MATW LN (USD), MATW1GBX EU (GBp) KSRTREX2 IT KSM Short TA Real Estate 15 X2 - - - - - - NMATW LN Lyxor MSCI World Materials 11 0.1 0.60 - 0.40 1.16 N HFN1516 IT Harel Real Estate 15 - - - 18 0.50 - NMain X-listings: MATG LN (GBp) HR1515 IT Harel Real Estate 15 - - - 15 0.50 - NSXOPEX GY iShares STOXX 600 Cons & Mats DE 11 0.1 0.34 21 0.46 0.61 N TCLGL32 IT Tachlit Short Real-Estate 15 500 - - - 15 - - NX4PS GY Source STOXX 600 Opt Chemicals 9 0.2 0.33 22 0.30 0.06 N TechnologyXBRS IM db x STOXX 600 Basic Res Short 6 0.0 0.29 - 0.50 - N TDXPEX GY iShares TecDAX DE 79 0.4 0.34 30 0.51 0.44 NMain X-listings: XBRS LN (GBp) TNO FP Lyxor STOXX 600 Technology 72 0.5 0.11 26 0.30 0.35 NXOPS GY Source STOXX 600 Opt Const & Mat 6 0.2 0.27 19 0.30 0.08 L XLKS LN Source Tech S&P US Select Sector 48 0.6 1.15 77 0.30 0.88 NXLBS LN Source Materials S&P US Sector 6 0.0 0.45 30 0.30 0.90 N SX8PEX GY iShares STOXX 600 Technology DE 34 0.4 0.19 26 0.46 0.53 NXWMD LN db x MSCI World Materials 4 0.0 0.64 - 0.45 1.47 N CBSX8R GY ComStage STOXX 600 Tech TR 34 0.1 0.19 26 0.25 4.99 NMain X-listings: DBPY GY (EUR), XWSM LN (GBp) Main X-listings: CBTECH SW (CHF)MATU FP Lyxor S&P 500 Materials 4 0.0 1.42 30 0.20 2.35 N SYQ FP EasyETF Euro Technology 31 0.1 0.29 - 0.30 4.44 NXACTBASI SS XACT Nordic Materials 2 0.0 0.83 - 0.40 4.55 N XWND LN db x MSCI World Info Tech 30 0.1 0.71 - 0.45 1.44 NRAFRES SJ New Funds eRAFI SA Resource 20 1 0.0 0.37 - 0.13 - N Main X-listings: XWND IM (EUR), XWSN LN (GBp)MATA FP Lyxor MSCI Asia Ex Japan Material 0 0.0 0.82 - 0.65 1.63 N TNOA FP Lyxor MSCI Asia Ex JP Info Tech 25 0.0 0.80 - 0.65 1.61 NMain X-listings: MATA LN (USD), MTLG LN (GBp) Main X-listings: IFNG LN (GBp), TNOA LN (USD)Real Estate XS8R LN db x STOXX 600 Technology 22 0.0 0.47 26 0.30 1.22 NIWDP LN iShares FTSE EPRA Dev Prop Yield 2,144 4.3 0.27 257 0.59 1.38 N Main X-listings: XS8R IM (EUR)Main X-listings: IDWP LN (USD), IWDP NA (EUR) CI6 FP Amundi MSCI Europe IT 19 0.1 0.22 - 0.25 1.78 NIPRP LN iShares FTSE/EPRA Euro Property 838 1.7 0.34 - 0.40 1.24 N Main X-listings: CI6 LN (GBp)Main X-listings: IPRP NA (EUR), IPRP SW (CHF) STK FP SPDR MSCI Europe Technology 8 0.0 0.87 - 0.30 1.75 NIUSP LN iShares FTSE EPRA US Prop Yield 535 1.1 0.34 102 0.40 1.71 N Main X-listings: STKS SW (CHF)Main X-listings: IDUP LN (USD), IUSP IM (EUR) SX8EEX GY iShares EuroSTOXX Technology DE 5 0.0 0.34 18 0.51 0.34 N
Sector Sector
1 Option Liquidity (H / M / L / N - High / Medium / Low / None)2 / - Significant increase / decrease in shares outstanding in last one year
EMEA Listed ETFs
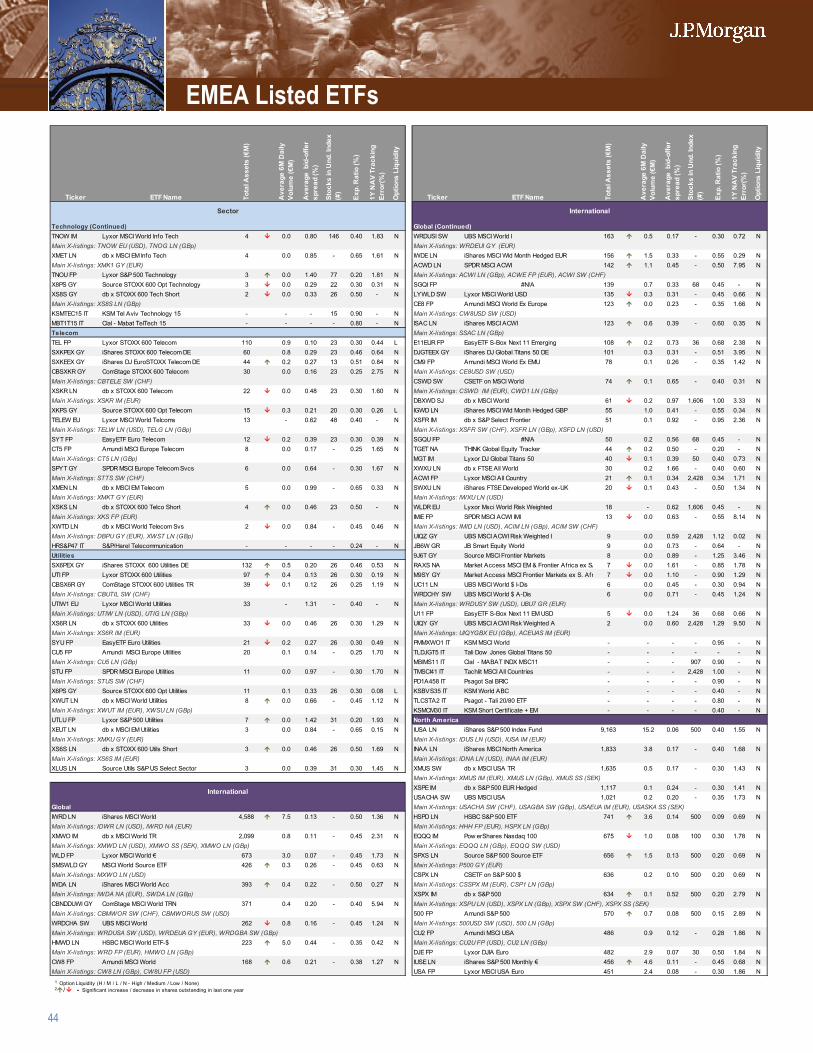
44
Ticker ETF Name Tota
l Ass
ets
(€M
)
Ave
rage
6M
Dai
ly
Volu
me
(€M
)
Ave
rage
bid
-offe
r sp
read
(%)
Stoc
ks in
Und
. Ind
ex
(#)
Exp.
Rat
io (%
)
1Y N
AV
Trac
king
Er
ror(
%)
Opt
ions
Liq
uidi
ty
Ticker ETF Name Tota
l Ass
ets
(€M
)
Ave
rage
6M
Dai
ly
Volu
me
(€M
)
Ave
rage
bid
-offe
r sp
read
(%)
Stoc
ks in
Und
. Ind
ex
(#)
Exp.
Rat
io (%
)
1Y N
AV
Trac
king
Er
ror(
%)
Opt
ions
Liq
uidi
ty
Technology (Continued) Global (Continued)TNOW IM Lyxor MSCI World Info Tech 4 0.0 0.80 146 0.40 1.83 N WRDUSI SW UBS MSCI World I 163 0.5 0.17 - 0.30 0.72 NMain X-listings: TNOW EU (USD), TNOG LN (GBp) Main X-listings: WRDEUI GY (EUR)XMET LN db x MSCI EM Info Tech 4 0.0 0.85 - 0.65 1.61 N IWDE LN iShares MSCI Wld Month Hedged EUR 156 1.5 0.33 - 0.55 0.29 NMain X-listings: XMK1 GY (EUR) ACWD LN SPDR MSCI ACWI 142 1.1 0.45 - 0.50 7.95 NTNOU FP Lyxor S&P 500 Technology 3 0.0 1.40 77 0.20 1.81 N Main X-listings: ACWI LN (GBp), ACWE FP (EUR), ACWI SW (CHF)X8PS GY Source STOXX 600 Opt Technology 3 0.0 0.29 22 0.30 0.31 N SGQI FP #N/A 139 0.7 0.33 68 0.45 - NXS8S GY db x STOXX 600 Tech Short 2 0.0 0.33 26 0.50 - N LYWLD SW Lyxor MSCI World USD 135 0.3 0.31 - 0.45 0.66 NMain X-listings: XS8S LN (GBp) CE8 FP Amundi MSCI World Ex Europe 123 0.0 0.23 - 0.35 1.66 NKSMTEC15 IT KSM Tel Aviv Technology 15 - - - 15 0.90 - N Main X-listings: CW8USD SW (USD)MBT1T15 IT Clal - Mabat TelTech 15 - - - - 0.80 - N ISAC LN iShares MSCI ACWI 123 0.6 0.39 - 0.60 0.35 NTelecom Main X-listings: SSAC LN (GBp)TEL FP Lyxor STOXX 600 Telecom 110 0.9 0.10 23 0.30 0.44 L E11EUR FP EasyETF S-Box Next 11 Emerging 108 0.2 0.73 36 0.68 2.38 NSXKPEX GY iShares STOXX 600 Telecom DE 60 0.8 0.29 23 0.46 0.64 N DJGTEEX GY iShares DJ Global Titans 50 DE 101 0.3 0.31 - 0.51 3.95 NSXKEEX GY iShares DJ EuroSTOXX Telecom DE 44 0.2 0.27 13 0.51 0.84 N CM9 FP Amundi MSCI World Ex EMU 78 0.1 0.26 - 0.35 1.42 NCBSXKR GY ComStage STOXX 600 Telecom 30 0.0 0.16 23 0.25 2.75 N Main X-listings: CE8USD SW (USD)Main X-listings: CBTELE SW (CHF) CSWD SW CSETF on MSCI World 74 0.1 0.65 - 0.40 0.31 NXSKR LN db x STOXX 600 Telecom 22 0.0 0.48 23 0.30 1.60 N Main X-listings: CSWD IM (EUR), CWD1 LN (GBp)Main X-listings: XSKR IM (EUR) DBXWD SJ db x MSCI World 61 0.2 0.97 1,606 1.00 3.33 NXKPS GY Source STOXX 600 Opt Telecom 15 0.3 0.21 20 0.30 0.26 L IGWD LN iShares MSCI Wld Month Hedged GBP 55 1.0 0.41 - 0.55 0.34 NTELEW EU Lyxor MSCI World Telcoms 13 - 0.62 48 0.40 - N XSFR IM db x S&P Select Frontier 51 0.1 0.92 - 0.95 2.36 NMain X-listings: TELW LN (USD), TELG LN (GBp) Main X-listings: XSFR SW (CHF), XSFR LN (GBp), XSFD LN (USD)SYT FP EasyETF Euro Telecom 12 0.2 0.39 23 0.30 0.39 N SGQU FP #N/A 50 0.2 0.56 68 0.45 - NCT5 FP Amundi MSCI Europe Telecom 8 0.0 0.17 - 0.25 1.65 N TGET NA THINK Global Equity Tracker 44 0.2 0.50 - 0.20 - NMain X-listings: CT5 LN (GBp) MGT IM Lyxor DJ Global Titans 50 40 0.1 0.39 50 0.40 0.73 NSPYT GY SPDR MSCI Europe Telecom Svcs 6 0.0 0.64 - 0.30 1.67 N XWXU LN db x FTSE All World 30 0.2 1.66 - 0.40 0.60 NMain X-listings: STTS SW (CHF) ACWI FP Lyxor MSCI All Country 21 0.1 0.34 2,428 0.34 1.71 NXMEN LN db x MSCI EM Telecom 5 0.0 0.99 - 0.65 0.33 N SWXU LN iShares FTSE Developed World ex-UK 20 0.1 0.43 - 0.50 1.34 NMain X-listings: XMKT GY (EUR) Main X-listings: IWXU LN (USD)XSKS LN db x STOXX 600 Telco Short 4 0.0 0.46 23 0.50 - N WLDR EU Lyxor Msci World Risk Weighted 18 - 0.62 1,606 0.45 - NMain X-listings: XKS FP (EUR) IMIE FP SPDR MSCI ACWI IMI 13 0.0 0.63 - 0.55 8.14 NXWTD LN db x MSCI World Telecom Svs 2 0.0 0.84 - 0.45 0.46 N Main X-listings: IMID LN (USD), ACIM LN (GBp), ACIM SW (CHF)Main X-listings: DBPU GY (EUR), XWST LN (GBp) UIQZ GY UBS MSCI ACWI Risk Weighted I 9 0.0 0.59 2,428 1.12 0.02 NHRS&P47 IT S&P/Harel Telecommunication - - - - 0.24 - N JB6W GR JB Smart Equity World 9 0.0 0.73 - 0.64 - NUtilities 9J6T GY Source MSCI Frontier Markets 8 0.0 0.89 - 1.25 3.46 NSX6PEX GY iShares STOXX 600 Utilities DE 132 0.5 0.20 26 0.46 0.53 N RAXS NA Market Access MSCI EM & Frontier Africa ex SA 7 0.0 1.61 - 0.85 1.78 NUTI FP Lyxor STOXX 600 Utilities 97 0.4 0.13 26 0.30 0.19 N M9SY GY Market Access MSCI Frontier Markets ex S. Afr 7 0.0 1.10 - 0.90 1.29 NCBSX6R GY ComStage STOXX 600 Utilities TR 39 0.1 0.12 26 0.25 1.19 N UC11 LN UBS MSCI World $ I-Dis 6 0.0 0.45 - 0.30 0.94 NMain X-listings: CBUTIL SW (CHF) WRDCHY SW UBS MSCI World $ A-Dis 6 0.0 0.71 - 0.45 1.24 NUTIW1 EU Lyxor MSCI World Utilities 33 - 1.31 - 0.40 - N Main X-listings: WRDUSY SW (USD), UBU7 GR (EUR)Main X-listings: UTIW LN (USD), UTIG LN (GBp) U11 FP EasyETF S-Box Next 11 EM USD 5 0.0 1.24 36 0.68 0.66 NXS6R LN db x STOXX 600 Utilities 33 0.0 0.46 26 0.30 1.29 N UIQY GY UBS MSCI ACWI Risk Weighted A 2 0.0 0.60 2,428 1.29 9.50 NMain X-listings: XS6R IM (EUR) Main X-listings: UIQYGBX EU (GBp), ACEUAS IM (EUR)SYU FP EasyETF Euro Utilities 21 0.2 0.27 26 0.30 0.49 N PMMXWO1 IT KSM MSCI World - - - - 0.95 - NCU5 FP Amundi MSCI Europe Utilities 20 0.1 0.14 - 0.25 1.70 N TLDJGT5 IT Tali Dow Jones Global Titans 50 - - - - - - NMain X-listings: CU5 LN (GBp) MBIMS11 IT Clal - MABAT INDX MSC11 - - - 907 0.90 - NSTU FP SPDR MSCI Europe Utilities 11 0.0 0.97 - 0.30 1.70 N TMSCI41 IT Tachlit MSCI All Countries - - - 2,428 1.00 - NMain X-listings: STUS SW (CHF) PD1A458 IT Psagot Sal BRIC - - - - 0.90 - NX6PS GY Source STOXX 600 Opt Utilities 11 0.1 0.33 26 0.30 0.08 L KSBVS35 IT KSM World ABC - - - - 0.40 - NXWUT LN db x MSCI World Utilities 8 0.0 0.66 - 0.45 1.12 N TLCSTA2 IT Psagot - Tali 20/80 ETF - - - - 0.80 - NMain X-listings: XWUT IM (EUR), XWSU LN (GBp) KSMCM30 IT KSM Short Certif icate + EM - - - - 0.40 - NUTLU FP Lyxor S&P 500 Utilities 7 0.0 1.42 31 0.20 1.93 N North AmericaXEUT LN db x MSCI EM Utilities 3 0.0 0.84 - 0.65 0.15 N IUSA LN iShares S&P 500 Index Fund 9,163 15.2 0.06 500 0.40 1.55 NMain X-listings: XMKU GY (EUR) Main X-listings: IDUS LN (USD), IUSA IM (EUR)XS6S LN db x STOXX 600 Utils Short 3 0.0 0.46 26 0.50 1.69 N INAA LN iShares MSCI North America 1,833 3.8 0.17 - 0.40 1.68 NMain X-listings: XS6S IM (EUR) Main X-listings: IDNA LN (USD), INAA IM (EUR)XLUS LN Source Utils S&P US Select Sector 3 0.0 0.39 31 0.30 1.45 N XMUS SW db x MSCI USA TR 1,635 0.5 0.17 - 0.30 1.43 N
Main X-listings: XMUS IM (EUR), XMUS LN (GBp), XMUS SS (SEK)XSPE IM db x S&P 500 EUR Hedged 1,117 0.1 0.24 - 0.30 1.41 NUSACHA SW UBS MSCI USA 1,021 0.2 0.20 - 0.35 1.73 N
Global Main X-listings: USACHA SW (CHF), USAGBA SW (GBp), USAEUA IM (EUR), USASKA SS (SEK)IWRD LN iShares MSCI World 4,588 7.5 0.13 - 0.50 1.36 N HSPD LN HSBC S&P 500 ETF 741 3.6 0.14 500 0.09 0.69 NMain X-listings: IDWR LN (USD), IWRD NA (EUR) Main X-listings: HHH FP (EUR), HSPX LN (GBp)XMWO IM db x MSCI World TR 2,099 0.8 0.11 - 0.45 2.31 N EQQQ IM Pow erShares Nasdaq 100 675 1.0 0.08 100 0.30 1.78 NMain X-listings: XMWD LN (USD), XMWO SS (SEK), XMWO LN (GBp) Main X-listings: EQQQ LN (GBp), EQQQ SW (USD)WLD FP Lyxor MSCI World € 673 3.0 0.07 - 0.45 1.73 N SPXS LN Source S&P 500 Source ETF 656 1.5 0.13 500 0.20 0.69 NSMSWLD GY MSCI World Source ETF 426 0.3 0.26 - 0.45 0.63 N Main X-listings: P500 GY (EUR)Main X-listings: MXWO LN (USD) CSPX LN CSETF on S&P 500 $ 636 0.2 0.10 500 0.20 0.69 NIWDA LN iShares MSCI World Acc 393 0.4 0.22 - 0.50 0.27 N Main X-listings: CSSPX IM (EUR), CSP1 LN (GBp)Main X-listings: IWDA NA (EUR), SWDA LN (GBp) XSPX IM db x S&P 500 634 0.1 0.52 500 0.20 2.79 NCBNDDUWI GY ComStage MSCI World TRN 371 0.4 0.20 - 0.40 5.94 N Main X-listings: XSPU LN (USD), XSPX LN (GBp), XSPX SW (CHF), XSPX SS (SEK)Main X-listings: CBMWOR SW (CHF), CBMWORUS SW (USD) 500 FP Amundi S&P 500 570 0.7 0.08 500 0.15 2.89 NWRDCHA SW UBS MSCI World 262 0.8 0.16 - 0.45 1.24 N Main X-listings: 500USD SW (USD), 500 LN (GBp)Main X-listings: WRDUSA SW (USD), WRDEUA GY (EUR), WRDGBA SW (GBp) CU2 FP Amundi MSCI USA 486 0.9 0.12 - 0.28 1.86 NHMWD LN HSBC MSCI World ETF-$ 223 5.0 0.44 - 0.35 0.42 N Main X-listings: CU2U FP (USD), CU2 LN (GBp)Main X-listings: WRD FP (EUR), HMWO LN (GBp) DJE FP Lyxor DJIA Euro 482 2.9 0.07 30 0.50 1.84 NCW8 FP Amundi MSCI World 168 0.6 0.21 - 0.38 1.27 N IUSE LN iShares S&P 500 Monthly € 456 4.6 0.11 - 0.45 0.68 NMain X-listings: CW8 LN (GBp), CW8U FP (USD) USA FP Lyxor MSCI USA Euro 451 2.4 0.08 - 0.30 1.86 N
Sector International
International
1 Option Liquidity (H / M / L / N - High / Medium / Low / None)2 / - Significant increase / decrease in shares outstanding in last one year
EMEA Listed ETFs
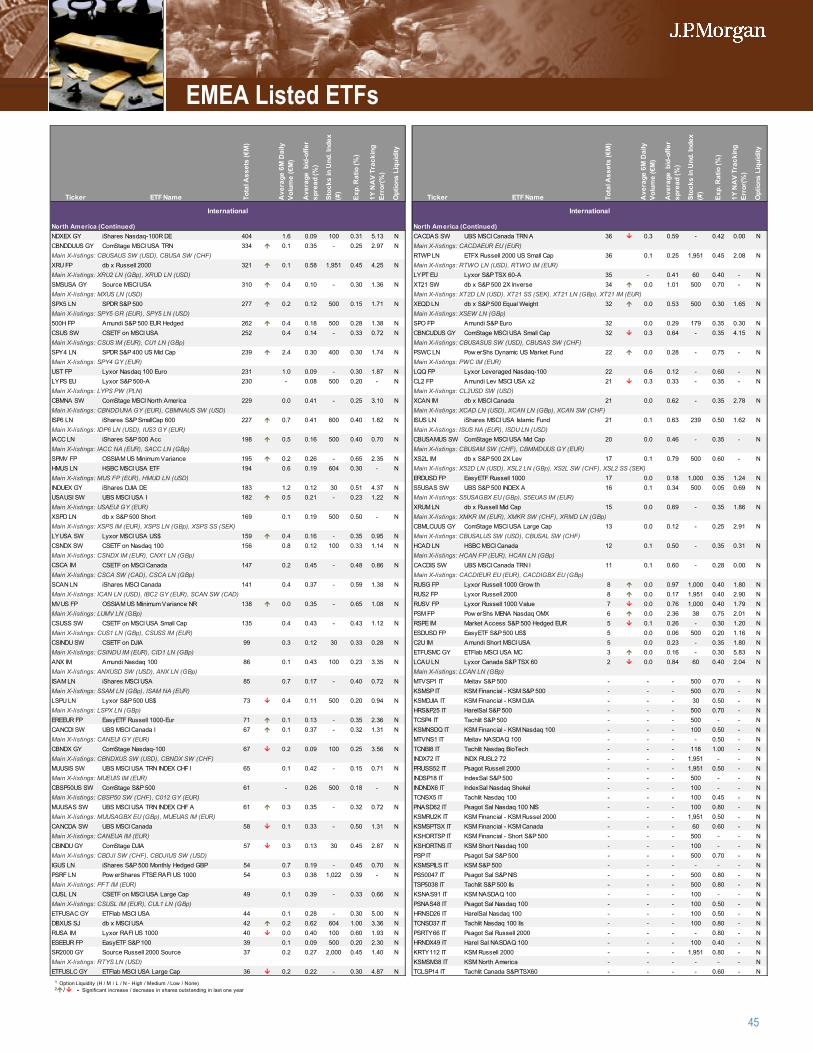
45
Ticker ETF Name Tota
l Ass
ets
(€M
)
Ave
rage
6M
Dai
ly
Volu
me
(€M
)
Ave
rage
bid
-offe
r sp
read
(%)
Stoc
ks in
Und
. Ind
ex
(#)
Exp.
Rat
io (%
)
1Y N
AV
Trac
king
Er
ror(
%)
Opt
ions
Liq
uidi
ty
Ticker ETF Name Tota
l Ass
ets
(€M
)
Ave
rage
6M
Dai
ly
Volu
me
(€M
)
Ave
rage
bid
-offe
r sp
read
(%)
Stoc
ks in
Und
. Ind
ex
(#)
Exp.
Rat
io (%
)
1Y N
AV
Trac
king
Er
ror(
%)
Opt
ions
Liq
uidi
ty
North America (Continued) North America (Continued)NDXEX GY iShares Nasdaq-100R DE 404 1.6 0.09 100 0.31 5.13 N CACDAS SW UBS MSCI Canada TRN A 36 0.3 0.59 - 0.42 0.00 NCBNDDUUS GY ComStage MSCI USA TRN 334 0.1 0.35 - 0.25 2.97 N Main X-listings: CACDAEUR EU (EUR)Main X-listings: CBUSAUS SW (USD), CBUSA SW (CHF) RTWP LN ETFX Russell 2000 US Small Cap 36 0.1 0.25 1,951 0.45 2.08 NXRU FP db x Russell 2000 321 0.1 0.58 1,951 0.45 4.25 N Main X-listings: RTWO LN (USD), RTWO IM (EUR)Main X-listings: XRU2 LN (GBp), XRUD LN (USD) LYPT EU Lyxor S&P TSX 60-A 35 - 0.41 60 0.40 - NSMSUSA GY Source MSCI USA 310 0.4 0.10 - 0.30 1.36 N XT21 SW db x S&P 500 2X Inverse 34 0.0 1.01 500 0.70 - NMain X-listings: MXUS LN (USD) Main X-listings: XT2D LN (USD), XT21 SS (SEK), XT21 LN (GBp), XT21 IM (EUR)SPX5 LN SPDR S&P 500 277 0.2 0.12 500 0.15 1.71 N XEQD LN db x S&P 500 Equal Weight 32 0.0 0.53 500 0.30 1.65 NMain X-listings: SPY5 GR (EUR), SPY5 LN (USD) Main X-listings: XSEW LN (GBp)500H FP Amundi S&P 500 EUR Hedged 262 0.4 0.18 500 0.28 1.38 N SPO FP Amundi S&P Euro 32 0.0 0.29 179 0.35 0.30 NCSUS SW CSETF on MSCI USA 252 0.4 0.14 - 0.33 0.72 N CBNCUDUS GY ComStage MSCI USA Small Cap 32 0.3 0.64 - 0.35 4.15 NMain X-listings: CSUS IM (EUR), CU1 LN (GBp) Main X-listings: CBUSASUS SW (USD), CBUSAS SW (CHF)SPY4 LN SPDR S&P 400 US Mid Cap 239 2.4 0.30 400 0.30 1.74 N PSWC LN Pow erShs Dynamic US Market Fund 22 0.0 0.28 - 0.75 - NMain X-listings: SPY4 GY (EUR) Main X-listings: PWC IM (EUR)UST FP Lyxor Nasdaq 100 Euro 231 1.0 0.09 - 0.30 1.87 N LQQ FP Lyxor Leveraged Nasdaq-100 22 0.6 0.12 - 0.60 - NLYPS EU Lyxor S&P 500-A 230 - 0.08 500 0.20 - N CL2 FP Amundi Lev MSCI USA x2 21 0.3 0.33 - 0.35 - NMain X-listings: LYPS PW (PLN) Main X-listings: CL2USD SW (USD)CBMNA SW ComStage MSCI North America 229 0.0 0.41 - 0.25 3.10 N XCAN IM db x MSCI Canada 21 0.0 0.62 - 0.35 2.78 NMain X-listings: CBNDDUNA GY (EUR), CBMNAUS SW (USD) Main X-listings: XCAD LN (USD), XCAN LN (GBp), XCAN SW (CHF)ISP6 LN iShares S&P SmallCap 600 227 0.7 0.41 600 0.40 1.82 N ISUS LN iShares MSCI USA Islamic Fund 21 0.1 0.63 239 0.50 1.62 NMain X-listings: IDP6 LN (USD), IUS3 GY (EUR) Main X-listings: ISUS NA (EUR), ISDU LN (USD)IACC LN iShares S&P 500 Acc 198 0.5 0.16 500 0.40 0.70 N CBUSAMUS SW ComStage MSCI USA Mid Cap 20 0.0 0.46 - 0.35 - NMain X-listings: IACC NA (EUR), SACC LN (GBp) Main X-listings: CBUSAM SW (CHF), CBMMDUUS GY (EUR)SPMV FP OSSIAM US Minimum Variance 195 0.2 0.26 - 0.65 2.35 N XS2L IM db x S&P 500 2X Lev 17 0.1 0.79 500 0.60 - NHMUS LN HSBC MSCI USA ETF 194 0.6 0.19 604 0.30 - N Main X-listings: XS2D LN (USD), XSL2 LN (GBp), XS2L SW (CHF), XSL2 SS (SEK)Main X-listings: MUS FP (EUR), HMUD LN (USD) ERDUSD FP EasyETF Russell 1000 17 0.0 0.18 1,000 0.35 1.24 NINDUEX GY iShares DJIA DE 183 1.2 0.12 30 0.51 4.37 N S5USAS SW UBS S&P 500 INDEX A 16 0.1 0.34 500 0.05 0.69 NUSAUSI SW UBS MSCI USA I 182 0.5 0.21 - 0.23 1.22 N Main X-listings: S5USAGBX EU (GBp), S5EUAS IM (EUR)Main X-listings: USAEUI GY (EUR) XRUM LN db x Russell Mid Cap 15 0.0 0.69 - 0.35 1.86 NXSPD LN db x S&P 500 Short 169 0.1 0.19 500 0.50 - N Main X-listings: XMKR IM (EUR), XMKR SW (CHF), XRMD LN (GBp)Main X-listings: XSPS IM (EUR), XSPS LN (GBp), XSPS SS (SEK) CBMLCUUS GY ComStage MSCI USA Large Cap 13 0.0 0.12 - 0.25 2.91 NLYUSA SW Lyxor MSCI USA US$ 159 0.4 0.16 - 0.35 0.95 N Main X-listings: CBUSALUS SW (USD), CBUSAL SW (CHF)CSNDX SW CSETF on Nasdaq 100 156 0.8 0.12 100 0.33 1.14 N HCAD LN HSBC MSCI Canada 12 0.1 0.50 - 0.35 0.31 NMain X-listings: CSNDX IM (EUR), CNX1 LN (GBp) Main X-listings: HCAN FP (EUR), HCAN LN (GBp)CSCA IM CSETF on MSCI Canada 147 0.2 0.45 - 0.48 0.86 N CACDIS SW UBS MSCI Canada TRN I 11 0.1 0.60 - 0.28 0.00 NMain X-listings: CSCA SW (CAD), CSCA LN (GBp) Main X-listings: CACDIEUR EU (EUR), CACDIGBX EU (GBp)SCAN LN iShares MSCI Canada 141 0.4 0.37 - 0.59 1.38 N RUSG FP Lyxor Russell 1000 Grow th 8 0.0 0.97 1,000 0.40 1.80 NMain X-listings: ICAN LN (USD), IBC2 GY (EUR), SCAN SW (CAD) RUS2 FP Lyxor Russell 2000 8 0.0 0.17 1,951 0.40 2.90 NMVUS FP OSSIAM US MIinimum Variance NR 138 0.0 0.35 - 0.65 1.08 N RUSV FP Lyxor Russell 1000 Value 7 0.0 0.76 1,000 0.40 1.79 NMain X-listings: LUMV LN (GBp) PSM FP Pow erShs MENA Nasdaq OMX 6 0.0 2.36 38 0.75 2.01 NCSUSS SW CSETF on MSCI USA Small Cap 135 0.4 0.43 - 0.43 1.12 N RSPE IM Market Access S&P 500 Hedged EUR 5 0.1 0.26 - 0.30 1.20 NMain X-listings: CUS1 LN (GBp), CSUSS IM (EUR) ESDUSD FP EasyETF S&P 500 US$ 5 0.0 0.06 500 0.20 1.16 NCSINDU SW CSETF on DJIA 99 0.3 0.12 30 0.33 0.28 N C2U IM Amundi Short MSCI USA 5 0.0 0.23 - 0.35 1.80 NMain X-listings: CSINDU IM (EUR), CID1 LN (GBp) ETFUSMC GY ETFlab MSCI USA MC 3 0.0 0.16 - 0.30 5.83 NANX IM Amundi Nasdaq 100 86 0.1 0.43 100 0.23 3.35 N LCAU LN Lyxor Canada S&P TSX 60 2 0.0 0.84 60 0.40 2.04 NMain X-listings: ANXUSD SW (USD), ANX LN (GBp) Main X-listings: LCAN LN (GBp)ISAM LN iShares MSCI USA 85 0.7 0.17 - 0.40 0.72 N MTVSP1 IT Meitav S&P 500 - - - 500 0.70 - NMain X-listings: SSAM LN (GBp), ISAM NA (EUR) KSMSP IT KSM Financial - KSM S&P 500 - - - 500 0.70 - NLSPU LN Lyxor S&P 500 US$ 73 0.4 0.11 500 0.20 0.94 N KSMDJIA IT KSM Financial - KSM DJIA - - - 30 0.50 - NMain X-listings: LSPX LN (GBp) HRS&P25 IT HarelSal S&P 500 - - - 500 0.70 - NEREEUR FP EasyETF Russell 1000-Eur 71 0.1 0.13 - 0.35 2.36 N TCSP4 IT Tachlit S&P 500 - - - 500 - - NCANCDI SW UBS MSCI Canada I 67 0.1 0.37 - 0.32 1.31 N KSMNSDQ IT KSM Financial - KSM Nasdaq 100 - - - 100 0.50 - NMain X-listings: CANEUI GY (EUR) MTVNS1 IT Meitav NASDAQ 100 - - - - 0.50 - NCBNDX GY ComStage Nasdaq-100 67 0.2 0.09 100 0.25 3.56 N TCNBI8 IT Tachlit Nasdaq BioTech - - - 118 1.00 - NMain X-listings: CBNDXUS SW (USD), CBNDX SW (CHF) INDX72 IT INDX RUSL2 72 - - - 1,951 - - NMUUSIS SW UBS MSCI USA TRN INDEX CHF I 65 0.1 0.42 - 0.15 0.71 N PRUSS52 IT Psagot Russell 2000 - - - 1,951 0.50 - NMain X-listings: MUEUIS IM (EUR) INDSP18 IT IndexSal S&P 500 - - - 500 - - NCBSP50US SW ComStage S&P 500 61 - 0.26 500 0.18 - N INDNDX6 IT IndexSal Nasdaq Shekel - - - 100 - - NMain X-listings: CBSP50 SW (CHF), C012 GY (EUR) TCNSX5 IT Tachlit Nasdaq 100 - - - 100 0.45 - NMUUSAS SW UBS MSCI USA TRN INDEX CHF A 61 0.3 0.35 - 0.32 0.72 N PNASD62 IT Psagot Sal Nasdaq 100 NIS - - - 100 0.80 - NMain X-listings: MUUSAGBX EU (GBp), MUEUAS IM (EUR) KSMRU2K IT KSM Financial - KSM Russel 2000 - - - 1,951 0.50 - NCANCDA SW UBS MSCI Canada 58 0.1 0.33 - 0.50 1.31 N KSMSPTSX IT KSM Financial - KSM Canada - - - 60 0.60 - NMain X-listings: CANEUA IM (EUR) KSHORTSP IT KSM Financial - Short S&P 500 - - - 500 - - NCBINDU GY ComStage DJIA 57 0.3 0.13 30 0.45 2.87 N KSHORTNS IT KSM Short Nasdaq 100 - - - 100 - - NMain X-listings: CBDJI SW (CHF), CBDJIUS SW (USD) PSP IT Psagot Sal S&P 500 - - - 500 0.70 - NIGUS LN iShares S&P 500 Monthly Hedged GBP 54 0.7 0.19 - 0.45 0.70 N KSMSPILS IT KSM S&P 500 - - - - - - NPSRF LN Pow erShares FTSE RAFI US 1000 54 0.3 0.38 1,022 0.39 - N PS50047 IT Psagot Sal S&P NIS - - - 500 0.80 - NMain X-listings: PFT IM (EUR) TSP5038 IT Tachlit S&P 500 Ils - - - 500 0.80 - NCUSL LN CSETF on MSCI USA Large Cap 49 0.1 0.39 - 0.33 0.66 N KSNAS91 IT KSM NASDAQ 100 - - - 100 - - NMain X-listings: CSUSL IM (EUR), CUL1 LN (GBp) PSNAS48 IT Psagot Sal Nasdaq 100 - - - 100 0.50 - NETFUSAC GY ETFlab MSCI USA 44 0.1 0.28 - 0.30 5.00 N HRNSD26 IT HarelSal Nasdaq 100 - - - 100 0.50 - NDBXUS SJ db x MSCI USA 42 0.2 0.62 604 1.00 3.36 N TCNSD37 IT Tachlit Nasdaq 100 Ils - - - 100 0.80 - NRUSA IM Lyxor RAFI US 1000 40 0.0 0.40 100 0.60 1.93 N PSRTY66 IT Psagot Sal Russell 2000 - - - - 0.80 - NESEEUR FP EasyETF S&P 100 39 0.1 0.09 500 0.20 2.30 N HRNDX49 IT Harel Sal NASDAQ 100 - - - 100 0.40 - NSR2000 GY Source Russell 2000 Source 37 0.2 0.27 2,000 0.45 1.40 N KRTY112 IT KSM Russell 2000 - - - 1,951 0.80 - NMain X-listings: RTYS LN (USD) KSMSM38 IT KSM North America - - - - - - NETFUSLC GY ETFlab MSCI USA Large Cap 36 0.2 0.22 - 0.30 4.87 N TCLSP14 IT Tachlit Canada S&P/TSX60 - - - - 0.60 - N
International International
1 Option Liquidity (H / M / L / N - High / Medium / Low / None)2 / - Significant increase / decrease in shares outstanding in last one year
EMEA Listed ETFs
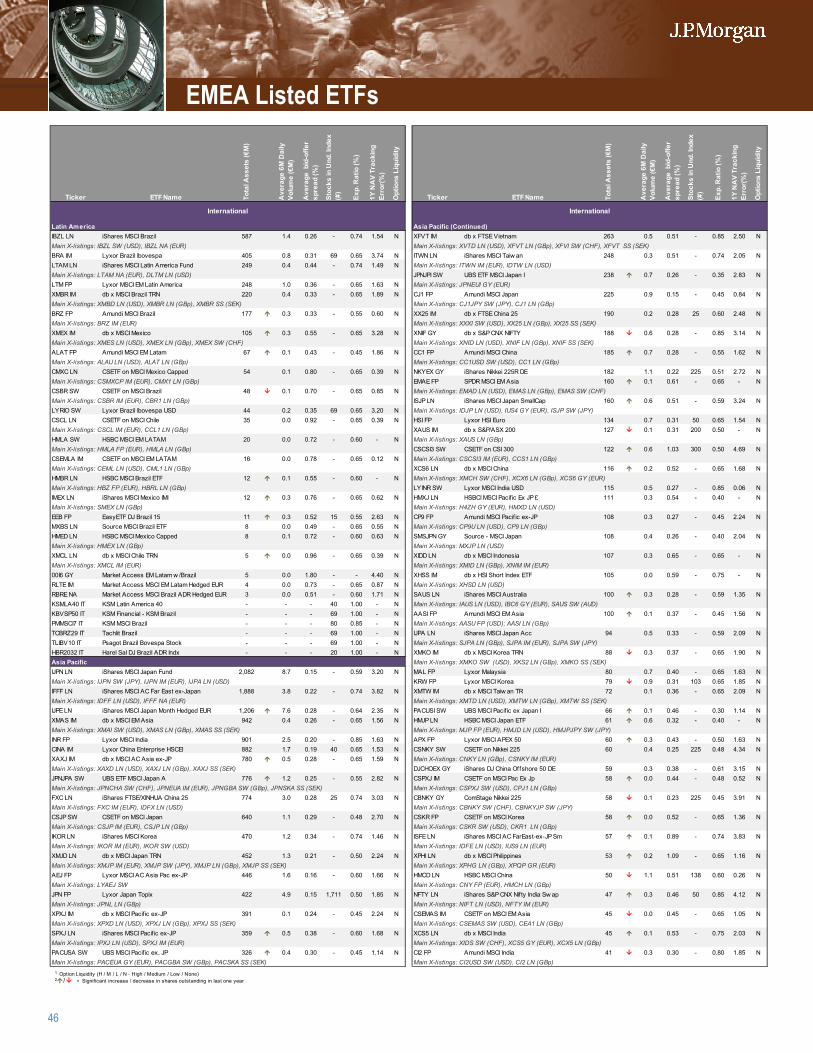
46
Ticker ETF Name Tota
l Ass
ets
(€M
)
Ave
rage
6M
Dai
ly
Volu
me
(€M
)
Ave
rage
bid
-offe
r sp
read
(%)
Stoc
ks in
Und
. Ind
ex
(#)
Exp.
Rat
io (%
)
1Y N
AV
Trac
king
Er
ror(
%)
Opt
ions
Liq
uidi
ty
Ticker ETF Name Tota
l Ass
ets
(€M
)
Ave
rage
6M
Dai
ly
Volu
me
(€M
)
Ave
rage
bid
-offe
r sp
read
(%)
Stoc
ks in
Und
. Ind
ex
(#)
Exp.
Rat
io (%
)
1Y N
AV
Trac
king
Er
ror(
%)
Opt
ions
Liq
uidi
ty
Latin America Asia Pacific (Continued)IBZL LN iShares MSCI Brazil 587 1.4 0.26 - 0.74 1.54 N XFVT IM db x FTSE Vietnam 263 0.5 0.51 - 0.85 2.50 NMain X-listings: IBZL SW (USD), IBZL NA (EUR) Main X-listings: XVTD LN (USD), XFVT LN (GBp), XFVI SW (CHF), XFVT SS (SEK)BRA IM Lyxor Brazil Ibovespa 405 0.8 0.31 69 0.65 3.74 N ITWN LN iShares MSCI Taiw an 248 0.3 0.51 - 0.74 2.05 NLTAM LN iShares MSCI Latin America Fund 249 0.4 0.44 - 0.74 1.49 N Main X-listings: ITWN IM (EUR), IDTW LN (USD)Main X-listings: LTAM NA (EUR), DLTM LN (USD) JPNJPI SW UBS ETF MSCI Japan I 238 0.7 0.26 - 0.35 2.83 NLTM FP Lyxor MSCI EM Latin America 248 1.0 0.36 - 0.65 1.63 N Main X-listings: JPNEUI GY (EUR)XMBR IM db x MSCI Brazil TRN 220 0.4 0.33 - 0.65 1.89 N CJ1 FP Amundi MSCI Japan 225 0.9 0.15 - 0.45 0.84 NMain X-listings: XMBD LN (USD), XMBR LN (GBp), XMBR SS (SEK) Main X-listings: CJ1JPY SW (JPY), CJ1 LN (GBp)BRZ FP Amundi MSCI Brazil 177 0.3 0.33 - 0.55 0.60 N XX25 IM db x FTSE China 25 190 0.2 0.28 25 0.60 2.48 NMain X-listings: BRZ IM (EUR) Main X-listings: XXXI SW (USD), XX25 LN (GBp), XX25 SS (SEK)XMEX IM db x MSCI Mexico 105 0.3 0.55 - 0.65 3.28 N XNIF GY db x S&P CNX NIFTY 188 0.6 0.28 - 0.85 3.14 NMain X-listings: XMES LN (USD), XMEX LN (GBp), XMEX SW (CHF) Main X-listings: XNID LN (USD), XNIF LN (GBp), XNIF SS (SEK)ALAT FP Amundi MSCI EM Latam 67 0.1 0.43 - 0.45 1.86 N CC1 FP Amundi MSCI China 185 0.7 0.28 - 0.55 1.62 NMain X-listings: ALAU LN (USD), ALAT LN (GBp) Main X-listings: CC1USD SW (USD), CC1 LN (GBp)CMXC LN CSETF on MSCI Mexico Capped 54 0.1 0.80 - 0.65 0.39 N NKYEX GY iShares Nikkei 225R DE 182 1.1 0.22 225 0.51 2.72 NMain X-listings: CSMXCP IM (EUR), CMX1 LN (GBp) EMAE FP SPDR MSCI EM Asia 160 0.1 0.61 - 0.65 - NCSBR SW CSETF on MSCI Brazil 48 0.1 0.70 - 0.65 0.85 N Main X-listings: EMAD LN (USD), EMAS LN (GBp), EMAS SW (CHF)Main X-listings: CSBR IM (EUR), CBR1 LN (GBp) ISJP LN iShares MSCI Japan SmallCap 160 0.6 0.51 - 0.59 3.24 NLYRIO SW Lyxor Brazil Ibovespa USD 44 0.2 0.35 69 0.65 3.20 N Main X-listings: IDJP LN (USD), IUS4 GY (EUR), ISJP SW (JPY)CSCL LN CSETF on MSCI Chile 35 0.0 0.92 - 0.65 0.39 N HSI FP Lyxor HSI Euro 134 0.7 0.31 50 0.65 1.54 NMain X-listings: CSCL IM (EUR), CCL1 LN (GBp) XAUS IM db x S&P/ASX 200 127 0.1 0.31 200 0.50 - NHMLA SW HSBC MSCI EM LATAM 20 0.0 0.72 - 0.60 - N Main X-listings: XAUS LN (GBp)Main X-listings: HMLA FP (EUR), HMLA LN (GBp) CSCSI3 SW CSETF on CSI 300 122 0.6 1.03 300 0.50 4.69 NCSEMLA IM CSETF on MSCI EM LATAM 16 0.0 0.78 - 0.65 0.12 N Main X-listings: CSCSI3 IM (EUR), CCS1 LN (GBp)Main X-listings: CEML LN (USD), CML1 LN (GBp) XCS6 LN db x MSCI China 116 0.2 0.52 - 0.65 1.68 NHMBR LN HSBC MSCI Brazil ETF 12 0.1 0.55 - 0.60 - N Main X-listings: XMCH SW (CHF), XCX6 LN (GBp), XCS6 GY (EUR)Main X-listings: HBZ FP (EUR), HBRL LN (GBp) LYINR SW Lyxor MSCI India USD 115 0.5 0.27 - 0.85 0.06 NIMEX LN iShares MSCI Mexico IMI 12 0.3 0.76 - 0.65 0.62 N HMXJ LN HSBCI MSCI Pacif ic Ex JP £ 111 0.3 0.54 - 0.40 - NMain X-listings: SMEX LN (GBp) Main X-listings: H4ZH GY (EUR), HMXD LN (USD)EEB FP EasyETF DJ Brazil 15 11 0.3 0.52 15 0.55 2.63 N CP9 FP Amundi MSCI Pacif ic ex-JP 108 0.3 0.27 - 0.45 2.24 NMXBS LN Source MSCI Brazil ETF 8 0.0 0.49 - 0.65 0.55 N Main X-listings: CP9U LN (USD), CP9 LN (GBp)HMED LN HSBC MSCI Mexico Capped 8 0.1 0.72 - 0.60 0.63 N SMSJPN GY Source - MSCI Japan 108 0.4 0.26 - 0.40 2.04 NMain X-listings: HMEX LN (GBp) Main X-listings: MXJP LN (USD)XMCL LN db x MSCI Chile TRN 5 0.0 0.96 - 0.65 0.39 N XIDD LN db x MSCI Indonesia 107 0.3 0.65 - 0.65 - NMain X-listings: XMCL IM (EUR) Main X-listings: XMID LN (GBp), XNIM IM (EUR)00I6 GY Market Access EM Latam w /Brazil 5 0.0 1.80 - - 4.40 N XHSS IM db x HSI Short Index ETF 105 0.0 0.59 - 0.75 - NRLTE IM Market Access MSCI EM Latam Hedged EUR 4 0.0 0.73 - 0.65 0.87 N Main X-listings: XHSD LN (USD)RBRE NA Market Access MSCI Brazil ADR Hedged EUR 3 0.0 0.51 - 0.60 1.71 N SAUS LN iShares MSCI Australia 100 0.3 0.28 - 0.59 1.35 NKSMLA40 IT KSM Latin America 40 - - - 40 1.00 - N Main X-listings: IAUS LN (USD), IBC6 GY (EUR), SAUS SW (AUD)KBVSP50 IT KSM Financial - KSM Brazil - - - 69 1.00 - N AASI FP Amundi MSCI EM Asia 100 0.1 0.37 - 0.45 1.56 NPMMSCI7 IT KSM MSCI Brazil - - - 80 0.85 - N Main X-listings: AASU FP (USD); AASI LN (GBp)TCBRZ29 IT Tachlit Brazil - - - 69 1.00 - N IJPA LN iShares MSCI Japan Acc 94 0.5 0.33 - 0.59 2.09 NTLIBV10 IT Psagot Brazil Bovespa Stock - - - 69 1.00 - N Main X-listings: SJPA LN (GBp), SJPA IM (EUR), SJPA SW (JPY)HBR2032 IT Harel Sal DJ Brazil ADR Indx - - - 20 1.00 - N XMKO IM db x MSCI Korea TRN 88 0.3 0.37 - 0.65 1.90 NAsia Pacific Main X-listings: XMKO SW (USD), XKS2 LN (GBp), XMKO SS (SEK)IJPN LN iShares MSCI Japan Fund 2,082 8.7 0.15 - 0.59 3.20 N MAL FP Lyxor Malaysia 80 0.7 0.40 - 0.65 1.63 NMain X-listings: IJPN SW (JPY), IJPN IM (EUR), IJPA LN (USD) KRW FP Lyxor MSCI Korea 79 0.9 0.31 103 0.65 1.85 NIFFF LN iShares MSCI AC Far East ex-Japan 1,888 3.8 0.22 - 0.74 3.82 N XMTW IM db x MSCI Taiw an TR 72 0.1 0.36 - 0.65 2.09 NMain X-listings: IDFF LN (USD), IFFF NA (EUR) Main X-listings: XMTD LN (USD), XMTW LN (GBp), XMTW SS (SEK)IJPE LN iShares MSCI Japan Month Hedged EUR 1,206 7.6 0.28 - 0.64 2.35 N PACUSI SW UBS MSCI Pacif ic ex Japan I 66 0.1 0.46 - 0.30 1.14 NXMAS IM db x MSCI EM Asia 942 0.4 0.26 - 0.65 1.56 N HMJP LN HSBC MSCI Japan ETF 61 0.6 0.32 - 0.40 - NMain X-listings: XMAI SW (USD), XMAS LN (GBp), XMAS SS (SEK) Main X-listings: MJP FP (EUR), HMJD LN (USD), HMJPJPY SW (JPY)INR FP Lyxor MSCI India 901 2.5 0.20 - 0.85 1.63 N APX FP Lyxor MSCI APEX 50 60 0.3 0.43 - 0.50 1.63 NCINA IM Lyxor China Enterprise HSCEI 882 1.7 0.19 40 0.65 1.53 N CSNKY SW CSETF on Nikkei 225 60 0.4 0.25 225 0.48 4.34 NXAXJ IM db x MSCI AC Asia ex-JP 780 0.5 0.28 - 0.65 1.59 N Main X-listings: CNKY LN (GBp), CSNKY IM (EUR)Main X-listings: XAXD LN (USD), XAXJ LN (GBp), XAXJ SS (SEK) DJCHOEX GY iShares DJ China Offshore 50 DE 59 0.3 0.38 - 0.61 3.15 NJPNJPA SW UBS ETF MSCI Japan A 776 1.2 0.25 - 0.55 2.82 N CSPXJ IM CSETF on MSCI Pac Ex Jp 58 0.0 0.44 - 0.48 0.52 NMain X-listings: JPNCHA SW (CHF), JPNEUA IM (EUR), JPNGBA SW (GBp), JPNSKA SS (SEK) Main X-listings: CSPXJ SW (USD), CPJ1 LN (GBp)FXC LN iShares FTSE/XINHUA China 25 774 3.0 0.28 25 0.74 3.03 N CBNKY GY ComStage Nikkei 225 58 0.1 0.23 225 0.45 3.91 NMain X-listings: FXC IM (EUR), IDFX LN (USD) Main X-listings: CBNKY SW (CHF), CBNKYJP SW (JPY)CSJP SW CSETF on MSCI Japan 640 1.1 0.29 - 0.48 2.70 N CSKR FP CSETF on MSCI Korea 58 0.0 0.52 - 0.65 1.36 NMain X-listings: CSJP IM (EUR), CSJP LN (GBp) Main X-listings: CSKR SW (USD), CKR1 LN (GBp)IKOR LN iShares MSCI Korea 470 1.2 0.34 - 0.74 1.46 N ISFE LN iShares MSCI AC FarEast-ex-JP Sm 57 0.1 0.89 - 0.74 3.83 NMain X-listings: IKOR IM (EUR), IKOR SW (USD) Main X-listings: IDFE LN (USD), IUS9 LN (EUR)XMJD LN db x MSCI Japan TRN 452 1.3 0.21 - 0.50 2.24 N XPHI LN db x MSCI Philippines 53 0.2 1.09 - 0.65 1.16 NMain X-listings: XMJP IM (EUR), XMJP SW (JPY), XMJP LN (GBp), XMJP SS (SEK) Main X-listings: XPHG LN (GBp), XPQP GR (EUR)AEJ FP Lyxor MSCI AC Asia Pac ex-JP 446 1.6 0.16 - 0.60 1.66 N HMCD LN HSBC MSCI China 50 1.1 0.51 138 0.60 0.26 NMain X-listings: LYAEJ SW Main X-listings: CNY FP (EUR), HMCH LN (GBp)JPN FP Lyxor Japan Topix 422 4.9 0.15 1,711 0.50 1.85 N NFTY LN iShares S&P CNX Nifty India Sw ap 47 0.3 0.46 50 0.85 4.12 NMain X-listings: JPNL LN (GBp) Main X-listings: NIFT LN (USD), NFTY IM (EUR)XPXJ IM db x MSCI Pacif ic ex-JP 391 0.1 0.24 - 0.45 2.24 N CSEMAS IM CSETF on MSCI EM Asia 45 0.0 0.45 - 0.65 1.05 NMain X-listings: XPXD LN (USD), XPXJ LN (GBp), XPXJ SS (SEK) Main X-listings: CSEMAS SW (USD), CEA1 LN (GBp)SPXJ LN iShares MSCI Pacif ic ex-JP 359 0.5 0.38 - 0.60 1.68 N XCS5 LN db x MSCI India 45 0.1 0.53 - 0.75 2.03 NMain X-listings: IPXJ LN (USD), SPXJ IM (EUR) Main X-listings: XIDS SW (CHF), XCS5 GY (EUR), XCX5 LN (GBp)PACUSA SW UBS MSCI Pacif ic ex. JP 326 0.4 0.30 - 0.45 1.14 N CI2 FP Amundi MSCI India 41 0.3 0.30 - 0.80 1.85 NMain X-listings: PACEUA GY (EUR), PACGBA SW (GBp), PACSKA SS (SEK) Main X-listings: CI2USD SW (USD), CI2 LN (GBp)
International International
1 Option Liquidity (H / M / L / N - High / Medium / Low / None)2 / - Significant increase / decrease in shares outstanding in last one year
EMEA Listed ETFs
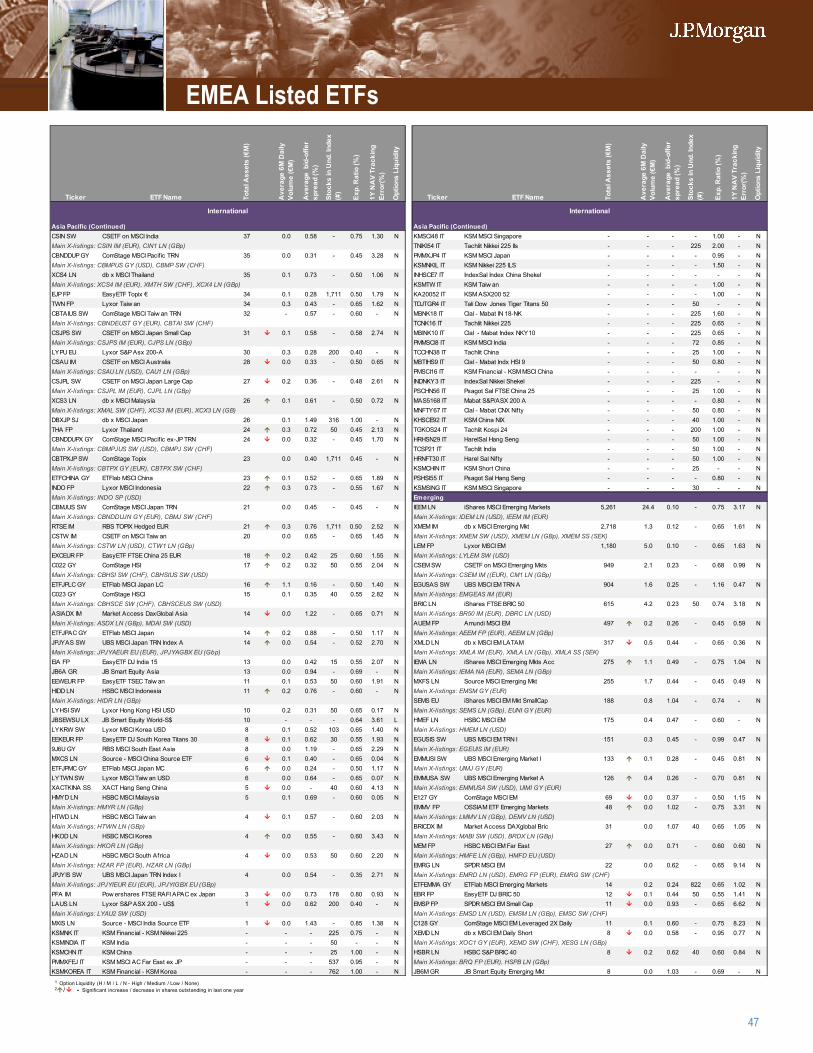
47
Ticker ETF Name Tota
l Ass
ets
(€M
)
Ave
rage
6M
Dai
ly
Volu
me
(€M
)
Ave
rage
bid
-offe
r sp
read
(%)
Stoc
ks in
Und
. Ind
ex
(#)
Exp.
Rat
io (%
)
1Y N
AV
Trac
king
Er
ror(
%)
Opt
ions
Liq
uidi
ty
Ticker ETF Name Tota
l Ass
ets
(€M
)
Ave
rage
6M
Dai
ly
Volu
me
(€M
)
Ave
rage
bid
-offe
r sp
read
(%)
Stoc
ks in
Und
. Ind
ex
(#)
Exp.
Rat
io (%
)
1Y N
AV
Trac
king
Er
ror(
%)
Opt
ions
Liq
uidi
ty
Asia Pacific (Continued) Asia Pacific (Continued)CSIN SW CSETF on MSCI India 37 0.0 0.58 - 0.75 1.30 N KMSCI48 IT KSM MSCI Singapore - - - - 1.00 - NMain X-listings: CSIN IM (EUR), CIN1 LN (GBp) TNIKI54 IT Tachlit Nikkei 225 Ils - - - 225 2.00 - NCBNDDUP GY ComStage MSCI Pacif ic TRN 35 0.0 0.31 - 0.45 3.28 N PMMXJP4 IT KSM MSCI Japan - - - - 0.95 - NMain X-listings: CBMPUS GY (USD), CBMP SW (CHF) KSMNKIL IT KSM Nikkei 225 ILS - - - - 1.50 - NXCS4 LN db x MSCI Thailand 35 0.1 0.73 - 0.50 1.06 N INHSCE7 IT IndexSal Index China Shekel - - - - - - NMain X-listings: XCS4 IM (EUR), XMTH SW (CHF), XCX4 LN (GBp) KSMTW IT KSM Taiw an - - - - 1.00 - NEJP FP EasyETF Topix € 34 0.1 0.28 1,711 0.50 1.79 N KA20052 IT KSM ASX200 52 - - - - 1.00 - NTWN FP Lyxor Taiw an 34 0.3 0.43 - 0.65 1.62 N TDJTGR4 IT Tali Dow Jones Tiger Titans 50 - - - 50 - - NCBTAIUS SW ComStage MSCI Taiw an TRN 32 - 0.57 - 0.60 - N MBNK18 IT Clal - Mabat IN 18-NK - - - 225 1.60 - NMain X-listings: CBNDEUST GY (EUR), CBTAI SW (CHF) TCNK16 IT Tachlit Nikkei 225 - - - 225 0.65 - NCSJPS SW CSETF on MSCI Japan Small Cap 31 0.1 0.58 - 0.58 2.74 N MBINK10 IT Clal - Mabat Index NKY10 - - - 225 0.65 - NMain X-listings: CSJPS IM (EUR), CJPS LN (GBp) PMMSCI8 IT KSM MSCI India - - - 72 0.85 - NLYPU EU Lyxor S&P Asx 200-A 30 0.3 0.28 200 0.40 - N TCCHN38 IT Tachlit China - - - 25 1.00 - NCSAU IM CSETF on MSCI Australia 28 0.0 0.33 - 0.50 0.65 N MBTIHS9 IT Clal - Mabat Indx HSI 9 - - - 50 0.80 - NMain X-listings: CSAU LN (USD), CAU1 LN (GBp) PMSCI16 IT KSM Financial - KSM MSCI China - - - - - - NCSJPL SW CSETF on MSCI Japan Large Cap 27 0.2 0.36 - 0.48 2.61 N INDNKY3 IT IndexSal Nikkei Shekel - - - 225 - - NMain X-listings: CSJPL IM (EUR), CJPL LN (GBp) PSCHN56 IT Psagot Sal FTSE China 25 - - - 25 1.00 - NXCS3 LN db x MSCI Malaysia 26 0.1 0.61 - 0.50 0.72 N MAS5168 IT Mabat S&P/ASX 200 A - - - - 0.80 - NMain X-listings: XMAL SW (CHF), XCS3 IM (EUR), XCX3 LN (GB) MNFTY67 IT Clal - Mabat CNX Nifty - - - 50 0.80 - NDBXJP SJ db x MSCI Japan 26 0.1 1.49 316 1.00 - N KHSCE92 IT KSM China NIX - - - 40 1.00 - NTHA FP Lyxor Thailand 24 0.3 0.72 50 0.45 2.13 N TGKOS24 IT Tachlit Kospi 24 - - - 200 1.00 - NCBNDDUPX GY ComStage MSCI Pacif ic ex-JP TRN 24 0.0 0.32 - 0.45 1.70 N HRHSN29 IT HarelSal Hang Seng - - - 50 1.00 - NMain X-listings: CBMPJUS SW (USD), CBMPJ SW (CHF) TCSP21 IT Tachlit India - - - 50 1.00 - NCBTPXJP SW ComStage Topix 23 0.0 0.40 1,711 0.45 - N HRNFT30 IT Harel Sal Nifty - - - 50 1.00 - NMain X-listings: CBTPX GY (EUR), CBTPX SW (CHF) KSMCHIN IT KSM Short China - - - 25 - - NETFCHINA GY ETFlab MSCI China 23 0.1 0.52 - 0.65 1.89 N PSHSI55 IT Psagot Sal Hang Seng - - - - 0.80 - NINDO FP Lyxor MSCI Indonesia 22 0.3 0.73 - 0.55 1.67 N KSMSING IT KSM MSCI Singapore - - - 30 - - NMain X-listings: INDO SP (USD) EmergingCBMJUS SW ComStage MSCI Japan TRN 21 0.0 0.45 - 0.45 - N IEEM LN iShares MSCI Emerging Markets 5,261 24.4 0.10 - 0.75 3.17 NMain X-listings: CBNDDUJN GY (EUR), CBMJ SW (CHF) Main X-listings: IDEM LN (USD), IEEM IM (EUR)RTSE IM RBS TOPIX Hedged EUR 21 0.3 0.76 1,711 0.50 2.52 N XMEM IM db x MSCI Emerging Mkt 2,718 1.3 0.12 - 0.65 1.61 NCSTW IM CSETF on MSCI Taiw an 20 0.0 0.65 - 0.65 1.45 N Main X-listings: XMEM SW (USD), XMEM LN (GBp), XMEM SS (SEK)Main X-listings: CSTW LN (USD), CTW1 LN (GBp) LEM FP Lyxor MSCI EM 1,180 5.0 0.10 - 0.65 1.63 NEXCEUR FP EasyETF FTSE China 25 EUR 18 0.2 0.42 25 0.60 1.55 N Main X-listings: LYLEM SW (USD)C022 GY ComStage HSI 17 0.2 0.32 50 0.55 2.04 N CSEM SW CSETF on MSCI Emerging Mkts 949 2.1 0.23 - 0.68 0.99 NMain X-listings: CBHSI SW (CHF), CBHSIUS SW (USD) Main X-listings: CSEM IM ((EUR), CM1 LN (GBp)ETFJPLC GY ETFlab MSCI Japan LC 16 1.1 0.16 - 0.50 1.40 N EGUSAS SW UBS MSCI EM TRN A 904 1.6 0.25 - 1.16 0.47 NC023 GY ComStage HSCI 15 0.1 0.35 40 0.55 2.82 N Main X-listings: EMGEAS IM (EUR)Main X-listings: CBHSCE SW (CHF), CBHSCEUS SW (USD) BRIC LN iShares FTSE BRIC 50 615 4.2 0.23 50 0.74 3.18 NASIADX IM Market Access DaxGlobal Asia 14 0.0 1.22 - 0.65 0.71 N Main X-listings: BR50 IM (EUR), DBRC LN (USD)Main X-listings: ASDX LN (GBp), MDAI SW (USD) AUEM FP Amundi MSCI EM 497 0.2 0.26 - 0.45 0.59 NETFJPAC GY ETFlab MSCI Japan 14 0.2 0.88 - 0.50 1.17 N Main X-listings: AEEM FP (EUR), AEEM LN (GBp)JPJYAS SW UBS MSCI Japan TRN Index A 14 0.0 0.54 - 0.52 2.70 N XMLD LN db x MSCI EM LATAM 317 0.5 0.44 - 0.65 0.36 NMain X-listings: JPJYAEUR EU (EUR), JPJYAGBX EU (Gbp) Main X-listings: XMLA IM (EUR), XMLA LN (GBp), XMLA SS (SEK)EIA FP EasyETF DJ India 15 13 0.0 0.42 15 0.55 2.07 N IEMA LN iShares MSCI Emerging Mkts Acc 275 1.1 0.49 - 0.75 1.04 NJB6A GR JB Smart Equity Asia 13 0.0 0.94 - 0.69 - N Main X-listings: IEMA NA (EUR), SEMA LN (GBp)EEWEUR FP EasyETF TSEC Taiw an 11 0.1 0.53 50 0.60 1.91 N MXFS LN Source MSCI Emerging Mkt 255 1.7 0.44 - 0.45 0.49 NHIDD LN HSBC MSCI Indonesia 11 0.2 0.76 - 0.60 - N Main X-listings: EMSM GY (EUR)Main X-listings: HIDR LN (GBp) SEMS EU iShares MSCI EM Mkt SmallCap 188 0.8 1.04 - 0.74 - NLYHSI SW Lyxor Hong Kong HSI USD 10 0.2 0.31 50 0.65 0.17 N Main X-listings: SEMS LN (GBp), EUNI GY (EUR)JBSEWSU LX JB Smart Equity World-S$ 10 - - - 0.64 3.61 L HMEF LN HSBC MSCI EM 175 0.4 0.47 - 0.60 - NLYKRW SW Lyxor MSCI Korea USD 8 0.1 0.52 103 0.65 1.40 N Main X-listings: HMEM LN (USD)EEKEUR FP EasyETF DJ South Korea Titans 30 8 0.1 0.62 30 0.55 1.93 N EGUSIS SW UBS MSCI EM TRN I 151 0.3 0.45 - 0.99 0.47 N9J6U GY RBS MSCI South East Asia 8 0.0 1.19 - 0.65 2.29 N Main X-listings: EGEUIS IM (EUR)MXCS LN Source - MSCI China Source ETF 6 0.1 0.40 - 0.65 0.04 N EMMUSI SW UBS MSCI Emerging Market I 133 0.1 0.28 - 0.45 0.81 NETFJPMC GY ETFlab MSCI Japan MC 6 0.0 0.24 - 0.50 1.17 N Main X-listings: UIMJ GY (EUR)LYTWN SW Lyxor MSCI Taiw an USD 6 0.0 0.64 - 0.65 0.07 N EMMUSA SW UBS MSCI Emerging Market A 126 0.4 0.26 - 0.70 0.81 NXACTKINA SS XACT Hang Seng China 5 0.0 - 40 0.60 4.13 N Main X-listings: EMMUSA SW (USD), UIMI GY (EUR)HMYD LN HSBC MSCI Malaysia 5 0.1 0.69 - 0.60 0.05 N E127 GY ComStage MSCI EM 69 0.0 0.37 - 0.50 1.15 NMain X-listings: HMYR LN (GBp) EMMV FP OSSIAM ETF Emerging Markets 48 0.0 1.02 - 0.75 3.31 NHTWD LN HSBC MSCI Taiw an 4 0.1 0.57 - 0.60 2.03 N Main X-listings: LMMV LN (GBp), DEMV LN (USD)Main X-listings: HTWN LN (GBp) BRICDX IM Market Access DAXglobal Bric 31 0.0 1.07 40 0.65 1.05 NHKOD LN HSBC MSCI Korea 4 0.0 0.55 - 0.60 3.43 N Main X-listings: MABI SW (USD), BRDX LN (GBp)Main X-listings: HKOR LN (GBp) MEM FP HSBC MSCI EM Far East 27 0.0 0.71 - 0.60 0.60 NHZAD LN HSBC MSCI South Africa 4 0.0 0.53 50 0.60 2.20 N Main X-listings: HMFE LN (GBp), HMFD EU (USD)Main X-listings: HZAR FP (EUR), HZAR LN (GBp) EMRG LN SPDR MSCI EM 22 0.0 0.62 - 0.65 9.14 NJPJYIS SW UBS MSCI Japan TRN Index I 4 0.0 0.54 - 0.35 2.71 N Main X-listings: EMRD LN (USD), EMRG FP (EUR), EMRG SW (CHF)Main X-listings: JPJYIEUR EU (EUR), JPJYIGBX EU (GBp) ETFEMMA GY ETFlab MSCI Emerging Markets 14 0.2 0.24 822 0.65 1.02 NPFA IM Pow ershares FTSE RAFI APAC ex Japan 3 0.0 0.73 178 0.80 0.93 N EBR FP EasyETF DJ BRIC 50 12 0.1 0.44 50 0.55 1.41 NLAUS LN Lyxor S&P ASX 200 - US$ 1 0.0 0.62 200 0.40 - N EMSP FP SPDR MSCI EM Small Cap 11 0.0 0.93 - 0.65 6.62 NMain X-listings: LYAU2 SW (USD) Main X-listings: EMSD LN (USD), EMSM LN (GBp), EMSC SW (CHF)MXIS LN Source - MSCI India Source ETF 1 0.0 1.43 - 0.85 1.38 N C128 GY ComStage MSCI EM Leveraged 2X Daily 11 0.1 0.60 - 0.75 8.23 NKSMNK IT KSM Financial - KSM Nikkei 225 - - - 225 0.75 - N XEMD LN db x MSCI EM Daily Short 8 0.0 0.58 - 0.95 0.77 NKSMINDIA IT KSM India - - - 50 - - N Main X-listings: XOC1 GY (EUR), XEMD SW (CHF), XESG LN (GBp)KSMCHN IT KSM China - - - 25 1.00 - N HSBR LN HSBC S&P BRIC 40 8 0.2 0.62 40 0.60 0.84 NPMMXFEJ IT KSM MSCI AC Far East ex JP - - - 537 0.95 - N Main X-listings: BRQ FP (EUR), HSPB LN (GBp)KSMKOREA IT KSM Financial - KSM Korea - - - 762 1.00 - N JB6M GR JB Smart Equity Emerging Mkt 8 0.0 1.03 - 0.69 - N
International International
1 Option Liquidity (H / M / L / N - High / Medium / Low / None)2 / - Significant increase / decrease in shares outstanding in last one year
EMEA Listed ETFs
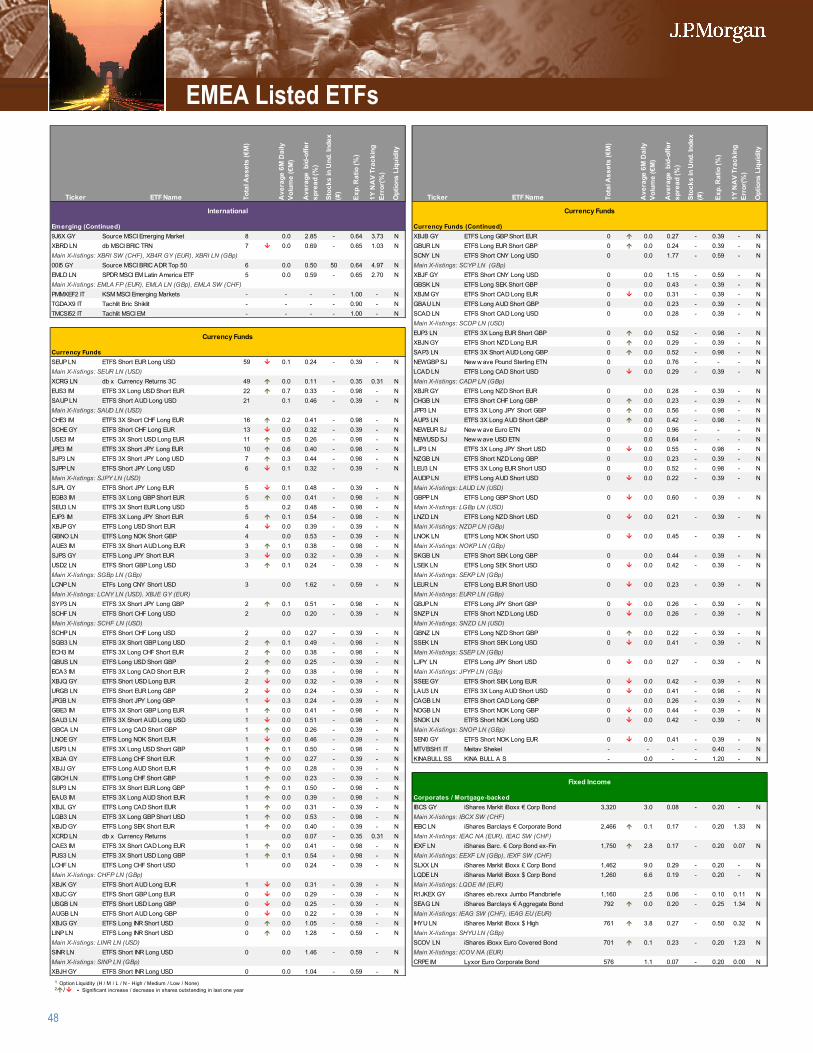
48
Ticker ETF Name Tota
l Ass
ets
(€M
)
Ave
rage
6M
Dai
ly
Volu
me
(€M
)
Ave
rage
bid
-offe
r sp
read
(%)
Stoc
ks in
Und
. Ind
ex
(#)
Exp.
Rat
io (%
)
1Y N
AV
Trac
king
Er
ror(
%)
Opt
ions
Liq
uidi
ty
Ticker ETF Name Tota
l Ass
ets
(€M
)
Ave
rage
6M
Dai
ly
Volu
me
(€M
)
Ave
rage
bid
-offe
r sp
read
(%)
Stoc
ks in
Und
. Ind
ex
(#)
Exp.
Rat
io (%
)
1Y N
AV
Trac
king
Er
ror(
%)
Opt
ions
Liq
uidi
ty
Emerging (Continued) Currency Funds (Continued)9J6X GY Source MSCI Emerging Market 8 0.0 2.85 - 0.64 3.73 N XBJB GY ETFS Long GBP Short EUR 0 0.0 0.27 - 0.39 - NXBRD LN db MSCI BRIC TRN 7 0.0 0.69 - 0.65 1.03 N GBUR LN ETFS Long EUR Short GBP 0 0.0 0.24 - 0.39 - NMain X-listings: XBRI SW (CHF), XB4R GY (EUR), XBRI LN (GBp) SCNY LN ETFS Short CNY Long USD 0 0.0 1.77 - 0.59 - N00I5 GY Source MSCI BRIC ADR Top 50 6 0.0 0.50 50 0.64 4.97 N Main X-listings: SCYP LN (GBp)EMLD LN SPDR MSCI EM Latin America ETF 5 0.0 0.59 - 0.65 2.70 N XBJF GY ETFS Short CNY Long USD 0 0.0 1.15 - 0.59 - NMain X-listings: EMLA FP (EUR), EMLA LN (GBp), EMLA SW (CHF) GBSK LN ETFS Long SEK Short GBP 0 0.0 0.43 - 0.39 - NPMMXEF2 IT KSM MSCI Emerging Markets - - - - 1.00 - N XBJM GY ETFS Short CAD Long EUR 0 0.0 0.31 - 0.39 - NTGDAX9 IT Tachlit Bric Shiklit - - - - 0.90 - N GBAU LN ETFS Long AUD Short GBP 0 0.0 0.23 - 0.39 - NTMCSI52 IT Tachlit MSCI EM - - - - 1.00 - N SCAD LN ETFS Short CAD Long USD 0 0.0 0.28 - 0.39 - N
Main X-listings: SCDP LN (USD)EUP3 LN ETFS 3X Long EUR Short GBP 0 0.0 0.52 - 0.98 - NXBJN GY ETFS Short NZD Long EUR 0 0.0 0.29 - 0.39 - N
Currency Funds SAP3 LN ETFS 3X Short AUD Long GBP 0 0.0 0.52 - 0.98 - NSEUP LN ETFS Short EUR Long USD 59 0.1 0.24 - 0.39 - N NEWGBP SJ New w ave Pound Sterling ETN 0 0.0 0.76 - - - NMain X-listings: SEUR LN (USD) LCAD LN ETFS Long CAD Short USD 0 0.0 0.29 - 0.39 - NXCRG LN db x Currency Returns 3C 49 0.0 0.11 - 0.35 0.31 N Main X-listings: CADP LN (GBp)EUS3 IM ETFS 3X Long USD Short EUR 22 0.7 0.33 - 0.98 - N XBJR GY ETFS Long NZD Short EUR 0 0.0 0.28 - 0.39 - NSAUP LN ETFS Short AUD Long USD 21 0.1 0.46 - 0.39 - N CHGB LN ETFS Short CHF Long GBP 0 0.0 0.23 - 0.39 - NMain X-listings: SAUD LN (USD) JPP3 LN ETFS 3X Long JPY Short GBP 0 0.0 0.56 - 0.98 - NCHE3 IM ETFS 3X Short CHF Long EUR 16 0.2 0.41 - 0.98 - N AUP3 LN ETFS 3X Long AUD Short GBP 0 0.0 0.42 - 0.98 - NSCHE GY ETFS Short CHF Long EUR 13 0.0 0.32 - 0.39 - N NEWEUR SJ New w ave Euro ETN 0 0.0 0.96 - - - NUSE3 IM ETFS 3X Short USD Long EUR 11 0.5 0.26 - 0.98 - N NEWUSD SJ New w ave USD ETN 0 0.0 0.64 - - - NJPE3 IM ETFS 3X Short JPY Long EUR 10 0.6 0.40 - 0.98 - N LJP3 LN ETFS 3X Long JPY Short USD 0 0.0 0.55 - 0.98 - NSJP3 LN ETFS 3X Short JPY Long USD 7 0.3 0.44 - 0.98 - N NZGB LN ETFS Short NZD Long GBP 0 0.0 0.23 - 0.39 - NSJPP LN ETFS Short JPY Long USD 6 0.1 0.32 - 0.39 - N LEU3 LN ETFS 3X Long EUR Short USD 0 0.0 0.52 - 0.98 - NMain X-listings: SJPY LN (USD) AUDP LN ETFS Long AUD Short USD 0 0.0 0.22 - 0.39 - NSJPL GY ETFS Short JPY Long EUR 5 0.1 0.48 - 0.39 - N Main X-listings: LAUD LN (USD)EGB3 IM ETFS 3X Long GBP Short EUR 5 0.0 0.41 - 0.98 - N GBPP LN ETFS Long GBP Short USD 0 0.0 0.60 - 0.39 - NSEU3 LN ETFS 3X Short EUR Long USD 5 0.2 0.48 - 0.98 - N Main X-listings: LGBp LN (USD)EJP3 IM ETFS 3X Long JPY Short EUR 5 0.1 0.54 - 0.98 - N LNZD LN ETFS Long NZD Short USD 0 0.0 0.21 - 0.39 - NXBJP GY ETFS Long USD Short EUR 4 0.0 0.39 - 0.39 - N Main X-listings: NZDP LN (GBp)GBNO LN ETFS Long NOK Short GBP 4 0.0 0.53 - 0.39 - N LNOK LN ETFS Long NOK Short USD 0 0.0 0.45 - 0.39 - NAUE3 IM ETFS 3X Short AUD Long EUR 3 0.1 0.38 - 0.98 - N Main X-listings: NOKP LN (GBp)SJPS GY ETFS Long JPY Short EUR 3 0.0 0.32 - 0.39 - N SKGB LN ETFS Short SEK Long GBP 0 0.0 0.44 - 0.39 - NUSD2 LN ETFS Short GBP Long USD 3 0.1 0.24 - 0.39 - N LSEK LN ETFS Long SEK Short USD 0 0.0 0.42 - 0.39 - NMain X-listings: SGBp LN (GBp) Main X-listings: SEKP LN (GBp)LCNP LN ETFs Long CNY Short USD 3 0.0 1.62 - 0.59 - N LEUR LN ETFS Long EUR Short USD 0 0.0 0.23 - 0.39 - NMain X-listings: LCNY LN (USD), XBJE GY (EUR) Main X-listings: EURP LN (GBp)SYP3 LN ETFS 3X Short JPY Long GBP 2 0.1 0.51 - 0.98 - N GBJP LN ETFS Long JPY Short GBP 0 0.0 0.26 - 0.39 - NSCHF LN ETFS Short CHF Long USD 2 0.0 0.20 - 0.39 - N SNZP LN ETFS Short NZD Long USD 0 0.0 0.26 - 0.39 - NMain X-listings: SCHF LN (USD) Main X-listings: SNZD LN (USD)SCHP LN ETFS Short CHF Long USD 2 0.0 0.27 - 0.39 - N GBNZ LN ETFS Long NZD Short GBP 0 0.0 0.22 - 0.39 - NSGB3 LN ETFS 3X Short GBP Long USD 2 0.1 0.49 - 0.98 - N SSEK LN ETFS Short SEK Long USD 0 0.0 0.41 - 0.39 - NECH3 IM ETFS 3X Long CHF Short EUR 2 0.0 0.38 - 0.98 - N Main X-listings: SSEP LN (GBp)GBUS LN ETFS Long USD Short GBP 2 0.0 0.25 - 0.39 - N LJPY LN ETFS Long JPY Short USD 0 0.0 0.27 - 0.39 - NECA3 IM ETFS 3X Long CAD Short EUR 2 0.0 0.38 - 0.98 - N Main X-listings: JPYP LN (GBp)XBJQ GY ETFS Short USD Long EUR 2 0.0 0.32 - 0.39 - N SSEE GY ETFS Short SEK Long EUR 0 0.0 0.42 - 0.39 - NURGB LN ETFS Short EUR Long GBP 2 0.0 0.24 - 0.39 - N LAU3 LN ETFS 3X Long AUD Short USD 0 0.0 0.41 - 0.98 - NJPGB LN ETFS Short JPY Long GBP 1 0.3 0.24 - 0.39 - N CAGB LN ETFS Short CAD Long GBP 0 0.0 0.26 - 0.39 - NGBE3 IM ETFS 3X Short GBP Long EUR 1 0.0 0.41 - 0.98 - N NOGB LN ETFS Short NOK Long GBP 0 0.0 0.44 - 0.39 - NSAU3 LN ETFS 3X Short AUD Long USD 1 0.0 0.51 - 0.98 - N SNOK LN ETFS Short NOK Long USD 0 0.0 0.42 - 0.39 - NGBCA LN ETFS Long CAD Short GBP 1 0.0 0.26 - 0.39 - N Main X-listings: SNOP LN (GBp)LNOE GY ETFS Long NOK Short EUR 1 0.0 0.46 - 0.39 - N SEN0 GY ETFS Short NOK Long EUR 0 0.0 0.41 - 0.39 - NUSP3 LN ETFS 3X Long USD Short GBP 1 0.1 0.50 - 0.98 - N MTVBSH1 IT Meitav Shekel - - - - 0.40 - NXBJA GY ETFS Long CHF Short EUR 1 0.0 0.27 - 0.39 - N KINABULL SS KINA BULL A S - 0.0 - - 1.20 - NXBJJ GY ETFS Long AUD Short EUR 1 0.0 0.28 - 0.39 - NGBCH LN ETFS Long CHF Short GBP 1 0.0 0.23 - 0.39 - NSUP3 LN ETFS 3X Short EUR Long GBP 1 0.1 0.50 - 0.98 - NEAU3 IM ETFS 3X Long AUD Short EUR 1 0.0 0.39 - 0.98 - N Corporates / Mortgage-backedXBJL GY ETFS Long CAD Short EUR 1 0.0 0.31 - 0.39 - N IBCS GY iShares Markit iBoxx € Corp Bond 3,320 3.0 0.08 - 0.20 - NLGB3 LN ETFS 3X Long GBP Short USD 1 0.0 0.53 - 0.98 - N Main X-listings: IBCX SW (CHF)XBJD GY ETFS Long SEK Short EUR 1 0.0 0.40 - 0.39 - N IEBC LN iShares Barclays € Corporate Bond 2,466 0.1 0.17 - 0.20 1.33 NXCRD LN db x Currency Returns 1 0.0 0.07 - 0.35 0.31 N Main X-listings: IEAC NA (EUR), IEAC SW (CHF)CAE3 IM ETFS 3X Short CAD Long EUR 1 0.0 0.41 - 0.98 - N IEXF LN iShares Barc. € Corp Bond ex-Fin 1,750 2.8 0.17 - 0.20 0.07 NPUS3 LN ETFS 3X Short USD Long GBP 1 0.1 0.54 - 0.98 - N Main X-listings: EEXF LN (GBp), IEXF SW (CHF)LCHF LN ETFS Long CHF Short USD 1 0.0 0.24 - 0.39 - N SLXX LN iShares Markit iBoxx £ Corp Bond 1,462 9.0 0.29 - 0.20 - NMain X-listings: CHFP LN (GBp) LQDE LN iShares Markit iBoxx $ Corp Bond 1,260 6.6 0.19 - 0.20 - NXBJK GY ETFS Short AUD Long EUR 1 0.0 0.31 - 0.39 - N Main X-listings: LQDE IM (EUR)XBJC GY ETFS Short GBP Long EUR 0 0.0 0.29 - 0.39 - N R1JKEX GY iShares eb.rexx Jumbo Pfandbriefe 1,160 2.5 0.06 - 0.10 0.11 NUSGB LN ETFS Short USD Long GBP 0 0.0 0.25 - 0.39 - N SEAG LN iShares Barclays € Aggregate Bond 792 0.0 0.20 - 0.25 1.34 NAUGB LN ETFS Short AUD Long GBP 0 0.0 0.22 - 0.39 - N Main X-listings: IEAG SW (CHF), IEAG EU (EUR)XBJG GY ETFS Long INR Short USD 0 0.0 1.05 - 0.59 - N IHYU LN iShares Markit iBoxx $ High 761 3.8 0.27 - 0.50 0.32 NLINP LN ETFS Long INR Short USD 0 0.0 1.28 - 0.59 - N Main X-listings: SHYU LN (GBp)Main X-listings: LINR LN (USD) SCOV LN iShares iBoxx Euro Covered Bond 701 0.1 0.23 - 0.20 1.23 NSINR LN ETFS Short INR Long USD 0 0.0 1.46 - 0.59 - N Main X-listings: ICOV NA (EUR)Main X-listings: SINP LN (GBp) CRPE IM Lyxor Euro Corporate Bond 576 1.1 0.07 - 0.20 0.00 NXBJH GY ETFS Short INR Long USD 0 0.0 1.04 - 0.59 - N
Fixed Income
International Currency Funds
Currency Funds
1 Option Liquidity (H / M / L / N - High / Medium / Low / None)2 / - Significant increase / decrease in shares outstanding in last one year
EMEA Listed ETFs
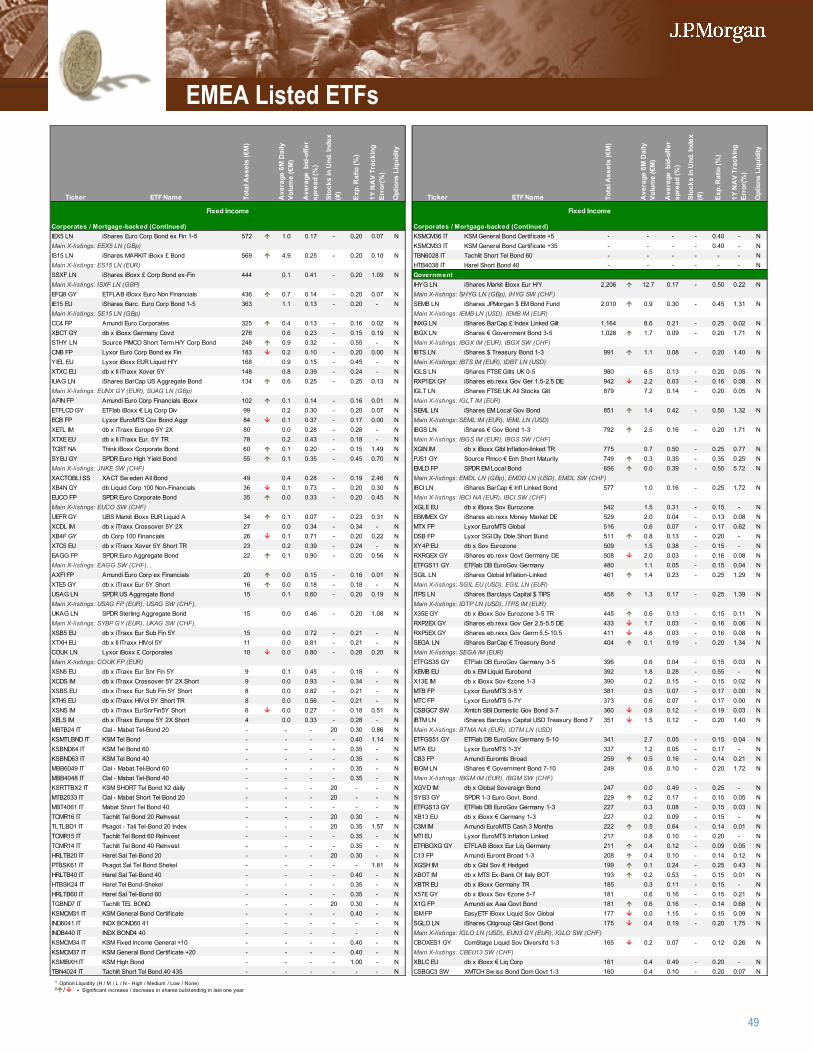
49
Ticker ETF Name Tota
l Ass
ets
(€M
)
Ave
rage
6M
Dai
ly
Volu
me
(€M
)
Ave
rage
bid
-offe
r sp
read
(%)
Stoc
ks in
Und
. Ind
ex
(#)
Exp.
Rat
io (%
)
1Y N
AV
Trac
king
Er
ror(
%)
Opt
ions
Liq
uidi
ty
Ticker ETF Name Tota
l Ass
ets
(€M
)
Ave
rage
6M
Dai
ly
Volu
me
(€M
)
Ave
rage
bid
-offe
r sp
read
(%)
Stoc
ks in
Und
. Ind
ex
(#)
Exp.
Rat
io (%
)
1Y N
AV
Trac
king
Er
ror(
%)
Opt
ions
Liq
uidi
ty
Corporates / Mortgage-backed (Continued) Corporates / Mortgage-backed (Continued)IEX5 LN iShares Euro Corp Bond ex Fin 1-5 572 1.0 0.17 - 0.20 0.07 N KSMCM36 IT KSM General Bond Certif icate +5 - - - - 0.40 - NMain X-listings: EEX5 LN (GBp) KSMCM33 IT KSM General Bond Certif icate +35 - - - - 0.40 - NIS15 LN iShares MARKIT iBoxx £ Bond 569 4.9 0.25 - 0.20 0.10 N TBN6028 IT Tachlit Short Tel Bond 60 - - - - - - NMain X-listings: ES15 LN (EUR) HTB4038 IT Harel Short Bond 40 - - - - - - NSSXF LN iShares iBoxx £ Corp Bond ex-Fin 444 0.1 0.41 - 0.20 1.09 N GovernmentMain X-listings: ISXF LN (GBP) IHYG LN iShares Markit iBoxx Eur H/Y 2,206 12.7 0.17 - 0.50 0.22 NEFQ8 GY ETFLAB iBoxx Euro Non Financials 436 0.7 0.14 - 0.20 0.07 N Main X-listings: SHYG LN (GBp), IHYG SW (CHF)IE15 EU iShares Barc. Euro Corp Bond 1-5 363 1.1 0.13 - 0.20 - N SEMB LN iShares JPMorgan $ EM Bond Fund 2,010 0.9 0.30 - 0.45 1.31 NMain X-listings: SE15 LN (GBp) Main X-listings: IEMB LN (USD), IEMB IM (EUR)CC4 FP Amundi Euro Corporates 325 0.4 0.13 - 0.16 0.02 N INXG LN iShares BarCap £ Index Linked Gilt 1,164 8.6 0.21 - 0.25 0.02 NXBCT GY db x iBoxx Germany Covd 276 0.6 0.23 - 0.15 0.19 N IBGX LN iShares € Government Bond 3-5 1,028 1.7 0.09 - 0.20 1.71 NSTHY LN Source PIMCO Short Term H/Y Corp Bond 248 0.9 0.32 - 0.55 - N Main X-listings: IBGX IM (EUR), IBGX SW (CHF)CNB FP Lyxor Euro Corp Bond ex Fin 183 0.2 0.10 - 0.20 0.00 N IBTS LN iShares $ Treasury Bond 1-3 991 1.1 0.08 - 0.20 1.40 NYIEL EU Lyxor iBoxx EUR Liquid H/Y 168 0.9 0.15 - 0.45 - N Main X-listings: IBTS IM (EUR), IDBT LN (USD)XTXC EU db x II iTraxx Xover 5Y 148 0.8 0.39 - 0.24 - N IGLS LN iShares FTSE Gilts UK 0-5 980 6.5 0.13 - 0.20 0.05 NIUAG LN iShares BarCap US Aggregate Bond 134 0.6 0.25 - 0.25 0.13 N RXP1EX GY iShares eb.rexx Gov Ger 1.5-2.5 DE 942 2.2 0.03 - 0.16 0.08 NMain X-listings: EUNX GY (EUR), SUAG LN (GBp) IGLT LN iShares FTSE UK All Stocks Gilt 879 7.2 0.14 - 0.20 0.05 NAFIN FP Amundi Euro Corp Financials iBoxx 102 0.1 0.14 - 0.16 0.01 N Main X-listings: IGLT IM (EUR)ETFLCD GY ETFlab iBoxx € Liq Corp Div 99 0.2 0.30 - 0.20 0.07 N SEML LN iShares EM Local Gov Bond 851 1.4 0.42 - 0.50 1.32 NECB FP Lyxor EuroMTS Cov Bond Aggr 84 0.1 0.37 - 0.17 0.00 N Main X-listings: SEML IM (EUR), IEML LN (USD)XETL IM db x iTraxx Europe 5Y 2X 80 0.0 0.28 - 0.28 - N IBGS LN iShares € Gov Bond 1-3 792 2.5 0.16 - 0.20 1.71 NXTXE EU db x II iTraxx Eur. 5Y TR 78 0.2 0.43 - 0.18 - N Main X-listings: IBGS IM (EUR), IBGS SW (CHF)TCBT NA Think iBoxx Corporate Bond 60 0.1 0.20 - 0.15 1.49 N XGIN IM db x iBoxx Glbl Inflation-linked TR 775 0.7 0.50 - 0.25 0.77 NSYBJ GY SPDR Euro High Yield Bond 55 0.1 0.35 - 0.45 0.70 N PJS1 GY Source Pimco € Enh Short Maturity 749 0.3 0.35 - 0.35 0.25 NMain X-listings: JNKE SW (CHF) EMLD FP SPDR EM Local Bond 656 0.0 0.39 - 0.55 5.72 NXACTOBLI SS XACT Sw eden All Bond 49 0.4 0.28 - 0.19 2.46 N Main X-listings: EMDL LN (GBp), EMDD LN (USD), EMDL SW (CHF)XB4N GY db Liquid Corp 100 Non-Financials 36 0.1 0.73 - 0.20 0.30 N IBCI LN iShares BarCap € Infl Linked Bond 577 1.0 0.16 - 0.25 1.72 NEUCO FP SPDR Euro Corporate Bond 35 0.0 0.33 - 0.20 0.45 N Main X-listings: IBCI NA (EUR), IBCI SW (CHF)Main X-listings: EUCO SW (CHF) XGLE EU db x iBoxx Sov Eurozone 542 1.5 0.31 - 0.15 - NUEFR GY UBS Markit iBoxx EUR Liquid A 34 0.1 0.07 - 0.23 0.31 N EBMMEX GY iShares eb.rexx Money Market DE 529 2.0 0.04 - 0.13 0.08 NXCDL IM db x iTraxx Crossover 5Y 2X 27 0.0 0.34 - 0.34 - N MTX FP Lyxor EuroMTS Global 516 0.6 0.07 - 0.17 0.62 NXB4F GY db Corp 100 Financials 26 0.1 0.71 - 0.20 0.22 N DSB FP Lyxor SGI Dly Dble Short Bund 511 0.8 0.13 - 0.20 - NXTC5 EU db x iTraxx Xover 5Y Short TR 23 0.2 0.39 - 0.24 - N XY4P EU db x Sov Eurozone 509 1.5 0.38 - 0.15 - NEAGG FP SPDR Euro Aggregate Bond 22 0.1 0.90 - 0.20 0.56 N RXRGEX GY iShares eb.rexx Govt Germany DE 508 2.0 0.03 - 0.16 0.08 NMain X-listings: EAGG SW (CHF), , ETFGS11 GY ETFlab DB EuroGov Germany 480 1.1 0.05 - 0.15 0.04 NAXFI FP Amundi Euro Corp ex Financials 20 0.0 0.15 - 0.16 0.01 N SGIL LN iShares Global Inflation-Linked 461 1.4 0.23 - 0.25 1.29 NXTE5 GY db x iTraxx Eur 5Y Short 16 0.0 0.18 - 0.18 - N Main X-listings: SGIL EU (USD), EGIL LN (EUR)USAG LN SPDR US Aggregate Bond 15 0.1 0.60 - 0.20 0.19 N ITPS LN iShares Barclays Capital $ TIPS 458 1.3 0.17 - 0.25 1.39 NMain X-listings: USAG FP (EUR), USAG SW (CHF), Main X-listings: IDTP LN (USD), ITPS IM (EUR)UKAG LN SPDR Sterling Aggregate Bond 15 0.0 0.46 - 0.20 1.08 N X35E GY db x iBoxx Sov Eurozone 3-5 TR 445 0.6 0.13 - 0.15 0.11 NMain X-listings: SYBP GY (EUR), UKAG SW (CHF), RXP2EX GY iShares eb.rexx Gov Ger 2.5-5.5 DE 433 1.7 0.03 - 0.16 0.06 NXSB5 EU db x iTraxx Eur Sub Fin 5Y 15 0.0 0.72 - 0.21 - N RXP5EX GY iShares eb.rexx Gov Germ 5.5-10.5 411 4.6 0.03 - 0.16 0.08 NXTXH EU db x II ITraxx HIVol 5Y 11 0.0 0.81 - 0.21 - N SEGA LN iShares BarCap € Treasury Bond 404 0.1 0.19 - 0.20 1.34 NCOUK LN Lyxor iBoxx £ Corporates 10 0.0 0.80 - 0.20 0.20 N Main X-listings: SEGA IM (EUR)Main X-listings: COUK FP (EUR) ETFGS35 GY ETFlab DB EuroGov Germany 3-5 396 0.6 0.04 - 0.15 0.03 NXSN5 EU db x iTraxx Eur Snr Fin 5Y 9 0.1 0.45 - 0.18 - N XEMB EU db x EM Liquid Eurobond 392 1.8 0.28 - 0.55 - NXCDS IM db x iTraxx Crossover 5Y 2X Short 9 0.0 0.93 - 0.34 - N X13E IM db x iBoxx Sov €zone 1-3 390 0.2 0.15 - 0.15 0.02 NXSBS EU db x iTraxx Eur Sub Fin 5Y Short 8 0.0 0.82 - 0.21 - N MTB FP Lyxor EuroMTS 3-5 Y 381 0.5 0.07 - 0.17 0.00 NXTH5 EU db x iTraxx HiVol 5Y Short TR 8 0.0 0.56 - 0.21 - N MTC FP Lyxor EuroMTS 5-7Y 373 0.6 0.07 - 0.17 0.00 NXSNS IM db x iTraxx EurSnrFin5Y Short 6 0.0 0.27 - 0.18 0.51 N CSBGC7 SW Xmtch SBI Domestic Gov Bond 3-7 360 0.9 0.12 - 0.19 0.03 NXELS IM db x iTraxx Europe 5Y 2X Short 4 0.0 0.33 - 0.28 - N IBTM LN iShares Barclays Capital USD Treasury Bond 7 351 1.5 0.12 - 0.20 1.40 NMBTB24 IT Clal - Mabat Tel-Bond 20 - - - 20 0.30 0.86 N Main X-listings: BTMA NA (EUR), IDTM LN (USD)KSMTLBND IT KSM Tel Bond - - - - 0.40 1.14 N ETFGS51 GY ETFlab DB EuroGov Germany 5-10 341 2.7 0.05 - 0.15 0.04 NKSBND64 IT KSM Tel Bond 60 - - - - 0.35 - N MTA EU Lyxor EuroMTS 1-3Y 337 1.2 0.05 - 0.17 - NKSBND63 IT KSM Tel Bond 40 - - - - 0.35 - N CB3 FP Amundi Euromts Broad 259 0.5 0.16 - 0.14 0.21 NMBB6049 IT Clal - Mabat Tel-Bond 60 - - - - 0.35 - N IBGM LN iShares € Government Bond 7-10 249 0.6 0.10 - 0.20 1.72 NMBB4048 IT Clal - Mabat Tel-Bond 40 - - - - 0.35 - N Main X-listings: IBGM IM (EUR), IBGM SW (CHF)KSRTTBX2 IT KSM SHORT Tel Bond X2 daily - - - 20 - - N XGVD IM db x Global Sovereign Bond 247 0.0 0.49 - 0.25 - NMTB2033 IT Clal - Mabat Short Tel Bond 20 - - - 20 - - N SYB3 GY SPDR 1-3 Euro Govt. Bond 229 0.2 0.17 - 0.15 0.05 NMBT4061 IT Mabat Short Tel Bond 40 - - - - - - N ETFGS13 GY ETFlab DB EuroGov Germany 1-3 227 0.3 0.08 - 0.15 0.03 NTCMR16 IT Tachlit Tel Bond 20 ReInvest - - - 20 0.30 - N XB13 EU db x iBoxx € Germany 1-3 227 0.2 0.09 - 0.15 - NTLTLBD1 IT Psagot - Tali Tel-Bond 20 Index - - - 20 0.35 1.57 N C3M IM Amundi EuroMTS Cash 3 Months 222 0.5 0.64 - 0.14 0.01 NTCMR15 IT Tachlit Tel Bond 60 ReInvest - - - - 0.35 - N MTI EU Lyxor EuroMTS Inflation Linked 217 0.8 0.10 - 0.20 - NTCMR14 IT Tachlit Tel Bond 40 ReInvest - - - - 0.35 - N ETFIBOXG GY ETFLAB iBoxx Eur Liq Germany 211 0.4 0.12 - 0.09 0.05 NHRLTB20 IT Harel Sal Tel-Bond 20 - - - 20 0.30 - N C13 FP Amundi Euromt Broad 1-3 208 0.4 0.10 - 0.14 0.12 NPTBSK61 IT Psagot Sal Tel Bond Shekel - - - - - 1.81 N XGSH IM db x Glbl Sov € Hedged 199 0.1 0.24 - 0.25 0.43 NHRLTB40 IT Harel Sal Tel-Bond 40 - - - - 0.40 - N XBOT IM db x MTS Ex-Bank Of Italy BOT 193 0.2 0.53 - 0.15 0.01 NHTBSK24 IT Harel Tel Bond-Shekel - - - - 0.35 - N XBTR EU db x iBoxx Germany TR 185 0.3 0.11 - 0.15 - NHRLTB60 IT Harel Sal Tel-Bond 60 - - - - 0.35 - N X57E GY db x iBoxx Sov €zone 5-7 181 0.6 0.16 - 0.15 0.21 NTGBND7 IT Tachlit TEL BOND - - - 20 0.30 - N X1G FP Amundi ex Aaa Govt Bond 181 0.6 0.16 - 0.14 0.68 NKSMCM31 IT KSM General Bond Certif icate - - - - 0.40 - N ISM FP EasyETF iBoxx Liquid Sov Global 177 0.0 1.15 - 0.15 0.09 NIND6041 IT INDX BOND60 41 - - - - - - N SGLO LN iShares Citigroup Glbl Govt Bond 175 0.4 0.19 - 0.20 1.75 NINDB440 IT INDX BOND4 40 - - - - - - N Main X-listings: IGLO LN (USD), EUN3 GY (EUR), IGLO SW (CHF)KSMCM34 IT KSM Fixed Income General +10 - - - - 0.40 - N CBOXES1 GY ComStage Liquid Sov Diversifd 1-3 165 0.2 0.07 - 0.12 0.26 NKSMCM37 IT KSM General Bond Certif icate +20 - - - - 0.40 - N Main X-listings: CBEU13 SW (CHF)KSMIBXH IT KSM High Bond - - - - 1.00 - N XBLC EU db x iBoxx € Liq Corp 161 0.4 0.49 - 0.20 - NTBN4024 IT Tachlit Short Tel Bond 40 435 - - - - - - N CSBGC3 SW XMTCH Sw iss Bond Dom Govt 1-3 160 0.4 0.10 - 0.20 0.07 N
Fixed Income Fixed Income
1 Option Liquidity (H / M / L / N - High / Medium / Low / None)2 / - Significant increase / decrease in shares outstanding in last one year
EMEA Listed ETFs
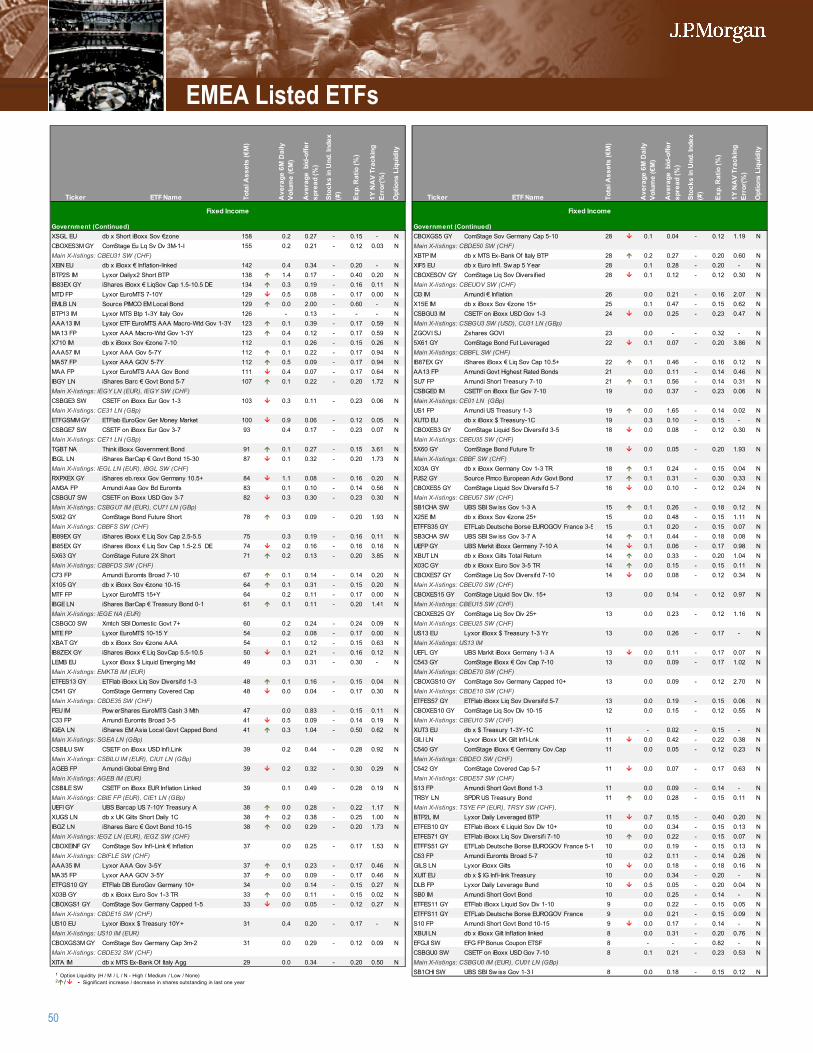
50
Ticker ETF Name Tota
l Ass
ets
(€M
)
Ave
rage
6M
Dai
ly
Volu
me
(€M
)
Ave
rage
bid
-offe
r sp
read
(%)
Stoc
ks in
Und
. Ind
ex
(#)
Exp.
Rat
io (%
)
1Y N
AV
Trac
king
Er
ror(
%)
Opt
ions
Liq
uidi
ty
Ticker ETF Name Tota
l Ass
ets
(€M
)
Ave
rage
6M
Dai
ly
Volu
me
(€M
)
Ave
rage
bid
-offe
r sp
read
(%)
Stoc
ks in
Und
. Ind
ex
(#)
Exp.
Rat
io (%
)
1Y N
AV
Trac
king
Er
ror(
%)
Opt
ions
Liq
uidi
ty
Government (Continued) Government (Continued)XSGL EU db x Short iBoxx Sov €zone 158 0.2 0.27 - 0.15 - N CBOXGS5 GY ComStage Sov Germany Cap 5-10 28 0.1 0.04 - 0.12 1.19 NCBOXES3M GY ComStage Eu Lq Sv Dv 3M-1-I 155 0.2 0.21 - 0.12 0.03 N Main X-listings: CBDE50 SW (CHF)Main X-listings: CBEU31 SW (CHF) XBTP IM db x MTS Ex-Bank Of Italy BTP 28 0.2 0.27 - 0.20 0.60 NXEIN EU db x iBoxx € Inflation-linked 142 0.4 0.34 - 0.20 - N XIF5 EU db x Euro Infl. Sw ap 5 Year 28 0.1 0.28 - 0.20 - NBTP2S IM Lyxor Dailyx2 Short BTP 138 1.4 0.17 - 0.40 0.20 N CBOXESOV GY ComStage Liq Sov Diversif ied 28 0.1 0.12 - 0.12 0.30 NIB83EX GY iShares iBoxx € LiqSov Cap 1.5-10.5 DE 134 0.3 0.19 - 0.16 0.11 N Main X-listings: CBEUOV SW (CHF)MTD FP Lyxor EuroMTS 7-10Y 129 0.5 0.08 - 0.17 0.00 N CI3 IM Amundi € Inflation 26 0.0 0.21 - 0.16 2.07 NEMLB LN Source PIMCO EM Local Bond 129 0.0 2.00 - 0.60 - N X15E IM db x iBoxx Sov €zone 15+ 25 0.1 0.47 - 0.15 0.62 NBTP13 IM Lyxor MTS Btp 1-3Y Italy Gov 126 - 0.13 - - - N CSBGU3 IM CSETF on iBoxx USD Gov 1-3 24 0.0 0.25 - 0.23 0.47 NAAA13 IM Lyxor ETF EuroMTS AAA Macro-Wtd Gov 1-3Y 123 0.1 0.39 - 0.17 0.59 N Main X-listings: CSBGU3 SW (USD), CU31 LN (GBp)MA13 FP Lyxor AAA Macro-Wtd Gov 1-3Y 123 0.4 0.12 - 0.17 0.59 N ZGOVI SJ Zshares GOVI 23 0.0 - - 0.32 - NX710 IM db x iBoxx Sov €zone 7-10 112 0.1 0.26 - 0.15 0.26 N 5X61 GY ComStage Bond Fut Leveraged 22 0.1 0.07 - 0.20 3.86 NAAA57 IM Lyxor AAA Gov 5-7Y 112 0.1 0.22 - 0.17 0.94 N Main X-listings: CBBFL SW (CHF)MA57 FP Lyxor AAA GOV 5-7Y 112 0.5 0.09 - 0.17 0.94 N IB87EX GY iShares iBoxx € Liq Sov Cap 10.5+ 22 0.1 0.46 - 0.16 0.12 NMAA FP Lyxor EuroMTS AAA Gov Bond 111 0.4 0.07 - 0.17 0.64 N AA13 FP Amundi Govt Highest Rated Bonds 21 0.0 0.11 - 0.14 0.46 NIBGY LN iShares Barc € Govt Bond 5-7 107 0.1 0.22 - 0.20 1.72 N SU7 FP Amundi Short Treasury 7-10 21 0.1 0.56 - 0.14 0.31 NMain X-listings: IEGY LN (EUR), IEGY SW (CHF) CSBGE0 IM CSETF on iBoxx Eur Gov 7-10 19 0.0 0.37 - 0.23 0.06 NCSBGE3 SW CSETF on iBoxx Eur Gov 1-3 103 0.3 0.11 - 0.23 0.06 N Main X-listings: CE01 LN (GBp)Main X-listings: CE31 LN (GBp) US1 FP Amundi US Treasury 1-3 19 0.0 1.65 - 0.14 0.02 NETFGSMM GY ETFlab EuroGov Ger Money Market 100 0.9 0.06 - 0.12 0.05 N XUTD EU db x iBoxx $ Treasury-1C 19 0.3 0.10 - 0.15 - NCSBGE7 SW CSETF on iBoxx Eur Gov 3-7 93 0.4 0.17 - 0.23 0.07 N CBOXES3 GY ComStage Liquid Sov Diversifd 3-5 18 0.0 0.08 - 0.12 0.30 NMain X-listings: CE71 LN (GBp) Main X-listings: CBEU35 SW (CHF)TGBT NA Think iBoxx Government Bond 91 0.1 0.27 - 0.15 3.61 N 5X60 GY ComStage Bond Future Tr 18 0.0 0.05 - 0.20 1.93 NIBGL LN iShares BarCap € Govt Bond 15-30 87 0.1 0.32 - 0.20 1.73 N Main X-listings: CBBF SW (CHF)Main X-listings: IEGL LN (EUR), IBGL SW (CHF) X03A GY db x iBoxx Germany Cov 1-3 TR 18 0.1 0.24 - 0.15 0.04 NRXPXEX GY iShares eb.rexx Gov Germany 10.5+ 84 1.1 0.08 - 0.16 0.20 N PJS2 GY Source Pimco European Adv Govt Bond 17 0.1 0.31 - 0.30 0.33 NAM3A FP Amundi Aaa Gov Bd Euromts 83 0.1 0.10 - 0.14 0.56 N CBOXES5 GY ComStage Liquid Sov Diversifd 5-7 16 0.0 0.10 - 0.12 0.24 NCSBGU7 SW CSETF on iBoxx USD Gov 3-7 82 0.3 0.30 - 0.23 0.30 N Main X-listings: CBEU57 SW (CHF)Main X-listings: CSBGU7 IM (EUR), CU71 LN (GBp) SB1CHA SW UBS SBI Sw iss Gov 1-3 A 15 0.1 0.26 - 0.18 0.12 N5X62 GY ComStage Bond Future Short 78 0.3 0.09 - 0.20 1.93 N X25E IM db x iBoxx Sov €zone 25+ 15 0.0 0.48 - 0.15 1.11 NMain X-listings: CBBFS SW (CHF) ETFFS35 GY ETFLab Deutsche Borse EUROGOV France 3-5 15 0.1 0.20 - 0.15 0.07 NIB89EX GY iShares iBoxx € Liq Sov Cap 2.5-5.5 75 0.3 0.19 - 0.16 0.11 N SB3CHA SW UBS SBI Sw iss Gov 3-7 A 14 0.1 0.44 - 0.18 0.08 NIB85EX GY iShares iBoxx € Liq Sov Cap 1.5-2.5 DE 74 0.2 0.16 - 0.16 0.16 N UEFP GY UBS Markit iBoxx Germany 7-10 A 14 0.1 0.06 - 0.17 0.98 N5X63 GY ComStage Future 2X Short 71 0.2 0.13 - 0.20 3.85 N XBUT LN db x iBoxx Gilts Total Return 14 0.0 0.33 - 0.20 1.04 NMain X-listings: CBBFDS SW (CHF) X03C GY db x iBoxx Euro Sov 3-5 TR 14 0.0 0.15 - 0.15 0.11 NC73 FP Amundi Euromts Broad 7-10 67 0.1 0.14 - 0.14 0.20 N CBOXES7 GY ComStage Liq Sov Diversifd 7-10 14 0.0 0.08 - 0.12 0.34 NX105 GY db x iBoxx Sov €zone 10-15 64 0.1 0.31 - 0.15 0.20 N Main X-listings: CBEU70 SW (CHF)MTF FP Lyxor EuroMTS 15+Y 64 0.2 0.11 - 0.17 0.00 N CBOXES15 GY ComStage Liquid Sov Div. 15+ 13 0.0 0.14 - 0.12 0.97 NIBGE LN iShares BarCap € Treasury Bond 0-1 61 0.1 0.11 - 0.20 1.41 N Main X-listings: CBEU15 SW (CHF)Main X-listings: IEGE NA (EUR) CBOXES25 GY ComStage Liq Sov Div 25+ 13 0.0 0.23 - 0.12 1.16 NCSBGC0 SW Xmtch SBI Domestic Govt 7+ 60 0.2 0.24 - 0.24 0.09 N Main X-listings: CBEU25 SW (CHF)MTE FP Lyxor EuroMTS 10-15 Y 54 0.2 0.08 - 0.17 0.00 N US13 EU Lyxor iBoxx $ Treasury 1-3 Yr 13 0.0 0.26 - 0.17 - NXBAT GY db x iBoxx Sov €zone AAA 54 0.1 0.12 - 0.15 0.63 N Main X-listings: US13 IMIB8ZEX GY iShares iBoxx € Liq SovCap 5.5-10.5 50 0.1 0.21 - 0.16 0.12 N UEFL GY UBS Markit iBoxx Germany 1-3 A 13 0.0 0.11 - 0.17 0.07 NLEMB EU Lyxor iBoxx $ Liquid Emerging Mkt 49 0.3 0.31 - 0.30 - N C543 GY ComStage iBoxx € Cov Cap 7-10 13 0.0 0.09 - 0.17 1.02 NMain X-listings: EMKTB IM (EUR) Main X-listings: CBDE70 SW (CHF)ETFES13 GY ETFlab iBoxx Liq Sov Diversifd 1-3 48 0.1 0.16 - 0.15 0.04 N CBOXGS10 GY ComStage Sov Germany Capped 10+ 13 0.0 0.09 - 0.12 2.70 NC541 GY ComStage Germany Covered Cap 48 0.0 0.04 - 0.17 0.30 N Main X-listings: CBDE10 SW (CHF)Main X-listings: CBDE35 SW (CHF) ETFES57 GY ETFlab iBoxx Liq Sov Diversifd 5-7 13 0.0 0.19 - 0.15 0.06 NPEU IM Pow erShares EuroMTS Cash 3 Mth 47 0.0 0.83 - 0.15 0.11 N CBOXES10 GY ComStage Liq Sov Div 10-15 12 0.0 0.15 - 0.12 0.55 NC33 FP Amundi Euromts Broad 3-5 41 0.5 0.09 - 0.14 0.19 N Main X-listings: CBEU10 SW (CHF)IGEA LN iShares EM Asia Local Govt Capped Bond 41 0.3 1.04 - 0.50 0.62 N XUT3 EU db x $ Treasury 1-3Y-1C 11 - 0.02 - 0.15 - NMain X-listings: SGEA LN (GBp) GILI LN Lyxor iBoxx UK Gilt Inf l-Lnk 11 0.0 0.42 - 0.22 0.38 NCSBILU SW CSETF on iBoxx USD Infl.Link 39 0.2 0.44 - 0.28 0.92 N C540 GY ComStage iBoxx € Germany Cov.Cap 11 0.0 0.05 - 0.12 0.23 NMain X-listings: CSBILU IM (EUR), CIU1 LN (GBp) Main X-listings: CBDEO SW (CHF)AGEB FP Amundi Global Emrg Bnd 39 0.2 0.32 - 0.30 0.29 N C542 GY ComStage Covered Cap 5-7 11 0.0 0.07 - 0.17 0.63 NMain X-listings: AGEB IM (EUR) Main X-listings: CBDE57 SW (CHF)CSBILE SW CSETF on iBoxx EUR Inflation Linked 39 0.1 0.49 - 0.28 0.19 N S13 FP Amundi Short Govt Bond 1-3 11 0.0 0.09 - 0.14 - NMain X-listings: CBIE FP (EUR), CIE1 LN (GBp) TRSY LN SPDR US Treasury Bond 11 0.0 0.28 - 0.15 0.11 NUEFI GY UBS Barcap US 7-10Y Treasury A 38 0.0 0.28 - 0.22 1.17 N Main X-listings: TSYE FP (EUR), TRSY SW (CHF), XUGS LN db x UK Gilts Short Daily 1C 38 0.2 0.38 - 0.25 1.00 N BTP2L IM Lyxor Daily Leveraged BTP 11 0.7 0.15 - 0.40 0.20 NIBGZ LN iShares Barc € Govt Bond 10-15 38 0.0 0.29 - 0.20 1.73 N ETFES10 GY ETFlab iBoxx € Liquid Sov Div 10+ 10 0.0 0.34 - 0.15 0.13 NMain X-listings: IEGZ LN (EUR), IEGZ SW (CHF) ETFES71 GY ETFlab iBoxx Liq Sov Diversif i 7-10 10 0.0 0.22 - 0.15 0.07 NCBOXEINF GY ComStage Sov Infl-Link € Inflation 37 0.0 0.25 - 0.17 1.53 N ETFFS51 GY ETFLab Deutsche Borse EUROGOV France 5-1 10 0.0 0.19 - 0.15 0.13 NMain X-listings: CBIFLE SW (CHF) C53 FP Amundi Euromts Broad 5-7 10 0.2 0.11 - 0.14 0.26 NAAA35 IM Lyxor AAA Gov 3-5Y 37 0.1 0.23 - 0.17 0.46 N GILS LN Lyxor iBoxx Gilts 10 0.0 0.18 - 0.18 0.16 NMA35 FP Lyxor AAA GOV 3-5Y 37 0.0 0.09 - 0.17 0.46 N XUIT EU db x $ IG Infl-link Treasury 10 0.0 0.34 - 0.20 - NETFGS10 GY ETFlab DB EuroGov Germany 10+ 34 0.0 0.14 - 0.15 0.27 N DLB FP Lyxor Daily Leverage Bund 10 0.5 0.05 - 0.20 0.04 NX03B GY db x iBoxx Euro Sov 1-3 TR 33 0.0 0.11 - 0.15 0.02 N SB0 IM Amundi Short Govt Bond 10 0.0 0.25 - 0.14 - NCBOXGS1 GY ComStage Sov Germany Capped 1-5 33 0.0 0.05 - 0.12 0.27 N ETFES11 GY ETFlab iBoxx Liquid Sov Div 1-10 9 0.0 0.22 - 0.15 0.05 NMain X-listings: CBDE15 SW (CHF) ETFFS11 GY ETFLab Deutsche Borse EUROGOV France 9 0.0 0.21 - 0.15 0.09 NUS10 EU Lyxor iBoxx $ Treasury 10Y+ 31 0.4 0.20 - 0.17 - N S10 FP Amundi Short Govt Bond 10-15 9 0.0 0.17 - 0.14 - NMain X-listings: US10 IM (EUR) XBUI LN db x iBoxx Gilt Inf lation linked 8 0.0 0.31 - 0.20 0.76 NCBOXGS3M GY ComStage Sov Germany Cap 3m-2 31 0.0 0.29 - 0.12 0.09 N EFGJI SW EFG FP Bonus Coupon ETSF 8 - - - 0.82 - NMain X-listings: CBDE32 SW (CHF) CSBGU0 SW CSETF on iBoxx USD Gov 7-10 8 0.1 0.21 - 0.23 0.53 NXITA IM db x MTS Ex-Bank Of Italy Agg 29 0.0 0.34 - 0.20 0.50 N Main X-listings: CSBGU0 IM (EUR), CU01 LN (GBp)
SB1CHI SW UBS SBI Sw iss Gov 1-3 I 8 0.0 0.18 - 0.15 0.12 N
Fixed Income Fixed Income
1 Option Liquidity (H / M / L / N - High / Medium / Low / None)2 / - Significant increase / decrease in shares outstanding in last one year
EMEA Listed ETFs
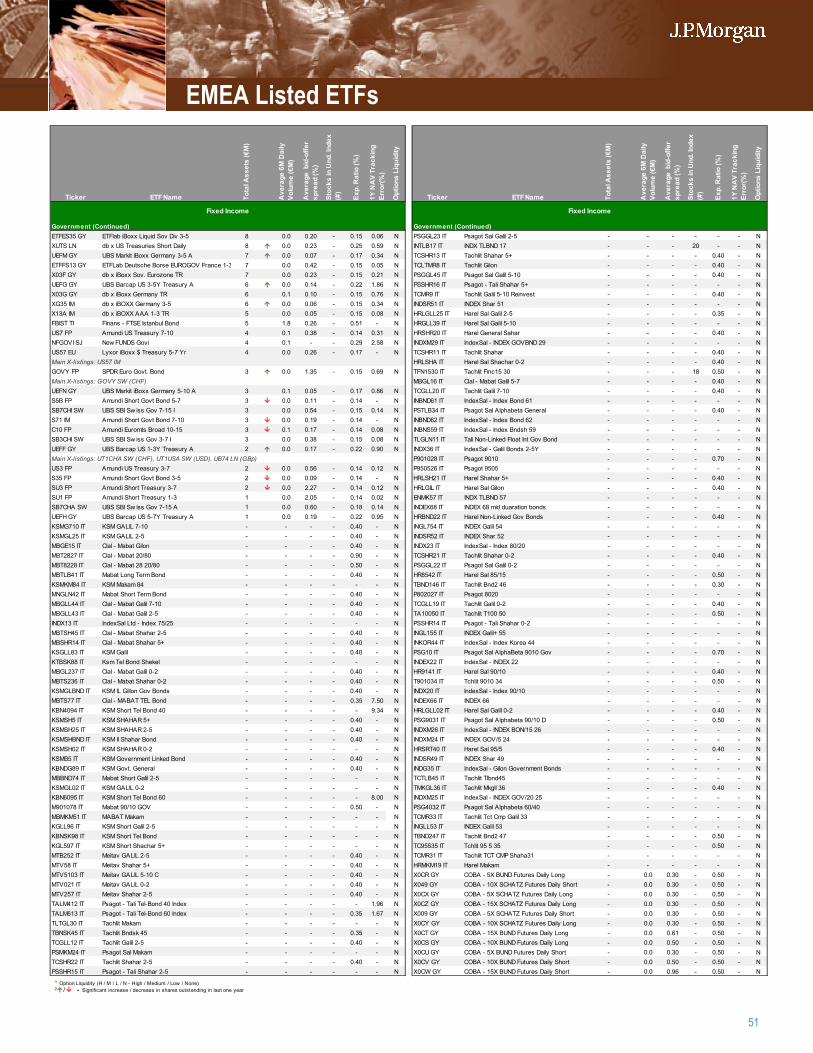
51
Ticker ETF Name Tota
l Ass
ets
(€M
)
Ave
rage
6M
Dai
ly
Volu
me
(€M
)
Ave
rage
bid
-offe
r sp
read
(%)
Stoc
ks in
Und
. Ind
ex
(#)
Exp.
Rat
io (%
)
1Y N
AV
Trac
king
Er
ror(
%)
Opt
ions
Liq
uidi
ty
Ticker ETF Name Tota
l Ass
ets
(€M
)
Ave
rage
6M
Dai
ly
Volu
me
(€M
)
Ave
rage
bid
-offe
r sp
read
(%)
Stoc
ks in
Und
. Ind
ex
(#)
Exp.
Rat
io (%
)
1Y N
AV
Trac
king
Er
ror(
%)
Opt
ions
Liq
uidi
ty
Government (Continued) Government (Continued)ETFES35 GY ETFlab iBoxx Liquid Sov Div 3-5 8 0.0 0.20 - 0.15 0.06 N PSGGL23 IT Psagot Sal Galil 2-5 - - - - - - NXUTS LN db x US Treasuries Short Daily 8 0.0 0.23 - 0.25 0.59 N INTLB17 IT INDX TLBND 17 - - - 20 - - NUEFM GY UBS Markit iBoxx Germany 3-5 A 7 0.0 0.07 - 0.17 0.34 N TCSHR13 IT Tachlit Shahar 5+ - - - - 0.40 - NETFFS13 GY ETFLab Deutsche Borse EUROGOV France 1-3 7 0.0 0.42 - 0.15 0.05 N TCLTMR8 IT Tachlit Gilon - - - - 0.40 - NX03F GY db x iBoxx Sov. Eurozone TR 7 0.0 0.23 - 0.15 0.21 N PSGGL45 IT Psagot Sal Galil 5-10 - - - - 0.40 - NUEFG GY UBS Barcap US 3-5Y Treasury A 6 0.0 0.14 - 0.22 1.86 N PSSHR16 IT Psagot - Tali Shahar 5+ - - - - - - NX03G GY db x iBoxx Germany TR 6 0.1 0.10 - 0.15 0.76 N TCMR9 IT Tachlit Galil 5-10 Reinvest - - - - 0.40 - NXG35 IM db x iBOXX Germany 3-5 6 0.0 0.06 - 0.15 0.34 N INDSR51 IT INDEX Shar 51 - - - - - - NX13A IM db x iBOXX AAA 1-3 TR 5 0.0 0.05 - 0.15 0.08 N HRLGLL25 IT Harel Sal Galil 2-5 - - - - 0.35 - NFBIST TI Finans - FTSE Istanbul Bond 5 1.8 0.26 - 0.51 - N HRGLL39 IT Harel Sal Galil 5-10 - - - - - - NUS7 FP Amundi US Treasury 7-10 4 0.1 0.38 - 0.14 0.31 N HRSHR20 IT Harel General Sahar - - - - 0.40 - NNFGOVI SJ New FUNDS Govi 4 0.1 - - 0.29 2.58 N INDXM29 IT IndexSal - INDEX GOVBND 29 - - - - - - NUS57 EU Lyxor iBoxx $ Treasury 5-7 Yr 4 0.0 0.26 - 0.17 - N TCSHR11 IT Tachlit Shahar - - - - 0.40 - NMain X-listings: US57 IM HRLSHA IT Harel Sal Shachar 0-2 - - - - 0.40 - NGOVY FP SPDR Euro Govt. Bond 3 0.0 1.35 - 0.15 0.69 N TFN1530 IT Tachlit Finc15 30 - - - 18 0.50 - NMain X-listings: GOVY SW (CHF) MBGL16 IT Clal - Mabat Galil 5-7 - - - - 0.40 - NUEFN GY UBS Markit iBoxx Germany 5-10 A 3 0.1 0.05 - 0.17 0.86 N TCGLL20 IT Tachlit Galil 7-10 - - - - 0.40 - NS5B FP Amundi Short Govt Bond 5-7 3 0.0 0.11 - 0.14 - N INBND61 IT IndexSal - Index Bond 61 - - - - - - NSB7CHI SW UBS SBI Sw iss Gov 7-15 I 3 0.0 0.54 - 0.15 0.14 N PSTLB34 IT Psagot Sal Alphabeta General - - - - 0.40 - NS71 IM Amundi Short Govt Bond 7-10 3 0.0 0.19 - 0.14 - N INBND62 IT IndexSal - Index Bond 62 - - - - - - NC10 FP Amundi Euromts Broad 10-15 3 0.1 0.17 - 0.14 0.08 N INBNS59 IT IndexSal - Index Bndsh 59 - - - - - - NSB3CHI SW UBS SBI Sw iss Gov 3-7 I 3 0.0 0.38 - 0.15 0.08 N TLGLN11 IT Tali Non-Linked Float Int Gov Bond - - - - - - NUEFF GY UBS Barcap US 1-3Y Treasury A 2 0.0 0.17 - 0.22 0.90 N INDX36 IT IndexSal - Galil Bonds 2-5Y - - - - - - NMain X-listings: UT1CHA SW (CHF), UT1USA SW (USD), UB74 LN (GBp) P901028 IT Psagot 9010 - - - - 0.70 - NUS3 FP Amundi US Treasury 3-7 2 0.0 0.56 - 0.14 0.12 N P950526 IT Psagot 9505 - - - - - - NS35 FP Amundi Short Govt Bond 3-5 2 0.0 0.09 - 0.14 - N HRLSH21 IT Harel Shahar 5+ - - - - 0.40 - NSU3 FP Amundi Short Treasury 3-7 2 0.0 2.27 - 0.14 0.12 N HRLGIL IT Harel Sal Gilon - - - - 0.40 - NSU1 FP Amundi Short Treasury 1-3 1 0.0 2.05 - 0.14 0.02 N ENMK57 IT INDX TLBND 57 - - - - - - NSB7CHA SW UBS SBI Sw iss Gov 7-15 A 1 0.0 0.60 - 0.18 0.14 N INDEX68 IT INDEX 68 mid duaration bonds - - - - - - NUEFH GY UBS Barcap US 5-7Y Treasury A 1 0.0 0.19 - 0.22 0.95 N HRBND22 IT Harel Non-Linked Gov Bonds - - - - 0.40 - NKSMG710 IT KSM GALIL 7-10 - - - - 0.40 - N INGL754 IT INDEX Galil 54 - - - - - - NKSMGL25 IT KSM GALIL 2-5 - - - - 0.40 - N INDSR52 IT INDEX Shar 52 - - - - - - NMBGE15 IT Clal - Mabat Gilon - - - - 0.40 - N INDX23 IT IndexSal - Index 80/20 - - - - - - NMBT2827 IT Clal - Mabat 20/80 - - - - 0.90 - N TCSHR21 IT Tachlit Shahar 0-2 - - - - 0.40 - NMBT8228 IT Clal - Mabat 28 20/80 - - - - 0.50 - N PSGGL22 IT Psagot Sal Galil 0-2 - - - - - - NMBTLB41 IT Mabat Long Term Bond - - - - 0.40 - N HR8542 IT Harel Sal 85/15 - - - - 0.50 - NKSMKM84 IT KSM Makam 84 - - - - - - N TBND146 IT Tachlit Bnd2 46 - - - - 0.30 - NMNGLN42 IT Mabat Short Term Bond - - - - 0.40 - N P802027 IT Psagot 8020 - - - - - - NMBGLL44 IT Clal - Mabat Galil 7-10 - - - - 0.40 - N TCGLL19 IT Tachlit Galil 0-2 - - - - 0.40 - NMBGLL43 IT Clal - Mabat Galil 2-5 - - - - 0.40 - N TA10050 IT Tachlit T100 50 - - - - 0.50 - NINDX13 IT IndexSal Ltd - Index 75/25 - - - - - - N PSSHR14 IT Psagot - Tali Shahar 0-2 - - - - - - NMBTSH45 IT Clal - Mabat Shahar 2-5 - - - - 0.40 - N INGL155 IT INDEX Galil+ 55 - - - - - - NMBSHR14 IT Clal - Mabat Shahar 5+ - - - - 0.40 - N INKOR44 IT IndexSal - Index Korea 44 - - - - - - NKSGLL83 IT KSM Galil - - - - 0.40 - N PSG10 IT Psagot Sal AlphaBeta 9010 Gov - - - - 0.70 - NKTBSK88 IT Ksm Tel Bond Shekel - - - - - - N INDEX22 IT IndexSal - INDEX 22 - - - - - - NMBGL237 IT Clal - Mabat Galil 0-2 - - - - 0.40 - N HR9141 IT Harel Sal 90/10 - - - - 0.40 - NMBTS236 IT Clal - Mabat Shahar 0-2 - - - - 0.40 - N T901034 IT Tchlit 9010 34 - - - - 0.50 - NKSMGLBND IT KSM IL Gillon Gov Bonds - - - - 0.40 - N INDX20 IT IndexSal - Index 90/10 - - - - - - NMBTS77 IT Clal - MABAT TEL Bond - - - - 0.35 7.50 N INDEX66 IT INDEX 66 - - - - - - NKBN4094 IT KSM Short Tel Bond 40 - - - - - 9.34 N HRLGLL02 IT Harel Sal Galil 0-2 - - - - 0.40 - NKSMSH5 IT KSM SHAHAR 5+ - - - - 0.40 - N PSG9031 IT Psagot Sal Alphabeta 90/10 D - - - - 0.50 - NKSMSH25 IT KSM SHAHAR 2-5 - - - - 0.40 - N INDXM26 IT IndexSal - INDEX BON/15 26 - - - - - - NKSMSHBND IT KSM Il Shahar Bond - - - - 0.40 - N INDXM24 IT INDEX GOV/5 24 - - - - - - NKSMSH02 IT KSM SHAHAR 0-2 - - - - - - N HRSRT40 IT Harel Sal 95/5 - - - - 0.40 - NKSMB5 IT KSM Government Linked Bond - - - - 0.40 - N INDSR49 IT INDEX Shar 49 - - - - - - NKBNDG89 IT KSM Govt. General - - - - 0.40 - N INDG35 IT IndexSal - Gilon Government Bonds - - - - - - NMBBND74 IT Mabat Short Galil 2-5 - - - - - - N TCTLB45 IT Tachlit Tlbnd45 - - - - - - NKSMGL02 IT KSM GALIL 0-2 - - - - - - N TMKGL36 IT Tachlit Mkgll 36 - - - - 0.40 - NKBN6095 IT KSM Short Tel Bond 60 - - - - - 8.00 N INDXM25 IT IndexSal - INDEX GOV/20 25 - - - - - - NM901078 IT Mabat 90/10 GOV - - - - 0.50 - N PSG4032 IT Psagot Sal Alphabeta 60/40 - - - - - - NMBMKM51 IT MABAT Makam - - - - - - N TCMR33 IT Tachlit Tct Cmp Galil 33 - - - - - - NKGLL96 IT KSM Short Galil 2-5 - - - - - - N INGLL53 IT INDEX Galil 53 - - - - - - NKBNSK98 IT KSM Short Tel Bond - - - - - - N TBND247 IT Tachlit Bnd2 47 - - - - 0.50 - NKGL597 IT KSM Short Shachar 5+ - - - - - - N TC95535 IT Tchlit 95 5 35 - - - - 0.50 - NMTB252 IT Meitav GALIL 2-5 - - - - 0.40 - N TCMR31 IT Tachlit TCT CMP Shaha31 - - - - - - NMTV58 IT Meitav Shahar 5+ - - - - 0.40 - N HRMKM19 IT Harel Makam - - - - - - NMTV5103 IT Meitav GALIL 5-10 C - - - - 0.40 - N X0CR GY COBA - 5X BUND Futures Daily Long - 0.0 0.30 - 0.50 - NMTV021 IT Meitav GALIL 0-2 - - - - 0.40 - N X049 GY COBA - 10X SCHATZ Futures Daily Short - 0.0 0.30 - 0.50 - NMTV257 IT Meitav Shahar 2-5 - - - - 0.40 - N X0CX GY COBA - 5X SCHATZ Futures Daily Long - 0.0 0.30 - 0.50 - NTALM412 IT Psagot - Tali Tel-Bond 40 Index - - - - - 1.96 N X0CZ GY COBA - 15X SCHATZ Futures Daily Long - 0.0 0.30 - 0.50 - NTALM613 IT Psagot - Tali Tel-Bond 60 Index - - - - 0.35 1.67 N X009 GY COBA - 5X SCHATZ Futures Daily Short - 0.0 0.30 - 0.50 - NTLTGL30 IT Tachlit Makam - - - - - - N X0CY GY COBA - 10X SCHATZ Futures Daily Long - 0.0 0.30 - 0.50 - NTBNSK45 IT Tachlit Bndsk 45 - - - - 0.35 - N X0CT GY COBA - 15X BUND Futures Daily Long - 0.0 0.61 - 0.50 - NTCGLL12 IT Tachlit Galil 2-5 - - - - 0.40 - N X0CS GY COBA - 10X BUND Futures Daily Long - 0.0 0.50 - 0.50 - NPSMKM24 IT Psagot Sal Makam - - - - - - N X0CU GY COBA - 5X BUND Futures Daily Short - 0.0 0.30 - 0.50 - NTCSHR22 IT Tachlit Shahar 2-5 - - - - 0.40 - N X0CV GY COBA - 10X BUND Futures Daily Short - 0.0 0.50 - 0.50 - NPSSHR15 IT Psagot - Tali Shahar 2-5 - - - - - - N X0CW GY COBA - 15X BUND Futures Daily Short - 0.0 0.96 - 0.50 - N
Fixed Income Fixed Income
1 Option Liquidity (H / M / L / N - High / Medium / Low / None)2 / - Significant increase / decrease in shares outstanding in last one year
EMEA Listed ETFs
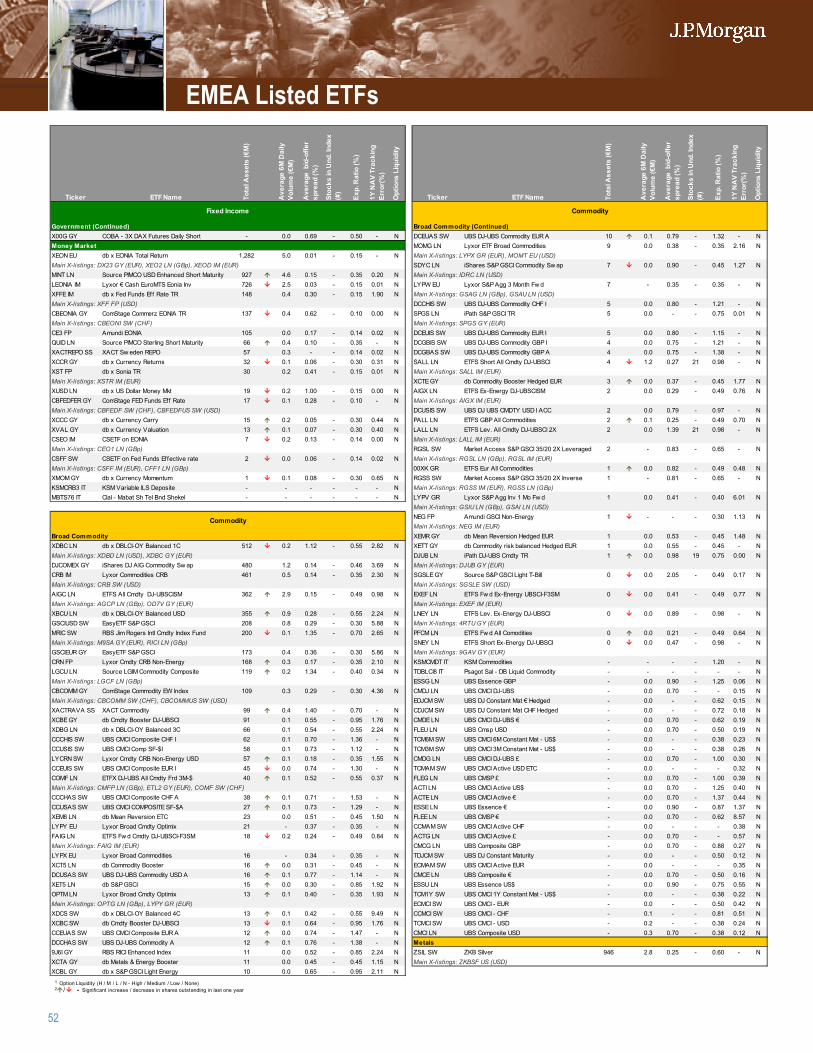
52
Ticker ETF Name Tota
l Ass
ets
(€M
)
Ave
rage
6M
Dai
ly
Volu
me
(€M
)
Ave
rage
bid
-offe
r sp
read
(%)
Stoc
ks in
Und
. Ind
ex
(#)
Exp.
Rat
io (%
)
1Y N
AV
Trac
king
Er
ror(
%)
Opt
ions
Liq
uidi
ty
Ticker ETF Name Tota
l Ass
ets
(€M
)
Ave
rage
6M
Dai
ly
Volu
me
(€M
)
Ave
rage
bid
-offe
r sp
read
(%)
Stoc
ks in
Und
. Ind
ex
(#)
Exp.
Rat
io (%
)
1Y N
AV
Trac
king
Er
ror(
%)
Opt
ions
Liq
uidi
ty
Government (Continued) Broad Commodity (Continued)X00G GY COBA - 3X DAX Futures Daily Short - 0.0 0.69 - 0.50 - N DCEUAS SW UBS DJ-UBS Commodity EUR A 10 0.1 0.79 - 1.32 - NMoney Market MOMG LN Lyxor ETF Broad Commodities 9 0.0 0.38 - 0.35 2.16 NXEON EU db x EONIA Total Return 1,282 5.0 0.01 - 0.15 - N Main X-listings: LYPX GR (EUR), MOMT EU (USD)Main X-listings: DX23 GY (EUR), XEO2 LN (GBp), XEOD IM (EUR) SDYC LN iShares S&P GSCI Commodity Sw ap 7 0.0 0.90 - 0.45 1.27 NMINT LN Source PIMCO USD Enhanced Short Maturity 927 4.6 0.15 - 0.35 0.20 N Main X-listings: IDRC LN (USD)LEONIA IM Lyxor € Cash EuroMTS Eonia Inv 726 2.5 0.03 - 0.15 0.01 N LYPW EU Lyxor S&P Agg 3 Month Fw d 7 - 0.35 - 0.35 - NXFFE IM db x Fed Funds Eff Rate TR 148 0.4 0.30 - 0.15 1.90 N Main X-listings: GSAG LN (GBp), GSAU LN (USD)Main X-listings: XFF FP (USD) DCCHIS SW UBS DJ-UBS Commodity CHF I 5 0.0 0.80 - 1.21 - NCBEONIA GY ComStage Commerz EONIA TR 137 0.4 0.62 - 0.10 0.00 N SPGS LN iPath S&P GSCI TR 5 0.0 - - 0.75 0.01 NMain X-listings: CBEONI SW (CHF) Main X-listings: SPGS GY (EUR)CE3 FP Amundi EONIA 105 0.0 0.17 - 0.14 0.02 N DCEUIS SW UBS DJ-UBS Commodity EUR I 5 0.0 0.80 - 1.15 - NQUID LN Source PIMCO Sterling Short Maturity 66 0.4 0.10 - 0.35 - N DCGBIS SW UBS DJ-UBS Commodity GBP I 4 0.0 0.75 - 1.21 - NXACTREPO SS XACT Sw eden REPO 57 0.3 - - 0.14 0.02 N DCGBAS SW UBS DJ-UBS Commodity GBP A 4 0.0 0.75 - 1.38 - NXCCR GY db x Currency Returns 32 0.1 0.06 - 0.30 0.31 N SALL LN ETFS Short All Cmdty DJ-UBSCI 4 1.2 0.27 21 0.98 - NXST FP db x Sonia TR 30 0.2 0.41 - 0.15 0.01 N Main X-listings: SALL IM (EUR)Main X-listings: XSTR IM (EUR) XCTE GY db Commodity Booster Hedged EUR 3 0.0 0.37 - 0.45 1.77 NXUSD LN db x US Dollar Money Mkt 19 0.2 1.00 - 0.15 0.00 N AIGX LN ETFS Ex-Energy DJ-UBSCISM 2 0.0 0.29 - 0.49 0.76 NCBFEDFER GY ComStage FED Funds Eff Rate 17 0.1 0.28 - 0.10 - N Main X-listings: AIGX IM (EUR)Main X-listings: CBFEDF SW (CHF), CBFEDFUS SW (USD) DCUSIS SW UBS DJ UBS CMDTY USD I ACC 2 0.0 0.79 - 0.97 - NXCCC GY db x Currency Carry 15 0.2 0.05 - 0.30 0.44 N PALL LN ETFS GBP All Commodities 2 0.1 0.25 - 0.49 0.70 NXVAL GY db x Currency Valuation 13 0.1 0.07 - 0.30 0.40 N LALL LN ETFS Lev. All Cmdty DJ-UBSCI 2X 2 0.0 1.39 21 0.98 - NCSEO IM CSETF on EONIA 7 0.2 0.13 - 0.14 0.00 N Main X-listings: LALL IM (EUR)Main X-listings: CEO1 LN (GBp) RGSL SW Market Access S&P GSCI 35/20 2X Leveraged 2 - 0.83 - 0.65 - NCSFF SW CSETF on Fed Funds Effective rate 2 0.0 0.06 - 0.14 0.02 N Main X-listings: RGSL LN (GBp), RGSL IM (EUR)Main X-listings: CSFF IM (EUR), CFF1 LN (GBp) 00XK GR ETFS Eur All Commodities 1 0.0 0.82 - 0.49 0.48 NXMOM GY db x Currency Momentum 1 0.1 0.08 - 0.30 0.65 N RGSS SW Market Access S&P GSCI 35/20 2X Inverse 1 - 0.81 - 0.65 - NKSMCRB3 IT KSM Variable ILS Deposite - - - - - - N Main X-listings: RGSS IM (EUR), RGSS LN (GBp)MBTS76 IT Clal - Mabat Sh Tel Bnd Shekel - - - - - - N LYPV GR Lyxor S&P Agg Inv 1 Mo Fw d 1 0.0 0.41 - 0.40 6.01 N
Main X-listings: GSIU LN (GBp), GSAI LN (USD)NEG FP Amundi GSCI Non-Energy 1 - - - 0.30 1.13 NMain X-listings: NEG IM (EUR)
Broad Commodity XEMR GY db Mean Reversion Hedged EUR 1 0.0 0.53 - 0.45 1.48 NXDBC LN db x DBLCI-OY Balanced 1C 512 0.2 1.12 - 0.55 2.82 N XETT GY db Commodity risk balanced Hedged EUR 1 0.0 0.55 - 0.45 - NMain X-listings: XDBD LN (USD), XDBC GY (EUR) DJUB LN iPath DJ-UBS Cmdty TR 1 0.0 0.98 19 0.75 0.00 NDJCOMEX GY iShares DJ AIG Commodity Sw ap 480 1.2 0.14 - 0.46 3.69 N Main X-listings: DJUB GY (EUR)CRB IM Lyxor Commodities CRB 461 0.5 0.14 - 0.35 2.30 N SGSLE GY Source S&P GSCI Light T-Bill 0 0.0 2.05 - 0.49 0.17 NMain X-listings: CRB SW (USD) Main X-listings: SGSLE SW (USD)AIGC LN ETFS All Cmdty DJ-UBSCISM 362 2.9 0.15 - 0.49 0.98 N EXEF LN ETFS Fw d Ex-Energy UBSCI-F3SM 0 0.0 0.41 - 0.49 0.77 NMain X-listings: AGCP LN (GBp), OD7V GY (EUR) Main X-listings: EXEF IM (EUR)XBCU LN db x DBLCI-OY Balanced USD 355 0.9 0.28 - 0.55 2.24 N LNEY LN ETFS Lev. Ex-Energy DJ-UBSCI 0 0.0 0.89 - 0.98 - NGSCIUSD SW EasyETF S&P GSCI 208 0.8 0.29 - 0.30 5.88 N Main X-listings: 4RTU GY (EUR)MRIC SW RBS Jim Rogers Intl Cmdty Index Fund 200 0.1 1.35 - 0.70 2.65 N PFCM LN ETFS Fw d All Comodities 0 0.0 0.21 - 0.49 0.64 NMain X-listings: M9SA GY (EUR), RICI LN (GBp) SNEY LN ETFS Short Ex-Energy DJ-UBSCI 0 0.0 0.47 - 0.98 - NGSCIEUR GY EasyETF S&P GSCI 173 0.4 0.36 - 0.30 5.86 N Main X-listings: 9GAV GY (EUR)CRN FP Lyxor Cmdty CRB Non-Energy 168 0.3 0.17 - 0.35 2.10 N KSMCMDT IT KSM Commodities - - - - 1.20 - NLGCU LN Source LGIM Commodity Composite 119 0.2 1.34 - 0.40 0.34 N TDBLCI8 IT Psagot Sal - DB Liquid Commodity - - - - - - NMain X-listings: LGCF LN (GBp) ESSG LN UBS Essence GBP - 0.0 0.90 - 1.25 0.06 NCBCOMM GY ComStage Commodity EW Index 109 0.3 0.29 - 0.30 4.36 N CMDJ LN UBS CMCI DJ-UBS - 0.0 0.70 - - 0.15 NMain X-listings: CBCOMM SW (CHF), CBCOMMUS SW (USD) EDJCM SW UBS DJ Constant Mat € Hedged - 0.0 - - 0.62 0.15 NXACTRAVA SS XACT Commodity 99 0.4 1.40 - 0.70 - N CDJCM SW UBS DJ Constant Mat CHF Hedged - 0.0 - - 0.72 0.18 NXCBE GY db Cmdty Booster DJ-UBSCI 91 0.1 0.55 - 0.95 1.76 N CMDE LN UBS CMCI DJ-UBS € - 0.0 0.70 - 0.62 0.19 NXDBG LN db x DBLCI-OY Balanced 3C 66 0.1 0.54 - 0.55 2.24 N FLEU LN UBS Cmsp USD - 0.0 0.70 - 0.50 0.19 NCCCHIS SW UBS CMCI Composite CHF I 62 0.1 0.70 - 1.36 - N TCM6M SW UBS CMCI 6M Constant Mat - US$ - 0.0 - - 0.38 0.23 NCCUSIS SW UBS CMCI Comp SF-$I 58 0.1 0.73 - 1.12 - N TCM3M SW UBS CMCI 3M Constant Mat - US$ - 0.0 - - 0.38 0.26 NLYCRN SW Lyxor Cmdty CRB Non-Energy USD 57 0.1 0.18 - 0.35 1.55 N CMDG LN UBS CMCI DJ-UBS £ - 0.0 0.70 - 1.00 0.30 NCCEUIS SW UBS CMCI Composite EUR I 45 0.0 0.74 - 1.30 - N TCMAM SW UBS CMCI Active USD ETC - 0.0 - - - 0.32 NCOMF LN ETFX DJ-UBS All Cmdty Frd 3M-$ 40 0.1 0.52 - 0.55 0.37 N FLEG LN UBS CMSP £ - 0.0 0.70 - 1.00 0.39 NMain X-listings: CMFP LN (GBp), ETL2 GY (EUR), COMF SW (CHF) ACTI LN UBS CMCI Active US$ - 0.0 0.70 - 1.25 0.40 NCCCHAS SW UBS CMCI Composite CHF A 38 0.1 0.71 - 1.53 - N ACTE LN UBS CMCI Active € - 0.0 0.70 - 1.37 0.44 NCCUSAS SW UBS CMCI COMPOSITE SF-$A 27 0.1 0.73 - 1.29 - N ESSE LN UBS Essence € - 0.0 0.90 - 0.87 1.37 NXEM8 LN db Mean Reversion ETC 23 0.0 0.51 - 0.45 1.50 N FLEE LN UBS CMSP € - 0.0 0.70 - 0.62 8.57 NLYPY EU Lyxor Broad Cmdty Optimix 21 - 0.37 - 0.35 - N CCMAM SW UBS CMCI Active CHF - 0.0 - - - 0.38 NFAIG LN ETFS Fw d Cmdty DJ-UBSCI-F3SM 18 0.2 0.24 - 0.49 0.84 N ACTG LN UBS CMCI Active £ - 0.0 0.70 - - 0.57 NMain X-listings: FAIG IM (EUR) CMCG LN UBS Composite GBP - 0.0 0.70 - 0.88 0.27 NLYPX EU Lyxor Broad Commodities 16 - 0.34 - 0.35 - N TDJCM SW UBS DJ Constant Maturity - 0.0 - - 0.50 0.12 NXCT5 LN db Commodity Booster 16 0.0 0.31 - 0.45 - N ECMAM SW UBS CMCI Active EUR - 0.0 - - - 0.35 NDCUSAS SW UBS DJ-UBS Commodity USD A 16 0.1 0.77 - 1.14 - N CMCE LN UBS Composite € - 0.0 0.70 - 0.50 0.16 NXET5 LN db S&P GSCI 15 0.0 0.30 - 0.85 1.92 N ESSU LN UBS Essence US$ - 0.0 0.90 - 0.75 0.55 NOPTM LN Lyxor Broad Cmdty Optimix 13 0.1 0.40 - 0.35 1.93 N TCM1Y SW UBS CMCI 1Y Constant Mat - US$ - 0.0 - - 0.38 0.22 NMain X-listings: OPTG LN (GBp), LYPY GR (EUR) ECMCI SW UBS CMCI - EUR - 0.0 - - 0.50 0.42 NXDCS SW db x DBLCI-OY Balanced 4C 13 0.1 0.42 - 0.55 9.49 N CCMCI SW UBS CMCI - CHF - 0.1 - - 0.81 0.51 NXCBC SW db Cmdty Booster DJ-UBSCI 13 0.1 0.64 - 0.95 1.76 N TCMCI SW UBS CMCI - USD - 0.2 - - 0.38 0.24 NCCEUAS SW UBS CMCI Composite EUR A 12 0.0 0.74 - 1.47 - N CMCI LN UBS Composite USD - 0.3 0.70 - 0.38 0.12 NDCCHAS SW UBS DJ-UBS Commodity A 12 0.1 0.76 - 1.38 - N Metals9J6I GY RBS RICI Enhanced Index 11 0.0 0.52 - 0.85 2.24 N ZSIL SW ZKB Silver 946 2.8 0.25 - 0.60 - NXCTA GY db Metals & Energy Booster 11 0.0 0.45 - 0.45 1.15 N Main X-listings: ZKBSF US (USD)XCBL GY db x S&P GSCI Light Energy 10 0.0 0.65 - 0.95 2.11 N
Fixed Income Commodity
Commodity
1 Option Liquidity (H / M / L / N - High / Medium / Low / None)2 / - Significant increase / decrease in shares outstanding in last one year
EMEA Listed ETFs
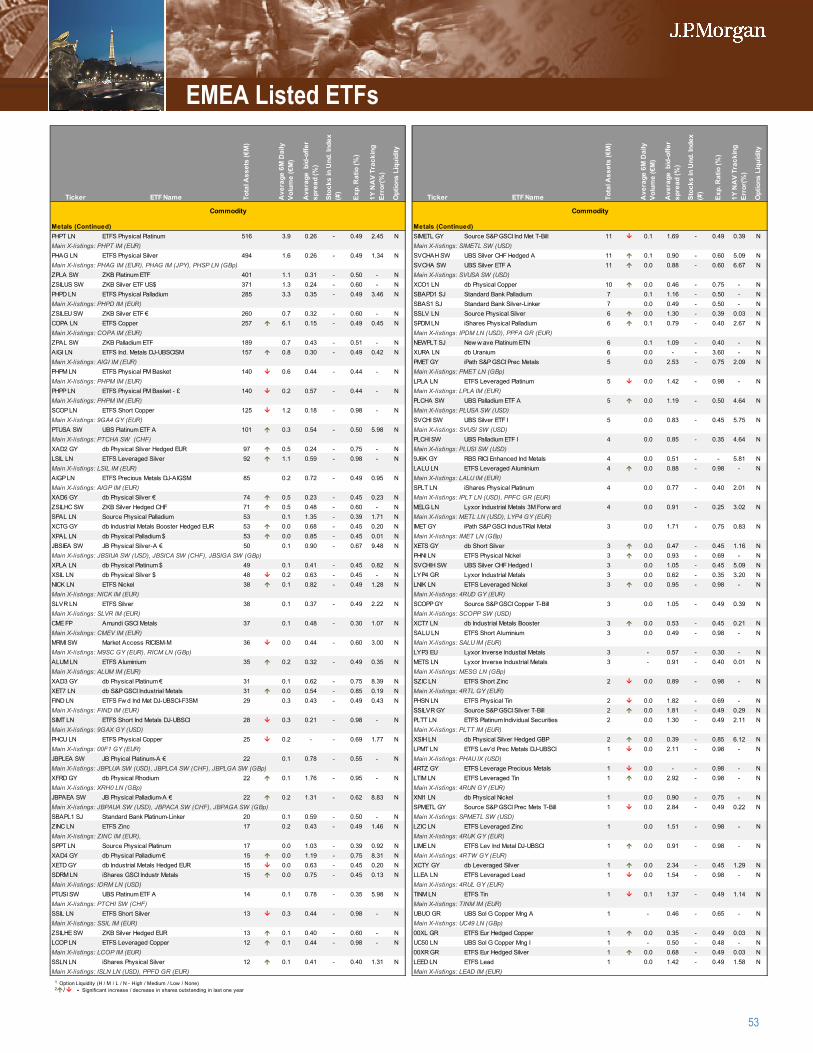
53
Ticker ETF Name Tota
l Ass
ets
(€M
)
Ave
rage
6M
Dai
ly
Volu
me
(€M
)
Ave
rage
bid
-offe
r sp
read
(%)
Stoc
ks in
Und
. Ind
ex
(#)
Exp.
Rat
io (%
)
1Y N
AV
Trac
king
Er
ror(
%)
Opt
ions
Liq
uidi
ty
Ticker ETF Name Tota
l Ass
ets
(€M
)
Ave
rage
6M
Dai
ly
Volu
me
(€M
)
Ave
rage
bid
-offe
r sp
read
(%)
Stoc
ks in
Und
. Ind
ex
(#)
Exp.
Rat
io (%
)
1Y N
AV
Trac
king
Er
ror(
%)
Opt
ions
Liq
uidi
ty
Metals (Continued) Metals (Continued)PHPT LN ETFS Physical Platinum 516 3.9 0.26 - 0.49 2.45 N SIMETL GY Source S&P GSCI Ind Met T-Bill 11 0.1 1.69 - 0.49 0.39 NMain X-listings: PHPT IM (EUR) Main X-listings: SIMETL SW (USD)PHAG LN ETFS Physical Silver 494 1.6 0.26 - 0.49 1.34 N SVCHAH SW UBS Silver CHF Hedged A 11 0.1 0.90 - 0.60 5.09 NMain X-listings: PHAG IM (EUR), PHAG IM (JPY), PHSP LN (GBp) SVCHA SW UBS Silver ETF A 11 0.0 0.88 - 0.60 6.67 NZPLA SW ZKB Platinum ETF 401 1.1 0.31 - 0.50 - N Main X-listings: SVUSA SW (USD)ZSILUS SW ZKB Silver ETF US$ 371 1.3 0.24 - 0.60 - N XCO1 LN db Physical Copper 10 0.0 0.46 - 0.75 - NPHPD LN ETFS Physical Palladium 285 3.3 0.35 - 0.49 3.46 N SBAPD1 SJ Standard Bank Palladium 7 0.1 1.16 - 0.50 - NMain X-listings: PHPD IM (EUR) SBAS1 SJ Standard Bank Silver-Linker 7 0.0 0.49 - 0.50 - NZSILEU SW ZKB Silver ETF € 260 0.7 0.32 - 0.60 - N SSLV LN Source Physical Silver 6 0.0 1.30 - 0.39 0.03 NCOPA LN ETFS Copper 257 6.1 0.15 - 0.49 0.45 N SPDM LN iShares Physical Palladium 6 0.1 0.79 - 0.40 2.67 NMain X-listings: COPA IM (EUR) Main X-listings: IPDM LN (USD), PPFA GR (EUR)ZPAL SW ZKB Palladium ETF 189 0.7 0.43 - 0.51 - N NEWPLT SJ New w ave Platinum ETN 6 0.1 1.09 - 0.40 - NAIGI LN ETFS Ind. Metals DJ-UBSCISM 157 0.8 0.30 - 0.49 0.42 N XURA LN db Uranium 6 0.0 - - 3.60 - NMain X-listings: AIGI IM (EUR) PMET GY iPath S&P GSCI Prec Metals 5 0.0 2.53 - 0.75 2.09 NPHPM LN ETFS Physical PM Basket 140 0.6 0.44 - 0.44 - N Main X-listings: PMET LN (GBp)Main X-listings: PHPM IM (EUR) LPLA LN ETFS Leveraged Platinum 5 0.0 1.42 - 0.98 - NPHPP LN ETFS Physical PM Basket - £ 140 0.2 0.57 - 0.44 - N Main X-listings: LPLA IM (EUR)Main X-listings: PHPM IM (EUR) PLCHA SW UBS Palladium ETF A 5 0.0 1.19 - 0.50 4.64 NSCOP LN ETFS Short Copper 125 1.2 0.18 - 0.98 - N Main X-listings: PLUSA SW (USD)Main X-listings: 9GA4 GY (EUR) SVCHI SW UBS Silver ETF I 5 0.0 0.83 - 0.45 5.75 NPTUSA SW UBS Platinum ETF A 101 0.3 0.54 - 0.50 5.98 N Main X-listings: SVUSI SW (USD)Main X-listings: PTCHA SW (CHF) PLCHI SW UBS Palladium ETF I 4 0.0 0.85 - 0.35 4.64 NXAD2 GY db Physical Silver Hedged EUR 97 0.5 0.24 - 0.75 - N Main X-listings: PLUSI SW (USD)LSIL LN ETFS Leveraged Silver 92 1.1 0.59 - 0.98 - N 9J6K GY RBS RICI Enhanced Ind Metals 4 0.0 0.51 - - 5.81 NMain X-listings: LSIL IM (EUR) LALU LN ETFS Leveraged Aluminium 4 0.0 0.88 - 0.98 - NAIGP LN ETFS Precious Metals DJ-AIGSM 85 0.2 0.72 - 0.49 0.95 N Main X-listings: LALU IM (EUR)Main X-listings: AIGP IM (EUR) SPLT LN iShares Physical Platinum 4 0.0 0.77 - 0.40 2.01 NXAD6 GY db Physical Silver € 74 0.5 0.23 - 0.45 0.23 N Main X-listings: IPLT LN (USD), PPFC GR (EUR)ZSILHC SW ZKB Silver Hedged CHF 71 0.5 0.48 - 0.60 - N MELG LN Lyxor Industrial Metals 3M Forw ard 4 0.0 0.91 - 0.25 3.02 NSPAL LN Source Physical Palladium 53 0.1 1.35 - 0.39 1.71 N Main X-listings: METL LN (USD), LYP4 GY (EUR)XCTG GY db Industrial Metals Booster Hedged EUR 53 0.0 0.68 - 0.45 0.20 N IMET GY iPath S&P GSCI IndusTRial Metal 3 0.0 1.71 - 0.75 0.83 NXPAL LN db Physical Palladium $ 53 0.0 0.85 - 0.45 0.01 N Main X-listings: IMET LN (GBp)JBSIEA SW JB Physical Silver-A € 50 0.1 0.90 - 0.67 9.48 N XETS GY db Short Silver 3 0.0 0.47 - 0.45 1.16 NMain X-listings: JBSIUA SW (USD), JBSICA SW (CHF), JBSIGA SW (GBp) PHNI LN ETFS Physical Nickel 3 0.0 0.93 - 0.69 - NXPLA LN db Physical Platinum $ 49 0.1 0.41 - 0.45 0.82 N SVCHIH SW UBS Silver CHF Hedged I 3 0.0 1.05 - 0.45 5.09 NXSIL LN db Physical Silver $ 48 0.2 0.63 - 0.45 - N LYP4 GR Lyxor Industrial Metals 3 0.0 0.62 - 0.35 3.20 NNICK LN ETFS Nickel 38 0.1 0.82 - 0.49 1.28 N LNIK LN ETFS Leveraged Nickel 3 0.0 0.95 - 0.98 - NMain X-listings: NICK IM (EUR) Main X-listings: 4RUD GY (EUR)SLVR LN ETFS Silver 38 0.1 0.37 - 0.49 2.22 N SCOPP GY Source S&P GSCI Copper T-Bill 3 0.0 1.05 - 0.49 0.39 NMain X-listings: SLVR IM (EUR) Main X-listings: SCOPP SW (USD)CME FP Amundi GSCI Metals 37 0.1 0.48 - 0.30 1.07 N XCT7 LN db Industrial Metals Booster 3 0.0 0.53 - 0.45 0.21 NMain X-listings: CMEV IM (EUR) SALU LN ETFS Short Aluminium 3 0.0 0.49 - 0.98 - NMRMI SW Market Access RICISM-M 36 0.0 0.44 - 0.60 3.00 N Main X-listings: SALU IM (EUR)Main X-listings: M9SC GY (EUR), RICM LN (GBp) LYP3 EU Lyxor Inverse Industial Metals 3 - 0.57 - 0.30 - NALUM LN ETFS Aluminium 35 0.2 0.32 - 0.49 0.35 N METS LN Lyxor Inverse Industrial Metals 3 - 0.91 - 0.40 0.01 NMain X-listings: ALUM IM (EUR) Main X-listings: MESG LN (GBp)XAD3 GY db Physical Platinum € 31 0.1 0.62 - 0.75 8.39 N SZIC LN ETFS Short Zinc 2 0.0 0.89 - 0.98 - NXET7 LN db S&P GSCI Industrial Metals 31 0.0 0.54 - 0.85 0.19 N Main X-listings: 4RTL GY (EUR)FIND LN ETFS Fw d Ind Met DJ-UBSCI-F3SM 29 0.3 0.43 - 0.49 0.43 N PHSN LN ETFS Physical Tin 2 0.0 1.82 - 0.69 - NMain X-listings: FIND IM (EUR) SSILVR GY Source S&P GSCI Silver T-Bill 2 0.0 1.81 - 0.49 0.29 NSIMT LN ETFS Short Ind Metals DJ-UBSCI 28 0.3 0.21 - 0.98 - N PLTT LN ETFS Platinum Individual Securities 2 0.0 1.30 - 0.49 2.11 NMain X-listings: 9GAX GY (USD) Main X-listings: PLTT IM (EUR)PHCU LN ETFS Physical Copper 25 0.2 - - 0.69 1.77 N XSIH LN db Physical Silver Hedged GBP 2 0.0 0.39 - 0.85 6.12 NMain X-listings: 00F1 GY (EUR) LPMT LN ETFS Lev'd Prec Metals DJ-UBSCI 1 0.0 2.11 - 0.98 - NJBPLEA SW JB Phyical Platinum-A € 22 0.1 0.78 - 0.55 - N Main X-listings: PHAU IX (USD)Main X-listings: JBPLUA SW (USD), JBPLCA SW (CHF), JBPLGA SW (GBp) 4RTZ GY ETFS Leverage Precious Metals 1 0.0 - - 0.98 - NXFRD GY db Physical Rhodium 22 0.1 1.76 - 0.95 - N LTIM LN ETFS Leveraged Tin 1 0.0 2.92 - 0.98 - NMain X-listings: XRH0 LN (GBp) Main X-listings: 4RUN GY (EUR)JBPAEA SW JB Physical Palladium-A € 22 0.2 1.31 - 0.62 8.83 N XNI1 LN db Physical Nickel 1 0.0 0.90 - 0.75 - NMain X-listings: JBPAUA SW (USD), JBPACA SW (CHF), JBPAGA SW (GBp) SPMETL GY Source S&P GSCI Prec Mets T-Bill 1 0.0 2.84 - 0.49 0.22 NSBAPL1 SJ Standard Bank Platinum-Linker 20 0.1 0.59 - 0.50 - N Main X-listings: SPMETL SW (USD)ZINC LN ETFS Zinc 17 0.2 0.43 - 0.49 1.46 N LZIC LN ETFS Leveraged Zinc 1 0.0 1.51 - 0.98 - NMain X-listings: ZINC IM (EUR), Main X-listings: 4RUK GY (EUR)SPPT LN Source Physical Platinum 17 0.0 1.03 - 0.39 0.92 N LIME LN ETFS Lev Ind Metal DJ-UBSCI 1 0.0 0.91 - 0.98 - NXAD4 GY db Physical Palladium € 15 0.0 1.19 - 0.75 8.31 N Main X-listings: 4RTW GY (EUR)XETD GY db Industrial Metals Hedged EUR 15 0.0 0.63 - 0.45 0.20 N XCTY GY db Leveraged Silver 1 0.0 2.34 - 0.45 1.29 NSDRM LN iShares GSCI Industr Metals 15 0.0 0.75 - 0.45 0.13 N LLEA LN ETFS Leveraged Lead 1 0.0 1.54 - 0.98 - NMain X-listings: IDRM LN (USD) Main X-listings: 4RUL GY (EUR)PTUSI SW UBS Platinum ETF A 14 0.1 0.78 - 0.35 5.98 N TINM LN ETFS Tin 1 0.1 1.37 - 0.49 1.14 NMain X-listings: PTCHI SW (CHF) Main X-listings: TINM IM (EUR)SSIL LN ETFS Short Silver 13 0.3 0.44 - 0.98 - N UBUO GR UBS Sol G Copper Mng A 1 - 0.46 - 0.65 - NMain X-listings: SSIL IM (EUR) Main X-listings: UC49 LN (GBp)ZSILHE SW ZKB Silver Hedged EUR 13 0.1 0.40 - 0.60 - N 00XL GR ETFS Eur Hedged Copper 1 0.0 0.35 - 0.49 0.03 NLCOP LN ETFS Leveraged Copper 12 0.1 0.44 - 0.98 - N UC50 LN UBS Sol G Copper Mng I 1 - 0.50 - 0.48 - NMain X-listings: LCOP IM (EUR) 00XR GR ETFS Eur Hedged Silver 1 0.0 0.68 - 0.49 0.03 NSSLN LN iShares Physical Silver 12 0.1 0.41 - 0.40 1.31 N LEED LN ETFS Lead 1 0.0 1.42 - 0.49 1.58 NMain X-listings: ISLN LN (USD), PPFD GR (EUR) Main X-listings: LEAD IM (EUR)
Commodity Commodity
1 Option Liquidity (H / M / L / N - High / Medium / Low / None)2 / - Significant increase / decrease in shares outstanding in last one year
EMEA Listed ETFs
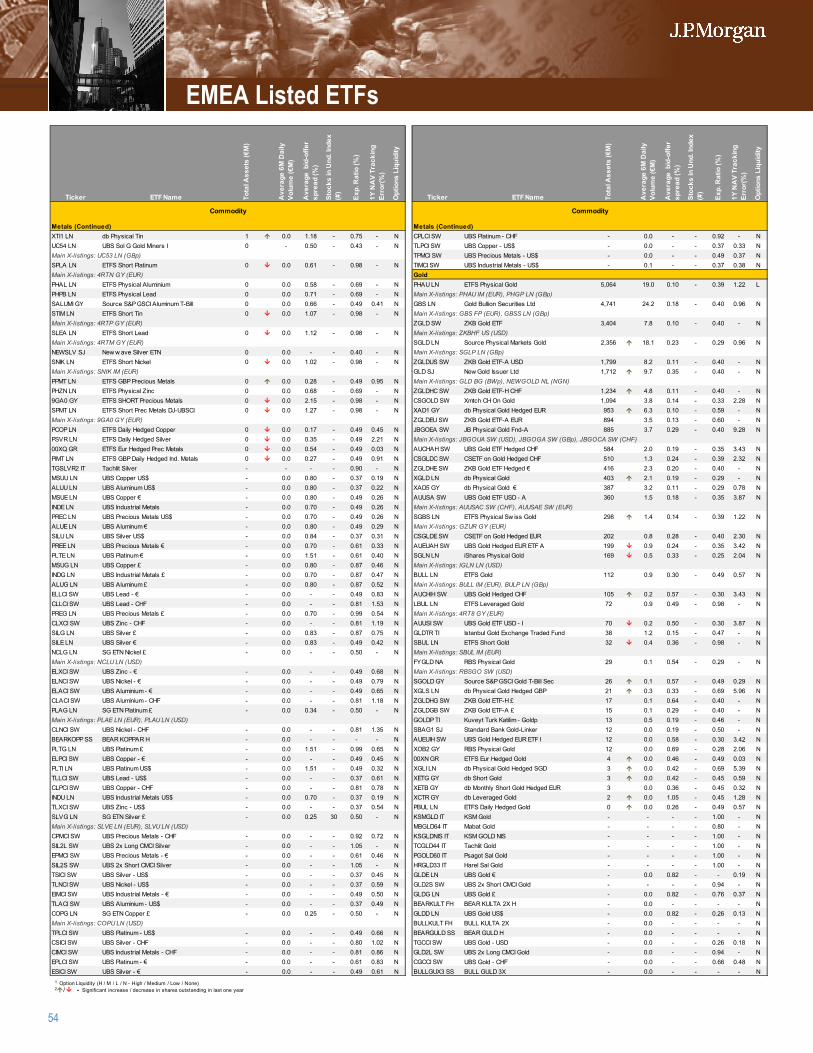
54
Ticker ETF Name Tota
l Ass
ets
(€M
)
Ave
rage
6M
Dai
ly
Volu
me
(€M
)
Ave
rage
bid
-offe
r sp
read
(%)
Stoc
ks in
Und
. Ind
ex
(#)
Exp.
Rat
io (%
)
1Y N
AV
Trac
king
Er
ror(
%)
Opt
ions
Liq
uidi
ty
Ticker ETF Name Tota
l Ass
ets
(€M
)
Ave
rage
6M
Dai
ly
Volu
me
(€M
)
Ave
rage
bid
-offe
r sp
read
(%)
Stoc
ks in
Und
. Ind
ex
(#)
Exp.
Rat
io (%
)
1Y N
AV
Trac
king
Er
ror(
%)
Opt
ions
Liq
uidi
ty
Metals (Continued) Metals (Continued)XTI1 LN db Physical Tin 1 0.0 1.18 - 0.75 - N CPLCI SW UBS Platinum - CHF - 0.0 - - 0.92 - NUC54 LN UBS Sol G Gold Miners I 0 - 0.50 - 0.43 - N TLPCI SW UBS Copper - US$ - 0.0 - - 0.37 0.33 NMain X-listings: UC53 LN (GBp) TPMCI SW UBS Precious Metals - US$ - 0.0 - - 0.49 0.37 NSPLA LN ETFS Short Platinum 0 0.0 0.61 - 0.98 - N TIMCI SW UBS Industrial Metals - US$ - 0.1 - - 0.37 0.38 NMain X-listings: 4RTN GY (EUR) GoldPHAL LN ETFS Physical Aluminium 0 0.0 0.58 - 0.69 - N PHAU LN ETFS Physical Gold 5,064 19.0 0.10 - 0.39 1.22 LPHPB LN ETFS Physical Lead 0 0.0 0.71 - 0.69 - N Main X-listings: PHAU IM (EUR), PHGP LN (GBp)SALUMI GY Source S&P GSCI Aluminum T-Bill 0 0.0 0.66 - 0.49 0.41 N GBS LN Gold Bullion Securities Ltd 4,741 24.2 0.18 - 0.40 0.96 NSTIM LN ETFS Short Tin 0 0.0 1.07 - 0.98 - N Main X-listings: GBS FP (EUR), GBSS LN (GBp)Main X-listings: 4RTP GY (EUR) ZGLD SW ZKB Gold ETF 3,404 7.8 0.10 - 0.40 - NSLEA LN ETFS Short Lead 0 0.0 1.12 - 0.98 - N Main X-listings: ZKBHF US (USD)Main X-listings: 4RTM GY (EUR) SGLD LN Source Physical Markets Gold 2,356 18.1 0.23 - 0.29 0.96 NNEWSLV SJ New w ave Silver ETN 0 0.0 - - 0.40 - N Main X-listings: SGLP LN (GBp)SNIK LN ETFS Short Nickel 0 0.0 1.02 - 0.98 - N ZGLDUS SW ZKB Gold ETF-A USD 1,799 8.2 0.11 - 0.40 - NMain X-listings: SNIK IM (EUR) GLD SJ New Gold Issuer Ltd 1,712 9.7 0.35 - 0.40 - NPPMT LN ETFS GBP Precious Metals 0 0.0 0.28 - 0.49 0.95 N Main X-listings: GLD BG (BWp), NEWGOLD NL (NGN)PHZN LN ETFS Physical Zinc 0 0.0 0.68 - 0.69 - N ZGLDHC SW ZKB Gold ETF-H CHF 1,234 4.8 0.11 - 0.40 - N9GA0 GY ETFS SHORT Precious Metals 0 0.0 2.15 - 0.98 - N CSGOLD SW Xmtch CH On Gold 1,094 3.8 0.14 - 0.33 2.28 NSPMT LN ETFS Short Prec Metals DJ-UBSCI 0 0.0 1.27 - 0.98 - N XAD1 GY db Physical Gold Hedged EUR 953 6.3 0.10 - 0.59 - NMain X-listings: 9GA0 GY (EUR) ZGLDEU SW ZKB Gold ETF-A EUR 894 3.5 0.13 - 0.60 - NPCOP LN ETFS Daily Hedged Copper 0 0.0 0.17 - 0.49 0.45 N JBGOEA SW JB Physical Gold Fnd-A 885 3.7 0.29 - 0.40 9.28 NPSVR LN ETFS Daily Hedged Silver 0 0.0 0.35 - 0.49 2.21 N Main X-listings: JBGOUA SW (USD), JBGOGA SW (GBp), JBGOCA SW (CHF)00XQ GR ETFS Eur Hedged Prec Metals 0 0.0 0.54 - 0.49 0.03 N AUCHAH SW UBS Gold ETF Hedged CHF 584 2.0 0.19 - 0.35 3.43 NPIMT LN ETFS GBP Daily Hedged Ind. Metals 0 0.0 0.27 - 0.49 0.91 N CSGLDC SW CSETF on Gold Hedged CHF 510 1.3 0.24 - 0.39 2.32 NTGSLVR2 IT Tachlit Silver - - - - 0.90 - N ZGLDHE SW ZKB Gold ETF Hedged € 416 2.3 0.20 - 0.40 - NMSUU LN UBS Copper US$ - 0.0 0.80 - 0.37 0.19 N XGLD LN db Physical Gold 403 2.1 0.19 - 0.29 - NALUU LN UBS Aluminum US$ - 0.0 0.80 - 0.37 0.22 N XAD5 GY db Physical Gold € 387 3.2 0.11 - 0.29 0.78 NMSUE LN UBS Copper € - 0.0 0.80 - 0.49 0.26 N AUUSA SW UBS Gold ETF USD - A 360 1.5 0.18 - 0.35 3.87 NINDE LN UBS Industrial Metals - 0.0 0.70 - 0.49 0.26 N Main X-listings: AUUSAC SW (CHF), AUUSAE SW (EUR)PREC LN UBS Precious Metals US$ - 0.0 0.70 - 0.49 0.26 N SGBS LN ETFS Physical Sw iss Gold 298 1.4 0.14 - 0.39 1.22 NALUE LN UBS Aluminum € - 0.0 0.80 - 0.49 0.29 N Main X-listings: GZUR GY (EUR)SILU LN UBS Silver US$ - 0.0 0.84 - 0.37 0.31 N CSGLDE SW CSETF on Gold Hedged EUR 202 0.8 0.28 - 0.40 2.30 NPREE LN UBS Precious Metals € - 0.0 0.70 - 0.61 0.33 N AUEUAH SW UBS Gold Hedged EUR ETF A 199 0.9 0.24 - 0.35 3.42 NPLTE LN UBS Platinum € - 0.0 1.51 - 0.61 0.40 N SGLN LN iShares Physical Gold 169 0.5 0.33 - 0.25 2.04 NMSUG LN UBS Copper £ - 0.0 0.80 - 0.87 0.46 N Main X-listings: IGLN LN (USD)INDG LN UBS Industrial Metals £ - 0.0 0.70 - 0.87 0.47 N BULL LN ETFS Gold 112 0.9 0.30 - 0.49 0.57 NALUG LN UBS Aluminum £ - 0.0 0.80 - 0.87 0.52 N Main X-listings: BULL IM (EUR), BULP LN (GBp)ELLCI SW UBS Lead - € - 0.0 - - 0.49 0.83 N AUCHIH SW UBS Gold Hedged CHF 105 0.2 0.57 - 0.30 3.43 NCLLCI SW UBS Lead - CHF - 0.0 - - 0.81 1.53 N LBUL LN ETFS Leveraged Gold 72 0.9 0.49 - 0.98 - NPREG LN UBS Precious Metals £ - 0.0 0.70 - 0.99 0.54 N Main X-listings: 4RT8 GY (EUR)CLXCI SW UBS Zinc - CHF - 0.0 - - 0.81 1.19 N AUUSI SW UBS Gold ETF USD - I 70 0.2 0.50 - 0.30 3.87 NSILG LN UBS Silver £ - 0.0 0.83 - 0.87 0.75 N GLDTR TI Istanbul Gold Exchange Traded Fund 38 1.2 0.15 - 0.47 - NSILE LN UBS Silver € - 0.0 0.83 - 0.49 0.42 N SBUL LN ETFS Short Gold 32 0.4 0.36 - 0.98 - NNCLG LN SG ETN Nickel £ - 0.0 - - 0.50 - N Main X-listings: SBUL IM (EUR)Main X-listings: NCLU LN (USD) FYGLD NA RBS Physical Gold 29 0.1 0.54 - 0.29 - NELXCI SW UBS Zinc - € - 0.0 - - 0.49 0.68 N Main X-listings: RBSGO SW (USD)ELNCI SW UBS Nickel - € - 0.0 - - 0.49 0.79 N SGOLD GY Source S&P GSCI Gold T-Bill Sec 26 0.1 0.57 - 0.49 0.29 NELACI SW UBS Aluminium - € - 0.0 - - 0.49 0.65 N XGLS LN db Physical Gold Hedged GBP 21 0.3 0.33 - 0.69 5.96 NCLACI SW UBS Aluminium - CHF - 0.0 - - 0.81 1.18 N ZGLDHG SW ZKB Gold ETF-H £ 17 0.1 0.64 - 0.40 - NPLAG LN SG ETN Platinum £ - 0.0 0.34 - 0.50 - N ZGLDGB SW ZKB Gold ETF-A £ 15 0.1 0.29 - 0.40 - NMain X-listings: PLAE LN (EUR), PLAU LN (USD) GOLDP TI Kuveyt Turk Katilim - Goldp 13 0.5 0.19 - 0.46 - NCLNCI SW UBS Nickel - CHF - 0.0 - - 0.81 1.35 N SBAG1 SJ Standard Bank Gold-Linker 12 0.0 0.19 - 0.50 - NBEARKOPP SS BEAR KOPPAR H - 0.0 - - - - N AUEUIH SW UBS Gold Hedged EUR ETF I 12 0.0 0.58 - 0.30 3.42 NPLTG LN UBS Platinum £ - 0.0 1.51 - 0.99 0.65 N XOB2 GY RBS Physical Gold 12 0.0 0.69 - 0.28 2.06 NELPCI SW UBS Copper - € - 0.0 - - 0.49 0.45 N 00XN GR ETFS Eur Hedged Gold 4 0.0 0.46 - 0.49 0.03 NPLTI LN UBS Platinum US$ - 0.0 1.51 - 0.49 0.32 N XGLI LN db Physical Gold Hedged SGD 3 0.0 0.42 - 0.69 5.39 NTLLCI SW UBS Lead - US$ - 0.0 - - 0.37 0.61 N XETG GY db Short Gold 3 0.0 0.42 - 0.45 0.59 NCLPCI SW UBS Copper - CHF - 0.0 - - 0.81 0.78 N XETB GY db Monthly Short Gold Hedged EUR 3 0.0 0.36 - 0.45 0.32 NINDU LN UBS Industrial Metals US$ - 0.0 0.70 - 0.37 0.19 N XCTR GY db Leveraged Gold 2 0.0 1.05 - 0.45 1.28 NTLXCI SW UBS Zinc - US$ - 0.0 - - 0.37 0.54 N PBUL LN ETFS Daily Hedged Gold 0 0.0 0.26 - 0.49 0.57 NSLVG LN SG ETN Silver £ - 0.0 0.25 30 0.50 - N KSMGLD IT KSM Gold - - - - 1.00 - NMain X-listings: SLVE LN (EUR), SLVU LN (USD) MBGLD64 IT Mabat Gold - - - - 0.80 - NCPMCI SW UBS Precious Metals - CHF - 0.0 - - 0.92 0.72 N KSGLDNIS IT KSM GOLD NIS - - - - 1.00 - NSIL2L SW UBS 2x Long CMCI Silver - 0.0 - - 1.05 - N TCGLD44 IT Tachlit Gold - - - - 1.00 - NEPMCI SW UBS Precious Metals - € - 0.0 - - 0.61 0.46 N PGOLD60 IT Psagot Sal Gold - - - - 1.00 - NSIL2S SW UBS 2x Short CMCI Silver - 0.0 - - 1.05 - N HRGLD33 IT Harel Sal Gold - - - - 1.00 - NTSICI SW UBS Silver - US$ - 0.0 - - 0.37 0.45 N GLDE LN UBS Gold € - 0.0 0.82 - - 0.19 NTLNCI SW UBS Nickel - US$ - 0.0 - - 0.37 0.59 N GLD2S SW UBS 2x Short CMCI Gold - - - - 0.94 - NEIMCI SW UBS Industrial Metals - € - 0.0 - - 0.49 0.50 N GLDG LN UBS Gold £ - 0.0 0.82 - 0.76 0.37 NTLACI SW UBS Aluminium - US$ - 0.0 - - 0.37 0.49 N BEARKULT FH BEAR KULTA 2X H - 0.0 - - - - NCOPG LN SG ETN Copper £ - 0.0 0.25 - 0.50 - N GLDD LN UBS Gold US$ - 0.0 0.82 - 0.26 0.13 NMain X-listings: COPU LN (USD) BULLKULT FH BULL KULTA 2X - 0.0 - - - - NTPLCI SW UBS Platinum - US$ - 0.0 - - 0.49 0.66 N BEARGULD SS BEAR GULD H - 0.0 - - - - NCSICI SW UBS Silver - CHF - 0.0 - - 0.80 1.02 N TGCCI SW UBS Gold - USD - 0.0 - - 0.26 0.18 NCIMCI SW UBS Industrial Metals - CHF - 0.0 - - 0.81 0.86 N GLD2L SW UBS 2x Long CMCI Gold - 0.0 - - 0.94 - NEPLCI SW UBS Platinum - € - 0.0 - - 0.61 0.83 N CGCCI SW UBS Gold - CHF - 0.0 - - 0.66 0.48 NESICI SW UBS Silver - € - 0.0 - - 0.49 0.61 N BULLGUX3 SS BULL GULD 3X - 0.0 - - - - N
Commodity Commodity
1 Option Liquidity (H / M / L / N - High / Medium / Low / None)2 / - Significant increase / decrease in shares outstanding in last one year
EMEA Listed ETFs
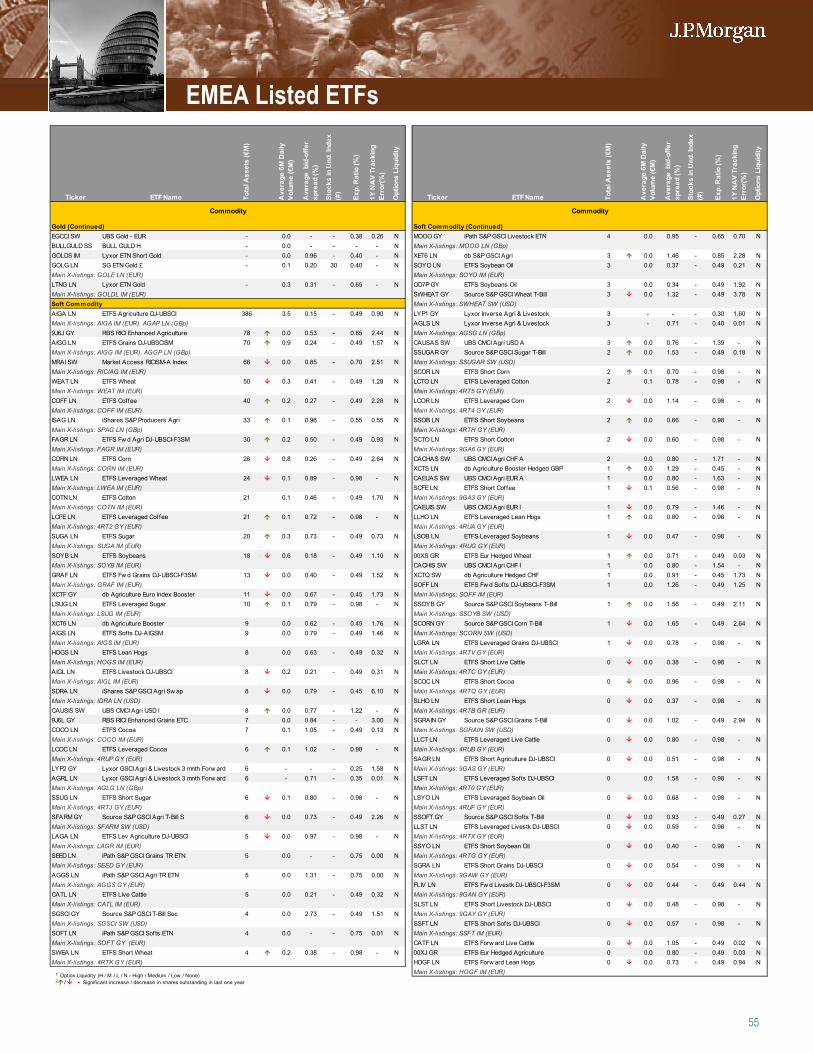
55
Ticker ETF Name Tota
l Ass
ets
(€M
)
Ave
rage
6M
Dai
ly
Volu
me
(€M
)
Ave
rage
bid
-offe
r sp
read
(%)
Stoc
ks in
Und
. Ind
ex
(#)
Exp.
Rat
io (%
)
1Y N
AV
Trac
king
Er
ror(
%)
Opt
ions
Liq
uidi
ty
Ticker ETF Name Tota
l Ass
ets
(€M
)
Ave
rage
6M
Dai
ly
Volu
me
(€M
)
Ave
rage
bid
-offe
r sp
read
(%)
Stoc
ks in
Und
. Ind
ex
(#)
Exp.
Rat
io (%
)
1Y N
AV
Trac
king
Er
ror(
%)
Opt
ions
Liq
uidi
ty
Gold (Continued) Soft Commodity (Continued)EGCCI SW UBS Gold - EUR - 0.0 - - 0.38 0.26 N MOOO GY iPath S&P GSCI Livestock ETN 4 0.0 0.95 - 0.65 0.70 NBULLGULD SS BULL GULD H - 0.0 - - - - N Main X-listings: MOOO LN (GBp)GOLDS IM Lyxor ETN Short Gold - 0.0 0.96 - 0.40 - N XET6 LN db S&P GSCI Agri 3 0.0 1.46 - 0.85 2.28 NGOLG LN SG ETN Gold £ - 0.1 0.20 30 0.40 - N SOYO LN ETFS Soybean Oil 3 0.0 0.37 - 0.49 0.21 NMain X-listings: GOLE LN (EUR) Main X-listings: SOYO IM (EUR)LTNG LN Lyxor ETN Gold - 0.3 0.31 - 0.65 - N OD7P GY ETFS Soybeans Oil 3 0.0 0.34 - 0.49 1.92 NMain X-listings: GOLDL IM (EUR) SWHEAT GY Source S&P GSCI Wheat T-Bill 3 0.0 1.32 - 0.49 3.78 NSoft Commodity Main X-listings: SWHEAT SW (USD)AIGA LN ETFS Agriculture DJ-UBSCI 386 3.5 0.15 - 0.49 0.90 N LYP1 GY Lyxor Inverse Agri & Livestock 3 - - - 0.30 1.60 NMain X-listings: AIGA IM (EUR), AGAP LN (GBp) AGLS LN Lyxor Inverse Agri & Livestock 3 - 0.71 - 0.40 0.01 N9J6J GY RBS RICI Enhanced Agriculture 78 0.0 0.53 - 0.85 2.44 N Main X-listings: AGSG LN (GBp)AIGG LN ETFS Grains DJ-UBSCISM 70 0.9 0.24 - 0.49 1.57 N CAUSAS SW UBS CMCI Agri USD A 3 0.0 0.76 - 1.39 - NMain X-listings: AIGG IM (EUR), AGGP LN (GBp) SSUGAR GY Source S&P GSCI Sugar T-Bill 2 0.0 1.53 - 0.49 0.18 NMRAI SW Market Access RICISM-A Index 66 0.0 0.85 - 0.70 2.51 N Main X-listings: SSUGAR SW (USD)Main X-listings: RICIAG IM (EUR) SCOR LN ETFS Short Corn 2 0.1 0.70 - 0.98 - NWEAT LN ETFS Wheat 50 0.3 0.41 - 0.49 1.28 N LCTO LN ETFS Leveraged Cotton 2 0.1 0.78 - 0.98 - NMain X-listings: WEAT IM (EUR) Main X-listings: 4RT5 GY (EUR)COFF LN ETFS Coffee 40 0.2 0.27 - 0.49 2.28 N LCOR LN ETFS Leveraged Corn 2 0.0 1.14 - 0.98 - NMain X-listings: COFF IM (EUR) Main X-listings: 4RT4 GY (EUR)ISAG LN iShares S&P Producers Agri 33 0.1 0.96 - 0.55 0.55 N SSOB LN ETFS Short Soybeans 2 0.0 0.66 - 0.98 - NMain X-listings: SPAG LN (GBp) Main X-listings: 4RTH GY (EUR)FAGR LN ETFS Fw d Agri DJ-UBSCI-F3SM 30 0.2 0.50 - 0.49 0.93 N SCTO LN ETFS Short Cotton 2 0.0 0.60 - 0.98 - NMain X-listings: FAGR IM (EUR) Main X-listings: 9GA6 GY (EUR)CORN LN ETFS Corn 28 0.8 0.26 - 0.49 2.64 N CACHAS SW UBS CMCI Agri CHF A 2 0.0 0.80 - 1.71 - NMain X-listings: CORN IM (EUR) XCTS LN db Agriculture Booster Hedged GBP 1 0.0 1.29 - 0.45 - NLWEA LN ETFS Leveraged Wheat 24 0.1 0.89 - 0.98 - N CAEUAS SW UBS CMCI Agri EUR A 1 0.0 0.80 - 1.63 - NMain X-listings: LWEA IM (EUR) SCFE LN ETFS Short Coffee 1 0.1 0.56 - 0.98 - NCOTN LN ETFS Cotton 21 0.1 0.46 - 0.49 1.70 N Main X-listings: 9GA3 GY (EUR)Main X-listings: COTN IM (EUR) CAEUIS SW UBS CMCI Agri EUR I 1 0.0 0.79 - 1.46 - NLCFE LN ETFS Leveraged Coffee 21 0.1 0.72 - 0.98 - N LLHO LN ETFS Leveraged Lean Hogs 1 0.0 0.80 - 0.98 - NMain X-listings: 4RT2 GY (EUR) Main X-listings: 4RUA GY (EUR)SUGA LN ETFS Sugar 20 0.3 0.73 - 0.49 0.73 N LSOB LN ETFS Leveraged Soybeans 1 0.0 0.47 - 0.98 - NMain X-listings: SUGA IM (EUR) Main X-listings: 4RUG GY (EUR)SOYB LN ETFS Soybeans 18 0.6 0.18 - 0.49 1.10 N 00XS GR ETFS Eur Hedged Wheat 1 0.0 0.71 - 0.49 0.03 NMain X-listings: SOYB IM (EUR) CACHIS SW UBS CMCI Agri CHF I 1 0.0 0.80 - 1.54 - NGRAF LN ETFS Fw d Grains DJ-UBSCI-F3SM 13 0.0 0.40 - 0.49 1.52 N XCTQ SW db Agriculture Hedged CHF 1 0.0 0.91 - 0.45 1.73 NMain X-listings: GRAF IM (EUR) SOFF LN ETFS Fw d Softs DJ-UBSCI-F3SM 1 0.0 1.26 - 0.49 1.25 NXCTF GY db Agriculture Euro Index Booster 11 0.0 0.67 - 0.45 1.73 N Main X-listings: SOFF IM (EUR)LSUG LN ETFS Leveraged Sugar 10 0.1 0.79 - 0.98 - N SSOYB GY Source S&P GSCI Soybeans T-Bill 1 0.0 1.56 - 0.49 2.11 NMain X-listings: LSUG IM (EUR) Main X-listings: SSOYB SW (USD)XCT6 LN db Agriculture Booster 9 0.0 0.62 - 0.45 1.76 N SCORN GY Source S&P GSCI Corn T-Bill 1 0.0 1.65 - 0.49 2.64 NAIGS LN ETFS Softs DJ-AIGSM 9 0.0 0.79 - 0.49 1.46 N Main X-listings: SCORN SW (USD)Main X-listings: AIGS IM (EUR) LGRA LN ETFS Leveraged Grains DJ-UBSCI 1 0.0 0.78 - 0.98 - NHOGS LN ETFS Lean Hogs 8 0.0 0.63 - 0.49 0.32 N Main X-listings: 4RTV GY (EUR)Main X-listings: HOGS IM (EUR) SLCT LN ETFS Short Live Cattle 0 0.0 0.38 - 0.98 - NAIGL LN ETFS Livestock DJ-UBSCI 8 0.2 0.21 - 0.49 0.31 N Main X-listings: 4RTC GY (EUR)Main X-listings: AIGL IM (EUR) SCOC LN ETFS Short Cocoa 0 0.0 0.96 - 0.98 - NSDRA LN iShares S&P GSCI Agri Sw ap 8 0.0 0.79 - 0.45 6.10 N Main X-listings: 4RTQ GY (EUR)Main X-listings: IDRA LN (USD) SLHO LN ETFS Short Lean Hogs 0 0.0 0.37 - 0.98 - NCAUSIS SW UBS CMCI Agri USD I 8 0.0 0.77 - 1.22 - N Main X-listings: 4RTB GR (EUR)9J6L GY RBS RICI Enhanced Grains ETC 7 0.0 0.84 - - 3.00 N SGRAIN GY Source S&P GSCI Grains T-Bill 0 0.0 1.02 - 0.49 2.94 NCOCO LN ETFS Cocoa 7 0.1 1.05 - 0.49 0.13 N Main X-listings: SGRAIN SW (USD)Main X-listings: COCO IM (EUR) LLCT LN ETFS Leveraged Live Cattle 0 0.0 0.80 - 0.98 - NLCOC LN ETFS Leveraged Cocoa 6 0.1 1.02 - 0.98 - N Main X-listings: 4RUB GY (EUR)Main X-listings: 4RUP GY (EUR) SAGR LN ETFS Short Agriculture DJ-UBSCI 0 0.0 0.51 - 0.98 - NLYP2 GY Lyxor GSCI Agri & Livestock 3 mnth Forw ard 6 - - - 0.25 1.58 N Main X-listings: 9GAS GY (EUR)AGRL LN Lyxor GSCI Agri & Livestock 3 mnth Forw ard 6 - 0.71 - 0.35 0.01 N LSFT LN ETFS Leveraged Softs DJ-UBSCI 0 0.0 1.58 - 0.98 - NMain X-listings: AGLG LN (GBp) Main X-listings: 4RT0 GY (EUR)SSUG LN ETFS Short Sugar 6 0.1 0.80 - 0.98 - N LSYO LN ETFS Leveraged Soybean Oil 0 0.0 0.68 - 0.98 - NMain X-listings: 4RTJ GY (EUR) Main X-listings: 4RUF GY (EUR)SFARM GY Source S&P GSCI Agri T-Bill S 6 0.0 0.73 - 0.49 2.26 N SSOFT GY Source S&P GSCI Softs T-Bill 0 0.0 0.93 - 0.49 0.27 NMain X-listings: SFARM SW (USD) LLST LN ETFS Leveraged Livestk DJ-UBSCI 0 0.0 0.59 - 0.98 - NLAGA LN ETFS Lev Agriculture DJ-UBSCI 5 0.0 0.97 - 0.98 - N Main X-listings: 4RTX GY (EUR)Main X-listings: LAGR IM (EUR) SSYO LN ETFS Short Soybean Oil 0 0.0 0.40 - 0.98 - NSEED LN iPath S&P GSCI Grains TR ETN 5 0.0 - - 0.75 0.00 N Main X-listings: 4RTG GY (EUR)Main X-listings: SEED GY (EUR) SGRA LN ETFS Short Grains DJ-UBSCI 0 0.0 0.54 - 0.98 - NAGGS LN iPath S&P GSCI Agri TR ETN 5 0.0 1.31 - 0.75 0.00 N Main X-listings: 9GAW GY (EUR)Main X-listings: AGGS GY (EUR) FLIV LN ETFS Fw d Livestk DJ-UBSCI-F3SM 0 0.0 0.44 - 0.49 0.44 NCATL LN ETFS Live Cattle 5 0.0 0.21 - 0.49 0.32 N Main X-listings: 9GAN GY (EUR)Main X-listings: CATL IM (EUR) SLST LN ETFS Short Livestock DJ-UBSCI 0 0.0 0.48 - 0.98 - NSGSCI GY Source S&P GSCI T-Bill Sec 4 0.0 2.73 - 0.49 1.51 N Main X-listings: 9GAY GY (EUR)Main X-listings: SGSCI SW (USD) SSFT LN ETFS Short Softs DJ-UBSCI 0 0.0 0.57 - 0.98 - NSOFT LN iPath S&P GSCI Softs ETN 4 0.0 - - 0.75 0.01 N Main X-listings: SSFT IM (EUR)Main X-listings: SOFT GY (EUR) CATF LN ETFS Forw ard Live Cattle 0 0.0 1.05 - 0.49 0.02 NSWEA LN ETFS Short Wheat 4 0.2 0.38 - 0.98 - N 00XJ GR ETFS Eur Hedged Agriculture 0 0.0 0.80 - 0.49 0.03 NMain X-listings: 4RTK GY (EUR) HOGF LN ETFS Forw ard Lean Hogs 0 0.0 0.73 - 0.49 0.94 N
Main X-listings: HOGF IM (EUR)
Commodity Commodity
1 Option Liquidity (H / M / L / N - High / Medium / Low / None)2 / - Significant increase / decrease in shares outstanding in last one year
EMEA Listed ETFs
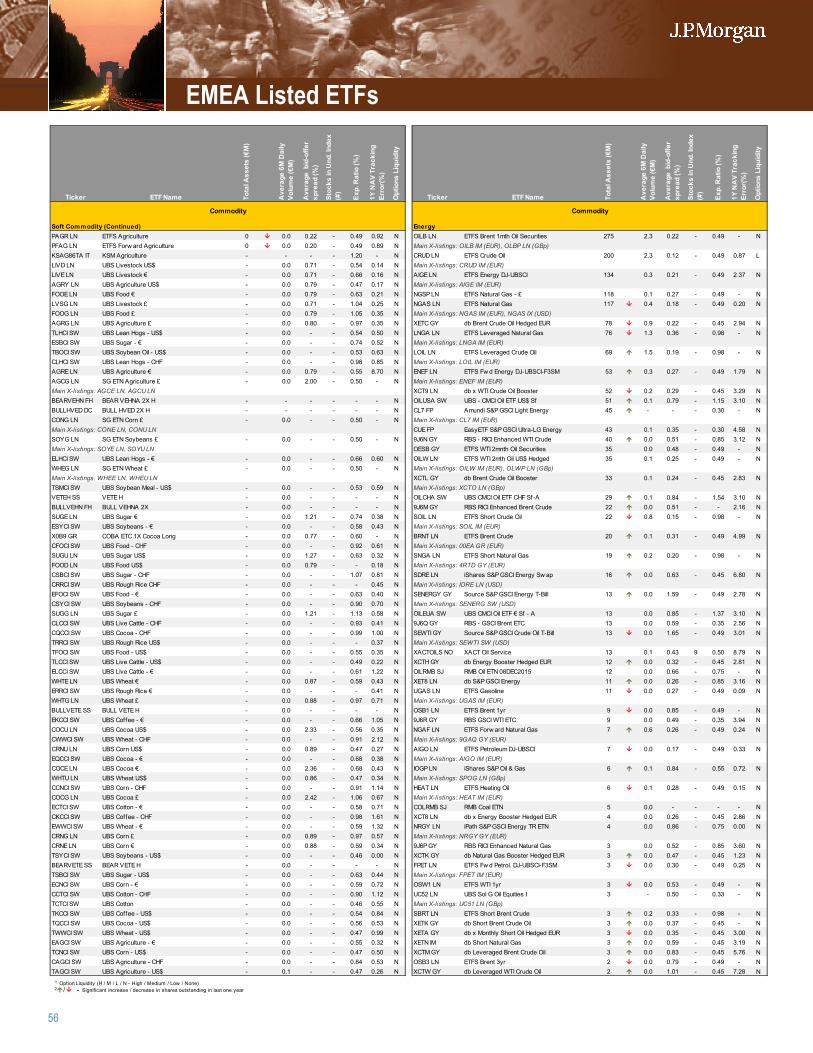
56
Ticker ETF Name Tota
l Ass
ets
(€M
)
Ave
rage
6M
Dai
ly
Volu
me
(€M
)
Ave
rage
bid
-offe
r sp
read
(%)
Stoc
ks in
Und
. Ind
ex
(#)
Exp.
Rat
io (%
)
1Y N
AV
Trac
king
Er
ror(
%)
Opt
ions
Liq
uidi
ty
Ticker ETF Name Tota
l Ass
ets
(€M
)
Ave
rage
6M
Dai
ly
Volu
me
(€M
)
Ave
rage
bid
-offe
r sp
read
(%)
Stoc
ks in
Und
. Ind
ex
(#)
Exp.
Rat
io (%
)
1Y N
AV
Trac
king
Er
ror(
%)
Opt
ions
Liq
uidi
ty
Soft Commodity (Continued) EnergyPAGR LN ETFS Agriculture 0 0.0 0.22 - 0.49 0.92 N OILB LN ETFS Brent 1mth Oil Securities 275 2.3 0.22 - 0.49 - NPFAG LN ETFS Forw ard Agriculture 0 0.0 0.20 - 0.49 0.89 N Main X-listings: OILB IM (EUR), OLBP LN (GBp)KSAG86TA IT KSM Agriculture - - - - 1.20 - N CRUD LN ETFS Crude Oil 200 2.3 0.12 - 0.49 0.87 LLIVD LN UBS Livestock US$ - 0.0 0.71 - 0.54 0.14 N Main X-listings: CRUD IM (EUR)LIVE LN UBS Livestock € - 0.0 0.71 - 0.66 0.16 N AIGE LN ETFS Energy DJ-UBSCI 134 0.3 0.21 - 0.49 2.37 NAGRY LN UBS Agriculture US$ - 0.0 0.79 - 0.47 0.17 N Main X-listings: AIGE IM (EUR)FOOE LN UBS Food € - 0.0 0.79 - 0.63 0.21 N NGSP LN ETFS Natural Gas - £ 118 0.1 0.27 - 0.49 - NLVSG LN UBS Livestock £ - 0.0 0.71 - 1.04 0.25 N NGAS LN ETFS Natural Gas 117 0.4 0.18 - 0.49 0.20 NFOOG LN UBS Food £ - 0.0 0.79 - 1.05 0.35 N Main X-listings: NGAS IM (EUR), NGAS IX (USD)AGRG LN UBS Agriculture £ - 0.0 0.80 - 0.97 0.35 N XETC GY db Brent Crude Oil Hedged EUR 78 0.9 0.22 - 0.45 2.94 NTLHCI SW UBS Lean Hogs - US$ - 0.0 - - 0.54 0.50 N LNGA LN ETFS Leveraged Natural Gas 76 1.3 0.36 - 0.98 - NESBCI SW UBS Sugar - € - 0.0 - - 0.74 0.52 N Main X-listings: LNGA IM (EUR)TBOCI SW UBS Soybean Oil - US$ - 0.0 - - 0.53 0.63 N LOIL LN ETFS Leveraged Crude Oil 69 1.5 0.19 - 0.98 - NCLHCI SW UBS Lean Hogs - CHF - 0.0 - - 0.98 0.85 N Main X-listings: LOIL IM (EUR)AGRE LN UBS Agriculture € - 0.0 0.79 - 0.55 8.70 N ENEF LN ETFS Fw d Energy DJ-UBSCI-F3SM 53 0.3 0.27 - 0.49 1.79 NAGCG LN SG ETN Agriculture £ - 0.0 2.00 - 0.50 - N Main X-listings: ENEF IM (EUR)Main X-listings: AGCE LN, AGCU LN XCT9 LN db x WTI Crude Oil Booster 52 0.2 0.29 - 0.45 3.29 NBEARVEHN FH BEAR VEHNA 2X H - - - - - - N OILUSA SW UBS - CMCI Oil ETF US$ Sf 51 0.1 0.79 - 1.15 3.10 NBULLHVED DC BULL HVED 2X H - - - - - - N CL7 FP Amundi S&P GSCI Light Energy 45 - - - 0.30 - NCONG LN SG ETN Corn £ - 0.0 - - 0.50 - N Main X-listings: CL7 IM (EUR)Main X-listings: CONE LN, CONU LN CUE FP EasyETF S&P GSCI Ultra-LG Energy 43 0.1 0.35 - 0.30 4.58 NSOYG LN SG ETN Soybeans £ - 0.0 - - 0.50 - N 9J6N GY RBS - RICI Enhanced WTI Crude 40 0.0 0.51 - 0.85 3.12 NMain X-listings: SOYE LN, SOYU LN OESB GY ETFS WTI 2mnth Oil Securities 35 0.0 0.48 - 0.49 - NELHCI SW UBS Lean Hogs - € - 0.0 - - 0.66 0.60 N OILW LN ETFS WTI 2mth Oil US$ Hedged 35 0.1 0.25 - 0.49 - NWHEG LN SG ETN Wheat £ - 0.0 - - 0.50 - N Main X-listings: OILW IM (EUR), OLWP LN (GBp)Main X-listings: WHEE LN, WHEU LN XCTL GY db Brent Crude Oil Booster 33 0.1 0.24 - 0.45 2.83 NTSMCI SW UBS Soybean Meal - US$ - 0.0 - - 0.53 0.59 N Main X-listings: XCTO LN (GBp)VETEH SS VETE H - 0.0 - - - - N OILCHA SW UBS CMCI Oil ETF CHF Sf-A 29 0.1 0.84 - 1.54 3.10 NBULLVEHN FH BULL VEHNA 2X - 0.0 - - - - N 9J6M GY RBS RICI Enhanced Brent Crude 22 0.0 0.51 - - 2.16 NSUGE LN UBS Sugar € - 0.0 1.21 - 0.74 0.38 N SOIL LN ETFS Short Crude Oil 22 0.8 0.15 - 0.98 - NESYCI SW UBS Soybeans - € - 0.0 - - 0.58 0.43 N Main X-listings: SOIL IM (EUR)X0B9 GR COBA ETC 1X Cocoa Long - 0.0 0.77 - 0.60 - N BRNT LN ETFS Brent Crude 20 0.1 0.31 - 0.49 4.99 NCFOCI SW UBS Food - CHF - 0.0 - - 0.92 0.61 N Main X-listings: 00EA GR (EUR)SUGU LN UBS Sugar US$ - 0.0 1.27 - 0.63 0.32 N SNGA LN ETFS Short Natural Gas 19 0.2 0.20 - 0.98 - NFOOD LN UBS Food US$ - 0.0 0.79 - - 0.18 N Main X-listings: 4RTD GY (EUR)CSBCI SW UBS Sugar - CHF - 0.0 - - 1.07 0.81 N SDRE LN iShares S&P GSCI Energy Sw ap 16 0.0 0.63 - 0.45 6.80 NCRRCI SW UBS Rough Rice CHF - 0.0 - - - 0.45 N Main X-listings: IDRE LN (USD)EFOCI SW UBS Food - € - 0.0 - - 0.63 0.40 N SENERGY GY Source S&P GSCI Energy T-Bill 13 0.0 1.59 - 0.49 2.78 NCSYCI SW UBS Soybeans - CHF - 0.0 - - 0.90 0.70 N Main X-listings: SENERG SW (USD)SUGG LN UBS Sugar £ - 0.0 1.21 - 1.13 0.58 N OILEUA SW UBS CMCI Oil ETF € Sf - A 13 0.0 0.85 - 1.37 3.10 NCLCCI SW UBS Live Cattle - CHF - 0.0 - - 0.93 0.41 N 9J6Q GY RBS - GSCI Brent ETC 13 0.0 0.59 - 0.35 2.56 NCQCCI SW UBS Cocoa - CHF - 0.0 - - 0.99 1.00 N SEWTI GY Source S&P GSCI Crude Oil T-Bill 13 0.0 1.65 - 0.49 3.01 NTRRCI SW UBS Rough Rice US$ - 0.0 - - - 0.37 N Main X-listings: SEWTI SW (USD)TFOCI SW UBS Food - US$ - 0.0 - - 0.55 0.35 N XACTOILS NO XACT Oil Service 13 0.1 0.43 9 0.50 8.79 NTLCCI SW UBS Live Cattle - US$ - 0.0 - - 0.49 0.22 N XCTH GY db Energy Booster Hedged EUR 12 0.0 0.32 - 0.45 2.81 NELCCI SW UBS Live Cattle - € - 0.0 - - 0.61 1.22 N OILRMB SJ RMB Oil ETN 08DEC2015 12 0.0 0.66 - 0.75 - NWHTE LN UBS Wheat € - 0.0 0.87 - 0.59 0.43 N XET8 LN db S&P GSCI Energy 11 0.0 0.26 - 0.85 3.16 NERRCI SW UBS Rough Rice € - 0.0 - - - 0.41 N UGAS LN ETFS Gasoline 11 0.0 0.27 - 0.49 0.09 NWHTG LN UBS Wheat £ - 0.0 0.88 - 0.97 0.71 N Main X-listings: UGAS IM (EUR)BULLVETE SS BULL VETE H - 0.0 - - - - N OSB1 LN ETFS Brent 1yr 9 0.0 0.85 - 0.49 - NEKCCI SW UBS Coffee - € - 0.0 - - 0.66 1.05 N 9J6R GY RBS GSCI WTI ETC 9 0.0 0.49 - 0.35 3.94 NCOCU LN UBS Cocoa US$ - 0.0 2.33 - 0.56 0.35 N NGAF LN ETFS Forw ard Natural Gas 7 0.6 0.26 - 0.49 0.24 NCWWCI SW UBS Wheat - CHF - 0.0 - - 0.91 2.12 N Main X-listings: 9GAQ GY (EUR)CRNU LN UBS Corn US$ - 0.0 0.89 - 0.47 0.27 N AIGO LN ETFS Petroleum DJ-UBSCI 7 0.0 0.17 - 0.49 0.33 NEQCCI SW UBS Cocoa - € - 0.0 - - 0.68 0.38 N Main X-listings: AIGO IM (EUR)COCE LN UBS Cocoa € - 0.0 2.36 - 0.68 0.43 N IOGP LN iShares S&P Oil & Gas 6 0.1 0.84 - 0.55 0.72 NWHTU LN UBS Wheat US$ - 0.0 0.86 - 0.47 0.34 N Main X-listings: SPOG LN (GBp)CCNCI SW UBS Corn - CHF - 0.0 - - 0.91 1.14 N HEAT LN ETFS Heating Oil 6 0.1 0.28 - 0.49 0.15 NCOCG LN UBS Cocoa £ - 0.0 2.42 - 1.06 0.67 N Main X-listings: HEAT IM (EUR)ECTCI SW UBS Cotton - € - 0.0 - - 0.58 0.71 N COLRMB SJ RMB Coal ETN 5 0.0 - - - - NCKCCI SW UBS Coffee - CHF - 0.0 - - 0.98 1.61 N XCT8 LN db x Energy Booster Hedged EUR 4 0.0 0.26 - 0.45 2.86 NEWWCI SW UBS Wheat - € - 0.0 - - 0.59 1.32 N NRGY LN iPath S&P GSCI Energy TR ETN 4 0.0 0.86 - 0.75 0.00 NCRNG LN UBS Corn £ - 0.0 0.89 - 0.97 0.57 N Main X-listings: NRGY GY (EUR)CRNE LN UBS Corn € - 0.0 0.88 - 0.59 0.34 N 9J6P GY RBS RICI Enhanced Natural Gas 3 0.0 0.52 - 0.85 3.60 NTSYCI SW UBS Soybeans - US$ - 0.0 - - 0.46 0.00 N XCTK GY db Natural Gas Booster Hedged EUR 3 0.0 0.47 - 0.45 1.23 NBEARVETE SS BEAR VETE H - 0.0 - - - - N FPET LN ETFS Fw d Petrol. DJ-UBSCI-F3SM 3 0.0 0.30 - 0.49 0.25 NTSBCI SW UBS Sugar - US$ - 0.0 - - 0.63 0.44 N Main X-listings: FPET IM (EUR)ECNCI SW UBS Corn - € - 0.0 - - 0.59 0.72 N OSW1 LN ETFS WTI 1yr 3 0.0 0.53 - 0.49 - NCCTCI SW UBS Cotton - CHF - 0.0 - - 0.90 1.12 N UC52 LN UBS Sol G Oil Equities I 3 - 0.50 - 0.33 - NTCTCI SW UBS Cotton - 0.0 - - 0.46 0.55 N Main X-listings: UC51 LN (GBp)TKCCI SW UBS Coffee - US$ - 0.0 - - 0.54 0.84 N SBRT LN ETFS Short Brent Crude 3 0.2 0.33 - 0.98 - NTQCCI SW UBS Cocoa - US$ - 0.0 - - 0.56 0.53 N XETK GY db Short Brent Crude Oil 3 0.0 0.37 - 0.45 - NTWWCI SW UBS Wheat - US$ - 0.0 - - 0.47 0.99 N XETA GY db x Monthly Short Oil Hedged EUR 3 0.0 0.35 - 0.45 3.00 NEAGCI SW UBS Agriculture - € - 0.0 - - 0.55 0.32 N XETN IM db Short Natural Gas 3 0.0 0.59 - 0.45 3.19 NTCNCI SW UBS Corn - US$ - 0.0 - - 0.47 0.50 N XCTM GY db Leveraged Brent Crude Oil 3 0.0 0.83 - 0.45 5.76 NCAGCI SW UBS Agriculture - CHF - 0.0 - - 0.84 0.53 N OSB3 LN ETFS Brent 3yr 2 0.0 0.79 - 0.49 - NTAGCI SW UBS Agriculture - US$ - 0.1 - - 0.47 0.26 N XCTW GY db Leveraged WTI Crude Oil 2 0.0 1.01 - 0.45 7.28 N
Commodity Commodity
1 Option Liquidity (H / M / L / N - High / Medium / Low / None)2 / - Significant increase / decrease in shares outstanding in last one year
EMEA Listed ETFs
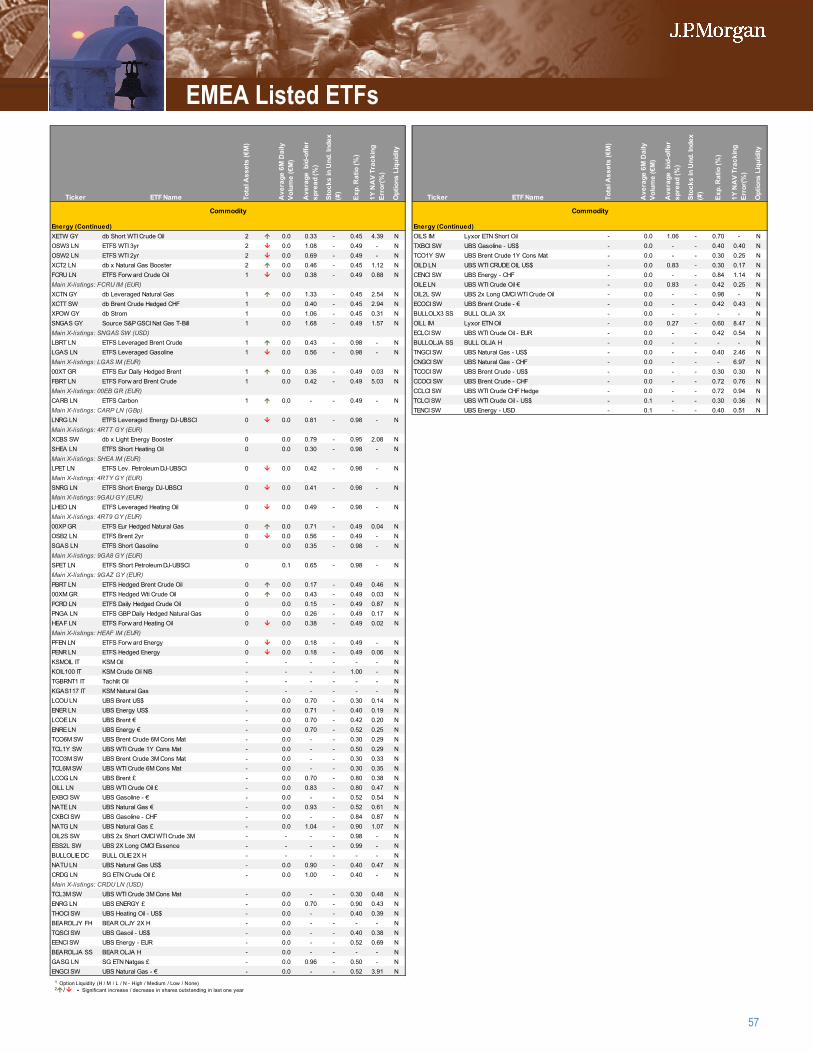
57
Ticker ETF Name Tota
l Ass
ets
(€M
)
Ave
rage
6M
Dai
ly
Volu
me
(€M
)
Ave
rage
bid
-offe
r sp
read
(%)
Stoc
ks in
Und
. Ind
ex
(#)
Exp.
Rat
io (%
)
1Y N
AV
Trac
king
Er
ror(
%)
Opt
ions
Liq
uidi
ty
Ticker ETF Name Tota
l Ass
ets
(€M
)
Ave
rage
6M
Dai
ly
Volu
me
(€M
)
Ave
rage
bid
-offe
r sp
read
(%)
Stoc
ks in
Und
. Ind
ex
(#)
Exp.
Rat
io (%
)
1Y N
AV
Trac
king
Er
ror(
%)
Opt
ions
Liq
uidi
ty
Energy (Continued) Energy (Continued)XETW GY db Short WTI Crude Oil 2 0.0 0.33 - 0.45 4.39 N OILS IM Lyxor ETN Short Oil - 0.0 1.06 - 0.70 - NOSW3 LN ETFS WTI 3yr 2 0.0 1.08 - 0.49 - N TXBCI SW UBS Gasoline - US$ - 0.0 - - 0.40 0.40 NOSW2 LN ETFS WTI 2yr 2 0.0 0.69 - 0.49 - N TCO1Y SW UBS Brent Crude 1Y Cons Mat - 0.0 - - 0.30 0.25 NXCT2 LN db x Natural Gas Booster 2 0.0 0.46 - 0.45 1.12 N OILD LN UBS WTI CRUDE OIL US$ - 0.0 0.83 - 0.30 0.17 NFCRU LN ETFS Forw ard Crude Oil 1 0.0 0.38 - 0.49 0.88 N CENCI SW UBS Energy - CHF - 0.0 - - 0.84 1.14 NMain X-listings: FCRU IM (EUR) OILE LN UBS WTI Crude Oil € - 0.0 0.83 - 0.42 0.25 NXCTN GY db Leveraged Natural Gas 1 0.0 1.33 - 0.45 2.54 N OIL2L SW UBS 2x Long CMCI WTI Crude Oil - 0.0 - - 0.98 - NXCTT SW db Brent Crude Hedged CHF 1 0.0 0.40 - 0.45 2.94 N ECOCI SW UBS Brent Crude - € - 0.0 - - 0.42 0.43 NXPOW GY db Strom 1 0.0 1.06 - 0.45 0.31 N BULLOLX3 SS BULL OLJA 3X - 0.0 - - - - NSNGAS GY Source S&P GSCI Nat Gas T-Bill 1 0.0 1.68 - 0.49 1.57 N OILL IM Lyxor ETN Oil - 0.0 0.27 - 0.60 8.47 NMain X-listings: SNGAS SW (USD) ECLCI SW UBS WTI Crude Oil - EUR - 0.0 - - 0.42 0.54 NLBRT LN ETFS Leveraged Brent Crude 1 0.0 0.43 - 0.98 - N BULLOLJA SS BULL OLJA H - 0.0 - - - - NLGAS LN ETFS Leveraged Gasoline 1 0.0 0.56 - 0.98 - N TNGCI SW UBS Natural Gas - US$ - 0.0 - - 0.40 2.46 NMain X-listings: LGAS IM (EUR) CNGCI SW UBS Natural Gas - CHF - 0.0 - - - 6.97 N00XT GR ETFS Eur Daily Hedged Brent 1 0.0 0.36 - 0.49 0.03 N TCOCI SW UBS Brent Crude - US$ - 0.0 - - 0.30 0.30 NFBRT LN ETFS Forw ard Brent Crude 1 0.0 0.42 - 0.49 5.03 N CCOCI SW UBS Brent Crude - CHF - 0.0 - - 0.72 0.76 NMain X-listings: 00EB GR (EUR) CCLCI SW UBS WTI Crude CHF Hedge - 0.0 - - 0.72 0.94 NCARB LN ETFS Carbon 1 0.0 - - 0.49 - N TCLCI SW UBS WTI Crude Oil - US$ - 0.1 - - 0.30 0.36 NMain X-listings: CARP LN (GBp) TENCI SW UBS Energy - USD - 0.1 - - 0.40 0.51 NLNRG LN ETFS Leveraged Energy DJ-UBSCI 0 0.0 0.81 - 0.98 - NMain X-listings: 4RTT GY (EUR)XCBS SW db x Light Energy Booster 0 0.0 0.79 - 0.95 2.08 NSHEA LN ETFS Short Heating Oil 0 0.0 0.30 - 0.98 - NMain X-listings: SHEA IM (EUR)LPET LN ETFS Lev. Petroleum DJ-UBSCI 0 0.0 0.42 - 0.98 - NMain X-listings: 4RTY GY (EUR)SNRG LN ETFS Short Energy DJ-UBSCI 0 0.0 0.41 - 0.98 - NMain X-listings: 9GAU GY (EUR)LHEO LN ETFS Leveraged Heating Oil 0 0.0 0.49 - 0.98 - NMain X-listings: 4RT9 GY (EUR)00XP GR ETFS Eur Hedged Natural Gas 0 0.0 0.71 - 0.49 0.04 NOSB2 LN ETFS Brent 2yr 0 0.0 0.56 - 0.49 - NSGAS LN ETFS Short Gasoline 0 0.0 0.35 - 0.98 - NMain X-listings: 9GA8 GY (EUR)SPET LN ETFS Short Petroleum DJ-UBSCI 0 0.1 0.65 - 0.98 - NMain X-listings: 9GAZ GY (EUR)PBRT LN ETFS Hedged Brent Crude Oil 0 0.0 0.17 - 0.49 0.46 N00XM GR ETFS Hedged Wti Crude Oil 0 0.0 0.43 - 0.49 0.03 NPCRD LN ETFS Daily Hedged Crude Oil 0 0.0 0.15 - 0.49 0.87 NPNGA LN ETFS GBP Daily Hedged Natural Gas 0 0.0 0.26 - 0.49 0.17 NHEAF LN ETFS Forw ard Heating Oil 0 0.0 0.38 - 0.49 0.02 NMain X-listings: HEAF IM (EUR)PFEN LN ETFS Forw ard Energy 0 0.0 0.18 - 0.49 - NPENR LN ETFS Hedged Energy 0 0.0 0.18 - 0.49 0.06 NKSMOIL IT KSM Oil - - - - - - NKOIL100 IT KSM Crude Oil NIS - - - - 1.00 - NTGBRNT1 IT Tachlit Oil - - - - - - NKGAS117 IT KSM Natural Gas - - - - - - NLCOU LN UBS Brent US$ - 0.0 0.70 - 0.30 0.14 NENER LN UBS Energy US$ - 0.0 0.71 - 0.40 0.19 NLCOE LN UBS Brent € - 0.0 0.70 - 0.42 0.20 NENRE LN UBS Energy € - 0.0 0.70 - 0.52 0.25 NTCO6M SW UBS Brent Crude 6M Cons Mat - 0.0 - - 0.30 0.29 NTCL1Y SW UBS WTI Crude 1Y Cons Mat - 0.0 - - 0.50 0.29 NTCO3M SW UBS Brent Crude 3M Cons Mat - 0.0 - - 0.30 0.33 NTCL6M SW UBS WTI Crude 6M Cons Mat - 0.0 - - 0.30 0.35 NLCOG LN UBS Brent £ - 0.0 0.70 - 0.80 0.38 NOILL LN UBS WTI Crude Oil £ - 0.0 0.83 - 0.80 0.47 NEXBCI SW UBS Gasoline - € - 0.0 - - 0.52 0.54 NNATE LN UBS Natural Gas € - 0.0 0.93 - 0.52 0.61 NCXBCI SW UBS Gasoline - CHF - 0.0 - - 0.84 0.87 NNATG LN UBS Natural Gas £ - 0.0 1.04 - 0.90 1.07 NOIL2S SW UBS 2x Short CMCI WTI Crude 3M - - - - 0.98 - NESS2L SW UBS 2X Long CMCI Essence - - - - 0.99 - NBULLOLIE DC BULL OLIE 2X H - - - - - - NNATU LN UBS Natural Gas US$ - 0.0 0.90 - 0.40 0.47 NCRDG LN SG ETN Crude Oil £ - 0.0 1.00 - 0.40 - NMain X-listings: CRDU LN (USD)TCL3M SW UBS WTI Crude 3M Cons Mat - 0.0 - - 0.30 0.48 NENRG LN UBS ENERGY £ - 0.0 0.70 - 0.90 0.43 NTHOCI SW UBS Heating Oil - US$ - 0.0 - - 0.40 0.39 NBEAROLJY FH BEAR OLJY 2X H - 0.0 - - - - NTQSCI SW UBS Gasoil - US$ - 0.0 - - 0.40 0.38 NEENCI SW UBS Energy - EUR - 0.0 - - 0.52 0.69 NBEAROLJA SS BEAR OLJA H - 0.0 - - - - NGASG LN SG ETN Natgas £ - 0.0 0.96 - 0.50 - NENGCI SW UBS Natural Gas - € - 0.0 - - 0.52 3.91 N
Commodity Commodity
1 Option Liquidity (H / M / L / N - High / Medium / Low / None)2 / - Significant increase / decrease in shares outstanding in last one year
EMEA Listed ETFs
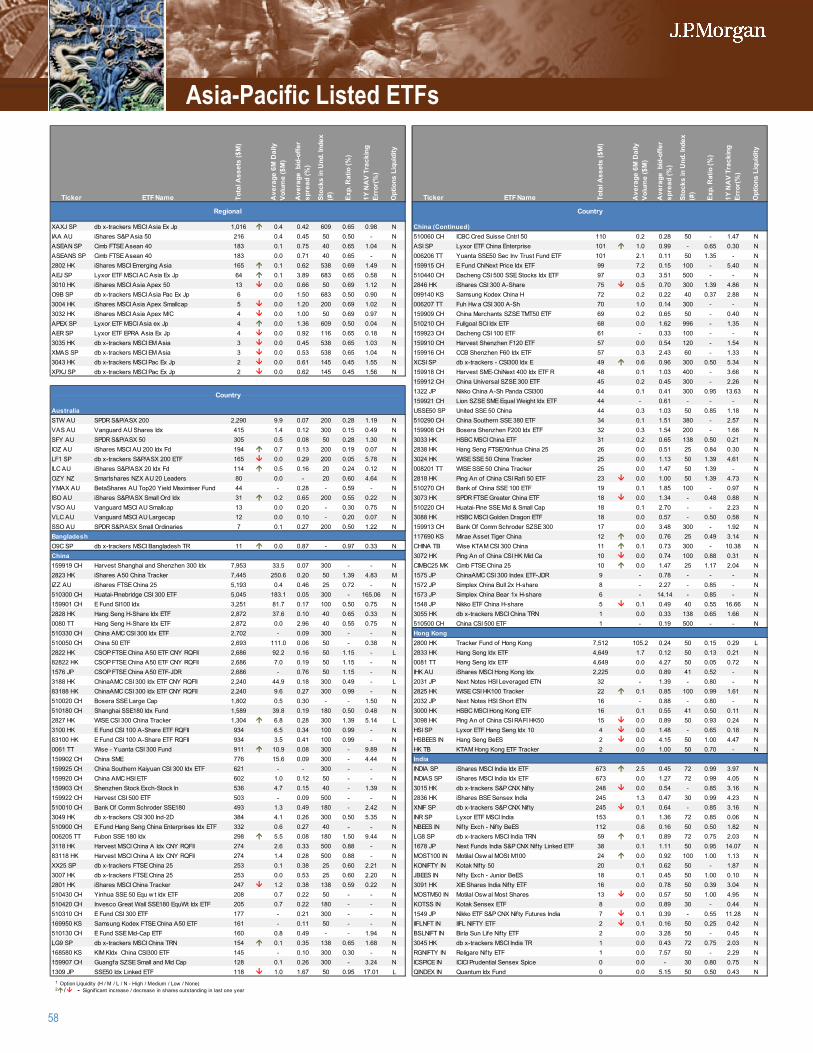
58
Ticker ETF Name Tota
l Ass
ets
($M
)
Ave
rage
6M
Dai
ly
Volu
me
($M
)
Ave
rage
bid
-offe
r sp
read
(%)
Stoc
ks in
Und
. Ind
ex
(#)
Exp.
Rat
io (%
)
1Y N
AV
Trac
king
Er
ror(
%)
Opt
ions
Liq
uidi
ty
Ticker ETF Name Tota
l Ass
ets
($M
)
Ave
rage
6M
Dai
ly
Volu
me
($M
)
Ave
rage
bid
-offe
r sp
read
(%)
Stoc
ks in
Und
. Ind
ex
(#)
Exp.
Rat
io (%
)
1Y N
AV
Trac
king
Er
ror(
%)
Opt
ions
Liq
uidi
ty
1
2
XAXJ SP db x-trackers MSCI Asia Ex Jp 1,016 0.4 0.42 609 0.65 0.98 N 3 China (Continued)IAA AU iShares S&P Asia 50 216 0.4 0.45 50 0.50 - N 4 510060 CH ICBC Cred Suisse Cntrl 50 110 0.2 0.28 50 - 1.47 NASEAN SP Cimb FTSE Asean 40 183 0.1 0.75 40 0.65 1.04 N 5 ASI SP Lyxor ETF China Enterprise 101 1.0 0.99 - 0.65 0.30 NASEANS SP Cimb FTSE Asean 40 183 0.0 0.71 40 0.65 - N 6 006206 TT Yuanta SSE50 Sec Inv Trust Fund ETF 101 2.1 0.11 50 1.35 - N2802 HK iShares MSCI Emerging Asia 165 0.1 0.62 538 0.69 1.49 N 7 159915 CH E Fund ChiNext Price Idx ETF 99 7.2 0.15 100 - 5.40 NAEJ SP Lyxor ETF MSCI AC Asia Ex Jp 64 0.1 3.89 683 0.65 0.58 N 8 510440 CH Dacheng CSI 500 SSE Stocks Idx ETF 97 0.3 3.51 500 - - N3010 HK iShares MSCI Asia Apex 50 13 0.0 0.66 50 0.69 1.12 N 9 2846 HK iShares CSI 300 A-Share 75 0.5 0.70 300 1.39 4.86 NO9B SP db x-trackers MSCI Asia Pac Ex Jp 6 0.0 1.50 683 0.50 0.90 N # 099140 KS Samsung Kodex China H 72 0.2 0.22 40 0.37 2.88 N3004 HK iShares MSCI Asia Apex Smallcap 5 0.0 1.20 200 0.69 1.02 N 11 006207 TT Fuh Hw a CSI 300 A-Sh 70 1.0 0.14 300 - - N3032 HK iShares MSCI Asia Apex M/C 4 0.0 1.00 50 0.69 0.97 N # 159909 CH China Merchants SZSE TMT50 ETF 69 0.2 0.65 50 - 0.40 NAPEX SP Lyxor ETF MSCI Asia ex Jp 4 0.0 1.36 609 0.50 0.04 N # 510210 CH Fullgoal SCI Idx ETF 68 0.0 1.62 996 - 1.35 NAER SP Lyxor ETF EPRA Asia Ex Jp 4 0.0 0.92 116 0.65 0.18 N # 159923 CH Dacheng CSI 100 ETF 61 - 0.33 100 - - N3035 HK db x-trackers MSCI EM Asia 3 0.0 0.45 538 0.65 1.03 N # 159910 CH Harvest Shenzhen F120 ETF 57 0.0 0.54 120 - 1.54 NXMAS SP db x-trackers MSCI EM Asia 3 0.0 0.53 538 0.65 1.04 N # 159916 CH CCB Shenzhen F60 Idx ETF 57 0.3 2.43 60 - 1.33 N3043 HK db x-trackers MSCI Pac Ex Jp 2 0.0 0.61 145 0.45 1.55 N # XCSI SP db x-trackers - CSI300 Idx E 49 0.6 0.96 300 0.50 5.34 NXPXJ SP db x-trackers MSCI Pac Ex Jp 2 0.0 0.62 145 0.45 1.56 N # 159918 CH Harvest SME-ChiNext 400 Idx ETF R 48 0.1 1.03 400 - 3.66 N
# 159912 CH China Universal SZSE 300 ETF 45 0.2 0.45 300 - 2.26 N# 1322 JP Nikko China A-Sh Panda CSI300 44 0.1 0.41 300 0.95 13.63 N# 159921 CH Lion SZSE SME Equal Weight Idx ETF 44 - 0.61 - - - N
Australia # USSE50 SP United SSE 50 China 44 0.3 1.03 50 0.85 1.18 NSTW AU SPDR S&P/ASX 200 2,290 9.9 0.07 200 0.28 1.19 N # 510290 CH China Southern SSE 380 ETF 34 0.1 1.51 380 - 2.57 NVAS AU Vanguard AU Shares Idx 415 1.4 0.12 300 0.15 0.49 N # 159908 CH Bosera Shenzhen F200 Idx ETF 32 0.3 1.54 200 - 1.66 NSFY AU SPDR S&P/ASX 50 305 0.5 0.08 50 0.28 1.30 N # 3033 HK HSBC MSCI China ETF 31 0.2 0.65 138 0.50 0.21 NIOZ AU iShares MSCI AU 200 Idx Fd 194 0.7 0.13 200 0.19 0.07 N # 2838 HK Hang Seng FTSE/Xinhua China 25 26 0.0 0.51 25 0.84 0.30 NLF1 SP db x-trackers S&P/ASX 200 ETF 165 0.0 0.29 200 0.05 5.78 N # 3024 HK WISE SSE 50 China Tracker 25 0.0 1.13 50 1.39 4.61 NILC AU iShares S&P/ASX 20 Idx Fd 114 0.5 0.16 20 0.24 0.12 N # 008201 TT WISE SSE 50 China Tracker 25 0.0 1.47 50 1.39 - NOZY NZ Smartshares NZX AU 20 Leaders 80 0.0 - 20 0.60 4.64 N # 2818 HK Ping An of China CSI Rafi 50 ETF 23 0.0 1.00 50 1.39 4.73 NYMAX AU BetaShares AU Top20 Yield Maximiser Fund 44 - 0.28 - 0.59 - N # 510270 CH Bank of China SSE 100 ETF 19 0.1 1.85 100 - 0.97 NISO AU iShares S&P/ASX Small Ord Idx 31 0.2 0.65 200 0.55 0.22 N # 3073 HK SPDR FTSE Greater China ETF 18 0.0 1.34 - 0.48 0.88 NVSO AU Vanguard MSCI AU Smallcap 13 0.0 0.20 - 0.30 0.75 N # 510220 CH Huatai-Pine SSE Mid & Small Cap 18 0.1 2.70 - - 2.23 NVLC AU Vanguard MSCI AU Largecap 12 0.0 0.10 - 0.20 0.07 N # 3088 HK HSBC MSCI Golden Dragon ETF 18 0.0 0.57 - 0.50 0.58 NSSO AU SPDR S&P/ASX Small Ordinaries 7 0.1 0.27 200 0.50 1.22 N # 159913 CH Bank Of Comm Schroder SZSE 300 17 0.0 3.48 300 - 1.92 NBangladesh # 117690 KS Mirae Asset Tiger China 12 0.0 0.76 25 0.49 3.14 NO9C SP db x-trackers MSCI Bangladesh TR 11 0.0 0.87 - 0.97 0.33 N # CHINA TB Wise KTAM CSI 300 China 11 0.1 0.73 300 - 10.38 NChina # 3072 HK Ping An of China CSI HK Mid Ca 10 0.0 0.74 100 0.88 0.31 N159919 CH Harvest Shanghai and Shenzhen 300 Idx 7,953 33.5 0.07 300 - - N # CIMBC25 MK Cimb FTSE China 25 10 0.0 1.47 25 1.17 2.04 N2823 HK iShares A50 China Tracker 7,445 250.6 0.20 50 1.39 4.83 M # 1575 JP ChinaAMC CSI 300 Index ETF-JDR 9 - 0.78 - - - NIZZ AU iShares FTSE China 25 5,193 0.4 0.46 25 0.72 - N # 1572 JP Simplex China Bull 2x H-share 8 - 2.27 - 0.85 - N510300 CH Huatai-Pinebridge CSI 300 ETF 5,045 183.1 0.05 300 - 165.06 N # 1573 JP Simplex China Bear 1x H-share 6 - 14.14 - 0.85 - N159901 CH E Fund SI100 Idx 3,251 81.7 0.17 100 0.50 0.75 N # 1548 JP Nikko ETF China H-share 5 0.1 0.49 40 0.55 16.66 N2828 HK Hang Seng H-Share Idx ETF 2,872 37.6 0.10 40 0.65 0.33 N # 3055 HK db x-trackers MSCI China TRN 1 0.0 0.33 138 0.65 1.66 N0080 TT Hang Seng H-Share Idx ETF 2,872 0.0 2.96 40 0.55 0.75 N # 510500 CH China CSI 500 ETF 1 - 0.19 500 - - N510330 CH China AMC CSI 300 Idx ETF 2,702 - 0.09 300 - - N # Hong Kong510050 CH China 50 ETF 2,693 111.0 0.06 50 - 0.38 N # 2800 HK Tracker Fund of Hong Kong 7,512 105.2 0.24 50 0.15 0.29 L2822 HK CSOP FTSE China A50 ETF CNY RQFII 2,686 92.2 0.16 50 1.15 - L # 2833 HK Hang Seng Idx ETF 4,649 1.7 0.12 50 0.13 0.21 N82822 HK CSOP FTSE China A50 ETF CNY RQFII 2,686 7.0 0.19 50 1.15 - N # 0081 TT Hang Seng Idx ETF 4,649 0.0 4.27 50 0.05 0.72 N1576 JP CSOP FTSE China A50 ETF-JDR 2,686 - 0.76 50 1.15 - N # IHK AU iShares MSCI Hong Kong Idx 2,225 0.0 0.89 41 0.52 - N3188 HK ChinaAMC CSI 300 Idx ETF CNY RQFII 2,240 44.9 0.18 300 0.49 - L # 2031 JP Next Notes HSI Leveraged ETN 32 - 1.39 - 0.80 - N83188 HK ChinaAMC CSI 300 Idx ETF CNY RQFII 2,240 9.6 0.27 300 0.99 - N # 2825 HK WISE CSI HK100 Tracker 22 0.1 0.85 100 0.99 1.61 N510020 CH Bosera SSE Large Cap 1,802 0.5 0.30 - - 1.50 N # 2032 JP Next Notes HSI Short ETN 16 - 0.88 - 0.80 - N510180 CH Shanghai SSE180 Idx Fund 1,589 39.8 0.19 180 0.50 0.48 N # 3000 HK HSBC MSCI Hong Kong ETF 16 0.1 0.55 41 0.50 0.11 N2827 HK WISE CSI 300 China Tracker 1,304 6.8 0.28 300 1.39 5.14 L # 3098 HK Ping An of China CSI RAFI HK50 15 0.0 0.89 50 0.93 0.24 N3100 HK E Fund CSI 100 A-Share ETF RQFII 934 6.5 0.34 100 0.99 - N # HSI SP Lyxor ETF Hang Seng Idx 10 4 0.0 1.48 - 0.65 0.18 N83100 HK E Fund CSI 100 A-Share ETF RQFII 934 3.5 0.41 100 0.99 - N # HSBEES IN Hang Seng BeES 2 0.0 4.15 50 1.00 4.47 N0061 TT Wise - Yuanta CSI 300 Fund 911 10.9 0.08 300 - 9.89 N # HK TB KTAM Hong Kong ETF Tracker 2 0.0 1.00 50 0.70 - N159902 CH China SME 776 15.6 0.09 300 - 4.44 N # India159925 CH China Southern Kaiyuan CSI 300 Idx ETF 621 - - 300 - - N # INDIA SP iShares MSCI India Idx ETF 673 2.5 0.45 72 0.99 3.97 N159920 CH China AMC HSI ETF 602 1.0 0.12 50 - - N # INDIAS SP iShares MSCI India Idx ETF 673 0.0 1.27 72 0.99 4.05 N159903 CH Shenzhen Stock Exch-Stock In 536 4.7 0.15 40 - 1.39 N # 3015 HK db x-trackers S&P CNX Nifty 248 0.0 0.54 - 0.85 3.16 N159922 CH Harvest CSI 500 ETF 503 - 0.09 500 - - N # 2836 HK iShares BSE Sensex India 245 1.3 0.47 30 0.99 4.23 N510010 CH Bank Of Comm Schroder SSE180 493 1.3 0.49 180 - 2.42 N # XNIF SP db x-trackers S&P CNX Nifty 245 0.1 0.64 - 0.85 3.16 N3049 HK db x-trackers CSI 300 Ind-2D 384 4.1 0.26 300 0.50 5.35 N # INR SP Lyxor ETF MSCI India 153 0.1 1.36 72 0.85 0.06 N510900 CH E Fund Hang Seng China Enterprises Idx ETF 332 0.6 0.27 40 - - N # NBEES IN Nifty Exch - Nifty BeES 112 0.6 0.16 50 0.50 1.82 N006205 TT Fubon SSE 180 Idx 298 5.5 0.08 180 1.50 9.44 N # LG8 SP db x-trackers MSCI India TRN 59 0.1 0.89 72 0.75 2.03 N3118 HK Harvest MSCI China A Idx CNY RQFII 274 2.6 0.33 500 0.88 - N # 1678 JP Next Funds India S&P CNX Nifty Linked ETF 38 0.1 1.11 50 0.95 14.07 N83118 HK Harvest MSCI China A Idx CNY RQFII 274 1.4 0.28 500 0.88 - N # MOST100 IN Motilal Osw al MOSt M100 24 0.0 0.92 100 1.00 1.13 NXX25 SP db x-trackers FTSE China 25 253 0.1 0.38 25 0.60 2.21 N # KONIFTY IN Kotak Nifty 50 20 0.1 0.62 50 - 1.87 N3007 HK db x-trackers FTSE China 25 253 0.0 0.53 25 0.60 2.20 N # JBEES IN Nifty Exch - Junior BeES 18 0.1 0.45 50 1.00 0.10 N2801 HK iShares MSCI China Tracker 247 1.2 0.38 138 0.59 0.22 N # 3091 HK XIE Shares India Nifty ETF 16 0.0 0.78 50 0.39 3.04 N510430 CH Yinhua SSE 50 Equ w t Idx ETF 208 0.7 0.22 50 - - N # MOSTM50 IN Motilal Osw al Most Shares 13 0.0 0.57 50 1.00 4.95 N510420 CH Invesco Great Wall SSE180 EquWt Idx ETF 205 0.7 0.22 180 - - N # KOTSS IN Kotak Sensex ETF 8 0.0 0.89 30 - 0.44 N510310 CH E Fund CSI 300 ETF 177 - 0.21 300 - - N # 1549 JP Nikko ETF S&P CNX Nifty Futures India 7 0.1 0.39 - 0.55 11.28 N169950 KS Samsung Kodex FTSE China A50 ETF 161 - 0.11 50 - - N # IIFLNFT IN IIFL NIFTY ETF 2 0.1 0.16 50 0.25 0.42 N510130 CH E Fund SSE Mid-Cap ETF 160 0.8 0.49 - - 1.94 N # BSLNIFT IN Birla Sun Life Nifty ETF 2 0.0 3.28 50 - 0.45 NLG9 SP db x-trackers MSCI China TRN 154 0.1 0.35 138 0.65 1.68 N # 3045 HK db x-trackers MSCI India TR 1 0.0 0.43 72 0.75 2.03 N168580 KS KIM KIdx China CSI300 ETF 145 - 0.10 300 0.30 - N # RGNIFTY IN Religare Nifty ETF 1 0.0 7.57 50 - 2.29 N159907 CH Guangfa SZSE Small and Mid Cap 128 0.1 0.26 300 - 3.24 N # ICSPICE IN ICICI Prudential Sensex Spice 0 0.0 - 30 0.80 0.75 N1309 JP SSE50 Idx Linked ETF 118 1.0 1.67 50 0.95 17.01 L # QINDEX IN Quantum Idx Fund 0 0.0 5.15 50 0.50 0.43 N
Regional Country
Country
1 Option Liquidity (H / M / L / N - High / Medium / Low / None)2 / - Significant increase / decrease in shares outstanding in last one year
Asia-Pacific Listed ETFs
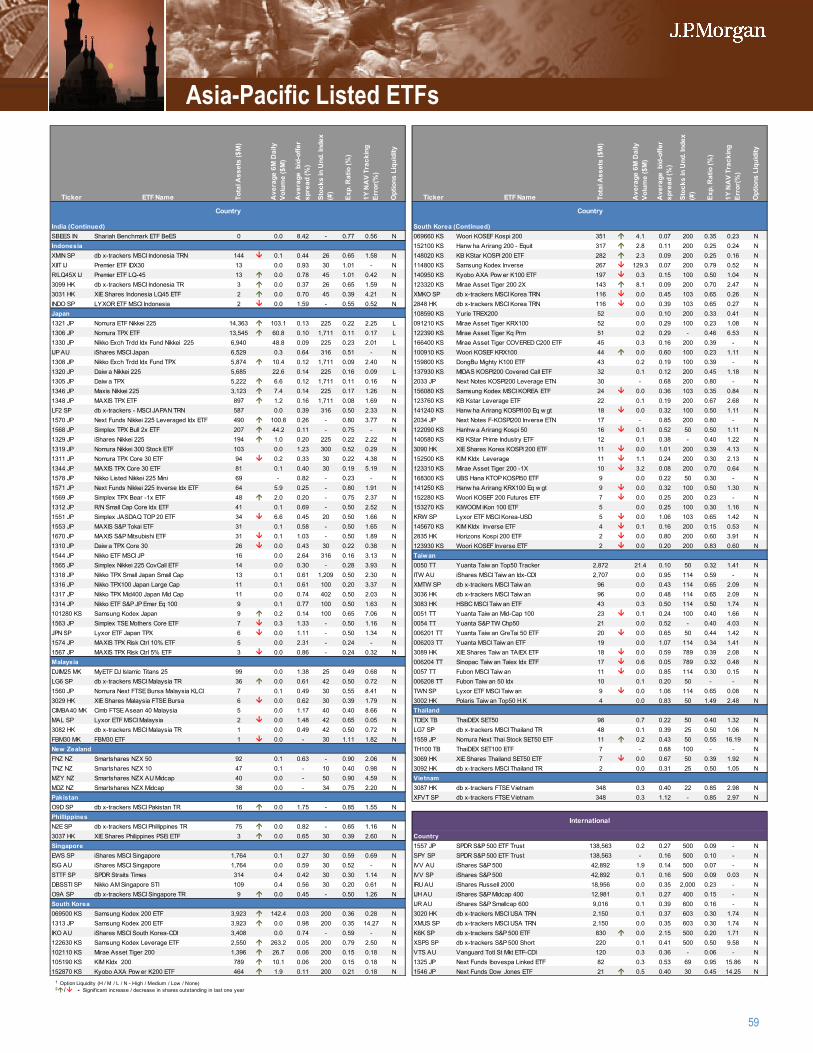
59
Ticker ETF Name Tota
l Ass
ets
($M
)
Ave
rage
6M
Dai
ly
Volu
me
($M
)
Ave
rage
bid
-offe
r sp
read
(%)
Stoc
ks in
Und
. Ind
ex
(#)
Exp.
Rat
io (%
)
1Y N
AV
Trac
king
Er
ror(
%)
Opt
ions
Liq
uidi
ty
Ticker ETF Name Tota
l Ass
ets
($M
)
Ave
rage
6M
Dai
ly
Volu
me
($M
)
Ave
rage
bid
-offe
r sp
read
(%)
Stoc
ks in
Und
. Ind
ex
(#)
Exp.
Rat
io (%
)
1Y N
AV
Trac
king
Er
ror(
%)
Opt
ions
Liq
uidi
ty
1
2
India (Continued) 3 South Korea (Continued)SBEES IN Shariah Benchmark ETF BeES 0 0.0 8.42 - 0.77 0.56 N 4 069660 KS Woori KOSEF Kospi 200 351 4.1 0.07 200 0.35 0.23 NIndonesia 5 152100 KS Hanw ha Arirang 200 - Equit 317 2.8 0.11 200 0.25 0.24 NXMIN SP db x-trackers MSCI Indonesia TRN 144 0.1 0.44 26 0.65 1.58 N 6 148020 KS KB KStar KOSPI 200 ETF 282 2.3 0.09 200 0.25 0.16 NXIIT IJ Premier ETF IDX30 13 0.0 0.93 30 1.01 - N 7 114800 KS Samsung Kodex Inverse 267 129.3 0.07 200 0.79 0.52 NR/LQ45X IJ Premier ETF LQ-45 13 0.0 0.78 45 1.01 0.42 N 8 140950 KS Kyobo AXA Pow er K100 ETF 197 0.3 0.15 100 0.50 1.04 N3099 HK db x-trackers MSCI Indonesia TR 3 0.0 0.37 26 0.65 1.59 N 9 123320 KS Mirae Asset Tiger 200 2X 143 8.1 0.09 200 0.70 2.47 N3031 HK XIE Shares Indonesia LQ45 ETF 2 0.0 0.70 45 0.39 4.21 N # XMKO SP db x-trackers MSCI Korea TRN 116 0.0 0.45 103 0.65 0.26 NINDO SP LYXOR ETF MSCI Indonesia 2 0.0 1.59 - 0.55 0.52 N 11 2848 HK db x-trackers MSCI Korea TRN 116 0.0 0.39 103 0.65 0.27 NJapan # 108590 KS Yurie TREX200 52 0.0 0.10 200 0.33 0.41 N1321 JP Nomura ETF Nikkei 225 14,363 103.1 0.13 225 0.22 2.25 L # 091210 KS Mirae Asset Tiger KRX100 52 0.0 0.29 100 0.23 1.08 N1306 JP Nomura TPX ETF 13,545 60.8 0.10 1,711 0.11 0.17 L # 122390 KS Mirae Asset Tiger Kq Prm 51 0.2 0.29 - 0.46 6.53 N1330 JP Nikko Exch Trdd Idx Fund Nikkei 225 6,940 48.8 0.09 225 0.23 2.01 L # 166400 KS Mirae Asset Tiger COVERED C200 ETF 45 0.3 0.16 200 0.39 - NIJP AU iShares MSCI Japan 6,529 0.3 0.64 316 0.51 - N # 100910 KS Woori KOSEF KRX100 44 0.0 0.60 100 0.23 1.11 N1308 JP Nikko Exch Trdd Idx Fund TPX 5,874 10.4 0.12 1,711 0.09 2.40 N # 159800 KS DongBu Mighty K100 ETF 43 0.2 0.19 100 0.39 - N1320 JP Daiw a Nikkei 225 5,685 22.6 0.14 225 0.16 0.09 L # 137930 KS MIDAS KOSPI200 Covered Call ETF 32 0.1 0.12 200 0.45 1.18 N1305 JP Daiw a TPX 5,222 6.6 0.12 1,711 0.11 0.16 N # 2033 JP Next Notes KOSPI200 Leverage ETN 30 - 0.68 200 0.80 - N1346 JP Maxis Nikkei 225 3,123 7.4 0.14 225 0.17 1.26 N # 156080 KS Samsung Kodex MSCI KOREA ETF 24 0.0 0.36 103 0.35 0.84 N1348 JP MAXIS TPX ETF 897 1.2 0.16 1,711 0.08 1.69 N # 123760 KS KB Kstar Leverage ETF 22 0.1 0.19 200 0.67 2.68 NLF2 SP db x-trackers - MSCI JAPAN TRN 587 0.0 0.39 316 0.50 2.33 N # 141240 KS Hanw ha Arirang KOSPI100 Eq w gt 18 0.0 0.32 100 0.50 1.11 N1570 JP Next Funds Nikkei 225 Leveraged Idx ETF 490 100.8 0.26 - 0.80 3.77 N # 2034 JP Next Notes F-KOSPI200 Inverse ETN 17 - 0.85 200 0.80 - N1568 JP Simplex TPX Bull 2x ETF 207 44.2 0.11 - 0.75 - N # 122090 KS Hanhw a Arirang Kospi 50 16 0.1 0.52 50 0.50 1.11 N1329 JP iShares Nikkei 225 194 1.0 0.20 225 0.22 2.22 N # 140580 KS KB KStar Prime Industry ETF 12 0.1 0.38 - 0.40 1.22 N1319 JP Nomura Nikkei 300 Stock ETF 103 0.0 1.23 300 0.52 0.29 N # 3090 HK XIE Shares Korea KOSPI 200 ETF 11 0.0 1.01 200 0.39 4.13 N1311 JP Nomura TPX Core 30 ETF 94 0.2 0.33 30 0.22 4.38 N # 152500 KS KIM KIdx Leverage 11 1.1 0.24 200 0.30 2.13 N1344 JP MAXIS TPX Core 30 ETF 81 0.1 0.40 30 0.19 5.19 N # 123310 KS Mirae Asset Tiger 200 -1X 10 3.2 0.08 200 0.70 0.64 N1578 JP Nikko Listed Nikkei 225 Mini 69 - 0.82 - 0.23 - N # 168300 KS UBS Hana KTOP KOSPI50 ETF 9 0.0 0.22 50 0.30 - N1571 JP Next Funds Nikkei 225 Inverse Idx ETF 64 5.9 0.25 - 0.80 1.91 N # 141250 KS Hanw ha Arirang KRX100 Eq w gt 9 0.0 0.32 100 0.50 1.30 N1569 JP Simplex TPX Bear -1x ETF 48 2.0 0.20 - 0.75 2.37 N # 152280 KS Woori KOSEF 200 Futures ETF 7 0.0 0.25 200 0.23 - N1312 JP R/N Small Cap Core Idx ETF 41 0.1 0.69 - 0.50 2.52 N # 153270 KS KIWOOM iKon 100 ETF 5 0.0 0.25 100 0.30 1.16 N1551 JP Simplex JASDAQ TOP 20 ETF 34 6.6 0.45 20 0.50 1.66 N # KRW SP Lyxor ETF MSCI Korea-USD 5 0.0 1.06 103 0.65 1.42 N1553 JP MAXIS S&P Tokai ETF 31 0.1 0.58 - 0.50 1.65 N # 145670 KS KIM KIdx Inverse ETF 4 0.1 0.16 200 0.15 0.53 N1670 JP MAXIS S&P Mitsubishi ETF 31 0.1 1.03 - 0.50 1.89 N # 2835 HK Horizons Kospi 200 ETF 2 0.0 0.80 200 0.60 3.91 N1310 JP Daiw a TPX Core 30 26 0.0 0.43 30 0.22 0.38 N # 123930 KS Woori KOSEF Inverse ETF 2 0.0 0.20 200 0.83 0.60 N1544 JP Nikko ETF MSCI JP 16 0.0 2.64 316 0.16 3.13 N # Taiwan1565 JP Simplex Nikkei 225 CovCall ETF 14 0.0 0.30 - 0.28 3.93 N # 0050 TT Yuanta Taiw an Top50 Tracker 2,872 21.4 0.10 50 0.32 1.41 N1318 JP Nikko TPX Small Japan Small Cap 13 0.1 0.61 1,209 0.50 2.30 N # ITW AU iShares MSCI Taiw an Idx-CDI 2,707 0.0 0.95 114 0.59 - N1316 JP Nikko TPX100 Japan Large Cap 11 0.1 0.61 100 0.20 3.37 N # XMTW SP db x-trackers MSCI Taiw an 96 0.0 0.43 114 0.65 2.09 N1317 JP Nikko TPX Mid400 Japan Mid Cap 11 0.0 0.74 402 0.50 2.03 N # 3036 HK db x-trackers MSCI Taiw an 96 0.0 0.48 114 0.65 2.09 N1314 JP Nikko ETF S&P JP Emer Eq 100 9 0.1 0.77 100 0.50 1.63 N # 3083 HK HSBC MSCI Taiw an ETF 43 0.3 0.50 114 0.50 1.74 N101280 KS Samsung Kodex Japan 9 0.2 0.14 100 0.65 7.06 N # 0051 TT Yuanta Taiw an Mid-Cap 100 23 0.1 0.24 100 0.40 1.66 N1563 JP Simplex TSE Mothers Core ETF 7 0.3 1.33 - 0.50 1.16 N # 0054 TT Yuanta S&P TW Chp50 21 0.0 0.52 - 0.40 4.03 NJPN SP Lyxor ETF Japan TPX 6 0.0 1.11 - 0.50 1.34 N # 006201 TT Yuanta Taiw an GreTai 50 ETF 20 0.0 0.65 50 0.44 1.42 N1574 JP MAXIS TPX Risk Ctrl 10% ETF 5 0.0 2.31 - 0.24 - N # 006203 TT Yuanta MSCI Taiw an ETF 19 0.0 1.07 114 0.34 1.41 N1567 JP MAXIS TPX Risk Ctrl 5% ETF 3 0.0 0.86 - 0.24 0.32 N # 3089 HK XIE Shares Taiw an TAIEX ETF 18 0.0 0.59 789 0.39 2.08 NMalaysia # 006204 TT Sinopac Taiw an Taiex Idx ETF 17 0.6 0.05 789 0.32 0.48 NDJIM25 MK MyETF DJ Islamic Titans 25 99 0.0 1.38 25 0.49 0.68 N # 0057 TT Fubon MSCI Taiw an 11 0.0 0.85 114 0.30 0.15 NLG6 SP db x-trackers MSCI Malaysia TR 36 0.0 0.61 42 0.50 0.72 N # 006208 TT Fubon Taiw an 50 Idx 10 0.1 0.20 50 - - N1560 JP Nomura Next FTSE Bursa Malaysia KLCI 7 0.1 0.49 30 0.55 8.41 N # TWN SP Lyxor ETF MSCI Taiw an 9 0.0 1.06 114 0.65 0.08 N3029 HK XIE Shares Malaysia FTSE Bursa 6 0.0 0.62 30 0.39 1.79 N # 3002 HK Polaris Taiw an Top50 H.K 4 0.0 0.83 50 1.49 2.48 NCIMBA40 MK Cimb FTSE Asean 40 Malaysia 5 0.0 1.17 40 0.40 8.66 N # ThailandMAL SP Lyxor ETF MSCI Malaysia 2 0.0 1.48 42 0.65 0.05 N # TDEX TB ThaiDEX SET50 98 0.7 0.22 50 0.40 1.32 N3082 HK db x-trackers MSCI Malaysia TR 1 0.0 0.49 42 0.50 0.72 N # LG7 SP db x-trackers MSCI Thailand TR 48 0.1 0.39 25 0.50 1.06 NFBM30 MK FBM30 ETF 1 0.0 - 30 1.11 1.82 N # 1559 JP Nomura Next Thai Stock SET50 ETF 11 0.2 0.43 50 0.55 16.19 NNew Zealand # TH100 TB ThaiDEX SET100 ETF 7 - 0.68 100 - - NFNZ NZ Smartshares NZX 50 92 0.1 0.63 - 0.90 2.06 N # 3069 HK XIE Shares Thailand SET50 ETF 7 0.0 0.67 50 0.39 1.92 NTNZ NZ Smartshares NZX 10 47 0.1 - 10 0.40 0.98 N # 3092 HK db x-trackers MSCI Thailand TR 2 0.0 0.31 25 0.50 1.05 NMZY NZ Smartshares NZX AU Midcap 40 0.0 - 50 0.90 4.59 N # VietnamMDZ NZ Smartshares NZX Midcap 38 0.0 - 34 0.75 2.20 N # 3087 HK db x-trackers FTSE Vietnam 348 0.3 0.40 22 0.85 2.98 NPakistan # XFVT SP db x-trackers FTSE Vietnam 348 0.3 1.12 - 0.85 2.97 NO9D SP db x-trackers MSCI Pakistan TR 16 0.0 1.75 - 0.85 1.55 N #
Phillippines #
N2E SP db x-trackers MSCI Phillippines TR 75 0.0 0.82 - 0.65 1.16 N #
3037 HK XIE Shares Philippines PSEi ETF 3 0.0 0.65 30 0.39 2.60 N # CountrySingapore # 1557 JP SPDR S&P 500 ETF Trust 138,563 0.2 0.27 500 0.09 - NEWS SP iShares MSCI Singapore 1,764 0.1 0.27 30 0.59 0.69 N # SPY SP SPDR S&P 500 ETF Trust 138,563 - 0.16 500 0.10 - NISG AU iShares MSCI Singapore 1,764 0.0 0.59 30 0.52 - N # IVV AU iShares S&P 500 42,892 1.9 0.14 500 0.07 - NSTTF SP SPDR Straits Times 314 0.4 0.42 30 0.30 1.14 N # IVV SP iShares S&P 500 42,892 0.1 0.16 500 0.09 0.03 NDBSSTI SP Nikko AM Singapore STI 109 0.4 0.56 30 0.20 0.61 N # IRU AU iShares Russell 2000 18,956 0.0 0.35 2,000 0.23 - NO9A SP db x-trackers MSCI Singapore TR 9 0.0 0.45 - 0.50 1.26 N # IJH AU iShares S&P Midcap 400 12,981 0.1 0.27 400 0.15 - NSouth Korea # IJR AU iShares S&P Smallcap 600 9,016 0.1 0.39 600 0.16 - N069500 KS Samsung Kodex 200 ETF 3,923 142.4 0.03 200 0.36 0.28 N # 3020 HK db x-trackers MSCI USA TRN 2,150 0.1 0.37 603 0.30 1.74 N1313 JP Samsung Kodex 200 ETF 3,923 0.0 0.98 200 0.35 14.27 N # XMUS SP db x-trackers MSCI USA TRN 2,150 0.0 0.35 603 0.30 1.74 NIKO AU iShares MSCI South Korea-CDI 3,408 0.0 0.74 - 0.59 - N # K6K SP db x-trackers S&P 500 ETF 830 0.0 2.15 500 0.20 1.71 N122630 KS Samsung Kodex Leverage ETF 2,550 263.2 0.05 200 0.79 2.50 N # XSPS SP db x-trackers S&P 500 Short 220 0.1 0.41 500 0.50 9.58 N102110 KS Mirae Asset Tiger 200 1,396 26.7 0.06 200 0.15 0.18 N # VTS AU Vanguard Totl St Mkt ETF-CDI 120 0.3 0.36 - 0.06 - N105190 KS KIM KIdx 200 789 10.1 0.06 200 0.15 0.18 N # 1325 JP Next Funds Ibovespa Linked ETF 82 0.3 0.53 69 0.95 15.86 N152870 KS Kyobo AXA Pow er K200 ETF 464 1.9 0.11 200 0.21 0.18 N # 1546 JP Next Funds Dow Jones ETF 21 0.5 0.40 30 0.45 14.25 N
International
Country Country
1 Option Liquidity (H / M / L / N - High / Medium / Low / None)2 / - Significant increase / decrease in shares outstanding in last one year
Asia-Pacific Listed ETFs
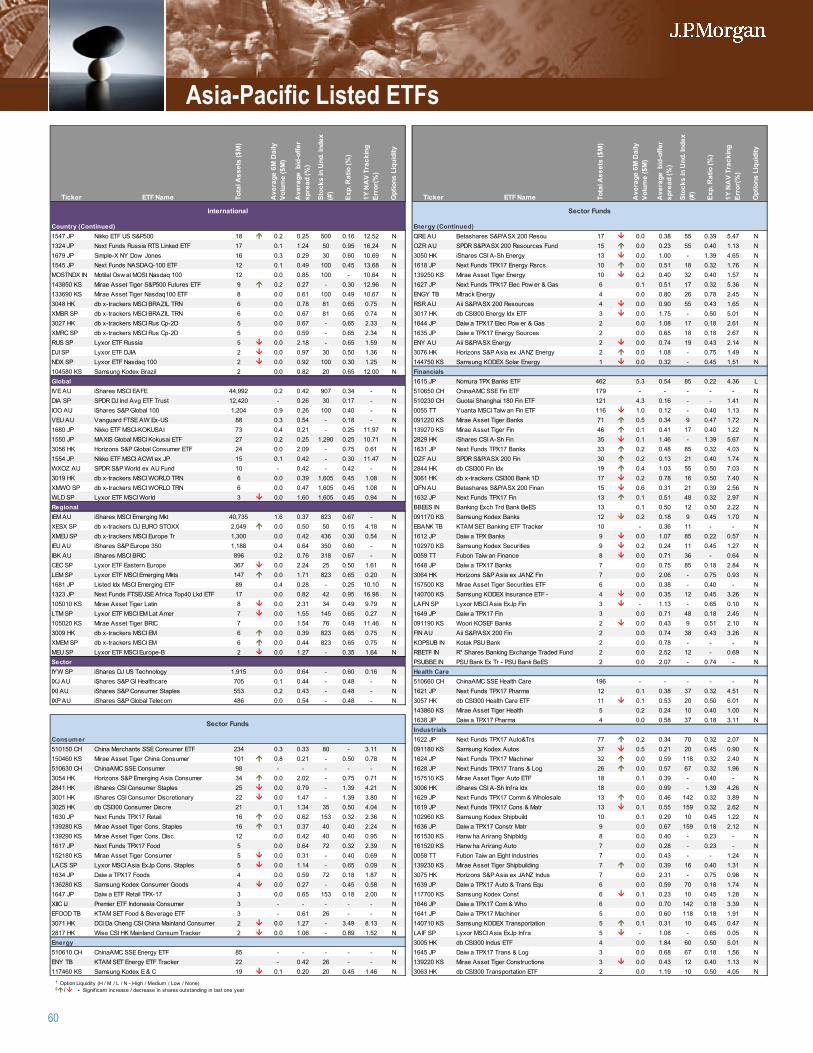
60
Ticker ETF Name Tota
l Ass
ets
($M
)
Ave
rage
6M
Dai
ly
Volu
me
($M
)
Ave
rage
bid
-offe
r sp
read
(%)
Stoc
ks in
Und
. Ind
ex
(#)
Exp.
Rat
io (%
)
1Y N
AV
Trac
king
Er
ror(
%)
Opt
ions
Liq
uidi
ty
Ticker ETF Name Tota
l Ass
ets
($M
)
Ave
rage
6M
Dai
ly
Volu
me
($M
)
Ave
rage
bid
-offe
r sp
read
(%)
Stoc
ks in
Und
. Ind
ex
(#)
Exp.
Rat
io (%
)
1Y N
AV
Trac
king
Er
ror(
%)
Opt
ions
Liq
uidi
ty
1
2
Country (Continued) 3 Energy (Continued)1547 JP Nikko ETF US S&P500 18 0.2 0.25 500 0.16 12.52 N 4 QRE AU Betashares S&P/ASX 200 Resou 17 0.0 0.38 55 0.39 5.47 N1324 JP Next Funds Russia RTS Linked ETF 17 0.1 1.24 50 0.95 16.24 N 5 OZR AU SPDR S&P/ASX 200 Resources Fund 15 0.0 0.23 55 0.40 1.13 N1679 JP Simple-X NY Dow Jones 16 0.3 0.29 30 0.60 10.69 N 6 3050 HK iShares CSI A-Sh Energy 13 0.0 1.00 - 1.39 4.65 N1545 JP Next Funds NASDAQ-100 ETF 12 0.1 0.49 100 0.45 13.68 N 7 1618 JP Next Funds TPX17 Energy Rsrcs 10 0.0 0.51 18 0.32 1.76 NMOSTNDX IN Motilal Osw al MOSt Nasdaq 100 12 0.0 0.85 100 - 10.64 N 8 139250 KS Mirae Asset Tiger Energy 10 0.2 0.40 32 0.40 1.57 N143850 KS Mirae Asset Tiger S&P500 Futures ETF 9 0.2 0.27 - 0.30 12.96 N 9 1627 JP Next Funds TPX17 Elec Pow er & Gas 6 0.1 0.51 17 0.32 5.36 N133690 KS Mirae Asset Tiger Nasdaq100 ETF 8 0.0 0.61 100 0.49 10.67 N # ENGY TB Mtrack Energy 4 0.0 0.80 26 0.78 2.45 N3048 HK db x-trackers MSCI BRAZIL TRN 6 0.0 0.78 81 0.65 0.75 N 11 RSR AU Aii S&P/ASX 200 Resources 4 0.0 0.90 55 0.43 1.65 NXMBR SP db x-trackers MSCI BRAZIL TRN 6 0.0 0.67 81 0.65 0.74 N # 3017 HK db CSI300 Energy Idx ETF 3 0.0 1.75 - 0.50 5.01 N3027 HK db x-trackers MSCI Rus Cp-2D 5 0.0 0.67 - 0.65 2.33 N # 1644 JP Daiw a TPX17 Elec Pow er & Gas 2 0.0 1.08 17 0.18 2.61 NXMRC SP db x-trackers MSCI Rus Cp-2D 5 0.0 0.59 - 0.65 2.34 N # 1635 JP Daiw a TPX17 Energy Sources 2 0.0 0.65 18 0.18 2.67 NRUS SP Lyxor ETF Russia 5 0.0 2.18 - 0.65 1.59 N # ENY AU Aii S&P/ASX Energy 2 0.0 0.74 19 0.43 2.14 NDJI SP Lyxor ETF DJIA 2 0.0 0.97 30 0.50 1.36 N # 3076 HK Horizons S&P Asia ex JANZ Energy 2 0.0 1.08 - 0.75 1.49 NNDX SP Lyxor ETF Nasdaq 100 2 0.0 0.92 100 0.30 1.25 N # 144750 KS Samsung KODEX Solar Energy 1 0.0 0.32 - 0.45 1.51 N104580 KS Samsung Kodex Brazil 2 0.0 0.82 20 0.65 12.00 N # FinancialsGlobal # 1615 JP Nomura TPX Banks ETF 462 5.3 0.54 85 0.22 4.36 LIVE AU iShares MSCI EAFE 44,992 0.2 0.42 907 0.34 - N # 510650 CH ChinaAMC SSE Fin ETF 179 - - - - - NDIA SP SPDR DJ Ind Avg ETF Trust 12,420 - 0.26 30 0.17 - N # 510230 CH Guotai Shanghai 180 Fin ETF 121 4.3 0.16 - - 1.41 NIOO AU iShares S&P Global 100 1,204 0.9 0.26 100 0.40 - N # 0055 TT Yuanta MSCI Taiw an Fin ETF 116 1.0 0.12 - 0.40 1.13 NVEU AU Vanguard FTSE AW Ex-US 88 0.3 0.54 - 0.18 - N # 091220 KS Mirae Asset Tiger Banks 71 0.5 0.34 9 0.47 1.72 N1680 JP Nikko ETF MSCI-KOKUSAI 73 0.4 0.21 - 0.25 11.97 N # 139270 KS Mirae Asset Tiger Fin 46 0.1 0.41 17 0.40 1.22 N1550 JP MAXIS Global MSCI Kokusai ETF 27 0.2 0.25 1,290 0.25 10.71 N # 2829 HK iShares CSI A-Sh Fin 35 0.1 1.46 - 1.39 5.67 N3056 HK Horizons S&P Global Consumer ETF 24 0.0 2.09 - 0.75 0.61 N # 1631 JP Next Funds TPX17 Banks 33 0.2 0.48 85 0.32 4.03 N1554 JP Nikko ETF MSCI ACWI ex JP 15 0.1 0.42 - 0.30 11.47 N # OZF AU SPDR S&P/ASX 200 Fin 30 0.2 0.13 21 0.40 1.74 NWXOZ AU SPDR S&P World ex AU Fund 10 - 0.42 - 0.42 - N # 2844 HK db CSI300 Fin Idx 19 0.4 1.03 55 0.50 7.03 N3019 HK db x-trackers MSCI WORLD TRN 6 0.0 0.39 1,605 0.45 1.08 N # 3061 HK db x-trackers CSI300 Bank 1D 17 0.2 0.78 16 0.50 7.40 NXMWO SP db x-trackers MSCI WORLD TRN 6 0.0 0.47 1,605 0.45 1.08 N # QFN AU Betashares S&P/ASX 200 Finan 15 0.6 0.31 21 0.39 2.56 NWLD SP Lyxor ETF MSCI World 3 0.0 1.60 1,605 0.45 0.94 N # 1632 JP Next Funds TPX17 Fin 13 0.1 0.51 48 0.32 2.97 NRegional # BBEES IN Banking Exch Trd Bank BeES 13 0.1 0.50 12 0.50 2.22 NIEM AU iShares MSCI Emerging Mkt 40,735 1.6 0.37 823 0.67 - N # 091170 KS Samsung Kodex Banks 12 0.2 0.18 9 0.45 1.70 NXESX SP db x-trackers DJ EURO STOXX 2,049 0.0 0.50 50 0.15 4.18 N # EBANK TB KTAM SET Banking ETF Tracker 10 - 0.36 11 - - NXMEU SP db x-trackers MSCI Europe Tr 1,300 0.0 0.42 436 0.30 0.54 N # 1612 JP Daiw a TPX Banks 9 0.0 1.07 85 0.22 0.57 NIEU AU iShares S&P Europe 350 1,188 0.4 0.64 350 0.60 - N # 102970 KS Samsung Kodex Securities 9 0.2 0.24 11 0.45 1.27 NIBK AU iShares MSCI BRIC 896 0.2 0.76 318 0.67 - N # 0059 TT Fubon Taiw an Finance 8 0.0 0.71 36 - 0.64 NCEC SP Lyxor ETF Eastern Europe 367 0.0 2.24 25 0.50 1.61 N # 1648 JP Daiw a TPX17 Banks 7 0.0 0.75 85 0.18 2.84 NLEM SP Lyxor ETF MSCI Emerging Mkts 147 0.0 1.71 823 0.65 0.20 N # 3064 HK Horizons S&P Asia ex JANZ Fin 7 0.0 2.06 - 0.75 0.93 N1681 JP Listed Idx MSCI Emerging ETF 89 0.4 0.28 - 0.25 10.10 N # 157500 KS Mirae Asset Tiger Securities ETF 6 0.0 0.38 - 0.40 - N1323 JP Next Funds FTSE/JSE Africa Top40 Lkd ETF 17 0.0 0.82 42 0.95 16.98 N # 140700 KS Samsung KODEX Insurance ETF - 4 0.0 0.35 12 0.45 3.26 N105010 KS Mirae Asset Tiger Latin 8 0.0 2.31 34 0.49 9.79 N # LAFN SP Lyxor MSCI Asia ExJp Fin 3 - 1.13 - 0.65 0.10 NLTM SP Lyxor ETF MSCI EM Lat Amer 7 0.0 1.55 145 0.65 0.27 N # 1649 JP Daiw a TPX17 Fin 3 0.0 0.71 48 0.18 2.45 N105020 KS Mirae Asset Tiger BRIC 7 0.0 1.54 76 0.49 11.46 N # 091190 KS Woori KOSEF Banks 2 0.0 0.43 9 0.51 2.10 N3009 HK db x-trackers MSCI EM 6 0.0 0.39 823 0.65 0.75 N # FIN AU Aii S&P/ASX 200 Fin 2 0.0 0.74 38 0.43 3.26 NXMEM SP db x-trackers MSCI EM 6 0.0 0.44 823 0.65 0.75 N # KOPSUB IN Kotak PSU Bank 2 0.0 0.78 - - - NMEU SP Lyxor ETF MSCI Europe-B 2 0.0 1.27 - 0.35 1.64 N # RBETF IN R* Shares Banking Exchange Traded Fund 2 0.0 2.52 12 - 0.69 NSector # PSUBBE IN PSU Bank Ex Tr - PSU Bank BeES 2 0.0 2.07 - 0.74 - NIYW SP iShares DJ US Technology 1,915 0.0 0.64 - 0.60 0.16 N # Health CareIXJ AU iShares S&P Gl Healthcare 705 0.1 0.44 - 0.48 - N # 510660 CH ChinaAMC SSE Health Care 196 - - - - - NIXI AU iShares S&P Consumer Staples 553 0.2 0.43 - 0.48 - N # 1621 JP Next Funds TPX17 Pharma 12 0.1 0.38 37 0.32 4.51 NIXP AU iShares S&P Global Telecom 486 0.0 0.54 - 0.48 - N # 3057 HK db CSI300 Health Care ETF 11 0.1 0.53 20 0.50 6.01 N
# 143860 KS Mirae Asset Tiger Health 5 0.2 0.24 10 0.40 1.00 N# 1638 JP Daiw a TPX17 Pharma 4 0.0 0.58 37 0.18 3.11 N# Industrials
Consumer # 1622 JP Next Funds TPX17 Auto&Trs 77 0.2 0.34 70 0.32 2.07 N510150 CH China Merchants SSE Consumer ETF 234 0.3 0.33 80 - 3.11 N # 091180 KS Samsung Kodex Autos 37 0.5 0.21 20 0.45 0.90 N150460 KS Mirae Asset Tiger China Consumer 101 0.8 0.21 - 0.50 0.78 N # 1624 JP Next Funds TPX17 Machiner 32 0.0 0.59 118 0.32 2.40 N510630 CH ChinaAMC SSE Consumer 98 - - - - - N # 1628 JP Next Funds TPX17 Trans & Log 26 0.0 0.57 67 0.32 1.96 N3054 HK Horizons S&P Emerging Asia Consumer 34 0.0 2.02 - 0.75 0.71 N # 157510 KS Mirae Asset Tiger Auto ETF 18 0.1 0.39 - 0.40 - N2841 HK iShares CSI Consumer Staples 25 0.0 0.79 - 1.39 4.21 N # 3006 HK iShares CSI A-Sh Infra Idx 18 0.0 0.99 - 1.39 4.26 N3001 HK iShares CSI Consumer Discretionary 22 0.0 1.47 - 1.39 3.80 N # 1629 JP Next Funds TPX17 Comm & Wholesale 13 0.0 0.46 142 0.32 3.89 N3025 HK db CSI300 Consumer Discre 21 0.1 1.34 35 0.50 4.04 N # 1619 JP Next Funds TPX17 Cons & Matr 13 0.1 0.55 159 0.32 2.62 N1630 JP Next Funds TPX17 Retail 16 0.0 0.62 153 0.32 2.36 N # 102960 KS Samsung Kodex Shipbuild 10 0.1 0.29 10 0.45 1.22 N139280 KS Mirae Asset Tiger Cons. Staples 16 0.1 0.37 40 0.40 2.24 N # 1636 JP Daiw a TPX17 Constr Matr 9 0.0 0.67 159 0.18 2.12 N139290 KS Mirae Asset Tiger Cons. Disc. 12 0.0 0.42 40 0.40 0.95 N # 161530 KS Hanw ha Arirang Shipbldg 8 0.0 0.40 - 0.23 - N1617 JP Next Funds TPX17 Food 5 0.0 0.64 72 0.32 2.39 N # 161520 KS Hanw ha Arirang Auto 7 0.0 0.28 - 0.23 - N152180 KS Mirae Asset Tiger Consumer 5 0.0 0.31 - 0.40 0.69 N # 0058 TT Fubon Taiw an Eight Industries 7 0.0 0.43 - - 1.24 NLACS SP Lyxor MSCI Asia ExJp Cons. Staples 5 0.0 1.14 - 0.65 0.09 N # 139230 KS Mirae Asset Tiger Shipbuilding 7 0.0 0.39 16 0.40 1.31 N1634 JP Daiw a TPX17 Foods 4 0.0 0.59 72 0.18 1.87 N # 3075 HK Horizons S&P Asia ex JANZ Indus 7 0.0 2.31 - 0.75 0.98 N136280 KS Samsung Kodex Consumer Goods 4 0.0 0.27 - 0.45 0.58 N # 1639 JP Daiw a TPX17 Auto & Trans Equ 6 0.0 0.59 70 0.18 1.74 N1647 JP Daiw a ETF Retail TPX-17 3 0.0 0.65 153 0.18 2.00 N # 117700 KS Samsung Kodex Const 6 0.1 0.23 10 0.45 1.28 NXIIC IJ Premier ETF Indonesia Consumer 3 - - - - - N # 1646 JP Daiw a TPX17 Com & Who 6 0.0 0.70 142 0.18 3.39 NEFOOD TB KTAM SET Food & Beverage ETF 3 - 0.61 26 - - N # 1641 JP Daiw a TPX17 Machiner 5 0.0 0.60 118 0.18 1.91 N3071 HK DCI Da Cheng CSI China Mainland Consumer 2 0.0 1.27 - 3.49 8.13 N # 140710 KS Samsung KODEX Transportation 5 0.1 0.31 10 0.45 0.47 N2817 HK Wise CSI HK Mainland Consum Tracker 2 0.0 1.06 - 0.89 1.52 N # LAIF SP Lyxor MSCI Asia ExJp Infra 5 - 1.08 - 0.65 0.05 NEnergy # 3005 HK db CSI300 Indus ETF 4 0.0 1.84 60 0.50 5.01 N510610 CH ChinaAMC SSE Energy ETF 85 - - - - - N # 1645 JP Daiw a TPX17 Trans & Log 3 0.0 0.68 67 0.18 1.56 NENY TB KTAM SET Energy ETF Tracker 22 - 0.42 26 - - N # 139220 KS Mirae Asset Tiger Constructions 3 0.0 0.43 12 0.40 1.13 N117460 KS Samsung Kodex E & C 19 0.1 0.20 20 0.45 1.46 N # 3063 HK db CSI300 Transportation ETF 2 0.0 1.19 10 0.50 4.05 N
International Sector Funds
Sector Funds
1 Option Liquidity (H / M / L / N - High / Medium / Low / None)2 / - Significant increase / decrease in shares outstanding in last one year
Asia-Pacific Listed ETFs
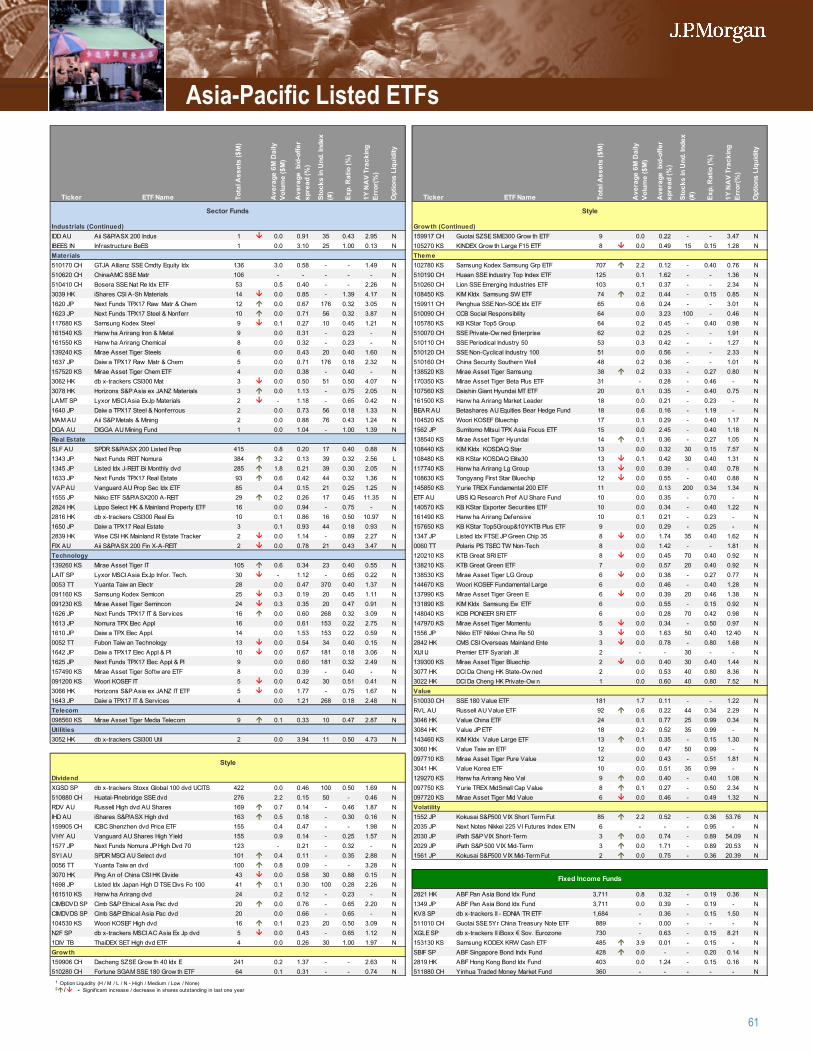
61
Ticker ETF Name Tota
l Ass
ets
($M
)
Ave
rage
6M
Dai
ly
Volu
me
($M
)
Ave
rage
bid
-offe
r sp
read
(%)
Stoc
ks in
Und
. Ind
ex
(#)
Exp.
Rat
io (%
)
1Y N
AV
Trac
king
Er
ror(
%)
Opt
ions
Liq
uidi
ty
Ticker ETF Name Tota
l Ass
ets
($M
)
Ave
rage
6M
Dai
ly
Volu
me
($M
)
Ave
rage
bid
-offe
r sp
read
(%)
Stoc
ks in
Und
. Ind
ex
(#)
Exp.
Rat
io (%
)
1Y N
AV
Trac
king
Er
ror(
%)
Opt
ions
Liq
uidi
ty
1
2
Industrials (Continued) 3 Growth (Continued)IDD AU Aii S&P/ASX 200 Indus 1 0.0 0.91 35 0.43 2.95 N 4 159917 CH Guotai SZSE SME300 Grow th ETF 9 0.0 0.22 - - 3.47 NIBEES IN Infrastructure BeES 1 0.0 3.10 25 1.00 0.13 N 5 105270 KS KINDEX Grow th Large F15 ETF 8 0.0 0.49 15 0.15 1.28 NMaterials 6 Theme510170 CH GTJA Allianz SSE Cmdty Equity Idx 136 3.0 0.58 - - 1.49 N 7 102780 KS Samsung Kodex Samsung Grp ETF 707 2.2 0.12 - 0.40 0.76 N510620 CH ChinaAMC SSE Matr 106 - - - - - N 8 510190 CH Huaan SSE Industry Top Index ETF 125 0.1 1.62 - - 1.36 N510410 CH Bosera SSE Nat Re Idx ETF 53 0.5 0.40 - - 2.26 N 9 510260 CH Lion SSE Emerging Industries ETF 103 0.1 0.37 - - 2.34 N3039 HK iShares CSI A-Sh Materials 14 0.0 0.85 - 1.39 4.17 N # 108450 KS KIM KIdx Samsung SW ETF 74 0.2 0.44 - 0.15 0.85 N1620 JP Next Funds TPX17 Raw Matr & Chem 12 0.0 0.67 176 0.32 3.05 N 11 159911 CH Penghua SSE Non-SOE Idx ETF 65 0.6 0.24 - - 3.01 N1623 JP Next Funds TPX17 Steel & Nonferr 10 0.0 0.71 56 0.32 3.87 N # 510090 CH CCB Social Responsibility 64 0.0 3.23 100 - 0.46 N117680 KS Samsung Kodex Steel 9 0.1 0.27 10 0.45 1.21 N # 105780 KS KB KStar Top5 Group 64 0.2 0.45 - 0.40 0.98 N161540 KS Hanw ha Arirang Iron & Metal 9 0.0 0.31 - 0.23 - N # 510070 CH SSE Private-Ow ned Enterprise 62 0.2 0.25 - - 1.91 N161550 KS Hanw ha Arirang Chemical 8 0.0 0.32 - 0.23 - N # 510110 CH SSE Periodical Industry 50 53 0.3 0.42 - - 1.27 N139240 KS Mirae Asset Tiger Steels 6 0.0 0.43 20 0.40 1.60 N # 510120 CH SSE Non-Cyclical Industry 100 51 0.0 0.56 - - 2.33 N1637 JP Daiw a TPX17 Raw Matr & Chem 5 0.0 0.71 176 0.18 2.32 N # 510160 CH China Security Southern Well 48 0.2 0.36 - - 1.01 N157520 KS Mirae Asset Tiger Chem ETF 4 0.0 0.38 - 0.40 - N # 138520 KS Mirae Asset Tiger Samsung 38 0.2 0.33 - 0.27 0.80 N3062 HK db x-trackers CSI300 Mat 3 0.0 0.50 51 0.50 4.07 N # 170350 KS Mirae Asset Tiger Beta Plus ETF 31 - 0.28 - 0.46 - N3078 HK Horizons S&P Asia ex JANZ Materials 3 0.0 1.13 - 0.75 2.05 N # 107560 KS Daishin Giant Hyundai MT ETF 20 0.1 0.35 - 0.40 0.75 NLAMT SP Lyxor MSCI Asia ExJp Materials 2 - 1.18 - 0.65 0.42 N # 161500 KS Hanw ha Arirang Market Leader 18 0.0 0.21 - 0.23 - N1640 JP Daiw a TPX17 Steel & Nonferrous 2 0.0 0.73 56 0.18 1.33 N # BEAR AU Betashares AU Equities Bear Hedge Fund 18 0.6 0.16 - 1.19 - NMAM AU Aii S&P Metals & Mining 2 0.0 0.88 76 0.43 1.24 N # 104520 KS Woori KOSEF Bluechip 17 0.1 0.29 - 0.40 1.17 NDGA AU DIGGA AU Mining Fund 1 0.0 1.04 - 1.00 1.39 N # 1562 JP Sumitomo Mitsui TPX Asia Focus ETF 15 0.0 2.45 - 0.40 1.18 NReal Estate # 138540 KS Mirae Asset Tiger Hyundai 14 0.1 0.36 - 0.27 1.05 NSLF AU SPDR S&P/ASX 200 Listed Prop 415 0.8 0.20 17 0.40 0.88 N # 108440 KS KIM KIdx KOSDAQ Star 13 0.0 0.32 30 0.15 7.57 N1343 JP Next Funds REIT Nomura 384 3.2 0.13 39 0.32 2.56 L # 108480 KS KB KStar KOSDAQ Elite30 13 0.1 0.42 30 0.40 1.31 N1345 JP Listed Idx J-REIT Bi Monthly dvd 285 1.8 0.21 39 0.30 2.05 N # 117740 KS Hanw ha Arirang Lg Group 13 0.0 0.39 - 0.40 0.78 N1633 JP Next Funds TPX17 Real Estate 93 0.6 0.42 44 0.32 1.36 N # 108630 KS Tongyang First Star Bluechip 12 0.0 0.55 - 0.40 0.88 NVAP AU Vanguard AU Prop Sec Idx ETF 85 0.4 0.15 21 0.25 1.25 N # 145850 KS Yurie TREX Fundamental 200 ETF 11 0.0 0.13 200 0.34 1.34 N1555 JP Nikko ETF S&P/ASX200 A-REIT 29 0.2 0.26 17 0.45 11.35 N # ETF AU UBS IQ Research Pref AU Share Fund 10 0.0 0.35 - 0.70 - N2824 HK Lippo Select HK & Mainland Property ETF 16 0.0 0.94 - 0.75 - N # 140570 KS KB KStar Exporter Securities ETF 10 0.0 0.34 - 0.40 1.22 N2816 HK db x-trackers CSI300 Real Es 10 0.1 0.86 16 0.50 10.97 N # 161490 KS Hanw ha Arirang Defensive 10 0.1 0.21 - 0.23 - N1650 JP Daiw a TPX17 Real Estate 3 0.1 0.93 44 0.18 0.93 N # 157650 KS KB KStar Top5Group&10YKTB Plus ETF 9 0.0 0.29 - 0.25 - N2839 HK Wise CSI HK Mainland R Estate Tracker 2 0.0 1.14 - 0.89 2.27 N # 1347 JP Listed Idx FTSE JP Green Chip 35 8 0.0 1.74 35 0.40 1.62 NFIX AU Aii S&P/ASX 200 Fin X-A-REIT 2 0.0 0.78 21 0.43 3.47 N # 0060 TT Polaris PS TSEC TW Non-Tech 8 0.0 1.42 - - 1.81 NTechnology # 120210 KS KTB Great SRI ETF 8 0.0 0.45 70 0.40 0.92 N139260 KS Mirae Asset Tiger IT 105 0.6 0.34 23 0.40 0.55 N # 138210 KS KTB Great Green ETF 7 0.0 0.57 20 0.40 0.92 NLAIT SP Lyxor MSCI Asia ExJp Infor. Tech. 30 - 1.12 - 0.65 0.22 N # 138530 KS Mirae Asset Tiger LG Group 6 0.0 0.38 - 0.27 0.77 N0053 TT Yuanta Taiw an Electr 28 0.0 0.47 370 0.40 1.37 N # 144670 KS Woori KOSEF Fundamental Large 6 0.0 0.46 - 0.40 1.28 N091160 KS Samsung Kodex Semicon 25 0.3 0.19 20 0.45 1.11 N # 137990 KS Mirae Asset Tiger Green E 6 0.0 0.39 20 0.46 1.38 N091230 KS Mirae Asset Tiger Semincon 24 0.3 0.35 20 0.47 0.91 N # 131890 KS KIM KIdx Samsung Ew ETF 6 0.0 0.55 - 0.15 0.92 N1626 JP Next Funds TPX17 IT & Services 16 0.0 0.60 268 0.32 3.09 N # 148040 KS KDB PIONEER SRI ETF 6 0.0 0.28 70 0.42 0.98 N1613 JP Nomura TPX Elec Appl 16 0.0 0.61 153 0.22 2.75 N # 147970 KS Mirae Asset Tiger Momentu 5 0.0 0.34 - 0.50 0.97 N1610 JP Daiw a TPX Elec Appl. 14 0.0 1.53 153 0.22 0.59 N # 1556 JP Nikko ETF Nikkei China Re 50 3 0.0 1.63 50 0.40 12.40 N0052 TT Fubon Taiw an Technology 13 0.0 0.54 34 0.40 0.15 N # 2842 HK CMS CSI Overseas Mainland Ente 3 0.0 0.78 - 0.80 1.68 N1642 JP Daiw a TPX17 Elec Appl & PI 10 0.0 0.67 181 0.18 3.06 N # XIJI IJ Premier ETF Syariah JII 2 - - 30 - - N1625 JP Next Funds TPX17 Elec Appl & PI 9 0.0 0.60 181 0.32 2.49 N # 139300 KS Mirae Asset Tiger Bluechip 2 0.0 0.40 30 0.40 1.44 N157490 KS Mirae Asset Tiger Softw are ETF 8 0.0 0.39 - 0.40 - N # 3077 HK DCI Da Cheng HK State-Ow ned 2 0.0 0.53 40 0.80 8.36 N091200 KS Woori KOSEF IT 5 0.0 0.42 30 0.51 0.41 N # 3022 HK DCI Da Cheng HK Private-Ow n 1 0.0 0.60 40 0.80 7.52 N3066 HK Horizons S&P Asia ex JANZ IT ETF 5 0.0 1.77 - 0.75 1.67 N # Value1643 JP Daiw a TPX17 IT & Services 4 0.0 1.21 268 0.18 2.48 N # 510030 CH SSE 180 Value ETF 181 1.7 0.11 - - 1.22 NTelecom # RVL AU Russell AU Value ETF 92 0.6 0.22 44 0.34 2.29 N098560 KS Mirae Asset Tiger Media Telecom 9 0.1 0.33 10 0.47 2.87 N # 3046 HK Value China ETF 24 0.1 0.77 25 0.99 0.34 NUtilities # 3084 HK Value JP ETF 18 0.2 0.52 35 0.99 - N3052 HK db x-trackers CSI300 Util 2 0.0 3.94 11 0.50 4.73 N # 143460 KS KIM KIdx Value Large ETF 13 0.1 0.35 - 0.15 1.30 N
# 3060 HK Value Taiw an ETF 12 0.0 0.47 50 0.99 - N# 097710 KS Mirae Asset Tiger Pure Value 12 0.0 0.43 - 0.51 1.81 N# 3041 HK Value Korea ETF 10 0.0 0.51 35 0.99 - N
Dividend # 129270 KS Hanw ha Arirang Neo Val 9 0.0 0.40 - 0.40 1.08 NXGSD SP db x-trackers Stoxx Global 100 dvd UCITS 422 0.0 0.46 100 0.50 1.69 N # 097750 KS Yurie TREX MidSmall Cap Value 8 0.1 0.27 - 0.50 2.34 N510880 CH Huatai-Pinebridge SSE dvd 276 2.2 0.15 50 - 0.46 N # 097720 KS Mirae Asset Tiger Mid Value 6 0.0 0.46 - 0.49 1.32 NRDV AU Russell High dvd AU Shares 169 0.7 0.14 - 0.46 1.87 N # VolatilityIHD AU iShares S&P/ASX High dvd 163 0.5 0.18 - 0.30 0.16 N # 1552 JP Kokusai S&P500 VIX Short Term Fut 85 2.2 0.52 - 0.36 53.76 N159905 CH ICBC Shenzhen dvd Price ETF 155 0.4 0.47 - - 1.98 N # 2035 JP Next Notes Nikkei 225 VI Futures Index ETN 6 - - - 0.95 - NVHY AU Vanguard AU Shares High Yield 155 0.9 0.14 - 0.25 1.57 N # 2030 JP iPath S&P VIX Short-Term 3 0.0 0.74 - 0.89 54.09 N1577 JP Next Funds Nomura JP High Dvd 70 123 - 0.21 - 0.32 - N # 2029 JP iPath S&P 500 VIX Mid-Term 3 0.0 1.71 - 0.89 20.53 NSYI AU SPDR MSCI AU Select dvd 101 0.4 0.11 - 0.35 2.88 N # 1561 JP Kokusai S&P500 VIX Mid-Term Fut 2 0.0 0.75 - 0.36 20.39 N0056 TT Yuanta Taiw an dvd 100 0.8 0.09 - - 3.28 N #
3070 HK Ping An of China CSI HK Divide 43 0.0 0.58 30 0.88 0.15 N #
1698 JP Listed Idx Japan High D TSE Divs Fo 100 41 0.1 0.30 100 0.28 2.26 N #
161510 KS Hanw ha Arirang dvd 24 0.2 0.12 - 0.23 - N # 2821 HK ABF Pan Asia Bond Idx Fund 3,711 0.8 0.32 - 0.19 0.36 NCIMBDVD SP Cimb S&P Ethical Asia Pac dvd 20 0.0 0.76 - 0.65 2.20 N # 1349 JP ABF Pan Asia Bond Idx Fund 3,711 0.0 0.39 - 0.19 - NCIMDVDS SP Cimb S&P Ethical Asia Pac dvd 20 0.0 0.66 - 0.65 - N # KV8 SP db x-trackers II - EONIA TR ETF 1,684 - 0.36 - 0.15 1.50 N104530 KS Woori KOSEF High dvd 16 0.1 0.23 20 0.50 3.09 N # 511010 CH Guotai SSE 5Yr China Treasury Note ETF 889 - 0.00 - - - NN2F SP db x-trackers MSCI AC Asia Ex Jp dvd 5 0.0 0.43 - 0.65 1.12 N # XGLE SP db x-trackers II iBoxx € Sov. Eurozone 730 - 0.63 - 0.15 8.21 N1DIV TB ThaiDEX SET High dvd ETF 4 0.0 0.26 30 1.00 1.97 N # 153130 KS Samsung KODEX KRW Cash ETF 485 3.9 0.01 - 0.15 - NGrowth # SBIF SP ABF Singapore Bond Indx Fund 428 0.0 - - 0.20 0.14 N159906 CH Dacheng SZSE Grow th 40 Idx E 241 0.2 1.37 - - 2.63 N # 2819 HK ABF Hong Kong Bond Idx Fund 403 0.0 1.24 - 0.15 0.16 N510280 CH Fortune SGAM SSE 180 Grow th ETF 64 0.1 0.31 - - 0.74 N # 511880 CH Yinhua Traded Money Market Fund 360 - - - - - N
Sector Funds Style
Style
Fixed Income Funds
1 Option Liquidity (H / M / L / N - High / Medium / Low / None)2 / - Significant increase / decrease in shares outstanding in last one year
Asia-Pacific Listed ETFs
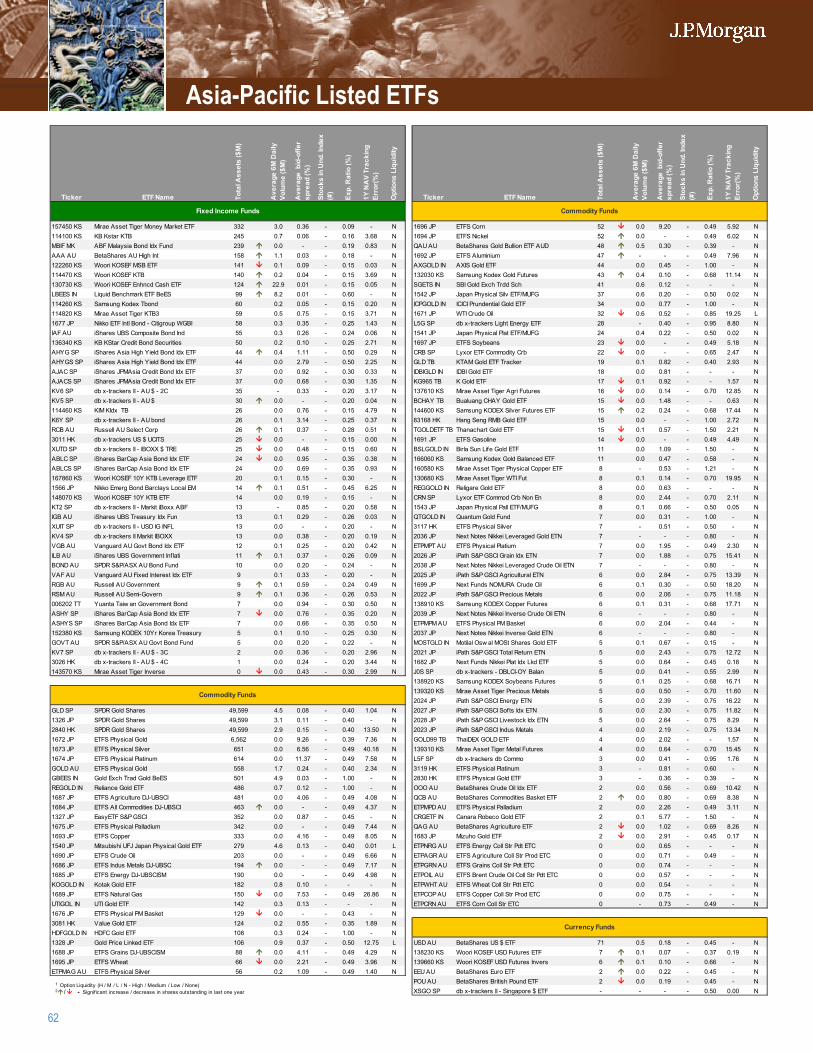
62
Ticker ETF Name Tota
l Ass
ets
($M
)
Ave
rage
6M
Dai
ly
Volu
me
($M
)
Ave
rage
bid
-offe
r sp
read
(%)
Stoc
ks in
Und
. Ind
ex
(#)
Exp.
Rat
io (%
)
1Y N
AV
Trac
king
Er
ror(
%)
Opt
ions
Liq
uidi
ty
Ticker ETF Name Tota
l Ass
ets
($M
)
Ave
rage
6M
Dai
ly
Volu
me
($M
)
Ave
rage
bid
-offe
r sp
read
(%)
Stoc
ks in
Und
. Ind
ex
(#)
Exp.
Rat
io (%
)
1Y N
AV
Trac
king
Er
ror(
%)
Opt
ions
Liq
uidi
ty
1
2
157450 KS Mirae Asset Tiger Money Market ETF 332 3.0 0.36 - 0.09 - N 3 1696 JP ETFS Corn 52 0.0 9.20 - 0.49 5.92 N114100 KS KB Kstar KTB 245 0.7 0.06 - 0.16 3.68 N 4 1694 JP ETFS Nickel 52 0.0 - - 0.49 6.02 NMBIF MK ABF Malaysia Bond Idx Fund 239 0.0 - - 0.19 0.83 N 5 QAU AU BetaShares Gold Bullion ETF AUD 48 0.5 0.30 - 0.39 - NAAA AU BetaShares AU High Int 158 1.1 0.03 - 0.18 - N 6 1692 JP ETFS Aluminium 47 - - - 0.49 7.96 N122260 KS Woori KOSEF MSB ETF 141 0.1 0.09 - 0.15 0.03 N 7 AXGOLD IN AXIS Gold ETF 44 0.0 0.45 - 1.00 - N114470 KS Woori KOSEF KTB 140 0.2 0.04 - 0.15 3.69 N 8 132030 KS Samsung Kodex Gold Futures 43 0.4 0.10 - 0.68 11.14 N130730 KS Woori KOSEF Enhncd Cash ETF 124 22.9 0.01 - 0.15 0.05 N 9 SGETS IN SBI Gold Exch Trdd Sch 41 0.6 0.12 - - - NLBEES IN Liquid Benchmark ETF BeES 99 8.2 0.01 - 0.60 - N # 1542 JP Japan Physical Silv ETF/MUFG 37 0.6 0.20 - 0.50 0.02 N114260 KS Samsung Kodex Tbond 60 0.2 0.05 - 0.15 0.20 N 11 ICPGOLD IN ICICI Prundential Gold ETF 34 0.0 0.77 - 1.00 - N114820 KS Mirae Asset Tiger KTB3 59 0.5 0.75 - 0.15 3.71 N # 1671 JP WTI Crude Oil 32 0.6 0.52 - 0.85 19.25 L1677 JP Nikko ETF Intl Bond - Citigroup WGBI 58 0.3 0.35 - 0.25 1.43 N # L5G SP db x-trackers Light Energy ETF 28 - 0.40 - 0.95 8.80 NIAF AU iShares UBS Composite Bond Ind 55 0.3 0.26 - 0.24 0.06 N # 1541 JP Japan Physical Plat ETF/MUFG 24 0.4 0.22 - 0.50 0.02 N136340 KS KB KStar Credit Bond Securities 50 0.2 0.10 - 0.25 2.71 N # 1697 JP ETFS Soybeans 23 0.0 - - 0.49 5.18 NAHYG SP iShares Asia High Yield Bond Idx ETF 44 0.4 1.11 - 0.50 0.29 N # CRB SP Lyxor ETF Commodity Crb 22 0.0 - - 0.65 2.47 NAHYGS SP iShares Asia High Yield Bond Idx ETF 44 0.0 2.79 - 0.50 2.25 N # GLD TB KTAM Gold ETF Tracker 19 0.1 0.82 - 0.40 2.93 NAJAC SP iShares JPMAsia Credit Bond Idx ETF 37 0.0 0.92 - 0.30 0.33 N # IDBIGLD IN IDBI Gold ETF 18 0.0 0.81 - - - NAJACS SP iShares JPMAsia Credit Bond Idx ETF 37 0.0 0.68 - 0.30 1.35 N # KG965 TB K Gold ETF 17 0.1 0.92 - - 1.57 NKV6 SP db x-trackers II - AU $ - 2C 35 - 0.33 - 0.20 3.17 N # 137610 KS Mirae Asset Tiger Agri Futures 16 0.0 0.14 - 0.70 12.85 NKV5 SP db x-trackers II - AU $ 30 0.0 - - 0.20 0.04 N # BCHAY TB Bualuang CHAY Gold ETF 15 0.0 1.48 - - 0.63 N114460 KS KIM KIdx TB 26 0.0 0.76 - 0.15 4.79 N # 144600 KS Samsung KODEX Silver Futures ETF 15 0.2 0.24 - 0.68 17.44 NK6Y SP db x-trackers II - AU bond 26 0.1 3.14 - 0.25 0.37 N # 83168 HK Hang Seng RMB Gold ETF 15 0.0 - - 1.00 2.72 NRCB AU Russell AU Select Corp 26 0.1 0.37 - 0.28 0.51 N # TGOLDETF TB Thanachart Gold ETF 15 0.1 0.57 - 1.50 2.21 N3011 HK db x-trackers US $ UCITS 25 0.0 - - 0.15 0.00 N # 1691 JP ETFS Gasoline 14 0.0 - - 0.49 4.49 NXUTD SP db x-trackers II - IBOXX $ TRE 25 0.0 0.48 - 0.15 0.60 N # BSLGOLD IN Birla Sun Life Gold ETF 11 0.0 1.09 - 1.50 - NABLC SP iShares BarCap Asia Bond Idx ETF 24 0.0 0.95 - 0.35 0.38 N # 166060 KS Samsung Kodex Gold Balanced ETF 11 0.0 0.47 - 0.58 - NABLCS SP iShares BarCap Asia Bond Idx ETF 24 0.0 0.69 - 0.35 0.93 N # 160580 KS Mirae Asset Tiger Physical Copper ETF 8 - 0.53 - 1.21 - N167860 KS Woori KOSEF 10Y KTB Leverage ETF 20 0.1 0.15 - 0.30 - N # 130680 KS Mirae Asset Tiger WTI Fut 8 0.1 0.14 - 0.70 19.95 N1566 JP Nikko Emerg Bond Barclays Local EM 14 0.1 0.51 - 0.45 6.25 N # REGGOLD IN Religare Gold ETF 8 0.0 0.63 - - - N148070 KS Woori KOSEF 10Y KTB ETF 14 0.0 0.19 - 0.15 - N # CRN SP Lyxor ETF Commod Crb Non En 8 0.0 2.44 - 0.70 2.11 NKT2 SP db x-trackers II - Markit iBoxx ABF 13 - 0.85 - 0.20 0.58 N # 1543 JP Japan Physical Pall ETF/MUFG 8 0.1 0.66 - 0.50 0.05 NIGB AU iShares UBS Treasury Idx Fun 13 0.1 0.29 - 0.26 0.03 N # QTGOLD IN Quantum Gold Fund 7 0.0 0.31 - 1.00 - NXUIT SP db x-trackers II - USD IG INFL 13 0.0 - - 0.20 - N # 3117 HK ETFS Physical Silver 7 - 0.51 - 0.50 - NKV4 SP db x-trackers II Markit IBOXX 13 0.0 0.38 - 0.20 0.19 N # 2036 JP Next Notes Nikkei Leveraged Gold ETN 7 - - - 0.80 - NVGB AU Vanguard AU Govt Bond Idx ETF 12 0.1 0.25 - 0.20 0.42 N # ETPMPT AU ETFS Physical Platium 7 0.0 1.95 - 0.49 2.30 NILB AU iShares UBS Government Inflati 11 0.1 0.37 - 0.26 0.09 N # 2026 JP iPath S&P GSCI Grain Idx ETN 7 0.0 1.88 - 0.75 15.41 NBOND AU SPDR S&P/ASX AU Bond Fund 10 0.0 0.20 - 0.24 - N # 2038 JP Next Notes Nikkei Leveraged Crude Oil ETN 7 - - - 0.80 - NVAF AU Vanguard AU Fixed Interest Idx ETF 9 0.1 0.33 - 0.20 - N # 2025 JP iPath S&P GSCI Agricultural ETN 6 0.0 2.84 - 0.75 13.39 NRGB AU Russell AU Government 9 0.1 0.59 - 0.24 0.49 N # 1699 JP Next Funds NOMURA Crude Oil 6 0.1 0.30 - 0.50 18.20 NRSM AU Russell AU Semi-Govern 9 0.1 0.36 - 0.26 0.53 N # 2022 JP iPath S&P GSCI Precious Metals 6 0.0 2.06 - 0.75 11.18 N006202 TT Yuanta Taiw an Government Bond 7 0.0 0.94 - 0.30 0.50 N # 138910 KS Samsung KODEX Copper Futures 6 0.1 0.31 - 0.68 17.71 NASHY SP iShares BarCap Asia Bond Idx ETF 7 0.0 0.76 - 0.35 0.20 N # 2039 JP Next Notes Nikkei Inverse Crude Oil ETN 6 - - - 0.80 - NASHYS SP iShares BarCap Asia Bond Idx ETF 7 0.0 0.66 - 0.35 0.50 N # ETPMPM AU ETFS Physical PM Basket 6 0.0 2.04 - 0.44 - N152380 KS Samsung KODEX 10Yr Korea Treasury 5 0.1 0.10 - 0.25 0.30 N # 2037 JP Next Notes Nikkei Inverse Gold ETN 6 - - - 0.80 - NGOVT AU SPDR S&P/ASX AU Govt Bond Fund 5 0.0 0.20 - 0.22 - N # MOSTGLD IN Motilal Osw al MOSt Shares Gold ETF 5 0.1 0.67 - 0.15 - NKV7 SP db x-trackers II - AU $ - 3C 2 0.0 0.36 - 0.20 2.96 N # 2021 JP iPath S&P GSCI Total Return ETN 5 0.0 2.43 - 0.75 12.72 N3026 HK db x-trackers II - AU $ - 4C 1 0.0 0.24 - 0.20 3.44 N # 1682 JP Next Funds Nikkei Plat Idx Lkd ETF 5 0.0 0.64 - 0.45 0.18 N143570 KS Mirae Asset Tiger Inverse 0 0.0 0.43 - 0.30 2.99 N # J0S SP db x-trackers - DBLCI-OY Balan 5 0.0 0.41 - 0.55 2.99 N
# 138920 KS Samsung KODEX Soybeans Futures 5 0.1 0.25 - 0.68 16.71 N# 139320 KS Mirae Asset Tiger Precious Metals 5 0.0 0.50 - 0.70 11.60 N# 2024 JP iPath S&P GSCI Energy ETN 5 0.0 2.39 - 0.75 16.22 N
GLD SP SPDR Gold Shares 49,599 4.5 0.08 - 0.40 1.04 N # 2027 JP iPath S&P GSCI Softs Idx ETN 5 0.0 2.30 - 0.75 11.82 N1326 JP SPDR Gold Shares 49,599 3.1 0.11 - 0.40 - N # 2028 JP iPath S&P GSCI Livestock Idx ETN 5 0.0 2.64 - 0.75 8.29 N2840 HK SPDR Gold Shares 49,599 2.9 0.15 - 0.40 13.50 N # 2023 JP iPath S&P GSCI Indus Metals 4 0.0 2.19 - 0.75 13.34 N1672 JP ETFS Physical Gold 6,562 0.0 9.26 - 0.39 7.36 N # GOLD99 TB ThaiDEX GOLD ETF 4 0.0 2.02 - - 1.57 N1673 JP ETFS Physical Silver 651 0.0 6.56 - 0.49 40.18 N # 139310 KS Mirae Asset Tiger Metal Futures 4 0.0 0.64 - 0.70 15.45 N1674 JP ETFS Physical Platinum 614 0.0 11.37 - 0.49 7.58 N # L5F SP db x-trackers db Commo 3 0.0 0.41 - 0.95 1.76 NGOLD AU ETFS Physical Gold 558 1.7 0.24 - 0.40 2.34 N # 3119 HK ETFS Physical Platinum 3 - 0.81 - 0.60 - NGBEES IN Gold Exch Trad Gold BeES 501 4.9 0.03 - 1.00 - N # 2830 HK ETFS Physical Gold ETF 3 - 0.36 - 0.39 - NREGOLD IN Reliance Gold ETF 486 0.7 0.12 - 1.00 - N # OOO AU BetaShares Crude Oil Idx ETF 2 0.0 0.56 - 0.69 10.42 N1687 JP ETFS Agriculture DJ-UBSCI 481 0.0 4.06 - 0.49 4.08 N # QCB AU BetaShares Commodities Basket ETF 2 0.0 0.80 - 0.69 8.38 N1684 JP ETFS All Commodities DJ-UBSCI 463 0.0 - - 0.49 4.37 N # ETPMPD AU ETFS Physical Palladium 2 0.0 2.26 - 0.49 3.11 N1327 JP EasyETF S&P GSCI 352 0.0 0.87 - 0.45 - N # CRGETF IN Canara Robeco Gold ETF 2 0.1 5.77 - 1.50 - N1675 JP ETFS Physical Palladium 342 0.0 - - 0.49 7.44 N # QAG AU BetaShares Agriculture ETF 2 0.0 1.02 - 0.69 8.26 N1693 JP ETFS Copper 333 0.0 4.16 - 0.49 8.05 N # 1683 JP Mizuho Gold ETF 2 0.0 2.91 - 0.45 0.17 N1540 JP Mitsubishi UFJ Japan Physical Gold ETF 279 4.6 0.13 - 0.40 0.01 L # ETPNRG AU ETFS Energy Coll Str Pdt ETC 0 0.0 0.65 - - - N1690 JP ETFS Crude Oil 203 0.0 - - 0.49 6.66 N # ETPAGR AU ETFS Agriculture Coll Str Prod ETC 0 0.0 0.71 - 0.49 - N1686 JP ETFS Indus Metals DJ-UBSC 194 0.0 - - 0.49 7.17 N # ETPGRN AU ETFS Grains Coll Str Pdt ETC 0 0.0 0.74 - - - N1685 JP ETFS Energy DJ-UBSCISM 190 0.0 - - 0.49 4.98 N # ETPOIL AU ETFS Brent Crude Oil Coll Str Pdt ETC 0 0.0 0.57 - - - NKOGOLD IN Kotak Gold ETF 182 0.8 0.10 - - - N # ETPWHT AU ETFS Wheat Coll Str Pdt ETC 0 0.0 0.54 - - - N1689 JP ETFS Natural Gas 150 0.0 7.53 - 0.49 26.86 N # ETPCOP AU ETFS Copper Coll Str Prod ETC 0 0.0 0.75 - - - NUTIGOL IN UTI Gold ETF 142 0.3 0.13 - - - N # ETPCRN AU ETFS Corn Coll Str ETC 0 - 0.73 - 0.49 - N1676 JP ETFS Physical PM Basket 129 0.0 - - 0.43 - N #
3081 HK Value Gold ETF 124 0.2 0.55 - 0.35 1.89 N #
HDFGOLD IN HDFC Gold ETF 108 0.3 0.24 - 1.00 - N #
1328 JP Gold Price Linked ETF 106 0.9 0.37 - 0.50 12.75 L # USD AU BetaShares US $ ETF 71 0.5 0.18 - 0.45 - N1688 JP ETFS Grains DJ-UBSCISM 88 0.0 4.11 - 0.49 4.29 N # 138230 KS Woori KOSEF USD Futures ETF 7 0.1 0.07 - 0.37 0.19 N1695 JP ETFS Wheat 66 0.0 2.21 - 0.49 3.96 N # 139660 KS Woori KOSEF USD Futures Invers 6 0.1 0.10 - 0.66 - NETPMAG AU ETFS Physical Silver 56 0.2 1.09 - 0.49 1.40 N # EEU AU BetaShares Euro ETF 2 0.0 0.22 - 0.45 - N
POU AU BetaShares British Pound ETF 2 0.0 0.19 - 0.45 - NXSGO SP db x-trackers II - Singapore $ ETF - - - - 0.50 0.00 N
Currency Funds
Fixed Income Funds Commodity Funds
Commodity Funds
1 Option Liquidity (H / M / L / N - High / Medium / Low / None)2 / - Significant increase / decrease in shares outstanding in last one year
Asia-Pacific Listed ETFs
63
Important Disclosures
This report is a product of the research department's Global Equity Derivatives and Delta One Strategy group. Views expressed may differ from the views of the research analysts covering stocks or sectors mentioned in this report. Structured securities, including inverse or leveraged ETFs, are considered to be complex instruments and may involve a high degree of risk. In evaluating any instrument discussed in this report, investors should evaluate, together with their advisers, whether the instruments discussed as appropriate for them. Certain of the instruments discussed in this report, including ETPs described in the report, may be appropriate investments only for sophisticated investors who are capable of understanding and assuming the risks involved. In addition, some of the ETFs discussed in the report are offered and sold publicly only outside the U.S. to persons that are not U.S. persons. J.P. Morgan Securities LLC (“JPM”) acts as authorized participant for substantially all U.S.-listed ETFs, including, without limitation, those mentioned in the attached Report. As such, JPM may earn commissions and transaction based compensation in connection with the distribution of these ETF shares and may earn fees for performing other trade-related services, such as securities lending to short sellers of the ETF shares. JPM may also perform services for the ETFs themselves, including acting as broker or dealer to the ETFs. In addition, affiliates of JPM perform services for the ETFs, including trust, custodial, administration, lending, index calculation and/or maintenance and other services. In addition, foreign affiliates of JPM act as authorized participant for ETF series funds, including those (i) listed in South Korea and managed by Samsung Asset Mgt Management, Woori Asset Management and Korea Investment Trust Management; (ii) listed in Japan and managed by BlackRock; (iii) listed in Australia and managed by BlackRock and Vanguard; (iv) listed in Hong Kong and managed by BlackRock, Ping An and EIS; (v) listed in Europe, the Middle East or Africa and managed by BlackRock, Lyxor, Deutsche Bank AG and/or one or more of its affiliates, ETFS Metal Securities Limited and Source. As a result of these relationships, JPM may be incented to positively recommend the ETFs discussed in the Report, and readers should evaluate any recommendations made in light of those relationships. JPM and/or its affiliates or employees, including the authors of this report, have or may have a long or short position in or hold securities, options, swaps and other related instruments on the ETFs mentioned herein as well as in the underlying portfolio securities or instruments. INVESTORS MAY OBTAIN PROSPECTUSES FOR EXCHANGE TRADED FUNDS (“ETFs”) FROM THE PARTICULAR ETF’S DISTRIBUTOR. AN INVESTOR SHOULD CAREFULLY CONSIDER THE CONFLICTS OF INTEREST DESCRIBED ABOVE AS WELL AS THE INVESTMENT OBJECTIVES, RISKS AND CHARGES AND EXPENSES OF AN ETF BEFORE INVESTING. EACH ETF’S PROSPECTUS CONTAINS MORE COMPLETE, IMPORTANT INFORMATION ABOUT THE ETF, INCLUDING WHETHER JPM OR ITS AFFILIATES ACT AS CUSTODIAN OR INDEX LICENSOR FOR THE ETF, AND SHOULD BE READ CAREFULLY BEFORE INVESTING. Risks associated with Leveraged and Inverse ETFs: Leveraged ETFs seek to provide a multiple of the investment returns of a given index or benchmark on a daily basis. Inverse ETFs seek to provide the opposite, or multiple times the opposite, of the daily returns, of an underlying index or benchmark. Leveraged and inverse ETFs usually reset daily and track their intended indices on a daily basis, but may fail to correlate over longer periods. Due to the effects of compounding and possible correlation errors, leveraged and inverse ETFs may experience greater losses than expected. Compounding can also cause a widening differential between the performance of an ETF and its underlying index or benchmark so that returns over periods longer than one day can differ in amount and direction from the target return of the same period. Consequently, these ETFs may experience losses even in situations where the underlying index or benchmark has performed as expected. Leveraged and inverse ETFs use aggressive investment techniques such as futures, forward contracts, swap agreements, derivatives and options that may increase ETF volatility and may cause a drag on performance. Investors holding these ETFs should therefore monitor their positions frequently -- i.e., in most cases, daily -- to look for possible divergences. Leveraged and inverse ETFs may not be suitable for all investors and should be used only by knowledgeable investors who understand the potential consequences of their strategies, including seeking daily leverage or daily inverse leveraged investment results. The Financial Industry Regulatory Authority has indicated that, in its view, inverse and leveraged ETFs that are reset daily typically are unsuitable for retail investors who plan to hold them for longer than one trading session, particularly in volatile markets. Accordingly, prior to investing in these instruments, all potential investors and, particularly, retail investors, should evaluate whether the instruments are suitable for them in light of their risk tolerance and investment horizon, carefully read the prospectus and consult with a financial professional as needed. INVESTORS SHOULD NOT INVEST IN THESE INSTRUMENTS UNLESS THEY FULLY UNDERSTAND AND HAVE EVALUATED THE RISKS AND HAVE, INDEPENDENTLY OF JPM, DETERMINED THAT THE INVESTMENT IS SUITABLE FOR THEM.
Other Risks & Disclosures
Possible Risks of Investing in ETFs The following is an incomplete list of possible risks of investing in ETFs. Not all of the risks will apply to each investment in ETFs and the applicable risks will depend on the particular ETFs invested in and the particular facts and circumstances and investment objectives of the individual investor. Commodities Risk. Certain ETFs invest in commodities. The commodities industries can be significantly affected by the level and volatility of commodity prices; world events including international monetary and political developments; import controls and worldwide competition; exploration and production spending; and tax and other government regulations and economic conditions. Concentration Risk. An ETF may, at various times, concentrate in the securities of a particular industry, group of industries, or sector, and when a fund is overweighted in an industry, group of industries, or sector, it may be more sensitive to any single economic, business, political, or regulatory occurrence than a fund that is not overweighted in an industry, group of industries, or sector. Costs of Investing in Underlying ETFs. Certain ETFs invest in other ETFs, and will bear a pro rata portion of the underlying ETFs’ expenses (including operating costs and management fees). Credit Risk. An ETF could be subject to the risk that a decline in the credit quality of a portfolio investment could cause the ETF’s share price to fall. The ETF could lose money if the issuer or guarantor of a portfolio investment or the counterparty to a derivatives contract fails to make timely principal or interest payments or otherwise honor its obligations. Early Closing Risk. An unanticipated early closing of the exchange on which an ETF’s shares trade may result in a shareholder’s inability to buy or sell shares of the ETF on that day. Emerging Markets Risk. There is an increased risk of price volatility associated with an ETF’s investments in emerging market countries, which may be magnified by currency fluctuations relative to the U.S. dollar. Equity Risk. The prices of equity securities in which an ETF may invest rise and fall daily. These price movements may result from factors affecting individual companies, industries or the securities market as a whole. Fixed Income Risk. An ETF’s investments in fixed income securities are subject to the risk that the securities may be paid off earlier or later than expected. Either situation could cause the ETF to hold securities paying lower-than-market rates of interest, which could hurt the ETF’s yield or share price. Foreign Currency Risk
. Currency movements may negatively impact the value of an ETF’s underlying securities, even when there is no change in the value of the security in the issuer’s home country.
64
Foreign Securities Risk. An ETF’s investments in securities of foreign issuers involve certain risks including, but not limited to, risks of adverse changes in foreign economic, political, regulatory and other conditions, or changes in currency exchange rates or exchange control regulations (including limitations on currency movements and exchanges). In certain countries, legal remedies available to investors may be more limited than those available with respect to investments in the United States. In addition, the securities of some foreign companies may be less liquid and, at times, more volatile than securities of comparable U.S. companies. High Yield Risk. Certain ETFs may invest in high yield securities and unrated securities of similar credit quality (commonly known as “junk bonds”). High yield securities generally pay higher yields (greater income) than investment in higher quality securities; however, high yield securities and junk bonds may be subject to greater levels of interest rate, credit and liquidity risk than funds that do not invest in such securities, and are considered predominantly speculative with respect to an issuer’s continuing ability to make principal and interest payments. Income Risk. An ETF may derive dividend and interest income from certain of its investments. This income can vary widely over the short- and long-term. If prevailing market interest rates drop, distribution rates of an ETF’s income producing investments may decline, which then may adversely affect the ETF’s value. Interest Rate Risk. An ETF’s investments in fixed income securities are subject to the risk that interest rates rise and fall over time. Investment RiskJurisdiction US-listed ETFs may not be marketed to foreign investors in certain jurisdictions, and vice versa.
. An investment in an ETF is not a bank deposit and is not insured or guaranteed by the Federal Deposit Insurance Corporation or any other government agency.
Liquidity Risk. The market for certain investments may become illiquid under adverse or volatile market or economic conditions, making those investments difficult to sell. The market price of certain investments may fall dramatically if there is no liquid trading market. The lack of liquidity in an ETF can result in its value being more volatile than its underlying portfolio securities. Loss of Money. Loss of money is a risk of investing in an ETF. Market Risk. Due to market conditions, an ETF’s investments may fluctuate significantly from day to day. This volatility may cause the value of your investment in the Fund to decrease. Strategy Risk. ETFs use different strategies, all of which are associated with different risks. For example, an equities-based ETF may use a large-capitalization, mid-capitalization, small-capitalization or other type of strategy. Tracking Error Risk. Although many ETFs may seek to match the returns of an index, an ETF’s return may not match or achieve a high degree of correlation with the return of its applicable index. Trading Risks
Risks of Common Option Strategies
. An ETF faces numerous market trading risks, including the potential lack of an active market for its shares, losses from trading in secondary markets, and disruption in the creation/redemption process of the ETF. Any of these factors may lead to the ETF’s shares trading at a premium or discount to net asset value (“NAV”), which may be material. In certain markets, ETF prices have dropped precipitously and experienced greater volatility than prices of other stocks.
Risks to Strategies: Not all option strategies are suitable for investors; certain strategies may expose investors to significant potential losses. We have summarized the risks of selected derivative strategies. For additional risk information, please call your sales representative for a copy of “Characteristics and Risks of Standardized Options.” We advise investors to consult their tax advisors and legal counsel about the tax implications of these strategies. Please also refer to option risk disclosure documents. Put Sale. Investors who sell put options will own the underlying asset if the asset’s price falls below the strike price of the put option. Investors, therefore, will be exposed to any decline in the underlying asset’s price below the strike potentially to zero, and they will not participate in any price appreciation in the underlying asset if the option expires unexercised. Call Sale. Investors who sell uncovered call options have exposure on the upside that is theoretically unlimited. Call Overwrite or Buywrite. Investors who sell call options against a long position in the underlying asset give up any appreciation in the underlying asset’s price above the strike price of the call option, and they remain exposed to the downside of the underlying asset in the return for the receipt of the option premium. Booster. In a sell-off, the maximum realized downside potential of a double-up booster is the net premium paid. In a rally, option losses are potentially unlimited as the investor is net short a call. When overlaid onto a long position in the underlying asset, upside losses are capped (as for a covered call), but downside losses are not. Collar. Locks in the amount that can be realized at maturity to a range defined by the put and call strike. If the collar is not costless, investors risk losing 100% of the premium paid. Since investors are selling a call option, they give up any price appreciation in the underlying asset above the strike price of the call option. Call Purchase. Options are a decaying asset, and investors risk losing 100% of the premium paid if the underlying asset’s price is below the strike price of the call option. Put Purchase. Options are a decaying asset, and investors risk losing 100% of the premium paid if the underlying asset’s price is above the strike price of the put option. Straddle or Strangle. The seller of a straddle or strangle is exposed to increases in the underlying asset’s price above the call strike and declines in the underlying asset’s price below the put strike. Since exposure on the upside is theoretically unlimited, investors who also own the underlying asset would have limited losses should the underlying asset rally. Covered writers are exposed to declines in the underlying asset position as well as any additional exposure should the underlying asset decline below the strike price of the put option. Having sold a covered call option, the investor gives up all appreciation in the underlying asset above the strike price of the call option. Put Spread. The buyer of a put spread risks losing 100% of the premium paid. The buyer of higher-ratio put spread has unlimited downside below the lower strike (down to zero), dependent on the number of lower-struck puts sold. The maximum gain is limited to the spread between the two put strikes, when the underlying is at the lower strike. Investors who own the underlying asset will have downside protection between the higher-strike put and the lower-strike put. However, should the underlying asset’s price fall below the strike price of the lower-strike put, investors regain exposure to the underlying asset, and this exposure is multiplied by the number of puts sold. Call Spread. The buyer risks losing 100% of the premium paid. The gain is limited to the spread between the two strike prices. The seller of a call spread risks losing an amount equal to the spread between the two call strikes less the net premium received. By selling a covered call spread, the investor remains exposed to the downside of the underlying asset and gives up the spread between the two call strikes should the underlying asset rally. Butterfly Spread. A butterfly spread consists of two spreads established simultaneously – one a bull spread and the other a bear spread. The resulting position is neutral, that is, the investor will profit if the underlying is stable. Butterfly spreads are established at a net debit. The maximum profit will occur at the middle strike price; the maximum loss is the net debit. Pricing Is Illustrative Only: Prices quoted in the above trade ideas are our estimate of current market levels, and are not indicative trading levels. Risks of Security Futures Transactions Trading security futures contracts may not be suitable for all investors. You may lose a substantial amount of money in a very short period of time. The amount you may lose is potentially unlimited and can exceed the amount you originally deposit with your broker. This is because futures trading is highly leveraged, with a relatively small amount of money used to establish a position in assets having a much greater value. If you are uncomfortable with this level of risk, you should not trade security futures contracts. General Risks Trading security futures contracts involves risk and may result in potentially unlimited losses that are greater than the amount you deposited with your broker. As with any high risk financial product, you should not risk any funds that you cannot afford to lose, such as your retirement savings, medical and other emergency funds, funds set aside for purposes such as education or home ownership, proceeds from student loans or mortgages, or funds required to meet your living expenses. Be cautious of claims that you can make large profits from trading security futures contracts. Although the high degree of leverage in security futures contracts can result in large and immediate gains, it can also result in large and immediate losses. As with any financial product, there is no such thing as a “sure winner.”
65
Because of the leverage involved and the nature of security futures contract transactions, you may feel the effects of your losses immediately. Gains and losses in security futures contracts are credited or debited to your account, at a minimum, on a daily basis. If movements in the markets for security futures contracts or the underlying security decrease the value of your positions in security futures contracts, you may be required to have or make additional funds available to your carrying firm as margin. If your account is under the minimum margin requirements set by the exchange or the brokerage firm, your position may be liquidated at a loss, and you will be liable for the deficit, if any, in your account. Margin requirements are addressed in Section 4. Under certain market conditions, it may be difficult or impossible to liquidate a position. Generally, you must enter into an offsetting transaction in order to liquidate a position in a security futures contract. If you cannot liquidate your position in a security futures contracts, you may not be able to realize a gain in the value of your position or prevent losses from mounting. This inability to liquidate could occur, for example, if trading is halted due to unusual trading activity in either the security futures contract or the underlying security; if trading is halted due to recent news events involving the issuer of the underlying security; if systems failures occur on an exchange or at the firm carrying your position; or if the position is on an illiquid market. Even if you can liquidate your position, you may be forced to do so at a price that involves a large loss. Under certain market conditions, it may also be difficult or impossible to manage your risk from open security futures positions by entering into an equivalent but opposite position in another contract month, on another market, or in the underlying security. This inability to take positions to limit your risk could occur, for example, if trading is halted across markets due to unusual trading activity in the security futures contract or the underlying security or due to recent news events involving the issuer of the underlying security. Under certain market conditions, the prices of security futures contracts may not maintain their customary or anticipated relationships to the prices of the underlying security or index. These pricing disparities could occur, for example, when the market for the security futures contract is illiquid, when the primary market for the underlying security is closed, or when the reporting of transactions in the underlying security has been delayed. For index products, it could also occur when trading is delayed or halted in some or all of the securities that make up the index. You may be required to settle certain security futures contracts with physical delivery of the underlying security. If you hold your position in a physically settled security futures contract until the end of the last trading day prior to expiration, you will be obligated to make or take delivery of the underlying securities, which could involve additional costs. The actual settlement terms may vary from contract to contract and exchange to exchange. You should carefully review the settlement and delivery conditions before entering into a security futures contract. Settlement and delivery are discussed in Section 5. You may experience losses due to systems failures. As with any financial transaction, you may experience losses if your orders for security futures contracts cannot be executed normally due to systems failures on a regulated exchange or at the brokerage firm carrying your position. Your losses may be greater if the brokerage firm carrying your position does not have adequate back-up systems or procedures. All security futures contracts involve risk, and there is no trading strategy that can eliminate it. Strategies using combinations of positions, such as spreads, may be as risky as outright long or short positions. Trading in security futures contracts requires knowledge of both the securities and the futures markets. Day trading strategies involving security futures contracts and other products pose special risks. As with any financial product, persons who seek to purchase and sell the same security future in the course of a day to profit from intra-day price movements (“day traders”) face a number of special risks, including substantial commissions, exposure to leverage, and competition with professional traders. You should thoroughly understand these risks and have appropriate experience before engaging in day trading. The special risks for day traders are discussed more fully in Section 7. Placing contingent orders, if permitted, such as “stop-loss” or “stop-limit” orders, will not necessarily limit your losses to the intended amount. Some regulated exchanges may permit you to enter into stop-loss or stop-limit orders for security futures contracts, which are intended to limit your exposure to losses due to market fluctuations. However, market conditions may make it impossible to execute the order or to get the stop price. You should thoroughly read and understand the customer account agreement with your brokerage firm before entering into any transactions in security futures contracts. You should thoroughly understand the regulatory protections available to your funds and positions in the event of the failure of your brokerage firm. The regulatory protections available to your funds and positions in the event of the failure of your brokerage firm may vary depending on, among other factors, the contract you are trading and whether you are trading through a securities account or a futures account. Firms that allow customers to trade security futures in either securities accounts or futures accounts, or both, are required to disclose to customers the differences in regulatory protections between such accounts, and, where appropriate, how customers may elect to trade in either type of account. Other Disclosures
J.P. Morgan ("JPM") is the global brand name for J.P. Morgan Securities LLC ("JPMS") and its affiliates worldwide. J.P. Morgan Cazenove is a marketing name for the U.K. investment banking businesses and EMEA cash equities and equity research businesses of JPMorgan Chase & Co. and its subsidiaries. Options related research: If the information contained herein regards options related research, such information is available only to persons who have received the proper option risk disclosure documents. For a copy of the Option Clearing Corporation's Characteristics and Risks of Standardized Options, please contact your J.P. Morgan Representative or visit the OCC's website at http://www.optionsclearing.com/publications/risks/riskstoc.pdf Important Disclosures MSCI: The MSCI sourced information is the exclusive property of Morgan Stanley Capital International Inc. (MSCI). Without prior written permission of MSCI, this information and any other MSCI intellectual property may not be reproduced, redisseminated or used to create any financial products, including any indices. This information is provided on an 'as is' basis. The user assumes the entire risk of any use made of this information. MSCI, its affiliates and any third party involved in, or related to, computing or compiling the information hereby expressly disclaim all warranties of originality, accuracy, completeness, merchantability or fitness for a particular purpose with respect to any of this information. Without limiting any of the foregoing, in no event shall MSCI, any of its affiliates or any third party involved in, or related to, computing or compiling the information have any liability for any damages of any kind. MSCI, Morgan Stanley Capital International and the MSCI indexes are services marks of MSCI and its affiliates. Company-Specific Disclosures: Important disclosures, including price charts, are available for compendium reports and all J.P. Morgan–covered companies by visiting https://mm.jpmorgan.com/disclosures/company, calling 1-800-477-0406, or e-mailing [email protected] with your request. J.P. Morgan’s Strategy, Technical, and Quantitative Research teams may screen companies not covered by J.P. Morgan. For important disclosures for these companies, please call 1-800-477-0406 or e-mail [email protected]. Legal Entities Disclosures U.S.: JPMS is a member of NYSE, FINRA, SIPC and the NFA. JPMorgan Chase Bank, N.A. is a member of FDIC and is authorized and regulated in the UK by the Financial Services Authority. U.K.: J.P. Morgan Securities plc (JPMS plc) is a member of the London Stock Exchange and is authorized and regulated by the Financial Services Authority. Registered in England & Wales No. 2711006. Registered Office 25 Bank Street, London, E14 5JP. South Africa: J.P. Morgan Equities South Africa Proprietary Limited is a member of the Johannesburg Securities Exchange and is regulated by the Financial Services Board. Hong Kong: J.P. Morgan Securities (Asia Pacific) Limited (CE number AAJ321) is regulated by the Hong Kong Monetary Authority and the Securities and Futures Commission in Hong Kong. Korea: J.P. Morgan Securities (Far East) Ltd, Seoul Branch, is regulated by the Korea Financial Supervisory Service. Australia: J.P. Morgan Australia Limited (JPMAL) (ABN 52 002 888 011/AFS Licence No: 238188) is regulated by ASIC and J.P. Morgan Securities Australia Limited (JPMSAL) (ABN 61 003 245 234/AFS Licence No: 238066) is regulated by ASIC and is a Market, Clearing and Settlement Participant of ASX Limited and CHI-X. Taiwan: J.P.Morgan Securities (Taiwan) Limited is a participant of the Taiwan Stock Exchange (company-type) and regulated by the Taiwan Securities and Futures Bureau. India: J.P. Morgan India Private Limited, having its registered office at J.P. Morgan Tower, Off. C.S.T. Road, Kalina, Santacruz East, Mumbai - 400098, is a member of the National Stock Exchange of India Limited (SEBI Registration Number - INB 230675231/INF 230675231/INE 230675231) and Bombay Stock Exchange Limited (SEBI Registration Number - INB 010675237/INF 010675237) and is regulated by Securities and Exchange Board of India. Thailand: JPMorgan Securities (Thailand) Limited is a member of the Stock Exchange of Thailand and is regulated by the Ministry of Finance and the Securities and Exchange Commission. Indonesia: PT J.P. Morgan Securities Indonesia is a member of the Indonesia Stock Exchange and is
1 Unlike mutual funds, however, ETFs are not redeemed by general holders. Moreover, unlike mutual funds, which must be transferred at their net asset values, ETFs trade at market prices which may differ from their NAVs. Similarly, unlike most stocks, most ETFs are in continuous offering. 2 Unlike the exemption that was previously available for short sales of ETFs in Rule 10a-1 under Securities Exchange Act of 1934 under current Rule 201 of Regulation SHO, ETFs are deemed to be “covered securities” and, thus, subject to the price tests developed by exchanges for execution of short sales upon price decreases of 10% or more from the prior day’s close price. In addition, although ETFs are marginable securities, broker-dealers are restricted from providing financing on the shares under Section 11(d)(1) of the Securities Exchange Act of 1934 if the broker-dealer or its affiliates or personnel receive compensation or economic benefit to promote or sell the ETF. 3 There are many factors which could impact this; one factor depends on how creation and redemption baskets are structured, 4 ETFs that are formed under the Investment Company Act of 1940 and qualify as “RICs” for tax purposes make distributions that are treated as ordinary dividends which, in general, reflects such RICs’ receipt of dividends and interest from its investments and gains from its short-term capital gain transactions. Long-term capital gain distributions are also distributed to shareholders reflecting such RICs’ long-term capital gains from disposition of investments. ETFs taxable as RICs typically make distributions on a quarterly basis, but in all events, at least annually, in order to distribute all of their ordinary and capital gain distributions to avoid an otherwise applicable excise tax. ETFs formed as grantor trusts, which include metal-based ETFs, generally do not make distributions and income and expenses are treated as if investors directly owned the underlying metals. Other types of ETFs (such as commodity-linked ETFs formed as limited partnerships) distribute earnings in accordance with general tax rules applicable to that type of entity. 5 ETF shares can be created on a T+3 basis provided to the authorized participant delivers in payment for the ETF shares the portfolio basket underlying an aggregation of ETF shares (known as a “creation unit”) whose size is specified by the issuer, as described below as well as a designated amount of cash. 6 ETFs that are subject to cash creation and redemption also require such creations and redemptions to be carried out through an authorized participant in creation unit size. Although there are designated market makers for ETFs on exchanges, some ETFs trade infrequently and have sizeable spreads between the bid and ask prices. ETF issuers have complained for a number of years that market makers need to be incented to make tighter spreads. The NASDAQ and NYSE Arca reportedly are preparing rules that seek to overturn existing rules that prohibit payments by an issuer to a market maker to reduce spreads. The SEC has not yet disclosed whether they would support these rules. 7 “Style-based” ETFs are those structured to provide investors an investment vehicle based on investing style (e.g., value, growth or a combination). International ETFs refer generally to ETFs investing in securities based on geographic focus. 8 Source:J.P. Morgan Securities, Bloomberg 9 Actively managed ETFs are included in our list of ETFs. Out of 132 US listed ETFs issued in 2009, 8 US listed ETFs are actively managed. Out of 217 ETFs issued in 2010, 11 ETFs are actively managed. In 2011, 9 out of 296 newly issued are actively managed. Overall, there are 44 actively managed US listed ETFs. In our entire universe of ETFs, there are 56 actively managed ETFs (44 in US, 11 in EMEA and 1 in Asia). 10 An ETC is an investment vehicle, including a type of fund, partnership, trust or other collective investment entity, that tracks the performance of an underlying commodity or basket of commodities. It is a variation on ETFs. “Single commodity ETCs” typically follow the spot-price of a single commodity, whereas “index-tracking ETCs” follow the movement of an index or grouping of commodities, such as futures on oil or livestock.
Exchange Traded Funds – ETFs regulated by the BAPEPAM LK. Philippines: J.P. Morgan Securities Philippines Inc. is a Trading Participant of the Philippine Stock Exchange and a member of the Securities Clearing Corporation of the Philippines and the Securities Investor Protection Fund. It is regulated by the Securities and Exchange Commission. Brazil: Banco J.P. Morgan S.A. is regulated by Comissao de Valores Mobiliarios (CVM) and by the Central Bank of Brazil. Mexico: J.P. Morgan Casa de Bolsa, S.A. de C.V., J.P. Morgan Grupo Financiero is a member of the Mexican Stock Exchange and authorized to act as a broker dealer by the National Banking and Securities Exchange Commission. Singapore: This material is issued and distributed in Singapore by J.P. Morgan Securities Singapore Private Limited (JPMSS) [MICA (P) 049/04/2013 and Co. Reg. No.: 199405335R] which is a member of the Singapore Exchange Securities Trading Limited and is regulated by the Monetary Authority of Singapore (MAS) and/or JPMorgan Chase Bank, N.A., Singapore branch (JPMCB Singapore) which is regulated by the MAS. Japan: JPMorgan Securities Japan Co., Ltd. is regulated by the Financial Services Agency in Japan. Malaysia: This material is issued and distributed in Malaysia by JPMorgan Securities (Malaysia) Sdn Bhd (18146-X) which is a Participating Organization of Bursa Malaysia Berhad and a holder of Capital Markets Services License issued by the Securities Commission in Malaysia. Pakistan: J. P. Morgan Pakistan Broking (Pvt.) Ltd is a member of the Karachi Stock Exchange and regulated by the Securities and Exchange Commission of Pakistan. Saudi Arabia: J.P. Morgan Saudi Arabia Ltd. is authorized by the Capital Market Authority of the Kingdom of Saudi Arabia (CMA) to carry out dealing as an agent, arranging, advising and custody, with respect to securities business under licence number 35-07079 and its registered address is at 8th Floor, Al-Faisaliyah Tower, King Fahad Road, P.O. Box 51907, Riyadh 11553, Kingdom of Saudi Arabia. Dubai: JPMorgan Chase Bank, N.A., Dubai Branch is regulated by the Dubai Financial Services Authority (DFSA) and its registered address is Dubai International Financial Centre - Building 3, Level 7, PO Box 506551, Dubai, UAE. Country and Region Specific Disclosures U.K. and European Economic Area (EEA): Unless specified to the contrary, issued and approved for distribution in the U.K. and the EEA by JPMS plc. Investment research issued by JPMS plc has been prepared in accordance with JPMS plc's policies for managing conflicts of interest arising as a result of publication and distribution of investment research. Many European regulators require a firm to establish, implement and maintain such a policy. This report has been issued in the U.K. only to persons of a kind described in Article 19 (5), 38, 47 and 49 of the Financial Services and Markets Act 2000 (Financial Promotion) Order 2005 (all such persons being referred to as "relevant persons"). This document must not be acted on or relied on by persons who are not relevant persons. Any investment or investment activity to which this document relates is only available to relevant persons and will be engaged in only with relevant persons. In other EEA countries, the report has been issued to persons regarded as professional investors (or equivalent) in their home jurisdiction. Australia: This material is issued and distributed by JPMSAL in Australia to "wholesale clients" only. This material does not take into account the specific investment objectives, financial situation or particular needs of the recipient. The recipient of this material must not distribute it to any third party or outside Australia without the prior written consent of JPMSAL. For the purposes of this paragraph the term "wholesale client" has the meaning given in section 761G of the Corporations Act 2001. Germany: This material is distributed in Germany by J.P. Morgan Securities plc, Frankfurt Branch and J.P.Morgan Chase Bank, N.A., Frankfurt Branch which are regulated by the Bundesanstalt für Finanzdienstleistungsaufsicht. Hong Kong: The 1% ownership disclosure as of the previous month end satisfies the requirements under Paragraph 16.5(a) of the Hong Kong Code of Conduct for Persons Licensed by or Registered with the Securities and Futures Commission. (For research published within the first ten days of the month, the disclosure may be based on the month end data from two months prior.) J.P. Morgan Broking (Hong Kong) Limited is the liquidity provider/market maker for derivative warrants, callable bull bear contracts and stock options listed on the Stock Exchange of Hong Kong Limited. An updated list can be found on HKEx website: http://www.hkex.com.hk. Japan: There is a risk that a loss may occur due to a change in the price of the shares in the case of share trading, and that a loss may occur due to the exchange rate in the case of foreign share trading. In the case of share trading, JPMorgan Securities Japan Co., Ltd., will be receiving a brokerage fee and consumption tax (shouhizei) calculated by multiplying the executed price by the commission rate which was individually agreed between JPMorgan Securities Japan Co., Ltd., and the customer in advance. Financial Instruments Firms: JPMorgan Securities Japan Co., Ltd., Kanto Local Finance Bureau (kinsho) No. 82 Participating Association / Japan Securities Dealers Association, The Financial Futures Association of Japan, Type II Financial Instruments Firms Association and Japan Investment Advisers Association. Korea: This report may have been edited or contributed to from time to time by affiliates of J.P. Morgan Securities (Far East) Ltd, Seoul Branch. Singapore: JPMSS and/or its affiliates may have a holding in any of the securities discussed in this report; for securities where the holding is 1% or greater, the specific holding is disclosed in the Important Disclosures section above. India: For private circulation only, not for sale. Pakistan: For private circulation only, not for sale. New Zealand: This material is issued and distributed by JPMSAL in New Zealand only to persons whose principal business is the investment of money or who, in the course of and for the purposes of their business, habitually invest money. JPMSAL does not issue or distribute this material to members of "the public" as determined in accordance with section 3 of the Securities Act 1978. The recipient of this material must not distribute it to any third party or outside New Zealand without the prior written consent of JPMSAL. Canada: The information contained herein is not, and under no circumstances is to be construed as, a prospectus, an advertisement, a public offering, an offer to sell securities described herein, or solicitation of an offer to buy securities described herein, in Canada or any province or territory thereof. Any offer or sale of the securities described herein in Canada will be made only under an exemption from the requirements to file a prospectus with the relevant Canadian securities regulators and only by a dealer properly registered under applicable securities laws or, alternatively, pursuant to an exemption from the dealer registration requirement in the relevant province or territory of Canada in which such offer or sale is made. The information contained herein is under no circumstances to be construed as investment advice in any province or territory of Canada and is not tailored to the needs of the recipient. To the extent that the information contained herein references securities of an issuer incorporated, formed or created under the laws of Canada or a province or territory of Canada, any trades in such securities must be conducted through a dealer registered in Canada. No securities commission or similar regulatory authority in Canada has reviewed or in any way passed judgment upon these materials, the information contained herein or the merits of the securities described herein, and any representation to the contrary is an offence. Dubai: This report has been issued to persons regarded as professional clients as defined under the DFSA rules. Brazil: Ombudsman J.P. Morgan: 0800-7700847 / [email protected]. General: Additional information is available upon request. Information has been obtained from sources believed to be reliable but JPMorgan Chase & Co. or its affiliates and/or subsidiaries (collectively J.P. Morgan) do not warrant its completeness or accuracy except with respect to any disclosures relative to JPMS and/or its affiliates and the analyst's involvement with the issuer that is the subject of the research. All pricing is as of the close of market for the securities discussed, unless otherwise stated. Opinions and estimates constitute our judgment as of the date of this material and are subject to change without notice. Past performance is not indicative of future results. This material is not intended as an offer or solicitation for the purchase or sale of any financial instrument. The opinions and recommendations herein do not take into account individual client circumstances, objectives, or needs and are not intended as recommendations of particular securities, financial instruments or strategies to particular clients. The recipient of this report must make its own independent decisions regarding any securities or financial instruments mentioned herein. JPMS distributes in the U.S. research published by non-U.S. affiliates and accepts responsibility for its contents. Periodic updates may be provided on companies/industries based on company specific developments or announcements, market conditions or any other publicly available information. Clients should contact analysts and execute transactions through a J.P. Morgan subsidiary or affiliate in their home jurisdiction unless governing law permits otherwise. "Other Disclosures" last revised May 4, 2013.
Copyright 2013 JPMorgan Chase & Co. All rights reserved. This report or any portion hereof may not be reprinted, sold or redistributed without the written consent of J.P. Morgan.
Global Quantitative and Derivatives Strategy
Global Head Marko Kolanovic Americas J.P. Morgan Securities LLC Europe J.P. Morgan Securities plc Marko Kolanovic [email protected] Derivatives Strategy Davide Silvestrini [email protected] Derivatives Strategy Bram Kaplan [email protected] Derivatives Strategy Peng Cheng [email protected] Derivatives Strategy AJ Mehra [email protected] Derivatives Strategy Carmen Firescu [email protected] Derivatives Strategy Dubravko Lakos-Bujas [email protected] Quantitative Strategy Marco Dion [email protected] Quantitative Strategy David (Sang) Han [email protected] Quantitative Strategy Viquar Shaikh [email protected] Quantitative Strategy Min Moon [email protected] Index Research Angelo Pessaris [email protected] Quantitative Strategy Asia J.P. Morgan Securities (Asia Pacific) Limited Ruy Ribeiro [email protected] Rule-based Strategies Tony Lee [email protected] Derivatives Strategy Rahil Iqbal [email protected] Index Research Michiro Naito [email protected] Derivatives Strategy Sahil Manocha [email protected] Index Research Sue Lee [email protected] Derivatives Strategy . Haoshun Liu [email protected] Derivatives Strategy India J.P. Morgan India Private Limited Robert Smith [email protected] Quantitative Strategy Pankaj Gupta Latha Nair Christopher Ma [email protected] Quantitative Strategy Rishabh Khandelwal Vivek Shah