Embed Size (px)
Citation preview
State of the Nation for Exchange Traded Funds (ETFs)
Trevor CummingsVice President

2
Growth of Exchange-Traded Funds Worldwide
0
200
400
600
800
1000
1200
1400
1600
1800
2000
220019
93
1994
1995
1996
1997
1998
1999
2000
2001
2002
2003
2004
2005
2006
2007
2008
2009
2010
Q1
2011
ETF Assets Total ($M) 0.8 1 2 5 8 18 40 74 105 142 212 310 412 566 797 710 1,032 1,311
ETF Commodity AssetsETF Fixed Income AssetsETF Equity Assets
# of ETFs
Growth of Exchange-Traded Funds Worldwide
Source: ETF Landscape, Industry Highlights, Q1 2011, BlackRock Canada.

3
U.S. Exchange Traded Products - Assets Under Management
U.S. Exchange Traded Products - Assets Under Management
45%
27%
17%
10% 1%
Domestic Equity
International Equity
Fixed Income
Commodities
Currency
Source: BlackRock Asset Management Canada Limited. Data as of 31 August 2010

4
Canada ETFs - Assets Under Management
Canada ETFs - Assets Under Management
61%11%
22%
4%0%
Domestic Equity
International Equity
Fixed Income
Commodities
Balanced
Source: BlackRock Asset Management Canada Limited. Data as of 29 April 2011
5
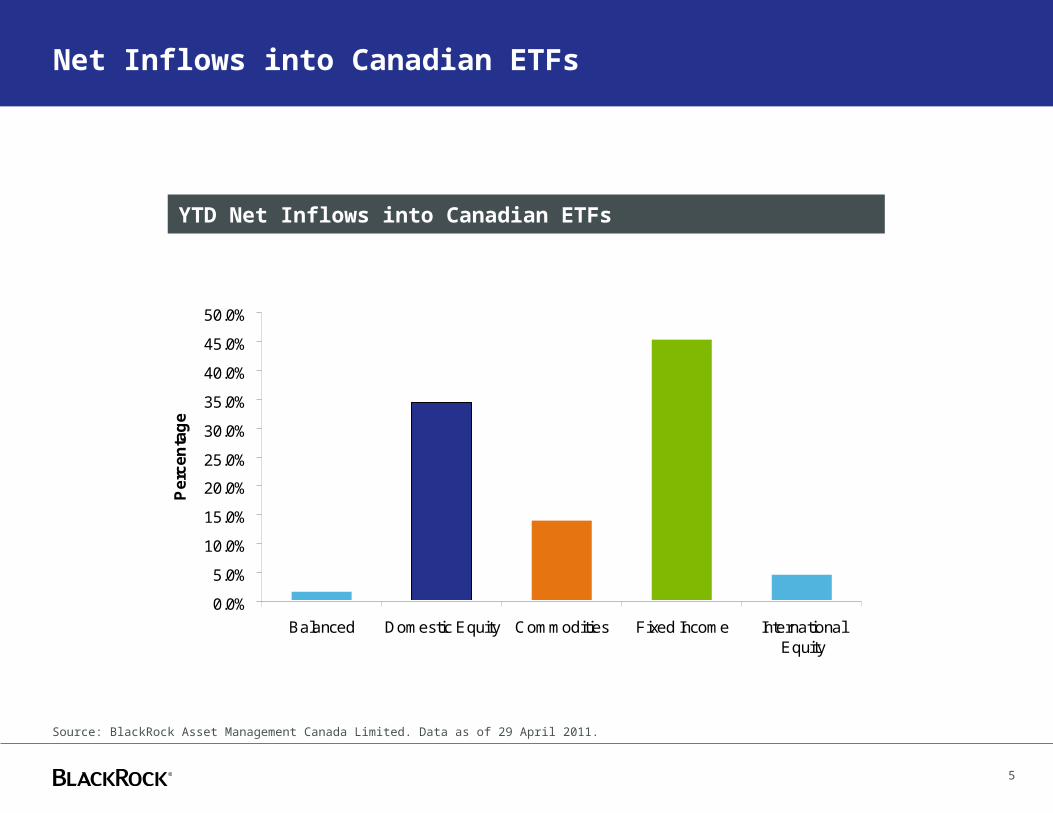
Net Inflows into Canadian ETFs
YTD Net Inflows into Canadian ETFs
Source: BlackRock Asset Management Canada Limited. Data as of 29 April 2011.
0.0%
5.0%
10.0%
15.0%
20.0%
25.0%
30.0%
35.0%
40.0%
45.0%
50.0%
Balanced Domestic Equity Commodities Fixed Income InternationalEquity
Pe
rce
nta
ge
Why Have Investors Embraced ETFs?
Portfolio Applications
7
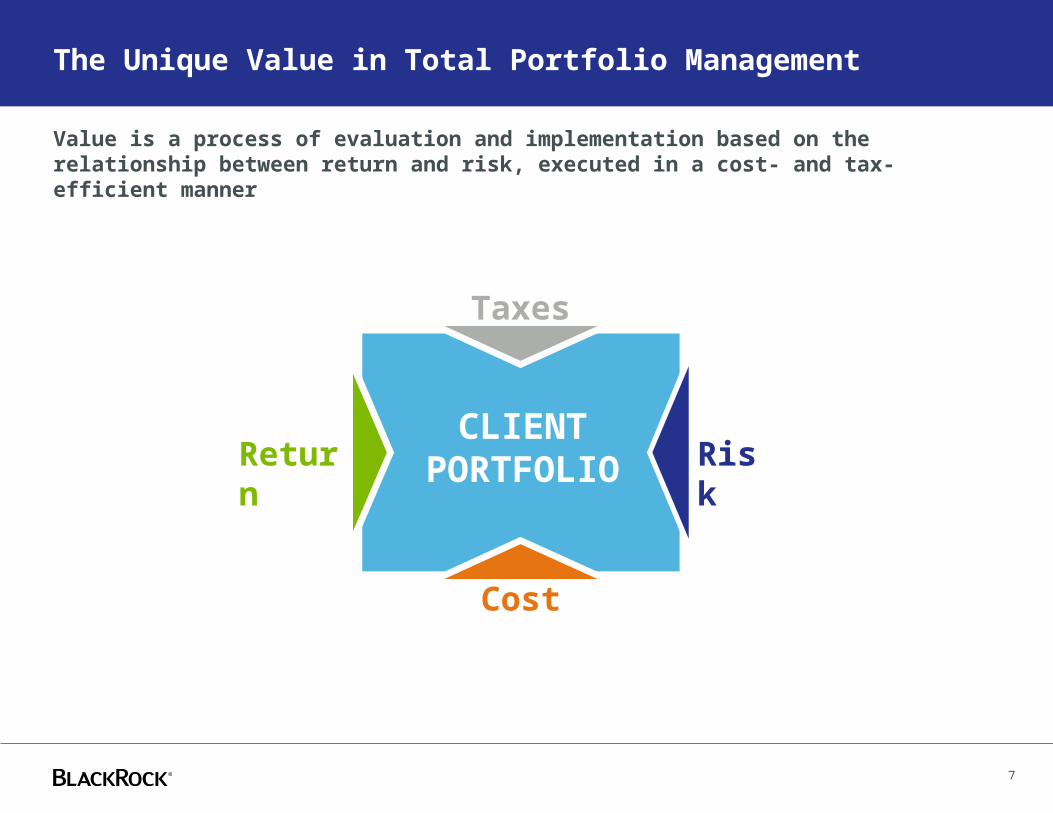
The Unique Value in Total Portfolio Management
Value is a process of evaluation and implementation based on the relationship between return and risk, executed in a cost- and tax-efficient manner
Cost
RiskReturn
Taxes
CLIENT PORTFOLIO

8
Investment Needs and Familiarity with ETFs
31
47
16
16
64
45
40
22
19
13
20
15
36
20
47
34
71
64
21
19
40
0% 20% 40% 60% 80% 100%
$750k+
$500k-$750k
65+
51-64
35-50
Under 35
Total
Very familiar Somewhat familiar Not very familiar
“How familiar are you with exchange traded funds or ETFs? Please tell us using a
scale of one to nine where one means not at all familiar and nine means very familiar.”
Source: The Gandalf Group
9
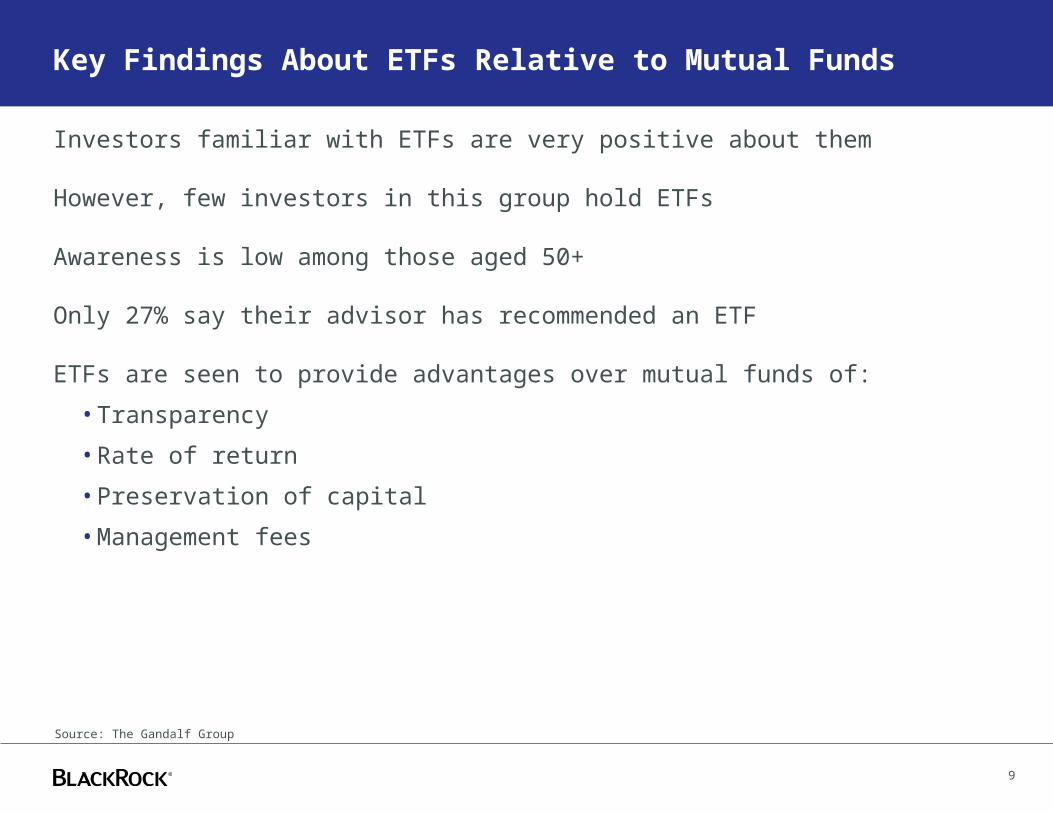
Key Findings About ETFs Relative to Mutual Funds
Investors familiar with ETFs are very positive about them
However, few investors in this group hold ETFs
Awareness is low among those aged 50+
Only 27% say their advisor has recommended an ETF
ETFs are seen to provide advantages over mutual funds of:
• Transparency
• Rate of return
• Preservation of capital
• Management fees
9
Source: The Gandalf Group

10
ETFs Mutual Funds
Hold baskets of securities
Obliged to distribute portfolio gains to shareholders
Trade on exchanges intraday at market price, which may be greater or less than Net Asset Value (NAV)
Shares are not individually redeemed from the fund
Transactions in shares of ETFs result in brokerage commissions and generate tax consequences
ETFs generally seek to track a market index, before fees and expenses
Accessed directly from the fund company or through a select broker and pricing generally occurs once a day
Investors buy or redeem shares at the end-of-day net asset value, less any applicable fees
Some mutual funds may charge sales loads or redemption fees
Most mutual funds are actively managed, seeking to outperform market indexes
ETFs and mutual funds: various differences

11
How To Take Advantage of ETFs Immediately?
• Fixed Income
• Active/Passive Mix
• Tactical Rotation Strategy
Fixed Income
13
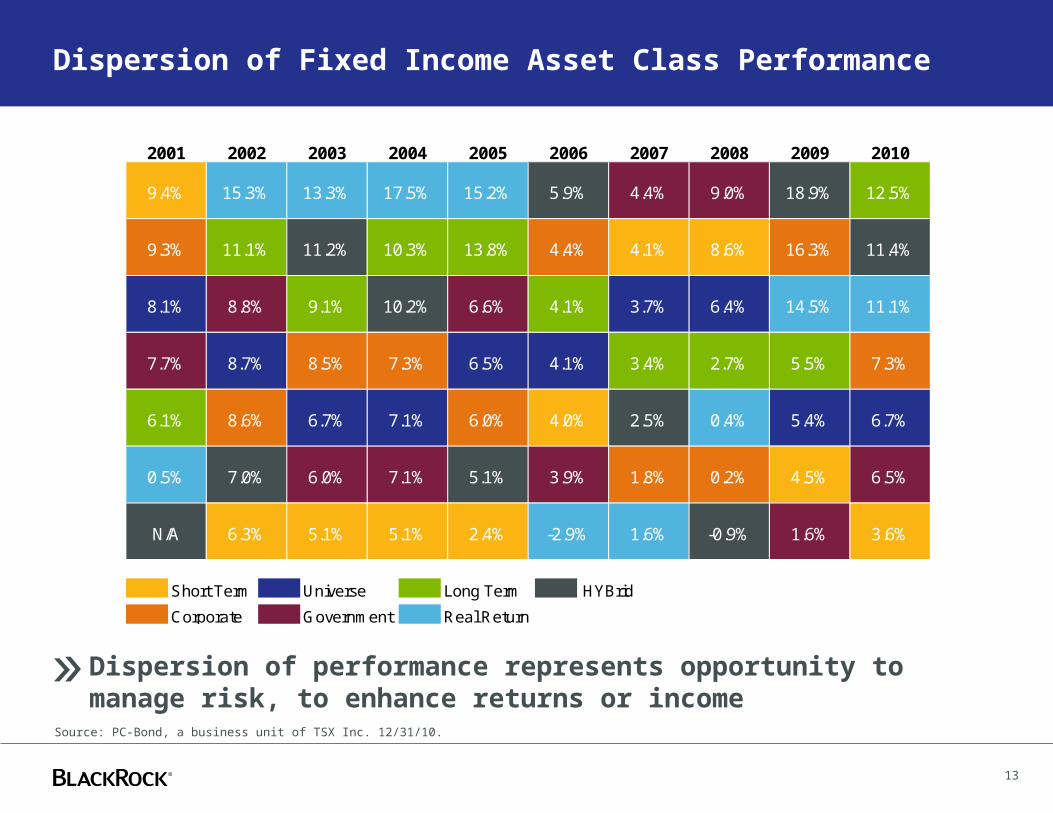
Dispersion of Fixed Income Asset Class Performance
2001 2002 2003 2004 2005 2006 2007 2008 2009 2010
9.4% 15.3% 13.3% 17.5% 15.2% 5.9% 4.4% 9.0% 18.9% 12.5%
9.3% 11.1% 11.2% 10.3% 13.8% 4.4% 4.1% 8.6% 16.3% 11.4%
8.1% 8.8% 9.1% 10.2% 6.6% 4.1% 3.7% 6.4% 14.5% 11.1%
7.7% 8.7% 8.5% 7.3% 6.5% 4.1% 3.4% 2.7% 5.5% 7.3%
6.1% 8.6% 6.7% 7.1% 6.0% 4.0% 2.5% 0.4% 5.4% 6.7%
0.5% 7.0% 6.0% 7.1% 5.1% 3.9% 1.8% 0.2% 4.5% 6.5%
N/A 6.3% 5.1% 5.1% 2.4% -2.9% 1.6% -0.9% 1.6% 3.6%
Dispersion of performance represents opportunity to manage risk, to enhance returns or income
Source: PC-Bond, a business unit of TSX Inc. 12/31/10.
Short Term Universe Long Term HYBrid
Corporate Government Real Return

14
Use the building blocks to exploit the opportunities
Over the past 5 years, sector returns within the index hover around 5.5%
The dispersion over shorter periods offers the opportunity to achieve higher returns
ETF Index Total Returns (%)
Source: PC-Bond, a business unit of TSX Inc. Data for month ending 29 April 2011.
-2.0% 0.0% 2.0% 4.0% 6.0% 8.0% 10.0% 12.0% 14.0%
Government
Real Return
Universe
Short
Long
Corporate
Hybrid
YTD 1 YR 5 YR

15
Duration Management
Alter the duration of a portfolio: • Efficiently adjust risk to reflect your market view – increase to reflect bullish fixed income
market sentiment or reduce to implement defensive position• Portfolio of several iShares ETFs with different duration
Du
rati
on
Increasing DurationDecreasing Duration
10
9
8
7
6
5
4
3
2
1
0
Core Bond Portfolio
iShares DEX Short Term Bond Index Fund (XSB)
iShares DEX Long Term Index Fund (XLB)
Adjust duration exposure to manage interest rate risk
16
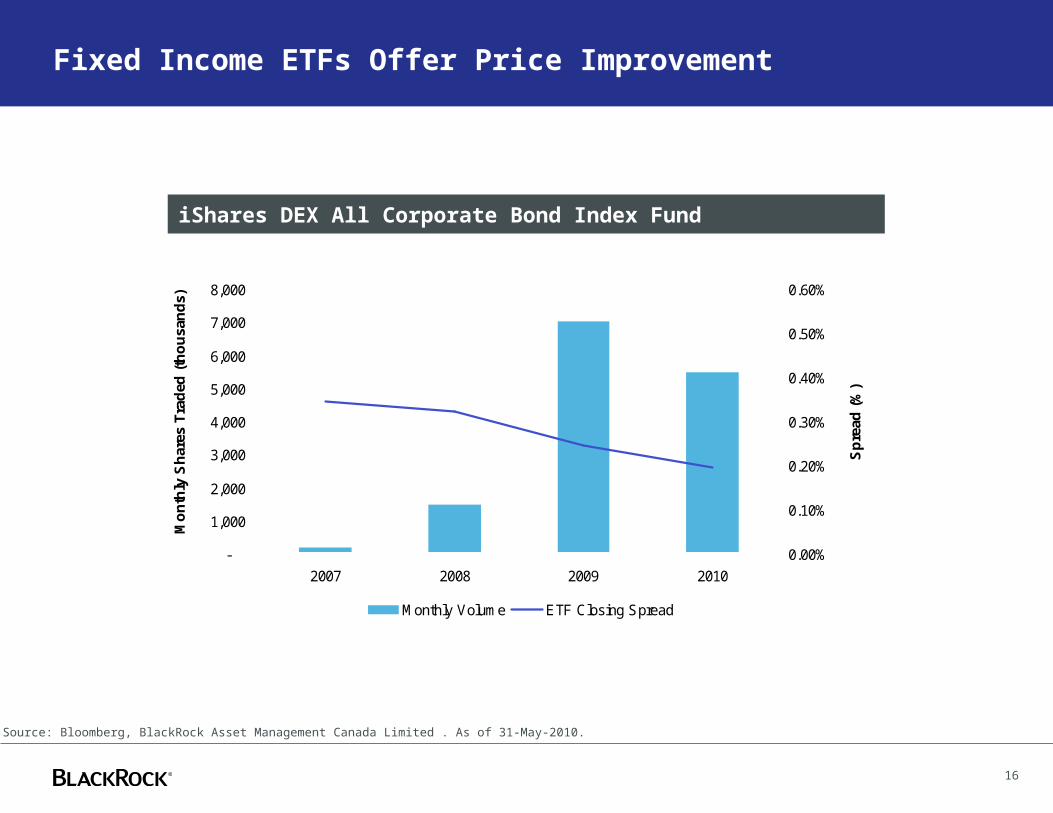
iShares DEX All Corporate Bond Index Fund
Fixed Income ETFs Offer Price Improvement
-
1,000
2,000
3,000
4,000
5,000
6,000
7,000
8,000
2007 2008 2009 2010
Mo
nth
ly S
har
es T
rad
ed (
tho
usa
nd
s)
0.00%
0.10%
0.20%
0.30%
0.40%
0.50%
0.60%
Sp
read
(%
)
Monthly Volume ETF Closing Spread
Source: Bloomberg, BlackRock Asset Management Canada Limited . As of 31-May-2010.
17
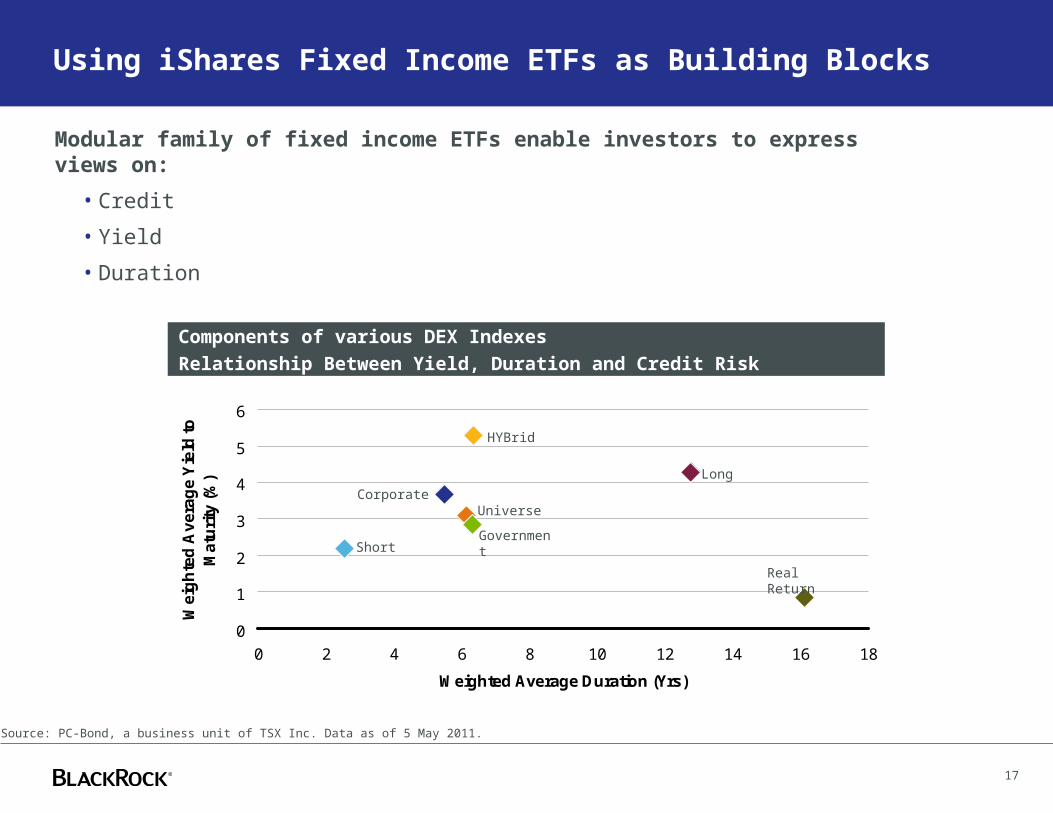
Using iShares Fixed Income ETFs as Building Blocks
Modular family of fixed income ETFs enable investors to express views on:
• Credit
• Yield
• Duration
Components of various DEX Indexes
Relationship Between Yield, Duration and Credit Risk
Source: PC-Bond, a business unit of TSX Inc. Data as of 5 May 2011.
0
1
2
3
4
5
6
0 2 4 6 8 10 12 14 16 18
Weighted Average Duration (Yrs)
We
igh
ted
Av
era
ge
Yie
ld t
o
Ma
turi
ty (
%)
Government
Long
HYBrid
Real Return
Short
UniverseCorporate
18
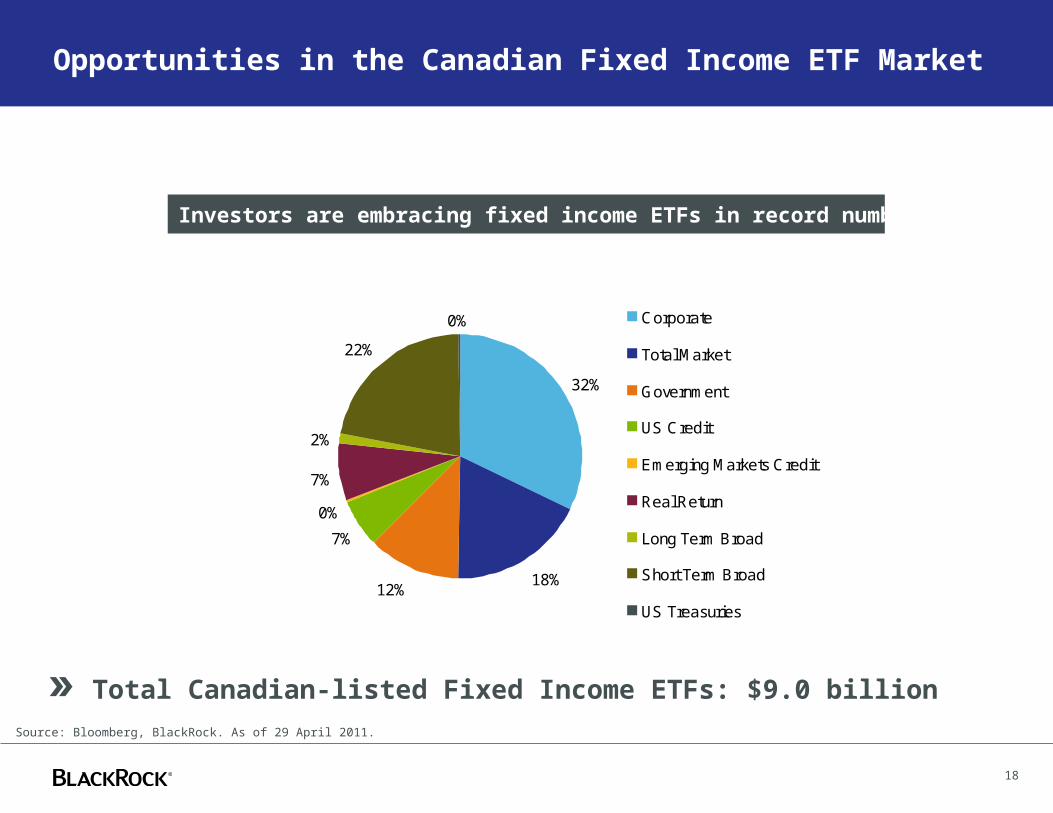
Opportunities in the Canadian Fixed Income ETF Market
Total Canadian-listed Fixed Income ETFs: $9.0 billion
Investors are embracing fixed income ETFs in record numbers
Source: Bloomberg, BlackRock. As of 29 April 2011.
32%
18%
7%
0%
7%
2%
22%
0%
12%
Corporate
Total Market
Government
US Credit
Emerging Markets Credit
Real Return
Long Term Broad
Short Term Broad
US Treasuries

Active & Passive
20
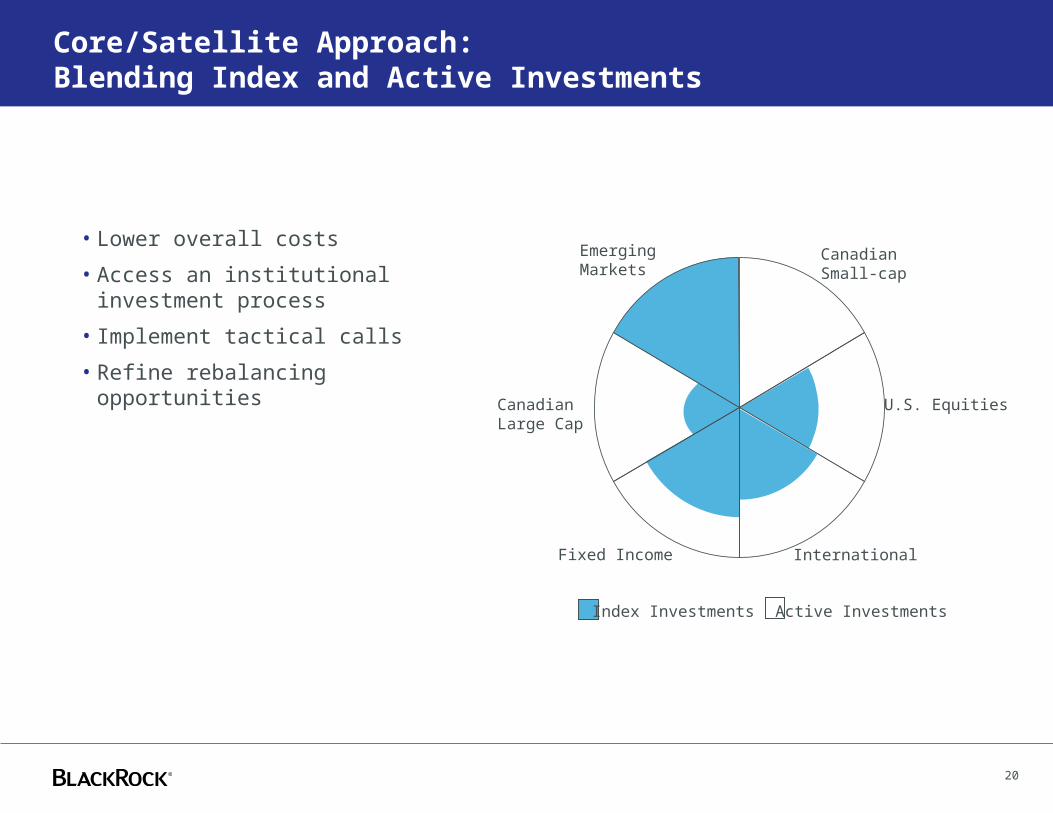
Core/Satellite Approach:Blending Index and Active Investments
• Lower overall costs
• Access an institutional investment process
• Implement tactical calls
• Refine rebalancing opportunities
Index Investments Active Investments
Canadian Small-cap
Emerging Markets
U.S. Equities
International Fixed Income
Canadian Large Cap
21
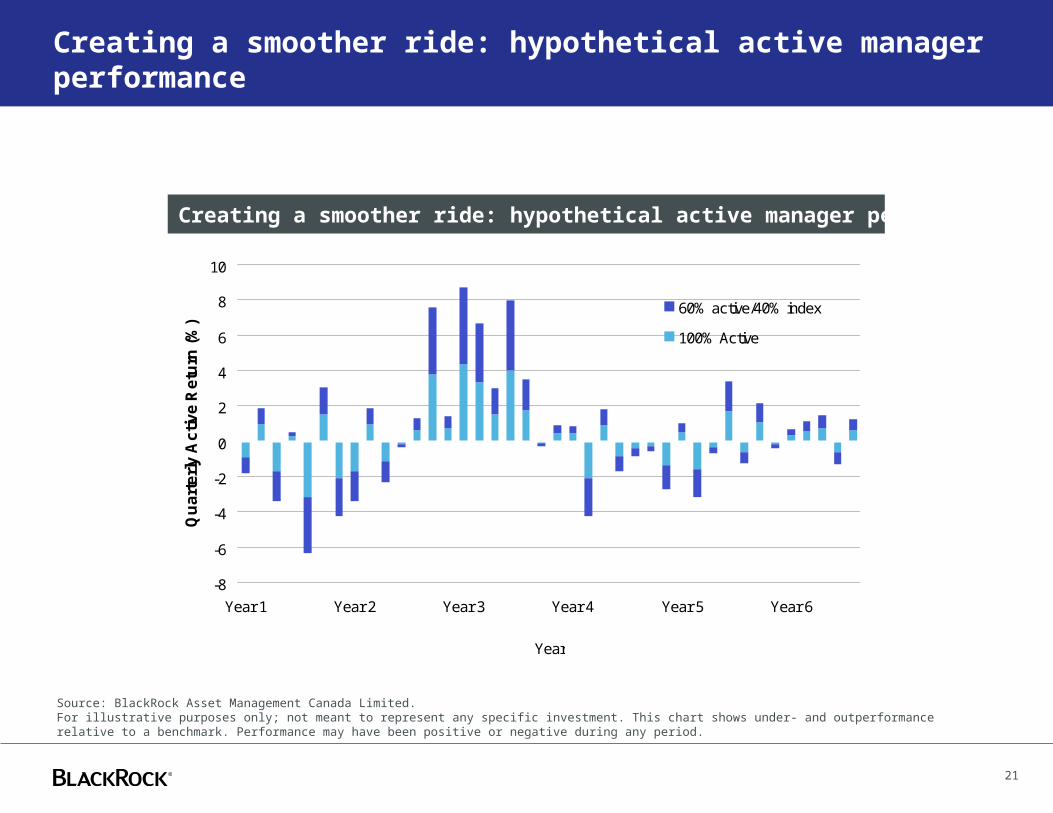
Creating a smoother ride: hypothetical active manager performance
-8
-6
-4
-2
0
2
4
6
8
10
Year 1 Year 2 Year 3 Year 4 Year 5 Year 6
Year
Qu
art
erl
y A
cti
ve
Re
turn
(%
)
60% active/40% index
100% Active
Creating a smoother ride: hypothetical active manager performance
Source: BlackRock Asset Management Canada Limited.For illustrative purposes only; not meant to represent any specific investment. This chart shows under- and outperformance relative to a benchmark. Performance may have been positive or negative during any period.

Tactical Rotation Strategy
23
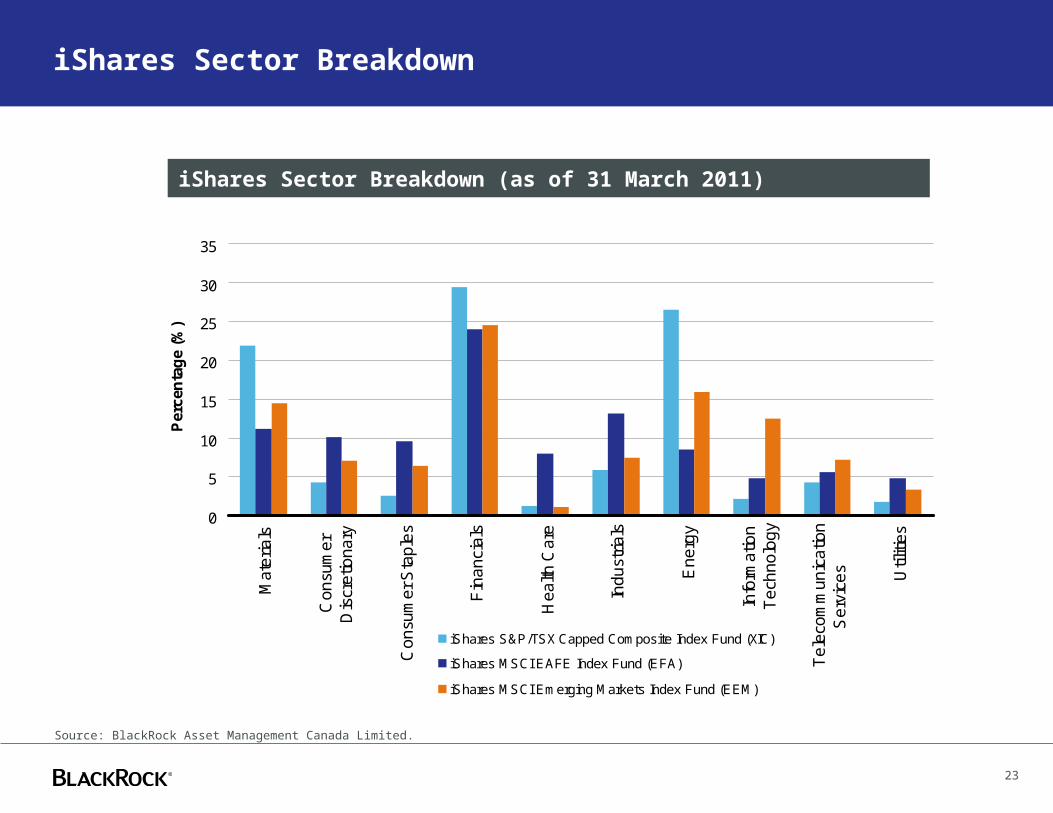
iShares Sector Breakdown
iShares Sector Breakdown (as of 31 March 2011)
Source: BlackRock Asset Management Canada Limited.
0
5
10
15
20
25
30
35M
ate
ria
ls
Co
nsu
me
rD
iscr
etio
na
ry
Co
nsu
me
r S
tap
les
Fin
an
cia
ls
He
alth
Ca
re
Ind
ust
ria
ls
En
erg
y
Info
rma
tion
Te
chn
olo
gy
Te
leco
mm
un
ica
tion
Se
rvic
es Util
itie
s
Per
cen
tag
e (%
)
iShares S&P/TSX Capped Composite Index Fund (XIC)
iShares MSCI EAFE Index Fund (EFA)
iShares MSCI Emerging Markets Index Fund (EEM)
24
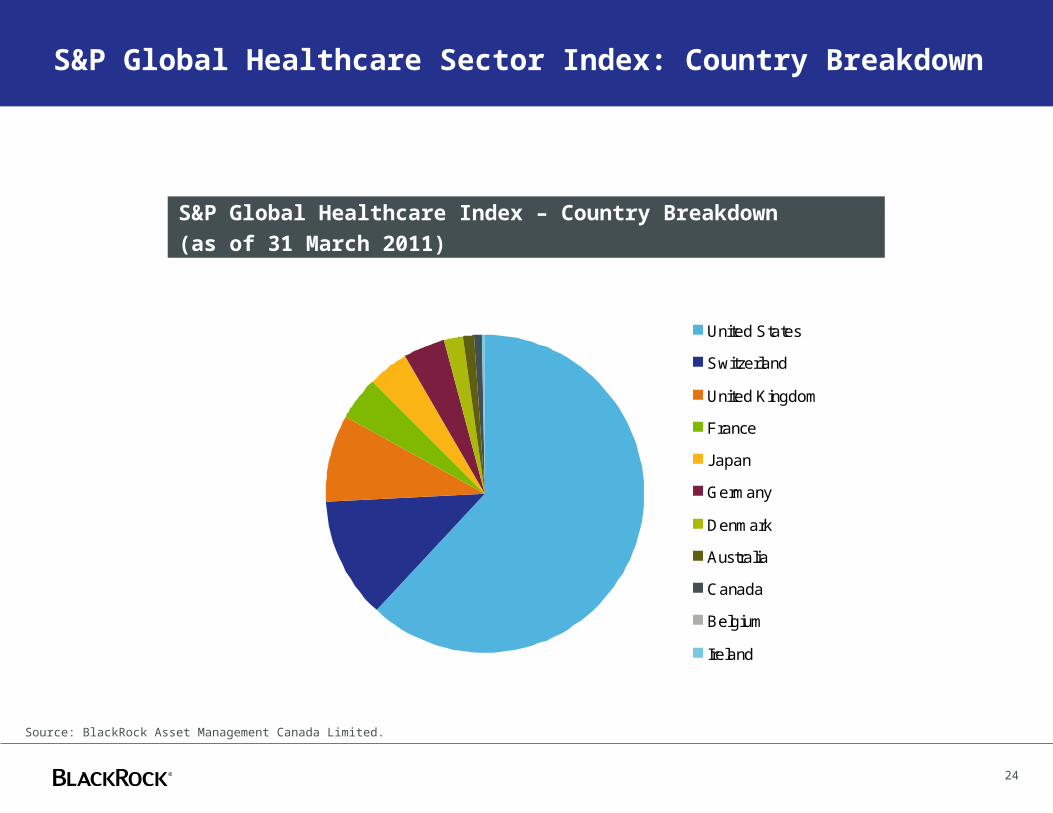
S&P Global Healthcare Sector Index: Country Breakdown
S&P Global Healthcare Index – Country Breakdown
(as of 31 March 2011)
Source: BlackRock Asset Management Canada Limited.
United States
Switzerland
United Kingdom
France
Japan
Germany
Denmark
Australia
Canada
Belgium
Ireland
25
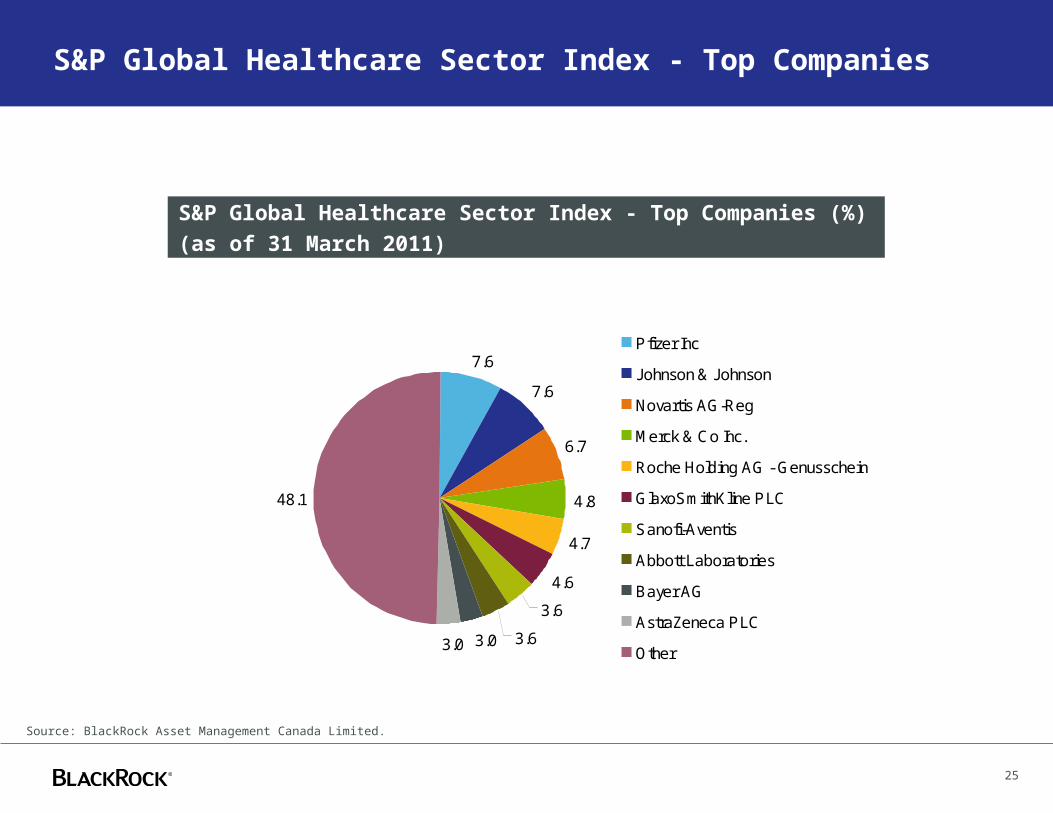
S&P Global Healthcare Sector Index - Top Companies
S&P Global Healthcare Sector Index - Top Companies (%)
(as of 31 March 2011)
Source: BlackRock Asset Management Canada Limited.
7.6
7.6
6.7
4.8
4.7
4.6
3.6
3.63.03.0
48.1
Pfizer Inc
Johnson & Johnson
Novartis AG-Reg
Merck & Co Inc.
Roche Holding AG - Genusschein
GlaxoSmithKline PLC
Sanofi-Aventis
Abbott Laboratories
Bayer AG
AstraZeneca PLC
Other
26
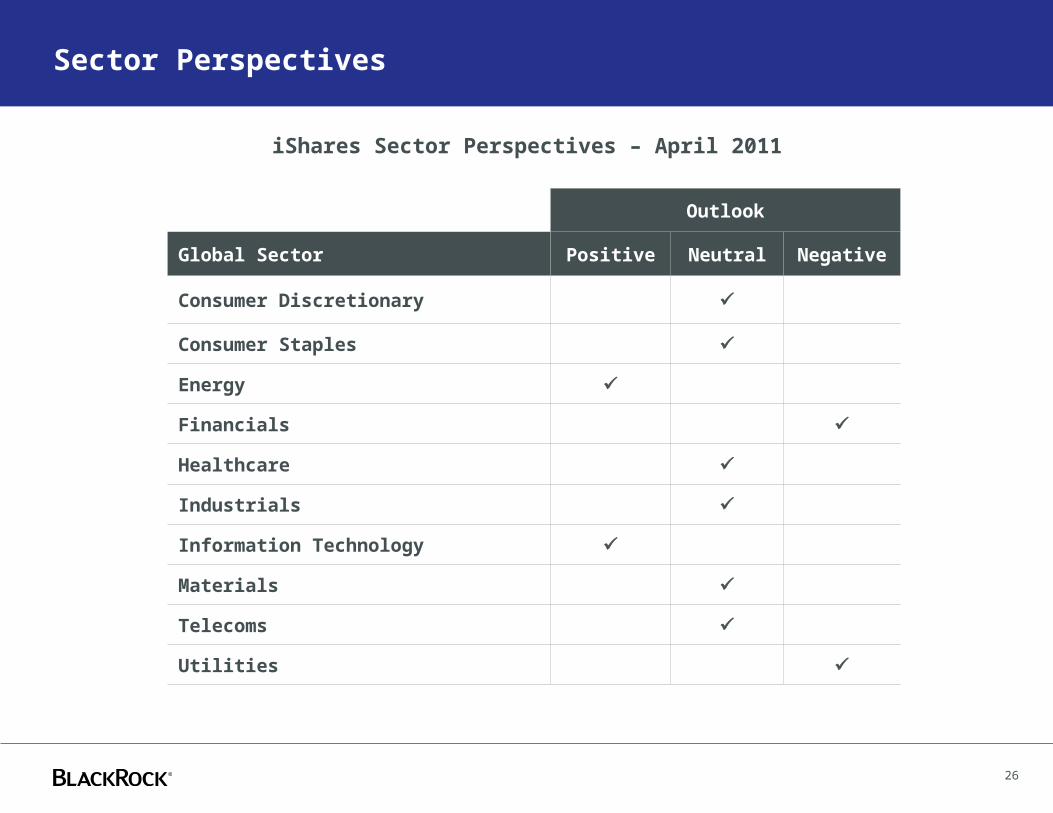
Sector Perspectives
Outlook
Global Sector Positive Neutral Negative
Consumer Discretionary
Consumer Staples
Energy
Financials
Healthcare
Industrials
Information Technology
Materials
Telecoms
Utilities
iShares Sector Perspectives – April 2011

27
THANK YOU
For more information, visitwww.iShares.ca
1-866-486-4874
28
This presentation is intended for accredited investors in Canada only.
iShares® Funds are managed by BlackRock Asset Management Canada Limited. Commissions, management fees and expenses all may be associated with investing in iShares Funds. Please read the relevant prospectus before investing. The indicated rates of return are the historical annual compounded total returns including changes in unit value and reinvestment of all distributions and do not take into account sales, redemption, distribution or operational charges or income taxes payable by any securityholder that would have reduced returns. The funds are not guaranteed, their values change frequently and past performance may not be repeated. Tax, investment and all other decisions should be made, as appropriate, only with guidance from a qualified professional.
DEX Universe Bond Index™, DEX All Corporate Bond Index™, DEX All Government Bond Index™, DEX HYBrid Bond IndexTM, DEX Long Term Bond Index™, DEX Real Return Bond Index™, and DEX Short Term Bond Index™ are trademarks of TSX Inc. and have been licensed for use for certain purposes to BlackRock Asset Management Canada Limited by PC-Bond, a business unit of TSX Inc. XBB, XCB, XGB, XHB, XLB, XRB and XSB are not sponsored, endorsed, sold or promoted by PC-Bond, TSX Inc., its affiliates or third party data providers and they make no representation, warranty, or condition regarding the advisability of investing in the funds.
MSCI® and EAFE® are trademarks of MSCI, Inc. (“MSCI”). XBZ, XEM, XIN and XWD are permitted to use the MSCI mark and, as applicable, the EAFE mark pursuant to a license agreement between MSCI and BlackRock Institutional Trust Company, N.A., relating to, among other things, the license granted to BlackRock Institutional Trust Company, N.A. to use the indices. BlackRock Institutional Trust Company, N.A. has sublicensed the use of these trademarks to BlackRock Asset Management Canada Limited. XBZ, XEM, XIN and XWD are not sponsored, endorsed, sold or promoted by MSCI and MSCI makes no representation, condition or warranty regarding the advisability of investing in XBZ, XEM, XIN and XWD.
© 2011 BlackRock Asset Management Canada Limited. All rights reserved. iShares® is registered trademark of BlackRock Institutional Trust Company, N.A. Used under license. BlackRock® is a registered trademark of BlackRock, Inc. Used with permission. All other trademarks, service marks or registered trademarks are the property of their respective owners.