Embed Size (px)
Citation preview

Excipient Mediated Biostabilization of Protein
Using Spray Drying Technique
Submitted
By
Priyadarsini Pattnayak
607BM002
In partial fulfillment for the award of the Degree of
MASTER OF TECHNOLOGY (RESEARCH)
IN
Department of Biotechnology and Medical Engineering
Under the esteemed guidance of
Prof. Gyana Ranjan Satpathy
National Institute of Technology, Rourkela
September– 2010

i
CERTIFICATE
This is to certify that thesis entitled, “Excipient mediated biostabilization of protein using
spray drying technique” has been done under my guidance is a bona fide record of work
done by Mrs. Priyadarsini Pattnayak in partial fulfillment of the requirement for the
completion of the Master of Technology by research in Department of Biotechnology &
Medical Engineering.
To the best of my knowledge, the matter embodied in this thesis has
not been submitted to any other university/ institute for award of any Degree or Diploma.
Prof. Gyana Ranjan Satpathy
Date: Department of Biotechnology& Medical Engineering
National Institute of Technology
Rourkela - 769008

ii
Acknowledgement I gladly take this opportunity to express my genuine appreciation, gratitude and credit to
individuals who have been involved throughout my research work.
I express my sincere gratitude to Prof. G. R. Satpathy, Department of Biotechnology and
Medical Engineering, NIT, Rourkela for his precious advice, depth supervision, guidance,
constant encouragement and co-operative attitude, throughout the course of my research
effort. I also thank him for helping me learning from my mistakes all through the project. I
shall remain ever grateful to him for his care, concern and sincere interest in my welfare.
I express my profound respect to Dr. B. P. Nayak, Department of Biotechnology and
Medical Engineering, NIT, Rourkela for providing me the lab facilities and being
approachable at all the time. I owe a depth of gratitude to Prof. R.K. Patel, of chemistry
Department NIT, Rourkela for permitting me to use the FTIR facility. I would like to extend
my sincere thanks to Prof. S.K. Pratihar Department of ceramic Engineering NIT, Rourkela
for allowing me to use DSC technique. I am thankful to Dr. S. Mishra Department of
Chemical Engineering NIT, Rourkela for the giving me permission to use TGA. I would also
thank to all my faculty members, office staffs and Technical staffs of Department of
Biotechnology & Medical engineering, NIT Rourkela, for their co-operation.
I express deep and sincere thanks to Satya, Prangya and Yoganand, Department of
Biotechnology & Medical Engineering, NIT, Rourkela for all their sincere help, invaluable
effort without which this thesis would not have seen the light of the world of science.
I would like to thank all my friends for their joyous company and constant support
throughout my work.
Finally, I would like to thank my parents and family members for their patience, support,
endurance, blessings and wishes that helped me in each step and every moment of my life.
Their endless support made completion of my work a reality. .
(Priyadarsini Pattnayak)

iii
CONTENTS PAGE No.
List of Tables ………………………………………………………………………VI
List of Figures …………………………………………………………………… VII
Abstract……………………………………………………………………………...XI
Abbreviations……………………………………………………………………....XIII
1. Introduction…………………………………………………………………........1
1.1 Denaturation of proteins…………………………………………………………2
1.2 Protein stabilization methods…………………………………………………...3
1.2.1 Stabilizing the hydrogen bonds, hydrophobic bonds and Electrostatic
interactions…………………………………………………………….3
1.2.2 Lyophilization or freeze drying ……………………………………….3
1.2.3 Structural modification through protein engineering &
ligand binding ……………………………………………………..…..4
1.2.4 Immobilization ……………………...…………………………………4
1.2.5 Spray drying………………………………….………………………...4
1.3 Improving the stability of the protein by addition of excipient.........................5
1.3.1 Excipients used in current study…………………………….…………7
1.3.1 (a) Trehalose................................................................................7
1.3.1 (b) Maltodextrin.........................................................................8
1.3.1 (c) Ammonium Sulfate ...............................................................9
1.3.1 (d) Mannitol …………………………………………………..10
1.4 Problem outlines and objectives………………………………………....…..10
2. Literature Survey…………………………………………………...12
2.1 Bovine serum albumin……………………………………………………....12
2.1.1 Structure of bovine serum albumin………………………………...12
2.1.2 Applications in diverse fields………………………………………13
2.1.3 Structural changes occur due to heat stress………………………..13
2.1.4 Previous work done……………………………………………………….14

iv
2.2 Conventional techniques for protein structure detection and their
limitations…………………………………………………………………………14
2.2.1 Mass Spectroscopy …………………………...……………………………. 15
2.2.2: Raman Spectroscopy………………………………...………………………15
2.2.3 Circular Dichroism………………………….………………………………..16
2.2.4 Ultra violet Spectroscopy………………………..……………………………16
2.2.5: Fluorescence Spectroscopy……………………….…………………………16
2.2.6 Nuclear Magnetic Resonance Spectroscopy …………....…………………17
2.2.7 X-ray Crystallography………………………………………....……………..17
2.3 Techniques used in the study…………………………………………....………….18
2.3.1 Fourier Transform Infrared Spectroscopy………………………………………18
2.3.1 (a) Band Assignments………………………………………………..…19
2.3.1 (b) Advantages of FTIR…………………………………………………20
2.3.1 (c) Structural changes of protein detected by FTIR……………………20
2.3.2 Electrophoresis method to study aggregation or fragmentation………………20
2.3.2 (a) Native electrophoresis…………………………………………………20
2.3.2 (b) SDS PAGE electrophoresis……………………………………………21
2.3.3 Differential Scanning Calorimetry……………………………………………...…21
2.3.3 (a) Principle of operation…………………………………………….……21
2.3.3 (b) Glass transition temperature……………………………………….…22
2.3.3 (c) DSC in some other use……………………………………………….…22
2.3.4 Thermogravimetric Analysis………………………………………………………..22
2.3.4 (a) Priniciple of operation………………………………………………..……22
2.3.4 (b) TGA in some other use………………………………………………….…23
2.3.5 Spray drying………………………………………………………………………….23
2.3.5 (a) Instrumental operation………………………..……………………….…23

v
2.3.5 (b) Application in various fields………………………………………..…24
2.3.5 (c) Spray drying of proteins………………………………………………...24
3. Materials and Methods…………………………………………….26
3.1 Materials…………………………………………………………………………..…26
3.2 Methods………………………………………………………………………………29
3.2.1 Spray drying of BSA with different excipients………………………….29
3.2.1 (a) Parameters optimization…………………………………......29
3.2.1 (b) Spray drying……………………………………………………30
3.2.1 (c) Sample preparation…………………………………………….30
3.2.1 (d) Thermogravimetry analysis for protein formulations……….31
3.2.2 Native electrophoresis of samples…………….…………………………31
3.2.2 (a) Stock preparation………………………………………………..31
3.2.4 (b) Gel preparation…………………………………………………..32
3.2.4 (c) Staining and destaining of the gel……………………………….32
3.2.5 Fourier Transform Spectroscopy……………………………………….…33
3.2.5 (a) Pellet preparation and scanning………………………………….33
3.2.6 Differential scanning calorimetry…………………………………………..34
4. Result and discussion……………………………………………….35
4.1 Moisture content analysis through Thermogravimetric Analysis………...36
4.2 Aggregation study through Native gel electrophoresis…………………….37
4.3 Fourier transform spectroscopic study on proteins………………………....41
4.4 Differential scanning calorimetry study on protein……………………...…71
5. Conclusion and summary……………………………………………………..76
6. References……………………………………………………..………..78

vi
LIST OF TABLES
TABLE No. TITLES PAGE No.
Table- 1.1 List of excipients used in the various biochemical and biopharmaceutical
industries………………….................................................................................................. 6
Table- 1.2 Physical properties of trehalose…………………………………….……7
Table-1.3 Physical properties of maltodextrin……………………………………....8
Table- 1.4 Physical properties of Ammonium sulfate……………………………….9
Table -1.5 Physical properties of mannitol………………………………...……......10
Table- 2.1 Different techniques used for the detection of structure of proteins…….14
Table- 2.2 The characteristic IR bands of proteins and peptides……………………18
Table-2.3 Deconvoluted amide I band frequencies and related secondary
structure structural components of protein in H2O media……………..... 19
Table-2.4 Spray drying applications………………………………………………..24
Table 3.1 Different chemicals used in the experiment……………………………..26
Table 3.2 Instruments used in the study…………………………………………….28
Table 4.1 Moisture content calculated at room temperature…………………....…..37
Table 4.2 Tg value and change in specific heat of native and
formulated samples…………………………………………………….....72

vii
LIST OF FIGURES
Fig No. Title Page No
Fig. 3.2.1 Laboratory spray dryer………………………………………….……..29
Fig. 3.2.2 FTIR used in the study…………………………………………………33
Fig. 3.2.3 DSC used in the study……………………………………….…………34
Fig. 4.1.1 Spray dried protein-mannitol……………………………………...……35
Fig. 4.1.2 Spray dried protein-ammonium sulfate…………………..……….…… 35
Fig. 4.1.3 Spray dried protein-maltodextrin……………………………………….35
Fig. 4.1.4 Spray dried protein-trehalose……………………………………………35
Fig. 4.2.1 Electrophoresis of BSA treated at different temperature for 60
minutes………………………..………………………………………… 38
Fig. 4.2.2 Electrophoresis of native and formulated BSA treated at 65°C for 10
minutes………………………..………………………………………….38
Fig. 4.2.3 Electrophoresis of native and formulated BSA treated at 75°C for 10
minutes………………………………………………………………… ..39
Fig. 4.2.4 Electrophoresis of native and formulated BSA treated at 65°C for 60
minutes………………………………………………………………… ..39
Fig. 4.2.5 Electrophoresis of native and formulated BSA treated at 75°C for 60
minutes……………………………………………………………….….40
Fig. 4.3.1 Comparison of IR graph between native protein without excipient heat treated
and spray dried with ammonium sulfate at 65°C for 5 min treatment, keeping
native protein at room temp. as control……………………………………..…43
Fig. 4.3.2 Comparison of IR graph between native protein without excipient heat
treated and spray dried with ammonium sulfate at 65°C for 10 min treatment,
keeping native protein at room temp. as control………………………………43
Fig. 4.3.3 Comparison of IR graph between native protein without excipient heat treated
and spray dried with ammonium sulfate at 65°C for 40 min treatment, keeping
native protein at room temp. as control…………………………………….….44
Fig. 4.3.4 Comparison of IR graph between native protein without excipient heat treated
and spray dried with ammonium sulfate at 65°C for 60 min treatment, keeping
native protein at room temp. as control…………………………………….….44
Fig. 4.3.5 Comparison of IR graph between native protein without excipient heat treated

viii
and spray dried with ammonium sulfate at 75°C for 5 min treatment, keeping
native protein at room temp. as control ……………………………………….45
Fig. 4.3.6 Comparison of IR graph between native protein without excipient heat treated
and spray dried with ammonium sulfate at 75°C for 10 min treatment, keeping
native protein at room temp. as control ……………………...…………..……..45
Fig. 4.3.7 Comparison of IR graph between native protein with out excipient heat treated
and spray dried with ammonium sulfate at 75°C for 40 min treatment, keeping
native protein at room temp. as control ………………………………………..46
Fig. 4.3.8 Comparison of IR graph between native protein without excipient heat treated
and spray dried with ammonium sulfate at 75°C for 60 min treatment, keeping
native protein at room temp. as control …………………………………..……46
Fig. 4.3.9 Comparison of IR graph between native protein without excipient heat treated
and spray dried with mannitol at 65°C for 5 min treatment, keeping native protein
at room temp. as control ………………………………………………………48
Fig. 4.3.10 Comparison of IR graph between native protein without excipient heat treated
and spray dried with mannitol at 65°C for 10 min treatment, keeping native
protein at room temp. as control ……………………………………..……….49
Fig. 4.3.11 Comparison of IR graph between native protein without excipient heat treated
and spray dried with mannitol at 65°C for 40 min treatment, keeping native
protein at room temp. as control ………………………………………………50
Fig. 4.3.12 Comparison of IR graph between native protein without excipient heat treated
and spray dried with mannitol at 65°C for 60 min treatment, keeping native
protein at room temp. as control……………………………………………….51
Fig. 4.3.l3 Comparison of IR graph between native protein without excipient heat treated
and spray dried with mannitol at 75°C for 5 min treatment, keeping native
protein at room temp. as control ………………………………………….….51
Fig. 4.3.14 Comparison of IR graph between native protein without excipient heat treated
and spray dried with mannitol at 75°C for 10min treatment, keeping native
protein at room temp. as control …………………..…………………………52
Fig. 4.3.15 Comparison of IR graph between native protein without excipient heat treated
and spray dried with mannitol at 75°C for 40 min treatment, keeping native
protein at room temp. as control ………………………………..……………53

ix
Fig. 4.3.16 Comparison of IR graph between native protein without excipient heat treated
and spray dried with mannitol at 75°C for 60 min treatment, keeping native
protein at room temp. as control ……………………………………….……54
Fig. 4.3.17 Comparison of IR graph between native protein without excipient heat treated
and spray dried with maltodextrin at 65°C for 5 min treatment, keeping native
protein at room temp. as control ……………………………………………..55
Fig. 4.3.18 Comparison of IR graph between native protein without excipient heat treated
and spray dried with maltodextrin at 65°C for 10 min treatment, keeping
native protein at room temp. as control ……………………………………..56
Fig. 4.3.19 Comparison of IR graph between native protein without excipient heat treated
and spray dried with maltodextrin at 65°C for 40 min treatment, keeping native
protein at room temp. as control ……………………………………………..57
Fig. 4.3.20 Comparison of IR graph between native protein without excipient heat treated
and spray dried with maltodextrin at 65°C for 60 min treatment, keeping native
protein at room temp. as control ……………………………………………..58
Fig. 4.3.21 Comparison of IR graph between native protein without excipient heat treated
and spray dried with maltodextrin at 75°C for 5 min treatment, keeping native
protein at room temp. as control ……………………………………….……59
Fig. 4.3.22 Comparison of IR graph between native protein without excipient heat treated
and spray dried with maltodextrin at 75°C for 10 min treatment, keeping native
protein at room temp. as control …………………………………………….60
Fig. 4.3.23 Comparison of IR graph between native protein without excipient heat treated
and spray dried with maltodextrin at 75°C for 40 min treatment, keeping native
protein at room temp. as control ………………………………………...……61
Fig. 4.3.24 Comparison of IR graph between native protein without excipient heat treated
and spray dried with maltodextrin at 75°C for 60 min treatment, keeping native
protein at room temp. as control ………………………………..……………62
Fig. 4.3.25 Comparison of IR graph between native protein without excipient heat treated
and spray dried with trehalose at 65°C for 5 min treatment, keeping native
protein at room temp. as control ……………………………………………..63

x
Fig. 4.3.26 Comparison of IR graph between native protein without excipient heat treated
and spray dried with trehalose at 65°C for 10 min treatment, keeping native
protein at room temp. as control …………………………………………..…..64
Fig. 4. 3.27 Comparison of IR graph between native protein without excipient heat treated
and spray dried with trehalose at 65°C for 40 min treatment, keeping native
protein at room temp. as control……………………………………………..… 65
Fig. 4.3.28 Comparison of IR graph between native protein without excipient heat treated
and spray dried with trehalose at 65°C for 60 min treatment, keeping native
protein at room temp. as control ………………………………………………..66
Fig. 4.3.29 Comparison of IR graph between native protein without excipient heat treated
and spray dried with trehalose at 65°C for 5 min treatment, keeping native
protein at room temp. as control ………………………………………………67
Fig. 4.3.30 Comparison of IR graph between native protein without excipient heat treated
and spray dried with trehalose at 75°C for 10 min treatment, keeping native
protein at room temp. as control ……………………………………………….68
Fig. 4.3.31 Comparison of IR graph between native protein without excipient heat treated
and spray dried with trehalose at 75°C for 40 min treatment, keeping native
protein at room temp. as control ……………………………………………….69
Fig. 4. 3.32 Comparison of IR graph between native protein without excipient heat treated
and spray dried with trehalose at 75°C for 60 min treatment, keeping native
protein at room temp. as control……………………………………..…………70
Fig.4.4.1 Tg value of native protein………………………………………………………72
Fig.4.4.2 Tg value of BSA formulated with trehalose……………………………...........73
Fig.4.4.3 Tg value of BSA formulated with maltodextrin……………………………….73
Fig.4.4.4 Tg value of BSA formulated with ammonium sulfate………………………...74
Fig.4.4.5 Tg value of BSA formulated with mannitol……………………………………74
Fig.4.4.6 Overlapping all the graphs Tg values obtain by DSC for comparison…………75

xi
Abstract
Biologically active molecules like proteins are better preserved in dry condition owing to
lower water activity and lower intra-molecular movement. However, 3-D conformation of
protein is dependent on water around it. Upon drying, water around the protein is lost and
therefore, excipients that work as water substitute molecule is provided during drying to
preserve its 3-D structure. Bovine serum albumin (BSA) is taken as a model protein in this
study. BSA is one of the highly studied proteins. Easy accessibility, low cost and inert
behaivour enhances its significant utility in various biochemical formulations. In this study,
BSA and excipient-BSA combinations were subjected to different levels of heat stress and
the resulting structural changes were assessed using native gel electrophoresis, DSC
(Differential Scanning Calorimetry), FTIR (Fourier Transform Infrared Spectroscopy)
techniques. Native PAGE, FTIR, DSC techniques are used to determine the aggregation,
secondary structure and glass transition properties of the spray dried and heat treated proteins
respectively. The moisture content of the spray dried samples was determined by Thermo
gravimetric analysis (TGA). For a protein to be stable, low moisture content, high Tg values
are ideal. Protein aggregation has a direct link with its secondary structure. Thus, upon heat
treatment of BSA and excipient-BSA combinations it is important that protein does not
aggregate and the secondary structure remain intact for the protein to be stable.
Sugar, sugar alcohol and salt based excipients are well-known water substitute molecules. In
the current study, BSA is spray dried in the presence of excipients like trehalose, mannitol,
maltodextrin and ammonium sulfate in a ratio of protein:excipient, w/w 1:2. Further, the
spray dried BSA samples were subjected to different levels of heat stresses and the resulting
structural changes were monitored. Heat stress disrupts the 3-D structure of proteins by
disturbing the secondary structure that ultimately leads towards protein aggregation.
Mannitol was found to be the best excipient in this study. Mannitol stabilizes the secondary
structure of BSA. The α-helix at 1655 cm-1
, 310 helix at 1665 cm-1
and β-turn at 1687 cm-1
of
BSA remained intact for heat treatment at 65ºC and 75
ºC and different time intervals (5, 10,
40 and 60 minutes) as monitored by IR spectroscopy. The recorded glass transition
temperature (Tg) is quite high for Mannitol-BSA combination i.e. 75.1ºC as quantified by

xii
DSC. After a prolonged heat treatment for 60 minutes at 75ºC the protein did not aggregate as
clearly exhibited by native PAGE. Besides, the moisture content of the spray dried mannitol-
BSA combination remains lowest i.e. 3.1 %.
Ammonium sulfate offers stability to the helical portion for short time at 65ºC and 75ºC up to
10 minutes of heat treatment. The structural change in case of ammonium sulfate-BSA
combination monitored by FTIR is comparable to its native PAGE analysis. Long term heat
treatment at high temperature caused aggregation in ammonium sulfate-BSA combination.
BSA dried with trehalose and maltodextrin (Trehalose-BSA and Maltodextrin-BSA
combinations) were found to be sticky, high moisture content and aggregated even during the
spray drying. Consequently, they had low Tg, aggregates at low heat treatment and its
secondary structure get easily disturbed as monitored by DSC, PAGE and FTIR respectively.
Thus a comprehensive study on “excipient mediated biostabilization” of a model protein like
BSA was accomplished in this thesis.
Keywords: Spray drying, Bovine Serum Albumin, Aggregation, Native Gel Electrophoresis,
Moisture content, Thermo gravimetric Analysis, Glass transition temperature, Differential
scanning Calorimetry, Fourier Transform Infrared Spectroscopy
xiii
ABBREVIATIONS
BSA Bovine serum albumin
FTIR Fourier Transform Infrared Spectroscopy
DSC Differential Scanning Calorimetry
TGA Thermo Gravimetric Analysis
PAGE Poly Acryl amide Gel Electrophoresis
CD Circular Dichroism
MS Mass Spectroscopy
NMR Nuclear Magnetic Resonance
UV Ultraviolet and Visible Spectroscopy
Tg Glass Transition Temperature
Tc Crystallization Temperature
Tm Melting Temperature
Na2HPO4 Disodium hydrogen phosphate
NaH2PO4 Sodium dihydrogen phosphate
Da Dalton
SDS Sodium dodecyl Sulfate
AS Ammonium sulfate
DM D-Mannitol
MD Maltodextrin
T Trehalose
Trp Tryptophan
Phe Phenylalanine
Try Tyrosine
KBr Potassium Bromide
TEMED Tetramethylethlylenediamine
HCl Hydrochloric Acid
NaOH Sodium hydroxide
mM Milimolar
Temp Temperature

1
Chapter 1
Introduction Biological systems are highly susceptible towards changes in their micro-environments. A
small variation in the surrounding can affect the stability of the macromolecules, cells, intact
plant and animal tissues. The factors that are liable to change the surroundings include
temperature, pH, concentration, denaturants, etc. Bio-stabilization is a process for preserving
and enhancing the shelf life of each and every component of the living systems individually
and collectively. Besides being the vital component of the living systems, proteins are
actively utilized in pathways like catalysis of biochemical reactions, transport of nutrients,
recognition, and transmission of signals. Delicate structure of protein is stabilized by
hydrogen bonds, hydrophobic interactions, disulphide bridges, van der waal forces etc. Any
variations in the storage parameters can rupture the bonds, thus disrupting the dynamic
structure and functions of protein. Proteins are subjected to various stresses during
production, storage, and shipping, which increase the molecular motion and disturb the
conformation. Helical structure of the protein i.e. α-helix and 310 helix are energetically less
stable and very sensitive to heat stresses. It can be disrupted and easily split leading to a
change in 3D structure due to rupture of the hydrogen bonds. After breakage of the hydrogen
bonds, protein may form aggregates. In the absence of a favorable environment, proteins are
relatively unstable. Proteins are functional in their hydrated form. On prolonged storage in
hydrated state, it loses its activity due to aggregation, disulphide exchange, oxidation etc.
Thus proteins are prepared in dried form to enhance its shelf life. In the solid state, due to the
removal of water protein loses its activity. Thus excipients forms hydrogen bonds with the
protein molecule, create a water-like environment around the protein and strengthen the
existence of its 3-D structure. The excipients protect its structure by providing the aqueous
active surrounding even in the desiccated state. In order to clearly discriminate between a
native and a denatured protein it is essential to have the understanding of denaturation of
protein.

2
1.1 Denaturation of proteins
Alteration in secondary and tertiary structure may lead to denaturation if its 3D conformation
is disrupted. The reason may be chemical, physical or thermodynamic one. In case of
chemical degradation, protein may undergo deamidation, oxidation and aggregation. In
deamidation process, the amide groups are removed by organic compounds. This is a pH
dependant process which hydrolyzes asparagines to aspartate. Deamidation reactions can be
checked by the addition of organic solvents (Yanli, 2000). The probability of oxidative
damage in protein is very high. There are many residues like- Met, Cys, Trp, Tyr that can
participate in oxidation reaction (Fransson et al., 1996). Disulphide bonds can play a major
role in protein stability. Some times thiolate group of Cys residue pairs with the sulfur atom
of a disulphide linkage that leads to breakage of the existing S-S bond in the polypeptide,
creating a new link. This Disulphide exchange causes a structural change in proteins (Yanli,
2000). In order to balance interaction between hydrogen bonds and hydrophobic interactions
which are disturbed by temperature and vortexing, some uncontrolled folding occurs, that is
called as aggregation of proteins. Physical factors that responsible for denaturation are
change in pH, concentration, and purity of proteins. Protein in stable form maintains a
balance between folded and unfolded stage. The temperature has a major effect on the
stability of the protein as it directly related to breaking of the secondary structure. With
increase in the temperature the weak hydrogen bonds are disrupted and hydrophobic residues
come out which leads to change in conformation (Jaenicke et al., 1990). Deviation from
optimal pH conditions (low or high pH) results in hydrolysis and deamidation of proteins
(Son et al., 1995). The Cys disulphide exchange reaction is influenced by pH and it also
affects the rate of aggregation. Protein purity depends on the source and it is directly related
to the protein stability (Brange et al., 1992). The presence of trace amount of metals or any
other contaminant may affect the protein stability. Protein concentration also affects the
aggregation formation, chemical degradation and disulfide bonding (Brange et al., 1992).
Protein stability means avoiding the path of denaturation. There are many ways one can
achieve it.
3
1.2 Protein Stabilization methods
Protein stabilization is highly desirable for storing the protein in its native form (Ragoonanan
et al., 2007). Stabilization of structure requires preservation during and after processing.
During production and storage, protein undergoes several biochemical changes that may lead
to aggregation following various reactions. Protein conformation and stability is strongly held
together by creating a favorable environment that will not allow the breakage of the intra-
molecular interactions namely hydrogen bonds, hydrophobic and electrostatic interactions
and disulfide bridges, etc.
1.2.1 Stabilizing the hydrogen bonds, hydrophobic and electrostatic interactions
As protein structure is balanced by various interactions, its stability can be enhanced by
improving these interactions. It is reported that hydrophobic interactions contribute major
part in the protein stability. Improving the hydrophobic interactions at interior and at the
surface of protein can lead to its stability (Pace et al., 1992). Hydrogen bonds are very
important for the stability of the secondary structure of the proteins. It is actively involved in
the formation and maintenance of secondary structural components like α-helix, 310 helix, -
sheets and turns. Hydrogen bonds are energetically very less i.e. 1.1–1.6 kcal/mol and break
easily. Protein stability increases by increasing the strength of hydrogen bonds. The three
dimensional structure of protein is strongly related to the salt bridge. The salt bridges can be
improved by electrostatic interactions (Scholtz et.al., 1993). The strength of salt bridges
offers a great impact on the stability of the proteins (Horovitz et al., 1990).
1.2.2 Lyophilization or Freeze drying
Proteins are generally stored in dry condition in order to avoid unnecessary interactions with
bound water molecules and minimize water activity (Aw). Freeze drying is based on
mechanism of dehydration. It is generally used for the preservation of heat sensitive material
like protein. It works by freezing the material through mechanical refrigeration, dry ice and
methanol, or liquid nitrogen and adding enough heat to allow the frozen water in the material
to sublime directly from the solid phase to the gas phase. Lastly in secondary drying step, the
unfrozen water molecules are removed. Through freeze drying, dry form of proteins are

4
produced with minimal damage to them and can be stored for years. Study of chymopapain
stabilization by lyophilization was done (Philippe et al., 1997)
1.2.3 Structural modification through protein engineering and ligand binding
By improving the ligand binding site of a protein, the substrate interactions increases which
increases the stability. The mechanism of the formation of complex is related to the thermal
stability of the protein (Denisio et al., 1992). In general, introduction of disulphide bonds in
between the residues using protein engineering tools improve the protein stability. Structural
modification through protein engineering i.e. insertion or deletion of amino acids improve the
stability of the protein and protect it from various stresses. Introducing a disulphide bond in
between two identical subunits of Streptomyces subtilisin inhibitor increases the stabilization
by increasing the melting temperature. Protein can also be stabilized by destabilizing the
unfolding state as well as stabilizing the folding state. Intermolecular complex formation
affects the stability of proteins (Denisov et al., 1992). The role of chaperon on protein folding
was studied (Hartl et al., 1996). The various stabilization methods for protein stabilization
was studied (Lee et al., 1997)
1.2.4 Immobilization
Structure can be modified by immobilization techniques. Immobilization can provide a
noticeable protection from pH and high temperature (Michele et al., 1992). Stability of yeast
alcohol dehydrogenase can be improved by covalent immobilization with glyoxyl-agarose.
The half life of a protein can also be improved by modification with polymers (Jafri et al.,
1993).
1.2.5 Spray drying
This process is based on evaporation of solvent mostly water. In spray drying the solution,
suspension or emulsion is sprayed through a hot dry air. The liquid droplet dries within a
fraction of second by the process of atomization which is carried out through a nozzle. This
transformation of liquid to solid requires few seconds. Spray drying can be applied to many
fields for creating amorphous solid with a specific particle size.
Spray-drying of therapeutic proteins has been successfully developed for the production of
inhalable powders. Spray-drying an aqueous solution of a pure protein produces aggregation
and/or loss of activity. These instabilities can, however, be ameliorated, in some cases fully,

5
by formulation measures. Disaccharides or surfactants in the liquid feed can prevent protein
aggregation or inactivation during spray-drying (Broadhead et al., 1994). Spray-dried protein
powders also have a potential application as a bulk storage material. If purified protein is
insufficiently stable in aqueous solution, it is routinely freeze-dried to yield a storage stable
powder. The most obvious disadvantage of this practice is the complexity of freeze-drying
process control, which adds further cost to an already expensive process and cannot prevent
occasional batch failure. Spray-dried protein powders represent, therefore, a potential
alternative to such lyophilized bulk protein. To be suitable as a bulk storage material, a spray-
dried protein powder must have a particle size sufficiently large to ensure the flowability
necessary for bulk powder handling. A further major process requirement is a high powder
yield from the spray-dryer. The remaining powder properties are, however, the same as those
required for inhalable powders, viz. minimal protein damage during spray-drying, acceptably
low residual moisture content, an overall spherical morphology, and satisfactory storage
stability.
1.3 Improving the stability of the protein by addition of excipient
Excipient mediated protein stabilization has been widely studied. An excipient is an inactive
substance used as a carrier for the highly active and thermo-labile biological and
pharmacological substances. Pharmaceutical excipients are now designed in such a way that
they should satisfy several essential qualities. It should bring multi-functional benefits to
tablets and capsule formulations through great binding capability, improved dissolution
properties, enhanced flow and lubricity. It offers benefit to product in terms of cost,
productivity, and moisture protection.

6
Table-1.1: List of excipients used in various biochemical and biopharmaceutical industries.
Excipients
Acetyltriethyl Citrate Lactose and Cellulose
Aspartame Lactose and Microcrystalline
Cellulose
Alginates Lauryl Lactate
Calcium Carbonate Magnesium Stearate
Cellulose Acetate Phthalate-based
Coatings Maltodextrin
Cellulose-based Coatings Poly ethylene Glycol
Cellulose and Lactose Combinations Mannitol
Colorants for Film Coating Systems Methylcellulose-based Coatings
Crospovidone Microcrystalline Cellulose
Dextrose Molasses
Dibutyl Sebacate Shellac
Ethylcellulose-based Coatings Sorbitol, crystalline
Fructose Starch
Gellan Gum Sucrose
Glycerol
Xanthan Gum
Lactose, anhydrous Xylitol
Lactose, monohydrate Trehalose
7
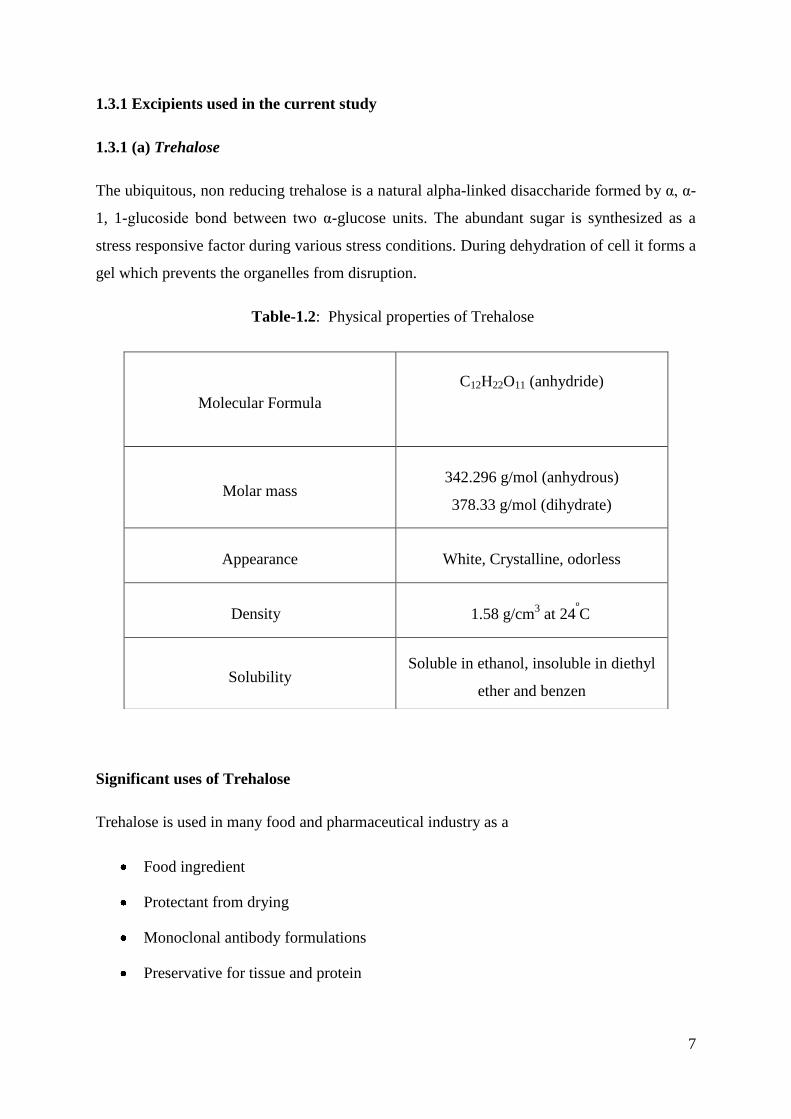
1.3.1 Excipients used in the current study
1.3.1 (a) Trehalose
The ubiquitous, non reducing trehalose is a natural alpha-linked disaccharide formed by α, α-
1, 1-glucoside bond between two α-glucose units. The abundant sugar is synthesized as a
stress responsive factor during various stress conditions. During dehydration of cell it forms a
gel which prevents the organelles from disruption.
Table-1.2: Physical properties of Trehalose
Significant uses of Trehalose
Trehalose is used in many food and pharmaceutical industry as a
Food ingredient
Protectant from drying
Monoclonal antibody formulations
Preservative for tissue and protein
Molecular Formula
C12H22O11 (anhydride)
Molar mass 342.296 g/mol (anhydrous)
378.33 g/mol (dihydrate)
Appearance White, Crystalline, odorless
Density 1.58 g/cm3 at 24
ºC
Solubility Soluble in ethanol, insoluble in diethyl
ether and benzen

8
Trehalose as an excipient:
Trehalose can be used as an excipient for the stabilization of proteins, animals, plants and
microbial cells during drying. It gives a very high Tg value as detected by calorimetry. It is
inert in several biochemical reactions and its low hygroscopic property makes it an excellent
excipient in pharmaceutical and other industries. The stability of spray dried product IgG1 was
found to be improved by addition of trehalose. In the case of cutinase, it is found that
trehalose formulation delays its thermal unfolding (Baptista et al., 2008). Trehalose protects
the myoglobin by preserving its internal mobility. Trehalose form completely amorphous
products and also stabilizes recombinant HSA for several months at 35°C determined by
electrophoresis. This stress responsive factors has also proved useful in the cryopreservation
of sperm and stem cells.
1.3.1 (b) Maltodextrin
Maltodextrin is a polysaccharide composed of long chains of D-glucose units linked together
by α (1→4) glycosidic bond. Partial hydrolysis of starch produces Maltodextrin. It is
available as a white powder, sweet and flavorless.
Table-1.3: Physical property of Maltodextrin
Molecular formula C6nH(10n+2)O(5n+1)
Molar mass Varies
Appearance White powder
Significant uses of Maltodextrin
Production of natural sodas and candy
food additive
Use as an excipient
Use in healthy drinks, for being easily digestible and to increase the amount of
calories. It can be used as a carbohydrate component in dry beverage mixes, puddings,
desserts, cake, cookie, infant foods, ice creams, food coating, low alcohol beer, cheese
spread and salad dressings, meal replacement powder, weight gain powder and post
exercise supplements.

9
Maltodextrin as an excipient
Maltodextrin along with sucrose was able to protect the native structure of catalase. It can be
used as a pharmaceutical excipient (Nath et al., 1992). Maltodextrin was used as a
lyoprotectant for Lactate dehydrogenase. It gave better protection to the enzyme during
freeze drying than sucrose and maltose as measured by the activity assays and calorimetry
(Sun et al., 1998).
1.3.1 (c) Ammonium sulfate
Ammonium sulfate contains 21% nitrogen as ammonium cations, and 24% sulfur as sulfate
anions. It can act as a soil fertilizer.
Table-1.4: Physical properties of Ammonium Sulfate
Molecular Formula (NH4)2SO4
Molar mass 132.14 g/mol
Appearance Fine white hygroscopic granules or crystals
Relative Density 1.769 g/cm3 (20 °C)
Solubility in water 70.6 g/100 ml (0 °C)
Solubility in other solvents insoluble in acetone, alcohol and ether
Significant uses of Ammonium sulfate
Preparation of other ammonium salts
A food additive
Purifying proteins by precipitation
Artificial fertilizer for alkaline soils
Ammonium Sulfate as an excipient
Ammonium sulfate is used to stabilize human and horse serum butyrylcholinesterase at a few
site. Ammonium sulfate was also able to give protection to the model enzyme lactate
dehydrogenase against heat and urea mediated stresses.

10
1.3.1 (d) Mannitol
Mannitol is a sugar alcohol. It is a non reducing acyclic sugar, available in α, , and γ forms
Table-1.5: Physical properties of Mannitol
Molecular Formula C6H14O6
Molar mass 182.172 g/mol
Appearance Fine white hygroscopic granules
Solubility in water Soluble in water
Significant uses of Mannitol
To treat the patients with oliguric renal failure.
Circuit prime of a heart lung machine during cardiopulmonary bypass
Reduce acutely raised intracranial pressure
Mannitol as an excipient
The pharmaceutical protein recombinant humanized anti-IgE monoclonal antibody
(rhuMAbE25) was spray dried with mannitol produced stable products (Constantine et al.,
1998). Sugar alcohols and metabolites such as proline and glycine is said to protect diverse
range of organisms against environmental stress. The protein and mannitol under vaccum
drying was investigated (Sharma et al. 2004).
1.4 Problem Outline and Objectives
Excipient mediated bio-stabilization of proteins involve selected excipients, a model protein,
a dehydration (drying) methodology and several analytical tools to study the stability aspects
of the protein. Since the goal is to evaluate the excipients that are capable of stabilizing the
protein for longer time at room temperature conditions, accelerated degradation of proteins
are generally adopted to evaluate and characterize the effect of excipients on the protein’s
structure and activity during extreme conditions. Heat stresses caused by high temperature
heat treatment, acidic and/or alkaline environments, elevated humidity and photon
bombardment expedite the degradation process of proteins. Native proteins in aqueous
environment crumble quickly in either one or combination of such stresses. Proteins that are
dehydrated in the presence of excipients are very well immobilized, have less bound water
and less water activity (Aw), placed in a glassy matrix of excipients that have high glass

11
transition (Tg) temperature keeping the protein intact in immobilized state. Thus, excipient-
protein combinations resist the accelerated degradation. It is to be seen that to what extent a
particular excipient resist the degradation of the protein. In this study, protein:excipent, w/w
1:2 combinations are first of all dehydrated using spray drying technique and heat stress is
applied to accelerate the degradation of immobilized protein. Finally, the effects of heat stress
on the protein-excipient combinations were evaluated by PAGE and IR techniques.
Keeping the above mentioned overall goal in mind we set the following objectives:
1. To spray dry one excipient at a time in combination with BSA in a ratio of
protein:excipient, 1:2 w/w.
2. To subject the native protein and other spray dried protein samples to a known heat
stress (65 ºC and 75
ºC) for a known time period (5, 10, 40 and 60 mins)
3. To quantify the moisture content and glass transition temperature of spray dried
protein-excipient formulations using TGA and DSC techniques
4. To analyze the structural changes in the protein exposed to accelerated degradation
using native PAGE and FTIR techniques

12
Chapter 2
LITERATURE SURVEY
2.1 Bovine Serum Albumin
Bovine serum Albumin accounts for about 60% of blood plasma protein, hence regarded as
the most abundant protein content of blood. In mammals, albumin is synthesized as
preproalbumin by the liver. The albumin released into circulation possesses a half-life of 19
days (Carter et al., 1994).
2.1.1 Structure of Bovine serum Albumin
The widely studied Bovine serum albumin (BSA) possesses molecular weight of 66500Da
(Pico et al., 1996). Albumin from different mammalian species show many similarities in
physico-chemical criteria. The indistinguishable bovine (BSA) and human (HSA) serum
albumin shows nearly 76% of sequence identities, similar surface hydrophobicity and also in
partitioning behavior (Michnik et al. 2006). This globular protein contains three domains,
each domain formed by 6 helices, and 9 loops stabilized together by internal networking of
disulphide bonds. Each domain contains two sub domains. Bovine serum albumin contains
583 amino acids containing two tryptophan (Trp-134), located in Proximity of the protein
surface, but buried in a residues located in the domain-I and Trp-236 located in the internal
part of the domain-II (Ajloo et al., 2006). Its primary structure is characterized by low content
of tryptophan, a high content of cystein which stabilizes a series of main loops, and charged
amino acids such as aspartic acid, glutamic acid, lysine and arginine. Its secondary structure
contain 67% of -helix, 10% turn, 23% extended chain, and no β-sheets. From FTIR
analysis, it was proposed that BSA does not denature up to 40 °C. Conformational changes of
the BSA molecule are reversible in the temperature range of 42- 50 °C, but unfolding of α-
helices of BSA is irreversible in the temperature range of 52-60 °C. From 60 °C, the
unfolding of BSA progresses and -aggregation of the BSA molecule begins. Above 70 °C,
the gel formation by unfolding of BSA advances further (Murayama et al., 2004)

13
2.1.2 Applications in diverse fields
BSA is one of the most extensively used proteins due its availability, low cost, stability, and
unusual ligand binding properties (Curry et al., 1998). In restriction digests, BSA is used to
stabilize some enzymes during digestion of DNA and to prevent adhesion of the enzyme to
reaction tubes and other vessels. BSA is also commonly used to prepare a protein stabdard
plot that is needed for estimation of other proteins. In addition, it has been reported that
albumin is chiefly responsible for maintenance of blood pH (Carter et al.1994). The serum
albumin is a multifunctional plasma carrier protein because of its unusual ability to bind with
a broad spectrum of ligands which include inorganic cations, organic anions, various drugs,
amino acids, and perhaps most important and physiologically available hydrophobic
molecules such as bilirubin and fatty acids. Serum albumin is regarded as drug carrier in the
drug delivery system. It interacts with the drugs and helps in drug design (Honda et al.,
1999). Though albumin is a protein, it can also function like an enzyme. There are various
applications of albumin in clinical areas like: it can be used as a fatty acid carrier for
biosynthesis of lens lipids. BSA with fatty acid showed the highest breaking strength and
evaluated as having highest wielding ability.
2.1.3 Structural changes occurs due to heat stress
BSA has a tendency to aggregate in macromolecular assemblies. As temperature increases,
the hydrogen bonds become weak and they break. Some molecular regions become accessible
to new intermolecular interactions, producing soluble aggregates through disulphide and non-
covalent bonds (Yanli , 2000). Specifically, BSA aggregation appears to be the result of three
interconnected mechanisms: critically diverging concentration fluctuations, conformational
changes and proteins cross-linking. The degree to which it happens is temperature and time-
dependent. Moreover, intermolecular -sheet formation can take place and contribute to
intermolecular association of the partially unfolded protein molecules. All these
intermolecular interactions can give rise to the protein gelling phenomenon and is driven by
surface net charge and hydrophobic area exposed to the solvent. Serum albumin when heat-
treated, goes through two stages (Kuznetsow et al., 1975). The first stage is reversible and is
carried out at 65°C while the second stage is irreversible which requires a high temperature
but does not necessarily result in a complete destruction of the ordered structure.

14
2.1.4 Previous work done
The conformational changes of BSA due to thermal aggregation was studied by using steady
state fluorescence and circular dichroism. The two tryptophan residues found in different
domain of the protein were targeted in order to study the mechanism of change by using
fluorescein-5-maleimide as dye. Differential scanning calorimetry was employed to study the
thermal denaturation processes of the main protein fractions of blood serum like α, -
globulins, γ-globulins, human serum albumin with or without fatty acids. By changing the
concentration protein stability can be studied. In order to detect the relationship between the
concentration and protein stability was studied by using various the concentrations of BSA.
Aggregation of BSA due to thermal stress was determined by native gel electrophoresis
(Arakawa et al., 1999). Thermostability of BSA and HSA was checked by DSC (Michnik et
al., 2006). The changes that occurred in the structure of the BSA due to temperature 130ºC
were studied (Moriyama, 2008).
2.2 Conventional techniques for protein structure determination
and their limitations
Table-2.1: Different techniques used for the detection of structure of proteins
Techniques Information about the structure of
protein
Mass Spectrometry Primary Structure
Fourier Transform Infrared Spectroscopy
(FTIR) Secondary Structures
Raman Spectroscopy
Secondary Structures
Circular Dichroism Spectroscopy (CD)
Far UV-Secondary Structure
Near UV- Tertiary structure
Ultraviolet/Visible Spectroscopy
(UV/VIS)
Tertiary Structures
Fluorescence Spectroscopy Tertiary Structures
Nuclear Magnetic Resonance
Spectroscopy (NMR) Tertiary and Quaternary Structures

15
X-Ray Crystallography
Tertiary and Quaternary Structures
Electrophoresis
Aggregation or Fragmentation
and also tertiary structure in some cases
Differential Scanning Calorimetry (DSC)
Thermal Stability
Thermo gravimetric Analysis (TGA) Thermal Stability
2.2.1: Mass spectroscopy
It is an analytical technique used to determine the elemental composition, chemical structure of a
sample by ionizing them to generate charged molecules or molecular fragments
Limitations
Restricted to some proteins based on their molecular weight
Able to give information about protein primary structure only
2.2.2: Raman spectroscopy
Raman scattering is a powerful spectroscopic technique is based on the principle that light of
a known frequency and polarization is scattered from a sample. The scattered light is used to
diagnose the internal structure of molecules and crystals. Raman spectroscopy can be applied
for reaction monitoring, chromatograpic detection, environmental monitoring and corrosion
studies. Raman spectroscopic study on different protein like BSA was done in order to detect
the sequence and primary structure (Izutsu et al. 2002).
Limitations
Detection through Raman spectroscopy many times not possible because it produces
weak signals
High rejection of scattered laser light must be provided by the spectrometer

16
2.2.3: Circular Dichroism
This spectroscopic study is very simple and is regarded as the extensively sensitive to protein
secondary structure. It can give information both in qualitative as well as qualitative manner.
Optically active chromophores absorb different amount of right and left polarized light, this
difference in absorbance results in either a positive or negative absorption spectrum. A
weaker CD spectrum is obtained along with an increasing degree of denaturation. Even if
there are high concentrations of denaturants the protein conformational stability can still be
monitored by CD spectra.
Limitations
Extremely sensitive to local environment and the conformational changes near the
aromatic groups and the disulfide bonds (Prieto et al., 1997).
Hard to quantitate the secondary structural component percentages.
2.2.4: Ultra violet spectroscopy
The optical spectroscopic technique spectroscopy is one of the most important methods to
determine protein properties. It is a reliable accurate analytical laboratory assessment
procedure for analysis. Targeting chromophoric groups it can provide information about
protein concentrations and the immediate environments. The change in UV or fluorescence
signal can be negative or positive, depending on the protein sequence and solution properties.
Limitations
Absorbance cannot accurately indicate either conformational stability or protein
concentration
2.2.5: Fluorescence Spectroscopy
The dynamic and noninvasive fluorescence measures the emission energy after the molecule
has been irradiated into an excited state. Since the fluorescence is related to the solvent
conditions even in the absence of conformational changes, it is useful to study solvent-protein
interactions. Protein stability was monitored by fluorescence spectroscopy (Eftink et al.,
1994)

17
Limitations
Very sensitive and by quenching process fluorescence intensity of a given substance
decreases and accurate results can not be obtained (Davis et al., 1987).
2.2.6: Nuclear Magnetic Resonance Spectroscopy
NMR is the foremost experimental method to study dynamic properties of proteins, nucleic
acids, a variety of low molecular weight compounds of biological, pharmacological and
medical interests. NMR can generate structures at atomic resolution. It can be applied in
solution with an adequate amount of proteins (Middaugh et al., 1990). At the atomic
resolution, 3D structures and secondary structure of proteins can also be determined (Xu et
al., 1997). It can provide estimation for both of the extent and location of the secondary
structure (Reid et al., 1997). Kinetic study of protein was done by NMR method (Dobson et
al., 1998)
Limitations
Complex interpretation
Can be applied to small proteins and multidimensional NMR may allow a molecular
weight up to 60 kD (Clore et al., 1998).
2.2.7: X-ray crystallography
X-ray crystallography is regarded as the most important and investigational technique that
applies the X-rays to prepare crystals structures. It can reliably provide 3-D molecular
structures, from global folds to atomic details of bonding. The knowledge of accurate
molecular structures from X-ray is a prerequisite for rational drug design and for structure
based functional studies, in order to develop the effective therapeutic drugs
Limitations
Crystal formation is not available for most of the proteins.

18
It can give only solid state information.
2.3 Techniques used in the study
2.3.1 Fourier Transform Infrared Spectroscopy
FTIR is flexible and used to give information in diverse range of environment. This powerful
laser detects the denaturation of proteins by analyzing the secondary structural components
which are generally -helix, -sheets, -turns and 310 helix. When a sample is placed in IR
source, the energetic light creates molecular vibrations at a particular wavelength. IR
spectroscopy monitors the vibrational intensity i.e. occurs due to stretching or bending and
wave length of absorption by a sample. Total 9 characteristics of Amide bands are present in
the peptide sequences of protein. Amide-I and Amide-II are associated with the IR spectrum.
Amide-I arises due to C=O stretching and usually related to the backbone conformation. It is
generally located in the region of 1600 cm-1
to 1700 cm-1
(Kong et al., 2007).
Table-2.2: The characteristic IR bands of the proteins and peptides
Designation Approximate
frequency (cm‾1
) Description
Amide-A 3300 NH stretching
Amide-B 3100 NH stretching
Amide-I 1600-1690 C=O stretching
Amide-II 1480-1575 CN stretching, NH bending
Amide-III 1229-1301 CN stretching, NH bending
Amide-IV 625-767 OCN bending
Amide-V 640-800 Out-of-plane NH bending
Amide-VI 537-606 Out-of-plane C=O bending
Amide-VII 200 Skeletal torsion
The above data obtained from Elliott and Ambrose, Krimm and Bandekar, Banker
and Miyazawa et al.
2.3.1 (a) Band Assignments
Amide-II band is found in between 1510-1580 cm-1
. It arises due to N-H bending, C-N and
C-C stretching. -helix is found at the region of 1548 cm-1
in Amide-II. In Amide-I,

19
-sheet absorption is nearly 1640 cm‾1
and -helix absorbs near 1652 cm-1
. Amide-I is more
sensitive than the Amide-II. By analyzing the peaks at corresponding region, the structure
and the changes can be marked.
For analysis, there are many methods have been used like-curving fitting method usually
meant to quantitate the area of each component. BOMEN GRAM/32 software can be used to
estimate data analysis. There are several softwares are used to quantitate the relative area of
each component. Data analysis can be done by taking the double derivative of the spectrum.
Table-2.3: Deconvoluted amide I band frequencies and related secondary
structure structural components of protein in H2O media.
Mean frequencies (Hz)
Assignment
1624±1.0
-sheet
1627±2.0
-sheet
1633±2.0
-sheet
1638±2.0
-sheet
1642±1.0
-sheet
1648±2.0
Random
1656±2.0
- Helix
1663±3.0
310 Helix
1667±1.0
-Turn
1680±2.0 -Turn
1685±2.0 -Turn
1691±2.0 β-sheet
1696±2.0 β-sheet

20
2.3.1(b) Advantages of FTIR
It can produce accurate results with less amount of samples
Fast and non invasive
Gives information at any type of environment and easy to operate
Gives information about secondary structure, stability and also structural stability of
proteins
The only limitation is that it requires different softwares for data analysis
2.3.1 (c) Structural changes of proteins detected by FTIR
FTIR is a well established analytical tool for the detection of protein structure. Pressure
induced alterations in secondary structure of ribonuclease-A was studied by Conventional
FTIR spectroscopic method. This spectroscopic technique has been carried out to investigate
the thermal denaturation of α-actinin (Han et al. 1998). Sugar additives like sucrose,
trehalose improves the stability of Human serum Albumin during Lyophilization. Infra red
method can be used to study hemoglobin reactions (Dong et al., 1994)
2.3.2 Electrophoresis Methods to Study Aggregation or Fragmentation
Electrophoresis is an analytical technique used to separate and purify macromolecules like
proteins and nucleic acids based on their size, charge or conformation. For the separation of
proteins, PAGE (Poly Acrylamide Gel Electrophoresis) is used. PAGE is basically of two
types: Native PAGE and SDS-PAGE.
2.3.2 (a) Native Gel Electrophoresis
Native or non-denaturing gel electrophoresis is run in the absence of any denaturant like SDS
and used for separation of non denatured proteins. This process gives clear cut definition
about the protein native structure.
Electrophoresis separation in a native gel may produce information both on sizes and charges.
The disadvantage is that it is a time taking

21
The non denaturing gel electrophoresis is used to study the kinetic and thermodynamic
properties of human erythropoietin (Arakawa et al. 2000).
2.3.2 (b) Sodium Dodecyl Sulfate Polyacrylamide Gel Electrophoresis
It is very common process which gives the information about the molecular weight of
an unknown protein. It can not give any information about the native form of proteins.
2.3.3 Differential scanning calorimetry
It is a thermo analytical process by which the physical changes of a substance can easily be
detected. As the enthalpy change, is a function of temperature of the sample increased or
decreased, it is measured by DSC. The specific heat of a sample can be calculated by
measuring the energy required to increase in the temperature of the sample. As the sample is
provided through a constant range of temperature the physical transitions occurred and these
are measured through DSC. This transitions occurred due to making and breaking of the
bonds there by enthalpy transitions can be determined. The effect of surfactant like SDS on
the stability of BSA was studied and detected by DSC (Giancola et al. 1997)
2.3.3 (a) Principle of operation
When a constant amount of heat is supplied to a sample it undergoes state change
phenomena. During physical change, sample forms different transitions. The transitions
include glass transition (Tg), crystallization (Tc), melting (Tm). Based on these thermal
transitions, protein stability can be detected. It can be use to characterize thermal properties
of materials and determine the heat capacities, melting enthalpies and transition points
accordingly by rate. Depending on the varying thermal behavior of the sample, the energy
will be taken or diffused from the sample, and the temperature difference will be sensed as an
electrical signal to the computer. As a result, an automatic adjustment of the heaters makes
the temperature of the sample holder identical to the reference holder. DSC can also be used
to study the water of hydration of pharmaceuticals and excipients. DSC can be applied to the
thermal analysis of impurity of raw materials during in-process, scale-up and quality control.
It can also be used to determine the storage conditions of finished products. It is very
sensitive to concentration of the protein i.e. if the accurate concentration is not maintained
then it will not produce the perfect result. DSC measured the stability of proteins by
measuring the Tm value. The effect of different denaturants like SDS on BSA is detected by

22
Differential scanning Calorimetry. Themo sensitive enzyme like yeast alcohol dehydrogenase
can be stabilized by sucrose detected by Calorimetry (Nath et al.1997).
2.3.3 (b) Glass transition temperature
It is a critical temperature at which the material undergoes a change in the physical state i.e.
from hard, brittle state to a rubbery, elastic and flexible state. In glass, there are no particular
molecular arrangements. In glassy state, the molecular motion is arrested due to high
viscosity. Polymers in amorphous state depend on the mobility of the polymers and
minimization of Gibb’s free energy.
2.3.3(c) DSC in some other uses
Protein folding, unfolding and stability study
Biopharmaceutical formulations development and characterization
Process development.
Protein engineering studies
Rank order binding.
Antibody domain binding studies.
Characterization of membranes, lipids, nucleic acids and micellar systems.
Assessment of the effects of structural change on a molecule’s stability.
Assessment of biocompatibility during manufacturing.
2.3.4 Thermo gravimetric Analysis (TGA)
TGA measures sample mass loss and the rate of weight loss as a function of temperature or
time. TGA provides an important tool to characterize and quantify the moisture content in
pharmaceutical materials. The measurements are used primarily to determine the thermal
and/or oxidative stabilities of materials as well as their compositional properties. The
technique can analyze materials that exhibit either weight loss or gain due to decomposition,
oxidation or loss of volatiles (such as moisture). The thermal analysis of protein is carried out
to measure the weight loss of Lysozyme (Liao et al. 2002).
2.3.4 (a) Principle of operation
A test sample is placed in an alumina/platinum sample holder that is attached to an analytical
balance. After that the sample is heated up to certain temperature maintained by a

23
thermocouple as it has to be set before. TGA curves shows percentage of weight verses
temperature.
2.3.4 (b) TGA in some other uses
Analysis of materials
Decay temperatures
Degradation rate
Product self life
Damage due to oxidative stress
Evaluation of polymer flammabilities
Thermal stabilities studies
Identifying the polymers through Fingerprinting
Moisture and volatile Content
Analysis and characterize the evolved gases using TGA
Effects of various parameters on materials
Moisture induced aggregation via disulfide scrambling was also detected in lyophilized
proteins such as bovine serum albumin, ovalbumin, glucose oxidize, and -lactoglobulin.
2.3.5 Spray drying
Spray drying is a one-step powder generating operation from liquid feed to its dried
particulate form through exposure to drying air. Air is used as a heated drying medium, and it
may flow along with the direction of the product and also in the opposite to the product.
There are several constructive designs and approaches for spray dryer. A systematic
approach was developed in order to get a solution form rational spray dryer that leads to save
cost, time and easy to handle (Nath et al. 1998). The effect of excipient and spray drying
parameters was studied (Andya et al. 1999).
2.3.5 (a) Instrumental Operation - Spray dryer takes the feed through a polypropylene pipe
by a pump. Then the liquid steam comes in contact with the atmospheric air drawn through
the air filter. There is a heater in the instrument in order to convert the atmospheric air to hot
drying gas. The aspirator motor produces the required amount of vacuum in order to carry out
the process The liquid steam is spray dried through the nozzle and products are collected

24
through the drying chamber and in the cyclone separator collection pot and the air is released
to the atmosphere. These are various parts of the spray dryer.
Aspirator
Compressor
Pump
Heater
Nozzle
Drying chamber
2.3.5 (b) Applications in various fields-
Table-2.4: Spray drying applications
Pharmaceutical industry
Antibiotics, medical ingredients, Additives
Food industry Milk powder, Coffee, Tea, Eggs, Cereal,
spice, Flavorings
Industrial
Paint pigments, ceramic materials, catalyst
supports, Bone and tooth amalgams
Beverages, colorings and plant extracts Milk
and egg products Plastics, polymers and
resins Soaps and detergents Textiles etc
2.3.5 (c) Spray drying of proteins
Sucrose and trehalose preserve the lysozyme native structure when they are spray dried with
the protein. The activity and stability of trypsinogen after spray drying was studied by
(Tzannis et al., 1999). The effect of sucrose, trehalose, mannose, on the thermal stability of
the protein transglutaminase by spray drying was studied (Cui et al., 2000). Trehalose
protects yeast alcohol dehydrogenase from stress through spray drying (Yosii et al. 2007).

25
The widely used excipient trehalose protects the model protein lactate dehydrogenase through
spray drying (Adler et al. 1999). The various effects of parameters and formulations on the
preservation of spray dried β-galactosidase was examined (Broadhead et al. 1994). The
change in shape and morphology of three spray-dried protein powders were analyzed by
scanning electron microscopy, X-ray diffraction and residual moisture analysis (Costantino et
al.1997). In order to study the adsorption behavior of proteins BSA and β-lactoglobulin were
spray dried and results were analyzed by fluorescence quenching mechanism (Landstrom et
al. 1999). The activity and stability of trypsinogen effect of sucrose during spray drying was
studied (Tzannis et al. 1999).

26
Chapter 3
Materials and methods
3.1 Materials
The following chemicals are used in the study.
Table- 3.1: Different chemicals used in the experiments
Serial No. Chemicals with Catalogue No. Company Name
1 Bovine Serum Albumin (11201800101730) Merck Private Limited
2 Trehalose (625625) Calbiochem
3 Mannitol (134889)
Sisco Research
Laboratories Private
Limited
4 Ammonium sulfate (61750705001730)
Sisco Research
Laboratories Private
Limited
5 Maltodextrin (RM 1249) Himedia laboratories
Private Limited
6 Hydrochloric acid (HCl) Himedia, laboratories
Private Limited
7 sodium hydroxide (NaOH) Himedia, laboratories
private Limited
8 NaH2PO4 (61784505001730) Merck Private Limited
9 Na2HPO4 (61754905001730) Merck Private Limited

27
10 Acrylamide (8.008301000) Merck Private Limited
11 Bis acrylamide (REF MB 005) Merck Private Limited
12 Ammonium persulfate (RM1096) Merck Private Limited
13 Bromophenol blue (REF RM 117), Merck Private Limited
14 Coomassie brilliant blue-G (REF RM
1219), Merck Private Limited
15 TEMED (MB026) Merck Private Limited
16 Acetic acid (AS001) Merck Private Limited
17 Glycerol (61756005001730) Merck Private Limited
18 Methanol (82228305031730) Merck Private Limited
19 Potassium bromide (P0220) RANKEM, Ranbaxy

28
The required equipments used in study are given below.
Table- 3.2: Instrument used in the study
Serial No Equipments Source
1
Water bath LAUDA Ecoline- staredition RE-104
2 Refrigerator LG
3 Analytical balance Afcoset ER-200A
4 Ultra pure water system Millipore
5 Ultra Low Temperature
freezer Remi- RQFP 265
6 pH meter Systronics
7 Vortex Mixer Genie
8 Spray dryer Labultima-LU20
9 Thermo gravimetric
Analyzer SHIMADZU, DTG-60H
10 Electrophoresis Genie
11 Differential scanning
calorimetry Jupiter-NETCSCH STA 449C
12 Fourier Transform
Infrared Spectroscopy Perkins Elmer-Spectrum RXI

29
3.2 Methods
3.2.1 Spray drying of BSA with different excipients
Fig. 3.2.1 Laboratory Spray Dryer (Labultima-LU-20)
3.2.1 (a) Parameter optimization
Spray drying parameter optimization was done by considering the inlet air
temperature, out let air temperature, aspirator motor speed, pump flow rate and feed
concentration.
In order to get the accurate parameter for protein, spray dryer was run at the following
conditions like inlet temperature starting from 90ºC to160 ºC, accordingly the outlet
temperature from 50°C to 140°C aspirator motor speed 40% to 55%, pump flow rate 8
to12 and the feed concentration 0.5gm/10ml,1gm/10ml, 2gm/ml etc.
The optimized parameters were-
Inlet temperature- 130°C
Outlet temperature- 90°C
Feed pump speed- 45
Aspirator speed- 10
Feed concentration- sample: distilled water :: 7.5g :50ml

30
3.2.1(b) Spray drying
For spray drying, the ratio of protein: excipient was 1:2 (w/w) i.e. 2.5 gm of protein
and 5 gm of excipient dissolved in 50 ml of water. That was used for the preparation
of the feed solution.
All the parameters were set and the instrument was start for run. The air was drawn
form the atmosphere by aspirator. Air filter supplies the filtrate air to the instrument.
The atmospheric air was converted to hot gas by heater
Before drying the sample solution single run of water would be done for internal
deblocking. The pump flow was started after the unit gets the desired inlet air
temperature.
Through pump, feed solution was taken to the system and by hot gas it atomized in to
droplets through nozzle. As the process continues, the final powder was deposited in
the drying chamber and cyclone separator.
After the completion of the sample solution, the instrument was again set for cooling
by reducing the inlet air temperature below 100°C.
The final dried product was collected from drying chamber collection pot and cyclone
separator collection pot and kept for further study in desiccators.
3.2.2 Sample preparation:
Samples were prepared by giving heat treatment in a water bath at different temperature (such
as 65ºC and 75
ºC) with different time interval like 5, 10, 40 & 60 minutes. After heat
treatment, they were put in ice for 2-3 minutes. These samples were stored in desiccators for
maintaining a moisture free environment. These prepared samples were taken for the IR
spectroscopy, DSC directly and for the Native Gel Electrophoresis they were taken along
with the Phosphate Buffer. Sodium phosphate buffer was prepared by Disodium hydrogen
phosphate (NaH2PO4-Molecular weight-156.01) and Sodium dihydrogen phosphate
(Na2HPO4- Molecular weight-141.96) and pH was adjusted to 7.

31
3.2.3 Thermo gravimetric Analysis for protein formulations
Thermo gravimetric analysis was done in order to detect the moisture content of the sample.
Both formulated as well as the native protein was analyzed by putting them in sealed
chamber and the temperature was set 150ºC through the thermocouple. That gives the
information about the moisture content measurement due to weight loss. The percentage of
moisture content in the sample is determined by the formula:
3.2.4 Native Electrophoresis of samples
Electrophoresis procedure was followed according to standard protocol.10% of native
polyacryalamide gel was prepared in order to study the denaturation process.
3.2.4 (a) Preparation of the stock solutions
Acryl amide monomer stock was prepared by adding acryl amide 30 gm, bis acryl
amide 0.8gm and making the volume up to 100ml with distilled water.
By addition of tris buffer-18.66 gm with distilled water 75 ml. separating gel buffer
was prepared After adjusting the pH 8.8 with dilute HCl the volume was made up to
100ml.
Stacking gel buffer was prepared by adding 6.55 gm of tris buffer was to 75ml of
distilled water and then the pH was set to 6.8. Final volume was made up to 100ml by
DW.
Bromophenol blue about 0.1 gm mixed with glycerol 2ml and stacking gel buffer 2.5
ml for the preparation of sample buffer.
Tank or running buffer was prepared by tris buffer 0.5 gm and glycine 14.4 gm. The
pH was adjusted to 8.3 and volume was adjusted to 1000ml.
In order to prepare the staining solution, coomassie brilliant blue 2 gm, methanol
500ml, acetic acid 100 ml dissolved in 500 ml distilled water.
Distaining solution was prepared by methanol 500 ml, acetic acid 100 ml and distilled
water 500ml. Stock solutions like-acryl amide monomer, stacking gel buffer,

32
separating gel buffer, running buffer, sample buffer were prepared and kept in
refrigerator.
After preparation the stocks were kept in the refrigerator. Ammonium per sulfate was
prepared freshly every time.
3.2.4 (b) Gel preparation and run
Running gel and stacking gel were prepared fresh for each run.
By addition of acrylamide monomer 1.7 ml, separating gel buffer 1.3 ml, distilled
water 1.9 ml, APS 50µl and TEMED 10µl running gel was prepared.
Stacking gel was prepared by adding acryl amide monomer 0.5 ml, stacking gel buffer
0.4 ml, distilled water 2.1 ml, APS 30µl and TEMED 10 µl.
After preparation of the running gel, it was poured in between the glass cascades
which were sealed tightly. After the casting of the running gel, stacking gel was
poured in to that and comb was inserted in order to form the wells.
10µl of samples along with sample buffers were loaded in the wells. The migrated
samples produce bands under the influence of constant amount of electric field.
3.2.4 (c) Staining and de staining of the gel
Gels were stained in the coomassie staining solution and kept for 2-3 hours and after that
destaining solution was added in order to visualize the bands.

33
3.2.5 Fourier Transform spectroscopy
Fig. 3.2.2 FTIR (Perkins Elmer-Spectrum RXI)
For FTIR spectroscopy, solid sample were used. Samples were prepared as described before
in the water bath giving different temperatures and at various time points. Fresh prepared
samples were taken for study. 2-3 mg of solid samples were milled with potassium bromide
in order to mix properly. Sample and KBr ratio should be 1:3.
3.2.5 (a) Pellet preparation and scanning
Pellets were prepared by adding the sample and KBr.
The prepared pellets were scanned through the whole range starting from 4000cm-1
to
400 cm-1
. The plots were done by taking wave number against absorbance in X and Y
axis respectively.
For analysis part, the peaks of Amide-I and Amide–II bands were considered which
is found in between 1600 and 1700cm-1.

34
3.2.6 Differential scanning Calorimetry
Fig. 3.2.3 DSC Jupiter-NETCSCH STA 449C
Solid sample i.e. both formulated and as well as native protein at room temperature were put
in the sample pan in a closed chamber of the instrument. The scanning was done starting
from room temperature 100ºC at a rate of 5
ºC per minute. The difference in the temperature
between sample and reference was plotted against the specific heat of the sample. The DSC
graph would show physical changes of the sample due to heat by measuring Tg, Tc and Tm of
the sample.

35
Chapter 4
Results and Discussion
Protein denaturation is modification in conformation not accompanied by rupture of peptide
bonds. It ultimately leads to totally unfolded polypeptide structure. Protein denaturation can
either be reversible or irreversible. It can be due to change in pH, addition of several
denaturants, due to heat and so on. Denaturation and aggregation of proteins are commonly
associated with the alterations in the populations of the 310 helix, α-helix, β-sheet, and β-
turns. The temperature has a major effect on the stability of the protein as it directly related to
breaking of the secondary structure. With increase in the temperature the weak hydrogen
bonds are disrupted and hydrophobic residues come out which leads to change in
conformation (Jaenicke et al., 1990). Low and high pH results hydrolysis and deamidation
reactions (Sun et al., 1998).
Fig.4.1.1 Spray dried protein- Mannitol Fig.4.1.2 Spray dried protein-Ammonium sulfate
Fig.4.1.3 Spray dried protein- Maltodextrin Fig.4.1.4 Spray dried protein- Trehalose

36
4.1 Moisture content determination through Thermo Gravimetric Analysis
(TGA)
Proteins are more stable in solid state than that of in aqueous solution. In presence of
water they aggregates or may also form disulphide links in between the Cys residues thus
leading to a change in the conformation and it also undergo several biochemical reactions like
oxidation and deamidation. Thus presence of moisture affects the stability of the protein in a
negative manner.
Thermo gravimetric analysis method has been employed in this study to find the
percentage moisture content of proteins. For a protein to be stable at optimum condition, the
percentage of moisture content should be less (Town et al., 2000). There are several
reactions that take place in the presence of water there by making the protein dynamically
active resulting in the change in its conformation. In the presence of water, glass transition
value reduces and phase change occurs. Protein molecules transits from a constrained,
viscous and supersaturated state to a relaxed state. The hydrogen bond breaks as the
temperature increases there by it brings the change in the structure of the proteins. Molecular
mobility is also increased due to increase in the water content. From thermodynamic point of
view, the structural alterations occur due to the imbalance in the mobility of the molecules
which leads to the change in ΔG. In this way the native balanced state of protein becomes
imbalanced (Ragoonanan et al. 2007). The residual moisture content inversely correlate to the
stability. Lippert et al. found that hydroxyl group plays a major role for maintaining the
stability of phosphofructokinase and lactate dehydrogenase. Excipient plays a major role in
stabilizing the proteins by satisfying the required hydrogen bonds in order to maintain its
native structure even at the absence of its hydrated environment, during the deleterious
reactions like phase separation and solute crystallization. They act as the water substitute
during drying. Free radical releases are greatly delayed and even at high temperature the
protein remains active. Trehalose, sucrose, maltose have shown to protect the protein
structure during dehydration (Crowe et al. 1995).

37
Table- 4.1: Percentage of moisture at room temperature.
Analyzing the data obtained from TGA, it is found that BSA formulated with
Mannitol contained less moisture content than samples formulated with other excipients.
Trehalose formulation yielding hygroscopic and sticky products was found to have highest
moisture content. After the analysis of the data through TGA, the samples are tested through
the other techniques.
4.2 Aggregation study by Native Gel Electrophoresis
Aggregation is a common phenomenon which results from several types of reactions and
uncontrolled folding. The chemical and physical transitions that a protein undergoes, changing
from its native state to the unfolded state may result in aggregation, crystallization, degradation
and denaturation. Aggregation can be regarded as an uncontrolled folding and unnatural folding,
since both balance the exposed and buried hydrophobic surface areas of proteins. Hydrophobic
interaction is the predominant driving force for both protein folding and aggregation.
Aggregation occurs to minimize the thermodynamically unfavorable interactions between
solvent and exposed hydrophobic residues of proteins (Yanli, 2005).
Name of the Sample % of moisture
BSA 10.354
BSA formulated
with mannitol
3.149
BSA formulated with
ammonium sulfate
3.607
BSA formulated with
trehalose
8.094
BSA formulated with
maltodextrin
7.709

38
Fig. 4.2.1: It shows electrophoresis of BSA treated at different temperature for 60
minutes. Lane-1 shows native BSA i.e. control, Lane-2 shows BSA treated at 55°C,
Lane-3 shows BSA treated at 60°C, Lane-4 shows BSA at 65
°C, Lane-5 shows BSA at
70°C, Lane-6 shows BSA at 75
°C
Fig. 4.2.2: It shows electrophoresis of BSA treated at 65°C for 10 minutes. Lane-1 shows
native BSA i.e. control, Lane-2 shows BSA treated at 65°C for 10 min, Lane-3 shows BSA
with maltodextrin, Lane-4 shows BSA with trehalose, Lane-5 shows BSA with ammonium
sulfate, Lane-6 shows BSA with mannitol
L1 L2 L3 L4 L5 L6
L1 L2 L3 L4 L5 L6

39
Fig. 4.2.3: Electrophoresis of BSA treated at 75°C for 10 minutes. Lane-1 shows native BSA
i.e. control, Lane-2 shows BSA treated at 75°C for 10 min, Lane-3 shows BSA with
trehalose, Lane-4 shows BSA with maltodextrin, Lane-5 shows BSA with ammonium sulfate,
Lane-6 shows BSA with mannitol
Fig. 4.2.4: Electrophoresis of BSA treated at 65°C for 60 minutes. Lane-1 shows native BSA
i.e. control, Lane-2 shows BSA treated at 65°C for 60 min, Lane-3 shows BSA with
trehalose, Lane-4 shows BSA with maltodextrin, Lane-5 shows BSA with ammonium sulfate,
Lane-6 shows BSA with mannitol
L1 L2 L3 L4 L5 L6
L1 L2 L3 L4 L5 L6

40
Fig. 4.2.5: Electrophoresis of BSA treated at temperature 75°C for 60 minutes. Lane-1 shows
native BSA i.e. control, Lane-2 shows BSA treated at 75°C for 60 min, Lane-3 shows BSA
with trehalose, Lane-4 shows BSA with maltodextrin, Lane-5 shows BSA with ammonium
sulfate, Lane-6 shows BSA with mannitol
Comparing the above figures it is quite clear that Mannitol shows highest degree of
protection as it produces the bands nearly equal to the bands of untreated control. Ammonium
sulfate also shows protection against the thermal stress up to certain extent and trehalose does
not show any significant protection where as maltodextrin forms similar type of band like the
denatured ones hence shows no protection. Thus excipient decreases the aggregation of the
protein and protects it against the thermal denaturation.
L1 L2 L3 L4 L5 L6

41
4.3 Fourier transfer spectroscopic study on protein Characterization through FTIR
In FTIR spectroscopy, the light is directed onto the sample of interest, and the
intensity is measured using an infrared detector. The intensity of light striking the detector is
measured as a function of the mirror position, and this is then Fourier-transformed to produce
a plot of intensity vs. wave number. We used FTIR analysis to evaluate changes in native
secondary structure during thermal denaturation and spray drying of both control and
formulated samples. Amide I and amide II bands are two major bands of the protein infrared
spectrum out of the 9 characteristic bands given by peptide unit. The amide I band (between
1600 and 1700 cm-1
) is mainly associated with the C=O stretching vibration (70-85%) and is
directly related to the backbone conformation. Amide II results from the N-H bending
vibration (40-60%) and from the C-N stretching vibration (18-40%). Amide-I is the most
intense absorption band in the proteins, that’s why it is taken into consideration during
analysis.
Structural analysis is done through FTIR. For analysis, the most sensitive Amide-I
band is considered here. Samples were prepared according to method described in material
and method section i.e. by heat treating them at constant temperature i.e. at 65°C and 75°C
for different time intervals like: for 5, 10, 40 and 60 minutes in order to detect the change
after thermal treatment. Bovine serum albumin basically under goes two types of structural
changes after heat treatment (Kuznetsow et al., 1975). The first stage i.e. is heating up to
65°C is reversible while above to that temperature is regarded as the second stage which is
irreversible. It is reported that -sheets are formed when the protein is heated at 65°C and
70°C. Formation of -sheets were concentration dependant. FTIR was carried out by
considering the second derivative form of Amide-I region of the whole original spectrum.
Denaturation of proteins is commonly associated with the alterations in the populations of the
α-helix, β-sheet, and random coil structures. The -helix is energetically less stable than the,
β-sheet. As the percentages of denaturation increases the -helix content decreases while in
the reversible structural stage, some of the alpha-helices are transformed to random coils and
aggregates are formed through the hydrogen bonding of beta-sheets between monomers.
Increasing the temp. above the reversible stage, unfolding of the pocket exposing Cys-34
takes place, resulting in the formation of disulphide bridges which are covalent bonds, thus
the stage is irreversible. The percentage of α-helices can be calculated by the relative area at
1655 cm−1
. The percentage of β-sheets can be calculated by the relative peak area at 1637

42
cm−1
. The percentage of β- turns can be calculated by adding the areas of all β-turn bands
between 1670 and 1690 cm−1.
The band area at 1648 cm−1
was assigned to random coil. By
comparison, the result can be obtained. The secondary structure of BSA is composed of 67%
helix, 10% turn, and 23% extended chain, and no β -sheet is contained (Murayama et
al.,2004). Several workers have pointed out several theories regarding the secondary structure
of the proteins i.e. particularly α-helix content in BSA. Studies indicate that the secondary
structure of BSA contains about 68% - 50% alpha-helix and 16% -18% beta-sheet. But
according to X-ray crystallography, there is no beta-sheet in the structure of native serum
albumin. BSA is having 54% of α-helix measured by Optical rotatory dispersion. BSA is
having 55% of α-helix measured by infrared spectroscopy. BSA is having 55-60% of α-helix
measured by Raman spectroscopy. BSA is having 68% of α-helix measured circular
dichriosm. Though different authors stated differently about the percentages of α-helix, but it
is clear that BSA contains maximum helical region. In this study, the major concerned is
given to α-helix.
In the double derivative form of the Amide-I band, specific wave numbers correspond
to specific components of protein. These wave numbers give information about the particular
band. According to Dong et.al. and Susi et al. 1624 cm‾1,
1627 cm‾1
, 1633 cm‾1
, 1638 cm‾1
,
1642 cm‾1
are assigned to β –sheet, 1648 cm‾1
is assigned to random coils, 1656 cm‾1
is
assigned to α-helix, 1663 cm‾1
is assigned to 310 helix, 1667 cm‾1
is assigned to β-turns. For
the data analysis of FTIR, several methods are used, like: relative area calculation (for
quantifying the percentage of structural components), Curve fitting method and Gauss peaks
can be drawn. In this study, due to unavailability of software, all the methods could not be
practiced. We have analyzed the second derivative spectra of the deconvoluted form of the
amide-I region of the protein. During result analysis we got significant difference in the no.
of bands, band shapes, appearance and disappearance of bands of control, the thermally
denatured native and formulated proteins(after spray drying). For the native state, the band is
fairly symmetric and has a peak maximum around 1655 cm-1
which corresponds to alpha-
helical structure and 1660-1666 cm-1
corresponding to 310 helix. 310 helix is rarely found in
the proteins. It is like helical portion of the protein in which the 1st atom is paired with 3
rd
atom not like 1st
with the 4th
. In contrast, the denatured proteins show no peaks at the region
of the 1655 cm-1
and additional maximum peak between 1690 and 1667 cm-1
, indicative of
the predominance of beta-sheet and beta-turn structures.

43
Using Ammonium sulfate as an excipient
Fig. 4.3.1 FTIR plots of native protein (black line i.e. reference at room temp.) protein with out
excipient heat treated (red line) and formulated sample (green line- spray dried with ammonium
sulfate at 65°C for 5 min treatment ). The graph shows second derivative form of the original
spectrum of Amide-I region (X-axis: wave number 1700-1600 cm‾1
and Y-axis: absorbance)
Fig. 4.3.2 FTIR plots of native protein (black line i.e. reference at room temp.) protein without
excipient heat treated (red line) and formulated sample (green line- spray dried with ammonium
sulfate at 65°C for 10 min treatment ). The graph shows second derivative form of the original
spectrum of Amide-I region (X-axis: wave number 1700-1600 cm‾1
and Y-axis: absorbance)

44
Fig. 4.3.3 FTIR plots of native protein (black line i.e. reference at room temp.) protein
without excipient heat treated (red line) and formulated sample (green line- spray dried with
ammonium sulfate at 65°C for 40 min treatment ). The graph shows second derivative form
of the original spectrum of Amide-I region (X-axis: wave number 1700-1600 cm‾1
and Y-
axis: absorbance)
Fig. 4.3.4 FTIR plots of native protein (black line i.e. reference at room temp.) protein with
out excipient heat treated (red line) and formulated sample (green line- spray dried with
ammonium sulfate at 65°C for 60 min treatment ). The graph shows second derivative form
of the original spectrum of Amide-I region (X-axis: wave number 1700-1600 cm‾1
and Y-
axis: absorbance)

45
Fig. 4.3.5 FTIR plots of native protein (black line i.e. reference at room temp.) protein without
excipient heat treated (red line) and formulated sample (green line- spray dried with ammonium
sulfate at 75°C for 5 min treatment). The graph shows second derivative form of the original
spectrum of Amide-I region (X-axis: wave number 1700-1600 cm‾1
and Y-axis: absorbance)
Fig. 4.3.6 FTIR plots of native protein (black line i.e. reference at room temp.) protein
without excipient heat treated (red line) and formulated sample (green line- spray dried with
ammonium sulfate at 75°C for 10 min treatment ). The graph shows second derivative form
of the original spectrum of Amide-I region (X-axis: wave number 1700-1600cm‾1
and Y-axis:
absorbance)

46
Fig. 4.3.7 FTIR plots of native protein (black line i.e. reference at room temp.) protein without
excipient heat treated (red line) and formulated sample (green line- spray dried with ammonium
sulfate at 75°C for 40 min treatment ). The graph shows second derivative form of the original
spectrum of Amide-I region (X-axis: wave number 1700-1600 cm‾1
and Y-axis: absorbance)
Fig. 4.3.8 FTIR plots of native protein (black line i.e. reference at room temp.) protein with
out excipient heat treated (red line) and formulated sample (green line- spray dried with
ammonium sulfate at 75°C for 60 min treatment ). The graph shows second derivative form of
the original spectrum of Amide-I region (X-axis: wave number 1700-1600 cm‾1
and Y-axis:
absorbance)

47
Total 8 peaks are there at different regions of the native protein graph i.e. at room
temperature. By comparing each peak, (Fig. 4.3.1) one can clearly conclude that formulated
sample producing the same types of peaks as that of the control. There is neither change in
the peaks position nor in the peak numbers.
Fig. 4.3.2 heat treated protein lacks peaks at the region of 1655cm‾1
which is related to the -
helix and also peaks are shifted from its original position can be marked. The peak found in
the region of 1687 cm‾1
is shifted to 1693 cm‾1
,1676 cm‾1
to 1679 cm‾1
and 1641 cm‾1
to 1644
cm‾1.
But in case of formulated ones, it does protect the band at 1655 cm‾1
and there is no
shift of peaks and the peak numbers and position are identical to that of control. Fig. 4.3.3
Treated protein lacks -helical peak at the region of 1655 cm‾1
and also peaks are shifted
from its original position can be marked. But in case of formulated ones, it gives protection to
the band at 1655 cm‾1
and there is no shift of peaks and the peak numbers and pertain are
identical to that of control. In Fig. 4.3.4 preserves all the peaks and there are no changes in
the original position. In case of the heat treated samples, -helical peak is absent indicating
that after heat treatment the -helix is strongly affected (Liao et al., 2002) and the formulated
sample is capable to protect the protein helicity. Fig. 4.3.4 Formulated sample can not able to
protect the protein structural component at 1655 cm‾1
and also clear shift of the bands and
new formation of band at 1693 cm‾1
. It produces same type of result to that of heat treated
one. Hence it can be seen that at 65 ºC for 60 minute i.e. protein when exposed to temperature
for more time, excipient cannot be able to give protection.
Fig. 4.3.5 Heat treated protein lacks peaks at the region of 1655cm‾1
which is related to the -
helix and also peaks are shifted from its original position can be marked. But in case of
formulated ones, it shields the band at 1655 cm‾1
and there is no shift of peaks and the peak
numbers and pertain are identical to that of control one. Fig. 4.3.6 Protein lacks peaks at the
region of 1655cm‾1
which is related to the -helix and also peaks are shifted from its original
position after heat treatment. But in case of formulated ones, it preserves the band at 1655
cm‾1
and all the peaks are remained conserved. Fig. 4.3 7 Protein lacks peaks at the region of
1655cm‾1
which is related to the -helix and also peaks are shifted from its original position
after heat treatment. But in case of formulated ones, it preserves the band at 1655 cm‾1
and
all the peaks are remained intact. Fig.4.3.8 Protein lacks peaks at the region of 1655cm‾1
which is related to the -helix and also peaks are shifted from its original position after heat
treatment and in case of formulated ones, it also does not able to protect the protein when

48
protein exposed for longer time i.e. for 60 min as the band at 1655 cm‾1
is also absent and and
the peak shifts and another peak at -sheet region is created.
From the above discussion this can be clearly concluded that this excipient protects the α-
helix at 1655 cm-1
and 310 helix at 1665 cm-1
and β-turn at 1687 cm-1
like that of native
protein where as the denatured one shows additional peak as β-sheet at 1693 cm-1
and β-turn
at 1667 cm-1
respectively. This indicates that ammonium sulfate formulated samples are
giving the protection at 65ºC and also 75
ºC but up to 40 minutes. But when the protein is
getting exposed to those temperatures for more time i.e. for 60 minute it can not give
protection by producing nearly equal peak, i.e. lacking the helical band at the region of 1655
cm‾1
and creation of new bands at the region of 1693 cm‾1
which is related to like that of heat
treated sample -sheet region (Dong et al.,1994)
Using Mannitol as an excipient
Fig. 4.3.9 FTIR plots of native protein (black line i.e. reference at room temp.) protein
without excipient heat treated (red line) and formulated sample (green line- spray dried with
mannitol at 65°C for 5 min treatment). The graph shows second derivative form of the
original spectrum of Amide-I region (X-axis: wave number 1700-1600 cm‾1
and Y-axis:
absorbance)

49
As per Fig. 4.3.9 the formulated sample conserves the peaks corresponding to β-turn at 1687
cm-1
310 helix at 1665 cm-1
α-helix at 1655 cm- 1
and β-sheet at 1628 cm-1
like that of native
protein where as the denatured one shows additional peaks corresponding to β-sheet at 1693
cm-1
and β-turn at 1667 cm-1
and β-sheet at 1632 cm-1
.
Fig. 4.3.10 FTIR plots of native protein (black line i.e. reference at room temp.) protein
without excipient heat treated (red line) and formulated sample (green line- spray dried with
mannitol at 65°C for 10 min treatment). The graph shows second derivative form of the
original spectrum of Amide-I region (X-axis: wave number 1700-1600 cm‾1
and Y-axis:
absorbance)
As per Fig. 4.3.10, the formulated sample conserves the peaks corresponding to β-turn at
1687 cm-1
and 1676 cm
-1 310 helix at 1665 cm
-1 α-helix at 1655 cm
- 1 and β-sheet at 1628 cm
-1
like that of native protein where as the denatured one shows additional peaks corresponding
to β-sheet at 1693 cm-1,
1642 cm-1
, 1632 cm-1
, and β-turn at 1680 cm-1
, 1667 cm-1
.

50
Fig: 4.3. 11 FTIR plots of native protein (black line i.e. reference at room temp.) protein
without excipient heat treated (red line) and formulated sample (green line- spray dried with
mannitol at 65°C for 40 min treatment). The graph shows second derivative form of the
original spectrum of Amide-I region (X-axis: wave number 1700-1600 cm‾1
and Y-axis:
absorbance)
As per Fig-4.3.11, the formulated sample conserves the peaks corresponding to β-turn at
1687 cm-1
, 1676 cm-1
, 310 helix at 1666 cm-1
α-helix at 1655 cm- 1
and β-sheet at 1628 cm-1
like that of native protein where as the denatured one shows additional peaks corresponding
to β-sheet at 1689 cm-1
and β-turn at 1667 cm-1
and β-sheet at 1632 cm-1
.

51
Fig. 4.3.12 FTIR plots of native protein (black line i.e. reference at room temp.) protein
without excipient heat treated (red line) and formulated sample (green line- spray dried with
mannitol at 65°C for 60 min treatment). The graph shows second derivative form of the
original spectrum of Amide-I region (X-axis: wave number 1700-1600 cm‾1
and Y-axis:
absorbance)
As per Fig: 4.3.12, the formulated sample conserves the peaks corresponding to β-turn at
1687 cm-1
, α-helix at 1655 cm- 1
and β-sheet at 1639 cm-1,
1628 cm-1
like that of native protein
where as the denatured one shows additional peaks corresponding to β-sheet at 1689 cm-1
and β-turn at 1667 cm-1
and β-sheet at 1641 cm-1
, 1632 cm-1
.
Fig. 4.3.13 FTIR plots of native protein (black line i.e. reference at room temp.) protein
without excipient heat treated (red line) and formulated sample (green line- spray dried with
mannitol at 75°C for 5 min treatment). The graph shows second derivative form of the
original spectrum of Amide-I region (X-axis: wave number 1700-1600 cm‾1
and Y-axis:
absorbance)

52
As per Fig. 4.3.13, the formulated sample conserves the peaks corresponding to β-turn at
1687 cm-1
, 1676 cm-1
, and β-sheet at 1628 cm
-1 like that of native protein where as the
denatured one shows additional peaks corresponding to β-turn at 1679 cm-1
and 310 helix at
1660 cm-1 and β-sheet at 1632 cm
-1.
Fig. 4.3.14 FTIR plots of native protein (black line i.e. reference at room temp.) protein
without excipient heat treated (red line) and formulated sample (green line- spray dried with
mannitol at 75°C for 10 min treatment). The graph shows second derivative form of the
original spectrum of Amide-I region (X-axis: wave number 1700-1600 cm‾1
and Y-axis:
absorbance)
As per Fig. 4.3.14, the formulated sample conserves the peaks corresponding to β-turn at
1687 cm-1
and 1676 cm-1
.α-helix at 1655 cm- 1
and β-sheet at 1639 and 1628 cm-1
like that of
native protein where as the denatured one shows additional peaks corresponding to β-sheet at
1694, 1644 and 1632 cm-1
. β-turn at 1681 and 1667 cm-1
and random coil at 1650 cm-1
.

53
Fig. 4.3.15 FTIR plots of native protein (black line i.e. reference at room temp.) protein
without excipient heat treated (red line) and formulated sample (green line- spray dried with
mannitol at 75°C for 40 min treatment). The graph shows second derivative form of the
original spectrum of Amide-I region (X-axis: wave number 1700-1600 cm‾1
and Y-axis:
absorbance)
As per Fig. 4.3.15, the formulated sample conserves the peaks corresponding to α-helix at
1655 cm- 1
random coil at 1648 cm-1
and β-sheet at 1639 and 1628 cm-1
like that of native
protein where as the denatured one shows additional peaks corresponding to β-turn at 1675
cm-1
and β-sheet at 1635 and 1632 cm-1
.

54
Fig. 4.3.16 FTIR plots of native protein (black line i.e. reference at room temp.) protein
without excipient heat treated (red line) and formulated sample (green line- spray dried with
mannitol at 75°C for 60 min treatment). The graph shows second derivative form of the
original spectrum of Amide-I region (X-axis: wave number 1700-1600 cm‾1
and Y-axis:
absorbance)
As per Fig. 4.3.16, the formulated sample conserves the peaks corresponding to β-turn at
1687 & 1676 cm-1
, α-helix at 1655 cm- 1
and β-sheet at,1628 cm-1
like that of native protein
where as the denatured one shows additional peaks corresponding to β-sheet at 1643 & 1632
cm-1
and random coil at 1649cm-1.
The double derivative of the deconvoluted form of Amide-I was taken for each sample. By
analyzing each peak of the graph it can be marked the effect of excipient on the heat treated
samples. After analyzing the FTIR plots for the protein formulation using mannitol as an
excipient, it concluded that this excipient (mannitol) conserves the peaks that correspond to
the β-turn at 1687 cm-1
, 1676 cm-1
, 310 helix at 1665 cm-1
, α-helix at 1655 cm- 1
and β-sheet
1639 cm-1
1628 cm-1
and random coil at 1650 cm-1
like that of native protein where as the
denatured one shows additional peaks corresponding to β-sheet at 1693 cm-1
,1643 cm-1
,
1632 cm-1
and β-turn at 1681 cm-1
, 1675 cm-1
, 1667 cm-1
and random coil at 1650 cm-1
.
Both at 75°C and 65
°C heat treatment it can protect upto an exposure time of 1hr. thus
conferring protection to the protein molecule and hence a good excipient.

55
Using Maltodextrin as an excipient
Fig. 4.3.17 FTIR plots of native protein (black line i.e. reference at room temp.) protein with
out excipient heat treated (red line) and formulated sample (green line- spray dried with
maltodextrin at 65°C for 5 min treatment). The graph shows second derivative form of the
original spectrum of Amide-I region (X-axis: wave number 1700-1600 cm‾1
and Y-axis:
absorbance).
Observing the FTIR plots for formulated protein using maltodextrin as an excipient (Fig-
4.3.17) it is clearly visible that, the plots of thermal denatured native protein goes side by side
with that of the formulated protein. In the formulated protein the basic peak that corresponds
to the -helix at 1655 cm-1
is not conserved. So the excipient is not working in the specified
temperature for the specific time of exposure.

56
Fig.4.3.18 FTIR plots of native protein (black line i.e. reference at room temp.) protein with
out excipient heat treated (red line) and formulated sample (green line- spray dried with
maltodextrin at 65°C for 10 min treatment). The graph shows second derivative form of the
original spectrum of Amide-I region (X-axis: wave number 1700-1600 cm‾1
and Y-axis:
absorbance).
In Fig. 4.3.18 all the three plots i.e. of control, native and formulated samples have similar
kind of peaks which is clearly visible. In the formulated protein the basic peak that
corresponds to the -helix at 1655 cm-1
is not conserved. So the excipient is not working in
the specified temperature for the specific time of exposure.

57
Fig. 4.3.19 FTIR plots of native protein (black line i.e. reference at room temp.) protein with
out excipient heat treated (red line) and formulated sample (green line- spray dried with
maltodextrin at 65°C for 40 min treatment). The graph shows second derivative form of the
original spectrum of Amide-I region (X-axis: wave number 1700-1600 cm‾1
and Y-axis:
absorbance).
Analyzing the result for Fig. 4.3.19, we observed the similar type of situation as that of the
above two cases. The plots of thermal denatured native protein goes side by side with that of
the formulated protein, whereas control shows different peaks than that of the other two. In
the formulated protein the basic peak that corresponds to the -helix at 1655 cm-1
is not
conserved. So the excipient is not working in the specified temperature for the specific time
of exposure.

58
Fig. 4.3.20 FTIR plots of native protein (black line i.e. reference at room temp.) protein
without excipient heat treated (red line) and formulated sample (green line- spray dried with
maltodextrin at 65°C for 60 min treatment). The graph shows second derivative form of the
original spectrum of Amide-I region (X-axis: wave number 1700-1600 cm‾1
and Y-axis:
absorbance).
For formulated sample in place of a peak corresponding to -helix at 1655 cm-1
we got a
trough over here, which is a clear cut indication that -helix is not protected. Also the plots of
thermal denatured native protein goes side by side with that of the formulated protein. So the
excipient is not working in the specified temperature for the specific time of exposure.

59
Fig. 4.3.21 FTIR plots of native protein (black line i.e. reference at room temp.) protein
without excipient heat treated (red line) and formulated sample (green line- spray dried with
maltodextrin at 75°C for 5 min treatment). The graph shows second derivative form of the
original spectrum of Amide-I region (X-axis: wave number 1700-1600 cm‾1
and Y-axis:
absorbance).
Formulated and heat treated protein lacks peaks at the region of 1655 cm‾1
(Fig.4.3.21) which
is related to the -helix and also peaks are shifted from its original position that can be
marked. The peak found in the region of 1687 cm‾1
is shifted to 1693 cm‾1,
1676 cm‾1
to 1679
cm‾1
and 1641 cm‾1
to 1644 cm‾1
. In case of formulated ones, it does not protect the band at
1655 cm‾1
and there is shift of peaks and the peak numbers and hence the excipient fails to
protect the protein in specified conditions.

60
Fig 4.3.22 FTIR plots of native protein (black line i.e. reference at room temp.) protein
without excipient heat treated (red line) and formulated sample (green line- spray dried with
maltodextrin at 75°C for 10 min treatment). The graph shows second derivative form of the
original spectrum of Amide-I region (X-axis: wave number 1700-1600 cm‾1
and Y-axis:
absorbance)
As per Fig. 4.3.22, we observed the similar type of situation as that of the above two cases.
The plots of thermal denatured native protein goes side by side with that of the formulated
protein, whereas control shows different peaks than that of the other two. In the formulated
protein the basic peak that corresponds to the -helix at 1655 cm-1
is not conserved. So the
excipient is not working in the specified temperature for the specific time of exposure

61
Fig. 4.3.23 FTIR plots of native protein (black line i.e. reference at room temp.) protein
without excipient heat treated (red line) and formulated sample (green line- spray dried with
maltodextrin at 75°C for 40 min treatment). The graph shows second derivative form of the
original spectrum of Amide-I region (X-axis: wave number 1700-1600 cm‾1
and Y-axis:
absorbance)
In the above figure we got totally irregular results. For the higher wave numbers native
denatured sample showed similar peaks with that of control one, where as for lower wave
number native denatured sample shows similar peaks as that of formulated one, but the very
basic for stability of formulated protein is the peak that corresponds to the -helix at 1655
cm-1
is not conserved. So the excipient is not working in the specified temperature for the
specific time of exposure

62
Fig. 4.3.24 FTIR plots of native protein (black line i.e. reference at room temp.) protein
without excipient heat treated (red line) and formulated sample (green line- spray dried with
maltodextrin at 75°C for 60 min treatment). The graph shows second derivative form of the
original spectrum of Amide-I region (X-axis: wave number 1700-1600 cm‾1
and Y-axis:
absorbance
For this particular plot we observed at higher wave number all the three plots showing similar
type of peaks but for lower wave numbers native denatured sample shows similar peaks as
that of formulated one. And again the vital peak is missing i.e. -helix at 1655 cm-1
is not
conserved. So the excipient is not working in the specified temperature for the specific time
of exposure.
Now coming to the overall result analysis of the formulated sample using maltodextrin as
excipient for the specific temperature and specified time of exposure to heat we can
concluded that, maltodextrin can not protect the basic α-helix at 1655 cm- 1
. Neither it shows
protection for higher time of exposure nor for lower time of exposure. It neither protects at
75°C nor at 65
°C. So it is not a better option to be used as an excipient.

63
Using Trehalose as an excipient:
Fig. 4.3.25 FTIR plots of native protein (black line i.e. reference at room temp.) protein
without excipient heat treated (red line) and formulated sample (green line- spray dried with
trehalose at 65°C for 5 min treatment). The graph shows second derivative form of the
original spectrum of Amide-I region (X-axis: wave number 1700-1600 cm‾1
and Y-axis:
absorbance).
As per Fig4.3.25, the formulated sample conserves the peaks corresponding β-turn at 1687
cm-1
, 1679 cm-1
and 1676 cm-1
. α-helix at 1655 cm- 1
and random coil at 1649 cm-1
. β-sheet
at 1639 cm-1
& 1628 cm-1
like that of native protein where as the denatured one shows
additional peaks corresponding to β-sheet at 1693 cm-1
, 1644 cm-1
and1632 cm-1
and β-turn
at 1679 cm-1
and 1667 cm-1
. Thus excipient confers protection.

64
Fig. 4.3.26 FTIR plots of native protein (black line i.e. reference at room temp.) protein
without excipient heat treated (red line) and formulated sample (green line- spray dried with
trehalose at 65°C for 10 min treatment). The graph shows second derivative form of the
original spectrum of Amide-I region (X-axis: wave number 1700-1600 cm‾1
and Y-axis:
absorbance)
Coming to Fig. 4.3.26, the formulated sample conserves the peaks corresponding β-turn at
1687 cm-1
and 1676 cm-1
, α-helix at 1655 cm- 1
, 310 helix at 1666 cm
-1 random coil at 1647
cm-1
. β-sheet at 1639 cm-1
& 1628 cm-1
like that of native protein where as the denatured
one shows additional peaks corresponding to β-sheet at 1694 cm-1
, 1644 cm-1
and1632 cm-1
and β-turn at 1680 cm-1
and 1667 cm-1
, random coil at 1650 cm-1
. Thus excipient confers
protection.

65
Fig. 4.3.27 FTIR plots of native protein (black line i.e. reference at room temp.) protein
without excipient heat treated (red line) and formulated sample (green line- spray dried with
trehalose at 65°C for 40 min treatment). The graph shows second derivative form of the
original spectrum of Amide-I region (X-axis: wave number 1700-1600 cm‾1
and Y-axis:
absorbance)
In the above figure we got peculiar results. For the higher wave numbers formulated sample
showed similar peaks with that of control one, where as for lower wave number plots for each
of the sample showed unique peaks and the very basic for stability of formulated protein is
the peak that corresponds to the -helix at 1655 cm-1
is not conserved. So the excipient is not
working in the specified temperature for the specific time of exposure

66
Fig. 4.3.28 FTIR plots of native protein (black line i.e. reference at room temp.) protein
without excipient heat treated (red line) and formulated sample (green line- spray dried with
trehalose at 65°C for 60 min treatment). The graph shows second derivative form of the
original spectrum of Amide-I region (X-axis: wave number 1700-1600cm‾1
and Y-axis:
absorbance)
For formulated sample in place of a peak corresponding to -helix at 1655 cm-1
we got a
trough over here, which is a clear cut indication that -helix is not protected. Also all the
three plots of the corresponding samples thermal goes side by side. So the excipient is not
working in the specified temperature for the specific time of exposure

67
Fig. 4.3.29 FTIR plots of native protein (black line i.e. reference at room temp.) protein
without excipient heat treated (red line) and formulated sample (green line- spray dried with
trehalose at 75°C for 5 min treatment). The graph shows second derivative form of the
original spectrum of Amide-I region (X-axis: wave number 1700-1600 cm‾1
and Y-axis:
absorbance)
Discussing the result for the plot given in Fig. 4.3.25, the formulated sample conserves the
peaks corresponding β-turn at 1687 cm-1
and 1676 cm-1
, α-helix at 1655 cm- 1
, β-sheet at
1628 cm-1
like that of native protein where as the denatured one shows additional peaks
corresponding to β-sheet at 1640 cm-1
and 1632 cm-1
and β-turn at 1680 cm-1
and 1667 cm-1
. Thus excipient confers protection

68
Fig:4.3.30 FTIR plots of native protein (black line i.e. reference at room temp.) protein
without excipient heat treated (red line) and formulated sample (green line- spray dried with
trehalose at 75°C for 10 min treatment). The graph shows second derivative form of the
original spectrum of Amide-I region (X-axis: wave number 1700-1600 cm‾1
and Y-axis:
absorbance)
Coming to result analysis of Fig. 4.3.30, the formulated sample conserves the peaks
corresponding to β-turn at 1687 cm-1
and 1676 cm-1
. α-helix at 1655 cm- 1
and random coil at
1647 cm-1
. β-sheet at 1639 cm-1
& 1628 cm-1
like that of native protein where as the
denatured one shows additional peaks corresponding to β-sheet at 1694 cm-1
, 1644 cm-1
and1632 cm-1
and β-turn at 1681 cm-1
and 1668 cm-1
. Thus excipient confers protection

69
Fig. 4.3.31 FTIR plots of native protein (black line i.e. reference at room temp.) protein
without excipient heat treated (red line) and formulated sample (green line- spray dried with
trehalose at 75°C for 40 min treatment). The graph shows second derivative form of the
original spectrum of Amide-I region (X-axis: wave number 1700-1600 cm‾1
and Y-axis:
absorbance)
Analyzing the result for Fig-4.3.31, we observed that the plots of thermal denatured native
protein goes side by side with that of the formulated protein, whereas control shows different
peaks than that of the other two. In the formulated protein the basic peak that corresponds to
the -helix at 1655 cm-1
is not conserved. So the excipient is not working in the specified
temperature for the specific time of exposure.

70
Fig. 4.3.32 FTIR plots of native protein (black line i.e. reference at room temp.) protein
without excipient heat treated (red line) and formulated sample (green line- spray dried with
trehalose at 75°C for 60 min treatment). The graph shows second derivative form of the
original spectrum of Amide-I region (X-axis: wave number 1700-1600 cm‾1
and Y-axis:
absorbance)
In the above figure we got a peculiar result. For the higher wave numbers all the three plots
of formulated sample i.e. of control, native and formulated samples, have similar kind of
peaks at higher wave numbers. Whereas for lower wave number plots for each of the sample
showed unique peaks. And the very basic for stability of formulated protein is the peak that
corresponds to the -helix at 1655 cm-1
is not conserved. So the excipient is not working in
the specified temperature for the specific time of exposure.
After going through FTIR result analysis of trehalose formulated sample for each individual
time interval of mentioned temperature treatment, we concluded that, for both the
temperature range trehalose is not a protectant for more time of exposure to heat i.e. upto 40
minutes and 60 minutes.For less than 20 mins exposure it protects α-helix at 1655 cm- 1
and
β-sheets at 1639 cm-1
and 1628 cm- 1
where denature one shows an additional β-sheet at 1644
cm-1
and 1632 cm-1
and β turn at 1681 cm-1
and 1668 cm-1
. Thus trehalose can be used as an
excipient for low time of exposure to heat that is at 65°C and 75
°C up to 10 minutes. But it

71
can’t be used as an excipient at the specified temperature for time of exposure more than 10
minutes.
Finally we analyzed the complete FTIR result of each and every individual excipient i.e.
ammonium sulfate, mannitol, maltodextrin, and trehalose formulated samples. We gave
thermal treatment to the formulated samples at two specific temperature i.e. 65°C and 75
°C
for time intervals of 5, 10, 40 and 60 minutes. And going by our one of the objective, that is
to choose the best excipient out of the four we used, we concluded that, Mannitol is the best excipient showing maximum alterations in the populations of the α-
helix, β-sheet, and random coil structures and protecting upto 1hr time of exposure. Then comes ammonium sulfate which fails to protect time of exposure more than 40
mins at 75°C temperature treatment.
Trehalose can’t protect for longer time of exposure but works well for shorter time of
exposure.
Maltodextrin cannot be used as an excipient at all.
4.4 Detection of denaturation of protein through Calorimetry
Exposure to heat leads to deformation of bonds resulting in the physical change of the sample
called phase transitions. The points at which phase transition occurs are called transition
points. The physical changes involve glass transition (Tg), crystallization (Tc) and melting
(Tm). Such events will either release energy (Exothermic) or it will be taken up by the system
(Endothermic) and this difference can give rise to a change in the Enthalpy (ΔHm). To
measure the amount of heat absorbed or released during such transitions we used the
Differential Scanning Calorimetric Technique (DSC). The result of a DSC experiment is a
curve of heat flux versus temperature or versus time. Using this technique it is possible to
observe fusion and crystallization events as well as glass transition temperatures (Tg). Glass
transition temperature is an intermediate temperature between solid and liquid states. It has
been also reported that formation of intracellular glass will increase the stability of the
anhydrobiotic organism in the dry state (Liao et al. 2002). Molecular mobility also creates an
adverse effect on the storage stability. Substance stored above Tg has been reported of high
molecular mobility while those stored below the Tg shown to have very low molecular
mobilty. Tg value is highly affected by the moisture content. Presence of moisture reduces the
glass transition temperature there by changes in the physical state of the protein occurs. In

72
this study, glass transition behaviors of the native and formulated proteins are considered as
the subject.
Sample Tg value DeltaCp J/(g*K)
Control 64.8°C 1.823
BSA + d-Mannitol 75.1°C 1.81
BSA+ Maltodextrin 62.6°C 3.137
BSA + Trehalose 65.5°C 5.149
BSA + Ammonium Sulfate 64.2°C 6.707
Table- 4.2: Tg value and change in specific heat of native and formulated samples at room
temperature.
Temperature
Fig. 4.4.1 Tg value of native BSA, X-axis shows temperature and Y-axis shows specific heat
(cp) scan rate 5°C per minute, temperature range from 30
°C to 100
°C. Formation of glass
starts from 44.8°C and ends in 70.5
°C and Tg can be obtained by taking the mid point i.e.
64.8ºC.
Spec
ific
hea
t
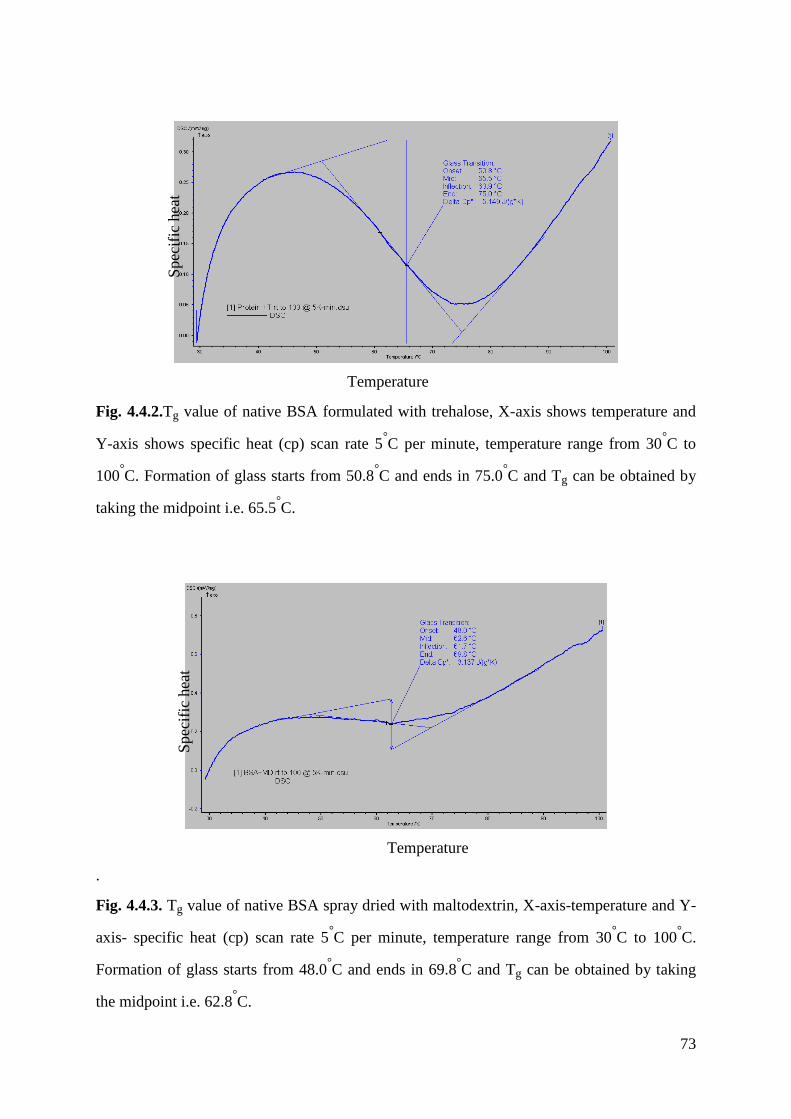
73
Temperature
Fig. 4.4.2.Tg value of native BSA formulated with trehalose, X-axis shows temperature and
Y-axis shows specific heat (cp) scan rate 5°C per minute, temperature range from 30
°C to
100°C. Formation of glass starts from 50.8
°C and ends in 75.0
°C and Tg can be obtained by
taking the midpoint i.e. 65.5°C.
Temperature
.
Fig. 4.4.3. Tg value of native BSA spray dried with maltodextrin, X-axis-temperature and Y-
axis- specific heat (cp) scan rate 5°C per minute, temperature range from 30
°C to 100
°C.
Formation of glass starts from 48.0°C and ends in 69.8
°C and Tg can be obtained by taking
the midpoint i.e. 62.8°C.
Spec
ific
hea
t S
pec
ific
hea
t

74
Temperature
Fig. 4.4.4. Tg value of native BSA spray dried with ammonium sulfate, X-axis-temperature
and Y-axis - specific heat (cp) scan rate 5°C per minute, temperature range from 30
°C to
100°C. Formation of glass starts from 50.0
°C and ends in 75.1
°C and Tg can be obtained by
taking the midpoint i.e. 64.2°C.
Temperature
Fig. 4.4.5. Tg value of native BSA spray dried with mannitol, X-axis-temperature and Y-axis-
specific heat (cp) scan rate 5°C per minute, temperature range from 30
°C to 100
°C. Formation
of glass starts from 52.5°C and ends in 78.5
°C and Tg can be obtained by taking the midpoint
i.e. 75.1°C.
Spec
ific
hea
t
Spec
ific
hea
t

75
.
Temperature
Fig 4.4.6: Overlapping all the graphs of Tg values obtained by DSC for comparison.
From the Fig 4.4.6: it is observed that the protein formulated with d-mannitol shows
the highest Tg value. This indicates that the excipient provides a better preserving condition
for the protein because as the Tg of the sample increases this decreases the possibility of the
phase change of the sample at room temperature and thus the physical stability of the sample
increases.
Spec
ific
hea
t

76
Chapter 5
Summary and Conclusions
The effect of excipients like: mannitol, ammonium sulfate, trehalose and maltodextrin on the
stability of the BSA were studied.
Considering the results obtained from different characterization techniques for mannitol
formulated samples, it works for the protein precisely.
TGA data indicate that out of all four excipients, mannitol formulations has less moisture
content i.e. 3.149%. The effect of mannitol on the decrease in the moisture content was
partially attributed to the increased hydrogen bonding that occurs between mannitol and
protein. As comparing to moisture content of native protein i.e. calculated as 10.354%.,
mannitol formulations brings a significant difference hence regarded as a good excipient
(Town et al in 2000).
It preserves the helical structure of the protein thoroughly, does not allow the protein to
produce any type of shift in the peak position and to form any new -sheets or any type of
additional peak hence regarded as a good excipient (Murayama et al. 2004). It preserves other
peaks intact position like that of native protein even after high temperature treatment for
prolong time i.e. 75°C for 1 hour heat treatment detected by spectroscopy.
From literature, it is reported that a good excipient should have capacity to increase the glass
transition values in order to reduce the molecular mobility and structural alterations (Sun et
al.1998). Differential scanning calorimetry detects that the mannitol formulated samples
showed highest glass transition value i.e. 75.1°C there by it reduces the molecular mobility
and preventing the conformational transitions and from many deleterious reactions.
Aggregation occurs due to heat was detected by electrophoresis. Mannitol gives protection to
the protein from degradation even at 75°C for 60 minute (Arakawa et al. 1999).
The second excipient used was ammonium sulfate. It produces less percentages of moisture
i.e. 3.607% and Tg value it is showing 64.2ºC. Tg value calculated is nearly equal to that of
native protein. From IR spectroscopic analysis, it was found that this excipient protects the

77
protein but up to a certain level. It can not give the protection at 65ºC and 75
ºC for long times
i.e. for 60 minutes. From gel electrophoresis, it is also found that ammonium sulfate also
gives protection the proteins from aggregation but not up to long time of expose. Hence it is
giving protection up to certain extent.
Trehalose is used as an excipient in the experiment. Trehalose is regarded as an efficient
stabilizer in various studies (Yoshii et al. 2007) but in case of this protein, trehalose is not
showing any significant protection. It produces hygroscopic and sticky products. The
moisture content is very high i.e. 8.094%. The glass transition temperature produced by
trehalose formulated samples i.e. 65.5 ºC was not so high. This formulation also up to certain
extent protects the helical structure of the protein but after 10 minute heat treatment at 65ºC
and 75ºC it neither protects the helical structure of the protein nor it conserved the bands.
Maltodextrin can not be regarded as a good excipient for this protein. The formulated
samples containing maltodextrin neither increases the glass transition temperature i.e. it is
showing 62.8ºC nor produces moisture free products i.e. 7.709%. It does not show any
protection towards the helical structure that were lost due to temperature. It does not produce
any effect on aggregation process. In the presence of maltodextrin, BSA also aggregates due
to heat. Its presence or absence does not bring any change in the structure.
It was concluded from the result that BSA formulated with excipients can be stabilized by
spray drying method. In between all four different excipients mannitol is regarded as the most
excellent by fulfilling all desired parameters for BSA detected by all four analytical
technique. This finding paves the path for protein stabilization through excipient mediated
spray drying technique.
Future studies
It was concluded from the result that BSA formulated with excipients can be stabilized by
spray drying method. It can be applied to any other proteins, enzymes and cells. The
combination of mannitol and ammonium sulfate can be produced and its effect on the
stability of the protein can be checked. Different ratios of combination of excipient with the
protein can be tried. Thermal denaturation studies can be done at different temperature and
different time point in order to know the excipient effects on the protein. Some more
techniques can be applied to find out more accuracy.

78
REFERENCES
1. Adler, M., Lee, G. (1999). Stability and surface activity of lactate dehydrogenase in
spray-dried trehalose. Journal of Pharmaceutical Sciences, 88(2), 199–208.
2. Adler, M., Unger, M., Lee, G. (2000). Surface Composition of Spray-Dried Particles
of Bovine Serum Albumin Trehalose/Surfactant. Journal of Pharmaceutical
Research 17, 63-870
3. Ajloo, D, Behnam, H., Saboury, A., Mohamadi-Zonoz, F., Ranjbar, B. Moosavi-
Movahedi, A., Hasani, Z., Alizadeh, K., Gharanfoli M., Amani M., (2007.
Thermodynamic and Structural Studies on the Human Serum Albumin in the Presence
of a Polyoxometalate Journal of the Korean Chemical Society 28,731-736
4. Andya, J, Maa, Y,H., Costantino, H., Nguyen, P., Dasovich, N, (1999. The Effect of
Formulation Excipients on Protein Stability and Aerosol Performance of Spray-Dried Powders of a
Recombinant Humanized Anti-IgE Monoclonal Antibody, Journal of Pharmaceutical Research 16,
350-358
5. Arakawa, T, Kita Y, (1999). Protection of Bovine Serum Albumin from Aggregation
by Tween 80, Journal of Pharmaceutical Sciences, 89, 646-651
6. Arakawa, T, Philo J S, and Kita Y, (2000. Kinetic and Thermodynamic study of
Recombinant Erythropoietin Bioscience, Biotechnology, Biochemistry.65 1321-1327
7. Baptista RP, Pedersen S, Cabrita GJ, Otzen DE, Cabral JM, Melo EP (2008).
Thermodynamics and mechanism of cutinase stabilization by trehalose. Biopolymer
89 538-47
8. Brange, J., Havelund, S., and Hougaard, P, (1992). Chemical Stability of Insulin. 2.
Formation of Higher Molecular Weight Transformation Products During Storage of
Pharmaceutical Preparations. Pharmaceutical Research 9, 727-734
9. Broadhead, J, Edmond Rouan, K, Hau, I., & Rhodes, C. T. (1994). The effect of
process and formulation variables on the properties of spraydried b-galactosidase.
Journal of Pharmacy and Pharmacology, 46(6), 458–467.
10. Carter, D,C, Chang, B, Keeling, Ho, K, Krishnasami Z. (1994). Preliminary
crystallographic studies of crystal forms of serum-albumin. 226, 1049–1052.
11. Clore, G. M., Bronenborn, A. M., (1998). Determining the structures of large proteins
and protein complexes by NMR. Trends Biotechnol. 16, 22-34.

79
12. Costantino H.R., Firouzabadian, L., Wu C. Karen G. Carrasquillo
, Kai Griebenow
,
Stephen E. Zale,
Mark A. Tracy (2002). Protein spray freeze drying. 2. Effect of
formulation variables on particle size and stability Journal of Pharmaceutical
Sciences 91 388-395
13. Crowe, J.H., Leslie, S., Israeli, E., Lighthart, B., Crowe L.M., (1995). Trehalose and
sucrose protect both membranes and proteins in intact bacteria during drying Applied
and Environmental Microbiology 60 3592
14. Cui, L., Zhang Liang, D., Huang, L., Liu, H., Du, G., Chen, J, (2006). Stabilization
of a new microbial transglutaminase from Streptomyces hygroscopicus WSH03-13 by
spray drying Process Biochemistry 41 1427–1431
15. Curry S, Mandelkow H, Brick P, Franks N. (1998). Crystal structure of human serum
albumin complexed with fatty acid reveals an asymmetric distribution of binding
sites. Nature Structural and Molecular Biology 751-3
16. Davis, J. M., Arakawa, T., Strickland, T. W., Yphantis, D. A. (1987). Characterization
of recombinant human erythropoietin produced in chinese hamster ovary cells.
Biochemistry. 26, 2633-2638.
17. Denisio M. Togashi, and Alan G. Ryder (2005). Time-Resolved Fluorescence Studies
on Bovine Serum Albumin Denaturation Process Journal of Fluorescence16 153-160
18. Denisov I. G. (1992). Thermal stability of proteins in intermolecular complexes.
Biophysical Chemistry, 44: 71–7
19. Dong, A., Caughey, W. S., (1994). Infrared methods for study of hemoglobin
reactions and structures. Methods Enzymol. 232, 139-175.
20. Dobson, C. M., Hore, P. J., (1998). Kinetic studies of protein folding using NMR
spectroscopy. Nat. Struct. Biol. 5, 504-507.
21. Eftink, M.R., (1994). The use of fluorescence methods to monitor unfolding
transitions in protein. Biophysics Journal. 66, 482-501.
22. Fransson, J, Florin-Robertsson, E, Axelsson, K, Nyhlén, C, (1996) Oxidation of
human insulin-like growth factor I in formulation studies: kinetics of methionine
oxidation in aqueous solution and in solid state. Journal of Pharmaceutical Research
13, 1252-1257
23. Giancola, C, Sena, C. Fessas, D, Graziano, G, Barone, G, (1997). DSC studies on
bovine serum albumin denaturation Effects of ionic strength and SDS concentration
Journal of Biological Macromolecules, 20 193-209

80
24. Han, X., Li, G., Li, G, Lin K, (1998.) FTIR study of Thermal Denaturation of -
Actinin in its Lipid free and Dioleoyl Phosphatidylglycerol-Bound states and central
and N-terminal Domains of -Actinin in D2O Biochemistry 37
25. Han, Y, Byung-Seok Jin, Lee S, Sohn, Y, Joung, J, Lee J, (2007). Effects of Sugar
Additives on Protein Stability of Recombinant Human Serum Albumin during
Lyophilization and Storage Archives of Pharmacal Research 30 1124-1131
26. Hartl, F. U., (1996). Molecular chaperones in cellular protein folding. Nature. 381,
571-580.
27. Honda, C, Kamizono, H., Samejima T. Endo K. (1999). Studies on thermal
denaturation of Bovine serum albumin as a drug carrier Chemical Pharmaceutical
Bulletin 48 464-466
28. Horovitz A, Serrano L, Avron B. Fersht A. R. (1990). Strength and co-operativity of
contributions of surface salt bridges to protein stability. Journal of Molecular Biology
216: 1031–1044
29. Izutsu, K., Kojima, S., (2002). Excipient crystallinity and its protein-structure-
stabilizing effect during freeze-drying Journal of Pharmacy and Pharmacology 54
1033–1039
30. Jaenicke, R., (1990). Protein structure and function at low temperatures. Philos.
Trans. R. Soc. London. B 326, 535-551
31. Jafri F., Husain S. Saleemuddin M. (1993). Immobilization and stabilization of
invertase using specific polyclonal antibodies. Biotechnology and Applied
Biochemistry 18: 401–408
32. Johnson, W. C, (1990). Protein secondary structure and circular dichroism: A
practical guide. Proteins. B, 205-214.
33. KONG, J., Shaoning YU (2007). Fourier Transform Infrared Spectroscopic Analysis
of Protein Secondary Structures Acta Biochimica et Biophysica Sinica 39 549–559
34. Landstrom, K., Alsins, J. Bergenstahl, B. (2000). Competitive protein adsorption
between bovine serum albumin and b-lactoglobulin during spray-drying. Food
Hydrocolloids, 14(1), 75–82.
35. Lee, B., Vasmatzis, G., (1997). Stabilization of protein structures. Curr. Opin.
Biotechnol. 8, 423-428.

81
36. Liao, Y H., Brown, B., Nazir, T., Quader, A., Martin G., (2002). Effects of Sucrose
and Trehalose on the Preservation of the Native Structure of Spray-Dried Lysozyme
Pharmaceutical Research 19
37. Lin, V. J. C. and Koenig, J. L. (1976). Raman studies of bovine serum albumin.
Biopolymers15 203-218
38. Maa, Y.F., Costantino, H. R., Nguyen, P. A. Hsu, C. C. (1997). The effect of
operating and formulation variables on the morphology of spray-dried protein
particles. Pharmaceutical Development and Technology,2 (3), 213–223.
39. Michnik, A., Michalik, K. Kluczewsk, A. Drzazga, Z. (2006). Comparative DSC
study of Human and Bovine serum Albumin. Journal of Thermal Analysis and
Calorimetry, 84
40. Middaugh, C.R., (1990). Biophysical approaches to the pharmaceutical development
of proteins. Drug Development and Industrial Pharmacy 16 18, 2635-2654
41. Moriyama,Y., Kawasaka, Y., Takeda,K., (2003). Protective effect of small amounts
of sodium dodecyl sulfate on the helical structure of bovine serum albumin in thermal
denaturation Journal of Colloid and interface science 257 41-46
42. Moriyama, Y., Watanabe, E., Kobayashi, K., Harano, H., Inui, E., Taked, K., (2008).
Secondary Structural Change of Bovine Serum Albumin in Thermal Denaturation up
to 130 °C and Protective Effect of Sodium Dodecyl Sulfate on the Change Journal of
Physical chemistry 112 16587-16589
43. Nath, S., Satpathy G.R., (1998). A Systematic approach for investigation of spray
drying process Drying Technology, 16 1173 – 1193
44. Nath, S, Satpathy, G.R., Mantri, R., Deep S, Ahluwalia J C., (1997). Evaluation of
enzyme thermostability by enzyme assay and differential scanning Calorimetry A
study of alcohol dehydrogenase Journal of Chemical Society Faraday Transaction.
93(18)
45. Pace C, N, (1992). Contribution of the hydrophobic effect to globular protein stability.
Journal of Molecular Biology 226 29–35
46. Philippe M. Dekeyser, Sam Corveleyn, Joseph Demeester Jean-Paul Remon (1997).
Stabilization of fully active chymopapain by lyophilization International Journal of
Pharmaceutics159 19-25
47. Pico, G, A., (1996). Thermodynamic feature of thermal unfolding of human serum
albumin International Journal of Biological macromolecules 20 63-73

82
48. Prieto, Wilmans, M., Jimenez, M.A., Rico, M., Serrano, L., (1997). Non-native local
interactions in protein folding and stability: introducing a helical tendency in the all -
sheet and - Journal of Molecular Biology 268, 760-778
49. Ragoonanan,V, Aksan, A., (2007). Protein stabilization Transfusion Medicine and
Hemotherapy. 34 246–252
50. Reid, D. G., Mac Lachlan, L. K., Edwards, A. J., Hubbard, J. A., Sweeney, P. J.,
(1997). Introduction to the NMR of proteins. Methods Mol. Biol. 60, 1-28.
51. Scholtz J. M., Qian H., Robbins V. H. Baldwin R. L. (1993). The energetics of ion-
pair and hydrogen-bonding interactions in a helical peptide. Biochemistry 32 9668–
9676
52. Sharma, V K., Calonia D.S., (2004). Effect of Vacuum Drying on Protein-Mannitol
Interactions: The Physical State of Mannitol and Protein Structure in the Dried State
Pharmaceutical science Technology5 1
53. Son, K., Kwon, C., (1995). Stabilization of human epidermal growth factor (hEGF)
in aqueous formulation. Pharmaceutical Research 12, 451-454
54. Sun, W., Davidson, P., Chan H., (1998). Protein stability in the amorphous
carbohydrate matrix relevance to anhydrobiosis Biochimica et Biophysica Acta 1425
245-254
55. Towns , J., (2000). Moisture content in proteins: its effects and measurement Journal
of chromatography 705 115-127
56. Tzannis, S., Prestrelski, S. (1999). Activity-stability considerations of trypsinogen
during spray drying: effect of sucrose. Journal of Pharmaceutical Sciences, 88(3),
351–359
57. Xu, G. Y., Yu, H.A., Hong, J., (1997) Solution structure of recombinant human
interluekin-6. Journal of Molecular Biology 268, 468-481
58. Yamamoto1, T., Chatani E., Kato M., (2010). FTIR observation of compression
recovery of the secondary structure of heat denaturated ribonuclease A in sucrose
solution Journal of Physics Conference Series 215
59. Yanli, Mi. (2002). Protection Mechanisms of Excipients on Lactate Dehydrogenase
during Freeze-Thawing and Lyophilization
60. Yoshii H., Buche, F., Takeuchi, N., Terrol, C., Ohgawara, M., Furuta T., (2007).
Effects of protein on retention of ADH enzyme activity encapsulated in trehalose
matrices by spray drying Journal of Food Engineering 87 34–39

83
Bio-data
Priyadarsini Pattnayak
Date of Birth: 11 June 1984
Correspondence
Department of Biotechnology and Medical Engineering,
National Institute of Technology Rourkela,
Rourkela – 769 008, Orissa, India.
Ph+ 91 9861737329
e-mail: [email protected]
Qualification
M.Tech. Biotechnology and Medical Engineering
NIT Rourkela
M.SC
F.M. Mohan University, Orissa [First Division]
B.SC
Swami Vivekananda Memorial College, Utkal University, Orissa [First Division]
Permanent Address
Patia, Bhubaneswar
Orissa, India


![RNA Interference-Mediated Change in Protein Body … · RNA Interference-Mediated Change in Protein Body Morphology and Seed Opacity through Loss of Different Zein Proteins1[C][W][OA]](https://img.pdfslide.net/doc/110x75/5b59bf4d7f8b9a31668d8a1c/rna-interference-mediated-change-in-protein-body-rna-interference-mediated-change.jpg)