Embed Size (px)
Citation preview
EXECUTABLE BEHAVIORAL MODELING OF SYSTEM-AND SOFTWARE-ARCHITECTURE SPECIFICATIONS TO INFORM
RESOURCING DECISIONS
Monica Farah-Stapleton, PhDRay Madachy, PhD
Mikhail Auguston, PhDKristin Giammarco, PhD

Overview
2
• Statement of Problem• Research Objectives• Summary of Results and Findings• ThreeMetrics Methodology• Research
– Methodology Description– Examples– Contributions of My Research
• Future Work• Closing Thoughts• Discussion
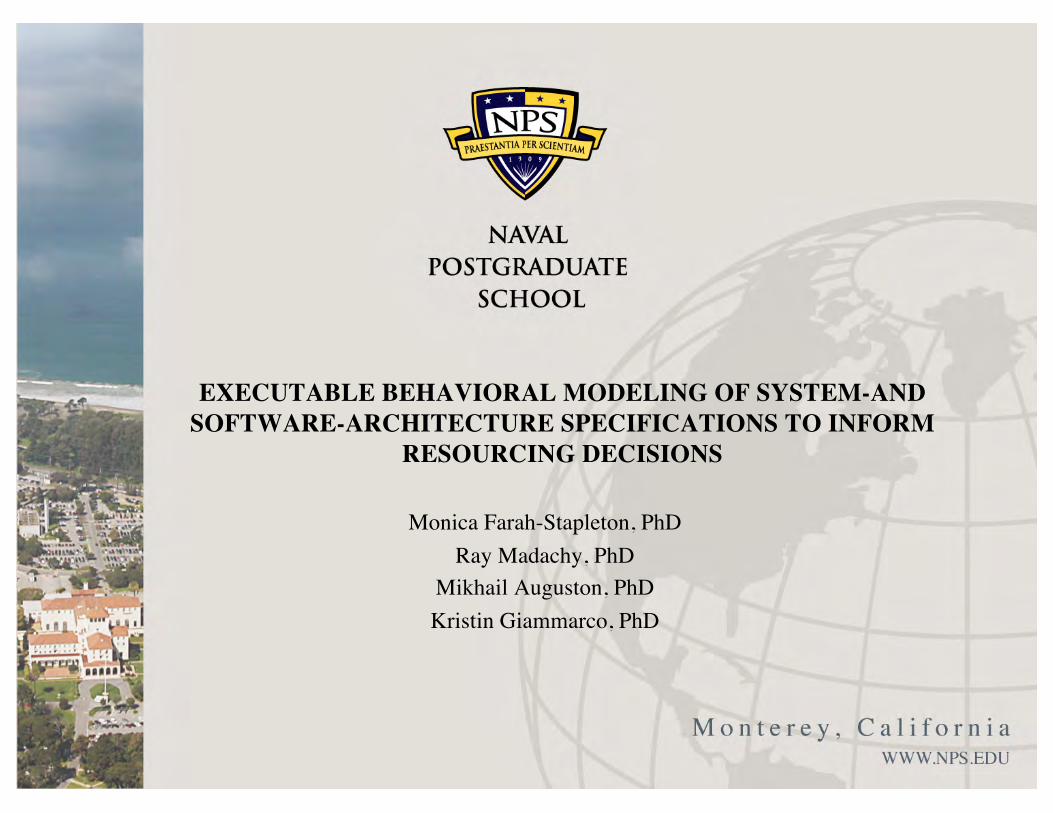
Statement of Problem
• Information Technology (IT) systems are large, complicated, and represent a significant investment in time and resources
– Operational and financial impacts are often assessed after the fact– Resourcing decisions and precise architectural descriptions of the system and
environment are often minimally related
• Precise modeling of architectures highlights design details and offers an early cost estimate for the system design
– Assists in assessing architectural design decisions and their impacts prior to, during, and after implementation and deployment
– Descriptions of interactions are related to function point transactional and data functions, and offer a way to estimate effort and cost of design decisions early in the process
– Provides foundation for supporting unadjusted function point (UFP) count with automated tools
3
Research Objectives
This research developed a methodology to extract unadjusted function point (UFP) counts from executable architectural behavioral models, for use in cost estimation models such as COCOMO II, in order to inform effort estimates
early in the life cycle
4
Summary of Results and Findings
• The ThreeMetrics methodology is able to extract an unadjusted function point (UFP) count from Monterey Phoenix’s (MP) executable architecture models for use in software cost estimation
• The ThreeMetrics methodology leverages precise behavioral modeling using MP and the MP Analyzer on Firebird to assess architecture design decisions and their impacts
• The ThreeMetrics methodology relates architecture modeling to resourcing through UFP counts
• The COCOMO II tool is used to input the UFP count to determine cost estimates
• The ThreeMetrics methodology uses event traces to inform integration test estimates and decision making
• Each step of the ThreeMetrics methodology provides meaningful information to stakeholders
5
Function Point AnalysisFunctionality From User’s Perspective
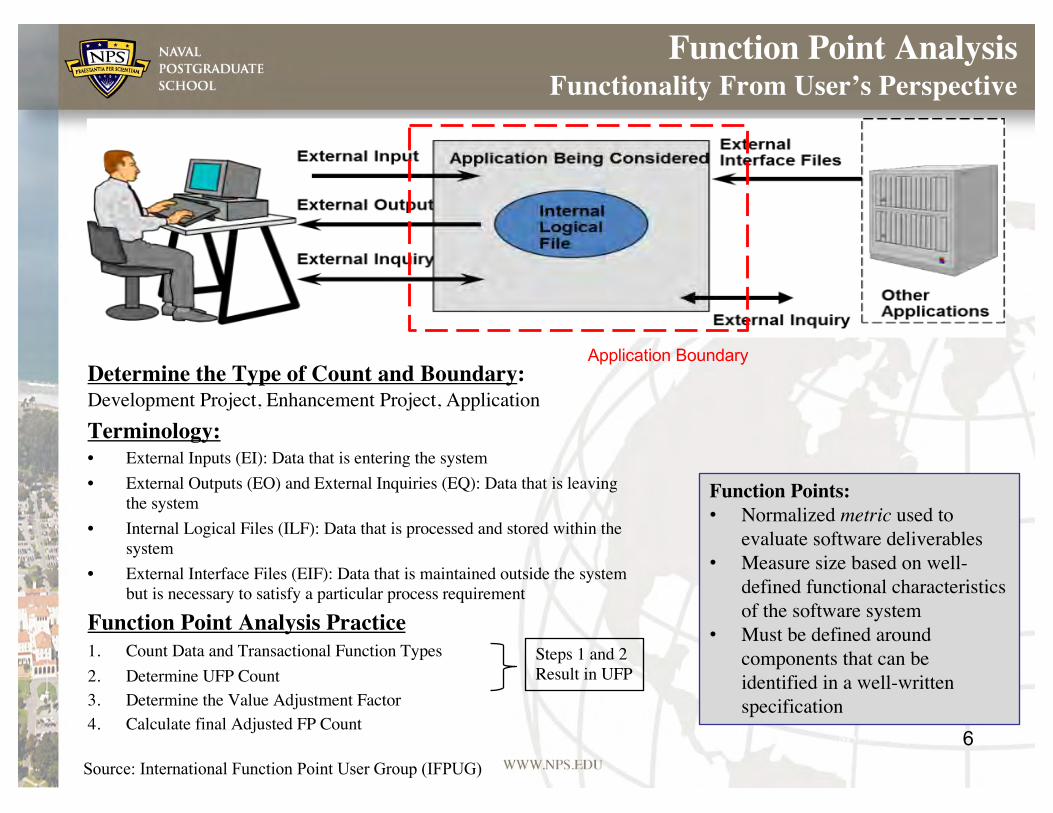
Determine the Type of Count and Boundary: Development Project, Enhancement Project, ApplicationTerminology: • External Inputs (EI): Data that is entering the system• External Outputs (EO) and External Inquiries (EQ): Data that is leaving
the system• Internal Logical Files (ILF): Data that is processed and stored within the
system• External Interface Files (EIF): Data that is maintained outside the system
but is necessary to satisfy a particular process requirement
Function Point Analysis Practice 1. Count Data and Transactional Function Types2. Determine UFP Count3. Determine the Value Adjustment Factor4. Calculate final Adjusted FP Count
6
Function Points: • Normalized metric used to
evaluate software deliverables• Measure size based on well-
defined functional characteristics of the software system
• Must be defined around components that can be identified in a well-written specification
Source: International Function Point User Group (IFPUG)
Steps 1 and 2 Result in UFP
Application Boundary
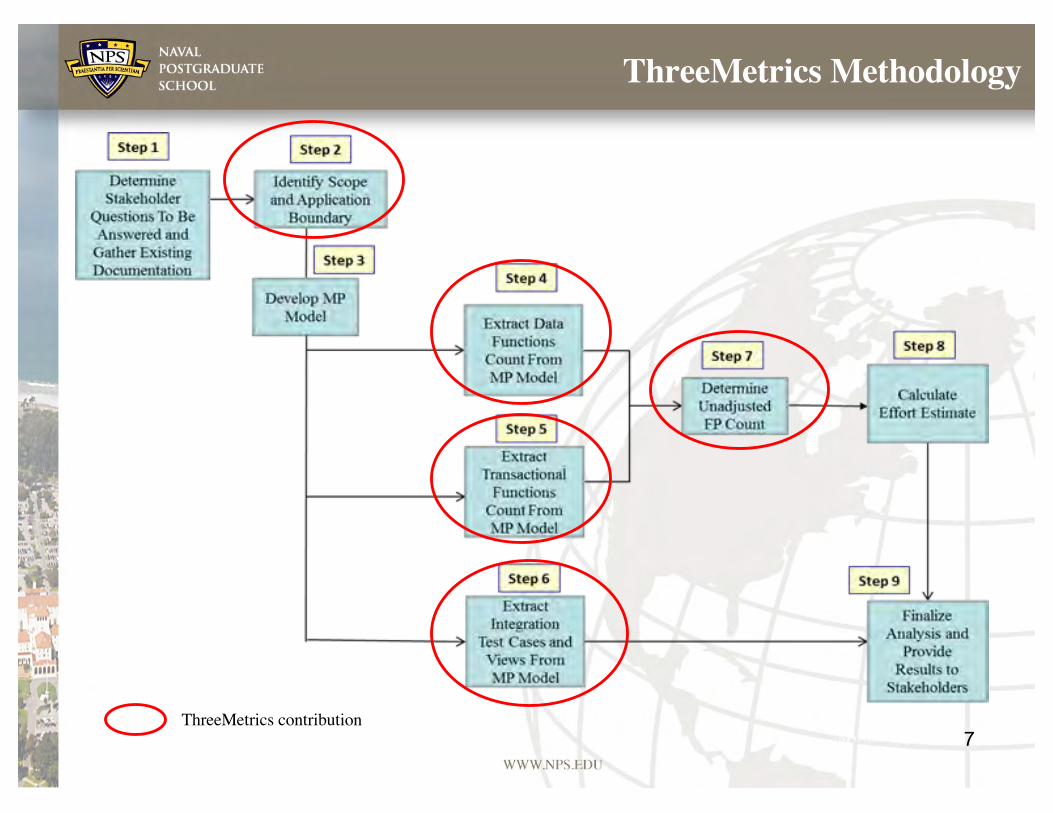
ThreeMetrics Methodology
7ThreeMetrics contribution
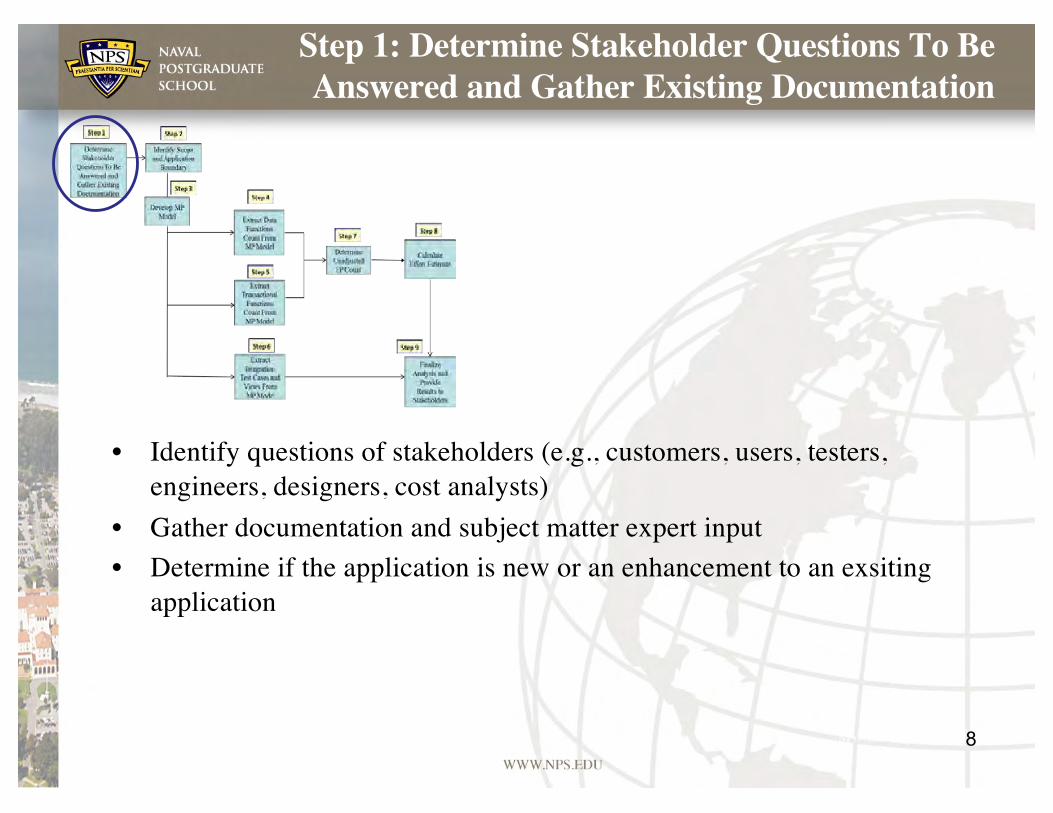
Step 1: Determine Stakeholder Questions To Be Answered and Gather Existing Documentation
• Identify questions of stakeholders (e.g., customers, users, testers, engineers, designers, cost analysts)
• Gather documentation and subject matter expert input• Determine if the application is new or an enhancement to an exsiting
application
8
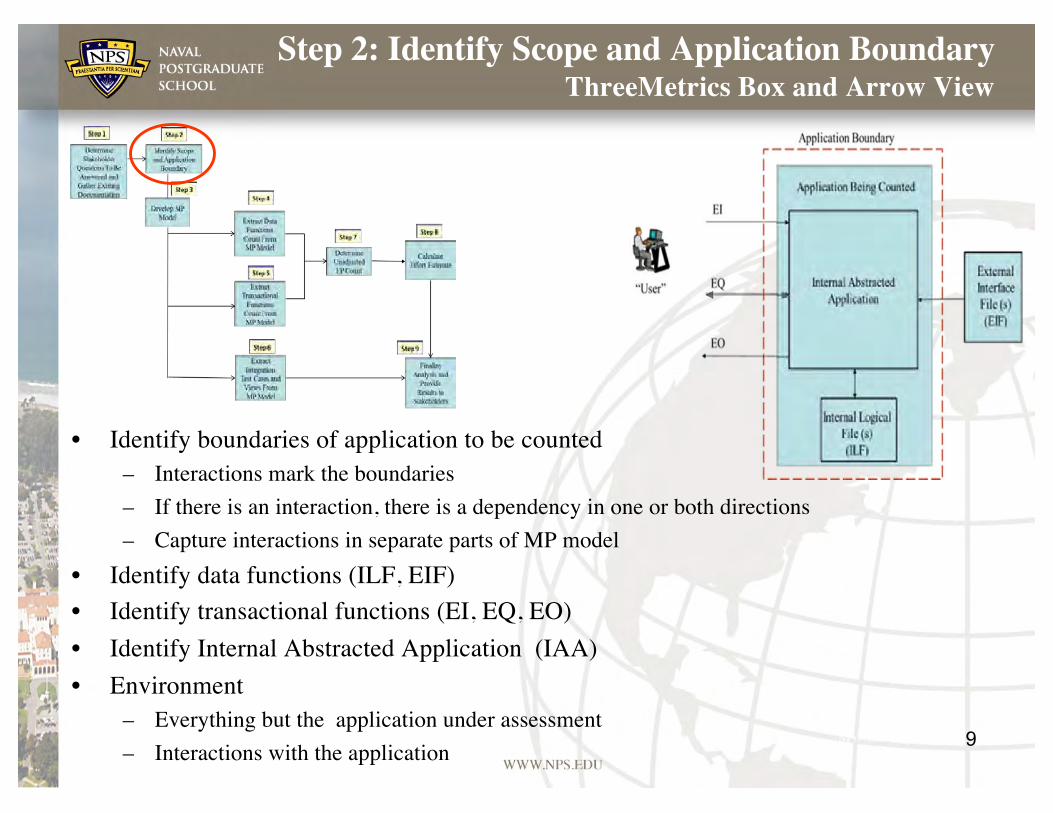
Step 2: Identify Scope and Application Boundary ThreeMetrics Box and Arrow View
9
• Identify boundaries of application to be counted – Interactions mark the boundaries– If there is an interaction, there is a dependency in one or both directions– Capture interactions in separate parts of MP model
• Identify data functions (ILF, EIF)• Identify transactional functions (EI, EQ, EO)• Identify Internal Abstracted Application (IAA)• Environment
– Everything but the application under assessment– Interactions with the application
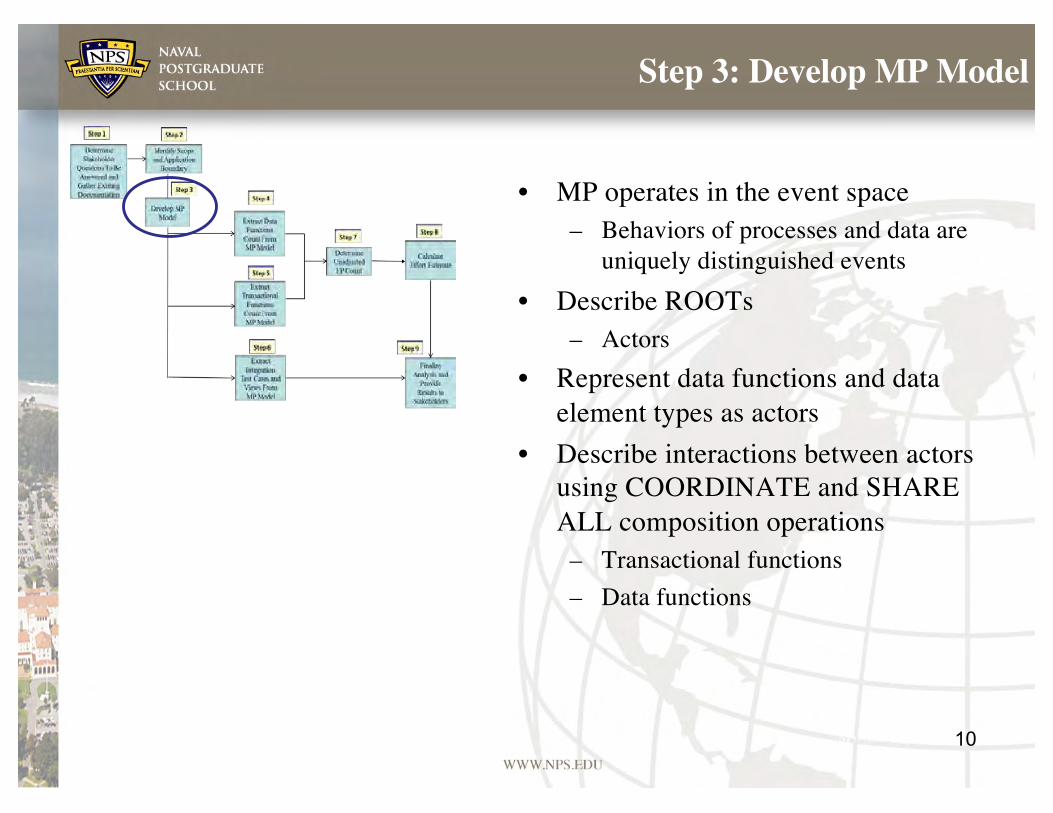
• MP operates in the event space– Behaviors of processes and data are
uniquely distinguished events • Describe ROOTs
– Actors• Represent data functions and data
element types as actors• Describe interactions between actors
using COORDINATE and SHARE ALL composition operations
– Transactional functions– Data functions
10
Step 3: Develop MP Model
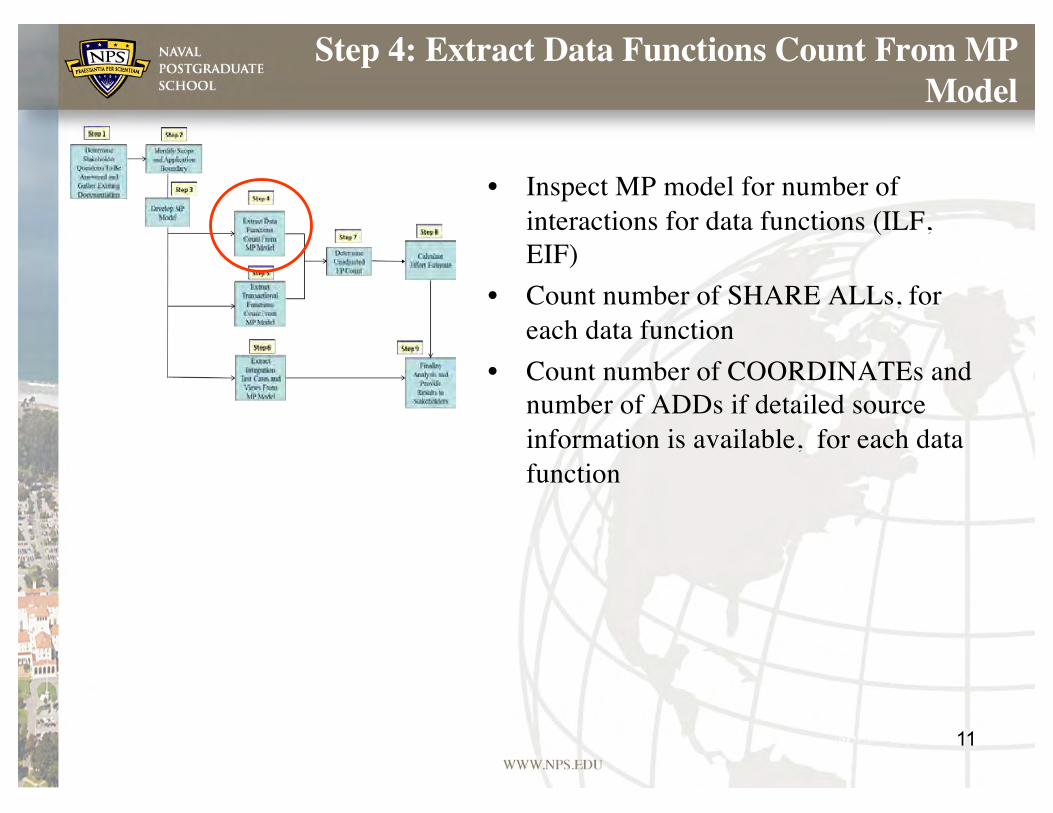
• Inspect MP model for number of interactions for data functions (ILF, EIF)
• Count number of SHARE ALLs, for each data function
• Count number of COORDINATEs and number of ADDs if detailed source information is available, for each data function
11
Step 4: Extract Data Functions Count From MP Model

12
Step 5: Extract Transactional Functions Count From MP Model
• Inspect MP model for interactions between processes (EI, EO, EQ)
• Count number of COORDINATEs for each transactional function
• Count number of COORDINATEs and number of ADDs if detailed source information is available, for each transactional function
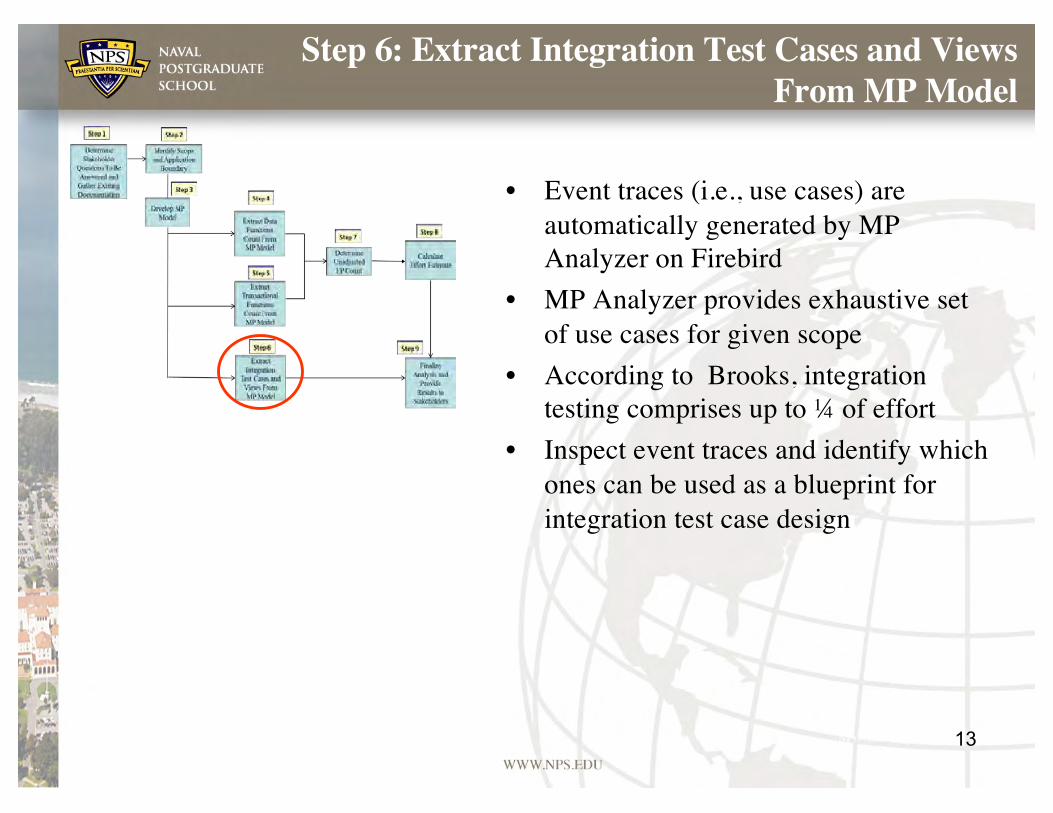
• Event traces (i.e., use cases) are automatically generated by MP Analyzer on Firebird
• MP Analyzer provides exhaustive set of use cases for given scope
• According to Brooks, integration testing comprises up to ¼ of effort
• Inspect event traces and identify which ones can be used as a blueprint for integration test case design
13
Step 6: Extract Integration Test Cases and Views From MP Model
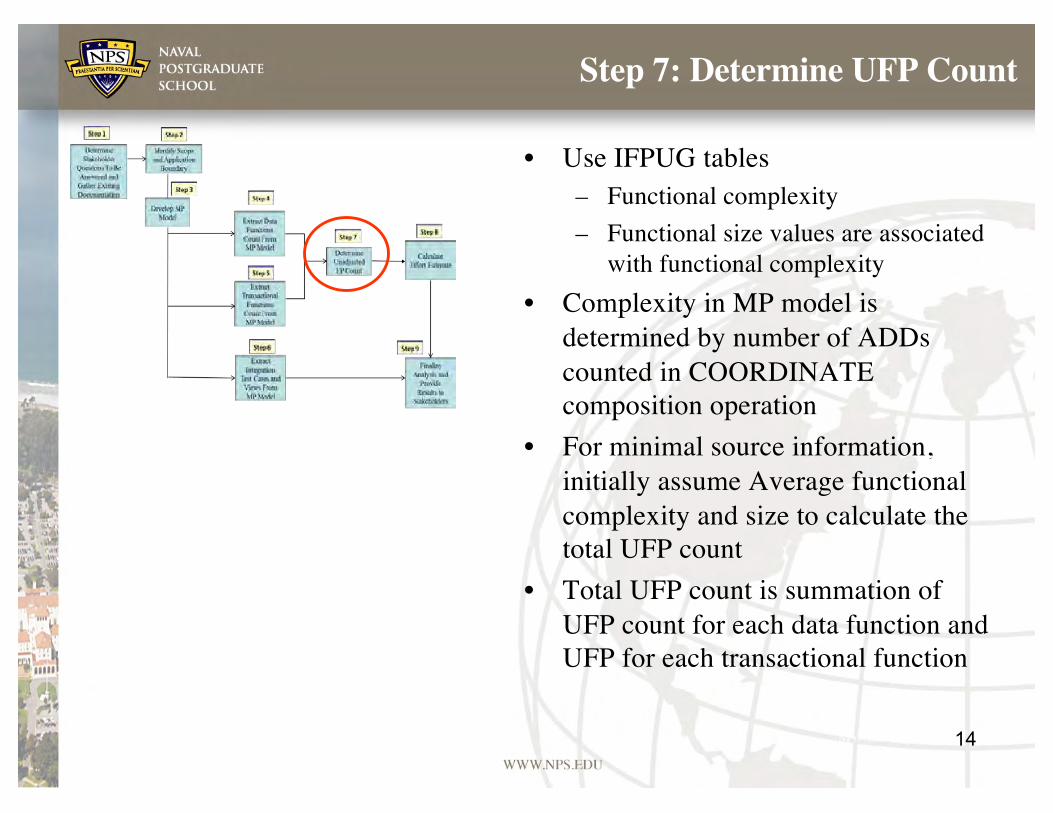
• Use IFPUG tables – Functional complexity– Functional size values are associated
with functional complexity• Complexity in MP model is
determined by number of ADDs counted in COORDINATE composition operation
• For minimal source information, initially assume Average functional complexity and size to calculate the total UFP count
• Total UFP count is summation of UFP count for each data function and UFP for each transactional function
14
Step 7: Determine UFP Count
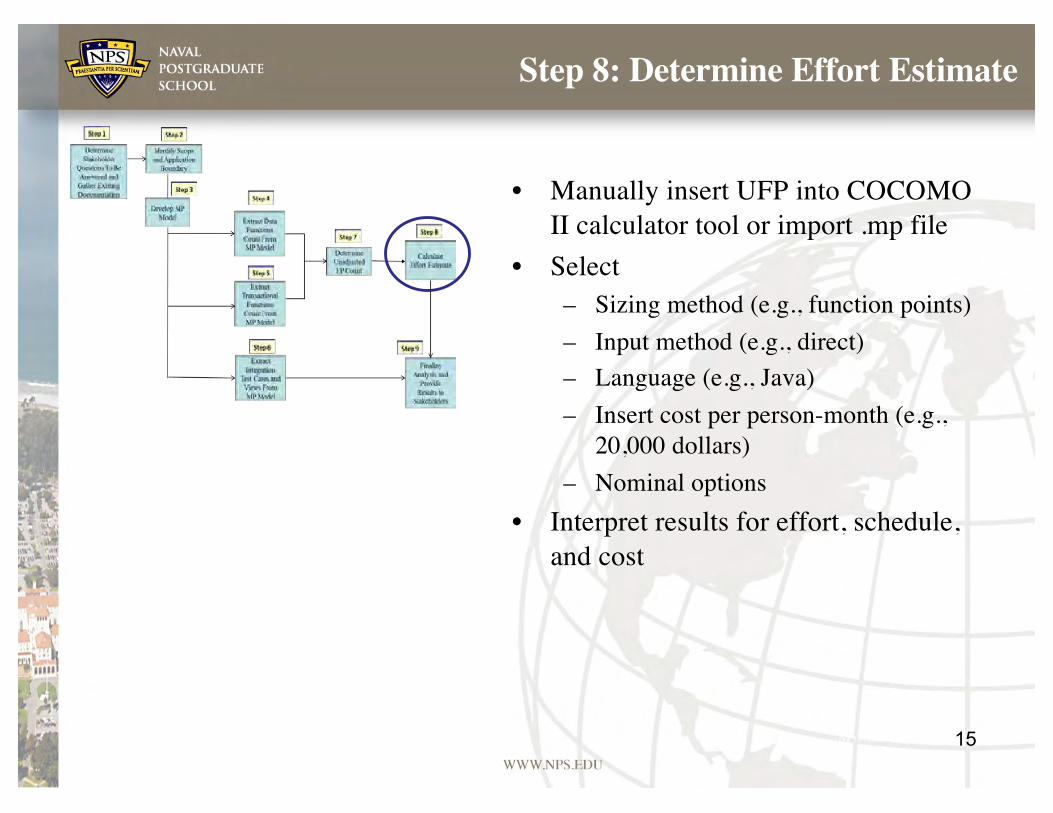
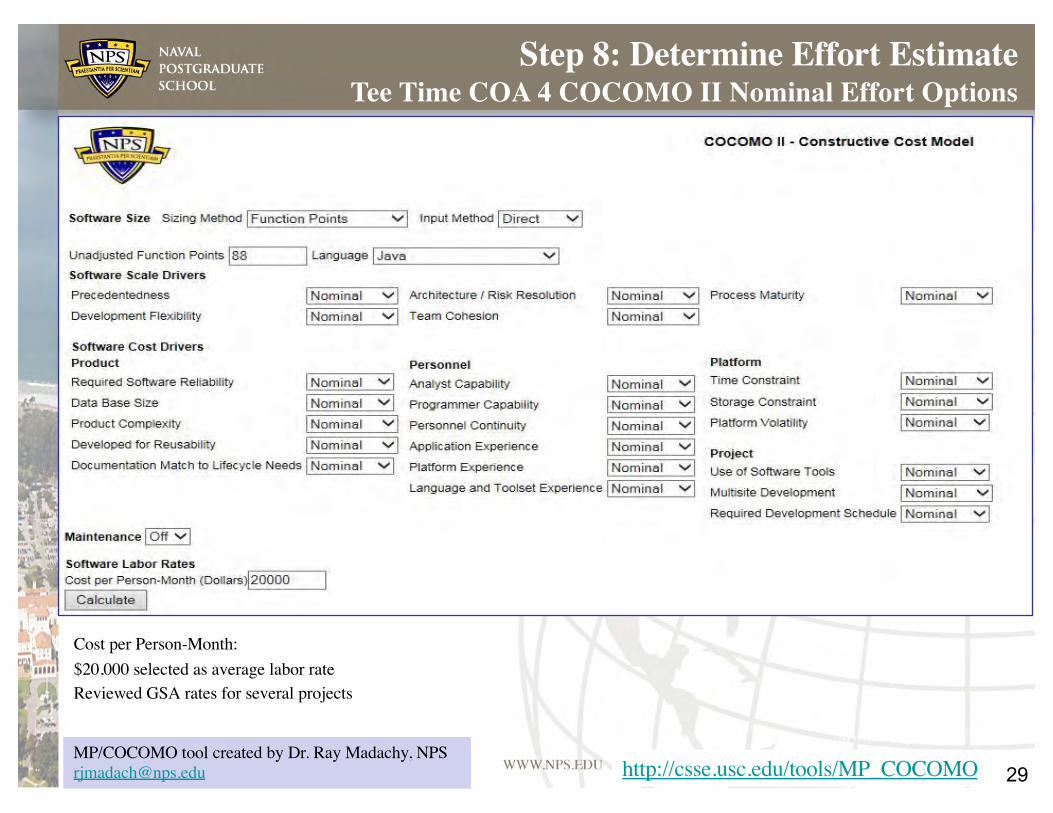
• Manually insert UFP into COCOMO II calculator tool or import .mp file
• Select – Sizing method (e.g., function points)– Input method (e.g., direct)– Language (e.g., Java)– Insert cost per person-month (e.g.,
20,000 dollars)– Nominal options
• Interpret results for effort, schedule, and cost
15
Step 8: Determine Effort Estimate
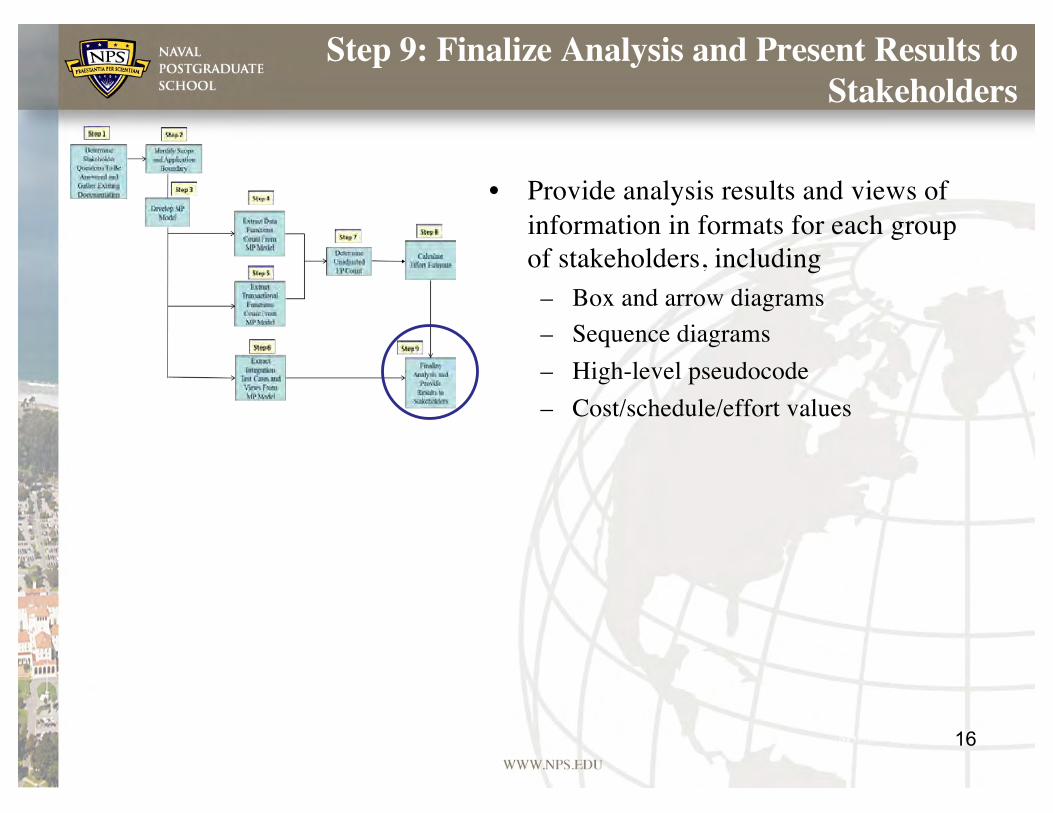
• Provide analysis results and views of information in formats for each group of stakeholders, including
– Box and arrow diagrams– Sequence diagrams– High-level pseudocode– Cost/schedule/effort values
16
Step 9: Finalize Analysis and Present Results to Stakeholders
Methodology Applied to Examples
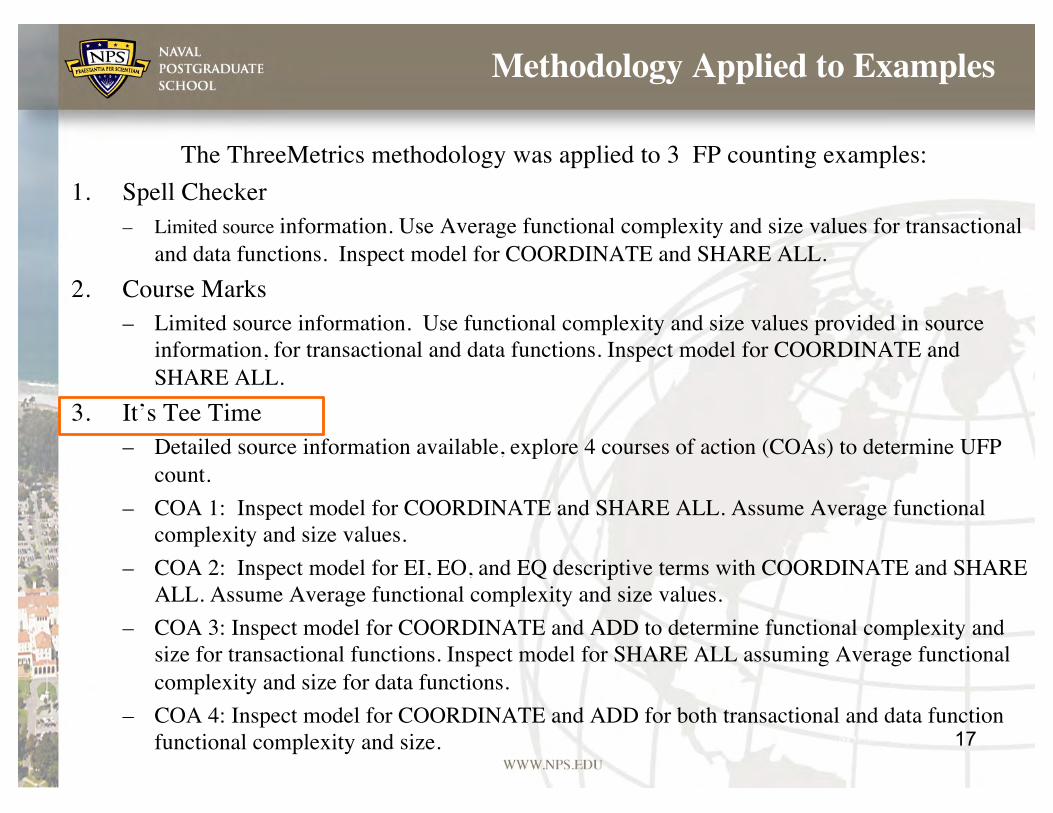
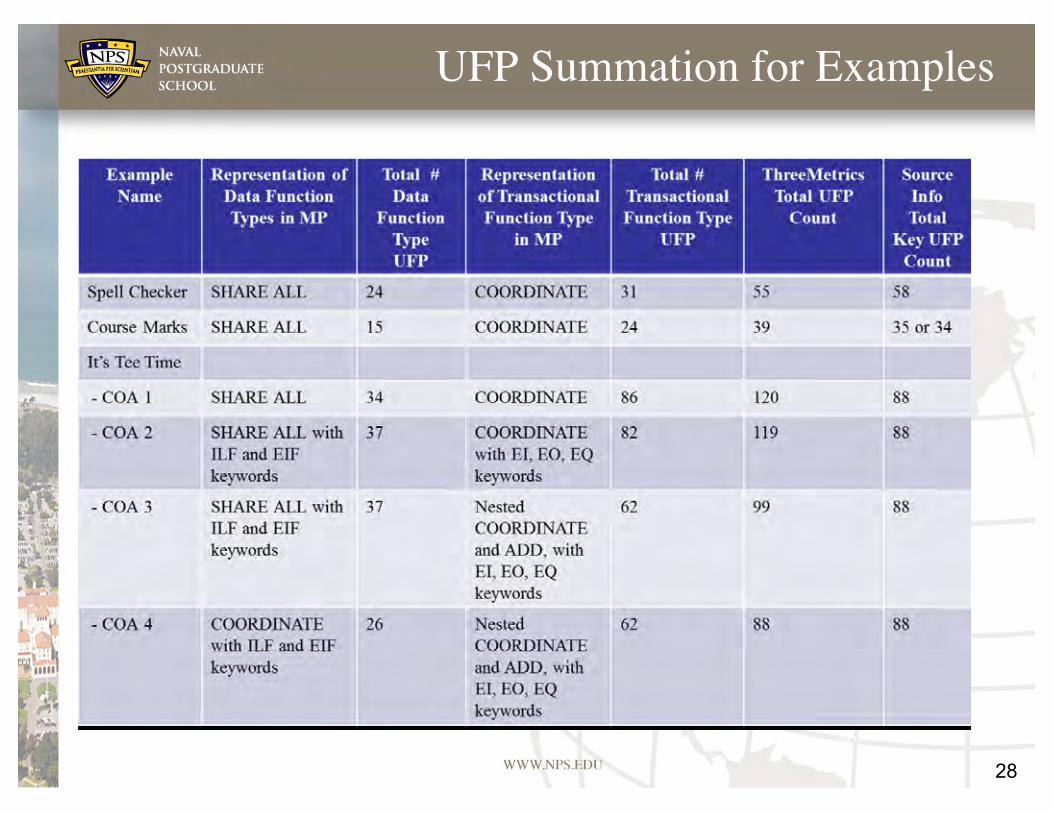
The ThreeMetrics methodology was applied to 3 FP counting examples:1. Spell Checker
– Limited source information. Use Average functional complexity and size values for transactional and data functions. Inspect model for COORDINATE and SHARE ALL.
2. Course Marks– Limited source information. Use functional complexity and size values provided in source
information, for transactional and data functions. Inspect model for COORDINATE and SHARE ALL.
3. It’s Tee Time– Detailed source information available, explore 4 courses of action (COAs) to determine UFP
count.– COA 1: Inspect model for COORDINATE and SHARE ALL. Assume Average functional
complexity and size values. – COA 2: Inspect model for EI, EO, and EQ descriptive terms with COORDINATE and SHARE
ALL. Assume Average functional complexity and size values. – COA 3: Inspect model for COORDINATE and ADD to determine functional complexity and
size for transactional functions. Inspect model for SHARE ALL assuming Average functional complexity and size for data functions.
– COA 4: Inspect model for COORDINATE and ADD for both transactional and data function functional complexity and size. 17
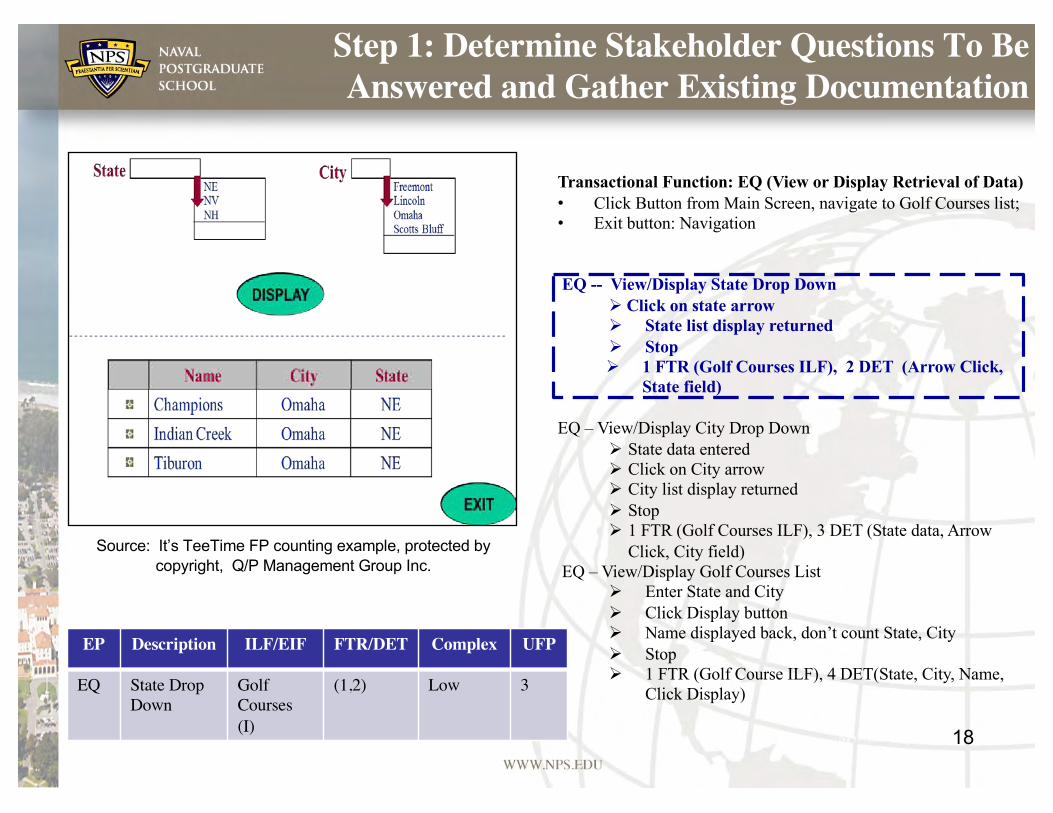
Step 1: Determine Stakeholder Questions To Be Answered and Gather Existing Documentation
18
Transactional Function: EQ (View or Display Retrieval of Data) • Click Button from Main Screen, navigate to Golf Courses list; • Exit button: Navigation
EQ -- View/Display State Drop DownØ Click on state arrowØ State list display returnedØ StopØ 1 FTR (Golf Courses ILF), 2 DET (Arrow Click,
State field)
EQ – View/Display City Drop DownØ State data entered Ø Click on City arrowØ City list display returnedØ StopØ 1 FTR (Golf Courses ILF), 3 DET (State data, Arrow
Click, City field)EQ – View/Display Golf Courses List
Ø Enter State and CityØ Click Display buttonØ Name displayed back, don’t count State, CityØ StopØ 1 FTR (Golf Course ILF), 4 DET(State, City, Name,
Click Display)
EP Description ILF/EIF FTR/DET Complex UFP
EQ State Drop Down
Golf Courses (I)
(1,2) Low 3
Source: It’s TeeTime FP counting example, protected by copyright, Q/P Management Group Inc.
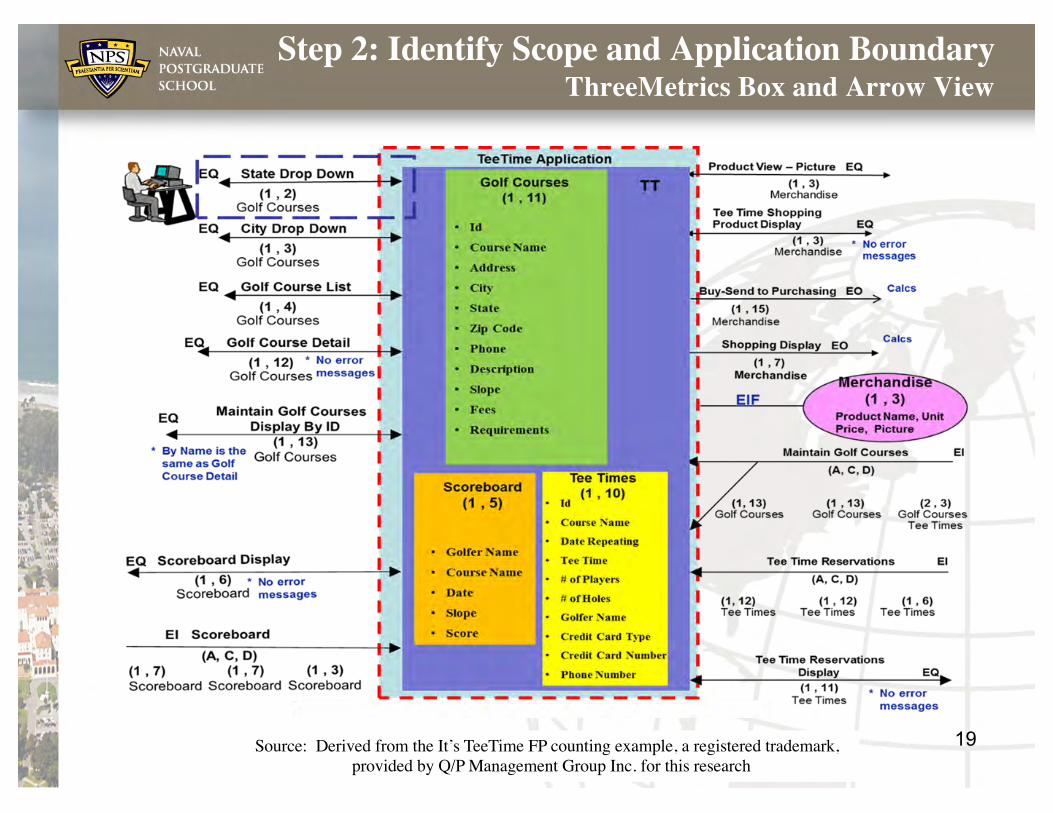
19Source: Derived from the It’s TeeTime FP counting example, a registered trademark, provided by Q/P Management Group Inc. for this research
Step 2: Identify Scope and Application Boundary ThreeMetrics Box and Arrow View
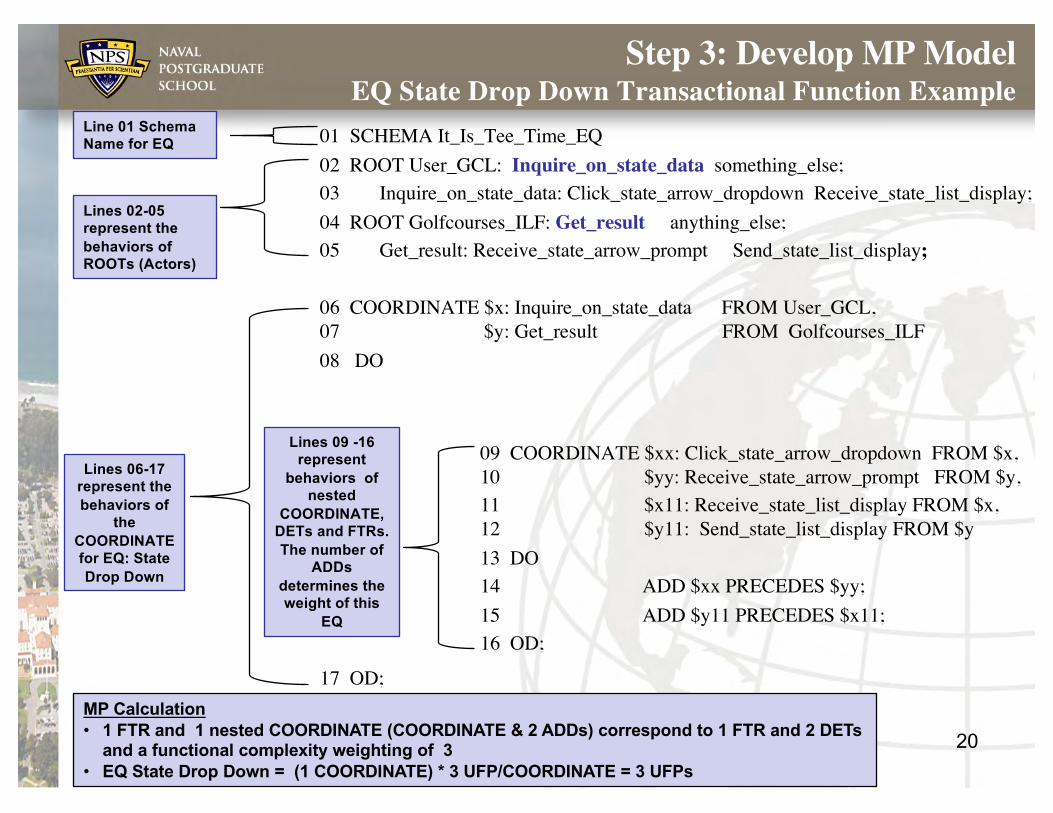
Step 3: Develop MP ModelEQ State Drop Down Transactional Function Example
01 SCHEMA It_Is_Tee_Time_EQ 02 ROOT User_GCL: Inquire_on_state_data something_else; 03 Inquire_on_state_data: Click_state_arrow_dropdown Receive_state_list_display;04 ROOT Golfcourses_ILF: Get_result anything_else;05 Get_result: Receive_state_arrow_prompt Send_state_list_display;
06 COORDINATE $x: Inquire_on_state_data FROM User_GCL, 07 $y: Get_result FROM Golfcourses_ILF08 DO
20
Lines 02-05 represent the behaviors of ROOTs (Actors)
Lines 06-17 represent the behaviors of
the COORDINATE for EQ: State Drop Down
MP Calculation• 1 FTR and 1 nested COORDINATE (COORDINATE & 2 ADDs) correspond to 1 FTR and 2 DETs
and a functional complexity weighting of 3• EQ State Drop Down = (1 COORDINATE) * 3 UFP/COORDINATE = 3 UFPs
Line 01 Schema Name for EQ
17 OD;
09 COORDINATE $xx: Click_state_arrow_dropdown FROM $x, 10 $yy: Receive_state_arrow_prompt FROM $y,11 $x11: Receive_state_list_display FROM $x, 12 $y11: Send_state_list_display FROM $y13 DO14 ADD $xx PRECEDES $yy;15 ADD $y11 PRECEDES $x11; 16 OD;
Lines 09 -16 represent
behaviors of nested
COORDINATE, DETs and FTRs. The number of
ADDs determines the weight of this
EQ
21
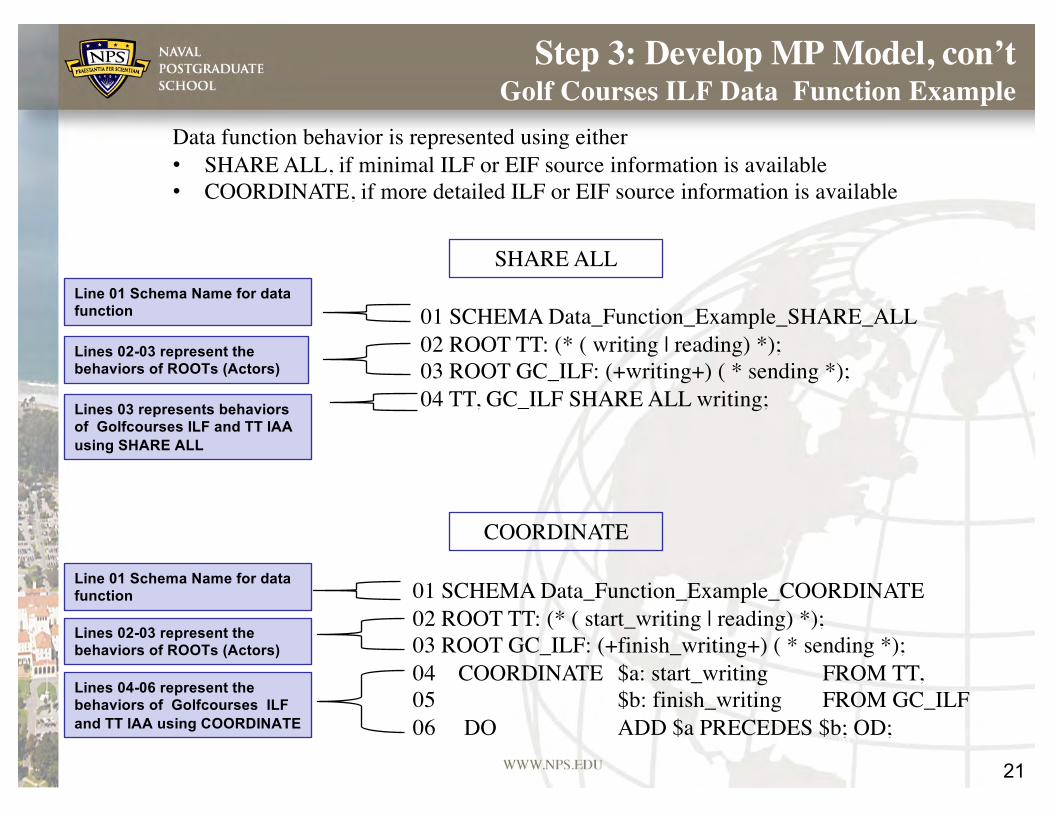
Step 3: Develop MP Model, con’tGolf Courses ILF Data Function Example
Data function behavior is represented using either • SHARE ALL, if minimal ILF or EIF source information is available• COORDINATE, if more detailed ILF or EIF source information is available
01 SCHEMA Data_Function_Example_SHARE_ALL02 ROOT TT: (* ( writing | reading) *);03 ROOT GC_ILF: (+writing+) ( * sending *);04 TT, GC_ILF SHARE ALL writing;
Line 01 Schema Name for data function
Lines 02-03 represent the behaviors of ROOTs (Actors)
Lines 03 represents behaviors of Golfcourses ILF and TT IAA using SHARE ALL
01 SCHEMA Data_Function_Example_COORDINATE02 ROOT TT: (* ( start_writing | reading) *);03 ROOT GC_ILF: (+finish_writing+) ( * sending *);04 COORDINATE $a: start_writing FROM TT,05 $b: finish_writing FROM GC_ILF06 DO ADD $a PRECEDES $b; OD;
Line 01 Schema Name for data function
Lines 02-03 represent the behaviors of ROOTs (Actors)
Lines 04-06 represent the behaviors of Golfcourses ILF and TT IAA using COORDINATE
SHARE ALL
COORDINATE
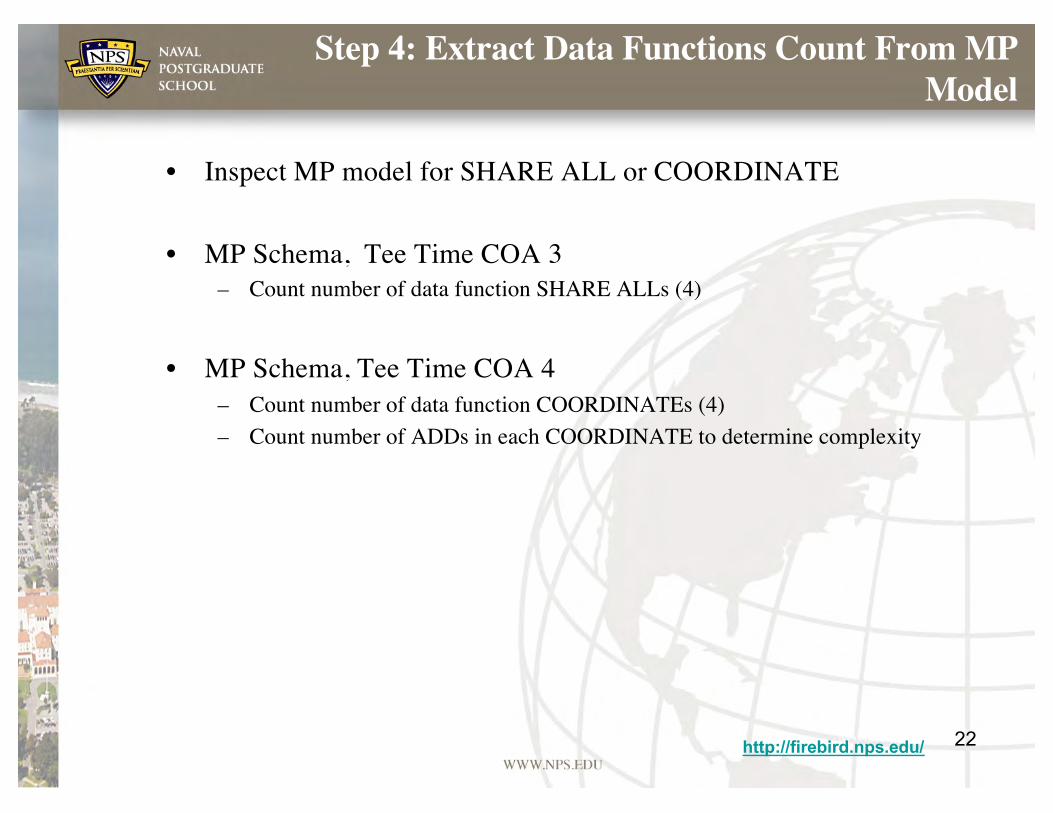
• Inspect MP model for SHARE ALL or COORDINATE
• MP Schema, Tee Time COA 3– Count number of data function SHARE ALLs (4)
• MP Schema, Tee Time COA 4 – Count number of data function COORDINATEs (4) – Count number of ADDs in each COORDINATE to determine complexity
22http://firebird.nps.edu/
Step 4: Extract Data Functions Count From MP Model
23
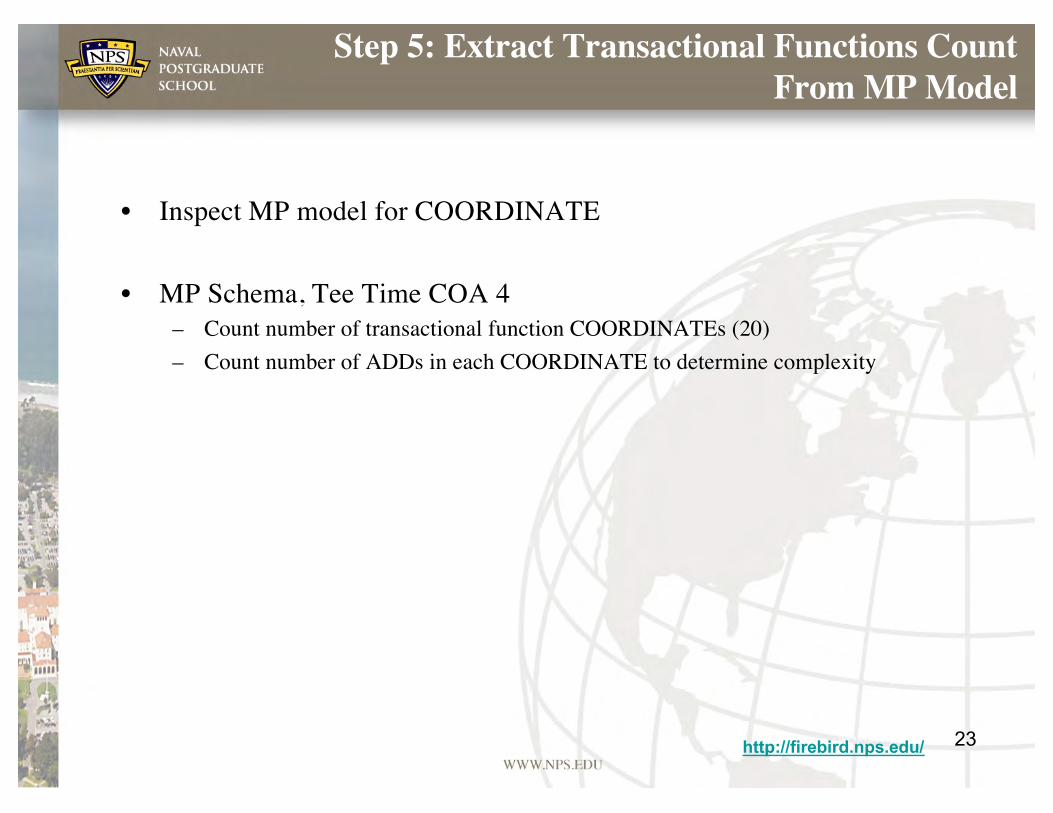
Step 5: Extract Transactional Functions Count From MP Model
http://firebird.nps.edu/
• Inspect MP model for COORDINATE
• MP Schema, Tee Time COA 4– Count number of transactional function COORDINATEs (20) – Count number of ADDs in each COORDINATE to determine complexity
24
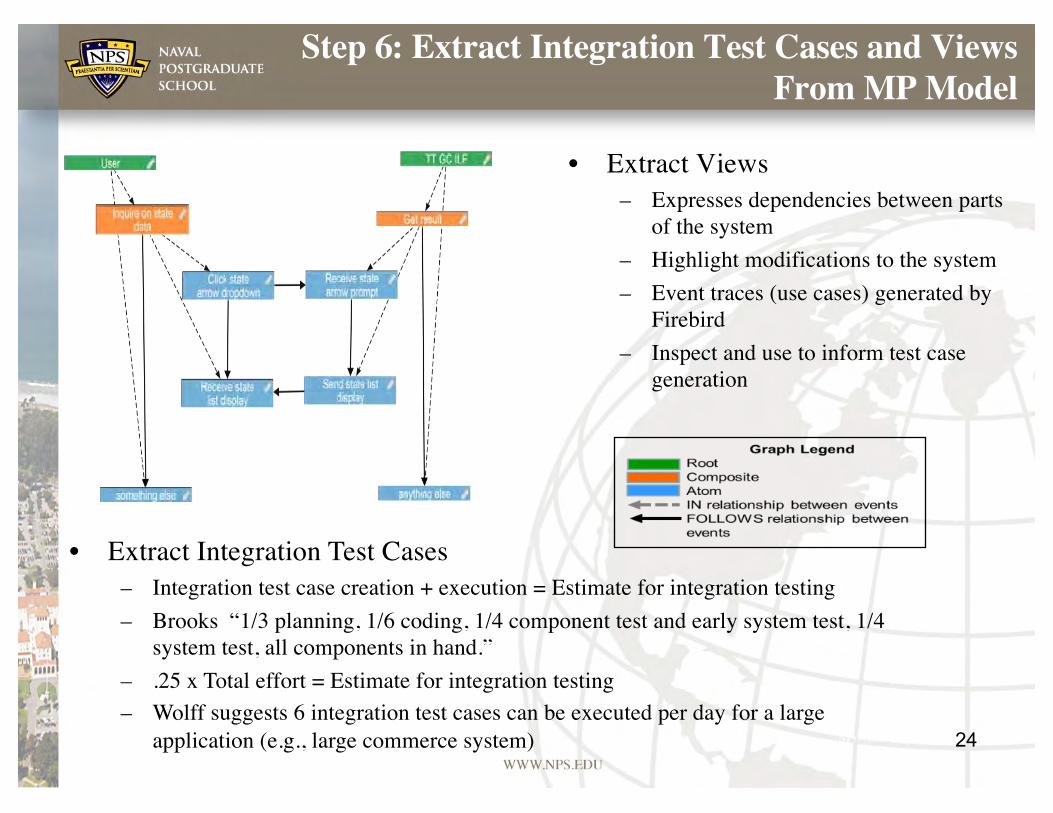
Step 6: Extract Integration Test Cases and Views From MP Model
• Extract Views– Expresses dependencies between parts
of the system– Highlight modifications to the system– Event traces (use cases) generated by
Firebird– Inspect and use to inform test case
generation
• Extract Integration Test Cases– Integration test case creation + execution = Estimate for integration testing– Brooks “1/3 planning, 1/6 coding, 1/4 component test and early system test, 1/4
system test, all components in hand.” – .25 x Total effort = Estimate for integration testing – Wolff suggests 6 integration test cases can be executed per day for a large
application (e.g., large commerce system)
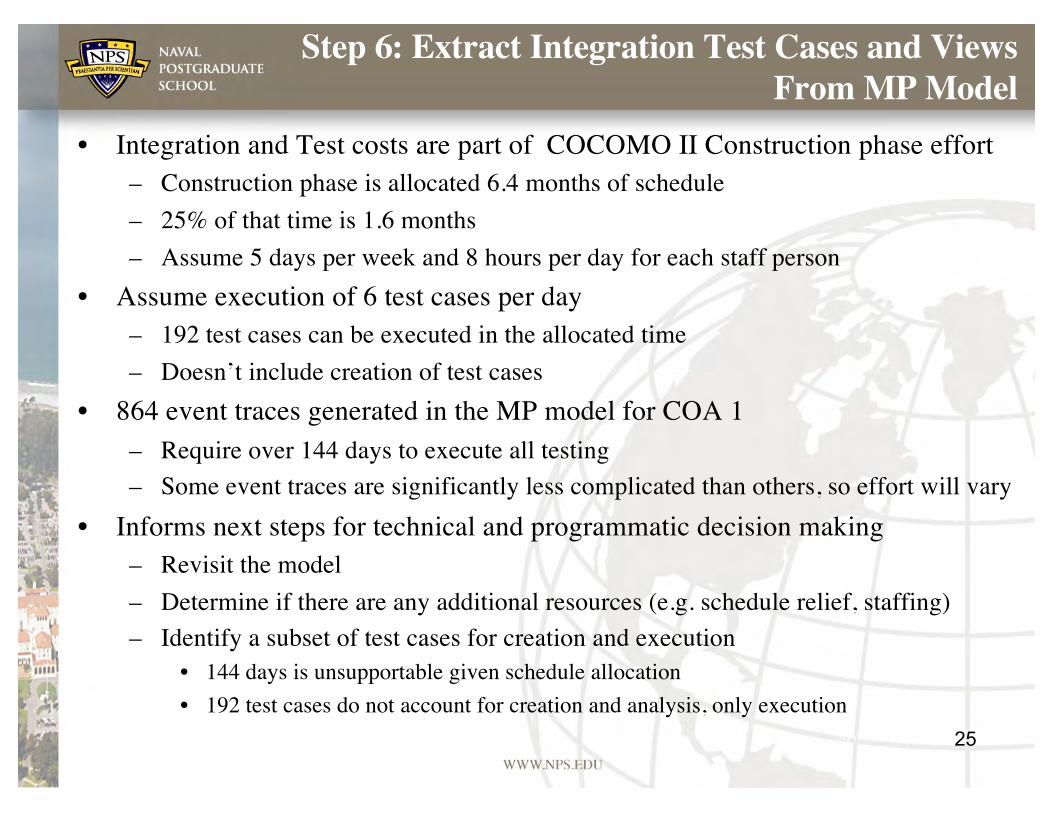
• Integration and Test costs are part of COCOMO II Construction phase effort– Construction phase is allocated 6.4 months of schedule– 25% of that time is 1.6 months– Assume 5 days per week and 8 hours per day for each staff person
• Assume execution of 6 test cases per day – 192 test cases can be executed in the allocated time– Doesn’t include creation of test cases
• 864 event traces generated in the MP model for COA 1– Require over 144 days to execute all testing– Some event traces are significantly less complicated than others, so effort will vary
• Informs next steps for technical and programmatic decision making – Revisit the model– Determine if there are any additional resources (e.g. schedule relief, staffing)– Identify a subset of test cases for creation and execution
• 144 days is unsupportable given schedule allocation• 192 test cases do not account for creation and analysis, only execution
25
Step 6: Extract Integration Test Cases and Views From MP Model
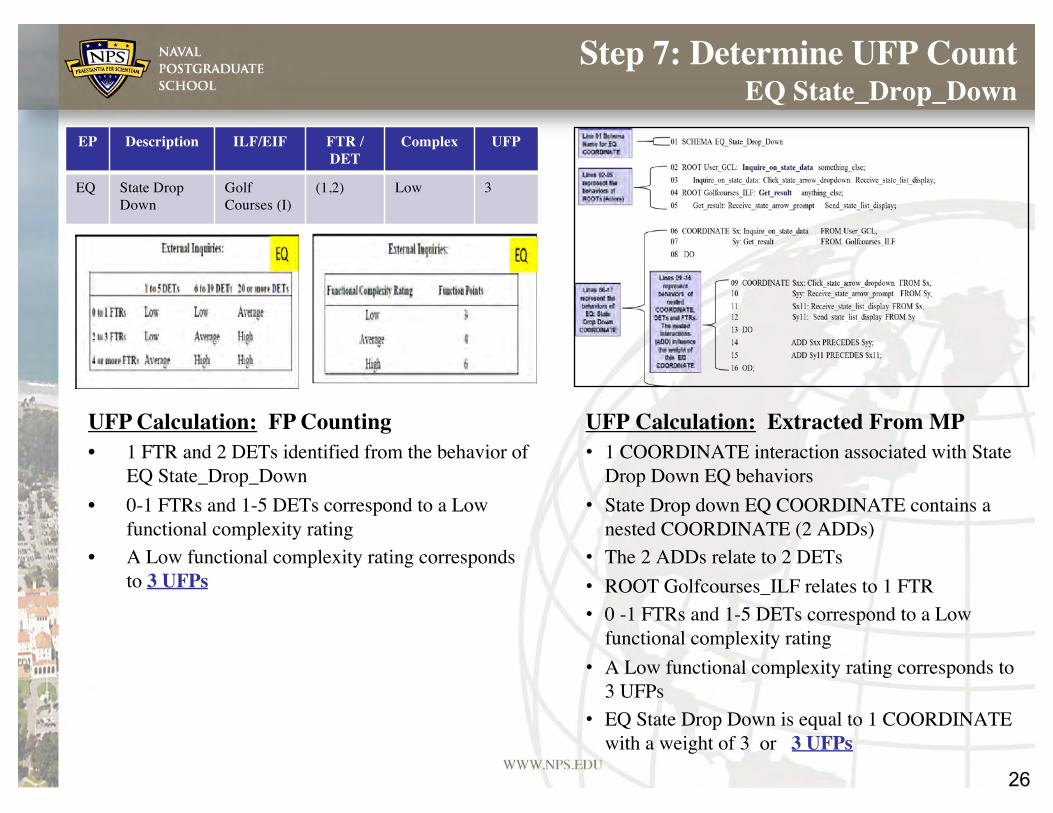
UFP Calculation: Extracted From MP• 1 COORDINATE interaction associated with State
Drop Down EQ behaviors• State Drop down EQ COORDINATE contains a
nested COORDINATE (2 ADDs)• The 2 ADDs relate to 2 DETs • ROOT Golfcourses_ILF relates to 1 FTR• 0 -1 FTRs and 1-5 DETs correspond to a Low
functional complexity rating• A Low functional complexity rating corresponds to
3 UFPs• EQ State Drop Down is equal to 1 COORDINATE
with a weight of 3 or 3 UFPs
26
UFP Calculation: FP Counting• 1 FTR and 2 DETs identified from the behavior of
EQ State_Drop_Down • 0-1 FTRs and 1-5 DETs correspond to a Low
functional complexity rating• A Low functional complexity rating corresponds
to 3 UFPs
EP Description ILF/EIF FTR / DET
Complex UFP
EQ State Drop Down
Golf Courses (I)
(1,2) Low 3
Step 7: Determine UFP CountEQ State_Drop_Down
27
Step 7: Determine Unadjusted FP Count, con’t
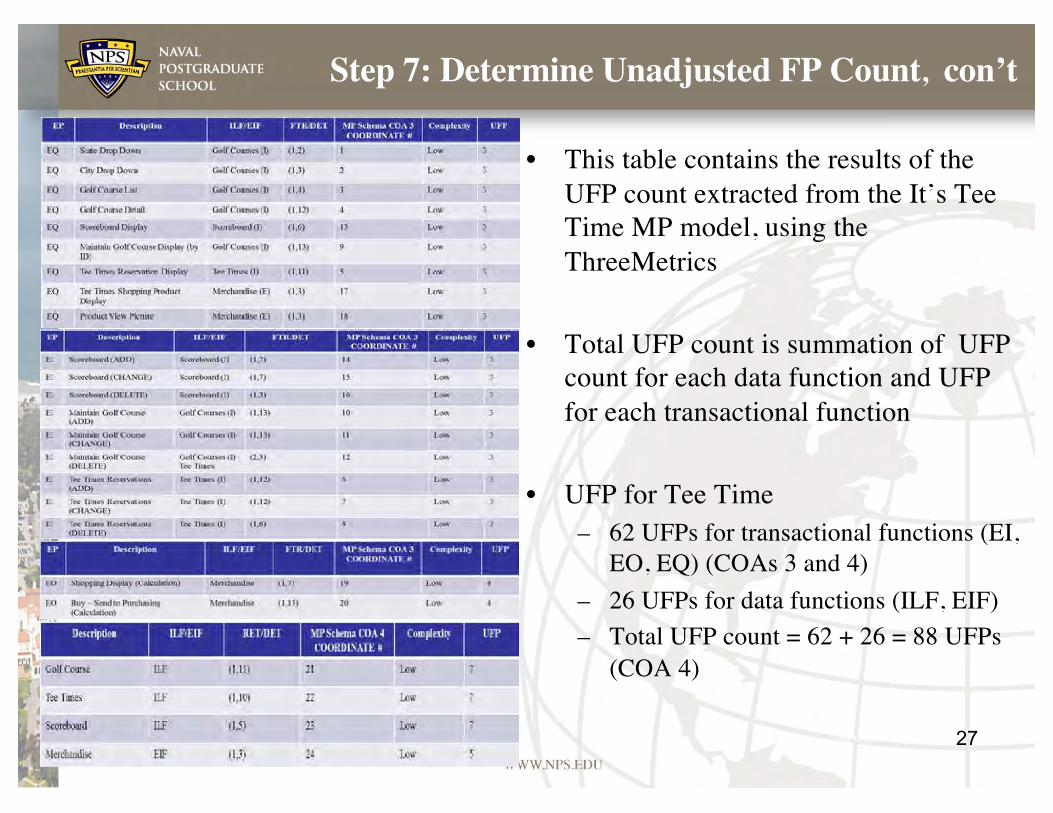
• This table contains the results of the UFP count extracted from the It’s Tee Time MP model, using the ThreeMetrics
• Total UFP count is summation of UFP count for each data function and UFP for each transactional function
• UFP for Tee Time– 62 UFPs for transactional functions (EI,
EO, EQ) (COAs 3 and 4)– 26 UFPs for data functions (ILF, EIF) – Total UFP count = 62 + 26 = 88 UFPs
(COA 4)
UFP Summation for Examples
28
29MP/COCOMO tool created by Dr. Ray Madachy, NPS [email protected] http://csse.usc.edu/tools/MP_COCOMO
Step 8: Determine Effort EstimateTee Time COA 4 COCOMO II Nominal Effort Options
Cost per Person-Month:$20,000 selected as average labor rateReviewed GSA rates for several projects
• SW
30MP/COCOMO tool Created by Dr. Ray Madachy, NPS, [email protected]/
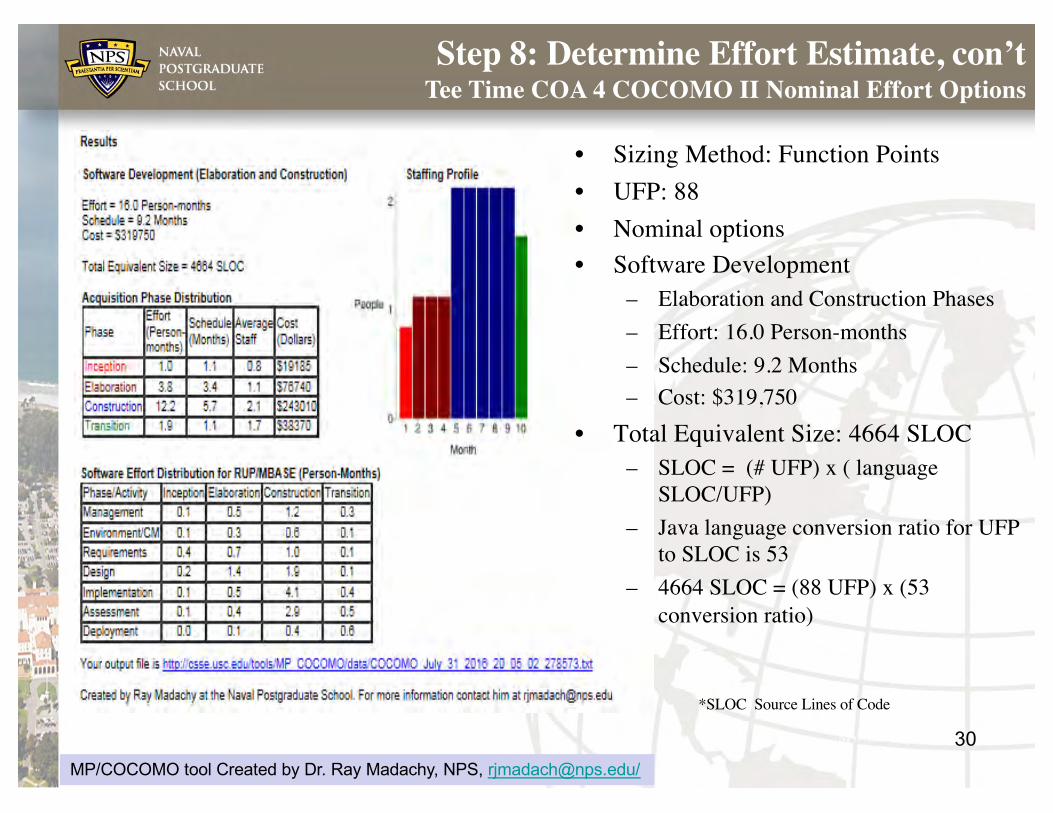
Step 8: Determine Effort Estimate, con’tTee Time COA 4 COCOMO II Nominal Effort Options
• Sizing Method: Function Points• UFP: 88 • Nominal options• Software Development
– Elaboration and Construction Phases– Effort: 16.0 Person-months– Schedule: 9.2 Months– Cost: $319,750
• Total Equivalent Size: 4664 SLOC– SLOC = (# UFP) x ( language
SLOC/UFP)– Java language conversion ratio for UFP
to SLOC is 53– 4664 SLOC = (88 UFP) x (53
conversion ratio)
*SLOC Source Lines of Code
31
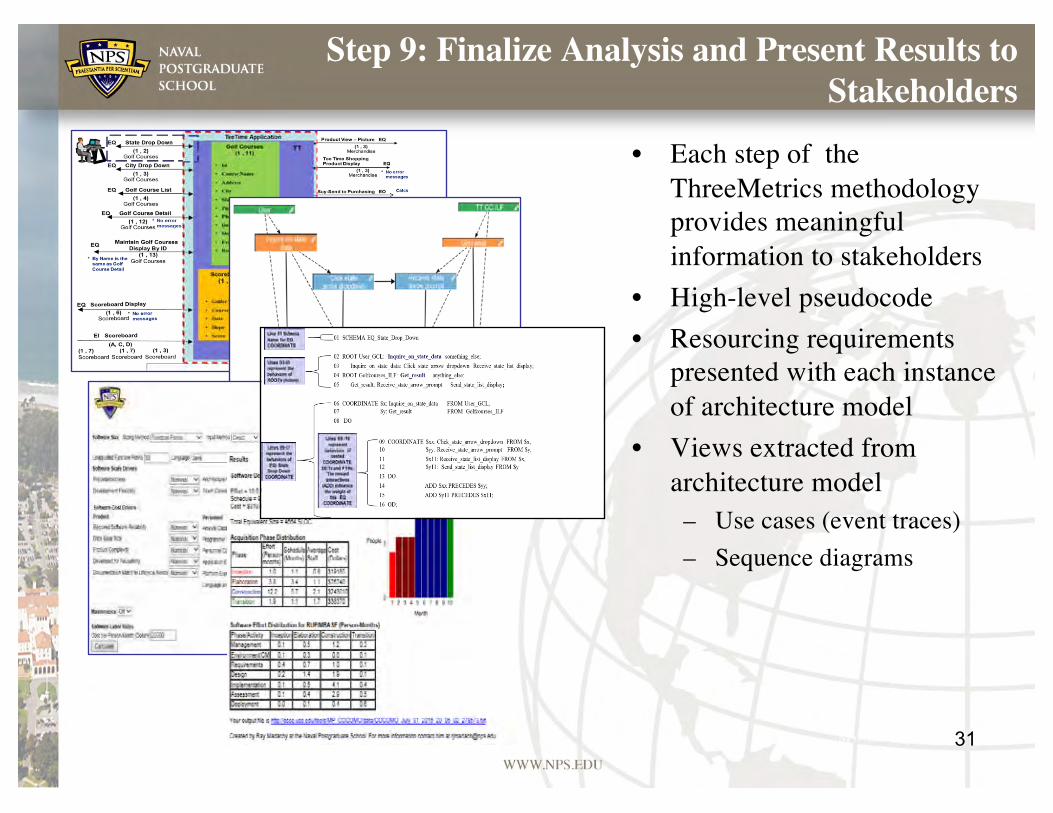
Step 9: Finalize Analysis and Present Results to Stakeholders
• Each step of the ThreeMetrics methodology provides meaningful information to stakeholders
• High-level pseudocode• Resourcing requirements
presented with each instance of architecture model
• Views extracted from architecture model
– Use cases (event traces)– Sequence diagrams
Contributions
32
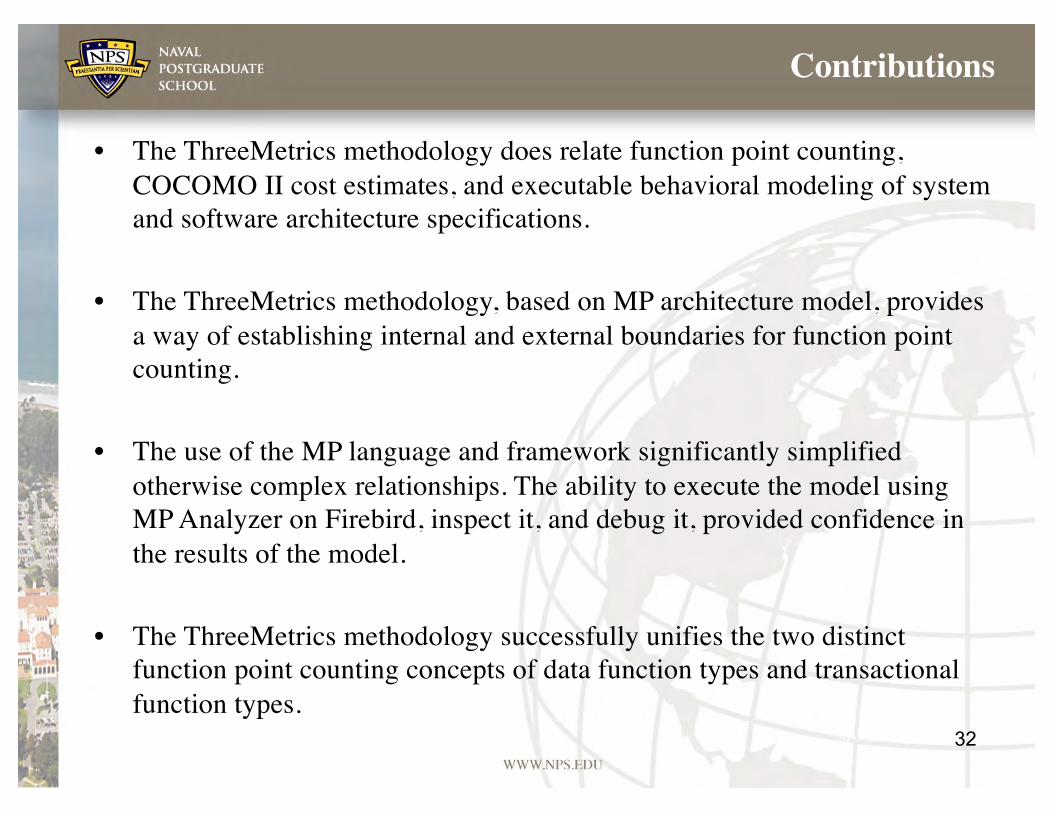
• The ThreeMetrics methodology does relate function point counting, COCOMO II cost estimates, and executable behavioral modeling of system and software architecture specifications.
• The ThreeMetrics methodology, based on MP architecture model, provides a way of establishing internal and external boundaries for function point counting.
• The use of the MP language and framework significantly simplified otherwise complex relationships. The ability to execute the model using MP Analyzer on Firebird, inspect it, and debug it, provided confidence in the results of the model.
• The ThreeMetrics methodology successfully unifies the two distinct function point counting concepts of data function types and transactional function types.
Future Work
• Determine criteria for selection of integration test cases from set of available MP event traces, leveraging Jackson’s small scope hypothesis
• Determine selection of COCOMO II formula coefficients based on MP metrics
• Consider how to use all the information in an MP model, particularly the event grammar (“pseudo code”), to inform cost estimates
• Integrate with other MBSE research on System Qualities Ontology, Tradespace and Affordability (SQOTA) Project with DoD Systems Engineering Research Center (SERC)
33

34
Discussion
35
Back Up
Published Papers and Presentations
Peer Reviewed Conference Papers and Presentations1. M. Farah-Stapleton, M. Auguston, R. Madachy, and K. Giammarco, “Executable behavioral modeling of
system- and software-architecture specifications to inform resourcing decisions,” in 31st International Forum on COCOMO and Systems/Software Cost Modeling, Los Angeles, CA , Oct 2016. (Abstract Submitted) http://csse.usc.edu/new/events/event/31st-international-forum-on-cocomo-and-systemssoftware-cost-modeling
2. M. Farah-Stapleton, M. Auguston, and K. Giammarco, “Executable behavioral modeling of system and software architecture specifications to inform resourcing decisions,” Complex Adaptive Systems (CAS) Conference, Los Angeles, CA, Nov 2016. (Paper Accepted)
3. M. Farah-Stapleton, M. Auguston, K. Giammarco, “Behavioral Modeling of Software Intensive System Architectures” at the Complex Adaptive Systems (CAS) Conference, Baltimore, MD, 2013, pp. 204-209.
4. K. Giammarco, M. Auguston, C. Baldwin, J. Crump, and M. Farah-Stapleton, “Controlling Design Complexity with the Monterey Phoenix Approach,” Complex Adaptive Systems (CAS) Conference, Philadelphia, PA, 2014, Volume 36, pp. 204-209.
5. M. Farah-Stapleton, Resource Analysis Based On System Architecture Behavior, Technical Presentation, 30th International Forum on COCOMO and Systems/Software Cost Modeling, November 2015. http://www.google.com/url?sa=t&rct=j&q=&esrc=s&source=web&cd=3&ved=0ahUKEwiXuuGLzoXMAhWHuBoKHTXbBTsQFggsMAI&url=http%3A%2F%2Fcsse.usc.edu%2Fnew%2Fwp-content%2Fuploads%2F2015%2F11%2FCOCOMO_Farah-Stapleton__November-2015-DRAFT9_MFS.pptx&usg=AFQjCNEcSGfu3opnpKfOYG9LAfAfChKthA&sig2=y3COAQP5B4QsGwi4kvvXyg
36
Published Papers and Presentationscon’t
Invited Presentations1. M. Farah-Stapleton, “Behavioral Modeling of Software System Architectures and
Verification & Validation,” FAA 10th Annual Verification & Validation Summit, Sep 2015.https://www.faa.gov/about/office_org/headquarters_offices/ang/offices/tc/library/v&vsummit/v&vsummit2015/presentations/V%20and%20V%20and%20Behavorial%20Modeling_Monica%20Farah-Stapleton.pdf
2. M. Farah-Stapleton, and K. Giammarco, “Behavioral Modeling of System Architectures”, INCOSE SoS WG Webinar series, Jan 2014.
3. M. Farah-Stapleton, and K. Giammarco, “Behavioral Modeling of Software Intensive System of System Architectures and Emergence,” International Forum, OSD Systems Engineering, TTCP TP4 SoS Workstream, May 2014.
Peer Reviewed Technical Posters1. M. Farah-Stapleton, Technical poster, 2015 SERC Doctoral Students Forum & SERC Sponsor Research Review,
Dec 2015.
Invited Article1. M. Farah-Stapleton, Behavioral Modeling of Software Intensive System Architectures Using Monterey
Phoenix, CRUSER Newsletter, Dec 2013.
37
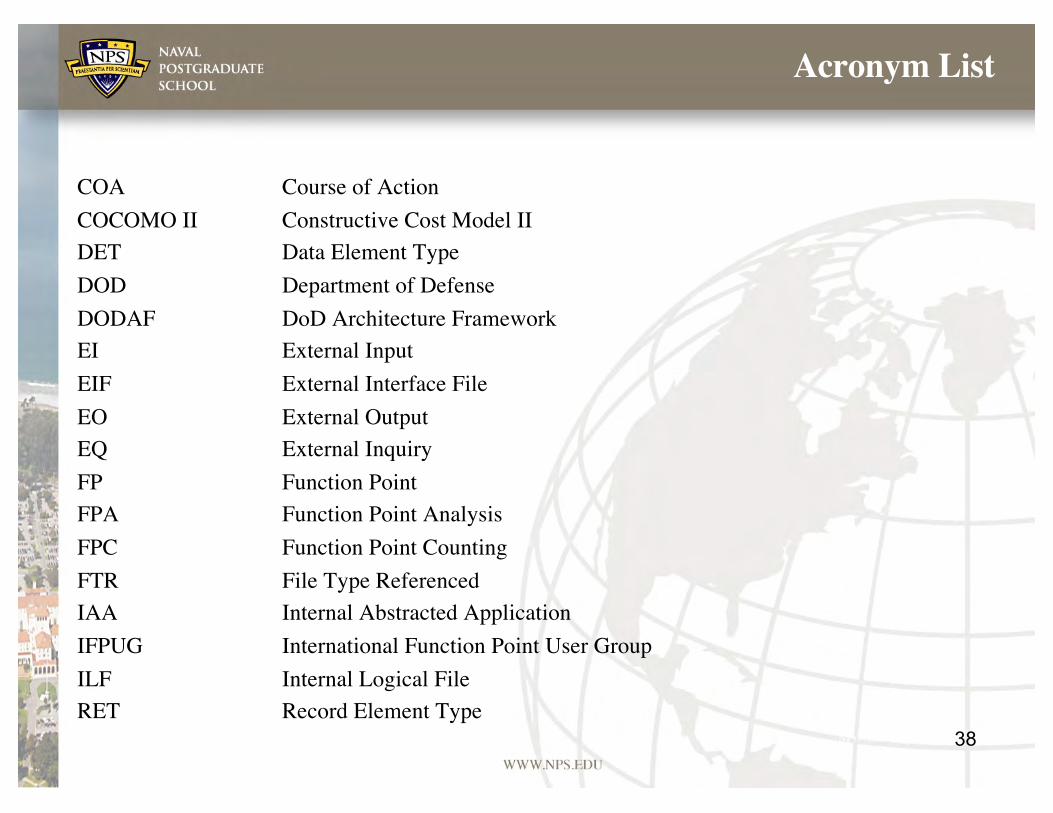
Acronym List
COA Course of ActionCOCOMO II Constructive Cost Model IIDET Data Element TypeDOD Department of DefenseDODAF DoD Architecture FrameworkEI External InputEIF External Interface FileEO External OutputEQ External InquiryFP Function PointFPA Function Point AnalysisFPC Function Point CountingFTR File Type ReferencedIAA Internal Abstracted ApplicationIFPUG International Function Point User GroupILF Internal Logical FileRET Record Element Type
38
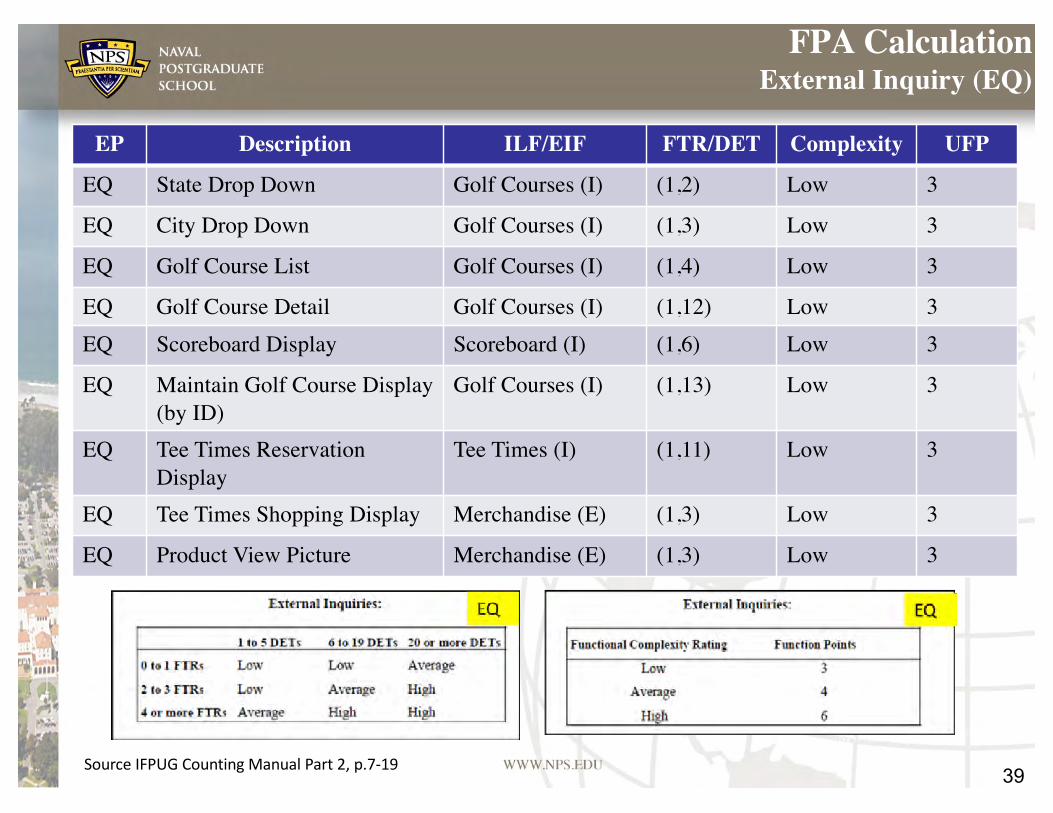
FPA Calculation External Inquiry (EQ)
EP Description ILF/EIF FTR/DET Complexity UFP
EQ State Drop Down Golf Courses (I) (1,2) Low 3
EQ City Drop Down Golf Courses (I) (1,3) Low 3
EQ Golf Course List Golf Courses (I) (1,4) Low 3
EQ Golf Course Detail Golf Courses (I) (1,12) Low 3EQ Scoreboard Display Scoreboard (I) (1,6) Low 3
EQ Maintain Golf Course Display (by ID)
Golf Courses (I) (1,13) Low 3
EQ Tee Times Reservation Display
Tee Times (I) (1,11) Low 3
EQ Tee Times Shopping Display Merchandise (E) (1,3) Low 3
EQ Product View Picture Merchandise (E) (1,3) Low 3
39SourceIFPUGCountingManualPart2,p.7-19
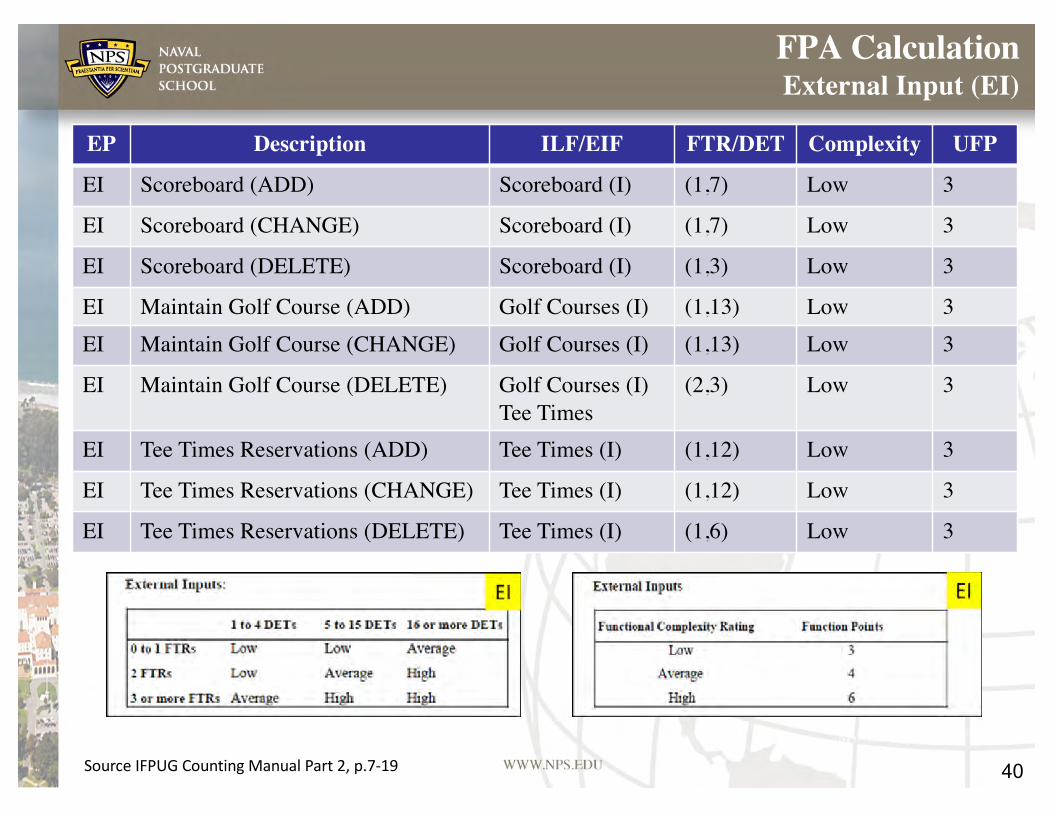
FPA Calculation External Input (EI)
EP Description ILF/EIF FTR/DET Complexity UFP
EI Scoreboard (ADD) Scoreboard (I) (1,7) Low 3
EI Scoreboard (CHANGE) Scoreboard (I) (1,7) Low 3
EI Scoreboard (DELETE) Scoreboard (I) (1,3) Low 3
EI Maintain Golf Course (ADD) Golf Courses (I) (1,13) Low 3EI Maintain Golf Course (CHANGE) Golf Courses (I) (1,13) Low 3
EI Maintain Golf Course (DELETE) Golf Courses (I)Tee Times
(2,3) Low 3
EI Tee Times Reservations (ADD) Tee Times (I) (1,12) Low 3
EI Tee Times Reservations (CHANGE) Tee Times (I) (1,12) Low 3
EI Tee Times Reservations (DELETE) Tee Times (I) (1,6) Low 3
40SourceIFPUGCountingManualPart2,p.7-19
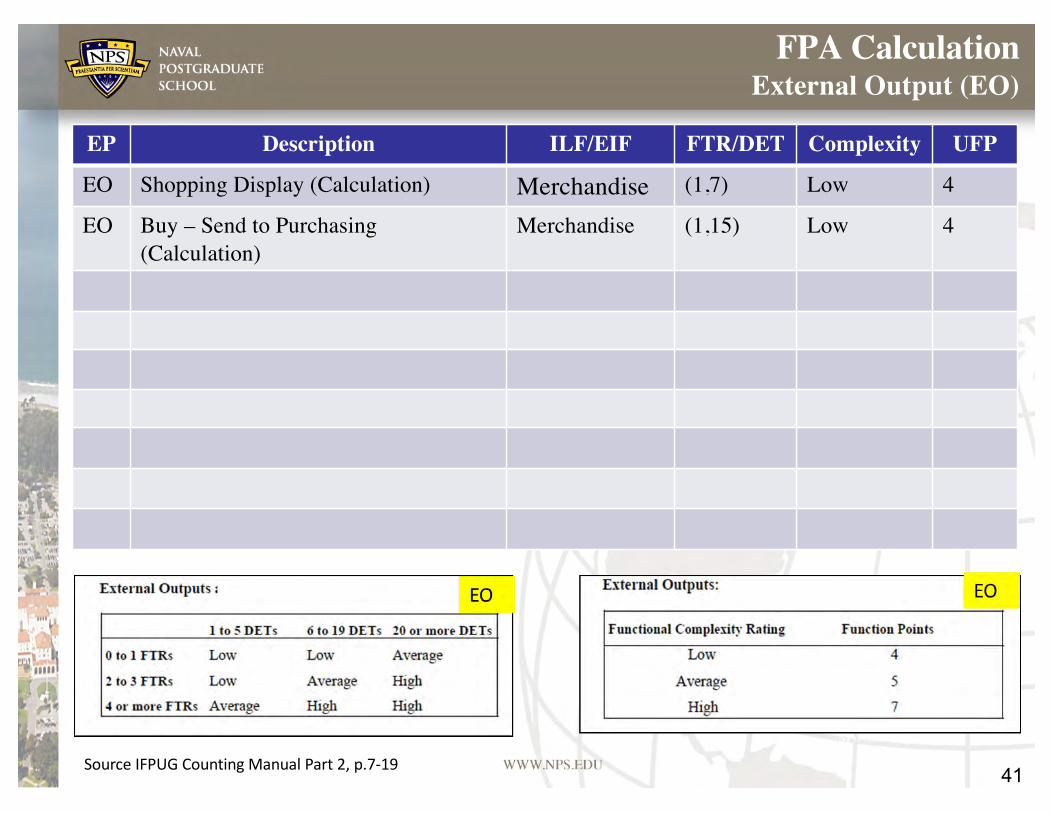
FPA Calculation External Output (EO)
EP Description ILF/EIF FTR/DET Complexity UFP
EO Shopping Display (Calculation) Merchandise (1,7) Low 4
EO Buy – Send to Purchasing (Calculation)
Merchandise (1,15) Low 4
41SourceIFPUGCountingManualPart2,p.7-19
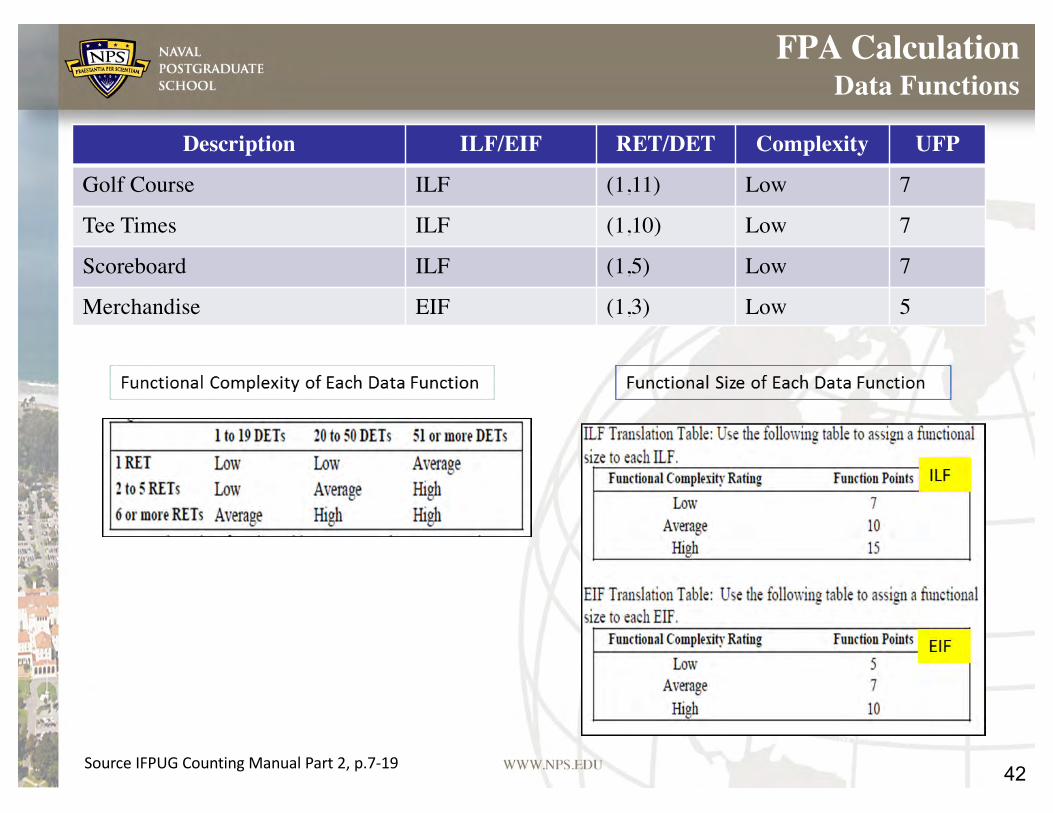
FPA Calculation Data Functions
Description ILF/EIF RET/DET Complexity UFP
Golf Course ILF (1,11) Low 7
Tee Times ILF (1,10) Low 7
Scoreboard ILF (1,5) Low 7
Merchandise EIF (1,3) Low 5
42SourceIFPUGCountingManualPart2,p.7-19
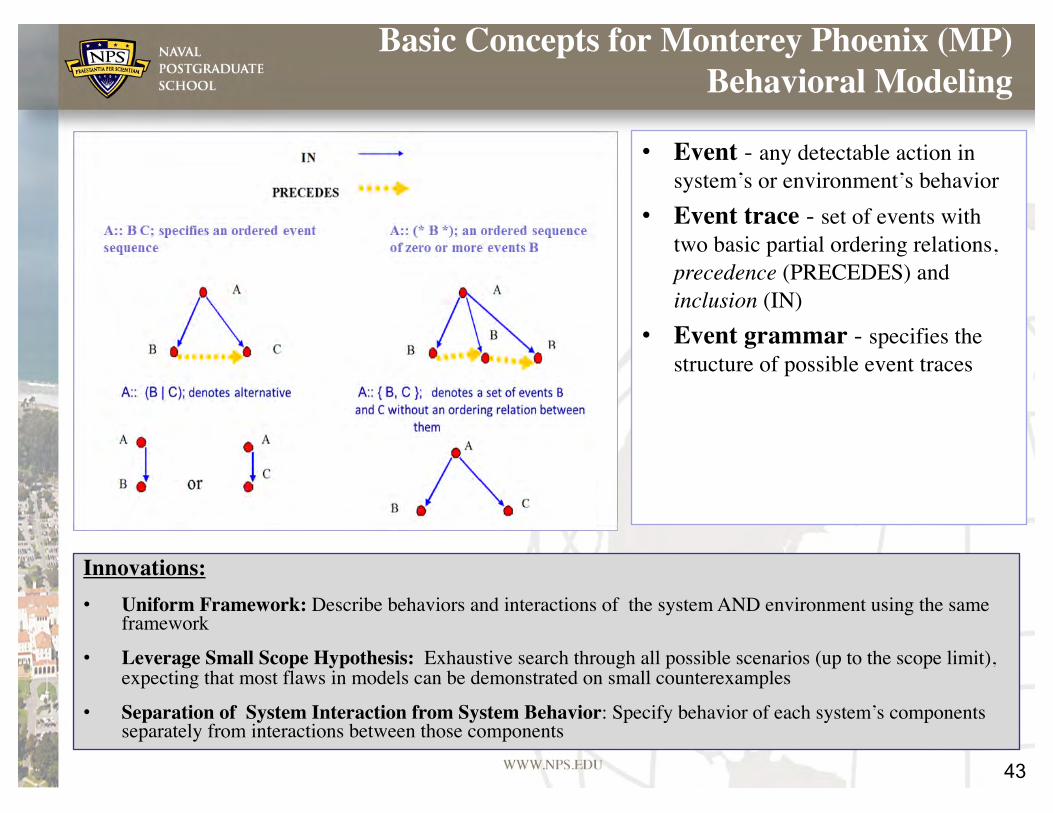
• Event - any detectable action in system’s or environment’s behavior
• Event trace - set of events with two basic partial ordering relations, precedence (PRECEDES) and inclusion (IN)
• Event grammar - specifies the structure of possible event traces
Basic Concepts for Monterey Phoenix (MP) Behavioral Modeling
43
Innovations:• Uniform Framework: Describe behaviors and interactions of the system AND environment using the same
framework
• Leverage Small Scope Hypothesis: Exhaustive search through all possible scenarios (up to the scope limit), expecting that most flaws in models can be demonstrated on small counterexamples
• Separation of System Interaction from System Behavior: Specify behavior of each system’s components separately from interactions between those components