Embed Size (px)
Citation preview

pwc.ch/reward
Executive Compensation & Corporate Governance
2012 survey examining compensation structures in SMI, SMIM and small-cap companies as well as SIX Disclosure

Disclaimer This publication has been prepared for general guidance on matters of interest only and does not constitute professional advice. You should not act upon the information contained in this publication without obtaining specific professional advice. No representation or warranty (express or implied) is given as to the accuracy or completeness of the information contained in this publication, and, to the extent permitted by law, PricewaterhouseCoopers Ltd., its members, employees and agents accept no liability and disclaim all responsibility for the consequences of you or anyone else acting, or refraining to act, in reliance on the information contained in this publication or for any decision based on it.

PwC Executive Compensation & Corporate Governance 3
Contents
1 The Survey 5
2 Executive Summary 6
3 Survey Results 83.1 Chairmen of the board of directors 83.2 Other members of the board of directors 103.3 CEOs 123.4 Structure of compensation 153.5 Wealth changes due to share ownership 183.6 Small-cap companies 20
4 Mandatory Disclosure According to SIX Exchange Regulation 224.1 Background 224.2 A scorecard for compliance with SIX Exchange Regulation rules 224.3 A view on compliance and best practice in Switzerland today 24
5 Concluding Remarks 265.1 Should executives hold more equity? 265.2 Using disclosure as an opportunity? 265.3 Swiss public vote on shareholder power 275.4 Six principles 27
Contacts 28
Appendix 29

4 Executive Compensation & Corporate Governance PwC

PwC Executive Compensation & Corporate Governance 5
1 The Survey
We are delighted to present the sixth edition of our survey “Executive Compensation & Corporate Governance”. The survey is one of the most detailed Swiss studies available on the level and structure of board and executive compensation for the years from 2007 to 2011. This report provides a comprehensive picture of executive compensation for SMI and SMIM companies in Switzerland today. We also provide a shorter summary of executive compensation in small-cap companies, and we hope you find this breadth of perspective helpful.
Following up on last year’s analysis, we also again investigate how well SMI and SMIM companies comply with the disclosure requirements of the Directive Corporate Governance. The SIX Exchange Regulation pays significant attention to these matters, and so should all listed companies. Moreover, in light of the final stretch of the debate on the “Abzocker-Initiative” the quality of information regarding compensation is of particular interest to shareholders and other stakeholders.
All data used in this survey are based on disclosed compensation information in the annual reports of the companies reviewed. We have not made any assumptions or adjustments to the disclosed values and methodologies used, in particular with regard to the variable compensation (valuation, vesting clauses, timing of disclosure and earning periods, etc.).
We trust you find the 2012 “Executive Compensation & Corpo-rate Governance” survey to be an interesting read that supports you in answering key questions and provides ideas for address-ing today’s reward challenges. As always, we welcome your feedback and hope to have the opportunity to discuss these issues with you.
Dr. Robert W. Kuipers Remo SchmidPartner PartnerHRS Reward HRS Reward

6 Executive Compensation & Corporate Governance PwC
2 Executive Summary
Building on the results from the surveys of the last four years, the 2012 issue of “Executive Compensation & Corporate Governance” examines the changes from 2007 to 2011 in total compensation for boards of directors and CEOs. The key findings are:
• In the five years under consideration, median chairman pay has increased in both SMI and SMIM companies: by 25% from CHF 1.2 million to CHF 1.5 million in SMI companies and by 35% from CHF 430,500 to CHF 580,375 in SMIM companies.
• By contrast, in the same period, median CEO pay has decreased in both SMI and SMIM companies: by 25% from CHF 7.7 million to CHF 5.8 million in SMI companies and by 13% from CHF 2.8 million to CHF 2.4 million in SMIM companies.
• The composition of CEO pay fluctuates significantly, but some broad patterns can be detected. In SMI companies, base salary has never made up more than 30% of total pay, long-term incentives (LTI) never less than 40% (and they exceed 50% in some years). In SMIM companies, by contrast, base salary has never made up less than 30% of total compen-sation, while the LTI usually accounted for less than 40% of total compensation (and falls below 30% in some years). The cash bonus and other payments are of approximately equal importance in the two samples.
• The median board member at a small-cap firm receives pay of around CHF 100,000, and this pay level has remained essentially stable in the past five years. The median CEO of a small-cap company received roughly CHF 1 million in 2011. As such, median CEO compensation in these firms has decreased by 5% from 2010 to 2011 and by around 10% from 2007, mirroring the pattern in CEO pay levels observed for SMI and SMIM companies. Small-cap CEOs tend to receive a larger portion of base pay and a smaller portion of equity-based pay than their counterparts in SMI and SMIM companies.
• Pay of small-cap CEOs is less volatile over time than pay of SMIM CEOs, which is in turn more stable than pay of SMI CEOs. On the other hand, the average CEO of an SMI company
earns twice the remuneration that the average CEO of an SMIM company earns, and the average CEO of an SMIM company receives almost twice the pay that the average small-cap CEO obtains. A similar pattern holds true for board members. Given this strong relationship between pay and firm size, we conclude that there can be substantial (implicit) incentives for executives and board members of Swiss companies driven by the fact that career advances depend on the success at the present company.
• Executives and board members felt the pain of the difficult market environment in 2011 in their equity holdings. The gains that the median CEO, chairman and board member had made in 2009 and 2010 essentially evaporated in 2011. In the SMI and SMIM sample, 50% of all CEOs (between the lower and upper quartiles) experienced wealth changes in the amount of CHF –1,000,000 to CHF –105,000. For chairmen, this range is from CHF –730,000 to CHF –90,000 for 2011. For other board members, this range amounts to CHF –230,000 to CHF –10,000 for 2011. A similar picture also emerges in the small-cap companies.
• As regards compliance with SIX Exchange Regulation rules on the disclosure of compensation, our data suggest an increase in the minimum disclosure standards. According to our scorecard, a score that put a company into the Top 10 in 2009 was barely sufficient to be in the top half of the sample in 2011. In 2011, the median disclosure score was 72%. In 2010, the median disclosure score was 63%, and in 2009, the median score was only 52%.
• While in some areas a clear market standard has been established, in others there remains large variation in the quality of disclosure and compliance with SIX regulations. An example of the former is the quantitative presentation of com-pensation levels and the discussion of benchmarks. As an example of the latter, we still detect great heterogeneity in key issues such as the clarity with which companies provide insight into how they aim for pay-for-performance. It is to be expected that the companies that are currently lagging in the adoption of a high disclosure standard in this and other respects will be pressured by shareholders and other stake-holders to make up for these deficiencies in the coming years.

PwC Executive Compensation & Corporate Governance 7PwC Executive Compensation & Corporate Governance 7
Our Survey Results 2011

8 Executive Compensation & Corporate Governance PwC
Figure 1: Total compensation of chairmen in SMI companies1)
0
2
4
6
8
10
12
14
16
HighestUpper quartileMedianLower quartileLowest
Mill
ion
CH
F
Lower quartileLowest Median HighestUpper quartile
2007 2008 2009 2010 2011
16
14
12
10
8
6
4
2
0
In this section, we analyse and comment on the level and structure of compensation for chairmen of boards of directors, other board members and CEOs. Our focus is on SMI and SMIM companies (sections 3.1 to 3.5), but we also provide a briefer summary perspective on small-cap companies (section 3.6).
3.1 Chairmen of the board of directors
As the structure of the board of directors and the related responsibilities and tasks for members of the board of directors vary, for the chairman in particular, a one-to-one comparison among the SMI and SMIM companies proved difficult. Neverthe-less, a comparison was made based on compensation data disclosed, whereby only the non-executive chairman function was considered.
3.1.1 MainfindingsIn the five years under consideration, median chairman pay has increased in both SMI and SMIM companies, from CHF 1.2 mil-lion to CHF 1.5 million or by 25% in SMI companies and from CHF 430,500 to CHF 580,375 or by 35% in SMIM companies. In these five years, we had initially seen a temporary contraction of the dispersion in pay among chairmen; however, in the past year, the dispersion of the middle two quartiles in both SMI and SMIM companies has become greater again.
3.1.2 Details on SMI companiesBoth the upper quartile (increase of 16.1% to CHF 4.3 million) as well as the lower quartile (increase of 34.6% to CHF 908,904) increased significantly from 2010 to 2011. This resulted in a higher median with an increase of 16.0% to CHF 1.5 million. In contrast to the previous years, a slight dispersion of pay (in absolute terms) seems to be taking place again. An increasing dispersion also occurred at the extremes: From 2010 to 2011, the compensation of the highest paid chairman increased by 27.4% to CHF 13.5 million whereas the compensation of the lowest paid chairman decreased by 39.4% to CHF 200,860.
3 Survey Results
1) Compensation for non-executive function (n=17)

PwC Executive Compensation & Corporate Governance 9
Figure 2: Total compensation of chairmen in SMIM companies2)
Lower quartileLowest Median HighestUpper quartile
2007 2008 2010 20112009
16
14
12
10
8
6
4
2
0 0
2
4
6
8
10
12
14
16
HighestUpper quartileMedianLower quartileLowest
Mill
ion
CH
F
3.1.3 Details on SMIM companiesIn contrast to the previous years, some compensation levels changed significantly in this group. The upper quartile increased by 32.9% to CHF 927,620 whereas the lower quartile decreased by 13.2% to CHF 326,750. The highest paid received CHF 6.6 million which represents a decrease of 11.6% from previous year. The lowest paid was CHF 0 (previous year CHF 141,000). The median slightly decreased by 3.8% to CHF 580,375, but due to substantial increases in earlier years (especially from 2007 to 2008), overall median total compensa-tion remained significantly higher than at the beginning of the sample period.
2) Compensation for non-executive function (n=22)

10 Executive Compensation & Corporate Governance PwC
3.2 Other members of the board of directors
3.2.1 MainfindingsIn 2011, the median board member of an SMI company received around CHF 320,000, approximately double the amount that the median board member of an SMIM company received (around CHF 170,000). These compensation levels of SMI and SMIM board members have been stable or slightly increasing in a relative small band for the years 2007 to 2011.
Figure 3: Total compensation of other members of the board of directors in SMI companies3)
Mill
ion
CH
F
Lower quartileLowest Median HighestUpper quartile
2007 2008 2009 2010 2011
0.0
0.2
0.4
0.6
0.8
1.0
1.5
2.0
2.5
3.0
3.5
4.0
4.5
5.0
5.5
6.0
6.5
0.0
0.2
0.4
0.6
0.8
1.0
Upper quartileMedianLower quartileLowest
3) Chairman and executive functions excluded (n=178)
3.2.2 Details on SMI companiesThe lower quartile was CHF 231,888 and the upper quartile CHF 424,063 with small changes compared to last year, i.e., an increase of 5.7% for the lower quartile and a decrease of 0.9% for the upper quartile. The median amounted to CHF 323,680 (a decrease of 1.5%). The highest paid amount has varied a lot over the years. 2011 is no exception, with a substantial decrease of this amount by 60.4% to CHF 2.4 million.

PwC Executive Compensation & Corporate Governance 11
3.2.3 Details on SMIM companiesThe lower quartile was CHF 114,451 and the upper quartile CHF 229,132, i.e., half of the SMIM board members were paid in this range for the year 2011. The changes over the years continue to be marginal; e.g., the median remained virtually unchanged from CHF 169,000 in 2007 to CHF 172,000 in 2011.
Figure 4: Total compensation of other members of the board of directors in SMIM companies4)
Mill
ion
CH
F
Lower quartileLowest Median HighestUpper quartile
2007 2008 2009 2010 2011
0.0
0.2
0.4
0.6
0.8
1.0
1.5
2.0
2.5
3.0
3.5
4.0
4.5
5.0
5.5
6.0
6.5
0.0
0.2
0.4
0.6
0.8
1.0
Upper quartileMedianLower quartileLowest
0
1
2
3
4
5
4) Chairman and executive functions excluded (n=200)

12 Executive Compensation & Corporate Governance PwC
3.3 CEOs3.3.1 MainfindingsTwo facts are particularly noteworthy. First, CEO total compen-sation has, by and large, decreased when considering the past five years in total. From 2007 to 2011, median CEO total compensation has fluctuated but has decreased overall in both SMI and SMIM companies, from CHF 7.7 million to CHF 5.8 mil-lion or by 25% in SMI companies and from CHF 2.8 million to CHF 2.4 million or by 13% in SMIM companies. A similar picture emerges when considering averages: In the SMI companies, average CEO total compensation decreased from CHF 9.3 million in 2007 to CHF 7.2 million in 2011 (–23%); in the SMIM companies, it decreased from CHF 3.8 million in 2007 to CHF 2.9 million in 2011 (–23%).
Figure 5: Total compensation of CEOs in SMI companies 5)
Mill
ion
CH
F
Lower quartileLowest Median HighestUpper quartile
24
22
20
18
16
14
12
10
8
6
4
2
0 0
2
4
6
8
10
12
14
16
18
20
22
24
HighestUpper quartileMedianLower quartileLowest2008 20102007 20112009
Second, as can also be observed from Figures 5 and 7, CEO compensation in SMI companies has been varying significantly more over time than CEO compensation in SMIM companies. The development from 2010 to 2011 exemplifies this overall picture. For both SMI and SMIM companies, median total compensation decreased from 2010 to 2011, though significantly more so in SMI companies than in SMIM companies. Further-more, for both SMI and SMIM companies the lower quartile decreased. By contrast, the upper quartile only decreased in SMI companies from 2010 to 2011, whereas it slightly increased in the SMIM companies. In the past years, average compensation remained stable (SMI) or increased slightly (SMIM).
5) In 2008 and 2010, the highest paid disclosed person in the whole sample was not a CEO. In these firms the compensation of the CEO was not disclosed and therefore could not be used in Figure 5. (n=19)

PwC Executive Compensation & Corporate Governance 13
3.3.2 Details on SMI companiesIn 2011, there were three (in 2010: five) companies in which a member of the Executive Board other than the CEO received the highest total compensation. Therefore, for the analysis and to enhance comparability, two graphs were created. The first one includes all the CEOs of the SMI companies; the second one shows all highest paid members of the Executive Board (i.e. sixteen CEOs and three other members).
Figure 6: Total compensation of the highest paid member of the executive board in SMI companies6)
Mill
ion
CH
F
Lower quartileLowest Median HighestUpper quartile
24
22
20
18
16
14
12
10
8
6
4
2
0 0
2
4
6
8
10
12
14
16
18
20
22
24
HighestUpper quartileMedianLower quartileLowest2008 20102007 20112009
6) CEO or the highest paid executive board member respectively (n=19)
Comparing 2011 to 2010, the median compensation of SMI CEOs decreased significantly by 22.1% to CHF 5.8 million. While the upper quartile increased to CHF 9.3 million (+7.3%), the lower quartile slightly decreased to CHF 5.3 million (–5.4%). The average total compensation remained virtually unchanged at CHF 7.2 million. As such, the average total compensation is still significantly below the figures of 2007 (CHF 9.3 million, –22.7%) when this survey was conducted for the first time (see also Figure 10).

14 Executive Compensation & Corporate Governance PwC
Figure 7: Total compensation of CEOs in SMIM companies7)
Mill
ion
CH
F
Lower quartileLowest Median HighestUpper quartile
2007 2008 2009 2010 2011
14
12
10
8
6
4
2
0 0
2
4
6
8
10
12
14
HighestUpper quartileMedianLower quartileLowest
3.3.3 Details on SMIM companiesAs in SMI companies, median CEO total compensation de-creased in SMIM companies in the past year, but to a smaller degree: It decreased by 5.0% to CHF 2.4 million (SMI companies –22.1%). The lower quartile decreased in 2011 by 9.3% to CHF 1.7 million. The upper quartile increased by 6.3% to CHF 3.8 million. Consequently, 50% of SMIM CEOs are paid in the range of CHF 1.7 million to CHF 3.8 million. Average total
7) CEO or highest paid executive board member respectively (n=24)
compensation remained at a similar level in 2011 as in 2010, with an increase of 6.1% to CHF 2.9 million. (This result is partially due to the increase in compensation of the highest paid CEO which rose by 22.4% to CHF 8.6 million.) However, from an overall perspective, the average total compensation has decreased over time by 23.2% from CHF 3.8 million in 2007 to CHF 2.9 million in 2011 (see also Figure 11).
PwC Executive Compensation & Corporate Governance 15
3.4 Structure of compensation As in previous years, we have analysed the structure of the average total compensation as we believe this provides impor-tant insights in addition to the analysis of the level.
Figure 8: Overview of compensation structure in SMI companies in 2011
Cash bonusFixed compensation Long-term incentives Other payments
0 20 40 60 80 100
Other payments
Long-term incentive
Cash bonus
Base salary
Other Executives
CEO
Other Membersof the Board of
Directors
Chairman 80%
87%
24%
28% 23% 39% 10%
18% 48% 10%
2% 8%3%
6% 4% 10%
Figure 9: Overview of compensation structure in SMIM companies in 2011
Cash bonusFixed compensation Long-term incentives Other payments
0 20 40 60 80 100
Other payments
Long-term incentive
Cash bonus
Base salary
Other Executives
CEO
Other Membersof the Board of
Directors
Chairman 60%
68%
32%
36% 21% 32% 11%
22% 37% 9%
10% 8%14%
23% 8% 9%
3.4.1 Comparing rolesBy and large, a similar picture emerges for SMI and SMIM companies when comparing the structure of compensation of different roles. On average, the largest part of total compensa-tion for chairmen and other board members – between 70% and 90% – comes from fixed and other compensation. By contrast, variable pay (either cash bonuses or equity-based long-term incentive plans) makes up the biggest portion – between 50% and 70% – of the total compensation package for CEOs and other executives.

16 Executive Compensation & Corporate Governance PwC
3.4.2 Comparing companies
Some interesting patterns emerge when comparing SMI and SMIM companies and when considering the development of the composition of pay over time.
First, at least in 2011, for board members of SMI companies, fixed compensation was actually a more important component (relative to total compensation) than in SMIM companies. Other board members receive 86.9% (SMI) and 68.1% (SMIM) as fixed compensation, and these numbers have remained stable in the past five years. We note that for chairmen 2011 appears unusual in that fixed compensation for the average chairman in the SMI companies increased significantly from 58.2% in 2010 to 79.8%. At the same time, the total variable compensation (cash bonus + long term incentive) dropped to 10.6% of total compensation (31.5% in 2010). In the SMIM companies, the total compensation structure for chairmen has not changed significantly over the years.
Figure 10: Structure of average total compensation of CEOs in SMI companies
Mill
ion
CH
F
Cash bonusBase salary Long-term incentives Other payments
2007
23%
23%
48%
6%
2008 2009
29%
16%
40%
15%
24%
18%
53%
5%
2010
24%
24%
41%
11%
2011
10
9
8
7
6
5
4
3
2
1
0 0
1
2
3
4
5
6
7
8
9
10
24%
18%
48%
10%
As for CEOs,8 in SMI companies, for 2011, the average total compensation was split into 24% base salary, 18% cash bonus, 48% long-term incentives, and 10% other compensation. In SMIM companies, for 2011, the average total compensation was split into 32% as base salary, 22% as cash bonus, 37% as long-term incentives, and 9% as other compensation. These numbers appear representative for the five-year sample period, even though the composition of CEO pay fluctuates significantly. In SMI companies, base salary has never made up more than 30% of total compensation and long-term incentive plans never less than 40% (and exceed 50% in some years). In SMIM companies, by contrast, base salary has never made up less than 30% of total compensation, while the LTIP usually accounted for less than 40% of total pay (and falls below 30% in some years). The cash bonus and other payments are of approximately equal importance in the two samples.
8) The comments in this section are based on the data for the CEOs (according to Figure 5) and not the highest paid member of the executive board.
PwC Executive Compensation & Corporate Governance 17
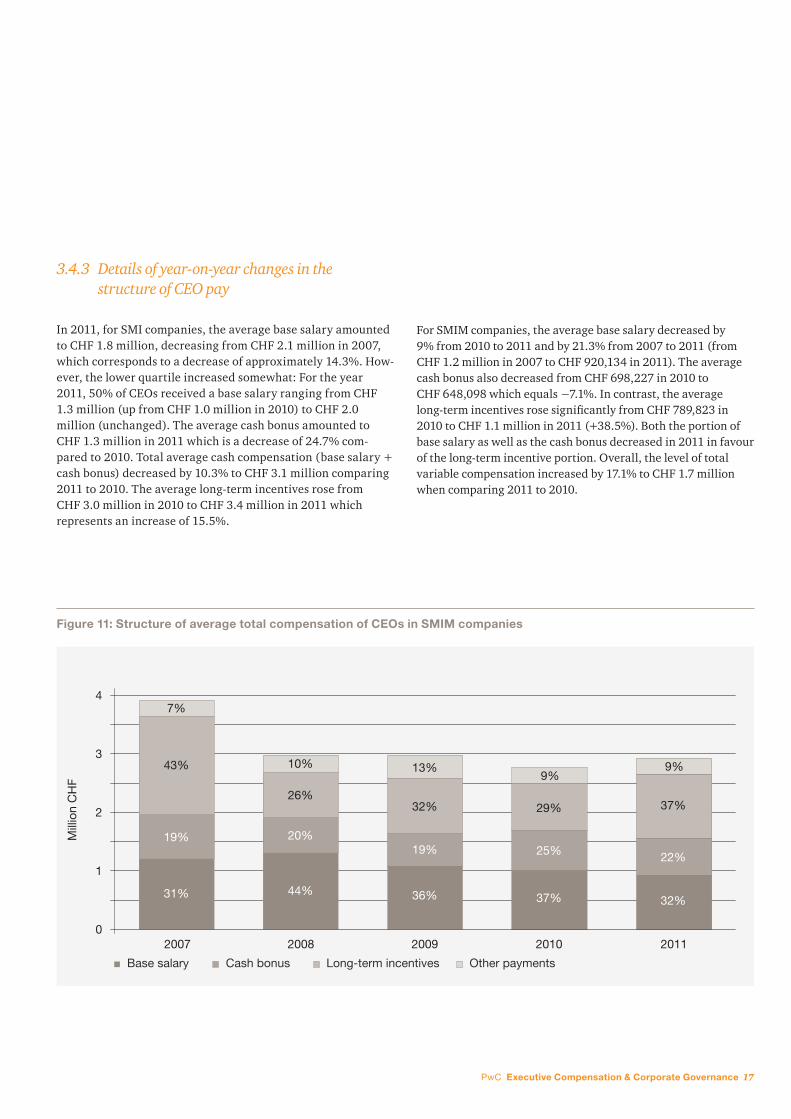
3.4.3 Details of year-on-year changes in the structure of CEO pay
In 2011, for SMI companies, the average base salary amounted to CHF 1.8 million, decreasing from CHF 2.1 million in 2007, which corresponds to a decrease of approximately 14.3%. How-ever, the lower quartile increased somewhat: For the year 2011, 50% of CEOs received a base salary ranging from CHF 1.3 million (up from CHF 1.0 million in 2010) to CHF 2.0 million (unchanged). The average cash bonus amounted to CHF 1.3 million in 2011 which is a decrease of 24.7% com-pared to 2010. Total average cash compensation (base salary + cash bonus) decreased by 10.3% to CHF 3.1 million comparing 2011 to 2010. The average long-term incentives rose from CHF 3.0 million in 2010 to CHF 3.4 million in 2011 which represents an increase of 15.5%.
Figure 11: Structure of average total compensation of CEOs in SMIM companies
Mill
ion
CH
F
Cash bonusBase salary Long-term incentives Other payments
2007
31%
19%
43%
7%
2008 2009
44%
20%
26%
10%
36%
19%
32%
13%
2010
4
3
2
1
0 0
1
2
3
4
37%
25%
29%
9%
32%
22%
37%
9%
2011
For SMIM companies, the average base salary decreased by 9% from 2010 to 2011 and by 21.3% from 2007 to 2011 (from CHF 1.2 million in 2007 to CHF 920,134 in 2011). The average cash bonus also decreased from CHF 698,227 in 2010 to CHF 648,098 which equals −7.1%. In contrast, the average long-term incentives rose significantly from CHF 789,823 in 2010 to CHF 1.1 million in 2011 (+38.5%). Both the portion of base salary as well as the cash bonus decreased in 2011 in favour of the long-term incentive portion. Overall, the level of total variable compensation increased by 17.1% to CHF 1.7 million when comparing 2011 to 2010.

18 Executive Compensation & Corporate Governance PwC
3.5 Wealth changes due to share ownership
In addition to analysing the total compensation development, it is also important to understand net wealth changes in the share ownership of board members and executives resulting from share price changes. These can be substantial in the case of volatile markets. Table 1 lists these changes and developments. The highest gains and losses relate to chairmen and other board members who have significant share holdings (in particular as founders or founding family members).
In 2008, at least 75% of CEOs, chairmen and other board members suffered net wealth losses resulting from falling share prices. In 2009, we observed the mirror image, i.e. at least 75% of the persons surveyed benefited from rising share prices. In 2010, an intermediate result occurred. The median CHF wealth change due to ownership was around zero or slightly positive for all three groups.
Table 1: CEO and board of director wealth changes in SMI and SMIM companies in the years 2008, 2009, 2010, and 2011 due to ownership9)
2008 Highest gain Top 25%(upper quartile)
Median Bottom 25%(lower quartile)
Greatest loss
CEOs +230,000 –240,000 –900,000 –2,000,000 –220,000,000
Chairmen +6,340,000 –300,000 –1,000,000 –35,600,000 –2,745,000,000
Other Members of the Board of Directors
+42,830,000 –60,000 –200,000 –670,000 –3,015,000,000
9) All amounts in CHF and rounded. Wealth changes in 2008 are calculated as the difference between the wealth due to the average of the reported stockholdings on 31 December 2007 and those on 31 December 2008, valued on 31 December 2008, minus the value of these average shareholdings on 31 December 2007. For wealth changes in 2009, 2010 and 2011, the same methodology is applied. All shares (not only vested shares) are considered. Companies that do not report shareholdings for the respective category of individuals are not considered in this table. Significant changes in wealth can also arise in these calculations, independent of developments in the share price, when an individual acquires or sells shares. Outside (non-equity) wealth is not observable.
2009 Highest gain Top 25%(upper quartile)
Median Bottom 25%(lower quartile)
Greatest loss
CEOs +10,300,000 +980,000 +480,000 +60,000 –35,400,000
Chairmen +2,170,000,000 +3,100,000 +240,000 +10,000 –30,000,000
Other Members of the Board of Directors
+1,440,000,000 +240,000 +50’000 +7,000 –318,000,000
2010 Highest gain Top 25%(upper quartile)
Median Bottom 25%(lower quartile)
Greatest loss
CEOs +11,600,000 +975,000 +230,000 –10,000 –21,100,000
Chairmen +1,899,000,000 +410,000 +80,000 –110,000 –32,000,000
Other Members of the Board of Directors
+290,000,000 +110,000 +/–0 –30,000 –590,000,000
2011 Highest gain Top 25%(upper quartile)
Median Bottom 25%(lower quartile)
Greatest loss
CEOs +5,600,000 –105,000 –400,000 –1,000,000 –99,300,000
Chairmen +4,400,000 –90,000 –330,000 –730,000 –9,300,000
Other Members of the Board of Directors
+44,400,000 –10,000 –70,000 –230,000 –1,570,000,000

PwC Executive Compensation & Corporate Governance 19
The difficult market environment in 2011 led to broad losses throughout, and so the gains the median CEO, chairman and board member had made in 2009 and 2010 essentially evapo-rated in 2011. The wealth changes of the middle half of CEOs, chairmen, and other board members are in a relatively narrow range around the median. 50% of all CEOs (between lower and upper quartile) experienced wealth changes in the amount of CHF –1,000,000 to CHF –105,000. For chairmen, this range is from CHF –730,000 to CHF –90,000 for 2011. For other board members, this range amounts to CHF –230,000 to CHF –10,000 for 2011.
While in 2010, the distribution of wealth changes was relatively symmetric – with the average wealth change approximating the median – in 2011, this distribution was again highly skewed (as had been the case in 2008 and 2009). For example, in 2011, the average CEO lost CHF 3.8 million while the median lost “only” CHF 400,000. This applies similarly for chairmen and other board members.
CEOs of SMI companies hold a smaller proportion of total equity capital than CEOs in SMIM companies. For example, the median CEO equity ownership in SMI companies is 0.01 percent, while it corresponds to 0.03 percent in SMIM firms. This means that a CHF 1,000 change in shareholder wealth in a given year corresponds to a CHF 0.10 and a CHF 0.30 CEO wealth change, respectively. In the SMI and SMIM firms, the median CEO holds roughly CHF 2.8 million in equity, which is around two times the annual base salary. Although these numbers are arguably small, we also observe a general increase in the equity participa-tion rate. Notably, the proportion of CEOs that do not hold any shares has dropped in the past five years. (More detailed analysis, also by company size bracket, is available on request.) Moreover, the percentage wealth change, defined as the wealth change of a disclosed person expressed as a percentage of the wealth he holds in shares of his company, can be substantial also in Switzerland: the median percentage wealth change of CEOs was –14.5%. For other board members, this number was –13.5%, for chairmen it was –12.5%.
All the numbers reported in this section do not reflect implied ownership through options or other instruments similar to equity. They are merely based on what companies report to be the direct alignment of their CEOs with shareholders through the ownership of shares.

20 Executive Compensation & Corporate Governance PwC
3.6 Small-cap companiesThis year, for the first time, we have also examined compensa-tion of executives and board members in a wider sample. In particular, we also consider those companies that ranked 51st to 100th in terms of equity market capitalisation at the end of the year 2007.10 In the following, we refer to this group as “small-cap” companies.
Naturally, this large sample provides a wealth of data. For space reasons, we highlight some salient, general facts. More detailed evaluations, geared to the interests of the reader, are available on request.
The median board member at a small-cap company receives pay of around CHF 100,000, and this pay level has remained essentially stable in the past five years. The median CEO of a small-cap company received CHF 1.1 million in 2011. As such, median CEO pay has decreased by 5% from 2010 to 2011 and by around 10% from 2007, mirroring the pattern in CEO pay levels observed for SMI and SMIM companies. The range of the middle 50% of small-cap CEO total compensation remained relatively stable between around CHF 900,000 and CHF 2.0 million. To put this in perspective, this corresponds approximately to the range of the middle 50% of base salary for SMI CEOs.
Figure 12: Total compensation of CEOs in small-cap companies
There are some additional interesting patterns regarding company size. First, total compensation of small-cap CEOs is less volatile over time than pay of SMIM CEOs (which is, as we have seen earlier, more stable than pay of SMI CEOs). Second, the average CEO of an SMI company earns twice the total compen-sation that the CEO of an average SMIM company earns. And the CEO of an SMIM company receives almost twice the total compensation that a small-cap CEO obtains. Similarly, a typical board member can almost quadruple his average total compen-sation by moving from a small-cap company to an SMI company.
Given this strong relationship between pay and firm size, and given the powerful empirical relationship between management performance and career advances, we conclude that there can be substantial implicit incentives through career concerns for executives and board members of Swiss companies. That is, these individuals are motivated not only by the incentive system in place in their current job, but they also arguably take into account that good performance now opens up better career opportunities – in particular, the opportunity to manage a larger, higher-paying firm – in the future. Conversely, they are aware that poor performance is likely to result in fewer such opportunities in the future; indeed, poor managers may find themselves slipping down a notch or two in the size of the
Mill
ion
CH
F
Lower quartileLowest Median HighestUpper quartile
2007 2008 2009 2010 20110
1
2
3
4
5
6
7
8
9
HighestUpper quartileMedianLower quartileLowest0
1
2
3
4
5
6
7
8
9
10) The data was collected by Reichenecker and Wagner (2012), “Executive Compensation and Disclosure of Compensation in Switzerland”, This University of Zurich working paper is available from www.pwc.ch/reward or on request.

PwC Executive Compensation & Corporate Governance 21
companies they lead, which implies lower pay. When added up over the duration of a career, these forward-looking incentives can be substantial.
Rewards in the form of equity participation are of relatively minor importance for CEOs in small-cap firms. On average just 20% of total compensation of small-cap firm CEOs are equity-based. For CEOs in small-cap firms, the portion of base salary in total compensation has, perhaps surprisingly, increased from around 30% in 2007 to around 40% in 2011.
Finally, we have also analysed the wealth changes due to share ownership of executives and board members in small-cap firms. CEO participation in small-cap firms is more wide-spread and reaches higher total levels in terms of fractions of ownership than in the SMI and SMIM firms. However, naturally, in terms of monetary wealth, CEOs of SMI companies hold on average more than three times the amount of wealth in firm’s equity than CEOs of SMIM and small-cap companies.
Figure 13: Total compensation of other members of the board of directors in small-cap companies
Table 2 shows that, over the years, the median small-cap executives and board members have experienced much the same fluctuations as their colleagues in the larger firms. For example, while 2009 and 2010 were “good years”, the median CEO has lost on the order of CHF 340,000 in wealth over the whole sample period.
Mill
ion
CH
F
Lower quartileLowest Median HighestUpper quartile
2007 2008 2009 2010 20110.0
0.2
0.4
0.6
0.8
1.0
1.2
1.4
1.6
HighestUpper quartileMedianLower quartileLowest
0.2
0.4
0.6
0.8
1.0
1.2
1.4
1.6
0
CEOs Chairmen Other members of board of directors
2008 –320,000 –240,000 –40,000
2009 +70,000 +70,000 +10,000
2010 +110,000 +100,000 +15,000
2011 –200,000 –60,000 –20,000
Table 2: Median CEO and board of director wealth changes in small-cap companies in the years 2008, 2009, 2010, and 2011 due to ownership11)
11) For details on the calculation, see footnote 9.

22 Executive Compensation & Corporate Governance PwC
4 Mandatory Disclosure According to SIX Exchange Regulation
4.1 BackgroundCompensation disclosure is one of the key topics of today’s challenging environment for companies. For Swiss listed companies, besides the rules in the Code of Obligations that mainly concern the disclosure of levels of compensation, several new requirements are in place that also concern the process and other substantive issues in management compensation. In particular, the Directive on Information relating to Corporate Governance of the SIX Swiss Exchange requires issuers to disclose important information on their board and executives (or to give substantial reasons why this information is not disclosed).
In its circular 2/2012, the SIX Exchange Regulation reiterated that in its review of yearly reports 2012 and future years it will pay particular attention to whether the Directive on Information relating to Corporate Governance (DCG) is being observed properly, especially with respect to compensation matters. The Directive Corporate Governance itself is not particularly detailed, and there are several additional relevant documents. First, the Commentary to the Directive provides several more detailed points. Second, in various documents the SIX provided some additional guidance on particular aspects of disclosure. Third, additional information can be read out of the published decisions of the SIX sanctions commission.12
4.2 A scorecard for compliance with SIX Exchange Regula-tion rules
To support listed companies in ascertaining what level of quality they have obtained in their compensation disclosure efforts and to develop a view on overall compliance and best practice in Switzerland today, in 2011 we developed and have since been continually updating a rating system that aims at capturing the rules that companies currently need to comply with as far as the SIX Exchange Regulation is concerned. We emphasise that the resulting scorecard is PricewaterhouseCoopers’ reading of the SIX Exchange Regulation’s rules. It is not an official rating and was developed without any involvement of SIX Exchange Regulation. Nonetheless, we believe the scorecard accurately and comprehensively reflects the rules that are in place today and as such provides a useful tool to evaluate company reports.13
The general guiding principle that companies need to follow is that the principles and elements of compensation (the design and determining mechanisms, as well as details of any share-holding programme and how it works) must be explained to investors in terms that are as comprehensible as possible. From this general principle follow several more specific requirements, which we have chosen to summarise under three headings. Topic A covers requirements regarding the process of how pay is set. Topic B relates to requirements regarding the substance of the compensation system. Topic C concerns requirements regarding the calculation of payments and other requirements. Our detailed scorecard covers a total of 24 criteria: 7 for Topic A, 11 for Topic B, and 6 for Topic C.
For the purpose of this survey, Table 3 highlights the main issues within each topic group that we perceive to play a role as companies prepare for the 2012/13 reporting season. The full scorecard is available upon request.
12) Our analysis in this survey is based on guidance published as of July 31, 2012.
13) The Directive Corporate Governance covers other aspects of disclosure not related to compensation; these are not part of this scorecard. The other statutory requirements that exist regarding compensation matters (in particular, disclosure requirements according to OR 663b bis) are also not part of this review, although there is of course some overlap.

PwC Executive Compensation & Corporate Governance 23
Table 3: Key compliance issues with regards to SIX Exchange Regulation rules on compensation disclosure.
Headings/Topics Main challenges in practical implementation, developments in 2011, and challenges for 2012/13
A: Requirements regarding the process of how pay is set (7 criteria)
The key points of the process used to determine compensation and participation in the shareholding programme must be described. This includes, but is not limited to, issues such as competencies of various bodies, who has a vote in a relevant meeting, whether external advisors are consulted, and whether part of the compensation is given on a discretionary basis.
We had seen a significant improvement from 2009 to 2010 reports in this dimension. From 2010 to 2011, the situation remained largely stable. Many, though not all companies have achieved a high level of clarity regarding the process of pay-setting. Occasionally, the difference between formula-based and discretionary bonuses is perhaps not as clear as it could be.
B: Requirements regarding the substance of the compensation system (11 criteria)
Companies have to describe which goals are taken into account when structuring compensation and share-ownership pro-grammes, and how strongly individual goals and other compo-nents are taken into account. Non-GAAP measures need to be explained. Moreover, companies are required to disclose whether benchmarks or salary comparisons have been used; if so, the benchmarks and salary comparisons selected must be disclosed (sector/function, etc.) and the choice of benchmarks and reference salaries must be explained as transparently as possible. Furthermore, the composition of pay needs to be detailed in various ways, using easy-to-understand quantitative analysis, and share and option plans need to be explained exactly.
Great progress has recently been made by several companies in this dimension, clarifying, for example, the explanation of the use of benchmarks. Generally speaking, the explanation of the substance of compensation systems has significantly improved in the past three years, although stakeholders still do not always obtain a clear picture of how value-generation is measured and rewarded in a company. Thus, significant heterogeneity continues to exist between companies in the extents to which individual goals relevant in variable pay plans are disclosed, and the extents to which a link between the attainment of goals and the change in pay from one year to the next is established. We note that the market standard for disclosure has been raised significantly by the decision of several companies to provide more insight into how they aim for pay-for-performance.
C: Requirements regarding the calculation of payments and other requirements (6 criteria)
This final topic covers the explanation of in-kind payments, special payments, especially those made upon leaving the company, and related topics.
As “other pay” tends to become more important, shareholders and the SIX are likely to take increased interest in the descrip-tion of such additional payments or benefits. We also emphasise that SIX requires disclosure of severance agreements, i.e., of all payments that would occur if an executive or a board member leaves. Companies have enhanced their disclosure in this respect in 2011, but more improvements are possible.

24 Executive Compensation & Corporate Governance PwC
4.3 A view on compliance and best practice in Switzer-land today
Based on our experience, we list some of the main challenges in practical implementation we observed in the right column of Table 3 above. Moreover, using the full scorecard, we have evaluated the annual reports of all the 48 SMI and SMIM companies that are part of our executive compensation survey in the first part of this report.14
To interpret the results, it is important to recognise some features of this analysis. We have applied this scorecard approach in the most diligent manner possible, but the proce-dure is clearly subjective. Different rating systems will yield different results. Moreover, it is possible that violations of some criteria may be regarded as more severe by the SIX sanctions commission than others. We refrained from applying such “value-weighting”. We also note that it is possible that material information was omitted in a report that is not available to an external reader, and so even an apparently transparent report
may be ultimately misleading. Scores between years can in principle be compared, but with care. First, new points of emphasis have become apparent through new sanctions. Second, some interpretations have changed over time. The comparison of a large sample of reports can suggest an upward or downward adjustment of the expectations that are reasonable concerning a particular criterion. Therefore, there are rare instances where the score on a particular criterion in 2011 varies from that in 2010 even though the statement in the annual report was not altered. We have made no ex-post adjustments to scores in previous years.
Figure 14 shows the ten companies with the highest disclosure score in 2011, with the scores for all three years under consid-eration. In our view, the reports of these companies in many ways represent what can be regarded as best practice in the Swiss market today. We also note that the competition for the top ranks is intense. The following companies reached scores in the ranks 11-20 in 2011 (in alphabetical order), with scores between 76% and 81%: ABB, Aryzta, Baloise, Credit Suisse, Roche, SGS, Swisscom, Swiss Life, Swiss Re, and Transocean.
Based on our analysis of the data, we make two observations, one regarding the development over time and one regarding the cross-section of companies.
14) In particular, on each of the 24 criteria, companies were rated with a grade of 0, 1, or 2. First, we determined whether a given criterion is addressed at all in a report. If it was addressed, a score of 2 was given if an issuer fully and understandably covered the issue or used the “explain” clause, i.e., did not disclose the issue, but explained why it did so. A score of 1 was given if the criterion was partially addressed. A score of 0 was given if the issuer used too general explanations or incompre-hensible prose. If a criterion was not mentioned at all, for those cases which clearly were relevant for a company, we assigned a score of 0 due to the apparent violation of disclosure requirements. However, for some criteria it was possible that they did not apply to a given company (for example, when no “special rules” exist for some managers, they cannot be disclosed), and in this case we did not take this criterion into account for calculation of the total number of reachable points for this company. The total compliance score for a company per year was then calculated as the ratio of the total number of points to the total number of reachable points.

PwC Executive Compensation & Corporate Governance 25
2010 20112009
0%
10%
20%
30%
40%
50%
60%
70%
80%
90%
100% 2011*
2010*
2009*
LogitechSulzerNovartisSikaHolcimUBSLonzaSyngentaZurichAdecco
Figure 14: Degree of compliance with SIX Exchange Regulation compensation disclosure rules Top 10 companies 2011, out of the SMI and SMIM sample (based on a scorecard developed by PwC)
• Compliance with SIX rules has substantially increased again from 2010 to 2011. In 2011, the median disclosure score was 72%. In 2010, the median disclosure score was 63%, and in 2009, the median score had only been 52%. Especially the group of companies that exhibited the lowest compliance in 2009 revealed the largest improvements. Naturally, annual improvements decrease the higher the initially achieved score. We interpret the ongoing increase of the median score as evidence of a general establishment of minimum disclo-sure standards. A score that put a company into the Top 10 in 2009 was barely sufficient to be in the top half of the sample in 2011.
• While in some areas a clear market standard has been established, in others there remains large variation in the quality of disclosure and compliance with SIX regulations. On the one hand, nowadays several points are part of standard disclosure procedures in most (though not all) companies. This concerns in particular an understandable quantitative presentation of compensation levels, but it also concerns illuminating descriptions of how pay is set. For example, while in 2010 there was great variation in the quality of disclosure of benchmarks, many companies have upgraded their disclosure in this respect significantly. On the other hand, we still detect great heterogeneity in key topics such as the clarity with which companies provide insight into how they aim for pay-for-performance.

26 Executive Compensation & Corporate Governance PwC
5 Concluding Remarks
5.1 Should executives hold more equity?
A one to one alignment of interests with shareholders results from board members and executives holding shares in their company. Based on the data analysed, they felt the same pain as the shareholders in the difficult market environment in 2011 through losses on their equity holdings. A number of companies have introduced so-called shareholding guidelines. Under these guidelines, executives must build up and hold a certain share-holding quota, e.g., a multiple of their base salary or through so-called net retention rates, i.e., executives are expected to hold on to a certain percentage of shares allocated (net after tax).
Based on our experience, shareholding guidelines are prevalent in countries such as the U.S. Indeed, we note that generally equity wealth holdings are much higher for U.S. executives than for executives in Switzerland. The median CEO of the largest 1,500 U.S. companies owns around 0.72 per cent of the firm’s market value. This corresponds to USD 7.5 million and around 11 times the annual base salary.
The importance of such shareholding guidelines has been increasing recently also in Switzerland. In the future, we expect equity holdings of board members, senior executives and other executives to become more important, continuing a trend towards more ownership (skin in the game). We see this trend as a positive development towards better alignment with long-term shareholder interests; however, risks of too strong alignment need to be addressed. Companies should carefully monitor these trends and consider the role of shareholdings in the total reward system that they have in place.
5.2 Using disclosure as an op-portunity?
Compliance with mandatory disclosure is a critical reputational issue for companies today. As such, companies are forced to think hard about how to describe their compensation systems in ways that fulfil the disclosure and transparency requirements. We suggest that management also sees the opportunities in these requirements, not only the costs. In particular, successful disclosure will require the board and executives to understand explicitly where and how value is generated in a company, and how value generation is rewarded. Modern compensation systems reward either outcomes (in the traditional pay-for-per-formance sense) or the achievement of strategic goals. In particular when the second approach is employed – as is the case in many companies, at least in a supplementary fashion – it becomes critical to explain to stakeholders why and how the chosen metrics are related to overall firm value. From our experience, this is not always easy as compensation systems have grown organically over time, without an explicit, guiding plan. We recommend that companies think carefully about their overall compensation policy and how it matches with their business strategy.

PwC Executive Compensation & Corporate Governance 27
5.3 Swiss public vote on share-holder power
The call for more shareholder power is loud and clear: in the majority of the 48 SMI and SMIM companies in Switzerland, shareholders have already had a non-binding consultative vote on the compensation report in recent years. All reports voted on were approved.
In March 2013, the Swiss public will vote on the “Abzocker-Initi-ative” (also known as the “Minder-Initiative”) and the corre-sponding counterproposal.
The Abzocker-Initiative was designed to strengthen shareholder rights and curb excessive pay practice in publicly listed compa-nies in Switzerland. The initiative contains constitutional amendments, including a number of prescriptions, prohibitions and sanctions. Significantly, the initiative:• seeks to introduce an annual and binding “say-on-pay”,
requiring shareholders to approve total compensation of the board of directors, advisory board and the executive board. In addition, shareholders would elect annually each member of the board of directors and compensation committee;
• prohibits sign-on bonuses, transactional bonuses and severance pay or holding additional contracts with another company in the group;
• rules that each member of the board of directors and the chairpersons should by elected annually at the general meeting and that shareholders should elect members of the compensation committee.
If a majority of the electorate votes in favour of the initiative, its constitutional amendments would come into force. If the public rejects it, the indirect counterproposal would take immediate effect.
The counterproposal is an alternative way of bolstering share-holder say-on-pay. It is widely regarded as based on the initia-tive, but allowing for some flexibility.
Some of the key provisions are as follows:• Like the initiative, the counterproposal contains a say-on-pay
element giving shareholders binding authority to approve the compensation of the board of directors and advisory board. However, there is an option for shareholders to have a binding or advisory vote on total compensation of the executive board.
• Although there are general prohibitions on sign-on bonuses, transactional bonuses and severance pay, the counter-propos-al allows for situations in which shareholders may agree to exceptions in limited circumstances.
• Each member of the board of directors is elected annually unless the articles of association allow for a longer tenure (up to three years). Furthermore, the articles may stipulate that the chairperson as well as the compensation committee members should be appointed by the board of directors.
The counterproposal also contains specific compensation disclosure requirements. If adopted, these would be additional to the existing compensation disclosure requirements under the “Swiss Code of Obligations” and the Swiss Stock Exchange Corporate Governance Directive (SIX).
Depending on the outcome of the vote, the impact for Swiss companies may be significant. We recommend that companies get prepared for the potential changes.
5.4 Six principles
Despite – or because of – the market fluctuations we have seen over the past years and the many new regulatory challenges companies face, we continue recommending that executive compensation be designed with six simple principles in mind.
1. Only a strong board can implement an effective total compensation system.
2. The incentive system must be designed as a “best fit” with company strategy – and it needs to be communicated as such.
3. Compensation should be linked to a few key performance indicators (KPIs), but not exclusively to easily controllable factors.
4. Limits to pay are counter-productive.5. An effective compensation system establishes entrepreneuri-
al incentives.6. An effective compensation system focuses on value created
for the long term.

28 Executive Compensation & Corporate Governance PwC
PwCHuman Resource Services
For further information about this survey or our services in the field of compensation planning for executives and applicable governance, disclosure and accounting requirements, please contact:
Dr. Robert W. KuipersPartner, HRS RewardPricewaterhouseCoopersPhone: +41 58 792 45 30Email: [email protected]
Remo SchmidPartner, HRS RewardPricewaterhouseCoopersPhone: +41 58 792 46 08Email: [email protected]
Other recent PwC publications on the subject of Executive Compensation & Disclosure:
• Making executive pay work – The psychology of incentives, 2012• The psychology of incentives: If executive pay is broken, making it more complex is not the answer, 2011• Global Equity Incentives Survey 2011
www.pwc.ch/reward
If you would like further copies of this survey or of the above publications, please contact:
Heidi FässlerHuman Resource ServicesPricewaterhouseCoopersBirchstrasse 1608050 ZurichSwitzerland
Phone: +41 58 792 45 31Email: [email protected]
* Alexander F. Wagner thanks Michael Reichenecker for research assistance.
Prof. Alexander F. Wagner, PhD*Independent Counsel, HRS RewardSwiss Finance Institute, University of ZurichPhone: +41 44 634 39 63Email: [email protected]

PwC Executive Compensation & Corporate Governance 29
AppendixCompanies surveyed (in alphabetical order)
SMICompany Name 2007 2008 2009 2010 2011ABB • • • • •Actelion • • • •Adecco • • • • •Baloise • • Clariant • Credit Suisse • • • • •Givaudan •Holcim • • • • •Julius Bär • • • • •Lonza • • Nestlé • • • • •Nobel Biocare • • Novartis • • • • •Richemont • • • • •Roche • • • • •SGS • • •Swatch • • • • •Swiss Life • • • Swiss Re • • • • •Swisscom • • • • •Syngenta • • • • •Synthes 15 • • • • Transocean • •UBS • • • • •Zurich • • • • •SMIMAryzta • • •Baloise • • •Barry Callebaut • • •Basilea • • •Ciba • •Clariant • • • •Dufry •EFG International • • •Fischer • • • • •Galenica • • • • •GAM • • •Geberit • • • • •Givaudan • • • •Helvetia • • • • •Kühne & Nagel • • • • •Lindt • • • • •Logitech • • • • •Lonza • • •Meyer Burger • •Nobel Biocare • • •OC Oerlikon • • • •Panalpina • • • •Pargesa • • • • •Partners Group •Petroplus • • • •PSP • • • • •Rieter • •Schindler • • • • •SGS • •Sika • • • • •Sonova • • • • •Straumann • • • • •Sulzer • • • • •Swiss Life • •Swiss Prime Site • •Temenos • • • • •Valiant • • • • •
Small-capCompany Name 2007 2008 2009 2010 2011Acino • • • • •Allreal • • • • •Arbonia • • • • •Arpida • • Arpida / Evola Holding • • •austriamicrosystems • • • • •Bank Sarasin • • • • •Banque Cantonale Vaudoise • • • • •Barry Callebaut • Basellandschaftliche Kantonalbank • • • • •Basler Kantonalbank • • • • •Belimo • • • • •Bellevue Group • • • • •Berner Kantonalbank • • • • •BKW FMB ENERGIE • • • • •Bobst Group • • • • •Bucher • • • • •Burckhardt • • • • •Charles Vögele • • • • •Cytos Biotech • • • • •Dufry • • • • Ems-Chemie • • • • Flughafen Zürich • • • • •Forbo • • • • •Gurit • • • • •Huber+Suhner • • • • •Implenia • • • • •Jelmoli • • Kaba • • • • •Komax • • • • •Kudelski • • • • •Kuoni • • • • •Liechtensteinische Landesbank • • • • •Luzerner Kantonalbank • • • • •Meyer Burger • • • Micronas • • • • •Mobimo • • • • •Orascom • • • •Partners Group • • • • Publigroupe • • • • •Quadrant • • Romande Energie • • • • •Schmolz + Bickenbach • • • • •Schulthess • • • • St. Galler Kantonalbank • • • • •Swiss Prime Site • • • Tecan • • • • •Valora • • • • •Von Roll • • • • •Vontobel • • • • •VPBK • • • • •
15) Synthes was exempted from publishing an annual report in 2012 due to delisting in June 2012 in connection with a merger.

© 2012 PwC. All rights reserved. “PwC” refers to PricewaterhouseCoopers AG, which is a member firm of PricewaterhouseCoopers International Limited, each member firm of which is a separate legal entity.
Chairman SMI SMI Changes SMIM SMIM Changes Small-caps Small-caps Changes
2007 2008 2009 2010 2011 10/11 07/11 2007 2008 2009 2010 2011 10/11 07/11 2007 2008 2009 2010 2011 10/11 07/11
Upper Quartile 2,568,379 2,388,785 3,070,609 3,734,814 4,334,881 16.07 % 68.78 % 906,043 932,560 751,464 697,994 927,620 32.90 % 2.38 % 469,000 418,000 400,000 400,000 415,116 3.78 % –11.49 %
Median 1,200,000 844,723 1,330,867 1,288,694 1,494,568 15.98 % 24.55 % 430,500 581,876 560,591 603,100 580,375 –3.77 % 34.81 % 274,318 238,973 235,000 258,000 298,050 15.52 % 8.65 %
Lower Quartile 520,869 397,564 670,599 675,175 908,904 34.62 % 74.50 % 278,750 261,000 305,640 376,250 326,750 –13.16 % 17.22 % 111,802 114,000 144,000 163,000 170,000 4.29 % 52.06 %
Highest 14,624,000 15,228,951 15,116,196 10,599,302 13,500,946 27.38 % –7.68 % 10,625,656 7,418,000 7,418,000 7,418,000 6,557,000 –11.61 % –38.29 % 2,924,700 2,500,000 1,991,300 1,665,367 2,124,972 27.60 % –27.34 %
Average 2,328,611 2,424,636 2,954,167 2,851,841 3,136,624 9.99 % 34.70 % 1,231,812 906,415 862,602 930,107 939,854 1.05 % –23.70 % 438,010 347,887 385,114 370,531 402,072 8.51 % –8.20 %
Lowest 0 0 256,570 331,275 200,860 –39.37 % n/a 0 0 144,000 141,000 0 –100.00 % n/a 0 0 0 0 0 n/a n/a
Board of Directors
SMI SMI Changes SMIM SMIM Changes Small-caps Small-caps Changes
2007 2008 2009 2010 2011 10/11 07/11 2007 2008 2009 2010 2011 10/11 07/11 2007 2008 2009 2010 2011 10/11 07/11
Upper Quartile 400,000 375,053 400,034 427,975 424,063 –0.91 % 6.02 % 221,000 218,217 223,975 231,823 229,132 –1.16 % 3.68 % 141,640 138,506 133,000 148,000 156,884 6.00 % 10.76 %
Median 296,030 279,869 317,407 328,694 323,680 –1.53 % 9.34 % 169,000 154,500 158,423 172,555 172,000 –0.32 % 1.78 % 103,000 96,233 89,000 100,462 106,000 5.51 % 2.91 %
Lower Quartile 176,265 170,000 192,799 219,440 231,888 5.67 % 31.56 % 105,919 106,250 105,050 117,000 114,451 –2.18 % 8.05 % 60,000 58,750 56,460 63,597 65,000 2.21 % 8.33 %
Highest 5,027,381 2,901,796 5,274,667 6,034,881 2,390,000 –60.40 % –52.46 % 3,255,621 4,107,000 4,107,000 4,107,000 4,107,000 0.00 % 26.15 % 1,369,487 606,810 600,000 356,000 501,671 40.92 % –63.37 %
Average 377,953 363,552 400,572 415,027 376,890 –9.19 % –0.28 % 248,103 239,510 230,052 235,286 253,844 7.89 % 2.31 % 117,093 108,106 100,393 108,214 111,323 2.87 % –4.93 %
Lowest 0 0 0 0 0 n/a n/a 0 0 0 0 0 n/a n/a 0 0 0 0 0 n/a n/a
CEO SMI SMI Changes SMIM SMIM Changes Small-caps Small-caps Changes
2007 2008 2009 2010 2011 10/11 07/11 2007 2008 2009 2010 2011 10/11 07/11 2007 2008 2009 2010 2011 10/11 07/11
Upper Quartile 12,618,250 8,185,720 12,518,763 8,687,749 9,322,764 7.31 % –26.12 % 4,058,039 3,469,390 3,664,328 3,547,000 3,770,986 6.31 % –7.07 % 2,186,020 1,659,889 1,769,000 1,730,815 2,076,000 19.94 % –5.03 %
Median 7,727,944 5,351,799 5,861,461 7,473,618 5,820,000 –22.13 % –24.69 % 2,750,174 2,520,853 2,178,500 2,515,000 2,388,487 –5.03 % –13.15 % 1,208,000 1,115,448 1,127,108 1,140,200 1,084,200 –4.91 % –10.25 %
Lower Quartile 4,792,787 3,770,484 3,935,927 5,615,828 5,315,541 –5.35 % 10.91 % 1,788,900 1,581,127 1,383,553 1,853,605 1,680,750 –9.33 % –6.05 % 922,466 785,500 723,000 881,000 915,000 3.86 % –0.81 %
Highest 22,280,000 20,544,032 20,471,929 12,760,000 15,722,386 23.22 % –29.43 % 12,024,884 7,062,808 7,840,619 6,999,000 8,568,000 22.42 % –28.75 % 8,254,573 5,938,000 3,728,000 5,389,826 4,504,000 –16.44 % –45.44 %
Average 9,326,781 6,943,456 8,191,353 7,166,879 7,208,376 0.58 % –22.71 % 3,814,715 2,939,052 2,948,413 2,761,837 2,930,936 6.12 % –23.17 % 1,821,102 1,548,651 1,340,985 1,641,761 1,441,203 –12.22 % –20.86 %
Lowest 1,704,000 1,814,702 1,819,000 1,560,206 1,570,000 0.63 % –7.86 % 1,012,836 930,824 710,000 5,000 5,000 0.00 % –99.51 % 139,000 130,000 20,000 5,000 5,000 0.00 % –96.40 %

www.pwc.ch/reward
© 2012 PwC. All rights reserved. “PwC” refers to PricewaterhouseCoopers AG, which is a member firm of PricewaterhouseCoopers International Limited, each member firm of which is a separate legal entity.