Embed Size (px)
Citation preview
EXECUTIVE COUNCIL : 2017-2020
Zone I : Dr Brij Nandan, SKUAST, Samba (J&K)Zone II : Dr C Bharadwaj, IARI, New DelhiZone III : Dr Rajib Nath, BCKV, KalyaniZone IV : Dr Baldev Ram, AU, Kota
Councillors
Dr Puran Gaur, ICRISAT, HyderabadDr Shiv Kumar, ICARDA, MoroccoDr BB Singh, GBPUA&T, PantnagarDr DK Agarwal, ICAR-IISS, MauDr Sarvajeet Singh, PAU, LudhianaDr J Souframanian, BARC
Chief PatronDr Trilochan Mohapatra
PatronDr A K Singh
Co-patronDr NP Singh
Zone V : Dr DK Patil, BadnapurZone VI : Dr P Jagan Mohan Rao, RARS, WarangalZone VII : Dr P Jayamani, TNAU, CoimbatoreZone VIII: Dr AK Parihar, ICAR-IIPR, Kanpur
PresidentDr NP Singh
SecretaryDr PK Katiyar
Joint SecretaryDr Jitendra Kumar
TreasurerDr RK Mishra
Vice PresidentDr Guriqbal Singh
Editors
Editor-in-ChiefDr CS Praharaj
The Indian Society of Pulses Research andDevelopment (ISPRD) was founded in April 1987 with thefollowing objectives: To advance the cause of pulses research To promote research and development, teaching and
extension activities in pulses To facilitate close association among pulse workers
in India and abroad To publish “Journal of Food Legumes” which is the
official publication of the Society, published four timesa year.
Membership : Any person in India and abroad interestedin pulses research and development shall be eligible formembership of the Society by becoming ordinary, life orcorporate member by paying respective membership fee.Membership Fee Indian (`) Foreign (US $)Ordinary (Annual) 500 40Life Member 5000 400Admission Fee 50 10Library/ Institution 5000 400Corporate Member 7500 -
INDIAN SOCIETY OF PULSES RESEARCH AND DEVELOPMENT(Regn. No. 877)
The contribution to the Journal, except in case ofinvited articles, is open to the members of the Societyonly. Any non-member submitting a manuscript will berequired to become annual member. Members will beentitled to receive the Journal and other communicationsissued by the Society.
Renewal of subscription should be done in Januaryeach year. If the subscription is not received by February15, the membership would stand cancelled. Themembership can be revived by paying readmission fee of` 50/-. Membership fee drawn in favour of Treasurer,Indian Society of Pulses Research and Development,through D.D. may be sent to the Treasurer, IndianSociety of Pulses Research and Development, ICAR-Indian Institute of Pulses Research, Kanpur208 024, India. In case of outstation cheques, an extraamount of ` 50/- may be paid as clearance charges.
Dr Aditya Pratap, ICAR-IIPR, KanpurDr Narendra Kumar, ICAR-IIPR, KanpurDr Naimuddin, ICAR-IIPR, KanpurDr Meenaal Rathore, ICAR-IIPR, KanpurDr Archana Singh, ICAR-IIPR Regional Station, BhopalDr Abhishek Bohra, ICAR-IIPR, Kanpur
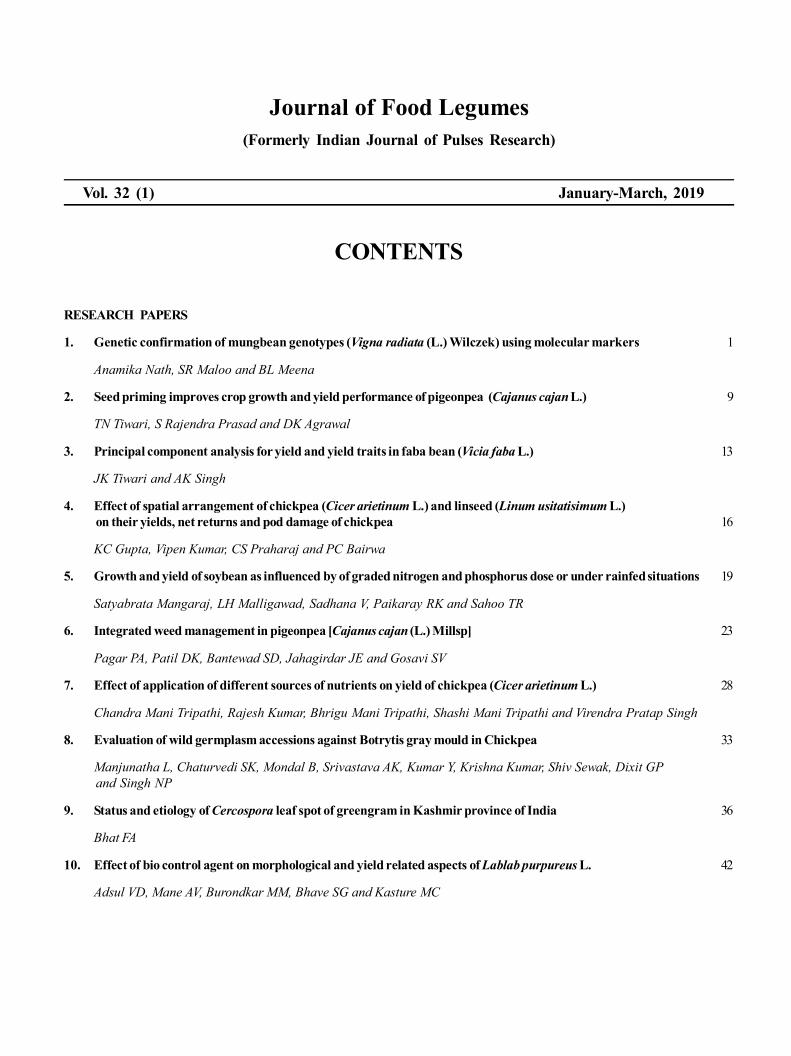
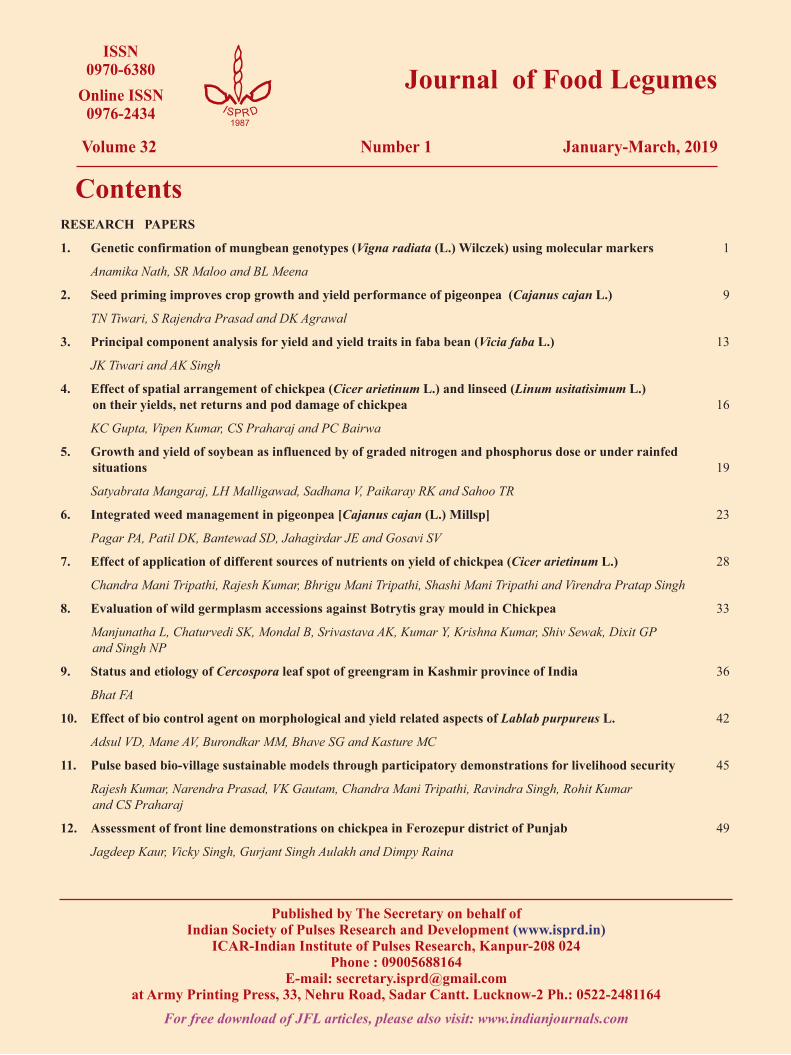
Journal of Food Legumes(Formerly Indian Journal of Pulses Research)
Vol. 32 (1) January-March, 2019
CONTENTS
RESEARCH PAPERS
1. Genetic confirmation of mungbean genotypes (Vigna radiata (L.) Wilczek) using molecular markers 1
Anamika Nath, SR Maloo and BL Meena
2. Seed priming improves crop growth and yield performance of pigeonpea (Cajanus cajan L.) 9
TN Tiwari, S Rajendra Prasad and DK Agrawal
3. Principal component analysis for yield and yield traits in faba bean (Vicia faba L.) 13
JK Tiwari and AK Singh
4. Effect of spatial arrangement of chickpea (Cicer arietinum L.) and linseed (Linum usitatisimum L.)on their yields, net returns and pod damage of chickpea 16
KC Gupta, Vipen Kumar, CS Praharaj and PC Bairwa
5. Growth and yield of soybean as influenced by of graded nitrogen and phosphorus dose or under rainfed situations 19
Satyabrata Mangaraj, LH Malligawad, Sadhana V, Paikaray RK and Sahoo TR
6. Integrated weed management in pigeonpea [Cajanus cajan (L.) Millsp] 23
Pagar PA, Patil DK, Bantewad SD, Jahagirdar JE and Gosavi SV
7. Effect of application of different sources of nutrients on yield of chickpea (Cicer arietinum L.) 28
Chandra Mani Tripathi, Rajesh Kumar, Bhrigu Mani Tripathi, Shashi Mani Tripathi and Virendra Pratap Singh
8. Evaluation of wild germplasm accessions against Botrytis gray mould in Chickpea 33
Manjunatha L, Chaturvedi SK, Mondal B, Srivastava AK, Kumar Y, Krishna Kumar, Shiv Sewak, Dixit GPand Singh NP
9. Status and etiology of Cercospora leaf spot of greengram in Kashmir province of India 36
Bhat FA
10. Effect of bio control agent on morphological and yield related aspects of Lablab purpureus L. 42
Adsul VD, Mane AV, Burondkar MM, Bhave SG and Kasture MC
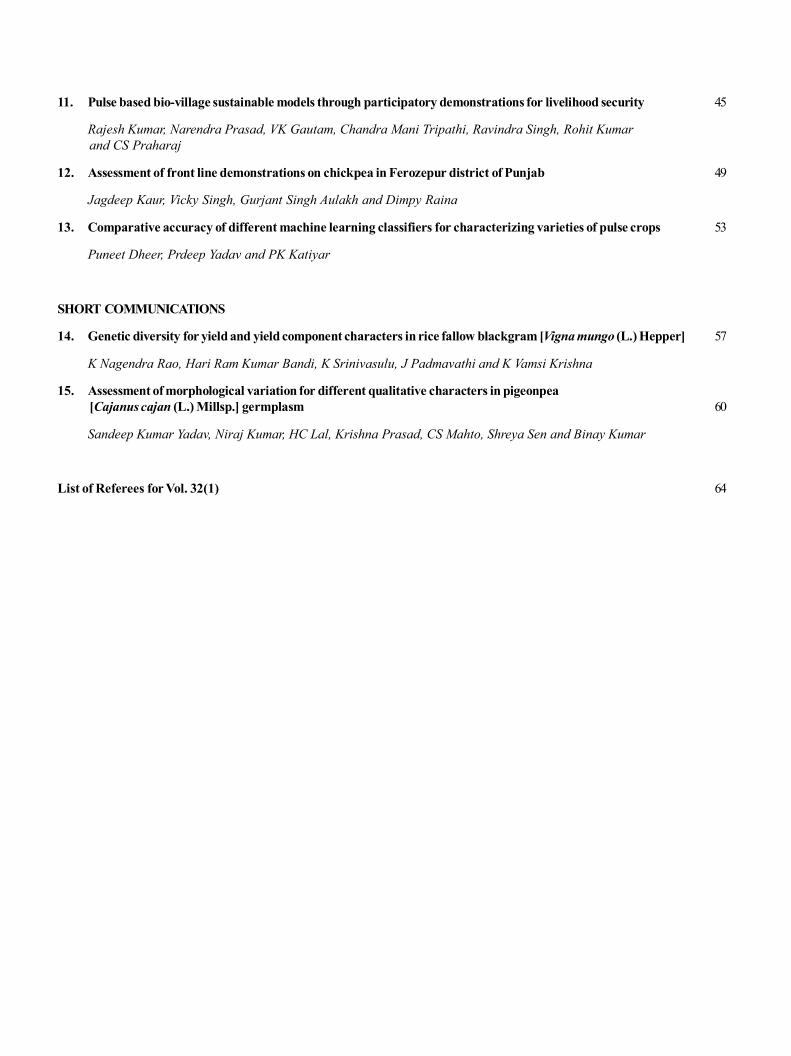
11. Pulse based bio-village sustainable models through participatory demonstrations for livelihood security 45
Rajesh Kumar, Narendra Prasad, VK Gautam, Chandra Mani Tripathi, Ravindra Singh, Rohit Kumarand CS Praharaj
12. Assessment of front line demonstrations on chickpea in Ferozepur district of Punjab 49
Jagdeep Kaur, Vicky Singh, Gurjant Singh Aulakh and Dimpy Raina
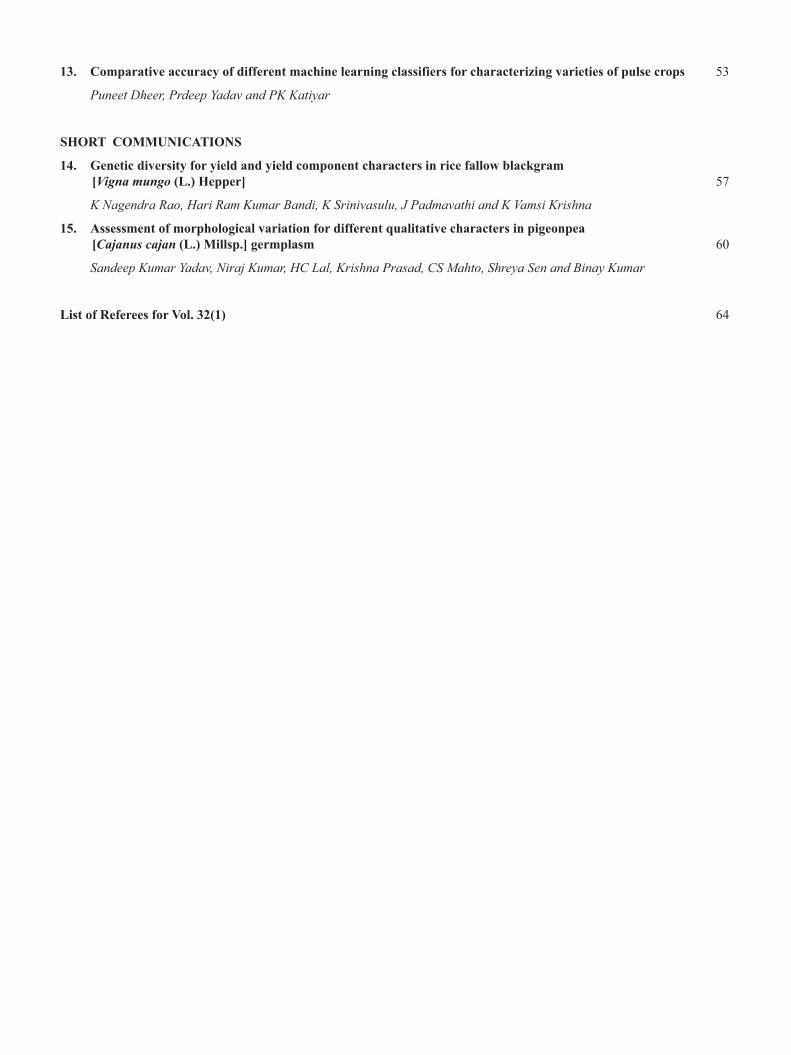
13. Comparative accuracy of different machine learning classifiers for characterizing varieties of pulse crops 53
Puneet Dheer, Prdeep Yadav and PK Katiyar
SHORT COMMUNICATIONS
14. Genetic diversity for yield and yield component characters in rice fallow blackgram [Vigna mungo (L.) Hepper] 57
K Nagendra Rao, Hari Ram Kumar Bandi, K Srinivasulu, J Padmavathi and K Vamsi Krishna
15. Assessment of morphological variation for different qualitative characters in pigeonpea[Cajanus cajan (L.) Millsp.] germplasm 60
Sandeep Kumar Yadav, Niraj Kumar, HC Lal, Krishna Prasad, CS Mahto, Shreya Sen and Binay Kumar
List of Referees for Vol. 32(1) 64
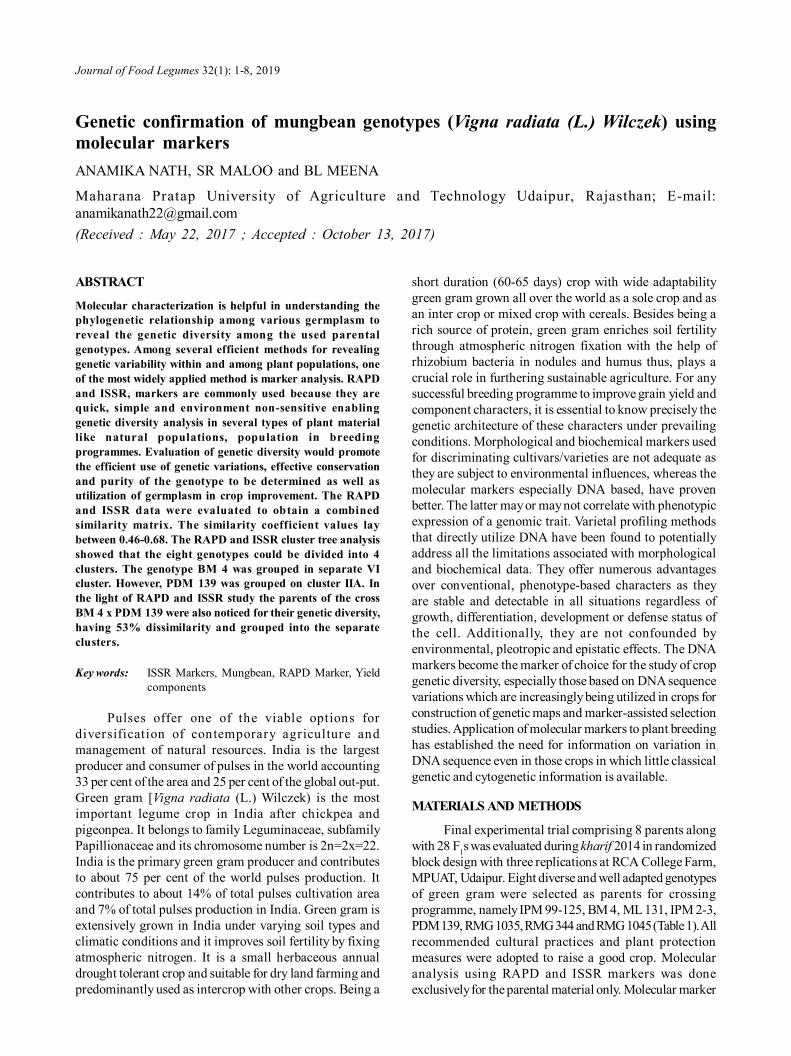
Journal of Food Legumes 32(1): 1-8, 2019
Genetic confirmation of mungbean genotypes (Vigna radiata (L.) Wilczek) usingmolecular markersANAMIKA NATH, SR MALOO and BL MEENA
Maharana Pratap University of Agriculture and Technology Udaipur, Rajasthan; E-mail:[email protected](Received : May 22, 2017 ; Accepted : October 13, 2017)
ABSTRACT
Molecular characterization is helpful in understanding thephylogenetic relationship among various germplasm toreveal the genetic diversity among the used parentalgenotypes. Among several efficient methods for revealinggenetic variability within and among plant populations, oneof the most widely applied method is marker analysis. RAPDand ISSR, markers are commonly used because they arequick, simple and environment non-sensitive enablinggenetic diversity analysis in several types of plant materiallike natural populations, population in breedingprogrammes. Evaluation of genetic diversity would promotethe efficient use of genetic variations, effective conservationand purity of the genotype to be determined as well asutilization of germplasm in crop improvement. The RAPDand ISSR data were evaluated to obtain a combinedsimilarity matrix. The similarity coefficient values laybetween 0.46-0.68. The RAPD and ISSR cluster tree analysisshowed that the eight genotypes could be divided into 4clusters. The genotype BM 4 was grouped in separate VIcluster. However, PDM 139 was grouped on cluster IIA. Inthe light of RAPD and ISSR study the parents of the crossBM 4 x PDM 139 were also noticed for their genetic diversity,having 53% dissimilarity and grouped into the separateclusters.
Key words: ISSR Markers, Mungbean, RAPD Marker, Yieldcomponents
Pulses offer one of the viable options fordiversification of contemporary agriculture andmanagement of natural resources. India is the largestproducer and consumer of pulses in the world accounting33 per cent of the area and 25 per cent of the global out-put.Green gram [Vigna radiata (L.) Wilczek) is the mostimportant legume crop in India after chickpea andpigeonpea. It belongs to family Leguminaceae, subfamilyPapillionaceae and its chromosome number is 2n=2x=22.India is the primary green gram producer and contributesto about 75 per cent of the world pulses production. Itcontributes to about 14% of total pulses cultivation areaand 7% of total pulses production in India. Green gram isextensively grown in India under varying soil types andclimatic conditions and it improves soil fertility by fixingatmospheric nitrogen. It is a small herbaceous annualdrought tolerant crop and suitable for dry land farming andpredominantly used as intercrop with other crops. Being a
short duration (60-65 days) crop with wide adaptabilitygreen gram grown all over the world as a sole crop and asan inter crop or mixed crop with cereals. Besides being arich source of protein, green gram enriches soil fertilitythrough atmospheric nitrogen fixation with the help ofrhizobium bacteria in nodules and humus thus, plays acrucial role in furthering sustainable agriculture. For anysuccessful breeding programme to improve grain yield andcomponent characters, it is essential to know precisely thegenetic architecture of these characters under prevailingconditions. Morphological and biochemical markers usedfor discriminating cultivars/varieties are not adequate asthey are subject to environmental influences, whereas themolecular markers especially DNA based, have provenbetter. The latter may or may not correlate with phenotypicexpression of a genomic trait. Varietal profiling methodsthat directly utilize DNA have been found to potentiallyaddress all the limitations associated with morphologicaland biochemical data. They offer numerous advantagesover conventional, phenotype-based characters as theyare stable and detectable in all situations regardless ofgrowth, differentiation, development or defense status ofthe cell. Additionally, they are not confounded byenvironmental, pleotropic and epistatic effects. The DNAmarkers become the marker of choice for the study of cropgenetic diversity, especially those based on DNA sequencevariations which are increasingly being utilized in crops forconstruction of genetic maps and marker-assisted selectionstudies. Application of molecular markers to plant breedinghas established the need for information on variation inDNA sequence even in those crops in which little classicalgenetic and cytogenetic information is available.
MATERIALS AND METHODS
Final experimental trial comprising 8 parents alongwith 28 F1s was evaluated during kharif 2014 in randomizedblock design with three replications at RCA College Farm,MPUAT, Udaipur. Eight diverse and well adapted genotypesof green gram were selected as parents for crossingprogramme, namely IPM 99-125, BM 4, ML 131, IPM 2-3,PDM 139, RMG 1035, RMG 344 and RMG 1045 (Table 1). Allrecommended cultural practices and plant protectionmeasures were adopted to raise a good crop. Molecularanalysis using RAPD and ISSR markers was doneexclusively for the parental material only. Molecular marker
2 Journal of Food Legumes 32(1), 2019
analysis was done for the parental material to see thediversity present among the parental material. DNAextracted from different green gram cultivars were comparedusing RAPD and ISSR methodology. The leaves wereharvested after 21 days and DNA was isolated with thehelp of Doyle and Doyle, 1987 protocol. DNA was extractedfrom young leaves (3-4 weeks old) using CTAB methodand was amplified by using decamer random oligonucleotideprimer in a DNA thermo cycler (Biometra). The amplifiedsamples were separated on agarose gel electrophoresis(1.2%). The bands were scored for their presence orabsence. The details of the technique of DNA isolation,RAPD and ISSR are as given below:
These data matrices were then entered into NTSYS-PCdeveloped by Rohlf (1993). The genetic distances obtainedfrom cluster analysis through UPGMA were used toconstruct the dendrogram, depicting the relationships ofthe genotypes using computer program NTSYSpc version2.02.
Table 1. Experimental material and their pedigreeParent Pedigree Source IPM 99-125 PM 3 x APM 36 IIPR, Kanpur BM 4 MUTANT of T44 ARS, Badnapur ML 131 ML 1 x ML 23 ARS, Durgapura IPM 02-03 IPM 99-125 x Pusa bold 2 IIPR, Kanpur PDM 139 ML 20/19 x ML 5 IIPR, Kanpur RMG 1035 RMG 492 x ML 818 ARS, Durgapura RMG 344 MOONG SEL.1 x J 45 ARS, Durgapura RMG-1045 RMG-62 x KM 2170 ARS, Durgapura
The DNA content in 20 ìl of the reaction mixture was50 ng. The sequences of these primers were purchasedfrom Bangalore Genei Pvt. Ltd. The details of operon codesequence of the primer and G:C contents are given ontable 3. The reaction contained 10X reaction buffer, 200 µMeach of dNTPs (Bangalore Genei), 0.5 µM of each primerand 1 unit of Taq DNA polymerase (Table 2). Submergedgel electrophoresis unit was used for fractionating amplifiedPCR products on 1.2% agarose gel. The gel was preparedin 1X TAE buffer containing 0.5 µg/ml of ethidium bromides.The samples and loading dye were mixed in 1:1 ratio andloaded with micropipette. In order to score and preservebanding patterns, photographs of the gel were taken by aGel Documentation System, under UV transilluminator.Bands were designated on the basis of their molecular sizeranging between 100-1000 bp. Electrophoresis was carriedout at 100 V for 3 hr in 1X TAE electrophoresis buffer. Forthe ISSR and RAPD reactions, 25 primer pairs were usedrespectively (Table 3).
Gel was viewed under UV transilluminator andphotographed by gel documentation system.
Presence of amplified product were scored as 1 andits absence as 0 for all genotypes and primer combinations.
Components Final concentration Single tube/20 (μl)DNA template 50ng 2.00 μl Master Mixture (i) dNTP MIX 200µM 1.6 μl (ii) Taq polymerase 1 U 0.33μl (iii) Reaction buffer (10x) 1X 2.00 μl (iv) Primer 0.5 µM 1.00μl (vi) dd H2O 12.07μl
Table 2. PCR reaction mixture content
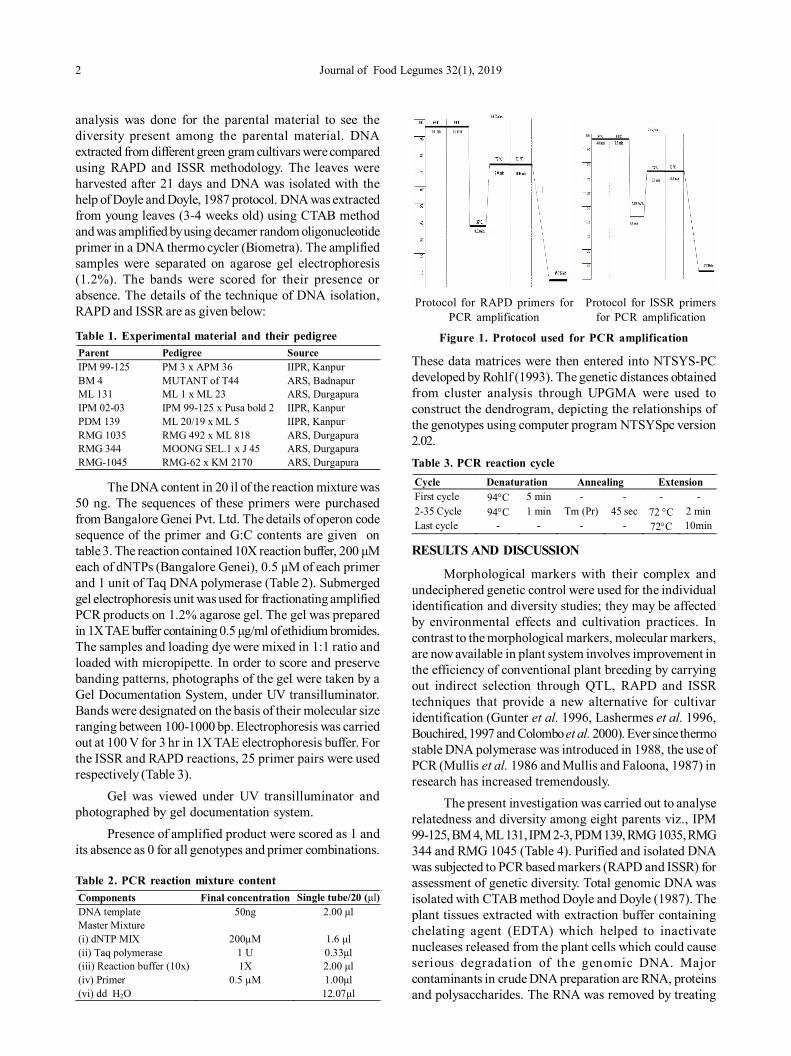
Figure 1. Protocol used for PCR amplification
Protocol for RAPD primers forPCR amplification
Protocol for ISSR primersfor PCR amplification
RESULTS AND DISCUSSION
Morphological markers with their complex andundeciphered genetic control were used for the individualidentification and diversity studies; they may be affectedby environmental effects and cultivation practices. Incontrast to the morphological markers, molecular markers,are now available in plant system involves improvement inthe efficiency of conventional plant breeding by carryingout indirect selection through QTL, RAPD and ISSRtechniques that provide a new alternative for cultivaridentification (Gunter et al. 1996, Lashermes et al. 1996,Bouchired, 1997 and Colombo et al. 2000). Ever since thermostable DNA polymerase was introduced in 1988, the use ofPCR (Mullis et al. 1986 and Mullis and Faloona, 1987) inresearch has increased tremendously.
The present investigation was carried out to analyserelatedness and diversity among eight parents viz., IPM99-125, BM 4, ML 131, IPM 2-3, PDM 139, RMG 1035, RMG344 and RMG 1045 (Table 4). Purified and isolated DNAwas subjected to PCR based markers (RAPD and ISSR) forassessment of genetic diversity. Total genomic DNA wasisolated with CTAB method Doyle and Doyle (1987). Theplant tissues extracted with extraction buffer containingchelating agent (EDTA) which helped to inactivatenucleases released from the plant cells which could causeserious degradation of the genomic DNA. Majorcontaminants in crude DNA preparation are RNA, proteinsand polysaccharides. The RNA was removed by treating
Cycle Denaturation Annealing Extension First cycle 94C 5 min - - - - 2-35 Cycle 94C 1 min Tm (Pr) 45 sec 72 C 2 min Last cycle - - - - 72C 10min
Table 3. PCR reaction cycle
Nath et al. : Genetic confirmation of mungbean genotypes using molecular markers 3
with RNase. Extraction with phenol–chloroform mixture wasemployed for eliminating most of the proteins. The qualityof DNA was determined by calculating the ratio betweenA260 and A280 which ranged from 1.74-1.89. Quality of DNAwas also supported by appearance of single, compact,sharp band that was not sheared on 0.8% agarose gelelectrophoresis corresponded to the high molecular weightDNA compared with standard ë hind III DNA marker.
The amount of DNA isolated from various genotypesof V. radiata ranged from 757 to 1518 ng/µl (Table 4). Thegenotype IPM 2-03 yielded the highest amount of DNA(1518 ng/µl). Whereas the lowest amount of DNA (757ng/µl) was obtained from genotype RMG 344. The ratio ofabsorbance (A260/A280) ranged from 1.70 to 1.89 revealingthat the DNA obtained was free from contaminants likepolysaccharides, protein and RNA. The quality of DNA asalso checked by gel electrophoresis revealed a singlediscrete band in all genotypes (Plate-5) showing thatgenomic DNA was intact and had high molecular weight,free from any mechanical or enzymatic degradation, freefrom RNA contamination and was of high quality.
and clear banding patterns were obtained in a reactionmixture of 20 µl containing 50 ng of template DNA, 2 µl of10 X Taq DNA polymerase buffer, 1.5 mM MgCl2, 200 µM ofeach dNTP, 0.30 µM of primer and 1 U of Taq DNApolymerase, at an annealing temperature of 37°C (RAPD)and 42.9°C-67°C (ISSR) for PCR amplification. Similarily,optimization of the concentration of template DNA, MgCl2,Taq polymerase and of primers were found similar to findingsreported by Khamassi et al. (2011). An annealingtemperature of 37°C (RAPD) and 41.3°C-67.2°C (ISSR) werefound optimum (Fig 1).
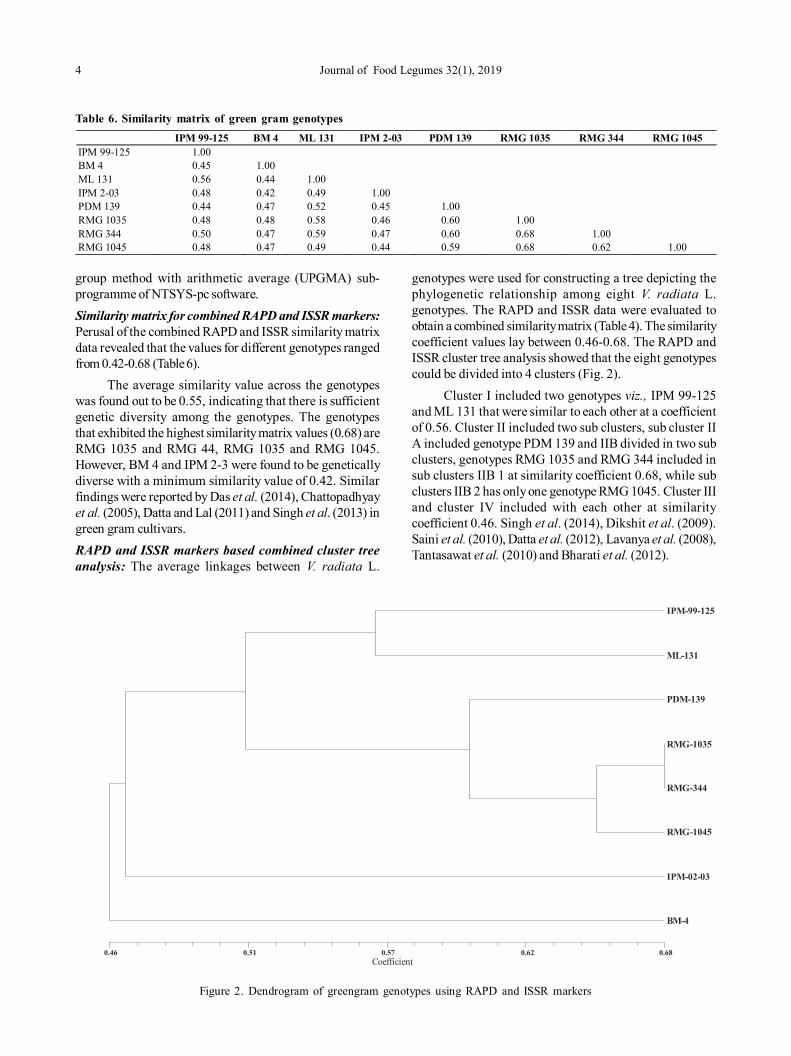
Out of 25 RAPD primers only 17 were amplified. Atotal of 104 amplified bands were obtained of which 91were polymorphic and 13 monomorphic that showed 88%polymorphism (Table 5). The total number of amplifiedbands varied between 5 and 8. The average number of bandsper primer was found to be 6.12 and average numbers ofpolymorphic bands per primer were 5.35. The polymorphismamongst all genotypes of V. radiata L. was 88% and theoverall size of PCR amplified products ranged between 100bp to 2500 bp. The per cent polymorphism ranged from aslow as 60% (OPA 15 and OPB 06) to as high as 100% (OPA09, OPA 10, OPA 08, OPB 03, OPB 07, OPE 03 and OPA 16).A total of 112 amplified bands were obtained from the 18ISSR primers, out of which 88 were polymorphic. The totalnumber of amplified bands varied between 5 and 8 (Table7).
Genotypes Parents’ Name Concentration (ng/ µl)
Ratio 260/280
P1 IPM 99-125 1420 1.81 P2 BM 4 968 1.77 P3 ML 131 1250 1.79 P4 IPM 2-03 1518 1.89 P5 PDM 139 1251 1.80 P6 RMG 1035 1012 1.81 P7 RMG 344 757 1.74 P8 RMG 1045 998 1.82
Table 4. Quality and quantity of total genomic DNA of V.radiata L. isolated and purified by CTAB method
RAPD has been used extensively for classificationof varieties, identification of cultivars and diversityestimation in various crops such as green gram(Karuppanapandian et al. 2006). Similarly, ISSR markers areuseful in detecting polymorphism among accessions bygenerating a large number of markers that target multiplemicrosatellite loci distributed across the genome (Reddy etal. 2002). The RAPD and ISSR techniques are moreinformative for estimating the extent of genetic diversityand relationships between green gram varieties. So far, verylittle attention has been given to varietal improvement oflegumes (Sultana et al. 2006; Nisar et al. 2006). The presentstudy aimed to analyze the extent of genetic diversity, usinga total of 25 RAPD and 25 ISSR primers, respectively, togenerate DNA fingerprints of eight parents of V. radiate L.with a view to detect polymorphism and access toinformation on diversity among these genotypes.Optimization of PCR conditions for RAPD and ISSRanalysis: PCR amplification conditions such asconcentration of template DNA, primers, concentration ofMgCl2, Taq DNA polymerase and annealing temperaturewere optimized for RAPD and ISSR primers. Reproducible
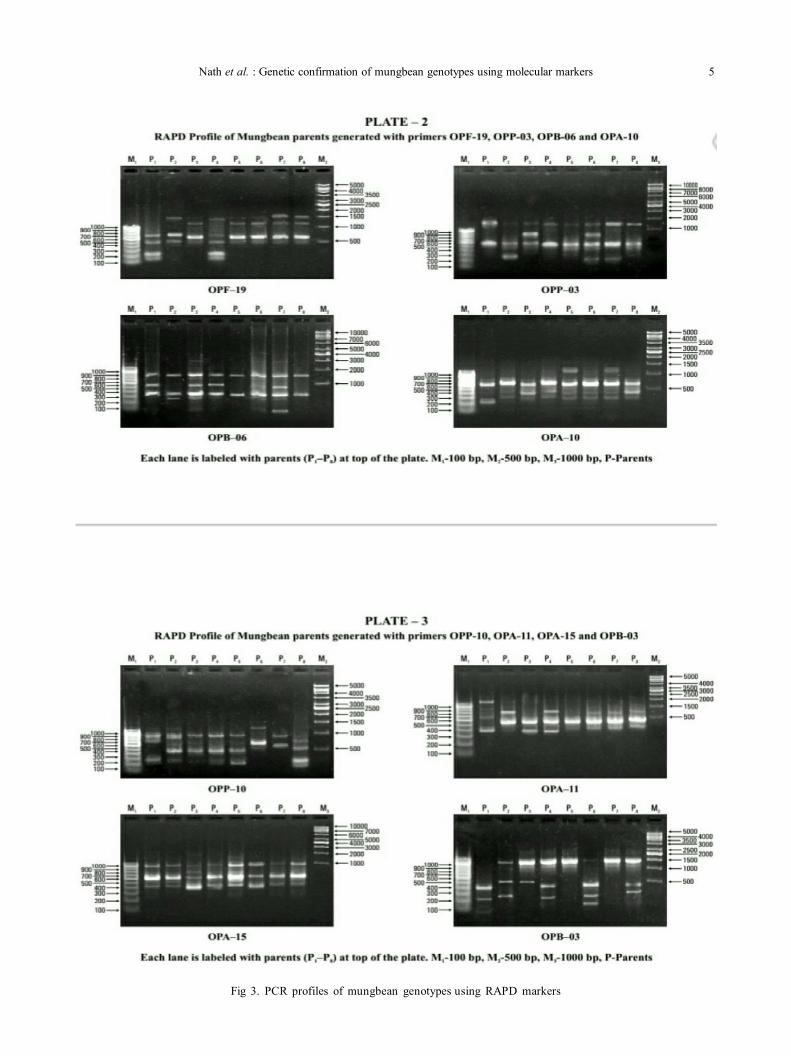
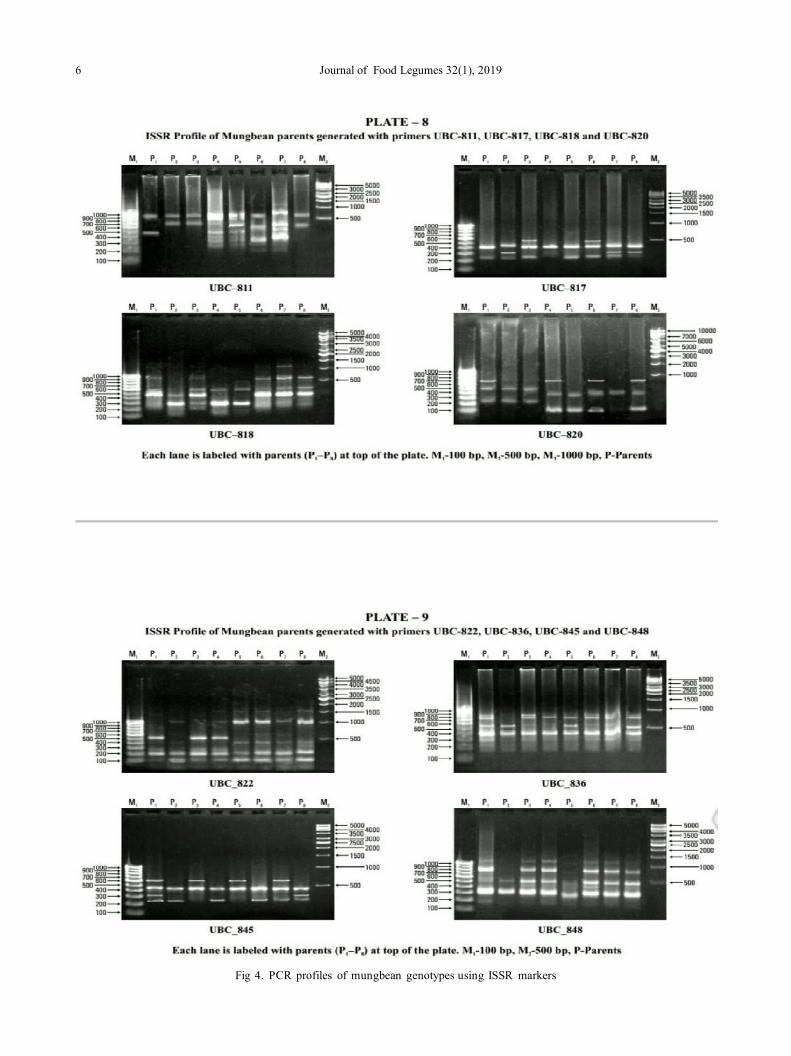
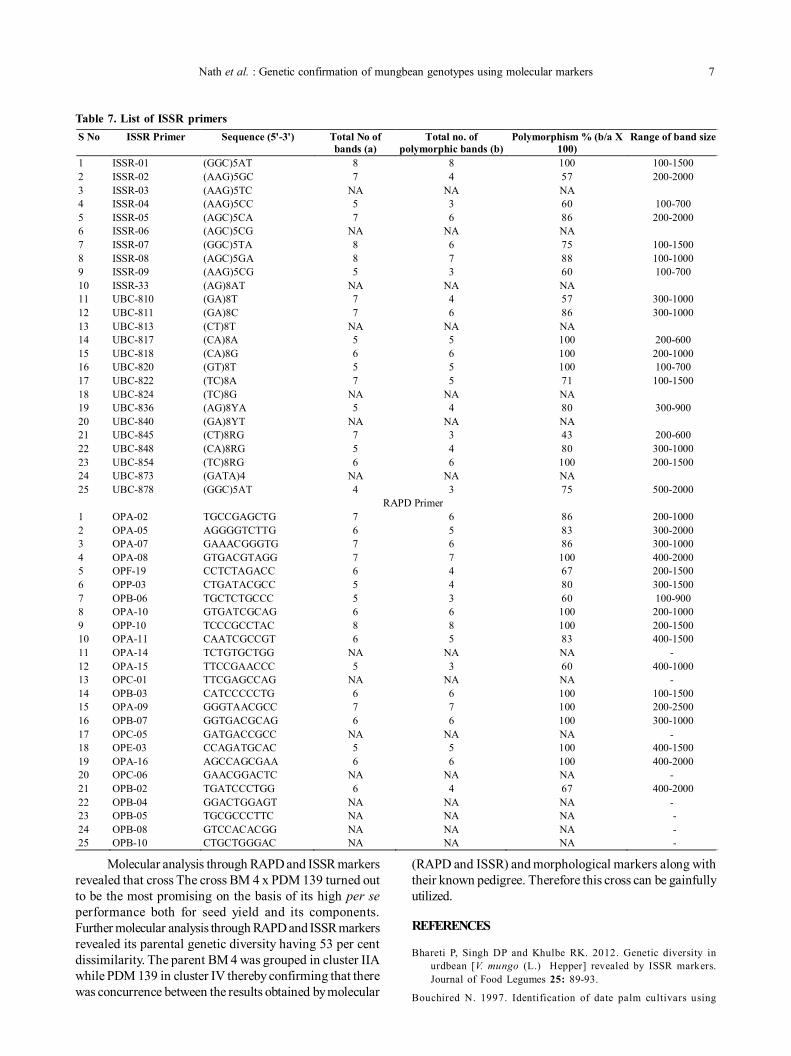
The average number of bands per primer was foundto be 6.22 and average numbers of polymorphic bands perprimer were 4.89. The polymorphism percentage ranged from43 % (UBC 845) to 100% for five primers (ISSR 1, UBC 817,UBC 818, UBC 820 and UBC 854) used. Averagepolymorphism across all the genotypes of V. radiata L.was found to be 79%. Overall size of PCR amplified productsranged between 100 bp to 2000 bp. Similar results werehown by Das et al. (2014), Singh et al. (2011), Tantasawatet al. (2010) Datta et al. (2012), Undal et al. (2011) and Sainiet al. (2010)Genetic relationship and cluster tree analysis: The dataobtained by using RAPD and ISSR primers (Appendix-VII)were further used to construct similarity matrix of eight V.radiata L. genotypes using ‘Simqual’ sub-programme ofsoftware NTSYS-pc. Dendrograms were constructed usingsimilarity matrix values as determined from RAPD and ISSRdata for V. radiata L. genotypes using unweighted pair
Table 5. Details of the RAPD and ISSR primers used foramplification of DNA in green gram
DNA primers RAPD ISSR Total number of primers 25 25 Number of primers which showed amplification 17 18 Number of primer which showed polymorphism 17 18 Total number of monomorphic bands 13 21 Total number of polymorphic bands 91 88 Total number of bands 104 109 Total number of amplicon produced 391 563
4 Journal of Food Legumes 32(1), 2019
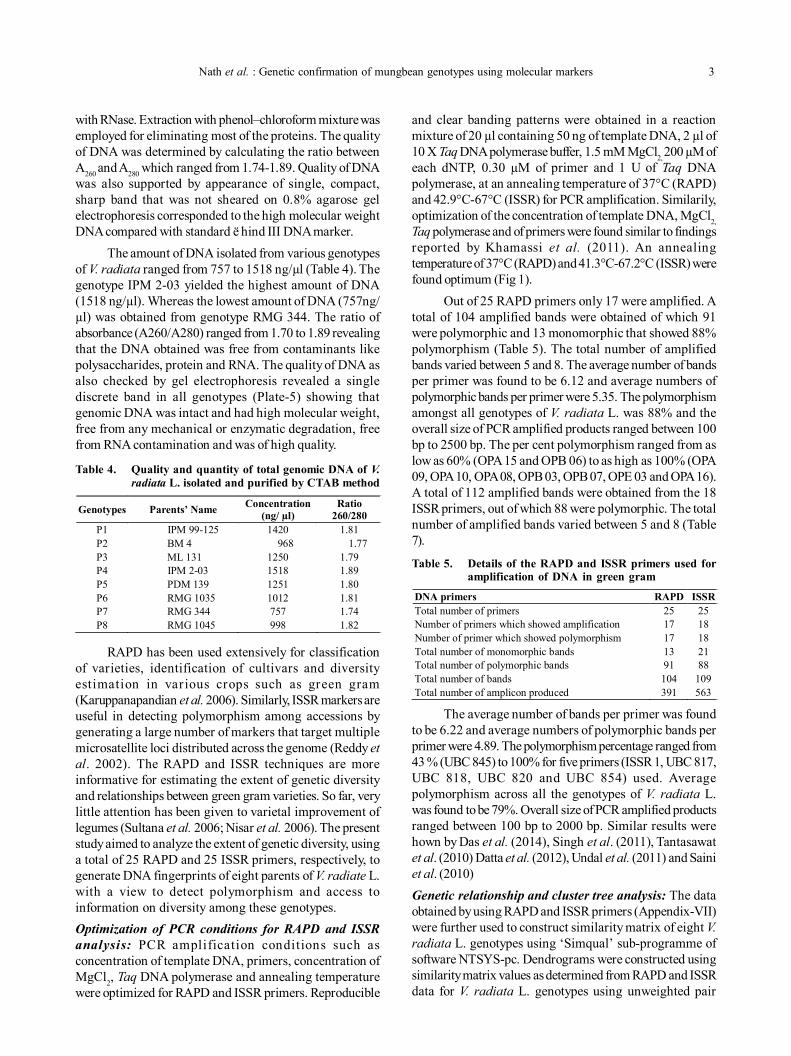
genotypes were used for constructing a tree depicting thephylogenetic relationship among eight V. radiata L.genotypes. The RAPD and ISSR data were evaluated toobtain a combined similarity matrix (Table 4). The similaritycoefficient values lay between 0.46-0.68. The RAPD andISSR cluster tree analysis showed that the eight genotypescould be divided into 4 clusters (Fig. 2).
Cluster I included two genotypes viz., IPM 99-125and ML 131 that were similar to each other at a coefficientof 0.56. Cluster II included two sub clusters, sub cluster IIA included genotype PDM 139 and IIB divided in two subclusters, genotypes RMG 1035 and RMG 344 included insub clusters IIB 1 at similarity coefficient 0.68, while subclusters IIB 2 has only one genotype RMG 1045. Cluster IIIand cluster IV included with each other at similaritycoefficient 0.46. Singh et al. (2014), Dikshit et al. (2009).Saini et al. (2010), Datta et al. (2012), Lavanya et al. (2008),Tantasawat et al. (2010) and Bharati et al. (2012).
Table 6. Similarity matrix of green gram genotypes IPM 99-125 BM 4 ML 131 IPM 2-03 PDM 139 RMG 1035 RMG 344 RMG 1045
IPM 99-125 1.00 BM 4 0.45 1.00 ML 131 0.56 0.44 1.00 IPM 2-03 0.48 0.42 0.49 1.00 PDM 139 0.44 0.47 0.52 0.45 1.00 RMG 1035 0.48 0.48 0.58 0.46 0.60 1.00 RMG 344 0.50 0.47 0.59 0.47 0.60 0.68 1.00 RMG 1045 0.48 0.47 0.49 0.44 0.59 0.68 0.62 1.00
group method with arithmetic average (UPGMA) sub-programme of NTSYS-pc software.Similarity matrix for combined RAPD and ISSR markers:Perusal of the combined RAPD and ISSR similarity matrixdata revealed that the values for different genotypes rangedfrom 0.42-0.68 (Table 6).
The average similarity value across the genotypeswas found out to be 0.55, indicating that there is sufficientgenetic diversity among the genotypes. The genotypesthat exhibited the highest similarity matrix values (0.68) areRMG 1035 and RMG 44, RMG 1035 and RMG 1045.However, BM 4 and IPM 2-3 were found to be geneticallydiverse with a minimum similarity value of 0.42. Similarfindings were reported by Das et al. (2014), Chattopadhyayet al. (2005), Datta and Lal (2011) and Singh et al. (2013) ingreen gram cultivars.RAPD and ISSR markers based combined cluster treeanalysis: The average linkages between V. radiata L.
Coefficient0.46 0.51 0.57 0.62 0.68
IPM-99-125
ML-131
PDM-139
RMG-1035
RMG-344
RMG-1045
IPM-02-03
BM-4
Figure 2. Dendrogram of greengram genotypes using RAPD and ISSR markers
Nath et al. : Genetic confirmation of mungbean genotypes using molecular markers 5
Fig 3. PCR profiles of mungbean genotypes using RAPD markers
6 Journal of Food Legumes 32(1), 2019
Fig 4. PCR profiles of mungbean genotypes using ISSR markers
Nath et al. : Genetic confirmation of mungbean genotypes using molecular markers 7
Table 7. List of ISSR primersS No ISSR Primer Sequence (5'-3') Total No of
bands (a) Total no. of
polymorphic bands (b) Polymorphism % (b/a X
100) Range of band size
1 ISSR-01 (GGC)5AT 8 8 100 100-1500 2 ISSR-02 (AAG)5GC 7 4 57 200-2000 3 ISSR-03 (AAG)5TC NA NA NA 4 ISSR-04 (AAG)5CC 5 3 60 100-700 5 ISSR-05 (AGC)5CA 7 6 86 200-2000 6 ISSR-06 (AGC)5CG NA NA NA 7 ISSR-07 (GGC)5TA 8 6 75 100-1500 8 ISSR-08 (AGC)5GA 8 7 88 100-1000 9 ISSR-09 (AAG)5CG 5 3 60 100-700 10 ISSR-33 (AG)8AT NA NA NA 11 UBC-810 (GA)8T 7 4 57 300-1000 12 UBC-811 (GA)8C 7 6 86 300-1000 13 UBC-813 (CT)8T NA NA NA 14 UBC-817 (CA)8A 5 5 100 200-600 15 UBC-818 (CA)8G 6 6 100 200-1000 16 UBC-820 (GT)8T 5 5 100 100-700 17 UBC-822 (TC)8A 7 5 71 100-1500 18 UBC-824 (TC)8G NA NA NA 19 UBC-836 (AG)8YA 5 4 80 300-900 20 UBC-840 (GA)8YT NA NA NA 21 UBC-845 (CT)8RG 7 3 43 200-600 22 UBC-848 (CA)8RG 5 4 80 300-1000 23 UBC-854 (TC)8RG 6 6 100 200-1500 24 UBC-873 (GATA)4 NA NA NA 25 UBC-878 (GGC)5AT 4 3 75 500-2000
RAPD Primer 1 OPA-02 TGCCGAGCTG 7 6 86 200-1000 2 OPA-05 AGGGGTCTTG 6 5 83 300-2000 3 OPA-07 GAAACGGGTG 7 6 86 300-1000 4 OPA-08 GTGACGTAGG 7 7 100 400-2000 5 OPF-19 CCTCTAGACC 6 4 67 200-1500 6 OPP-03 CTGATACGCC 5 4 80 300-1500 7 OPB-06 TGCTCTGCCC 5 3 60 100-900 8 OPA-10 GTGATCGCAG 6 6 100 200-1000 9 OPP-10 TCCCGCCTAC 8 8 100 200-1500 10 OPA-11 CAATCGCCGT 6 5 83 400-1500 11 OPA-14 TCTGTGCTGG NA NA NA - 12 OPA-15 TTCCGAACCC 5 3 60 400-1000 13 OPC-01 TTCGAGCCAG NA NA NA - 14 OPB-03 CATCCCCCTG 6 6 100 100-1500 15 OPA-09 GGGTAACGCC 7 7 100 200-2500 16 OPB-07 GGTGACGCAG 6 6 100 300-1000 17 OPC-05 GATGACCGCC NA NA NA - 18 OPE-03 CCAGATGCAC 5 5 100 400-1500 19 OPA-16 AGCCAGCGAA 6 6 100 400-2000 20 OPC-06 GAACGGACTC NA NA NA - 21 OPB-02 TGATCCCTGG 6 4 67 400-2000 22 OPB-04 GGACTGGAGT NA NA NA - 23 OPB-05 TGCGCCCTTC NA NA NA - 24 OPB-08 GTCCACACGG NA NA NA - 25 OPB-10 CTGCTGGGAC NA NA NA -
Molecular analysis through RAPD and ISSR markersrevealed that cross The cross BM 4 x PDM 139 turned outto be the most promising on the basis of its high per seperformance both for seed yield and its components.Further molecular analysis through RAPD and ISSR markersrevealed its parental genetic diversity having 53 per centdissimilarity. The parent BM 4 was grouped in cluster IIAwhile PDM 139 in cluster IV thereby confirming that therewas concurrence between the results obtained by molecular
(RAPD and ISSR) and morphological markers along withtheir known pedigree. Therefore this cross can be gainfullyutilized.
REFERENCES
Bhareti P, Singh DP and Khulbe RK. 2012. Genetic diversity inurdbean [V. mungo (L.) Hepper] revealed by ISSR markers.Journal of Food Legumes 25: 89-93.
Bouchired N. 1997. Identification of date palm cultivars using
8 Journal of Food Legumes 32(1), 2019
random amplified spolymorphic DNA (RAPD). 3rdInternational Symposium on Mineral Nutrition of DeciduousFruit Tree, edited by J. Val, L. Montanes and Emonge. Ishs ActaHorticulturae pp. 448
Chattopadhyay K, Ali MN, Sarkar HK, Mandal N and BhattacharyyaS. 2005. Diversity analysis by RAPD and ISSR markers amongthe selected mungbean (Vigna radiata (L.) Wilckez) genotype.Indian Journal of Genetics 65: 172-175
Colombo C, Second G and Charrier A. 2000. Diversity withinAmerican Cassava germplasm based on RAPD markers. Geneticsand Molecular Biology 23: 189-199
Das S, Das SS and Ghosh P. 2014. Assessment of molecular geneticdiversity in some green gram cultivars as revealed by ISSRanalysis. Advances in Applied Science Research 5: 93-97
Datta S, Gangwar S, Kumar S, Gupta S, Rai R, Kaashyap M, Singh P,Chaturvedi SK, Singh BB and Nadarajan N. 2012. Geneticdiversity in selected indian mungbean [Vigna radiata (L.)Wilczek] cultivars using RAPD markers. American Journal ofPlant Sciences 3: 1085-1091
Datta J and Lal N. 2011. Genetic differentiation in Cicer arietinumL. and Cajanus cajan L. Millspaugh using SSR and ISSR markersystems. Advanced Biotech 11: 39-44
Dikshit HK, Sharma TR, Singh BB and Kumari J. 2009. Molecularand morphological characterization of fixed lines from diversecross in Mung bean (Vigna radiata (L.) Wilczek). Journal ofGenetics 88: 341-344
Gunter LE, Tuskan GA and Wullschleger SD. 1996. Diversity amongpopulation of switchgrass based on RAPD marker. CurrentScience 36: 1017-1022
Karuppanapandian T, Karuppudurai T, Sinha PB, Haniya AH andManoharan K. 2006. Genetic diversity in greengram [Vignaradiata (L.)] landraces analyzed by using random amplifiedpolymorphic DNA (RAPD). African Journal of Biotechnology5: 1214-1219
Khamassi K, Khoufi S, Chaabane R, Da Silva JAT and Naceur MB.2011. Optimization of conditions for assessment of geneticdiversity in chickpea (C. arietinum L.) using SSR markers.International Journal of Plant Breeding 12: 141-145
Lashermes P, Trouslot P, Anthony F, Combes MC and Charrier A.1996. Genetic diversity for RAPD marker using cultivated andwild accessions of Coffea arabica. Euphytica 87: 59-64
Lavanya GR, Srivastava J and Ranade SA. 2008. Molecular assessmentof genetic diversity in mungbean germplasm. Journal of Genetics87: 65-74
Mullis KB and Faloona FA. 1987. Specific synthesis of DNA in vitrovia a polymerase catalysed reaction. Methods of Enzymology255: 335-350
Mullis KB, Faloona FA, Scharf S, Saiki R, Horn G and Erlich H.1986. Specific enzymatic amplification of DNA in vitro: Thepolymerase chain reaction. Cold Spring Harbor SymposiumQuantitative Biology 51: 263-273
Nisar M, Ghafoor H, Ahmad KM, Rashid AS, Qureshi H and Ali H.2008. Evaluation of genetic diversity of pea germplasm throughphenotypic traits analysis. Pakistan Journal of Botany 40(5):2081-2088
Reddy MP, Sarla N and Siddiq EA. 2002. Inter simple sequencerepeat polymorphism and its application in plant breeding.Euphytica 128: 9-17
Rohlf FJ. 1993. NTSYS-PC. Numerical taxonomy and multivariateanalysis system. Exeter Software, New York
Saini M, Singh S, Hussain Z and Sikka VK. 2010. RAPD analysis inmungbean [Vigna radiata (L.) Wilczek.] II: A comparison ofefficiency parameters of RAPD primers. Indian Journal ofBiotechnology 9: 276-282
Singh R, Heusden AW and Yadav RC. 2013. A comparative geneticdiversity analysis in mungbean (Vigna radiata L.) using inter-simple sequence repeat and amplified fragment lengthpolymorphism. African Journal of Biotechnology 12: 6574-6582
Singh R, Heusden AWV and Yadav RC. 2011. A comparative geneticdiversity analysis in mungbean (Vigna radiata L.) using inter-simple sequence repeat and amplified fragment lengthpolymorphism. African Journal of Biotechnology 12(47): 6574-6582
Singh SK, Suresh BG, Lavanya GR, Lalit Arya Bhat KV, Hussain Zand Verma M. 2014. Assessment of genetic variability in mutantlines of greengram (Vigna radiata) using ISSR markers. IndianJournal of Agricultural Sciences 84: 534-539
Tantasawat P, Trongchuen J, Prajongjai T, Thongpae T, PetkhumC, Seehalak W and Machikowa T. 2010. Variety identificationand genetic relationships of mungbean and black gram in Thailandbased on morphological characters and ISSR analysis. AfricanJournal of Biotechnology 9: 4152-4164
Undal VS, Thakare PV, Chaudhari US, Deshmukh VP and GawandePA. 2011. Estimation of Genetic Diversity among wild Vignaspecies revealed by RAPD Markers. Annals of BiologicalResearch 2: 348-354
Journal of Food Legumes 32(1): 9-12, 2019
Seed priming improves crop growth and yield performance of pigeonpea (Cajanuscajan L)TN TIWARI, S RAJENDRA PRASAD1 and DK AGRAWAL2
ICAR-Indian Institute of Seed Science, Mau Uttar Pradesh, 1ICAR-Indian Institute of Pulses Research, Kanpur,Uttar Pradesh, 2University of Agricultural Science, Bengaluru, Email: [email protected](Received : August 05, 2018 ; Accepted : December 20, 2018)
ABSTRACT
Field experiments a were conducted with four levels of seedpriming including control and two varieties of pigeonpea atICAR-Indian Institute of Seed Science, Mau during threeconsecutive years (2011-12 to 2013-14). One-year-old seedsof pigeonpea varieties (Bahar and Malviya 13) were primedwith different priming agents such as growth regulator (100ppm GA3), in-organic salt (0.2% KNO3) and tap waterseparately for 06 hours and sown in field under randomizedblock design with three replications. Observations wererecorded on growth parameters, yield attributes and grainyield. Priming with in-organic salts and plant growthregulator showed the significant improvement in plantheight (14.18-21.25%), number of branches (27.44-54.20%),yield test attributes including no. biological of pods/plant(16.45-34.40%), Test weight (21.97-41.53%), Biological yield(17.28-28.70%) and grain yield (18.73-35.18%) in both thevarieties evaluated. Variety Bahar displayed higher valuesin all the parameters studied.
Key words: Pigeonpea, Priming, Seeds, Seedling vigour, Yieldand its attributes
In India, pigeon pea occupies an area of about 4.65million ha with total production of 3.02 million tonnes andproductivity being 7.00 q/ha (FAO, 2013) which is quitelow because of its cultivation in rain fed and marginal lands,use of old and low quality seed by the farmers and severalabiotic and biotic stresses affecting different phases ofcrop in the entire crop season. This in turns results in topoor germination, delayed emergence and unhealthyseedlings that lead to low yield. In seed priming, seeds aresoaked in water or an osmotic solution that allows waterimbibition’s and permits early stages of germination butdoes not permit radicle protrusion through seed coat(Heydecker, 1973). Priming with different in-organic saltshas been reported to improve the seedling vigour, growthand yield of different vegetable and field crops (Min Taigi2001, Pandita et al. 2003, Mishra and Sahoo 2003, Thakurand Thakur 2006, Dhedhi et al. 2006 and Tiwari et al. 2013and 2014). Considerable evidences exist that repair ofproteins and enzymes occurs during imbibition (McDonalds 2000). It is also known that priming increases theactivity of enzymes that counteracts the effect of lipidperoxidation and as a result the free radical scavengingenzymes are increased (Sung and Jeng, 1994). Priming alsoenhanced the membrane repair in seeds and could be
ascribed to evoke activities of several lipid peroxidescavenging enzymes (Chiu et al. 1995). Very less informationare available on response of KNO3 and GA3 onenhancement of plant growth and yield in pigeon pea.Keeping the above facts into consideration the presentexperiment was under taken.
MATERIALS AND METHODS
Field experiment was conducted during threeconsecutive kharif season of 2011-12 to 2013-14 at theresearch farm of Indian Institute of Seed Science, Mau.One year old farmer saved seeds of pigeonpea varieties,Bahar and Malviya 13 were initially surface sterilized with0.2% HgCl2 and then primed with Tap water, 100 ppm GA3and 0.2% KNO3 separately for 6 hours. The Primed seeds ofboth the varieties were sown under field condition followingRBD in three replications. Seed rate, fertilizer, irrigationsand other agronomic practices were adopted as perstandard recommendation for long duration pigeonpeacrops. Observations on growth parameters including plantheight and number of branches were recorded. Atharvesting, yield attributes like biological yield, test weight,number of pods/plant and grain yield were recorded. Threeyears data were pooled and statistically analyzed usingAGRES Toll Var.
RESULTS AND DISCUSSION
Growth characters like plant height and number ofbranches were improved by the priming treatments in boththe varieties evaluated however variety Bahar exhibitedmaximum plant height and number of branches irrespectiveof treatments (Table 1a and b). Among the primingtreatments, priming with GA3 increased maximum plantheight and number of branches followed by KNO3 and tapwater over unprimed control. Improvement in plant heightwas 6.01, 14.18 and 21.25% with tap water, KNO3 and GA3priming respectively over unprimed control. Similarly, thenumber of branches were also improved 10.85, 27.44 and54.20% with tap water, KNO3 and GA3 priming over unprimedcontrol.
Priming with various chemicals to seeds enhancesthe growth characters in field (Bose and Mishra, 1992 andBose, 1997) and this might be cause of enhancement insubsequent phases of plant growth. Bose and Mishra (1999and 2001) opened that during soaking of seed in Mg (NO3)2
1 0 Journal of Food Legumes 32(1), 2019
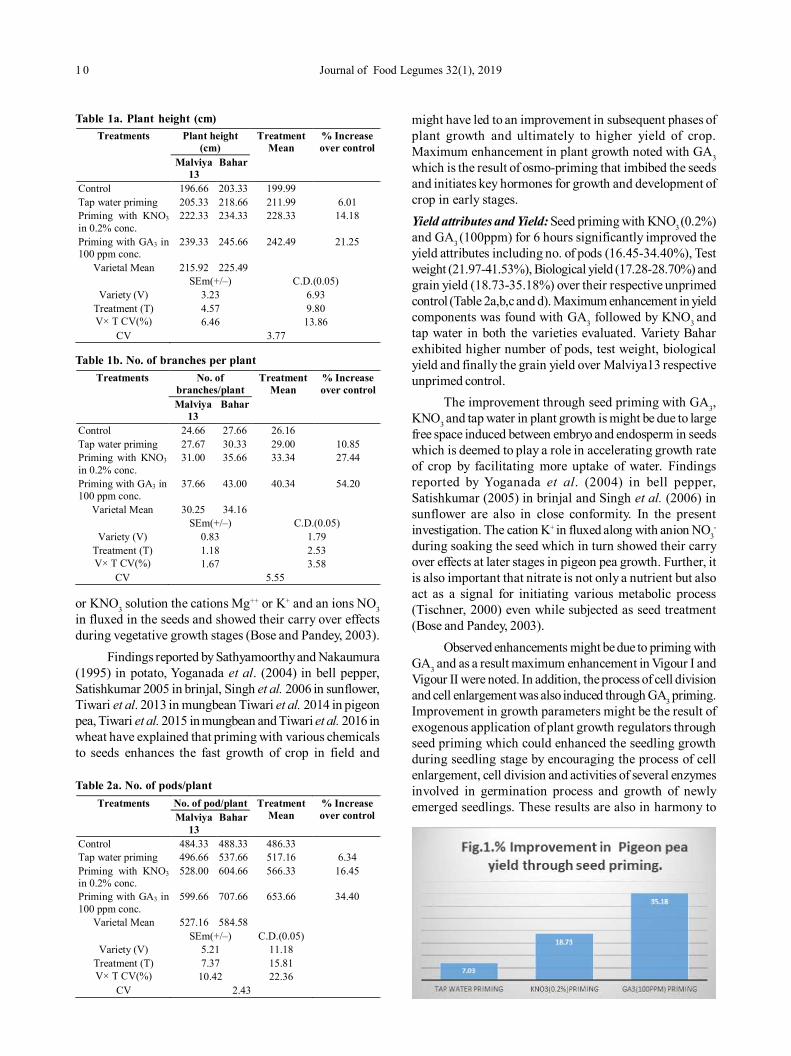
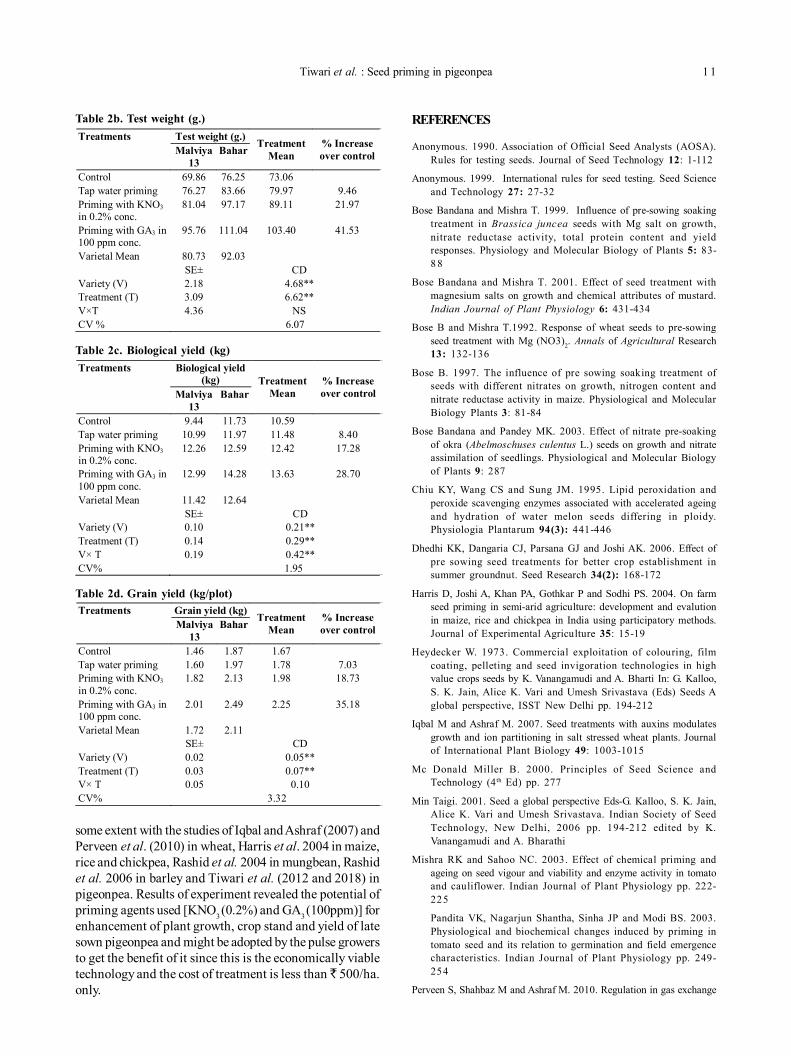
might have led to an improvement in subsequent phases ofplant growth and ultimately to higher yield of crop.Maximum enhancement in plant growth noted with GA3which is the result of osmo-priming that imbibed the seedsand initiates key hormones for growth and development ofcrop in early stages.Yield attributes and Yield: Seed priming with KNO3 (0.2%)and GA3 (100ppm) for 6 hours significantly improved theyield attributes including no. of pods (16.45-34.40%), Testweight (21.97-41.53%), Biological yield (17.28-28.70%) andgrain yield (18.73-35.18%) over their respective unprimedcontrol (Table 2a,b,c and d). Maximum enhancement in yieldcomponents was found with GA3 followed by KNO3 andtap water in both the varieties evaluated. Variety Baharexhibited higher number of pods, test weight, biologicalyield and finally the grain yield over Malviya13 respectiveunprimed control.
The improvement through seed priming with GA3,KNO3 and tap water in plant growth is might be due to largefree space induced between embryo and endosperm in seedswhich is deemed to play a role in accelerating growth rateof crop by facilitating more uptake of water. Findingsreported by Yoganada et al. (2004) in bell pepper,Satishkumar (2005) in brinjal and Singh et al. (2006) insunflower are also in close conformity. In the presentinvestigation. The cation K+ in fluxed along with anion NO3
-
during soaking the seed which in turn showed their carryover effects at later stages in pigeon pea growth. Further, itis also important that nitrate is not only a nutrient but alsoact as a signal for initiating various metabolic process(Tischner, 2000) even while subjected as seed treatment(Bose and Pandey, 2003).
Observed enhancements might be due to priming withGA3 and as a result maximum enhancement in Vigour I andVigour II were noted. In addition, the process of cell divisionand cell enlargement was also induced through GA3 priming.Improvement in growth parameters might be the result ofexogenous application of plant growth regulators throughseed priming which could enhanced the seedling growthduring seedling stage by encouraging the process of cellenlargement, cell division and activities of several enzymesinvolved in germination process and growth of newlyemerged seedlings. These results are also in harmony to
or KNO3 solution the cations Mg++ or K+ and an ions NO3in fluxed in the seeds and showed their carry over effectsduring vegetative growth stages (Bose and Pandey, 2003).
Findings reported by Sathyamoorthy and Nakaumura(1995) in potato, Yoganada et al. (2004) in bell pepper,Satishkumar 2005 in brinjal, Singh et al. 2006 in sunflower,Tiwari et al. 2013 in mungbean Tiwari et al. 2014 in pigeonpea, Tiwari et al. 2015 in mungbean and Tiwari et al. 2016 inwheat have explained that priming with various chemicalsto seeds enhances the fast growth of crop in field and
Table 1a. Plant height (cm)Treatments Plant height
(cm) Treatment
Mean % Increase over control
Malviya 13
Bahar
Control 196.66 203.33 199.99 Tap water priming 205.33 218.66 211.99 6.01 Priming with KNO3 in 0.2% conc.
222.33 234.33 228.33 14.18
Priming with GA3 in 100 ppm conc.
239.33 245.66 242.49 21.25
Varietal Mean 215.92 225.49 SEm(+/–) C.D.(0.05)
Variety (V) 3.23 6.93 Treatment (T) 4.57 9.80 V× T CV(%) 6.46 13.86
CV 3.77
Table 1b. No. of branches per plantTreatments No. of
branches/plant Treatment
Mean % Increase over control
Malviya 13
Bahar
Control 24.66 27.66 26.16 Tap water priming 27.67 30.33 29.00 10.85 Priming with KNO3 in 0.2% conc.
31.00 35.66 33.34 27.44
Priming with GA3 in 100 ppm conc.
37.66 43.00 40.34 54.20
Varietal Mean 30.25 34.16 SEm(+/–) C.D.(0.05)
Variety (V) 0.83 1.79 Treatment (T) 1.18 2.53 V× T CV(%) 1.67 3.58
CV 5.55
Table 2a. No. of pods/plantTreatments No. of pod/plant Treatment
Mean % Increase over control Malviya
13 Bahar
Control 484.33 488.33 486.33 Tap water priming 496.66 537.66 517.16 6.34 Priming with KNO3 in 0.2% conc.
528.00 604.66 566.33 16.45
Priming with GA3 in 100 ppm conc.
599.66 707.66 653.66 34.40
Varietal Mean 527.16 584.58 SEm(+/–) C.D.(0.05)
Variety (V) 5.21 11.18 Treatment (T) 7.37 15.81 V× T CV(%) 10.42 22.36
CV 2.43
Tiwari et al. : Seed priming in pigeonpea 1 1
some extent with the studies of Iqbal and Ashraf (2007) andPerveen et al. (2010) in wheat, Harris et al. 2004 in maize,rice and chickpea, Rashid et al. 2004 in mungbean, Rashidet al. 2006 in barley and Tiwari et al. (2012 and 2018) inpigeonpea. Results of experiment revealed the potential ofpriming agents used [KNO3 (0.2%) and GA3 (100ppm)] forenhancement of plant growth, crop stand and yield of latesown pigeonpea and might be adopted by the pulse growersto get the benefit of it since this is the economically viabletechnology and the cost of treatment is less than ̀ 500/ha.only.
REFERENCES
Anonymous. 1990. Association of Official Seed Analysts (AOSA).Rules for testing seeds. Journal of Seed Technology 12: 1-112
Anonymous. 1999. International rules for seed testing. Seed Scienceand Technology 27: 27-32
Bose Bandana and Mishra T. 1999. Influence of pre-sowing soakingtreatment in Brassica juncea seeds with Mg salt on growth,nitrate reductase activity, total protein content and yieldresponses. Physiology and Molecular Biology of Plants 5: 83-8 8
Bose Bandana and Mishra T. 2001. Effect of seed treatment withmagnesium salts on growth and chemical attributes of mustard.Indian Journal of Plant Physiology 6: 431-434
Bose B and Mishra T.1992. Response of wheat seeds to pre-sowingseed treatment with Mg (NO3)2. Annals of Agricultural Research13: 132-136
Bose B. 1997. The influence of pre sowing soaking treatment ofseeds with different nitrates on growth, nitrogen content andnitrate reductase activity in maize. Physiological and MolecularBiology Plants 3: 81-84
Bose Bandana and Pandey MK. 2003. Effect of nitrate pre-soakingof okra (Abelmoschuses culentus L.) seeds on growth and nitrateassimilation of seedlings. Physiological and Molecular Biologyof Plants 9: 287
Chiu KY, Wang CS and Sung JM. 1995. Lipid peroxidation andperoxide scavenging enzymes associated with accelerated ageingand hydration of water melon seeds differing in ploidy.Physiologia Plantarum 94(3): 441-446
Dhedhi KK, Dangaria CJ, Parsana GJ and Joshi AK. 2006. Effect ofpre sowing seed treatments for better crop establishment insummer groundnut. Seed Research 34(2): 168-172
Harris D, Joshi A, Khan PA, Gothkar P and Sodhi PS. 2004. On farmseed priming in semi-arid agriculture: development and evalutionin maize, rice and chickpea in India using participatory methods.Journal of Experimental Agriculture 35: 15-19
Heydecker W. 1973. Commercial exploitation of colouring, filmcoating, pelleting and seed invigoration technologies in highvalue crops seeds by K. Vanangamudi and A. Bharti In: G. Kalloo,S. K. Jain, Alice K. Vari and Umesh Srivastava (Eds) Seeds Aglobal perspective, ISST New Delhi pp. 194-212
Iqbal M and Ashraf M. 2007. Seed treatments with auxins modulatesgrowth and ion partitioning in salt stressed wheat plants. Journalof International Plant Biology 49: 1003-1015
Mc Donald Miller B. 2000. Principles of Seed Science andTechnology (4th Ed) pp. 277
Min Taigi. 2001. Seed a global perspective Eds-G. Kalloo, S. K. Jain,Alice K. Vari and Umesh Srivastava. Indian Society of SeedTechnology, New Delhi, 2006 pp. 194-212 edited by K.Vanangamudi and A. Bharathi
Mishra RK and Sahoo NC. 2003. Effect of chemical priming andageing on seed vigour and viability and enzyme activity in tomatoand cauliflower. Indian Journal of Plant Physiology pp. 222-225
Pandita VK, Nagarjun Shantha, Sinha JP and Modi BS. 2003.Physiological and biochemical changes induced by priming intomato seed and its relation to germination and field emergencecharacteristics. Indian Journal of Plant Physiology pp. 249-254
Perveen S, Shahbaz M and Ashraf M. 2010. Regulation in gas exchange
Table 2b. Test weight (g.)
Table 2c. Biological yield (kg)Treatments Biological yield
(kg) Treatment Mean
% Increase over control Malviya
13 Bahar
Control 9.44 11.73 10.59 Tap water priming 10.99 11.97 11.48 8.40 Priming with KNO3 in 0.2% conc.
12.26 12.59 12.42 17.28
Priming with GA3 in 100 ppm conc.
12.99 14.28 13.63 28.70
Varietal Mean 11.42 12.64 SE± CD Variety (V) 0.10 0.21** Treatment (T) 0.14 0.29** V× T 0.19 0.42** CV% 1.95
Treatments Test weight (g.) Treatment Mean
% Increase over control Malviya
13 Bahar
Control 69.86 76.25 73.06 Tap water priming 76.27 83.66 79.97 9.46 Priming with KNO3 in 0.2% conc.
81.04 97.17 89.11 21.97
Priming with GA3 in 100 ppm conc.
95.76 111.04 103.40 41.53
Varietal Mean 80.73 92.03 SE± CD Variety (V) 2.18 4.68** Treatment (T) 3.09 6.62** V×T 4.36 NS CV % 6.07
Table 2d. Grain yield (kg/plot)Treatments Grain yield (kg) Treatment
Mean % Increase over control Malviya
13 Bahar
Control 1.46 1.87 1.67 Tap water priming 1.60 1.97 1.78 7.03 Priming with KNO3 in 0.2% conc.
1.82 2.13 1.98 18.73
Priming with GA3 in 100 ppm conc.
2.01 2.49 2.25 35.18
Varietal Mean 1.72 2.11 SE± CD Variety (V) 0.02 0.05** Treatment (T) 0.03 0.07** V× T 0.05 0.10 CV% 3.32
1 2 Journal of Food Legumes 32(1), 2019
and quantum yield of photosystem II in salt stressed andnonstressed wheat plants raised from seed treatments withtriacontanol. Pakistan journal of Botany 42(5): 3073-3081
Rashid A, Harris D, Hollington PA and Raffiq M. 2004. Improvingthe yield of mungbean (Vigna radiata) in the North West frontierprovince of Pakistan using on-farm seed priming. Journal ofExperimental Agriculture 40: 233-244
Rashid A, Hollington PA, Harris D and Khan P. 2006. On-farm seedpriming for barley on normal, saline and saline-sodic soils inNorth West frontier province of Pakistan using on-farm seedpriming. European Journal of Agronomy 24: 276-281
Sathish kumar. 2005. Influence of pre-sowing seed treatment andseed pelleting on storability in brinjal (Solanum melongenaL.). M.Sc. (Agri.) Thesis, Univ. Agric. Sci., Dharwad.
Sathiyamoorthy P and Nakamura S. 1995. Effect of gibberellic acidand inorganic salts on breaking dormancy and enhancinggermination of true potato seed. Seed Research 23(1): 5-7
Singh Poonam, Singh V, Maurya CL, Swarnakar SK and Baipai VP.2006. Selection of suitable growth regulator and spacing forseed yield and quality of okra (Abelmoschuses culentus (L.)Moench) cv. KS 404. Seed Research 34(1): 61-65
Sung JM and Jeng TL. 1994. Lipid peroxidation and peroxide-scavenging enzymes associated with accelerated ageing of peanutseeds. Physiologia Plantarum 91(1): 51-55
Thakur AS and Thakur PS. 2006. Effect of pre-sowing treatmentson germination and seedling vigour in Dioscoreadeltoida. SeedResearch 34(2): 162-167
Tischner R. 2000. Nitrate uptake and reduction in higher and lowerplants. Plant Cell Environment 23(10): 1005-1024
Tiwari TN, Upadhyaya Neha, Kumar V and Prasad SR. 2012. Seedpriming induced enhancement in germination, vigour andgermination enzymes in pegionpea. Extended Summaries 3 rd
International Agronomy Congress Nov. 26-30, 2012, 2: 399-401
Tiwari TN, Kamal Dipti, Kumar V, Chaturvedi AK and Prasad SR.2013. Relative efficacy of in-organic salt as priming agent ongermination, vigour, nitrate assimilation and yield in mungbean.Seed Research 41(2): 180-189
Tiwari TN, Kamal Dipti, Singh RK and Prasad SR. 2014. Relativeefficacy of seed priming with potassium nitrate and tap water inrelation to germination, invigoration, growth, nitrateassimilation and yield of pegionpea (Cajanus cajan L.)Annals of Agricultural Research 35(2): 368-371
Tiwai TN, Kamal Dipti, Singh RK and Prasad SR. 2015. Plant growthregulators priming enhances seed quality and enzyme activity inmungbean (Vigna radiata L.). Annals of Agricultural Research36(4): 1-8
Tiwari TN, Kamal Dipti and Prasad SR. 2016. Seed priming withgrowth regulators ameliorates salt stress in wheat (Triticumaestivum). Indian Journal of Agricultural Sciences 86(8): 980-893
Tiwari TN, Upadhyay Neha and Prasad SR. 2018. Enhancement ofseed quality through seed priming in pigeon pea. Journal of FoodLegumes 31(2): 88-92
Yogananda DK, Vyakarnahal BS and Shekhargouda M. 2004. Effectof seed invigoration with growth regulations and micronutrientson germination and seedling vigour of bell pepper cv. CaliforniaWonder. Karnataka Journal of Agricultural Sciences 17(4): 811-813
Journal of Food Legumes 32(1): 13-15, 2019
ABSTRACT
Twenty faba bean (Vicia faba L.) genotypes were evaluatedduring rabi seasons of 2015-16 and 2016-17 for twelve yieldand attributing traits with an objective to determine theextent of variability in faba bean genotypes and therelationship between yield and other characters. Seed yieldhave significant correlation with all the traits except 100-seed weight (g), indicating that breeding for yield attributessignificantly affect yield in these genotypes. Stepwisemultiple regression analysis indicated that number of podsper plant and days to maturity play significant role indetermining seed yield in faba beans. The three principalcomponents with eigen values greater than one contributed75.20% of the total variability amongst twenty faba beangenotypes evaluated. There is an ample scope forimprovement of yield and other associated charactersespecially, number of branches per plant, number of podsper plant and pod width in faba bean. These traits should beused while selecting elite genotypes of fababeans.
Key words: Correlation, Faba bean, Principal componentanalysis, Regression, Yield
Faba bean (Vicia faba L.) is one of the most importantlegume crops used as food for human consumption indeveloping countries and as animal feed in developedcountries (Sainte, 2011). It is the fourth important pulsecrop in the world after common bean, peas and chickpeas(Kumari and Van Leur, 2011). Faba bean is also referred toas broad bean, horse bean and field bean. The crop has amultipurpose use and is consumed as dry seeds, greenvegetable, or as processed food. Its products are richsource of high-quality protein (24-33%) in the human diet,while its dry seeds, green haulm and dry straw are used asanimal feeds (Sainte, 2011). It is a good source of lysinerich protein and levadopa (L-dopa), a precursor ofdopamine, which can be potentially used as medicine forthe treatment of Parkinson’s disease (Oplinger, 1982; Veredet al. 1997). Faba bean varieties that are used for humannutrition belong to the V. faba major botanically whereasthe V. faba minor and V. faba equina are botanical typesused for animal feeding (Martin et al. 1991).
Probably faba beans are among one of the bestperforming crops under global warming and climate changescenario due to its unique ability to excel under almost alltypes of climatic conditions coupled with wide adoptabilityto a range of soil conditions. Faba bean being incredible
Principal component analysis for yield and yield traits in faba bean (Vicia fabaL.)JK TIWARI1 and AK SINGH2
1RMD College of Agriculture and Research Station, Ambikapur, Chhattisgarh, 2Indira Gandhi KrishiVishwavidyalaya, Raipur Chhattisgarh; Email: [email protected](Received : July 17, 2018 ; Accepted : October 23, 2018)
and crop complete food, unfortunately some part of worldincluding India, it is still underutilized crop and not fullyexploited so far, though it is seen as an agronomically viablealternative crop to cereal, with a potential of fixing freenitrogen upto 300 kg N/ ha (Singh et al. 2013). There is aneed to improve its yield potential and make it moreacceptable to country. In the present study, differencesamong the faba bean genotypes has been assessed on thebasis of multivariate analysis so that to identify bettergenotypes for future breeding programs.
MATERIALS AND METHODS
A field experiment was carried out at Research Farmof Raj Mohini Devi College of Agriculture and ResearchStation, Ambikapur (Chhattisgarh) during the rabi seasonsof 2015 and 2016. Twenty faba bean genotypes under AllIndia Coordinated research network project on potentialcrops were used in the present study (DFB 8-12, HB 27, HB45, HB 11-12, HB 11-15, HB 11-30, HB 11-32, HB 11-38, HB8-12, HB 9-01, HB 9-15, HB 9-16, NDFB 13, NDFB 14, NDFB15, NDFB 15-1, RFB 11, RFB 12, RFB 13 and Vikrant as‘Check’). The experiment was laid out in a randomized blockdesign with four replications at the spacing of 45cmbetween rows and 15cm between plant to plant. A plot sizeof 4m x 2.7m was kept for each genotype and all therecommended package of practices for the region werefollowed to raise a good crop (Annual report Potential crops,2014). Five randomly selected plants of each genotype fromeach replication were used for recording of data on elevenyield and yield attributing characters namely, days to 50%flowering, days to maturity, Plant population per plot, plantheight (cm), number of branches per plant, number of podsper plants, pod length (mm), pod width (mm), number ofseeds per pods, 100-seed weight (g), seed yield (kg perplot) and seed yield (kg/ha). Data were analyzed bynumerical taxonomic techniques using the procedure forprincipal component analysis with the help of computersoftware STAR 2.0.1 for windows.
RESULTS AND DISCUSSION
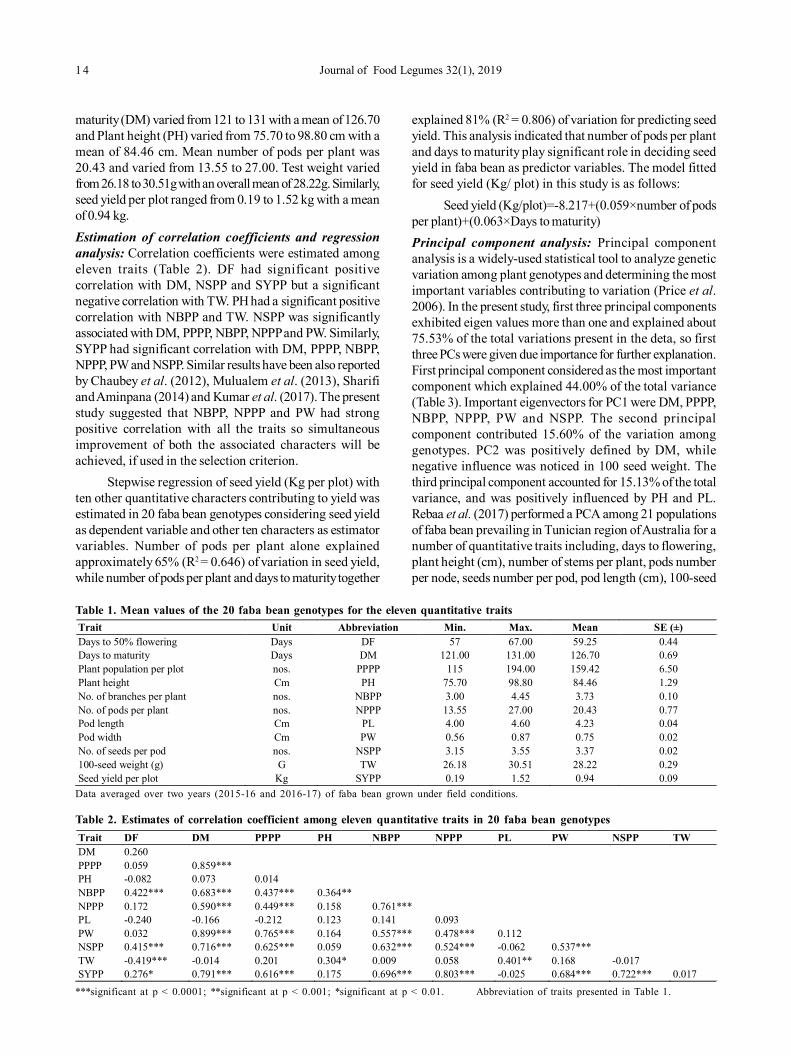
The overall means for the eleven traits across 20 fababean genotypes have been presented in Table 1, whichshowed a wide range of variation among the genotypes foreach trait. Among 20 genotypes, days to 50 % flowering(DF) varied from 57 to 67 with a mean of 59.25, Days to
1 4 Journal of Food Legumes 32(1), 2019
maturity (DM) varied from 121 to 131 with a mean of 126.70and Plant height (PH) varied from 75.70 to 98.80 cm with amean of 84.46 cm. Mean number of pods per plant was20.43 and varied from 13.55 to 27.00. Test weight variedfrom 26.18 to 30.51g with an overall mean of 28.22g. Similarly,seed yield per plot ranged from 0.19 to 1.52 kg with a meanof 0.94 kg.Estimation of correlation coefficients and regressionanalysis: Correlation coefficients were estimated amongeleven traits (Table 2). DF had significant positivecorrelation with DM, NSPP and SYPP but a significantnegative correlation with TW. PH had a significant positivecorrelation with NBPP and TW. NSPP was significantlyassociated with DM, PPPP, NBPP, NPPP and PW. Similarly,SYPP had significant correlation with DM, PPPP, NBPP,NPPP, PW and NSPP. Similar results have been also reportedby Chaubey et al. (2012), Mulualem et al. (2013), Sharifiand Aminpana (2014) and Kumar et al. (2017). The presentstudy suggested that NBPP, NPPP and PW had strongpositive correlation with all the traits so simultaneousimprovement of both the associated characters will beachieved, if used in the selection criterion.
Stepwise regression of seed yield (Kg per plot) withten other quantitative characters contributing to yield wasestimated in 20 faba bean genotypes considering seed yieldas dependent variable and other ten characters as estimatorvariables. Number of pods per plant alone explainedapproximately 65% (R2 = 0.646) of variation in seed yield,while number of pods per plant and days to maturity together
explained 81% (R2 = 0.806) of variation for predicting seedyield. This analysis indicated that number of pods per plantand days to maturity play significant role in deciding seedyield in faba bean as predictor variables. The model fittedfor seed yield (Kg/ plot) in this study is as follows:
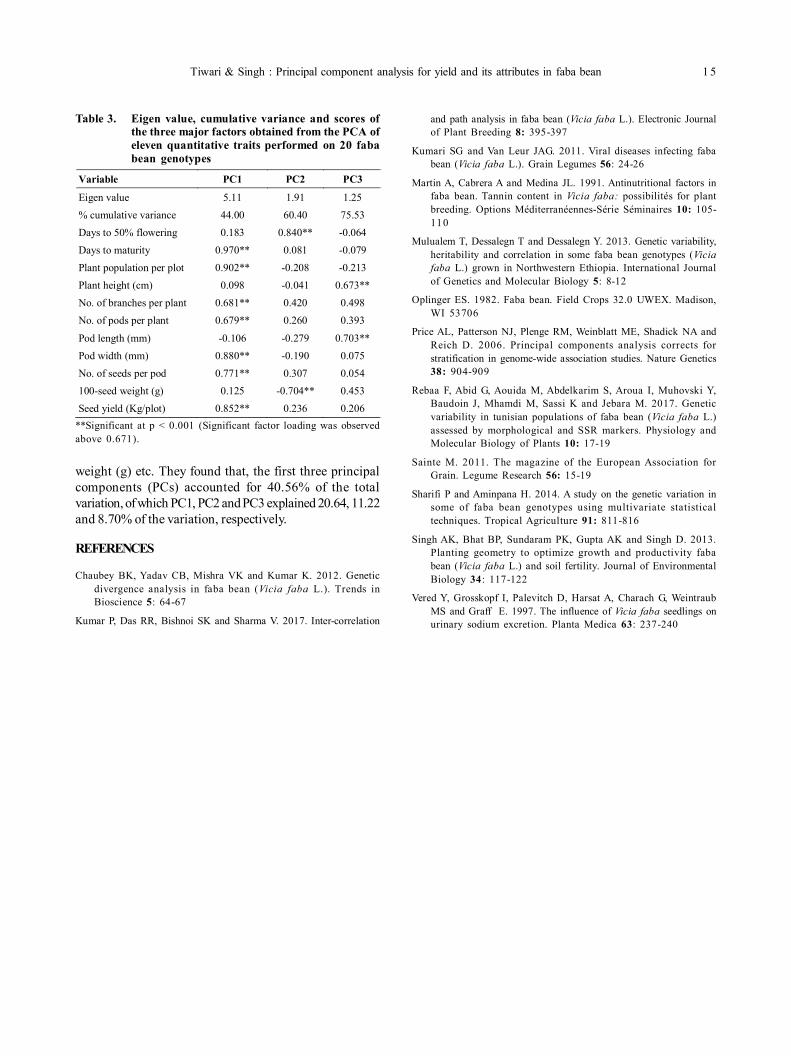
Seed yield (Kg/plot)=-8.217+(0.059×number of podsper plant)+(0.063×Days to maturity)Principal component analysis: Principal componentanalysis is a widely-used statistical tool to analyze geneticvariation among plant genotypes and determining the mostimportant variables contributing to variation (Price et al.2006). In the present study, first three principal componentsexhibited eigen values more than one and explained about75.53% of the total variations present in the deta, so firstthree PCs were given due importance for further explanation.First principal component considered as the most importantcomponent which explained 44.00% of the total variance(Table 3). Important eigenvectors for PC1 were DM, PPPP,NBPP, NPPP, PW and NSPP. The second principalcomponent contributed 15.60% of the variation amonggenotypes. PC2 was positively defined by DM, whilenegative influence was noticed in 100 seed weight. Thethird principal component accounted for 15.13% of the totalvariance, and was positively influenced by PH and PL.Rebaa et al. (2017) performed a PCA among 21 populationsof faba bean prevailing in Tunician region of Australia for anumber of quantitative traits including, days to flowering,plant height (cm), number of stems per plant, pods numberper node, seeds number per pod, pod length (cm), 100-seed
Table 1. Mean values of the 20 faba bean genotypes for the eleven quantitative traits
Data averaged over two years (2015-16 and 2016-17) of faba bean grown under field conditions.
Trait Unit Abbreviation Min. Max. Mean SE (±) Days to 50% flowering Days DF 57 67.00 59.25 0.44 Days to maturity Days DM 121.00 131.00 126.70 0.69 Plant population per plot nos. PPPP 115 194.00 159.42 6.50 Plant height Cm PH 75.70 98.80 84.46 1.29 No. of branches per plant nos. NBPP 3.00 4.45 3.73 0.10 No. of pods per plant nos. NPPP 13.55 27.00 20.43 0.77 Pod length Cm PL 4.00 4.60 4.23 0.04 Pod width Cm PW 0.56 0.87 0.75 0.02 No. of seeds per pod nos. NSPP 3.15 3.55 3.37 0.02 100-seed weight (g) G TW 26.18 30.51 28.22 0.29 Seed yield per plot Kg SYPP 0.19 1.52 0.94 0.09
Table 2. Estimates of correlation coefficient among eleven quantitative traits in 20 faba bean genotypes
***significant at p < 0.0001; **significant at p < 0.001; *significant at p < 0.01. Abbreviation of traits presented in Table 1.
Trait DF DM PPPP PH NBPP NPPP PL PW NSPP TW DM 0.260 PPPP 0.059 0.859*** PH -0.082 0.073 0.014 NBPP 0.422*** 0.683*** 0.437*** 0.364** NPPP 0.172 0.590*** 0.449*** 0.158 0.761*** PL -0.240 -0.166 -0.212 0.123 0.141 0.093 PW 0.032 0.899*** 0.765*** 0.164 0.557*** 0.478*** 0.112 NSPP 0.415*** 0.716*** 0.625*** 0.059 0.632*** 0.524*** -0.062 0.537*** TW -0.419*** -0.014 0.201 0.304* 0.009 0.058 0.401** 0.168 -0.017 SYPP 0.276* 0.791*** 0.616*** 0.175 0.696*** 0.803*** -0.025 0.684*** 0.722*** 0.017
Tiwari & Singh : Principal component analysis for yield and its attributes in faba bean 1 5
Table 3. Eigen value, cumulative variance and scores ofthe three major factors obtained from the PCA ofeleven quantitative traits performed on 20 fababean genotypes
**Significant at p < 0.001 (Significant factor loading was observedabove 0.671).
Variable PC1 PC2 PC3
Eigen value 5.11 1.91 1.25 % cumulative variance 44.00 60.40 75.53 Days to 50% flowering 0.183 0.840** -0.064 Days to maturity 0.970** 0.081 -0.079 Plant population per plot 0.902** -0.208 -0.213 Plant height (cm) 0.098 -0.041 0.673** No. of branches per plant 0.681** 0.420 0.498 No. of pods per plant 0.679** 0.260 0.393
Pod length (mm) -0.106 -0.279 0.703** Pod width (mm) 0.880** -0.190 0.075 No. of seeds per pod 0.771** 0.307 0.054 100-seed weight (g) 0.125 -0.704** 0.453 Seed yield (Kg/plot) 0.852** 0.236 0.206
weight (g) etc. They found that, the first three principalcomponents (PCs) accounted for 40.56% of the totalvariation, of which PC1, PC2 and PC3 explained 20.64, 11.22and 8.70% of the variation, respectively.
REFERENCES
Chaubey BK, Yadav CB, Mishra VK and Kumar K. 2012. Geneticdivergence analysis in faba bean (Vicia faba L.). Trends inBioscience 5: 64-67
Kumar P, Das RR, Bishnoi SK and Sharma V. 2017. Inter-correlation
and path analysis in faba bean (Vicia faba L.). Electronic Journalof Plant Breeding 8: 395-397
Kumari SG and Van Leur JAG. 2011. Viral diseases infecting fababean (Vicia faba L.). Grain Legumes 56: 24-26
Martin A, Cabrera A and Medina JL. 1991. Antinutritional factors infaba bean. Tannin content in Vicia faba: possibilités for plantbreeding. Options Méditerranéennes-Série Séminaires 10: 105-110
Mulualem T, Dessalegn T and Dessalegn Y. 2013. Genetic variability,heritability and correlation in some faba bean genotypes (Viciafaba L.) grown in Northwestern Ethiopia. International Journalof Genetics and Molecular Biology 5: 8-12
Oplinger ES. 1982. Faba bean. Field Crops 32.0 UWEX. Madison,WI 53706
Price AL, Patterson NJ, Plenge RM, Weinblatt ME, Shadick NA andReich D. 2006. Principal components analysis corrects forstratification in genome-wide association studies. Nature Genetics38: 904-909
Rebaa F, Abid G, Aouida M, Abdelkarim S, Aroua I, Muhovski Y,Baudoin J, Mhamdi M, Sassi K and Jebara M. 2017. Geneticvariability in tunisian populations of faba bean (Vicia faba L.)assessed by morphological and SSR markers. Physiology andMolecular Biology of Plants 10: 17-19
Sainte M. 2011. The magazine of the European Association forGrain. Legume Research 56: 15-19
Sharifi P and Aminpana H. 2014. A study on the genetic variation insome of faba bean genotypes using multivariate statisticaltechniques. Tropical Agriculture 91: 811-816
Singh AK, Bhat BP, Sundaram PK, Gupta AK and Singh D. 2013.Planting geometry to optimize growth and productivity fababean (Vicia faba L.) and soil fertility. Journal of EnvironmentalBiology 34: 117-122
Vered Y, Grosskopf I, Palevitch D, Harsat A, Charach G, WeintraubMS and Graff E. 1997. The influence of Vicia faba seedlings onurinary sodium excretion. Planta Medica 63: 237-240
Journal of Food Legumes 32(1): 16-18, 2019
ABSTRACT
A field experiments was conducted during three consecutiverabi seasons of 2013-14, 2014-15 and 2015-16 to study theeffect, net of spatial arrangements of chickpea and linseedon yield, net returns and LER; and to find out the mostoptimum chickpea + linseed row ratio. The results revealedthat maximum pooled chickpea equivalent yield (20.72 q/ha), mean gross, net and B:C ratio (` 109934, 82404 and3.40) and LER (1.17) were recorded under chickpea + linseedin 5:1 row ratio. This was closely followed by 5:2 row ratio(20.18q/ha). The pooled mean increases in chickpeaequivalent yields due to 5:1 and 5:2 row ratios were 15.9 and21.0 per cent and 12.9 and 17.8 per cent, respectively oversole chickpea and sole linseed. The least % pod damage(5.80) was that of observed in 3:2 row ratio which was staticallyat par with 4:2 (T7) and 5:2 (T8). However, these weresignificantly superior over 3:1 (T3), 4:1 (T4), 5:1 (T5) andsole chickpea (T1).
Key word: B:C Ratio, Chickpea, Intercropping, Lentil
Chickpea is one of the most important pulse crops inIndia. It is an important constituent of Indian vegetariandiet. It is also an integral part of cropping system forsustainable agricultural production. Inspite of itsmultifarious advantages, its productivity is poor due toseveral biotic and abiotic factors. Cultivation of linseed isgaining momentum due to increase in awareness amongurban population about their health. Both these crops mayform a perfect combination for improving their productivityand profitability. Intercropping offers an excellentopportunity in sustaining their production through the bestuse of available resources and inputs by minimizingcompetition and by providing a barrier to the entry of manybiotic pests. Keeping in view, the present study wasundertaken to select an appropriate row ratio ofchickpea+linseed under irrigated conditions of semi-arideastern plain zone of Rajasthan and to evaluate their effecton yield and pod damage along with their economics.
MATERIALS AND METHODS
The field experiment was conducted during threeconsecutive rabi seasons of 2013-14, 2014-15 and 2015-16at research farm of Rajasthan Agricultural ResearchInstitute, Durgapura, Jaipur, Rajasthan. The soil type ofthe experimental site was sandy loam with sand (86.8%),silt (5.6%), clay (7.6%), pH 7.8, 0.17 % organic carbon and
Effect of spatial arrangement of chickpea (Cicer arietinum L.) and linseed (Linumusitatisimum L.) on their yields, net returns and pod damage of chickpeaKC GUPTA, VIPEN KUMAR, CS PRAHARAJ1 and PC BAIRWA
Rajasthan Agricultural Research Institute, Durgapura, Jaipur, Rajasthan, India; 1ICAR-Indian Institute of PulsesResearch, Kanpur, India 208024; E-mail: [email protected](Received : July 12, 2018 ; Accepted : November 16, 2018)
139.2, 36.6 and 238.0 kg/ha available N, P2O5 and K2O,respectively. The present experiment comprising eighttreatments viz., sole crops of chickpea (RSG 973) and linseed(Parvati) and six intercropping systems of chickpea + linseedin 3:1, 4:1, 5:1, 3:2, 4:2, 5:2 row ratio were evaluated inrandomized block design with three replications. The cropswas sown on 5.11.2013 and 9.11.2014 and 8.11.2015 at acrop geometry of 30 x 10cm. The experimental crops werefertilized@20kg N+40kg P2O5/ha as per the recommendation.The yield was used to compute different parameters likeland equivalent ratio (LER), gross and net monetary returnsand B:C ratio for each treatment as suggested by Willey(1979). Per cent pod damage was recorded from fiverandomly selected plants per plot by counting total numberof pods and damage pods.
RESULTS AND DISCUSSION
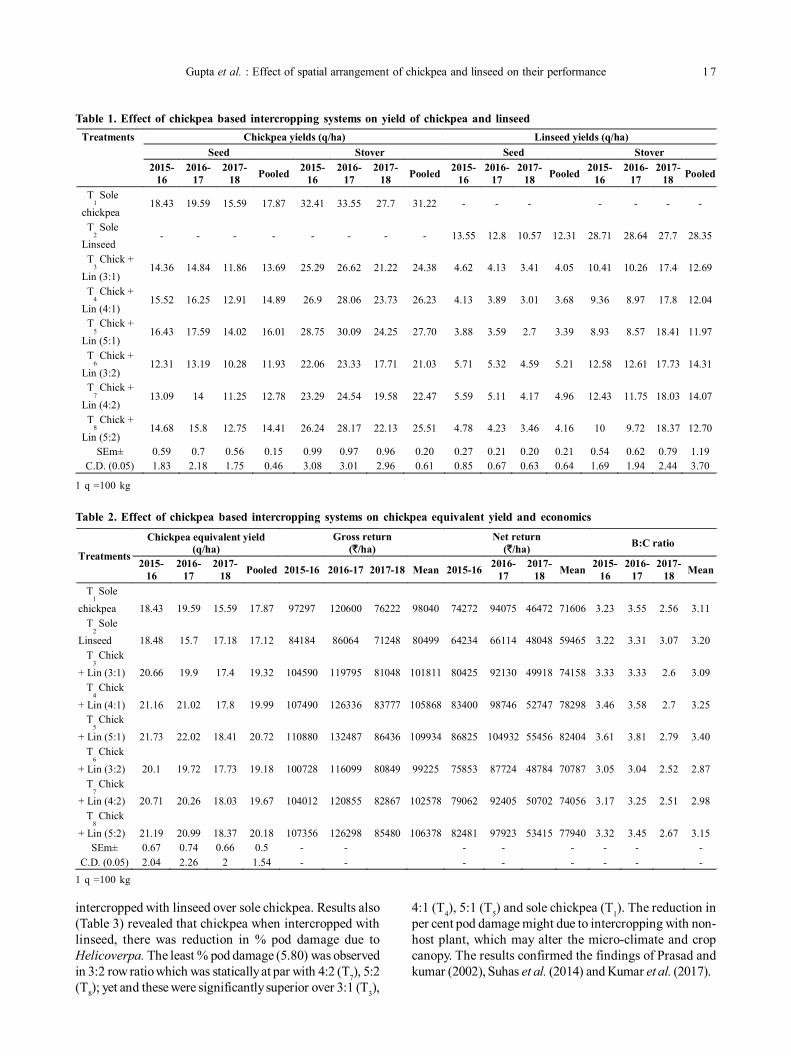
The highest chickpea equivalent yield (21.7, 22.0, 18.4q/ha) was recorded under chickpea + linseed in 5:1 rowratio (T5) and was closely followed by 5:2 row ratio (T8) and4:1 row ratio (T4) during all the years of experimentation.Similarly maximum pooled chickpea equivalent yield (20.72q/ha ) was recorded under treatment T5 which was againclosely followed by treatment T8 ; and were statistically atpar with all the treatments of intercropping. And it was yetsignificantly superior over sole chickpea (T1) and solelinseed (T2). The pooled mean increases in chickpeaequivalent yield due to T5 and T8 were 15.9 and 21.0 percent and 12.9 and 17.8 per cent over sole chickpea (T1) andsole linseed (T2), respectively. Similarly, the maximum meangross, net returns and B:C ratio (` 109934, 82404/ha and3.40) were also obtained under treatment T5 and the leastwere recorded under sole linseed (T2). Further, all theintercropping systems proved significantly superior interms of pooled LER values over sole crops of chickpeaand linseed. The maximum LER (1.17) was recorded under5:1 row ratio which was significantly superior over resttreatments followed by 5:2 row ratio (1.14). The increasesin chickpea equivalent yield under intercropping systemscould be attributed to favorable microclimatic conditionswhich favored better crop growth and ultimately yield.Significantly higher system productivity of chickpea+linseed intercropping to the extent of 43.4% over that ofsole chickpea was also recorded by Ahlawat and Gangaiah(2010). Hossain et al. (2000) and Singh and Pandey (2002)also observed better performance of chickpea when
Gupta et al. : Effect of spatial arrangement of chickpea and linseed on their performance 1 7
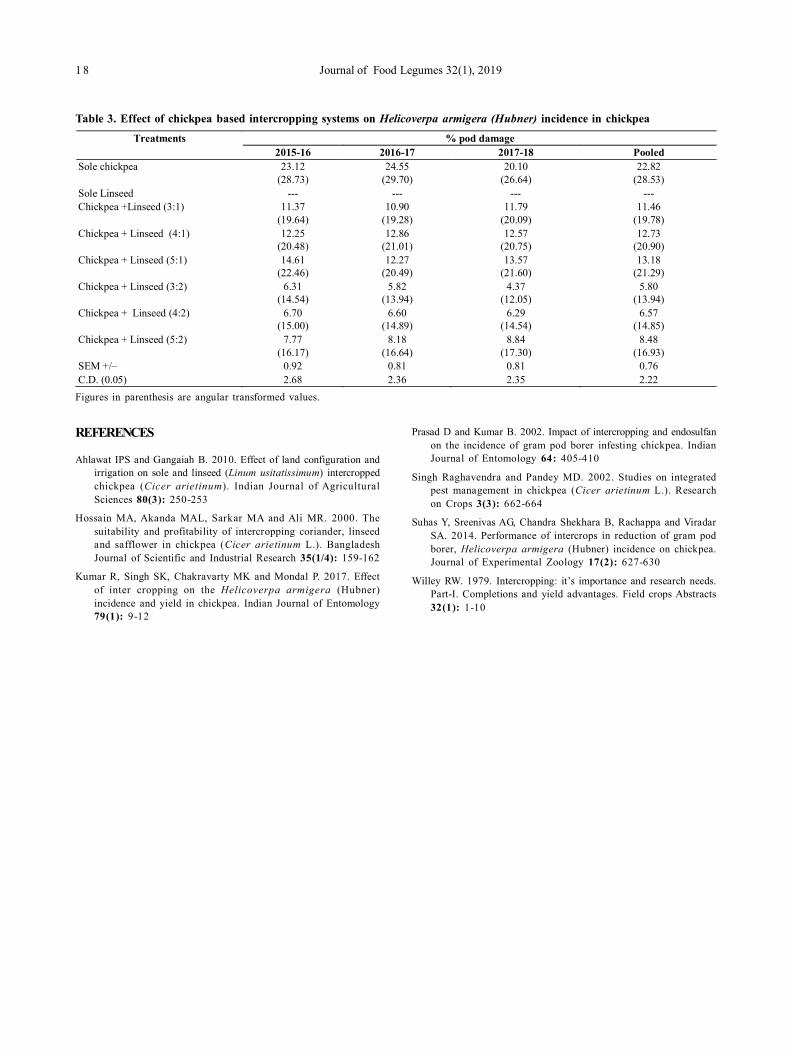
intercropped with linseed over sole chickpea. Results also(Table 3) revealed that chickpea when intercropped withlinseed, there was reduction in % pod damage due toHelicoverpa. The least % pod damage (5.80) was observedin 3:2 row ratio which was statically at par with 4:2 (T7), 5:2(T8); yet and these were significantly superior over 3:1 (T3),
Table 1. Effect of chickpea based intercropping systems on yield of chickpea and linseedTreatments Chickpea yields (q/ha) Linseed yields (q/ha)
Seed Stover Seed Stover 2015-
16 2016-
17 2017-
18 Pooled 2015-16
2016-17
2017-18 Pooled 2015-
16 2016-
17 2017-
18 Pooled 2015-16
2016-17
2017-18 Pooled
T1 Sole
chickpea 18.43 19.59 15.59 17.87 32.41 33.55 27.7 31.22 - - - - - - -
T2 Sole
Linseed - - - - - - - - 13.55 12.8 10.57 12.31 28.71 28.64 27.7 28.35
T3 Chick +
Lin (3:1) 14.36 14.84 11.86 13.69 25.29 26.62 21.22 24.38 4.62 4.13 3.41 4.05 10.41 10.26 17.4 12.69
T4 Chick +
Lin (4:1) 15.52 16.25 12.91 14.89 26.9 28.06 23.73 26.23 4.13 3.89 3.01 3.68 9.36 8.97 17.8 12.04
T5 Chick +
Lin (5:1) 16.43 17.59 14.02 16.01 28.75 30.09 24.25 27.70 3.88 3.59 2.7 3.39 8.93 8.57 18.41 11.97
T6 Chick +
Lin (3:2) 12.31 13.19 10.28 11.93 22.06 23.33 17.71 21.03 5.71 5.32 4.59 5.21 12.58 12.61 17.73 14.31
T7 Chick +
Lin (4:2) 13.09 14 11.25 12.78 23.29 24.54 19.58 22.47 5.59 5.11 4.17 4.96 12.43 11.75 18.03 14.07
T8 Chick +
Lin (5:2) 14.68 15.8 12.75 14.41 26.24 28.17 22.13 25.51 4.78 4.23 3.46 4.16 10 9.72 18.37 12.70
SEm± 0.59 0.7 0.56 0.15 0.99 0.97 0.96 0.20 0.27 0.21 0.20 0.21 0.54 0.62 0.79 1.19 C.D. (0.05) 1.83 2.18 1.75 0.46 3.08 3.01 2.96 0.61 0.85 0.67 0.63 0.64 1.69 1.94 2.44 3.70
Table 2. Effect of chickpea based intercropping systems on chickpea equivalent yield and economics
Treatments
Chickpea equivalent yield (q/ha)
Gross return (`/ha)
Net return (`/ha) B:C ratio
2015-16
2016-17
2017-18 Pooled 2015-16 2016-17 2017-18 Mean 2015-16 2016-
17 2017-
18 Mean 2015-16
2016-17
2017-18 Mean
T1 Sole
chickpea 18.43 19.59 15.59 17.87 97297 120600 76222 98040 74272 94075 46472 71606 3.23 3.55 2.56 3.11 T
2 Sole
Linseed 18.48 15.7 17.18 17.12 84184 86064 71248 80499 64234 66114 48048 59465 3.22 3.31 3.07 3.20 T
3 Chick
+ Lin (3:1) 20.66 19.9 17.4 19.32 104590 119795 81048 101811 80425 92130 49918 74158 3.33 3.33 2.6 3.09 T
4 Chick
+ Lin (4:1) 21.16 21.02 17.8 19.99 107490 126336 83777 105868 83400 98746 52747 78298 3.46 3.58 2.7 3.25 T
5 Chick
+ Lin (5:1) 21.73 22.02 18.41 20.72 110880 132487 86436 109934 86825 104932 55456 82404 3.61 3.81 2.79 3.40 T
6 Chick
+ Lin (3:2) 20.1 19.72 17.73 19.18 100728 116099 80849 99225 75853 87724 48784 70787 3.05 3.04 2.52 2.87 T
7 Chick
+ Lin (4:2) 20.71 20.26 18.03 19.67 104012 120855 82867 102578 79062 92405 50702 74056 3.17 3.25 2.51 2.98 T
8 Chick
+ Lin (5:2) 21.19 20.99 18.37 20.18 107356 126298 85480 106378 82481 97923 53415 77940 3.32 3.45 2.67 3.15 SEm± 0.67 0.74 0.66 0.5 - - - - - - - -
C.D. (0.05) 2.04 2.26 2 1.54 - - - - - - - -
4:1 (T4), 5:1 (T5) and sole chickpea (T1). The reduction inper cent pod damage might due to intercropping with non-host plant, which may alter the micro-climate and cropcanopy. The results confirmed the findings of Prasad andkumar (2002), Suhas et al. (2014) and Kumar et al. (2017).
1 q =100 kg
1 q =100 kg
1 8 Journal of Food Legumes 32(1), 2019
REFERENCES
Ahlawat IPS and Gangaiah B. 2010. Effect of land configuration andirrigation on sole and linseed (Linum usitatissimum) intercroppedchickpea (Cicer arietinum). Indian Journal of AgriculturalSciences 80(3): 250-253
Hossain MA, Akanda MAL, Sarkar MA and Ali MR. 2000. Thesuitability and profitability of intercropping coriander, linseedand safflower in chickpea (Cicer arietinum L.). BangladeshJournal of Scientific and Industrial Research 35(1/4): 159-162
Kumar R, Singh SK, Chakravarty MK and Mondal P. 2017. Effectof inter cropping on the Helicoverpa armigera (Hubner)incidence and yield in chickpea. Indian Journal of Entomology79(1): 9-12
Table 3. Effect of chickpea based intercropping systems on Helicoverpa armigera (Hubner) incidence in chickpea
Figures in parenthesis are angular transformed values.
Treatments % pod damage 2015-16 2016-17 2017-18 Pooled
Sole chickpea 23.12 (28.73)
24.55 (29.70)
20.10 (26.64)
22.82 (28.53)
Sole Linseed --- --- --- --- Chickpea +Linseed (3:1) 11.37
(19.64) 10.90
(19.28) 11.79
(20.09) 11.46
(19.78) Chickpea + Linseed (4:1) 12.25
(20.48) 12.86
(21.01) 12.57
(20.75) 12.73
(20.90) Chickpea + Linseed (5:1) 14.61
(22.46) 12.27
(20.49) 13.57
(21.60) 13.18
(21.29) Chickpea + Linseed (3:2) 6.31
(14.54) 5.82
(13.94) 4.37
(12.05) 5.80
(13.94) Chickpea + Linseed (4:2) 6.70
(15.00) 6.60
(14.89) 6.29
(14.54) 6.57
(14.85) Chickpea + Linseed (5:2) 7.77
(16.17) 8.18
(16.64) 8.84
(17.30) 8.48
(16.93) SEM +/– 0.92 0.81 0.81 0.76 C.D. (0.05) 2.68 2.36 2.35 2.22
Prasad D and Kumar B. 2002. Impact of intercropping and endosulfanon the incidence of gram pod borer infesting chickpea. IndianJournal of Entomology 64: 405-410
Singh Raghavendra and Pandey MD. 2002. Studies on integratedpest management in chickpea (Cicer arietinum L.). Researchon Crops 3(3): 662-664
Suhas Y, Sreenivas AG, Chandra Shekhara B, Rachappa and ViradarSA. 2014. Performance of intercrops in reduction of gram podborer, Helicoverpa armigera (Hubner) incidence on chickpea.Journal of Experimental Zoology 17(2): 627-630
Willey RW. 1979. Intercropping: it’s importance and research needs.Part-I. Completions and yield advantages. Field crops Abstracts32(1): 1-10
Journal of Food Legumes 32(1): 19-22, 2019
ABSTRACT
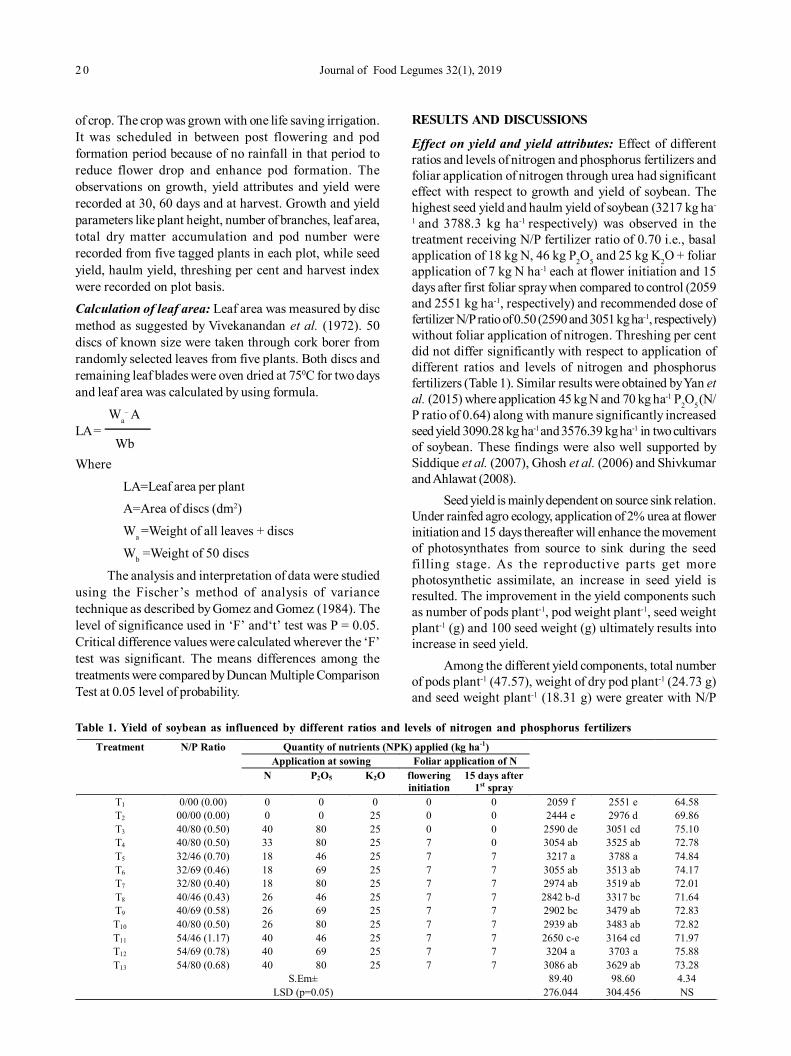
A field experiment was carried out during kharif 2015 withthirteen ratios of nitrogen and phosphorus fertilizers withconstant potassium level (25 kg K2O ha-1) on soybean cultivarDSb 21 at MARS, UAS, Dharwad. The seed yield increaseddue to increasing N/P ratios up to 0.78. The treatmentreceiving N/P fertilizer ratio of 0.70 (basal application of 18kg N, 46 kg P2O5, 25 kg K2O ha-1 + foliar application ofnitrogen@7 kg N ha-1 at initiation of flowering and foliarapplication of nitrogen@7 kg N ha-1 at 15 days after firstfoliar spray) recorded significantly higher seed yield (3217kg ha-1), total number of pods plant-1 (47.57), 100 seed weight(15.40 g) and seed weight plant-1 (18.31 g). This treatmentalso recorded significantly higher leaf area plant-1 (12.62dm2), leaf area index (4.21) and total dry matter production(34.15 g)
Key words: Fertilizer ratio, Foliar application, Leaf area,Rainfed, Seed yield
Soybean (Glycine max L. Merrill), a species of grainlegume called as the “GOLDEN BEAN” of the 20th centuryis widely grown for its edible bean having numerous uses.Soybean is considered as a wonder crop due to its dualqualities viz., high protein (40-43%) and oil content (20%).In addition, soybean protein has 5% lysine which isdeficient in most cereals. In India, area under soybean cropis about 10.33 M ha with annual production of 8.91 Mt withan average productivity of 983 kg ha -1 (Anon., 2015) whichis much less than world average despite it is introduced inIndia during 1880. In Karnataka, soybean crop is cultivatedin an area of 0.2 lakh ha with an annual production of 0.22Mt and productivity of 1103 kg ha-1.
Among the factors responsible for low productivity,unbalanced fertilizer use lead to emergence of multiple-nutrient deficiencies. (The crop is often subjected to bothwater logging and soil moisture deficit in the growingseason.) Many a times even with normal distribution ofrainfall, crop suffers from excess soil moisture during peakflowering and pod development stages which leads todeficiency of certain nutrients, particularly nitrogen, resultedin low productivity. Application of small amounts of fertilizerN at sowing time as a starter dose of the crop improves thebiological nitrogen fixation, whereas heavy doses of Nreduces the efficacy of BNF leading to lower yield throughexcessive vegetative growth. To assure continuous Nsupply to the crop and to improve its efficiency, split
Growth and yield of soybean as influenced by of graded nitrogen and phosphorusdose or under rainfed situationsSATYABRATA MANGARAJ, LH MALLIGAWAD1, SADHANA V1, PAIKARAY RK1 and SAHOO TR1
Odisha University of Agriculture and Technology, Bhubaneswar; 1University of Agricultural Sciences, Dharwad;E-mail: [email protected](Received : February 01, 2017 ; Accepted : June 20, 2017)
application of N may be helpful for raising crop yield andreduce soil and water pollution due to leaching. Phosphorusis also a critical nutrient, both in respect of its supply andavailability in the soil. It is also reported that poor responseto the application of higher rates of inorganic phosphorusfertilizers was noticed in the soils with medium to highavailable phosphorus contents. Optimum nitrogen andphosphorus ratios applied N as basal and foliar applicationin soybean crop under rainfed situation is lacking.
Therefore, studies on productivity of soybean asinfluenced by ratios and levels of nitrogen and phosphoruswere carried out in medium black clay soil of NorthernTransitional Zone (Zone 8) of Karnataka state.
MATERIALS AND METHODS
A field experiment was conducted at MainAgricultural Research Station, University of AgriculturalSciences, Dharwad, Karnataka during kharif 2015. The soilwas texturally clay soil, neutral in pH, medium in availableof nitrogen (301.56 kg N ha-1) and phosphorus (28.23 kgP2O5 ha-1) with high in available of potassium (386.32 kgK2O ha-1), high in organic matter content (0.76%) and normalin salt content (0.72 dSm-1).The experiment was laid out in arandomized complete block design with three replications.The experiment consists of 13 N/P fertilizer ratios and levelsviz., T1 -0.00 (Control), T2 - 0.00 (0 kg N, 0 kg P2O5 and 25 kgK2O ha-1), T3 -0.50 (40 kg N, 80 kg P2O5 and 25 kg K2O ha-1),T4 - 0.50 (40 kg N, 80 kg P2O5 and 25 kg K2O ha-1), T5 -0.70 (32 kg N, 46 kg P2O5 and 25 kg K2O ha-1) T6 - 0.46 (32 kg N, 69kg P2O5 and 25 kg K2O ha-1), T7 - 0.40 (32 kg N, 80 kg P2O5and 25 kg K2O ha-1), T8 - 0.43 (40 kg N, 46 kg P2O5 and 25 kgK2O ha-1), T9 - 0.58 (40 kg N, 69 kg P2O5 and 25 kg K2O ha-1),T10 -0.50 (40 kg N, 80 kg P2O5 and 25 kg K2O ha-1), T11 - 1.17(54 kg N, 46 kg P2O5 and 25 kg K2O ha-1), T12 - 0.78 (54 kg N,69 kg P2O5 and 25 kg K2O ha-1), T13 - 0.68 (54 kg N, 80 kgP2O5 and 25 kg K2O ha-1). Foliar application of nitrogen wastaken in the form of urea @ 2.00 % at initiation of flowering(i.e., in the treatment T4) or at initiation of flowering and 15days after first spray (i.e., in the treatments from T5 to T13).Soybean cultivar DSb 21 was used with a spacing of 30 cmbetween rows and 10 cm within row.
The land was prepared to a fine tilth before sowingof soybean seed. The seed treatment was done withRhizobium and P solubilisers @ 15 kg-1 seeds. Weedingand plant protection measures were undertaken as per need
2 0 Journal of Food Legumes 32(1), 2019
of crop. The crop was grown with one life saving irrigation.It was scheduled in between post flowering and podformation period because of no rainfall in that period toreduce flower drop and enhance pod formation. Theobservations on growth, yield attributes and yield wererecorded at 30, 60 days and at harvest. Growth and yieldparameters like plant height, number of branches, leaf area,total dry matter accumulation and pod number wererecorded from five tagged plants in each plot, while seedyield, haulm yield, threshing per cent and harvest indexwere recorded on plot basis.Calculation of leaf area: Leaf area was measured by discmethod as suggested by Vivekanandan et al. (1972). 50discs of known size were taken through cork borer fromrandomly selected leaves from five plants. Both discs andremaining leaf blades were oven dried at 750C for two daysand leaf area was calculated by using formula.
Wa– A
LA = WbWhere
LA=Leaf area per plantA=Area of discs (dm2)
Wa =Weight of all leaves + discs
Wb =Weight of 50 discs
The analysis and interpretation of data were studiedusing the Fischer’s method of analysis of variancetechnique as described by Gomez and Gomez (1984). Thelevel of significance used in ‘F’ and‘t’ test was P = 0.05.Critical difference values were calculated wherever the ‘F’test was significant. The means differences among thetreatments were compared by Duncan Multiple ComparisonTest at 0.05 level of probability.
RESULTS AND DISCUSSIONS
Effect on yield and yield attributes: Effect of differentratios and levels of nitrogen and phosphorus fertilizers andfoliar application of nitrogen through urea had significanteffect with respect to growth and yield of soybean. Thehighest seed yield and haulm yield of soybean (3217 kg ha-
1 and 3788.3 kg ha-1 respectively) was observed in thetreatment receiving N/P fertilizer ratio of 0.70 i.e., basalapplication of 18 kg N, 46 kg P2O5 and 25 kg K2O + foliarapplication of 7 kg N ha-1 each at flower initiation and 15days after first foliar spray when compared to control (2059and 2551 kg ha-1, respectively) and recommended dose offertilizer N/P ratio of 0.50 (2590 and 3051 kg ha-1, respectively)without foliar application of nitrogen. Threshing per centdid not differ significantly with respect to application ofdifferent ratios and levels of nitrogen and phosphorusfertilizers (Table 1). Similar results were obtained by Yan etal. (2015) where application 45 kg N and 70 kg ha-1 P2O5 (N/P ratio of 0.64) along with manure significantly increasedseed yield 3090.28 kg ha-1 and 3576.39 kg ha-1 in two cultivarsof soybean. These findings were also well supported bySiddique et al. (2007), Ghosh et al. (2006) and Shivkumarand Ahlawat (2008).
Seed yield is mainly dependent on source sink relation.Under rainfed agro ecology, application of 2% urea at flowerinitiation and 15 days thereafter will enhance the movementof photosynthates from source to sink during the seedfilling stage. As the reproductive parts get morephotosynthetic assimilate, an increase in seed yield isresulted. The improvement in the yield components suchas number of pods plant-1, pod weight plant-1, seed weightplant-1 (g) and 100 seed weight (g) ultimately results intoincrease in seed yield.
Among the different yield components, total numberof pods plant-1 (47.57), weight of dry pod plant-1 (24.73 g)and seed weight plant-1 (18.31 g) were greater with N/P
Table 1. Yield of soybean as influenced by different ratios and levels of nitrogen and phosphorus fertilizersQuantity of nutrients (NPK) applied (kg ha-1)
Application at sowing Foliar application of N Treatment N/P Ratio
N P2O5 K2O flowering initiation
15 days after 1st spray
T1 0/00 (0.00) 0 0 0 0 0 2059 f 2551 e 64.58 T2 00/00 (0.00) 0 0 25 0 0 2444 e 2976 d 69.86 T3 40/80 (0.50) 40 80 25 0 0 2590 de 3051 cd 75.10 T4 40/80 (0.50) 33 80 25 7 0 3054 ab 3525 ab 72.78 T5 32/46 (0.70) 18 46 25 7 7 3217 a 3788 a 74.84 T6 32/69 (0.46) 18 69 25 7 7 3055 ab 3513 ab 74.17 T7 32/80 (0.40) 18 80 25 7 7 2974 ab 3519 ab 72.01 T8 40/46 (0.43) 26 46 25 7 7 2842 b-d 3317 bc 71.64 T9 40/69 (0.58) 26 69 25 7 7 2902 bc 3479 ab 72.83 T10 40/80 (0.50) 26 80 25 7 7 2939 ab 3483 ab 72.82 T11 54/46 (1.17) 40 46 25 7 7 2650 c-e 3164 cd 71.97 T12 54/69 (0.78) 40 69 25 7 7 3204 a 3703 a 75.88 T13 54/80 (0.68) 40 80 25 7 7 3086 ab 3629 ab 73.28
S.Em± 89.40 98.60 4.34 LSD (p=0.05) 276.044 304.456 NS
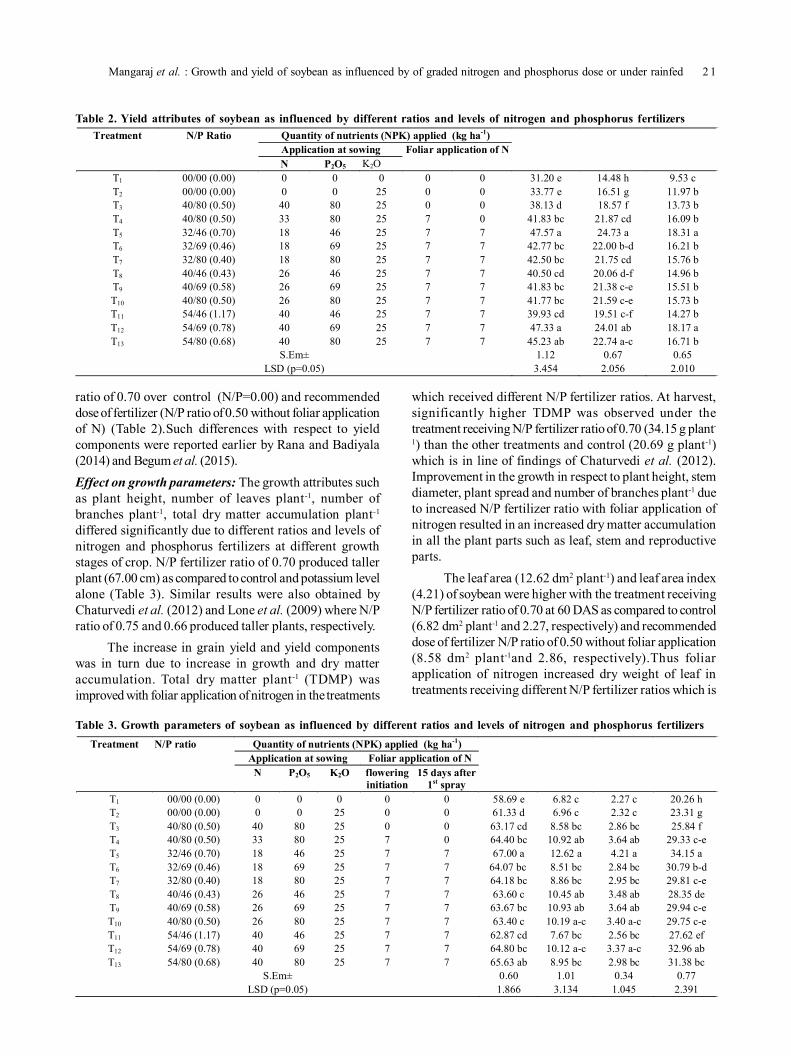
Mangaraj et al. : Growth and yield of soybean as influenced by of graded nitrogen and phosphorus dose or under rainfed 2 1
ratio of 0.70 over control (N/P=0.00) and recommendeddose of fertilizer (N/P ratio of 0.50 without foliar applicationof N) (Table 2).Such differences with respect to yieldcomponents were reported earlier by Rana and Badiyala(2014) and Begum et al. (2015).Effect on growth parameters: The growth attributes suchas plant height, number of leaves plant-1, number ofbranches plant-1, total dry matter accumulation plant-1
differed significantly due to different ratios and levels ofnitrogen and phosphorus fertilizers at different growthstages of crop. N/P fertilizer ratio of 0.70 produced tallerplant (67.00 cm) as compared to control and potassium levelalone (Table 3). Similar results were also obtained byChaturvedi et al. (2012) and Lone et al. (2009) where N/Pratio of 0.75 and 0.66 produced taller plants, respectively.
The increase in grain yield and yield componentswas in turn due to increase in growth and dry matteraccumulation. Total dry matter plant-1 (TDMP) wasimproved with foliar application of nitrogen in the treatments
which received different N/P fertilizer ratios. At harvest,significantly higher TDMP was observed under thetreatment receiving N/P fertilizer ratio of 0.70 (34.15 g plant-
1) than the other treatments and control (20.69 g plant-1)which is in line of findings of Chaturvedi et al. (2012).Improvement in the growth in respect to plant height, stemdiameter, plant spread and number of branches plant-1 dueto increased N/P fertilizer ratio with foliar application ofnitrogen resulted in an increased dry matter accumulationin all the plant parts such as leaf, stem and reproductiveparts.
The leaf area (12.62 dm2 plant-1) and leaf area index(4.21) of soybean were higher with the treatment receivingN/P fertilizer ratio of 0.70 at 60 DAS as compared to control(6.82 dm2 plant-1 and 2.27, respectively) and recommendeddose of fertilizer N/P ratio of 0.50 without foliar application(8.58 dm2 plant-1and 2.86, respectively).Thus foliarapplication of nitrogen increased dry weight of leaf intreatments receiving different N/P fertilizer ratios which is
Table 2. Yield attributes of soybean as influenced by different ratios and levels of nitrogen and phosphorus fertilizersQuantity of nutrients (NPK) applied (kg ha-1) Application at sowing Foliar application of N
Treatment N/P Ratio
N P2O5 K2O
T1 00/00 (0.00) 0 0 0 0 0 31.20 e 14.48 h 9.53 c T2 00/00 (0.00) 0 0 25 0 0 33.77 e 16.51 g 11.97 b T3 40/80 (0.50) 40 80 25 0 0 38.13 d 18.57 f 13.73 b T4 40/80 (0.50) 33 80 25 7 0 41.83 bc 21.87 cd 16.09 b T5 32/46 (0.70) 18 46 25 7 7 47.57 a 24.73 a 18.31 a T6 32/69 (0.46) 18 69 25 7 7 42.77 bc 22.00 b-d 16.21 b T7 32/80 (0.40) 18 80 25 7 7 42.50 bc 21.75 cd 15.76 b T8 40/46 (0.43) 26 46 25 7 7 40.50 cd 20.06 d-f 14.96 b T9 40/69 (0.58) 26 69 25 7 7 41.83 bc 21.38 c-e 15.51 b T10 40/80 (0.50) 26 80 25 7 7 41.77 bc 21.59 c-e 15.73 b T11 54/46 (1.17) 40 46 25 7 7 39.93 cd 19.51 c-f 14.27 b T12 54/69 (0.78) 40 69 25 7 7 47.33 a 24.01 ab 18.17 a T13 54/80 (0.68) 40 80 25 7 7 45.23 ab 22.74 a-c 16.71 b
S.Em± 1.12 0.67 0.65 LSD (p=0.05) 3.454 2.056 2.010
Table 3. Growth parameters of soybean as influenced by different ratios and levels of nitrogen and phosphorus fertilizersQuantity of nutrients (NPK) applied (kg ha-1)
Application at sowing Foliar application of N Treatment N/P ratio
N P2O5 K2O flowering initiation
15 days after 1st spray
T1 00/00 (0.00) 0 0 0 0 0 58.69 e 6.82 c 2.27 c 20.26 h T2 00/00 (0.00) 0 0 25 0 0 61.33 d 6.96 c 2.32 c 23.31 g T3 40/80 (0.50) 40 80 25 0 0 63.17 cd 8.58 bc 2.86 bc 25.84 f T4 40/80 (0.50) 33 80 25 7 0 64.40 bc 10.92 ab 3.64 ab 29.33 c-e T5 32/46 (0.70) 18 46 25 7 7 67.00 a 12.62 a 4.21 a 34.15 a T6 32/69 (0.46) 18 69 25 7 7 64.07 bc 8.51 bc 2.84 bc 30.79 b-d T7 32/80 (0.40) 18 80 25 7 7 64.18 bc 8.86 bc 2.95 bc 29.81 c-e T8 40/46 (0.43) 26 46 25 7 7 63.60 c 10.45 ab 3.48 ab 28.35 de T9 40/69 (0.58) 26 69 25 7 7 63.67 bc 10.93 ab 3.64 ab 29.94 c-e T10 40/80 (0.50) 26 80 25 7 7 63.40 c 10.19 a-c 3.40 a-c 29.75 c-e T11 54/46 (1.17) 40 46 25 7 7 62.87 cd 7.67 bc 2.56 bc 27.62 ef T12 54/69 (0.78) 40 69 25 7 7 64.80 bc 10.12 a-c 3.37 a-c 32.96 ab T13 54/80 (0.68) 40 80 25 7 7 65.63 ab 8.95 bc 2.98 bc 31.38 bc
S.Em± 0.60 1.01 0.34 0.77 LSD (p=0.05) 1.866 3.134 1.045 2.391
2 2 Journal of Food Legumes 32(1), 2019
usually associated with increase in leaf area plant-1 and leafarea index. These results are in conformity with Rana andBadiyala (2014).
Based on results of present investigation, higherseed yield of soybean (3217 kg ha-1) was obtained withimproved fertilizer management practices involving basalapplication of 18 kg N, 46kg P2O5 and 25 kg K2O with foliarapplication of 7 kg N ha-1 at flower initiation and 15 daysafter first foliar spray (N/P fertilizer ratio of 0.70) in mediumblack clay soil of Karnataka during kharif under rainfedsituations.
REFERENCES
Anonymous. 2015. Oil seed crops. Handbook of agriculture, publishedby directorate of information and publication of agriculture.Indian Council Agriculture Research. New Delhi, 6th Edn. 1143-1144
Begum A, Islam A, Ahmed QM, Islam MA and Rahman MM. 2015.Effect of nitrogen and phosphorus on the growth and yieldperformance of soybean. Research in Agriculture Livestock andFisheries 2(1): 35-42
Chaturvedi S, Chandel AS, Dhyani VC and Singh AP. 2012. Nutrientmanagement for enhanced yield and quality of soybean (Glycinemax) and residual soil fertility. Legume Research 35(3): 175-184
Ghosh PK, Mohanty M, Bandyopadhyay KK, Painuli DK and MishraAK. 2006. Effect of nutrient management growth, competition,
yield advantage and economics in soybean/ pigeonpeaintercropping system in semi-arid tropics of India. Field CropsResearch 96: 90-97
Gomez KA and Gomez AA. 1984. Statistical procedures foragricultural research, an international rice research institute book,wiley-inter science publication, New York, USA. Pp. 680
Lone BA, Hasan B, Ansar S and Khanday BA. 2009. Effect of seedrate, row spacing and fertility levels on growth and nutrientuptake of soybean (Glycine max L.) under temperate conditions.European Journal of Agronomy 4(3): 7-10
Rana R and Badiyala D. 2014. Effect of integrated nutrientmanagement on seed yield, quality and nutrient uptake of soybean(Glycine max) under mid hill conditions of Himachal Pradesh.Indian Journal of Agronomy 59(4): 641-645
Shivakumar BG and Ahlawat IPS. 2008. Integrated nutrientmanagement in soybean (Glycine max)-wheat (Triticumaestivum) cropping system. Indian Journal of Agronomy 53(4):273-278
Siddique MH, Oad FC, Kumbhar AM and Burriro UA. 2007. NPrequirement of soybean varieties for yield and yield components.Journal of Agronomy 6(1): 222-224
Vivekanandan AS, Gunasena HPM and Sivanayagam T. 1972.Statistical evaluation of the accuracy of three techniques used inthe estimation of leaf area of crop plants. Indian Journal ofAgricultural Sciences 42: 857-860
Yan CJ, Song SH, Wang WB, Miao SJ, Cao YQ, Wang CL and ZhangLJ. 2015. Impacts of fertilization on photosynthesis, growthand yield of two soybean cultivars (Glycine max) in NortheastChina. Legume Research 38(1): 77-84
Journal of Food Legumes 32(1): 23-27, 2019
ABSTRACT
India has a key place in global production and contributesabout 25% to the total pulse basket. Pigeonpea is the secondimportant pulse crop in India. In pigeonpea, weeds caused21-97 % yield loss. High cost of wages and various limitationsin cultural practices and mechanical practices necessitatesto study integrated weed management approach in pigeonpea.Therefore, a f ield experiment on integrated weedmanagement in pigeonpea was conducted at AgricultureResearch Station, Badnapur Dist-Jalna (Vasantrao NaikMarathwada Krishi Vidyapeeth, Parbhani, Maharashtra)during 2012-13, 2013-14 and 2014-15 with an objective tofind out the effective weed management practice in pigeonpeacultivation. The experiment was laid out in randomizedblock design comparing eight treatments viz., T 1 -pendimethalin @ 0.75 kg a.i/ha at 1-2 DAS + 1 hand weedingat 50 DAS, T2 -imazethapyr @100 g a.i./ha at 20-25 DAS + 1hand weeding at 50 DAS, T3 - quizalofop ethyl @ 100 g a.i./ha at 20-25 DAS + 1 hand weeding at 50 DAS, T 4 -pendimethalin @ 0.75 kg a.i /ha at 1-2 DAS + imazethapyr@ 100 g a.i./ha at 20-25 DAS, T5 -pendimethalin @ 0.75 kga.i/ha at 1-2 DAS + imazethapyr @ 100 g i.e./ha at 20-25DAS + 1 hand weeding at 50 DAS, T6 -pendimethalin @ 0.75kg a.i/ha at 1-2 DAS + quizalofop ethyl @ 100 g a.i/ha at 20-25 DAS, T7 -pendimethalin @ 0.75 kg a.i/ha at 1-2 DAS +quizalofop ethyl @ 100 g a.i./ha at 20-25 DAS + 1 handweeding at on 50 DAS, T8 -weedy check (Unwedded control)and T9 -weed free plot (weeding at an interval of 20-25 DAS).Three years pooled data revealed that pre-emergenceapplication of pendimethalin @ 0.75 kg a.i./ha–1 at 1-2 DAS+ imazethapyr @ 100 g a.i./ha at 20-25 DAS + 1 hand weedingat 50 DAS was found effective weed management practice.The application of pendimethalin @ 0.75 kg a.i./ha-1 at 1-2DAS + imazethapyr@ 100 g a.i./ha at 20-25 DAS + 1 handweeding at 50 DAS was also economical.
Key words: Hand weeding, Pigeonpea, Pre-emergence, Seedyield, Weed
Pigeonpea also known as redgram, arhar and tur[Cajanus cajan (L.) Millsp] is the most important kharifgrain legume. Pigeonpea is the second important pulse cropfollowed by chickpea. The crop is extensively grown inMaharashtra, Uttar Pradesh, Madhya Pradesh, Karnataka,Andhra Pradesh and Gujarat. It accounts for about 11.8%of the total pulse area and 17% of the total pulse productionof the country. Maharashtra, Uttar Pradesh, MadhyaPradesh, Karnataka, Gujarat and Andhra Pradesh accountsfor 87% area of the country and 83.8% of total production.Bihar and Haryana have the highest productivity 1115 kg
Integrated weed management in pigeonpea [Cajanus cajan (L.) Millsp]PAGAR PA, PATIL DK, BANTEWAD SD, JAHAGIRDAR JE and GOSAVI SV
Vasantrao Naik Marathwada Krishi Vidyapeeth, Parbhani, Maharashtra; E-mail:[email protected](Received : September 11, 2018 ; Accepted : December 24, 2018)
ha-1 and 1036 kg ha-1, respectively (Anonymous, 2017).In India, the area under pigeon pea was 5.21 million
hectares with the production and productivity of 4.23 milliontones and 826 kg ha-1, respectively and in Maharashtra, thearea under pigeonpea was 15.33 lakh hectares withproduction of 11.70 lakh tonnes and productivity of 764 kgha-1 during the year 2016-17 (Anonymous, 2017). InMarathwada region area under pigeonpea was 5.95 lakh hawith the production and productivity of 4.47 lakh ton and759 kg ha-1. Unchecked weeds caused 20-97% yield loss indifferent pulse crops. In pigeonpea weeds caused 21-97 %yield loss. Due to high cost of wages, considering variouslimitations in cultural practices and mechanical practicesthere is a need to study integrated weed managementapproach in pigeonpea. Therefore a field experiment,integrated weed management in pigeonpea was conductedat Agriculture Research Station, Badnapur Dist-Jalna(Vasantrao Naik Marathwada Krishi Vidyapeeth, Parbhani,Maharashtra) during 2012-13, 2013-14 and 2014-15 with theobjectives of finding out the effective and remunerativeweed management practice in pigeonpea.
MATERIALS AND METHODS
A field experiment on integrated weed managementin pigeonpea was conducted at Agriculture ResearchStation, Badnapur Dist-Jalna (Vasantrao Naik MarathwadaKrishi Vidyapeeth, Parbhani, Maharashtra) during 2012-13,2013-14 and 2014-15. The soil of the Experimental field wasclayey in texture having EC 0.25 dsm-1, pH: 7.62, available N139 Kg/ha, available P2O5 10 Kg/ha, available K2O 548 Kg/ha and organic carbon 0.68%. Pigeonpea variety BSMR853 was used for sowing. Sowing was done by dibblingmethod. Seed rate of 10 kg/ha was used with spacing of90cm x 20cm. Common dose of 25 kg N, 50kg P2O5 /hathrough urea + SSP was given.
The experiment was laid out in randomized blockdesign with three replications comparing eight treatments.Viz., T1 -pendimethalin @ 0.75 kg a.i./ha at 1-2 DAS + 1hand weeding at 50 DAS, T2 -imazethapyr @100 g a.i./ha at20-25 DAS + 1 hand weeding at 50 DAS, T3 -quizalofopethyl @ 100 g a.i./ha at 20-25 DAS + 1 hand weeding at 50DAS, T4 -pendimethalin @ 0.75 kg a.i./ha at 1-2 DAS +imazethapyr @ 100 g a.i./ha at 20-25 DAS, T5 -pendimethalin@ 0.75 kg a.i./ha at 1-2 DAS + imazethapyr @ 100 g i.e./haat 20-25 DAS + 1 hand weeding at 50 DAS, T6 -pendimethalin @ 0.75 kg a.i/ha at 1-2 DAS + quizalofopethyl @ 100 g a.i/ha at 20-25 DAS, T7 -pendimethalin @ 0.75
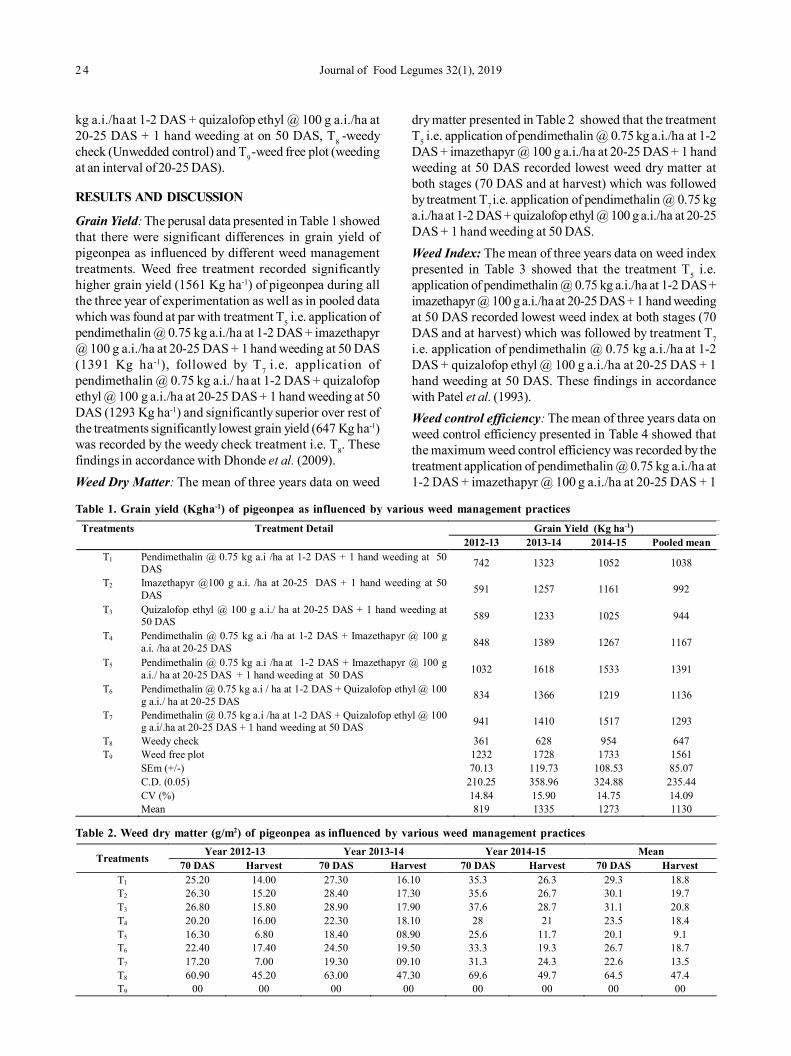
2 4 Journal of Food Legumes 32(1), 2019
kg a.i./ha at 1-2 DAS + quizalofop ethyl @ 100 g a.i./ha at20-25 DAS + 1 hand weeding at on 50 DAS, T8 -weedycheck (Unwedded control) and T9 -weed free plot (weedingat an interval of 20-25 DAS).
RESULTS AND DISCUSSION
Grain Yield: The perusal data presented in Table 1 showedthat there were significant differences in grain yield ofpigeonpea as influenced by different weed managementtreatments. Weed free treatment recorded significantlyhigher grain yield (1561 Kg ha-1) of pigeonpea during allthe three year of experimentation as well as in pooled datawhich was found at par with treatment T5 i.e. application ofpendimethalin @ 0.75 kg a.i./ha at 1-2 DAS + imazethapyr@ 100 g a.i./ha at 20-25 DAS + 1 hand weeding at 50 DAS(1391 Kg ha -1), followed by T7 i.e. application ofpendimethalin @ 0.75 kg a.i./ ha at 1-2 DAS + quizalofopethyl @ 100 g a.i./ha at 20-25 DAS + 1 hand weeding at 50DAS (1293 Kg ha-1) and significantly superior over rest ofthe treatments significantly lowest grain yield (647 Kg ha-1)was recorded by the weedy check treatment i.e. T8. Thesefindings in accordance with Dhonde et al. (2009).Weed Dry Matter: The mean of three years data on weed
dry matter presented in Table 2 showed that the treatmentT5 i.e. application of pendimethalin @ 0.75 kg a.i./ha at 1-2DAS + imazethapyr @ 100 g a.i./ha at 20-25 DAS + 1 handweeding at 50 DAS recorded lowest weed dry matter atboth stages (70 DAS and at harvest) which was followedby treatment T7 i.e. application of pendimethalin @ 0.75 kga.i./ha at 1-2 DAS + quizalofop ethyl @ 100 g a.i./ha at 20-25DAS + 1 hand weeding at 50 DAS.Weed Index: The mean of three years data on weed indexpresented in Table 3 showed that the treatment T5 i.e.application of pendimethalin @ 0.75 kg a.i./ha at 1-2 DAS +imazethapyr @ 100 g a.i./ha at 20-25 DAS + 1 hand weedingat 50 DAS recorded lowest weed index at both stages (70DAS and at harvest) which was followed by treatment T7i.e. application of pendimethalin @ 0.75 kg a.i./ha at 1-2DAS + quizalofop ethyl @ 100 g a.i./ha at 20-25 DAS + 1hand weeding at 50 DAS. These findings in accordancewith Patel et al. (1993).Weed control efficiency: The mean of three years data onweed control efficiency presented in Table 4 showed thatthe maximum weed control efficiency was recorded by thetreatment application of pendimethalin @ 0.75 kg a.i./ha at1-2 DAS + imazethapyr @ 100 g a.i./ha at 20-25 DAS + 1
Table 1. Grain yield (Kgha-1) of pigeonpea as influenced by various weed management practicesTreatments Treatment Detail Grain Yield (Kg ha-1)
2012-13 2013-14 2014-15 Pooled mean T1 Pendimethalin @ 0.75 kg a.i /ha at 1-2 DAS + 1 hand weeding at 50
DAS 742 1323 1052 1038
T2
Imazethapyr @100 g a.i. /ha at 20-25 DAS + 1 hand weeding at 50 DAS 591 1257 1161 992
T3
Quizalofop ethyl @ 100 g a.i./ ha at 20-25 DAS + 1 hand weeding at 50 DAS 589 1233 1025 944
T4
Pendimethalin @ 0.75 kg a.i /ha at 1-2 DAS + Imazethapyr @ 100 g a.i. /ha at 20-25 DAS 848 1389 1267 1167
T5
Pendimethalin @ 0.75 kg a.i /ha at 1-2 DAS + Imazethapyr @ 100 g a.i./ ha at 20-25 DAS + 1 hand weeding at 50 DAS 1032 1618 1533 1391
T6 Pendimethalin @ 0.75 kg a.i / ha at 1-2 DAS + Quizalofop ethyl @ 100 g a.i./ ha at 20-25 DAS 834 1366 1219 1136
T7 Pendimethalin @ 0.75 kg a.i /ha at 1-2 DAS + Quizalofop ethyl @ 100 g a.i/.ha at 20-25 DAS + 1 hand weeding at 50 DAS 941 1410 1517 1293
T8 Weedy check 361 628 954 647 T9 Weed free plot 1232 1728 1733 1561
SEm (+/-) 70.13 119.73 108.53 85.07 C.D. (0.05) 210.25 358.96 324.88 235.44 CV (%) 14.84 15.90 14.75 14.09 Mean 819 1335 1273 1130
Table 2. Weed dry matter (g/m2) of pigeonpea as influenced by various weed management practices
Treatments Year 2012-13 Year 2013-14 Year 2014-15 Mean 70 DAS Harvest 70 DAS Harvest 70 DAS Harvest 70 DAS Harvest
T1 25.20 14.00 27.30 16.10 35.3 26.3 29.3 18.8 T2 26.30 15.20 28.40 17.30 35.6 26.7 30.1 19.7 T3 26.80 15.80 28.90 17.90 37.6 28.7 31.1 20.8 T4 20.20 16.00 22.30 18.10 28 21 23.5 18.4 T5 16.30 6.80 18.40 08.90 25.6 11.7 20.1 9.1 T6 22.40 17.40 24.50 19.50 33.3 19.3 26.7 18.7 T7 17.20 7.00 19.30 09.10 31.3 24.3 22.6 13.5 T8 60.90 45.20 63.00 47.30 69.6 49.7 64.5 47.4 T9 00 00 00 00 00 00 00 00
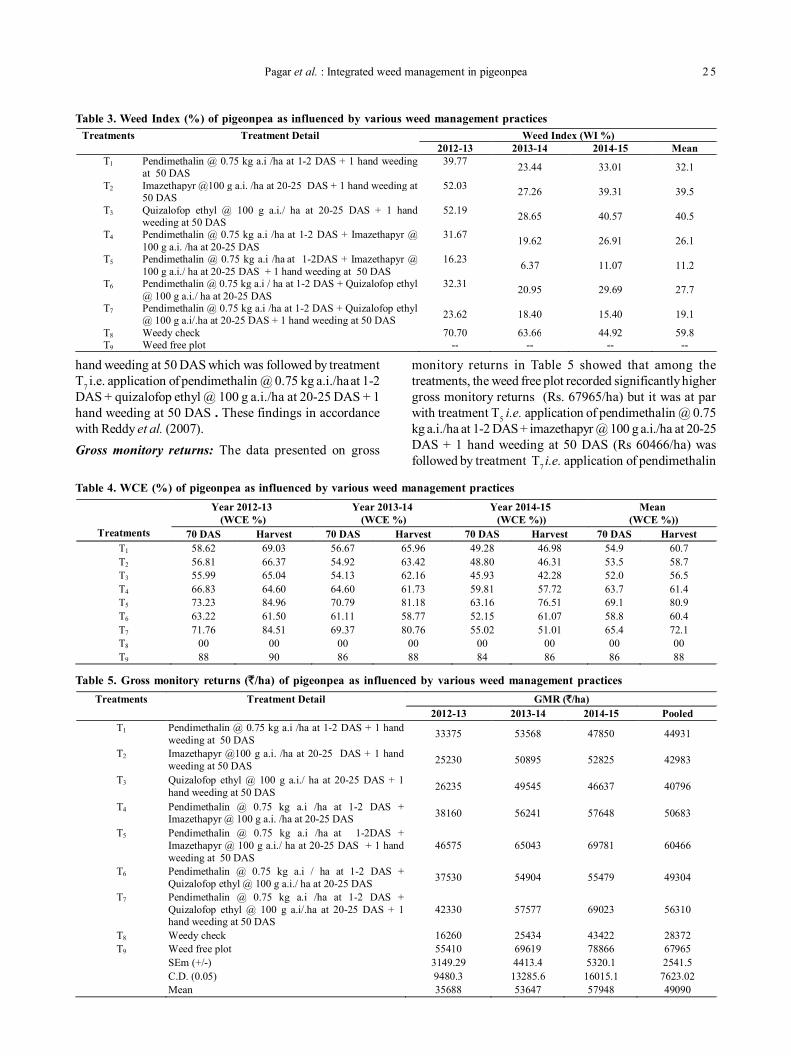
Pagar et al. : Integrated weed management in pigeonpea 2 5
hand weeding at 50 DAS which was followed by treatmentT7 i.e. application of pendimethalin @ 0.75 kg a.i./ha at 1-2DAS + quizalofop ethyl @ 100 g a.i./ha at 20-25 DAS + 1hand weeding at 50 DAS . These findings in accordancewith Reddy et al. (2007).Gross monitory returns: The data presented on gross
Table 3. Weed Index (%) of pigeonpea as influenced by various weed management practicesTreatments Treatment Detail Weed Index (WI %)
2012-13 2013-14 2014-15 Mean T1 Pendimethalin @ 0.75 kg a.i /ha at 1-2 DAS + 1 hand weeding
at 50 DAS 39.77
23.44 33.01 32.1
T2
Imazethapyr @100 g a.i. /ha at 20-25 DAS + 1 hand weeding at 50 DAS
52.03 27.26 39.31 39.5
T3
Quizalofop ethyl @ 100 g a.i./ ha at 20-25 DAS + 1 hand weeding at 50 DAS
52.19 28.65 40.57 40.5
T4
Pendimethalin @ 0.75 kg a.i /ha at 1-2 DAS + Imazethapyr @ 100 g a.i. /ha at 20-25 DAS
31.67 19.62 26.91 26.1
T5
Pendimethalin @ 0.75 kg a.i /ha at 1-2DAS + Imazethapyr @ 100 g a.i./ ha at 20-25 DAS + 1 hand weeding at 50 DAS
16.23 6.37 11.07 11.2
T6 Pendimethalin @ 0.75 kg a.i / ha at 1-2 DAS + Quizalofop ethyl @ 100 g a.i./ ha at 20-25 DAS
32.31 20.95 29.69 27.7
T7 Pendimethalin @ 0.75 kg a.i /ha at 1-2 DAS + Quizalofop ethyl @ 100 g a.i/.ha at 20-25 DAS + 1 hand weeding at 50 DAS 23.62 18.40 15.40 19.1
T8 Weedy check 70.70 63.66 44.92 59.8 T9 Weed free plot -- -- -- --
monitory returns in Table 5 showed that among thetreatments, the weed free plot recorded significantly highergross monitory returns (Rs. 67965/ha) but it was at parwith treatment T5 i.e. application of pendimethalin @ 0.75kg a.i./ha at 1-2 DAS + imazethapyr @ 100 g a.i./ha at 20-25DAS + 1 hand weeding at 50 DAS (Rs 60466/ha) wasfollowed by treatment T7 i.e. application of pendimethalin
Table 4. WCE (%) of pigeonpea as influenced by various weed management practices
Treatments
Year 2012-13 (WCE %)
Year 2013-14 (WCE %)
Year 2014-15 (WCE %))
Mean (WCE %))
70 DAS Harvest 70 DAS Harvest 70 DAS Harvest 70 DAS Harvest T1 58.62 69.03 56.67 65.96 49.28 46.98 54.9 60.7 T2 56.81 66.37 54.92 63.42 48.80 46.31 53.5 58.7 T3 55.99 65.04 54.13 62.16 45.93 42.28 52.0 56.5 T4 66.83 64.60 64.60 61.73 59.81 57.72 63.7 61.4 T5 73.23 84.96 70.79 81.18 63.16 76.51 69.1 80.9 T6 63.22 61.50 61.11 58.77 52.15 61.07 58.8 60.4 T7 71.76 84.51 69.37 80.76 55.02 51.01 65.4 72.1 T8 00 00 00 00 00 00 00 00 T9 88 90 86 88 84 86 86 88
Table 5. Gross monitory returns (`/ha) of pigeonpea as influenced by various weed management practicesTreatments Treatment Detail GMR (`/ha)
2012-13 2013-14 2014-15 Pooled T1 Pendimethalin @ 0.75 kg a.i /ha at 1-2 DAS + 1 hand
weeding at 50 DAS 33375 53568 47850 44931
T2
Imazethapyr @100 g a.i. /ha at 20-25 DAS + 1 hand weeding at 50 DAS 25230 50895 52825 42983
T3
Quizalofop ethyl @ 100 g a.i./ ha at 20-25 DAS + 1 hand weeding at 50 DAS 26235 49545 46637 40796
T4
Pendimethalin @ 0.75 kg a.i /ha at 1-2 DAS + Imazethapyr @ 100 g a.i. /ha at 20-25 DAS 38160 56241 57648 50683
T5
Pendimethalin @ 0.75 kg a.i /ha at 1-2DAS + Imazethapyr @ 100 g a.i./ ha at 20-25 DAS + 1 hand weeding at 50 DAS
46575 65043 69781 60466
T6 Pendimethalin @ 0.75 kg a.i / ha at 1-2 DAS + Quizalofop ethyl @ 100 g a.i./ ha at 20-25 DAS 37530 54904 55479 49304
T7 Pendimethalin @ 0.75 kg a.i /ha at 1-2 DAS + Quizalofop ethyl @ 100 g a.i/.ha at 20-25 DAS + 1 hand weeding at 50 DAS
42330 57577 69023 56310
T8 Weedy check 16260 25434 43422 28372 T9 Weed free plot 55410 69619 78866 67965
SEm (+/-) 3149.29 4413.4 5320.1 2541.5 C.D. (0.05) 9480.3 13285.6 16015.1 7623.02 Mean 35688 53647 57948 49090
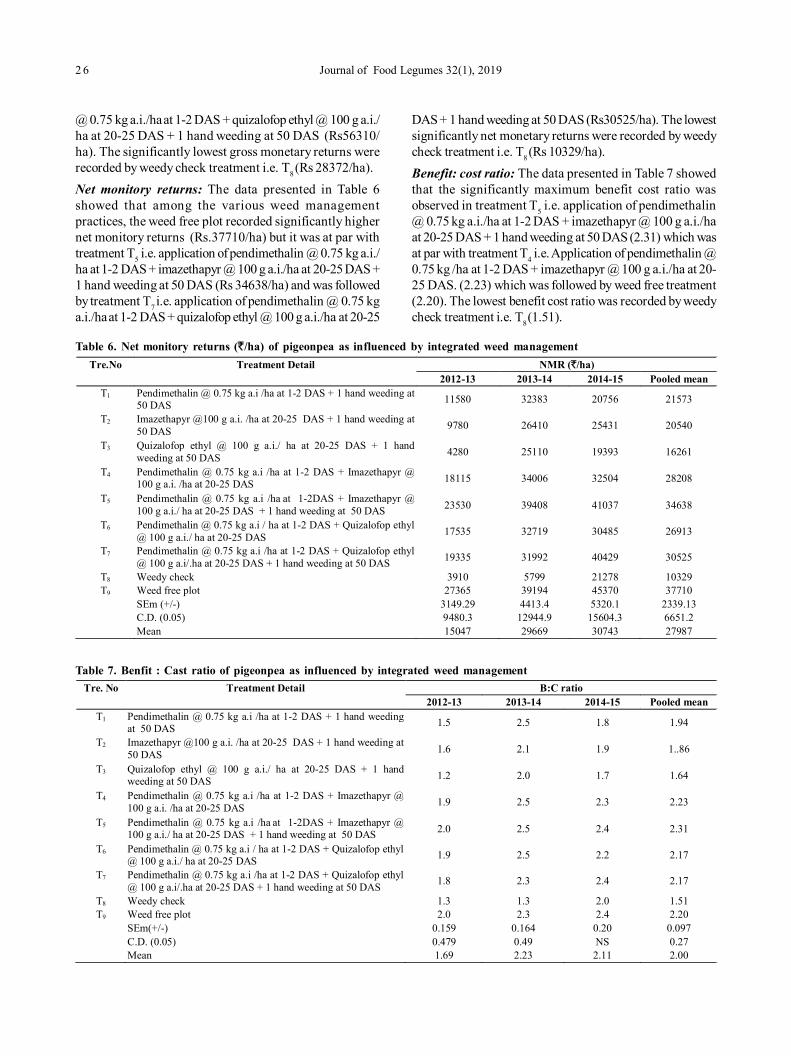
2 6 Journal of Food Legumes 32(1), 2019
@ 0.75 kg a.i./ha at 1-2 DAS + quizalofop ethyl @ 100 g a.i./ha at 20-25 DAS + 1 hand weeding at 50 DAS (Rs56310/ha). The significantly lowest gross monetary returns wererecorded by weedy check treatment i.e. T8 (Rs 28372/ha).Net monitory returns: The data presented in Table 6showed that among the various weed managementpractices, the weed free plot recorded significantly highernet monitory returns (Rs.37710/ha) but it was at par withtreatment T5 i.e. application of pendimethalin @ 0.75 kg a.i./ha at 1-2 DAS + imazethapyr @ 100 g a.i./ha at 20-25 DAS +1 hand weeding at 50 DAS (Rs 34638/ha) and was followedby treatment T7 i.e. application of pendimethalin @ 0.75 kga.i./ha at 1-2 DAS + quizalofop ethyl @ 100 g a.i./ha at 20-25
DAS + 1 hand weeding at 50 DAS (Rs30525/ha). The lowestsignificantly net monetary returns were recorded by weedycheck treatment i.e. T8 (Rs 10329/ha).Benefit: cost ratio: The data presented in Table 7 showedthat the significantly maximum benefit cost ratio wasobserved in treatment T5 i.e. application of pendimethalin@ 0.75 kg a.i./ha at 1-2 DAS + imazethapyr @ 100 g a.i./haat 20-25 DAS + 1 hand weeding at 50 DAS (2.31) which wasat par with treatment T4 i.e. Application of pendimethalin @0.75 kg /ha at 1-2 DAS + imazethapyr @ 100 g a.i./ha at 20-25 DAS. (2.23) which was followed by weed free treatment(2.20). The lowest benefit cost ratio was recorded by weedycheck treatment i.e. T8 (1.51).
Table 6. Net monitory returns (`/ha) of pigeonpea as influenced by integrated weed managementTre.No Treatment Detail NMR (`/ha)
2012-13 2013-14 2014-15 Pooled mean T1 Pendimethalin @ 0.75 kg a.i /ha at 1-2 DAS + 1 hand weeding at
50 DAS 11580 32383 20756 21573
T2
Imazethapyr @100 g a.i. /ha at 20-25 DAS + 1 hand weeding at 50 DAS 9780 26410 25431 20540
T3
Quizalofop ethyl @ 100 g a.i./ ha at 20-25 DAS + 1 hand weeding at 50 DAS 4280 25110 19393 16261
T4
Pendimethalin @ 0.75 kg a.i /ha at 1-2 DAS + Imazethapyr @ 100 g a.i. /ha at 20-25 DAS 18115 34006 32504 28208
T5
Pendimethalin @ 0.75 kg a.i /ha at 1-2DAS + Imazethapyr @ 100 g a.i./ ha at 20-25 DAS + 1 hand weeding at 50 DAS 23530 39408 41037 34638
T6 Pendimethalin @ 0.75 kg a.i / ha at 1-2 DAS + Quizalofop ethyl @ 100 g a.i./ ha at 20-25 DAS 17535 32719 30485 26913
T7 Pendimethalin @ 0.75 kg a.i /ha at 1-2 DAS + Quizalofop ethyl @ 100 g a.i/.ha at 20-25 DAS + 1 hand weeding at 50 DAS 19335 31992 40429 30525
T8 Weedy check 3910 5799 21278 10329 T9 Weed free plot 27365 39194 45370 37710
SEm (+/-) 3149.29 4413.4 5320.1 2339.13 C.D. (0.05) 9480.3 12944.9 15604.3 6651.2 Mean 15047 29669 30743 27987
Table 7. Benfit : Cast ratio of pigeonpea as influenced by integrated weed managementTre. No Treatment Detail B:C ratio
2012-13 2013-14 2014-15 Pooled mean T1 Pendimethalin @ 0.75 kg a.i /ha at 1-2 DAS + 1 hand weeding
at 50 DAS 1.5 2.5 1.8 1.94
T2
Imazethapyr @100 g a.i. /ha at 20-25 DAS + 1 hand weeding at 50 DAS 1.6 2.1 1.9 1..86
T3
Quizalofop ethyl @ 100 g a.i./ ha at 20-25 DAS + 1 hand weeding at 50 DAS 1.2 2.0 1.7 1.64
T4
Pendimethalin @ 0.75 kg a.i /ha at 1-2 DAS + Imazethapyr @ 100 g a.i. /ha at 20-25 DAS 1.9 2.5 2.3 2.23
T5
Pendimethalin @ 0.75 kg a.i /ha at 1-2DAS + Imazethapyr @ 100 g a.i./ ha at 20-25 DAS + 1 hand weeding at 50 DAS 2.0 2.5 2.4 2.31
T6 Pendimethalin @ 0.75 kg a.i / ha at 1-2 DAS + Quizalofop ethyl @ 100 g a.i./ ha at 20-25 DAS 1.9 2.5 2.2 2.17
T7 Pendimethalin @ 0.75 kg a.i /ha at 1-2 DAS + Quizalofop ethyl @ 100 g a.i/.ha at 20-25 DAS + 1 hand weeding at 50 DAS 1.8 2.3 2.4 2.17
T8 Weedy check 1.3 1.3 2.0 1.51 T9 Weed free plot 2.0 2.3 2.4 2.20
SEm(+/-) 0.159 0.164 0.20 0.097 C.D. (0.05) 0.479 0.49 NS 0.27 Mean 1.69 2.23 2.11 2.00
Pagar et al. : Integrated weed management in pigeonpea 2 7
REFERENCES
Ahlawat IPS and Venkateswarlu U. 1987. Weed managementin pigeonpea based intercropping system, Int. PigeonpeaNewslett. 66: 37-39
Aravind Kumar, Shrivastava GP, Prasad NK and Kumar A. 1998.Efficiency of weed control measures in pigeonpea and soybeanassociation, J .of Res, Bisra Agril .Univ. 10:12
Bondarwad BN. 1991. Integrated weed management in pigeonpeaM.Sc. (Agri.) Thesis. MAU Parbhani. India
Dhonde MB, Kate SR, Pandure BS and Tambe AD. 2009. Integratedweed management in pigeonpea. Ind. J. of weed Sci. 41(1&2):102-105
Gangwar KS. 1992. Studies on weed control in soreghum + pigeonpeaintercropping system under dry land condition. Indian J. WeedSci., 24(1& 2): 91-93
Giri AN, Shelke DK, Bhosle RH, Solunke VD and Jadhav NS. 1992.Integrated weed management in pigeonpea (BDN 2) Abstr. AnnualWeed Sci Conf. ISWS, March-4, held at CCS HAU Hissar 125004,Indian pp.85
Itnal CJ, Lingaraju BS, Kurdikar CB and Naik N. 1993. Weed controlin irrigated pigeonpea J. Maharashtra agric. Univ. 18(2): 237-240
Kadam DM. 1994. IWM in pigeonpea M.Sc. (Agri.) Thesis, MAUParbhani
Kolar JS and Sandhu KS. 1989. Weed management in pulse crops.Indian FMG 34(6): 17-18
Mishra SS, Sinha KK, Singh SJ, Nandan R, Sharma HM and RoySharma RP. 1990. Comparative efficacy of herbicides inpigeonpea. Biennial Conf. Indian Soc. Weed Sci. Univ. of Agril.Sci. Bangalore
Najappa HM and Maheswarappa. 1990. Efficacy of herbicides alone
and in combination with mechanical practices to control weedsin pigeonpea. Abstract of Papers Biennial Conf. of Indian Soc.Of Weed Sci. Univ. of Agril. Sci. Bangalore 85-86
Najappa HV and Maheswarappa HP. 1994. Releative efficacy ofherbicides controlling the weed infestesting pigeonpea. Ind. J.of Agron. 39(4): 662-664
Nimje PM. 1993. Weed management in pigeonpea-soybeanintercropping system. Proc. Indian Soc. Weed Sci. Int. Symp.,Hissar, Ind 3: 163-165
Padmaja B, Reddy MM and Reddy DVV. 2013. Weed controlefficiency of pre and post emergence herbicides in pigeonpea(Cajanus cajan L.) J. of food legumes 26: 1-2
Patel ZG, Raj VC and Patel CL. 1993. Integrated Weed managementin pigeonpea. Indian J. Weed Sci. 24(1&2): 17-21
Patil BM and Pandey Jitendra. 1996. Chemical weed control inpigeonpea (Cajanus cajan) intercropped with short durationgrain legumes. Indian J. Agron. 41(4): 529-535
Patil SA. 2003. Effect of row spacing and weed management ongrowth and yield of pigeonpea. Thesis submitted to M.P.K.V.,Rahuri for M. Sc (Agri.) Degree
Reddy MM, Vilatha AM and Rao LJ. 2007. I ntegrated weedmanagement in pigeonpea: soyabean inercropping system onvertisol under rainfed condition. Ind. J. of Agric. Sci 77(3): 177-178
Roy LJ, Sharma RP, Sharma HM, Mishra SS, Singh SJ and Thakur SS.1991. Contribution of improved agronomic practices inpigeonpea production. Indian J.Agron. 36: 280-281
Singh HP, Saxena MC, Yadav DS and Sharma RD. 1980. Chemicaland mechanical weed control in pigeonpea under humidsubtropical condition of Pantnagar. Leg. Res. 3(1): 22-26
Singh ON and Singh RS. 1985. Chemical weed control in pigeonpea.Int. pigeonpea News letter., (4): 26
Journal of Food Legumes 32(1): 28-32, 2019
Effect of application of different sources of nutrients on yield of chickpea (Cicerarietinum L.)CHANDRA MANI TRIPATHI, RAJESH KUMAR1, BHRIGU MANI TRIPATHI, SHASHI MANITRIPATHI2 and VIRENDRA PRATAP SINGH
CS Azad University of Agriculture and Technology, Kanpur, Uttar Pradesh, 1ICAR-Indian Institute of PulsesResearch, Kanpur, Uttar Pradesh, 2Narendra Dev University of Agriculture and Technology, Kumarganj, Faizabad;E-mail: [email protected](Received : March 17. 2018 ; Accepted : August 19, 2018)
ABSTRACT
A field experiment was conducted during rabi seasons of2014-15 and 2015-16 at Students Instructional Farm,Department of Agronomy, CS Azad University of Agricultureand Technology, Kanpur in alluvial tract of indo gangeticplains in central part of Uttar Pradesh to find out experimentwas conducted on chickpea with three replication, keepingone factor and nine treatments of randomized block designT1: RDF (20:60:20:20 NPKS kg/ha), T2 : RDF + rhizobiumculture, T3 :RDF + rhizobium culture + vermicompost @ 5.0t/ha, T4 : RDF + rhizobium culture + vermicompost @ 3.0 t/ha, T5 :RDF + rhizobium culture + vermicompost @ 2.0 t/ha,T6 : RDF + rhizobium culture + vermicompost @ 2.0 t/ha, +FYM @ 5.0 t/ha, T7 : RDF + rhizobium culture +vermicompost @ 2.0 t/ha + FYM @ 3.0 t/ha, T8 : RDF +rhizobium culture + vermicompost @ 2.0 t/ha + FYM @ 2.0t/ha and T9 : RDF + rhizobium culture + FYM @ 8.0 t/ha.Checkpea variety KWR 108 was grown row spacing of 40 cmapart based on two years. The field experiment was conductedduring rabi season of 2014-15, at Students Instructional Farmof CS Azad University of Agriculture and Technology, Kanpurwith the objectives to find out the effect of integrated use ofFYM and vermicompost with the different level ofrecommended dose of fertilizer on growth and yield ofchickpea. With the application of T3: RDF + rhizobiumculture + vermicompost @ 5.0 t/ha and harvest index wasobtained with the application of T6 : RDF + rhizobium culture+ vermicompost @ 2.0 t/ha + FYM @ 5.0 t/ha respectively,during the two years of experimentation.
Key words: FYM, RDF, Rhizobium culture, Vermicompost
Chickpea (Cicer arietinum L.) is the 4th largest grain-legume crop in the world as well as in Asia. Being a rich andcheap source of protein, it can help people to improve thenutritional quality of their diets. Chickpea is an importantsource of energy, protein and soluble and insoluble fiber.Chickpea grains contain 60-65% carbohydrates, 6% fat, and12-13% protein. Through symbiotic nitrogen fixation, thecrop meets up to 80% of the soils nitrogen needs, so farmershave to apply less nitrogen fertilizer than they do for othernon-legume crops. Among the pulses, chickpea is the thirdmost important legumes in the world, which is grown inalmost all the continents except Antarctica. India alonecontributes >67% of the total area and production ofchickpea in the world Anonymous (2017). Chickpea thus
are usually grown under stored residual soil moisture withthe moisture receding to deeper soil layers with the age ofthe plants experiencing terminal drought stress. Theintensity and the timing of the stress, of course, can varydepending on the previous rainfall, soil type, crop durationand the crop growth. Clearly, the number of pods per plantwas enhanced progressively with the use of differentsources of nutrient. The maximum number of pod (38.34)per plant was noted with application of R.D.F + rhizobiumculture + vermicompost @ 5.0 t/ha followed by RDF +rhizobium culture + vermicompost @ 2.0 t/ha + FYM @ 5.0t/ha (35.35). The treatment 3 is superior to other treatment.Hence application of various organic sources viz., FYMand vermicompost along with inorganic mineral nitrogen,phosphorus, potassium and sulphur either in combinationor alone in order to ascertain their effect on yield, growthand finally on economic viability of chickpea in the presentcontext is the all most need. The integrated nutrientmanagement does not have now gaining importancebecause of the present negative balance and the chemicalfertilizers alone nor can the potential alternative source ofnutrient achieve the production sustainability of soils andcrops under intensive cultivation. Under such conditionsintegration of indigenously available organic sources ofnutrients with inorganic sources is of vital significance forsustaining the productivity and fertility of soil Sharma andSaroa (2017). Vermicompost is a good organic source ofplant nutrient and growth hormone which enhance plantgrowth and microbial population.
MATERIALS AND METHODS
The field experiment was conducted during rabiseasons of 2014-15 and 2015-16 at Students InstructionalFarm, Department of Agronomy, CS Azad University ofAgriculture and Technology, Kanpur in alluvial tract of indogangetic plains in central part of Uttar Pradesh. The soil ofthe experimental field was sandy loam in texture and slightlycalcareous having organic carbon 0.28%, total nitrogen0.032%, available P2O5 13.0 kg /ha, available K2O 180 kg/ ha,pH 7.5, electrical conductivity 0.20 dS/m wilting point 6.0%,field capacity 19.2%, water holding capacity 28.3%, Bulkdensity 1.43 Mg/ m³, particle density 2.60 Mg/m³ andporosity 45.6%. The field experiment was conducted inrandomized block design with three replications, keeping
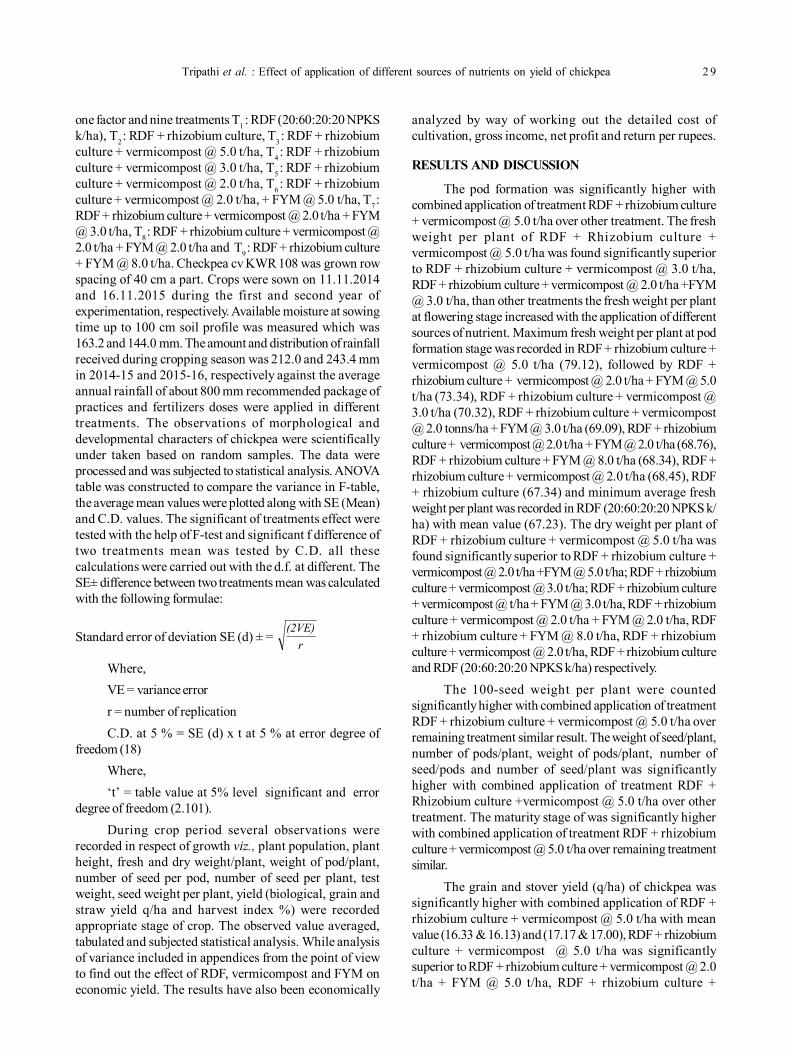
Tripathi et al. : Effect of application of different sources of nutrients on yield of chickpea 2 9
one factor and nine treatments T1 : RDF (20:60:20:20 NPKSk/ha), T2 : RDF + rhizobium culture, T3 : RDF + rhizobiumculture + vermicompost @ 5.0 t/ha, T4 : RDF + rhizobiumculture + vermicompost @ 3.0 t/ha, T5 : RDF + rhizobiumculture + vermicompost @ 2.0 t/ha, T6 : RDF + rhizobiumculture + vermicompost @ 2.0 t/ha, + FYM @ 5.0 t/ha, T7 :RDF + rhizobium culture + vermicompost @ 2.0 t/ha + FYM@ 3.0 t/ha, T8 : RDF + rhizobium culture + vermicompost @2.0 t/ha + FYM @ 2.0 t/ha and T9 : RDF + rhizobium culture+ FYM @ 8.0 t/ha. Checkpea cv KWR 108 was grown rowspacing of 40 cm a part. Crops were sown on 11.11.2014and 16.11.2015 during the first and second year ofexperimentation, respectively. Available moisture at sowingtime up to 100 cm soil profile was measured which was163.2 and 144.0 mm. The amount and distribution of rainfallreceived during cropping season was 212.0 and 243.4 mmin 2014-15 and 2015-16, respectively against the averageannual rainfall of about 800 mm recommended package ofpractices and fertilizers doses were applied in differenttreatments. The observations of morphological anddevelopmental characters of chickpea were scientificallyunder taken based on random samples. The data wereprocessed and was subjected to statistical analysis. ANOVAtable was constructed to compare the variance in F-table,the average mean values were plotted along with SE (Mean)and C.D. values. The significant of treatments effect weretested with the help of F-test and significant f difference oftwo treatments mean was tested by C.D. all thesecalculations were carried out with the d.f. at different. TheSE± difference between two treatments mean was calculatedwith the following formulae:
Standard error of deviation SE (d) ± = r(2VE)
Where,VE = variance errorr = number of replicationC.D. at 5 % = SE (d) x t at 5 % at error degree of
freedom (18)Where,‘t’ = table value at 5% level significant and error
degree of freedom (2.101).During crop period several observations were
recorded in respect of growth viz., plant population, plantheight, fresh and dry weight/plant, weight of pod/plant,number of seed per pod, number of seed per plant, testweight, seed weight per plant, yield (biological, grain andstraw yield q/ha and harvest index %) were recordedappropriate stage of crop. The observed value averaged,tabulated and subjected statistical analysis. While analysisof variance included in appendices from the point of viewto find out the effect of RDF, vermicompost and FYM oneconomic yield. The results have also been economically
analyzed by way of working out the detailed cost ofcultivation, gross income, net profit and return per rupees.
RESULTS AND DISCUSSION
The pod formation was significantly higher withcombined application of treatment RDF + rhizobium culture+ vermicompost @ 5.0 t/ha over other treatment. The freshweight per plant of RDF + Rhizobium culture +vermicompost @ 5.0 t/ha was found significantly superiorto RDF + rhizobium culture + vermicompost @ 3.0 t/ha,RDF + rhizobium culture + vermicompost @ 2.0 t/ha +FYM@ 3.0 t/ha, than other treatments the fresh weight per plantat flowering stage increased with the application of differentsources of nutrient. Maximum fresh weight per plant at podformation stage was recorded in RDF + rhizobium culture +vermicompost @ 5.0 t/ha (79.12), followed by RDF +rhizobium culture + vermicompost @ 2.0 t/ha + FYM @ 5.0t/ha (73.34), RDF + rhizobium culture + vermicompost @3.0 t/ha (70.32), RDF + rhizobium culture + vermicompost@ 2.0 tonns/ha + FYM @ 3.0 t/ha (69.09), RDF + rhizobiumculture + vermicompost @ 2.0 t/ha + FYM @ 2.0 t/ha (68.76),RDF + rhizobium culture + FYM @ 8.0 t/ha (68.34), RDF +rhizobium culture + vermicompost @ 2.0 t/ha (68.45), RDF+ rhizobium culture (67.34) and minimum average freshweight per plant was recorded in RDF (20:60:20:20 NPKS k/ha) with mean value (67.23). The dry weight per plant ofRDF + rhizobium culture + vermicompost @ 5.0 t/ha wasfound significantly superior to RDF + rhizobium culture +vermicompost @ 2.0 t/ha +FYM @ 5.0 t/ha; RDF + rhizobiumculture + vermicompost @ 3.0 t/ha; RDF + rhizobium culture+ vermicompost @ t/ha + FYM @ 3.0 t/ha, RDF + rhizobiumculture + vermicompost @ 2.0 t/ha + FYM @ 2.0 t/ha, RDF+ rhizobium culture + FYM @ 8.0 t/ha, RDF + rhizobiumculture + vermicompost @ 2.0 t/ha, RDF + rhizobium cultureand RDF (20:60:20:20 NPKS k/ha) respectively.
The 100-seed weight per plant were countedsignificantly higher with combined application of treatmentRDF + rhizobium culture + vermicompost @ 5.0 t/ha overremaining treatment similar result. The weight of seed/plant,number of pods/plant, weight of pods/plant, number ofseed/pods and number of seed/plant was significantlyhigher with combined application of treatment RDF +Rhizobium culture +vermicompost @ 5.0 t/ha over othertreatment. The maturity stage of was significantly higherwith combined application of treatment RDF + rhizobiumculture + vermicompost @ 5.0 t/ha over remaining treatmentsimilar.
The grain and stover yield (q/ha) of chickpea wassignificantly higher with combined application of RDF +rhizobium culture + vermicompost @ 5.0 t/ha with meanvalue (16.33 & 16.13) and (17.17 & 17.00), RDF + rhizobiumculture + vermicompost @ 5.0 t/ha was significantlysuperior to RDF + rhizobium culture + vermicompost @ 2.0t/ha + FYM @ 5.0 t/ha, RDF + rhizobium culture +
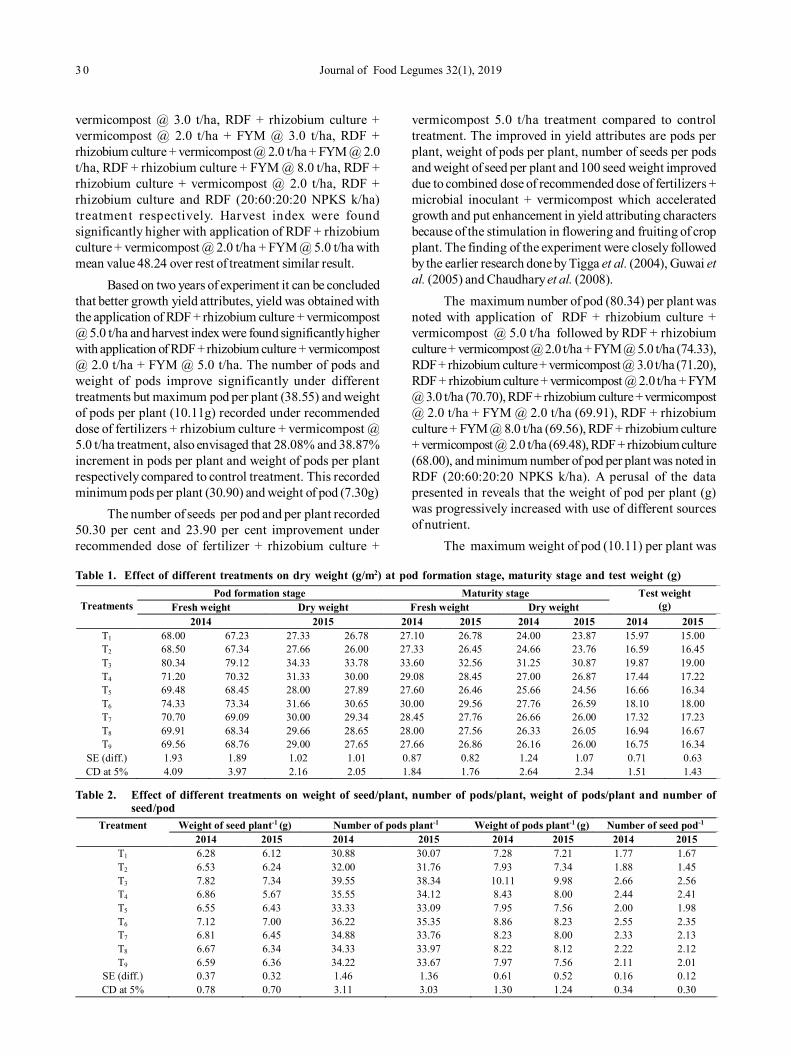
3 0 Journal of Food Legumes 32(1), 2019
vermicompost @ 3.0 t/ha, RDF + rhizobium culture +vermicompost @ 2.0 t/ha + FYM @ 3.0 t/ha, RDF +rhizobium culture + vermicompost @ 2.0 t/ha + FYM @ 2.0t/ha, RDF + rhizobium culture + FYM @ 8.0 t/ha, RDF +rhizobium culture + vermicompost @ 2.0 t/ha, RDF +rhizobium culture and RDF (20:60:20:20 NPKS k/ha)treatment respectively. Harvest index were foundsignificantly higher with application of RDF + rhizobiumculture + vermicompost @ 2.0 t/ha + FYM @ 5.0 t/ha withmean value 48.24 over rest of treatment similar result.
Based on two years of experiment it can be concludedthat better growth yield attributes, yield was obtained withthe application of RDF + rhizobium culture + vermicompost@ 5.0 t/ha and harvest index were found significantly higherwith application of RDF + rhizobium culture + vermicompost@ 2.0 t/ha + FYM @ 5.0 t/ha. The number of pods andweight of pods improve significantly under differenttreatments but maximum pod per plant (38.55) and weightof pods per plant (10.11g) recorded under recommendeddose of fertilizers + rhizobium culture + vermicompost @5.0 t/ha treatment, also envisaged that 28.08% and 38.87%increment in pods per plant and weight of pods per plantrespectively compared to control treatment. This recordedminimum pods per plant (30.90) and weight of pod (7.30g)
The number of seeds per pod and per plant recorded50.30 per cent and 23.90 per cent improvement underrecommended dose of fertilizer + rhizobium culture +
vermicompost 5.0 t/ha treatment compared to controltreatment. The improved in yield attributes are pods perplant, weight of pods per plant, number of seeds per podsand weight of seed per plant and 100 seed weight improveddue to combined dose of recommended dose of fertilizers +microbial inoculant + vermicompost which acceleratedgrowth and put enhancement in yield attributing charactersbecause of the stimulation in flowering and fruiting of cropplant. The finding of the experiment were closely followedby the earlier research done by Tigga et al. (2004), Guwai etal. (2005) and Chaudhary et al. (2008).
The maximum number of pod (80.34) per plant wasnoted with application of RDF + rhizobium culture +vermicompost @ 5.0 t/ha followed by RDF + rhizobiumculture + vermicompost @ 2.0 t/ha + FYM @ 5.0 t/ha (74.33),RDF + rhizobium culture + vermicompost @ 3.0 t/ha (71.20),RDF + rhizobium culture + vermicompost @ 2.0 t/ha + FYM@ 3.0 t/ha (70.70), RDF + rhizobium culture + vermicompost@ 2.0 t/ha + FYM @ 2.0 t/ha (69.91), RDF + rhizobiumculture + FYM @ 8.0 t/ha (69.56), RDF + rhizobium culture+ vermicompost @ 2.0 t/ha (69.48), RDF + rhizobium culture(68.00), and minimum number of pod per plant was noted inRDF (20:60:20:20 NPKS k/ha). A perusal of the datapresented in reveals that the weight of pod per plant (g)was progressively increased with use of different sourcesof nutrient.
The maximum weight of pod (10.11) per plant was
Table 1. Effect of different treatments on dry weight (g/m2) at pod formation stage, maturity stage and test weight (g)
Treatments Pod formation stage Maturity stage Test weight
(g) Fresh weight Dry weight Fresh weight Dry weight 2014 2015 2014 2015 2014 2015 2014 2015
T1 68.00 67.23 27.33 26.78 27.10 26.78 24.00 23.87 15.97 15.00 T2 68.50 67.34 27.66 26.00 27.33 26.45 24.66 23.76 16.59 16.45 T3 80.34 79.12 34.33 33.78 33.60 32.56 31.25 30.87 19.87 19.00 T4 71.20 70.32 31.33 30.00 29.08 28.45 27.00 26.87 17.44 17.22 T5 69.48 68.45 28.00 27.89 27.60 26.46 25.66 24.56 16.66 16.34 T6 74.33 73.34 31.66 30.65 30.00 29.56 27.76 26.59 18.10 18.00 T7 70.70 69.09 30.00 29.34 28.45 27.76 26.66 26.00 17.32 17.23 T8 69.91 68.34 29.66 28.65 28.00 27.56 26.33 26.05 16.94 16.67 T9 69.56 68.76 29.00 27.65 27.66 26.86 26.16 26.00 16.75 16.34
SE (diff.) 1.93 1.89 1.02 1.01 0.87 0.82 1.24 1.07 0.71 0.63 CD at 5% 4.09 3.97 2.16 2.05 1.84 1.76 2.64 2.34 1.51 1.43
Table 2. Effect of different treatments on weight of seed/plant, number of pods/plant, weight of pods/plant and number ofseed/pod
Treatment Weight of seed plant-1 (g) Number of pods plant-1 Weight of pods plant-1 (g) Number of seed pod-1
2014 2015 2014 2015 2014 2015 2014 2015 T1 6.28 6.12 30.88 30.07 7.28 7.21 1.77 1.67 T2 6.53 6.24 32.00 31.76 7.93 7.34 1.88 1.45 T3 7.82 7.34 39.55 38.34 10.11 9.98 2.66 2.56 T4 6.86 5.67 35.55 34.12 8.43 8.00 2.44 2.41 T5 6.55 6.43 33.33 33.09 7.95 7.56 2.00 1.98 T6 7.12 7.00 36.22 35.35 8.86 8.23 2.55 2.35 T7 6.81 6.45 34.88 33.76 8.23 8.00 2.33 2.13 T8 6.67 6.34 34.33 33.97 8.22 8.12 2.22 2.12 T9 6.59 6.36 34.22 33.67 7.97 7.56 2.11 2.01
SE (diff.) 0.37 0.32 1.46 1.36 0.61 0.52 0.16 0.12 CD at 5% 0.78 0.70 3.11 3.03 1.30 1.24 0.34 0.30
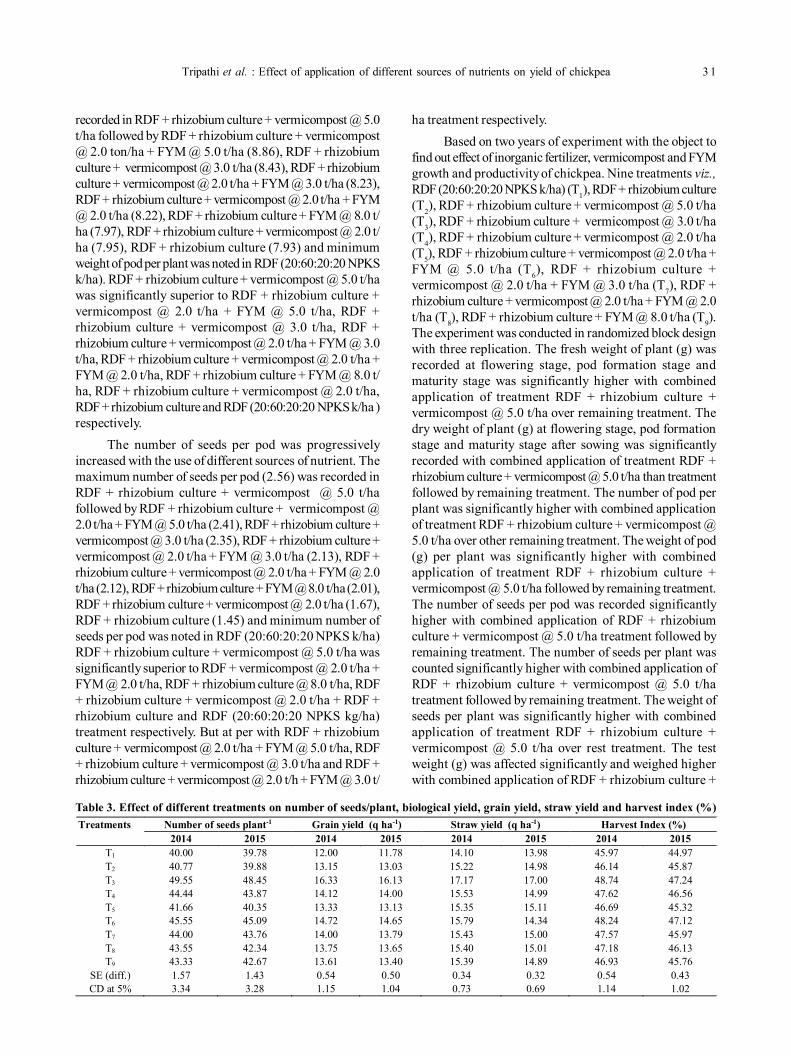
Tripathi et al. : Effect of application of different sources of nutrients on yield of chickpea 3 1
recorded in RDF + rhizobium culture + vermicompost @ 5.0t/ha followed by RDF + rhizobium culture + vermicompost@ 2.0 ton/ha + FYM @ 5.0 t/ha (8.86), RDF + rhizobiumculture + vermicompost @ 3.0 t/ha (8.43), RDF + rhizobiumculture + vermicompost @ 2.0 t/ha + FYM @ 3.0 t/ha (8.23),RDF + rhizobium culture + vermicompost @ 2.0 t/ha + FYM@ 2.0 t/ha (8.22), RDF + rhizobium culture + FYM @ 8.0 t/ha (7.97), RDF + rhizobium culture + vermicompost @ 2.0 t/ha (7.95), RDF + rhizobium culture (7.93) and minimumweight of pod per plant was noted in RDF (20:60:20:20 NPKSk/ha). RDF + rhizobium culture + vermicompost @ 5.0 t/hawas significantly superior to RDF + rhizobium culture +vermicompost @ 2.0 t/ha + FYM @ 5.0 t/ha, RDF +rhizobium culture + vermicompost @ 3.0 t/ha, RDF +rhizobium culture + vermicompost @ 2.0 t/ha + FYM @ 3.0t/ha, RDF + rhizobium culture + vermicompost @ 2.0 t/ha +FYM @ 2.0 t/ha, RDF + rhizobium culture + FYM @ 8.0 t/ha, RDF + rhizobium culture + vermicompost @ 2.0 t/ha,RDF + rhizobium culture and RDF (20:60:20:20 NPKS k/ha )respectively.
The number of seeds per pod was progressivelyincreased with the use of different sources of nutrient. Themaximum number of seeds per pod (2.56) was recorded inRDF + rhizobium culture + vermicompost @ 5.0 t/hafollowed by RDF + rhizobium culture + vermicompost @2.0 t/ha + FYM @ 5.0 t/ha (2.41), RDF + rhizobium culture +vermicompost @ 3.0 t/ha (2.35), RDF + rhizobium culture +vermicompost @ 2.0 t/ha + FYM @ 3.0 t/ha (2.13), RDF +rhizobium culture + vermicompost @ 2.0 t/ha + FYM @ 2.0t/ha (2.12), RDF + rhizobium culture + FYM @ 8.0 t/ha (2.01),RDF + rhizobium culture + vermicompost @ 2.0 t/ha (1.67),RDF + rhizobium culture (1.45) and minimum number ofseeds per pod was noted in RDF (20:60:20:20 NPKS k/ha)RDF + rhizobium culture + vermicompost @ 5.0 t/ha wassignificantly superior to RDF + vermicompost @ 2.0 t/ha +FYM @ 2.0 t/ha, RDF + rhizobium culture @ 8.0 t/ha, RDF+ rhizobium culture + vermicompost @ 2.0 t/ha + RDF +rhizobium culture and RDF (20:60:20:20 NPKS kg/ha)treatment respectively. But at per with RDF + rhizobiumculture + vermicompost @ 2.0 t/ha + FYM @ 5.0 t/ha, RDF+ rhizobium culture + vermicompost @ 3.0 t/ha and RDF +rhizobium culture + vermicompost @ 2.0 t/h + FYM @ 3.0 t/
ha treatment respectively.Based on two years of experiment with the object to
find out effect of inorganic fertilizer, vermicompost and FYMgrowth and productivity of chickpea. Nine treatments viz.,RDF (20:60:20:20 NPKS k/ha) (T1), RDF + rhizobium culture(T2), RDF + rhizobium culture + vermicompost @ 5.0 t/ha(T3), RDF + rhizobium culture + vermicompost @ 3.0 t/ha(T4), RDF + rhizobium culture + vermicompost @ 2.0 t/ha(T5), RDF + rhizobium culture + vermicompost @ 2.0 t/ha +FYM @ 5.0 t/ha (T6), RDF + rhizobium culture +vermicompost @ 2.0 t/ha + FYM @ 3.0 t/ha (T7), RDF +rhizobium culture + vermicompost @ 2.0 t/ha + FYM @ 2.0t/ha (T8), RDF + rhizobium culture + FYM @ 8.0 t/ha (T9).The experiment was conducted in randomized block designwith three replication. The fresh weight of plant (g) wasrecorded at flowering stage, pod formation stage andmaturity stage was significantly higher with combinedapplication of treatment RDF + rhizobium culture +vermicompost @ 5.0 t/ha over remaining treatment. Thedry weight of plant (g) at flowering stage, pod formationstage and maturity stage after sowing was significantlyrecorded with combined application of treatment RDF +rhizobium culture + vermicompost @ 5.0 t/ha than treatmentfollowed by remaining treatment. The number of pod perplant was significantly higher with combined applicationof treatment RDF + rhizobium culture + vermicompost @5.0 t/ha over other remaining treatment. The weight of pod(g) per plant was significantly higher with combinedapplication of treatment RDF + rhizobium culture +vermicompost @ 5.0 t/ha followed by remaining treatment.The number of seeds per pod was recorded significantlyhigher with combined application of RDF + rhizobiumculture + vermicompost @ 5.0 t/ha treatment followed byremaining treatment. The number of seeds per plant wascounted significantly higher with combined application ofRDF + rhizobium culture + vermicompost @ 5.0 t/hatreatment followed by remaining treatment. The weight ofseeds per plant was significantly higher with combinedapplication of treatment RDF + rhizobium culture +vermicompost @ 5.0 t/ha over rest treatment. The testweight (g) was affected significantly and weighed higherwith combined application of RDF + rhizobium culture +
Table 3. Effect of different treatments on number of seeds/plant, biological yield, grain yield, straw yield and harvest index (%)Treatments Number of seeds plant-1 Grain yield (q ha-1) Straw yield (q ha-1) Harvest Index (%)
2014 2015 2014 2015 2014 2015 2014 2015 T1 40.00 39.78 12.00 11.78 14.10 13.98 45.97 44.97 T2 40.77 39.88 13.15 13.03 15.22 14.98 46.14 45.87 T3 49.55 48.45 16.33 16.13 17.17 17.00 48.74 47.24 T4 44.44 43.87 14.12 14.00 15.53 14.99 47.62 46.56 T5 41.66 40.35 13.33 13.13 15.35 15.11 46.69 45.32 T6 45.55 45.09 14.72 14.65 15.79 14.34 48.24 47.12 T7 44.00 43.76 14.00 13.79 15.43 15.00 47.57 45.97 T8 43.55 42.34 13.75 13.65 15.40 15.01 47.18 46.13 T9 43.33 42.67 13.61 13.40 15.39 14.89 46.93 45.76
SE (diff.) 1.57 1.43 0.54 0.50 0.34 0.32 0.54 0.43 CD at 5% 3.34 3.28 1.15 1.04 0.73 0.69 1.14 1.02
3 2 Journal of Food Legumes 32(1), 2019
vermicompost @ 5.0 t/ha treatment followed by remainingtreatment.
REFERENCES
Anonymous. 2017. Agriculture statics at a glance in India
Amin PK, Dev and SK Singh. 2015. Effect of inorganic fertilizer ongrowth and yield of chickpea variety. Journals of AgriculturalSciences 6(2): 546-551
Anjum SA, Ehsanullah U, Mohsin T and Rafi QIK. 2014.Morphological and phonological attributed of chickpea affectedby different tillage practices and varied sowing method. AmericanJournal of Plant Sciences 7(4): 1182-1187
Chaudhary Rampratap, Singh Harphool and Singh Maa. 2016. Projectof chickpea production under moisture condition of North-western India. Harayana Journal of Agronomy 3(5): 234-242
Jat RS and Ahlawat IPS. 2004. Effect of vermicompost, biofertilizerand phosphorus on growth, yield and nutrient uptake by gram
and their residual effect on fodder maize. Indian Journal ofAgricultural Sciences 74(7): 359-361
Gholipoor M, Karamzadeh A and Gholami A. 2014. Vermicompostas a soil supplement to relieve the effects of low-intensitydrought stress on chickpea yield. Acta Horticulture 10(1): 219-226
Lal B, Rana KS, Rana DS, Shivay YS, Priyanka Gautam, Ansari MAand Ekta Joshi. 2013. Assessment of economics, energy use andyield advantage indices of Ethiopian mustard + chickpeaintercropping system under dry land conditions. Research onCrops 14(3): 815-824
Singh Ranveer, Nath YN, Singh SK, Mohan TK and Shahi JP. 2016.Effect of agronomic management practices on growth, yieldand quality of wheat under excessive moisture condition. CropResearch 23(6): 402-408
Sharma S and Saroa GS. 2017. Effect of organic and integratednutrient management practices on soil phosphorus fractionsand total phosphorus in basmati-wheat sequence. Journal of Soiland Water Conservation 16(11): 79-85
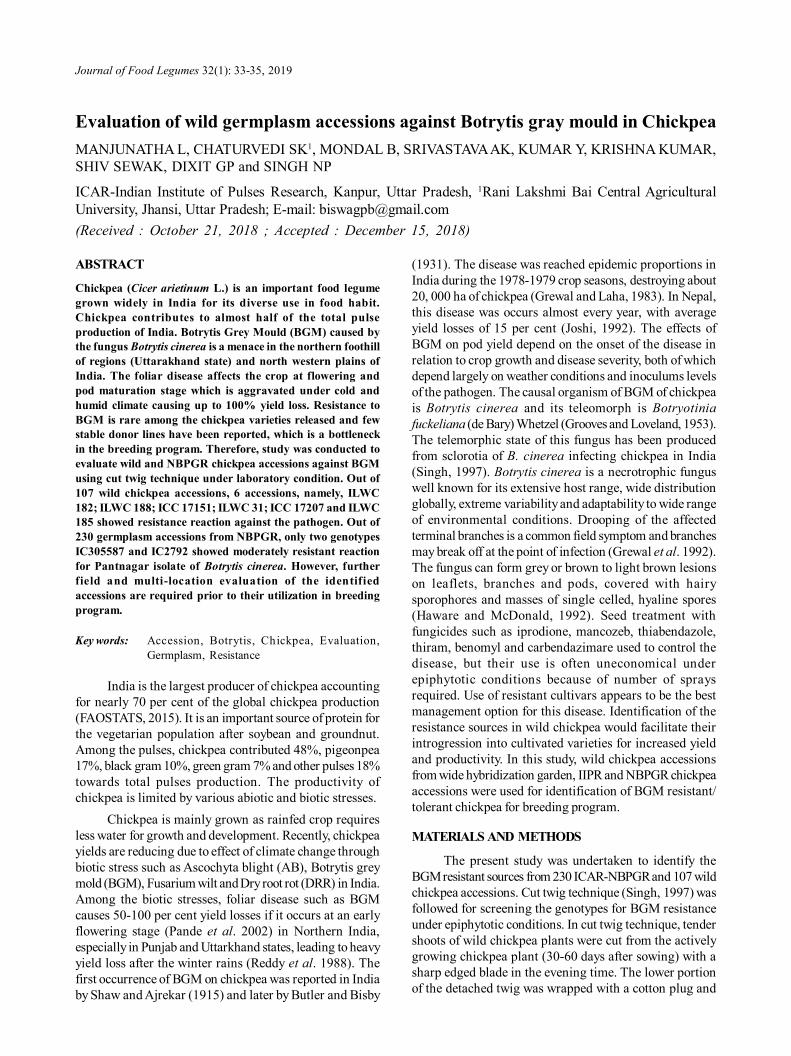
Journal of Food Legumes 32(1): 33-35, 2019
Evaluation of wild germplasm accessions against Botrytis gray mould in ChickpeaMANJUNATHA L, CHATURVEDI SK1, MONDAL B, SRIVASTAVA AK, KUMAR Y, KRISHNA KUMAR,SHIV SEWAK, DIXIT GP and SINGH NP
ICAR-Indian Institute of Pulses Research, Kanpur, Uttar Pradesh, 1Rani Lakshmi Bai Central AgriculturalUniversity, Jhansi, Uttar Pradesh; E-mail: [email protected](Received : October 21, 2018 ; Accepted : December 15, 2018)
ABSTRACT
Chickpea (Cicer arietinum L.) is an important food legumegrown widely in India for its diverse use in food habit.Chickpea contributes to almost half of the total pulseproduction of India. Botrytis Grey Mould (BGM) caused bythe fungus Botrytis cinerea is a menace in the northern foothillof regions (Uttarakhand state) and north western plains ofIndia. The foliar disease affects the crop at flowering andpod maturation stage which is aggravated under cold andhumid climate causing up to 100% yield loss. Resistance toBGM is rare among the chickpea varieties released and fewstable donor lines have been reported, which is a bottleneckin the breeding program. Therefore, study was conducted toevaluate wild and NBPGR chickpea accessions against BGMusing cut twig technique under laboratory condition. Out of107 wild chickpea accessions, 6 accessions, namely, ILWC182; ILWC 188; ICC 17151; ILWC 31; ICC 17207 and ILWC185 showed resistance reaction against the pathogen. Out of230 germplasm accessions from NBPGR, only two genotypesIC305587 and IC2792 showed moderately resistant reactionfor Pantnagar isolate of Botrytis cinerea. However, furtherfield and multi-location evaluation of the identifiedaccessions are required prior to their utilization in breedingprogram.
Key words: Accession, Botrytis, Chickpea, Evaluation,Germplasm, Resistance
India is the largest producer of chickpea accountingfor nearly 70 per cent of the global chickpea production(FAOSTATS, 2015). It is an important source of protein forthe vegetarian population after soybean and groundnut.Among the pulses, chickpea contributed 48%, pigeonpea17%, black gram 10%, green gram 7% and other pulses 18%towards total pulses production. The productivity ofchickpea is limited by various abiotic and biotic stresses.
Chickpea is mainly grown as rainfed crop requiresless water for growth and development. Recently, chickpeayields are reducing due to effect of climate change throughbiotic stress such as Ascochyta blight (AB), Botrytis greymold (BGM), Fusarium wilt and Dry root rot (DRR) in India.Among the biotic stresses, foliar disease such as BGMcauses 50-100 per cent yield losses if it occurs at an earlyflowering stage (Pande et al. 2002) in Northern India,especially in Punjab and Uttarkhand states, leading to heavyyield loss after the winter rains (Reddy et al. 1988). Thefirst occurrence of BGM on chickpea was reported in Indiaby Shaw and Ajrekar (1915) and later by Butler and Bisby
(1931). The disease was reached epidemic proportions inIndia during the 1978-1979 crop seasons, destroying about20, 000 ha of chickpea (Grewal and Laha, 1983). In Nepal,this disease was occurs almost every year, with averageyield losses of 15 per cent (Joshi, 1992). The effects ofBGM on pod yield depend on the onset of the disease inrelation to crop growth and disease severity, both of whichdepend largely on weather conditions and inoculums levelsof the pathogen. The causal organism of BGM of chickpeais Botrytis cinerea and its teleomorph is Botryotiniafuckeliana (de Bary) Whetzel (Grooves and Loveland, 1953).The telemorphic state of this fungus has been producedfrom sclorotia of B. cinerea infecting chickpea in India(Singh, 1997). Botrytis cinerea is a necrotrophic funguswell known for its extensive host range, wide distributionglobally, extreme variability and adaptability to wide rangeof environmental conditions. Drooping of the affectedterminal branches is a common field symptom and branchesmay break off at the point of infection (Grewal et al. 1992).The fungus can form grey or brown to light brown lesionson leaflets, branches and pods, covered with hairysporophores and masses of single celled, hyaline spores(Haware and McDonald, 1992). Seed treatment withfungicides such as iprodione, mancozeb, thiabendazole,thiram, benomyl and carbendazimare used to control thedisease, but their use is often uneconomical underepiphytotic conditions because of number of spraysrequired. Use of resistant cultivars appears to be the bestmanagement option for this disease. Identification of theresistance sources in wild chickpea would facilitate theirintrogression into cultivated varieties for increased yieldand productivity. In this study, wild chickpea accessionsfrom wide hybridization garden, IIPR and NBPGR chickpeaaccessions were used for identification of BGM resistant/tolerant chickpea for breeding program.
MATERIALS AND METHODS
The present study was undertaken to identify theBGM resistant sources from 230 ICAR-NBPGR and 107 wildchickpea accessions. Cut twig technique (Singh, 1997) wasfollowed for screening the genotypes for BGM resistanceunder epiphytotic conditions. In cut twig technique, tendershoots of wild chickpea plants were cut from the activelygrowing chickpea plant (30-60 days after sowing) with asharp edged blade in the evening time. The lower portionof the detached twig was wrapped with a cotton plug and
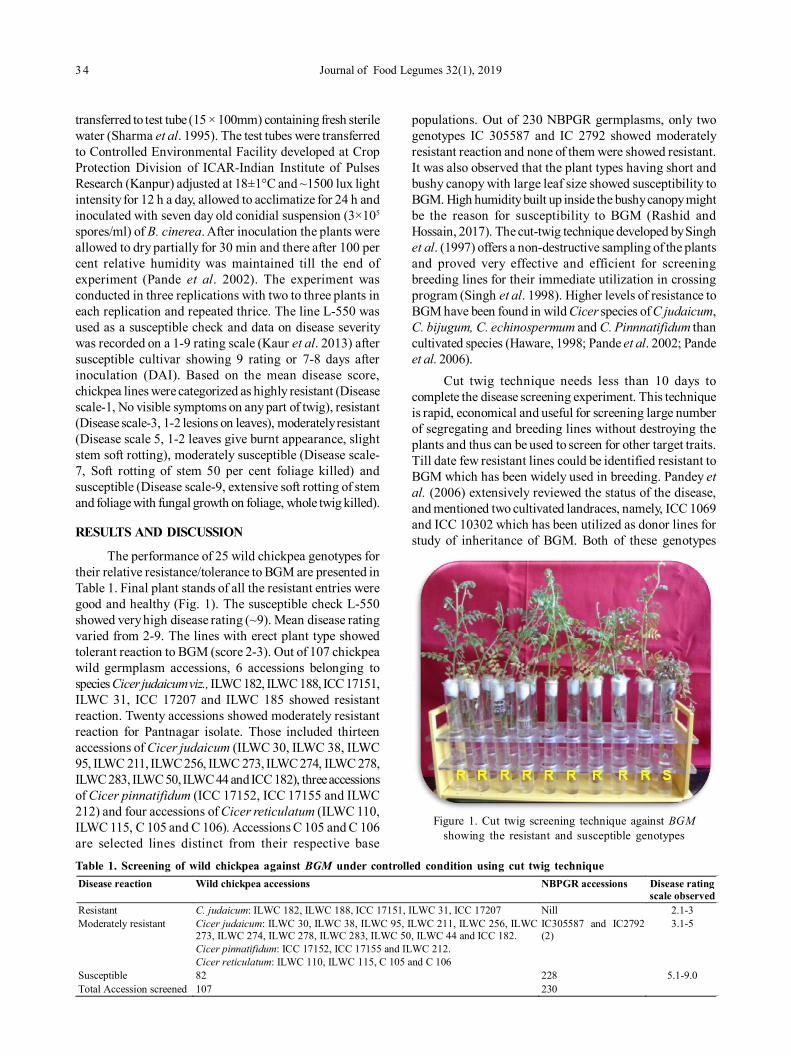
3 4 Journal of Food Legumes 32(1), 2019
transferred to test tube (15 × 100mm) containing fresh sterilewater (Sharma et al. 1995). The test tubes were transferredto Controlled Environmental Facility developed at CropProtection Division of ICAR-Indian Institute of PulsesResearch (Kanpur) adjusted at 18±1°C and ~1500 lux lightintensity for 12 h a day, allowed to acclimatize for 24 h andinoculated with seven day old conidial suspension (3×10⁵
spores/ml) of B. cinerea. After inoculation the plants wereallowed to dry partially for 30 min and there after 100 percent relative humidity was maintained till the end ofexperiment (Pande et al. 2002). The experiment wasconducted in three replications with two to three plants ineach replication and repeated thrice. The line L-550 wasused as a susceptible check and data on disease severitywas recorded on a 1-9 rating scale (Kaur et al. 2013) aftersusceptible cultivar showing 9 rating or 7-8 days afterinoculation (DAI). Based on the mean disease score,chickpea lines were categorized as highly resistant (Diseasescale-1, No visible symptoms on any part of twig), resistant(Disease scale-3, 1-2 lesions on leaves), moderately resistant(Disease scale 5, 1-2 leaves give burnt appearance, slightstem soft rotting), moderately susceptible (Disease scale-7, Soft rotting of stem 50 per cent foliage killed) andsusceptible (Disease scale-9, extensive soft rotting of stemand foliage with fungal growth on foliage, whole twig killed).
RESULTS AND DISCUSSION
The performance of 25 wild chickpea genotypes fortheir relative resistance/tolerance to BGM are presented inTable 1. Final plant stands of all the resistant entries weregood and healthy (Fig. 1). The susceptible check L-550showed very high disease rating (~9). Mean disease ratingvaried from 2-9. The lines with erect plant type showedtolerant reaction to BGM (score 2-3). Out of 107 chickpeawild germplasm accessions, 6 accessions belonging tospecies Cicer judaicum viz., ILWC 182, ILWC 188, ICC 17151,ILWC 31, ICC 17207 and ILWC 185 showed resistantreaction. Twenty accessions showed moderately resistantreaction for Pantnagar isolate. Those included thirteenaccessions of Cicer judaicum (ILWC 30, ILWC 38, ILWC95, ILWC 211, ILWC 256, ILWC 273, ILWC 274, ILWC 278,ILWC 283, ILWC 50, ILWC 44 and ICC 182), three accessionsof Cicer pinnatifidum (ICC 17152, ICC 17155 and ILWC212) and four accessions of Cicer reticulatum (ILWC 110,ILWC 115, C 105 and C 106). Accessions C 105 and C 106are selected lines distinct from their respective base
populations. Out of 230 NBPGR germplasms, only twogenotypes IC 305587 and IC 2792 showed moderatelyresistant reaction and none of them were showed resistant.It was also observed that the plant types having short andbushy canopy with large leaf size showed susceptibility toBGM. High humidity built up inside the bushy canopy mightbe the reason for susceptibility to BGM (Rashid andHossain, 2017). The cut-twig technique developed by Singhet al. (1997) offers a non-destructive sampling of the plantsand proved very effective and efficient for screeningbreeding lines for their immediate utilization in crossingprogram (Singh et al. 1998). Higher levels of resistance toBGM have been found in wild Cicer species of C judaicum,C. bijugum, C. echinospermum and C. Pinnnatifidum thancultivated species (Haware, 1998; Pande et al. 2002; Pandeet al. 2006).
Cut twig technique needs less than 10 days tocomplete the disease screening experiment. This techniqueis rapid, economical and useful for screening large numberof segregating and breeding lines without destroying theplants and thus can be used to screen for other target traits.Till date few resistant lines could be identified resistant toBGM which has been widely used in breeding. Pandey etal. (2006) extensively reviewed the status of the disease,and mentioned two cultivated landraces, namely, ICC 1069and ICC 10302 which has been utilized as donor lines forstudy of inheritance of BGM. Both of these genotypes
Figure 1. Cut twig screening technique against BGMshowing the resistant and susceptible genotypes
Table 1. Screening of wild chickpea against BGM under controlled condition using cut twig techniqueDisease reaction Wild chickpea accessions NBPGR accessions Disease rating
scale observed Resistant C. judaicum: ILWC 182, ILWC 188, ICC 17151, ILWC 31, ICC 17207 Nill 2.1-3 Moderately resistant Cicer judaicum: ILWC 30, ILWC 38, ILWC 95, ILWC 211, ILWC 256, ILWC
273, ILWC 274, ILWC 278, ILWC 283, ILWC 50, ILWC 44 and ICC 182. Cicer pinnatifidum: ICC 17152, ICC 17155 and ILWC 212. Cicer reticulatum: ILWC 110, ILWC 115, C 105 and C 106
IC305587 and IC2792 (2)
3.1-5
Susceptible 82 228 5.1-9.0 Total Accession screened 107 230
Manjunatha et al. : Evaluation of wild germplasm accessions against Botrytis gray mould in Chickpea 3 5
(ICC 1069 and ICC 10302) have exotic origin which mighthave prevented their use in breeding programs. Kaur et al.(2013) has combined resistance for BGM and Ascochytablight using interspecific hybridization with C. judaicumand C. pinnatifidum accessions. In this study, all of theresistant lines identified belonged to Cicer judaicum, whichspecies has less cross ability with the cultivated speciesCicer arietinum. Strategies for trait intogression need tobe worked out for the further utilization of those lines usingembryo rescue techniques or bridge species.
REFERENCES
Butler EJ and Bisby GR. 1931. The fungi of India. Science MonographNo. 1.’ pp. XVIII 237. (ICAR: New Delhi)
Grewal JS and Laha SK. 1983. Chemical control of botrytis blight ofchickpea. Indian Phytopathology 36: 516-520
Grewal JS, Pal M and Rewal N. 1992. Botrytis gray mold of chickpeain India. In ‘Botrytis gray mold of chickpea’. (Eds MP Haware,DG Faris, CLL Gowda) pp. 6-8. (ICRISAT: Patancheru, AP,India)
Groves JW and Loveland CA. 1953. The connection betweenBotrytinia fuckeliana and Botrytis cinerea. Mycologia 45: 415-425
Haware MP. 1998. Diseases of chickpea. In ‘The pathology of foodand pasture legumes’. (Eds DJ Allen, JM Lenne) pp. 473-516.(ICARDA, CAB International: Wallingford, UK)
Joshi S. 1992. Botrytis gray mold of chickpea in Nepal. In ‘Botrytisgray mold of chickpea’. (Eds MP Haware, DG Faris, CLL Gowda)pp. 12-13. (ICRISAT: Patancheru, AP, India)
Kaur L, Sirari A, Kumar D, Sandhu JS, Singh S, Kapoor K, Singh I,Gowda CLL, Pande S, Gaur P, Sharma M, Imtiaz M and SiddiqueKHM. 2013. Combining Ascochyta blight and Botrytis greymould resistance in chickpea through interspecific hybridization.Phytopathologia Mediterranea 52(1): 157-165
Pande S, Galloway J, Gaur PM, Siddique KHM, Tripathi HS, MacLeodMWJ, Basandrai AK, Bakr A, Joshi S, Taylor P, Krishna KishoreG, Isenegger DA, Narayana Rao J and Sharma M. 2006. Botrytisgrey mould of chickpea: a review of biology, epidemiology anddisease management. Australian Journal of Agricultural Research57: 1137-1150
Pande S, Sharma M, Pathak M and Rao JN. 2006. Comparison ofgreenhouse and field screening techniques for botrytis gray moldresistance. SAT eJournal 2(1): 3
Pande S, Singh G, Narayana Rao J, Bakr MA, Chaurasia PCP, Joshi S,Johanson C, Singh SD, Kumar J, Rahman MM and Gowda CLL.2002. Integrated management of botrytis gray mold of chickpea.In Information Bulletin No. 61. Patancheru, Andhra Pradesh,India. International Crops Research Institute for the Semi-AridTropics 32 pp.
Rashid MH and Hossain MA. 2017. Screening of botrytis gray moulddisease of chickpea as compared with field screening techniquesand cut-twig method. IOSR Journal of Agriculture and VeterinaryScience 10(6): 41-44
Reddy MV, Singh O, Bharati MP, Sah RP and Joshi S. 1988. Botrytisgrey mold epiphytotic of chickpea in Nepal. InternationalChickpea Newsletter 19: 15
Sharma YR, Singh G and Kaur L. 1995. A rapid technique for ascochytablight resistance in chickpea. International Chickpea andPigeonpea Newsletter 2: 34-35
Shaw FJF and Ajrekar SL. 1915. The genus Rhizoctonia in India.Mem. Department of Agriculture in India 7: 117
Singh G, Kumar B and Sharma YR. 1997. Botrytis grey mold ofchickpea in Punjab, India. In: Haware MP, Lenne JM, GowdaCLL (eds.) Recent advances in research on botrytis grey moldof chickpea: summary proceedings of the third working groupmeeting to discuss collaborative research on botrytis grey moldof chickpea, 15-17 April 1996, Pantnagar, Uttar Pradesh, India.Patancheru 502 324, Andhra Pradesh, India: International CropsResearch Institute for the Semi-Arid Tropics pp.13-14
Singh G, Sharma YR and Bains TS. 1998. Status of botrytis greymold of chickpea research in Punjab, India. In: Pande S, BakrMA, Johansen C (eds.) Recent advances in research andmanagement of botrytis grey mold of chickpea: summaryproceedings of the fourth working group meeting to discusscollaborative research on botrytis grey mold of chickpea, 23-26 february 1998, BARI, Joydebpur, Gazipur 1701, Bangladesh.Patancheru 502 324, Andhra Pradesh, India: International CropsResearch Institute for the Semi-Arid Tropics pp. 7-14
Singh G. 1997. Epidemiology of botrytis gray mold of chickpea.Pages 47-50 in: recent advances in research on botrytis graymold of chickpea (Haware MP, Lenne JM and Gowda CLL eds.).Patancheru 502 324, Andhra Pradesh, India: International CropsResearch Institute for the Semi-Arid Tropicswww.faostat.fao.org. 2015
Journal of Food Legumes 32(1): 36-41, 2019
Status and etiology of Cercospora leaf spot of greengram in Kashmir province ofIndiaBHAT FA
University of Agricultural Sciences and Technology of Kashmir Wadura Jammu and Kashmir; E-mail:[email protected](Received : August 22, 2017 ; Accepted : November 28, 2017)
ABSTRACT
Green gram fields were surveyed in ten geographical blocksdistributed from north to south of Kashmir valley at 1580 to2000 meters above sea level and Cercospora leaf spot wasfound predominant disease ranged 6-28 per cent leaf area.Maximum disease was recorded in Lalpora (26-31%) followedby Shalimar with disease intensity of 26-30 per cent. Conidiaof the fungus were hyaline, straight to sub-straight or slightlycurved, obclavate-cylindric, 40.2-180.3 × 2.5-3.4 µm with anaverage of 102.8 × 3 µm having 1-14 septa. The diagnosticsymptoms comprised of roughly circular to irregular, whitecentered reddish brown to brown leaf spots measuring 2-12mm in diameter. Under natural epiphytotic conditionsminimum disease (2-5%) was recorded during 1st week ofaugust which picked up later and reached 42-44 per cent by1st week of october. Higher values of periodic disease (6-9%)coincided with average maximum temperature 27-30oC,minimum temperature 10-16oC, RH 82-84 per cent andperiodic rain of 2-34 mm. While maximum temperature, RHand rain persay masked their statistical significance byfluctuating around respective optima, the influence ofminimum temperature on disease was, however, statisticallysignificant for the period between 4th week of July and 2nd
week of September.
Key words: Cercospora canescens, Etiology, Epidemiology,Green gram, Leaf spot,
Pulses offer a cheaper source of dietary protein tocommon masses particularly the vegetarian group, besidesbeing a delicious dietetic variety for upper class. Greengram (Vigna radiate L.) is the third important pulse crop ofIndia and occupies 8 per cent of the total area under pulsesin the country. National Food Security Mission is underimplementation in J&K to increase production of pulsesand other crops, farmer’s income by making the farmbusiness management more profitable and to generateemployability. Although, Jammu and Kashmir relies onimport of green gram seed and its value added products, itis an important kharif crop of the state where differentpulses are grown over an area of 26.57 thousand hectareswith an annual production of 8.41 thousand tonnesincluding about 34 per cent from Kashmir province(Anonymous, 2015). The crop experiences several bioticstresses worldwide due to pathogenic fungi, bacteria,viruses and nematodes. However, the foliar fungal diseasesincluding Cercospora leaf spot are more destructive which
know to causes qualitative and quantitative lossesworldwide. The leaf spot caused by Cercospora spp. wasdeclared threat to green gram cultivation in several countriesfor its devastating appearance in crop stands (Poehlman etal. 1973). It inflicts heavy yield losses ranging from 23 to 96per cent under natural epiphytotic conditions (Kasno, 1990;Iqbal et al. 1995; Kaur, 2007). The yield losses varydepending upon how early the crop is infected in theseason, crop variety and prevailing weather conditions. Ina preliminary study wide spread incidence of some foliardiseases predominated by a fungal leaf spot manifestationtypical of Cercospora in vasion was noticed in the cropstands. Keeping in view the importance of green gram aswell as associated disease, the present study was, therefore,intended to generate timely information with respect tostatus and etiology of the disease which is a prerequisitefor devising a meaningful management program of CLS.
MATERIALS AND METHODS
The present investigations on fungal leaf spot ofgreen gram were conducted in the laboratory and theexperimental field of Plant Pathology, Sher-e-KashmirUniversity of Agricultural Sciences and Technology ofKashmir, Shalimar, located at 34o472 north latitude and74o522 east longitude at an elevation of 1591 meters abovemean sea level (masl). However, survey for estimation ofthe disease in Kashmir was conducted in some importantareas distributed from north to south of the valley at 1580to 2000 masl.Status of the disease: Status of the disease in Kashmir wasassessed by surveying ten well distributed geographicalblocks viz., Rafiabad, Bandipora, Pattan, Lalpora, Shalimar,Khansahib, Malangpora, Shopian, Kulgam and Shangusduring first fortnight of Sepember (reproductive stage ofthe crop). Each block was represented by three villagesand each village by three fields. In each field, leaves werecollected randomly from 25 plants while moving in zig zagfashion. The leaves were categorized according to 0-7 ratingscale (where 0 = no infection, 1 = one spot to 20 % diseasedarea, 3 = 21-40% diseased area, 5= 41-60% diseased areaand 7 = >60 % diseased area) and the disease intensity wascalculated by using following formula:
(nv)Disease Intensity (%) = ————— x 100
NG
Bhat FA : Status and etiology of Cercospora leaf spot of greengram 3 7
Where, n = number of leaves in a category, v =numerical value of category, N = total of leaves examinedand G = maximum category value.Identification of the pathogen: The causal fungus wasidentified on the basis of its morphology and diseasesymptomology. Morphological characters of the pathogenwere recorded with respect to conidia, conidiophores andmycelium. The fungal structures were stained and mountedin lactophenol-cottonblue solution (Weeks and Padhye,1982), and the micrometry was conducted with a calibratedcompound microscope. Symptomology was recorded undernatural epiphytotic conditions for which fifteen green gramplants (cv. Shalimar Mung 1) were randomly selected andtagged in the crop stand kept unsprayed throughout.Observations with respect to size, shape and colour oflesions, and fructification were recorded as soon as thedisease appeared and then repeated at two days intervalfor two weeks.Epidemiology: The study was conducted on anindeterminate cultivar of green gram (Shalimar Mung 1)and the data on weather variables viz., temperature, RHand rainfall were obtained from the metrological observatoryof SKUAST-K, Shalimar located close to the experimentalfield. In order to nullify the possible effect of plant age ondisease score, the later was recorded on five different agedcrop stands at a particular date which persay weremaintained by sowing green gram on five different dates(May 26, June 5, 15 and 25, and July 5) in randomized blockdesign with four replications and plot size of three metersquare while maintaining plant spacing of 30 x 10cm. Disease
was recorded from 30 to 90 days after sowing at 10 daysinterval for which a random sample of 10 plants was takenfrom each plot. Disease intensity was calculated by using0-7 rating scale as above and its correlation with weatherfactors was worked out as suggested by Gomez and Gomez(1984).
RESULTS AND DISCUSSION
Status of the disease: The data reveals that CLS of greengram was prevalent in all ten blocks of valley and theintensity ranged from 5.9 to 28.4 per cent with an overallaverage of 23 per cent (Table 1). Maximum disease intensity(31%) was recorded at one of the locations in block Lalporasituated at 1690 masl. The block also supported maximummean disease intensity and was followed by Shalimar (28%)and Shangus (27.4%) situated at 1590-1595 and 1676-1690masl, respectively. In Pattan, the disease intensity wassignificantly lower and ranged from 0-15 per cent with anaverage of 5.87 per cent though there was little differencein altitude when compared to Shalimar and Rafiabad. Thedisease intensity varied in a considerable range in most ofthe blocks. In Shopian and Khansahib blocks it varied in aclose range with respective Confidence Intervals of 23-26and 24-27 when compared with that of Pattan and otherblocks. Bandipora (16-23), Lalpora (26-31), and Rafiabad(18-26) and Shangus (25-30). The varied intensity might bedue to the adoption of different crop production practicesin general and left over infected straw as a source ofinoculum in particular. The partial role of crop remains indetermining the disease intensity of crop stand was
Table 1. Prevalence of Cercospora leaf spot of greengram in Kashmir
Name of block Altitude (masl)
Disease intensity (%) Location 1 Location 2 Location 3 Mean Confidence interval (95 %)
Bandipora 1580-1630 19.13 16.25 23.30 19.56 16.28-22.83 Rafiabad 1590-1596 26.50 18.77 20.93 22.07 18.38-25.75 Pattan 1580-1582 2.19 0.00 15.41 5.87 -1.86-13.57 Lalpora 1690-1700 31.35 26.14 27.81 28.43 25.97-30.89 Shalimar 1590-1595 28.27 25.71 30.08 28.02 25.99-30.04 Khansahib 1885-1902 26.33 23.21 24.15 24.56 23.08-26.04 Malangpora 1600-1608 27.53 23.03 27.16 25.91 23.59-28.21 Shopian 1980-1995 23.98 27.50 25.67 25.72 24.09-27.34 Kulgam 1610-1615 25.03 20.47 26.72 22.05 21.08-27.06 Shangus 1676-1690 30.85 25.22 26.18 27.41 24.60-30.19 Overall average 22.96
Table 2. Effect of weather factors on Cercospora leaf spot of greengram (Vigna radiata) during kharif 2009
SD1 to SD5 are 5 sowing dates viz., May 26, Jun 05, Jun 15, Jun 25 and July 05; *total of preceding 10 days.
Date of observation
Disease intensity (%) Weather factors Cumulative Average
Periodic Temperature (oC) RH (%) *Rain
(mm) SD1 SD2 SD3 SD4 SD5 Average Max. Min. 4-Aug 4.66 2.18 0.00 0.00 0.00 1.37 1.37 30.65 16.80 85.00 34.00 14-Aug 8.61 4.98 2.08 1.19 0.50 3.47 2.10 33.60 18.06 72.20 8.00 24-Aug 18.30 11.08 9.55 6.04 4.22 9.84 6.37 30.00 16.20 81.40 27.80 3-Sep - 26.14 19.04 17.10 12.53 18.70 8.86 29.66 14.89 77.40 12.20 13-Sep - - 32.60 29.19 24.17 28.65 9.95 27.15 9.81 81.60 14.40 23-Sep - - - 39.05 33.48 36.27 7.62 29.02 9.46 79.40 0.40 3-Oct - - - - 41.70 41.70 5.43 31.46 9.92 90.40 0.00
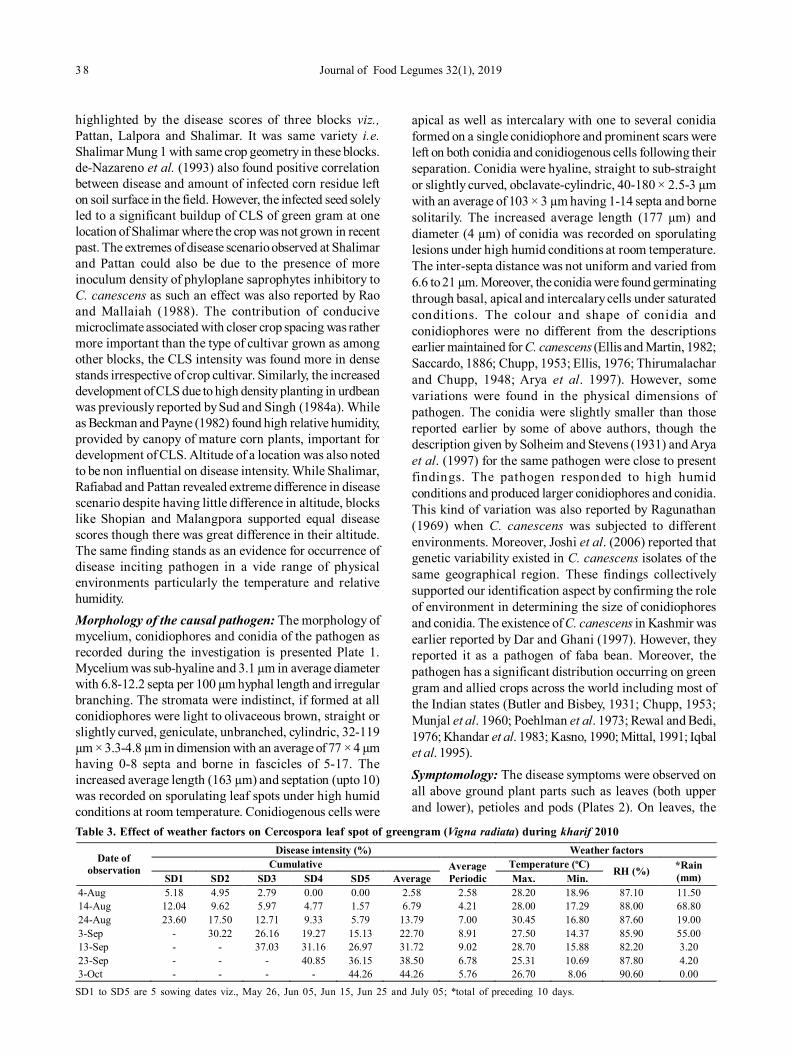
3 8 Journal of Food Legumes 32(1), 2019
highlighted by the disease scores of three blocks viz.,Pattan, Lalpora and Shalimar. It was same variety i.e.Shalimar Mung 1 with same crop geometry in these blocks.de-Nazareno et al. (1993) also found positive correlationbetween disease and amount of infected corn residue lefton soil surface in the field. However, the infected seed solelyled to a significant buildup of CLS of green gram at onelocation of Shalimar where the crop was not grown in recentpast. The extremes of disease scenario observed at Shalimarand Pattan could also be due to the presence of moreinoculum density of phyloplane saprophytes inhibitory toC. canescens as such an effect was also reported by Raoand Mallaiah (1988). The contribution of conducivemicroclimate associated with closer crop spacing was rathermore important than the type of cultivar grown as amongother blocks, the CLS intensity was found more in densestands irrespective of crop cultivar. Similarly, the increaseddevelopment of CLS due to high density planting in urdbeanwas previously reported by Sud and Singh (1984a). Whileas Beckman and Payne (1982) found high relative humidity,provided by canopy of mature corn plants, important fordevelopment of CLS. Altitude of a location was also notedto be non influential on disease intensity. While Shalimar,Rafiabad and Pattan revealed extreme difference in diseasescenario despite having little difference in altitude, blockslike Shopian and Malangpora supported equal diseasescores though there was great difference in their altitude.The same finding stands as an evidence for occurrence ofdisease inciting pathogen in a vide range of physicalenvironments particularly the temperature and relativehumidity.Morphology of the causal pathogen: The morphology ofmycelium, conidiophores and conidia of the pathogen asrecorded during the investigation is presented Plate 1.Mycelium was sub-hyaline and 3.1 µm in average diameterwith 6.8-12.2 septa per 100 µm hyphal length and irregularbranching. The stromata were indistinct, if formed at allconidiophores were light to olivaceous brown, straight orslightly curved, geniculate, unbranched, cylindric, 32-119µm × 3.3-4.8 µm in dimension with an average of 77 × 4 µmhaving 0-8 septa and borne in fascicles of 5-17. Theincreased average length (163 µm) and septation (upto 10)was recorded on sporulating leaf spots under high humidconditions at room temperature. Conidiogenous cells were
apical as well as intercalary with one to several conidiaformed on a single conidiophore and prominent scars wereleft on both conidia and conidiogenous cells following theirseparation. Conidia were hyaline, straight to sub-straightor slightly curved, obclavate-cylindric, 40-180 × 2.5-3 µmwith an average of 103 × 3 µm having 1-14 septa and bornesolitarily. The increased average length (177 µm) anddiameter (4 µm) of conidia was recorded on sporulatinglesions under high humid conditions at room temperature.The inter-septa distance was not uniform and varied from6.6 to 21 µm. Moreover, the conidia were found germinatingthrough basal, apical and intercalary cells under saturatedconditions. The colour and shape of conidia andconidiophores were no different from the descriptionsearlier maintained for C. canescens (Ellis and Martin, 1982;Saccardo, 1886; Chupp, 1953; Ellis, 1976; Thirumalacharand Chupp, 1948; Arya et al. 1997). However, somevariations were found in the physical dimensions ofpathogen. The conidia were slightly smaller than thosereported earlier by some of above authors, though thedescription given by Solheim and Stevens (1931) and Aryaet al. (1997) for the same pathogen were close to presentfindings. The pathogen responded to high humidconditions and produced larger conidiophores and conidia.This kind of variation was also reported by Ragunathan(1969) when C. canescens was subjected to differentenvironments. Moreover, Joshi et al. (2006) reported thatgenetic variability existed in C. canescens isolates of thesame geographical region. These findings collectivelysupported our identification aspect by confirming the roleof environment in determining the size of conidiophoresand conidia. The existence of C. canescens in Kashmir wasearlier reported by Dar and Ghani (1997). However, theyreported it as a pathogen of faba bean. Moreover, thepathogen has a significant distribution occurring on greengram and allied crops across the world including most ofthe Indian states (Butler and Bisbey, 1931; Chupp, 1953;Munjal et al. 1960; Poehlman et al. 1973; Rewal and Bedi,1976; Khandar et al. 1983; Kasno, 1990; Mittal, 1991; Iqbalet al. 1995).Symptomology: The disease symptoms were observed onall above ground plant parts such as leaves (both upperand lower), petioles and pods (Plates 2). On leaves, the
SD1 to SD5 are 5 sowing dates viz., May 26, Jun 05, Jun 15, Jun 25 and July 05; *total of preceding 10 days.
Table 3. Effect of weather factors on Cercospora leaf spot of greengram (Vigna radiata) during kharif 2010
Date of observation
Disease intensity (%) Weather factors Cumulative Average
Periodic Temperature (oC) RH (%) *Rain
(mm) SD1 SD2 SD3 SD4 SD5 Average Max. Min. 4-Aug 5.18 4.95 2.79 0.00 0.00 2.58 2.58 28.20 18.96 87.10 11.50 14-Aug 12.04 9.62 5.97 4.77 1.57 6.79 4.21 28.00 17.29 88.00 68.80 24-Aug 23.60 17.50 12.71 9.33 5.79 13.79 7.00 30.45 16.80 87.60 19.00 3-Sep - 30.22 26.16 19.27 15.13 22.70 8.91 27.50 14.37 85.90 55.00 13-Sep - - 37.03 31.16 26.97 31.72 9.02 28.70 15.88 82.20 3.20 23-Sep - - - 40.85 36.15 38.50 6.78 25.31 10.69 87.80 4.20 3-Oct - - - - 44.26 44.26 5.76 26.70 8.06 90.60 0.00
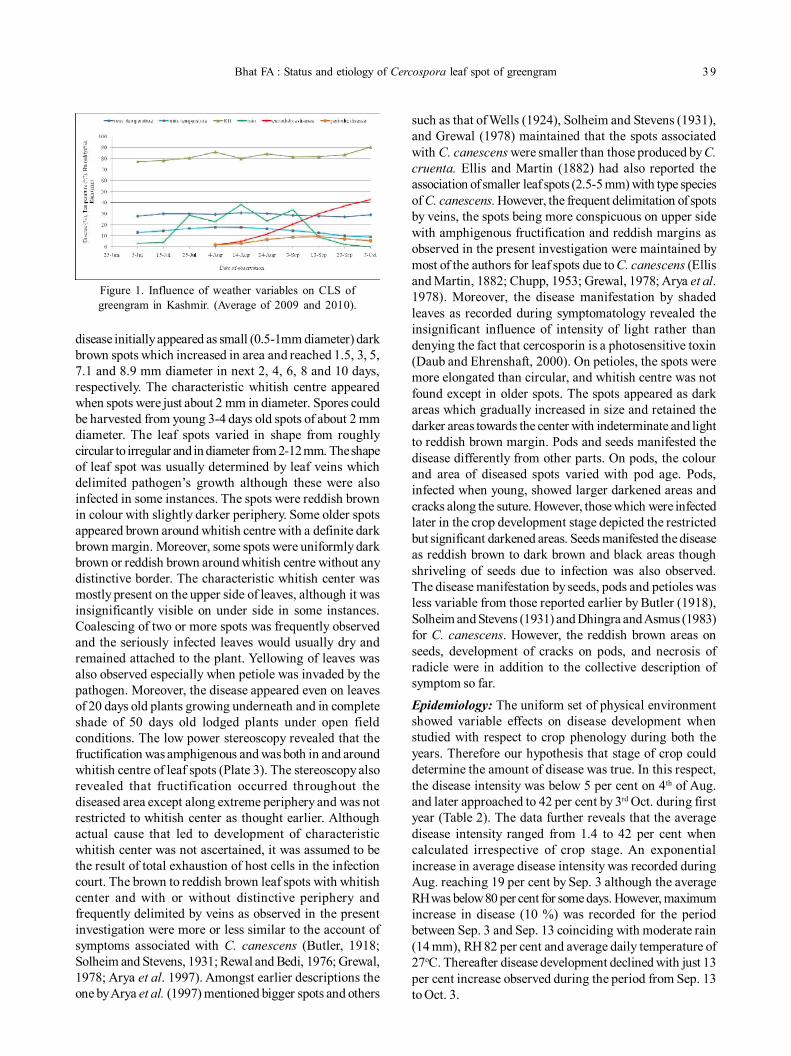
Bhat FA : Status and etiology of Cercospora leaf spot of greengram 3 9
disease initially appeared as small (0.5-1mm diameter) darkbrown spots which increased in area and reached 1.5, 3, 5,7.1 and 8.9 mm diameter in next 2, 4, 6, 8 and 10 days,respectively. The characteristic whitish centre appearedwhen spots were just about 2 mm in diameter. Spores couldbe harvested from young 3-4 days old spots of about 2 mmdiameter. The leaf spots varied in shape from roughlycircular to irregular and in diameter from 2-12 mm. The shapeof leaf spot was usually determined by leaf veins whichdelimited pathogen’s growth although these were alsoinfected in some instances. The spots were reddish brownin colour with slightly darker periphery. Some older spotsappeared brown around whitish centre with a definite darkbrown margin. Moreover, some spots were uniformly darkbrown or reddish brown around whitish centre without anydistinctive border. The characteristic whitish center wasmostly present on the upper side of leaves, although it wasinsignificantly visible on under side in some instances.Coalescing of two or more spots was frequently observedand the seriously infected leaves would usually dry andremained attached to the plant. Yellowing of leaves wasalso observed especially when petiole was invaded by thepathogen. Moreover, the disease appeared even on leavesof 20 days old plants growing underneath and in completeshade of 50 days old lodged plants under open fieldconditions. The low power stereoscopy revealed that thefructification was amphigenous and was both in and aroundwhitish centre of leaf spots (Plate 3). The stereoscopy alsorevealed that fructification occurred throughout thediseased area except along extreme periphery and was notrestricted to whitish center as thought earlier. Althoughactual cause that led to development of characteristicwhitish center was not ascertained, it was assumed to bethe result of total exhaustion of host cells in the infectioncourt. The brown to reddish brown leaf spots with whitishcenter and with or without distinctive periphery andfrequently delimited by veins as observed in the presentinvestigation were more or less similar to the account ofsymptoms associated with C. canescens (Butler, 1918;Solheim and Stevens, 1931; Rewal and Bedi, 1976; Grewal,1978; Arya et al. 1997). Amongst earlier descriptions theone by Arya et al. (1997) mentioned bigger spots and others
such as that of Wells (1924), Solheim and Stevens (1931),and Grewal (1978) maintained that the spots associatedwith C. canescens were smaller than those produced by C.cruenta. Ellis and Martin (1882) had also reported theassociation of smaller leaf spots (2.5-5 mm) with type speciesof C. canescens. However, the frequent delimitation of spotsby veins, the spots being more conspicuous on upper sidewith amphigenous fructification and reddish margins asobserved in the present investigation were maintained bymost of the authors for leaf spots due to C. canescens (Ellisand Martin, 1882; Chupp, 1953; Grewal, 1978; Arya et al.1978). Moreover, the disease manifestation by shadedleaves as recorded during symptomatology revealed theinsignificant influence of intensity of light rather thandenying the fact that cercosporin is a photosensitive toxin(Daub and Ehrenshaft, 2000). On petioles, the spots weremore elongated than circular, and whitish centre was notfound except in older spots. The spots appeared as darkareas which gradually increased in size and retained thedarker areas towards the center with indeterminate and lightto reddish brown margin. Pods and seeds manifested thedisease differently from other parts. On pods, the colourand area of diseased spots varied with pod age. Pods,infected when young, showed larger darkened areas andcracks along the suture. However, those which were infectedlater in the crop development stage depicted the restrictedbut significant darkened areas. Seeds manifested the diseaseas reddish brown to dark brown and black areas thoughshriveling of seeds due to infection was also observed.The disease manifestation by seeds, pods and petioles wasless variable from those reported earlier by Butler (1918),Solheim and Stevens (1931) and Dhingra and Asmus (1983)for C. canescens. However, the reddish brown areas onseeds, development of cracks on pods, and necrosis ofradicle were in addition to the collective description ofsymptom so far.Epidemiology: The uniform set of physical environmentshowed variable effects on disease development whenstudied with respect to crop phenology during both theyears. Therefore our hypothesis that stage of crop coulddetermine the amount of disease was true. In this respect,the disease intensity was below 5 per cent on 4th of Aug.and later approached to 42 per cent by 3rd Oct. during firstyear (Table 2). The data further reveals that the averagedisease intensity ranged from 1.4 to 42 per cent whencalculated irrespective of crop stage. An exponentialincrease in average disease intensity was recorded duringAug. reaching 19 per cent by Sep. 3 although the averageRH was below 80 per cent for some days. However, maximumincrease in disease (10 %) was recorded for the periodbetween Sep. 3 and Sep. 13 coinciding with moderate rain(14 mm), RH 82 per cent and average daily temperature of27oC. Thereafter disease development declined with just 13per cent increase observed during the period from Sep. 13to Oct. 3.
Figure 1. Influence of weather variables on CLS ofgreengram in Kashmir. (Average of 2009 and 2010).
4 0 Journal of Food Legumes 32(1), 2019
During second year the disease appeared in the lastweek of Jul. at flowering stage in early sown crop and pickedup later in the next month (Table 3). It ranged from 5.8 to 24per cent on 24th of Aug. following season’s maximum rainfallcoupled with higher RH (about 88 %). The disease intensitywas also on rise during the month of Sep. covering 44 percent leaf area as recorded on Oct. 3. The average diseaseintensity irrespective of crop phenological stages showeda linear increase in the month of Aug. The period betweenAug. 14 and Sep. 13, supporting maximum increase indisease intensity (25 %) received well distributed rain andexperienced high RH (>85 %) with average maximum andminimum temperatures of 27-30oC and 14-17oC, respectively.Thereafter a gradual decrease was recorded with mere 5.7per cent periodic increase recorded between Sep. 23 andOct. 3. Although RH remained continuously over 80 percent during Sep., slight decrease in average maximum andminimum temperature was also recorded during Sep. 13 toSep. 23 and Sep. 23 to Oct. 3, respectively.
Two year’s averaged data, depicted in Figure 1, showslinear progression of disease after appearing during earlyAug. However, there was sharp increase during 2nd fortnightof Aug. and 1st fortnight of Sep. The figure further showsthat higher values of periodic disease (>6 %) coincidedwith average maximum temperature 27-30oC, minimumtemperature 10-16.5oC, RH 82-84.5 per cent and periodicrain of 2-34 mm. The correlation and regression analysis ofthe data, presented in Table 4 and 5, reveal that most of theweather variables had non-significant effect on diseasedevelopment during the period between Jul. 25 and Sep.13. However, significant correlation was found betweenperiodic disease and minimum temperature (-0.931). Furtherregression coefficients also show that contribution ofminimum temperature (-1.480) to CLS of green gram wassignificant while that of maximum temperature (-2.011), RH(-0.489) and rain (-0.117) was non-significant. The results
apparently contradicted earlier reports which mentioned ofdirect or indirect relation of weather factors like maximumtemperature, RH and rain with CLS of green gram (Dubeyand Singh, 2006). However, our findings did not deny theinfluence of weather factors on disease at all. The influencewas rather masked by weather parameters persay forfluctuating around their respective optima throughout theseason. The argument draws support from prior reports onoptimum values of weather factors which effectedsignificant increase in CLS development on soybean(Schuh, 1991), carrot (Hooker, 1944; Carisse andKushalappa, 1992), green gram (Rewal and Bedi, 1976) andurdbean (Sud and Singh, 1984b). These results may beconstrued as evidence for the existence of favourableweather for the development of CLS on green gram duringAug. and Sep. in Kashmir.
REFERENCES
Anonymous. 2015. Economic Survey 2014-15. Directorate ofeconomics and statistics, Govt. of Jammu and Kashmir pp. 299
Arya AK, Agarwal DK, Sarbhoy AK and Pal M. 1997. Taxonomicstudies of Cercospora complex of some legume crops. IndianPhytopathology 50: 206-215
Beckman PM and Payne GA. 1982. External growth, penetrationand development of Cercospora zeae-maydis in corn leaves.Phytopathology 72: 810-815
Butler EJ. 1918. Fungi and diseases in plants. Thacker spink andCo., Calcutta 547 p
Butler EJ and Bisbey GR. 1931. The fungi of India. Imperial Councilof Agriculture Research, Science Monograph 1: 237 p
Carisse O and Kushalappa AC. 1992. Influence of interrupted wetperiods, relative humidity and temperature on infection of carrotsby Cercospora carotae. Phytopathology 82: 602-606
Chupp C. 1953. A monograph of the fungus genus Cercospora.Cornell University, Ithaca, New York. p. 288
Dar GM and Ghani MY. 1997. Additions to fungi of Kashmir-I.Plant Disease Research 12: 191-192
Daub ME and Ehrenshaft M. 2000. The photo activated Cercosporatoxin cercosporin: contributions to plant disease and fundamentalbiology. Annual Review of Phytopathology 38: 461-490
De-Nazareno NRX, Lipps PE and Madden LV. 1993. Effect of levelsof corn residue on the epidemiology of grey leaf spot of corn inOhio. Plant Disease 77: 67-70
Dhingra OD and Asmus GL. 1983. An efficient method of detectingCercospora canescens in bean seeds. Transactions of BritishMycological Society 81: 425-426
Dubey SC and Singh B. 2006. Influence of sowing time ondevelopment of Cercospora leaf spot and yellow mosaic diseasesof urdbean (Vigna mungo). Indian Journal of Agricultural Sciences76: 766-769
Ellis JB and Martin GW. 1882. Cercospora canescens. American Nt.16: 1003
Ellis MB. 1976. More Dematiaceous Hyphomycetes. Commonwealth agricultural bureaux, CMI, England 507 pp
Gomez KA and Gomez AA. 1984. Statistical procedures foragricultural research. 2nd ed. John Willey and Sons, New York.680 pp
Table 4. Simple correlation coefficients betweenCercospora leaf spot of greengram and weatherfactors
* Significant at 5%
Variables Max. Temp.
Min. Temp. RH Rain CLS
Max. Temp. 1.00 0.854* -0.004 0.637 -0.690 Min. Temp. 1.00 0.334 0.581 -0.931* RH 1.00 0.380 -0.343 Rain 1.00 -0.394 CLS 1.00
Table 5. Simple regression equations indicating therelationship of Cercospora leaf spot of greengram(Y) with weather factors
Equation R2 Y = 65.12 – 2.011 (Max. temperature) 0.477 Y = 29.56 – 1.480 (Min. temperature) 0.867 Y = 46.56 – 0.489 (Relative humidity) 0.117 Y = 8.99 – 0.117 (Rain) 0.155
Bhat FA : Status and etiology of Cercospora leaf spot of greengram 4 1
Grewal JS. 1978. Diseases of mungbean in India. In: Proceedings ofFirst International Mungbean Symposium, 16-19 Aug, 1977.University of Philippines, Los Banos, pp 165-168
Hooker WJ. 1944. Comparative study of two carrot leaf diseases.Phytopathology 34: 180-181
Iqbal SM, Ghafoor A, Basak M and Malik BA. 1995. Estimation oflosses in yield components of mungbean due to Cercospora leafspot. Pakistan Journal of Phytopathology 7: 80-81
Joshi A, Souframanien J, Chand R and Pawar SE. 2006. Geneticdiversity study of Cercospora canescens (Ellis and Martin)isolate, pathogen of Cercospora leaf spot in legumes. CurrentScience 90: 564-568
Kasno A. 1990. The tolerance of mungbean genotypes to Cercosporaleaf spot. Penelitian Palawija 5: 39-47
Kaur L. 2007. Multiple disease resistant sources of mungbean. ActaHorticulturae 752: 423-426
Khandar RR, Bhatnagar MK and Rawal PP. 1983. Evaluation ofsome commercial varieties of mungbean (Vigna radiata) againstthe leaf spot caused by Cercospora canescens . AgriculturalScience Digest 3: 182-184
Mittal RK. 1991. Fungicidal control of Cercospora leaf spot ofgreen gram (Vigna radiata) in Kumaon Hills of Uttar Pradesh.Indian Journal of Mycology and Plant Pathology 21: 283-284
Munjal RL, Lall G and Chona BL. 1960. Some Cercospora speciesfrom India-IV. Indian Phytopathology 13: 144-145
Poehlman JM, Sechler DT, Yoke JM, Watt EE, Swindell RE andBashandi MMH. 1973. Performance of the 1 st InternationalMungbean Nursery. Missouri Agricultural Experiment StationSpecial Report pp. 158-200
Ragunathan AN. 1969. The role of environment with relation tothe morphology of Cercospora dolichi E and E and C. canescensE and M. Madras Agricultural Journal 95: 608-610
Rao PB and Mallaiah KV. 1988. Effect of phyloplane fungi on theleaf spot pathogen Cercospora canescens. Indian Journal ofMicrobiology 28: 103-107
Rewal HS and Bedi PS. 1976. Epidemiology and control of Cercosporaleaf spot of mungbean in Punjab. Indian Phytopathology 29:102-103
Saccardo PA. 1886. Cercospora canescens Ellis and Martin. SyllogeFungorum 4: 435pp
Schuh W. 1991. Influence of temperature and leaf wetness period onconidial germination in vitro and infection of Cercospora kikuchiion soyabean. Phytopathology 81: 1315-1318
Solheim WG and Stevens FL. 1931. Cercospora studies II. Sometropical Cercospora. Mycologia 23: 365-405
Sud VK and Singh BM. 1984a. Effect of sowing date and row spacingon the development of leaf spot in urdbean. IndianPhytopathology 37: 288-293
Sud VK and Singh BM. 1984b. Effect of environmental factors onthe development of leaf spot in urdbean. Indian Phytopathology37: 511-515
Thirumalachar MJ and Chupp C. 1948. Notes on some Cercosporaof India. Mycologia 40: 352-362
Weeks RJ and Padhye AA. 1982. A mounting media for permanentpreparations of microfungi. Mykosen 25: 702-704
Wells CG. 1924. Studies on leaf spot of Phaseolusaureus new to thePhilippines Islands. Phytopathology 14: 351-358
Journal of Food Legumes 32(1): 42-44, 2019
ABSTRACT
The field experiment was conducted at Education andResearch Farm, Department of Agriculture Botany, Collegeof Agriculture, Dapoli during rabi 2017-2018 to study effectof biocontrol agents on physiochemical aspects of Lablabpurpureus L. The experiment was laid out in randomizedblock design with seven treatments in three replications.The seven treatment were T0 RDF only, T1 Rhizobiumtreatment, T2 RDF + T1, T3 Tricoderma viride (4ml/lit) + T1, T4Pseudomonas fluorescence (4ml/lit) + T1, T5 Bacillus subtilis(4ml/lit) + T1, T6 -Paceilomyces lilacinus (4ml/lit) + T1respectively. Different bio control agents were appliedthrough foliar spray at 2nd and 4th week after sowing. Datawere collected on plant height, number of branches, numberof leaves, days to 50% flowering, days to maturity, numberof pods per plant, number of pods per plant, no of grains perpod, pod yield per plant (g), pod yield per plot (kg), grainyield per plant (g), grain yield per plot (g) at the interval of30, 60, 90 DAS and at physiological maturity. Growth periodof the crop significantly reduced with the application of biocontrol agent. The treatment paceilomyces lilacinus Bacillussubtilis Pseudomonas fluorescence and Trichoderma harzianumwere superior in physiological attributes and growthparameter among all the treatments. So there is a need offurther research work on different bio-control agents toassess their potential for developing smart greentechnologies in agriculture. Physiological role of biocontrolagent in mitigating the morphological related consequencesof crop are discussed.
Key words: Biocontrol agent, Morphological, Yield attributes
Lablab bean (Lablab purpureus L.) is an ancientlegume crop widely grown throughout the world for itsvegetable or pulse for human consumption or used as acover crop (Mureithi et al. 2003). The plant is variable dueto wide genetic variation in cultivation, but in general, theyare annual or short-lived perennial vines. It is popularlyknown as ‘Wal’ in Maharashtra state. India ranks first inthe world in terms of pulse production (25 per cent totalworlds production) (FAOSTAT, 2015). In India, the areaunder rabi pulses cultivation was 190.40 lakh hectares with124 lakh tonnes total production of pulses and productivitywas 651.2 kg per hectare (Anon., 2015). Maharashtra had 1,125 thousand hectare area and 2, 268 million tonnes totalpulses production with 743 kg per hectare productivity ofpulses (Anonymous, 2017). Yield is a complex trait governedby many traits and there are ample evidences to show thatselections directly for grain yield in plants are not easy.The basic studies on the basis of morpho-physiological
Effect of bio control agent on morphological and yield related aspects of Lablabpurpureus L.ADSUL VD, MANE AV, BURONDKAR MM, BHAVE SG and KASTURE MC
Dr. Balasaheb Sawant Konkan Krishi Vidyapeeth, Dapoli; E-mail: [email protected](Received : April 05, 2018 ; Accepted : September 03, 2018)
traits are needed to overcome the yield barriers within thegenotypes. It is ultimately the we either morpho-physiological thought out the M/S variations, which isimportant for realizing higher productivity as evident fromvery high and positive association within traits. The presentinvestigation was, therefore, undertaken to assess thephysio-morphological variability among collectedgenotypes. Bio-control agents are often used for thecontrolling pest and diseases. But the potential of bio-control agents for improvisation of physiological,biochemical and quality aspects in different pulses is yetto understood in systematic and scientific manner. Inducedsystemic resistance is the ability of an agent (a fungus,bacteria, virus, chemical etc.) to induce plant defensemechanisms that lead to systemic resistance to a numberof pathogens.
MATERIALS AND METHODS
The field experiment was conducted at Education andResearch Farm, Dept. of Agril. Botany, College ofAgriculture, Dapoli during rabi 2017-18. Variety of wal i.e.Kokan wal 2 was selected for study with seven treatmentsand three replication.
Treatments Details T0 RDF only explain what dose NPK was applied T1 Rhizobium treatment T2 RDF + Rhizobium treatment (T1) T3 Tricoderma harzianum (4ml/lit) + Rhizobium treatment
( T1) T4 Pseudomonas fluorescnce (4ml/lit) + Rhizobium
treatment (T1) T5 Bacillus subtilis (4ml/lit) + Rhizobium treatment (T1) T6 Pacilomyces lilacinus (4ml/lit) + Rhizobium treatment
(T1)
Table 1. Treatments details
Bio-controls were procured from the Krishi VigyanKendra Baramati Dist. Pune and utilize in the experiment.Seeds of variety Kokan wal 2 were taken from theDepartment of Agril. Botany, Dapoli. Sowing was done atspacing of 30×30 cm. Thinning was done 10 days aftersowing to retain one plant per hill. Five plants wererandomly selected in each genotype and replication. Variousmorphological characters viz., plant height (cm), number ofbranches, number of leaves, days to 50% flowering, daysto maturity and yield parameters were studied. Criticaldifferences were calculated at five per cent level ofsignificance. Based on the results, high yielding treatmentswere identified.
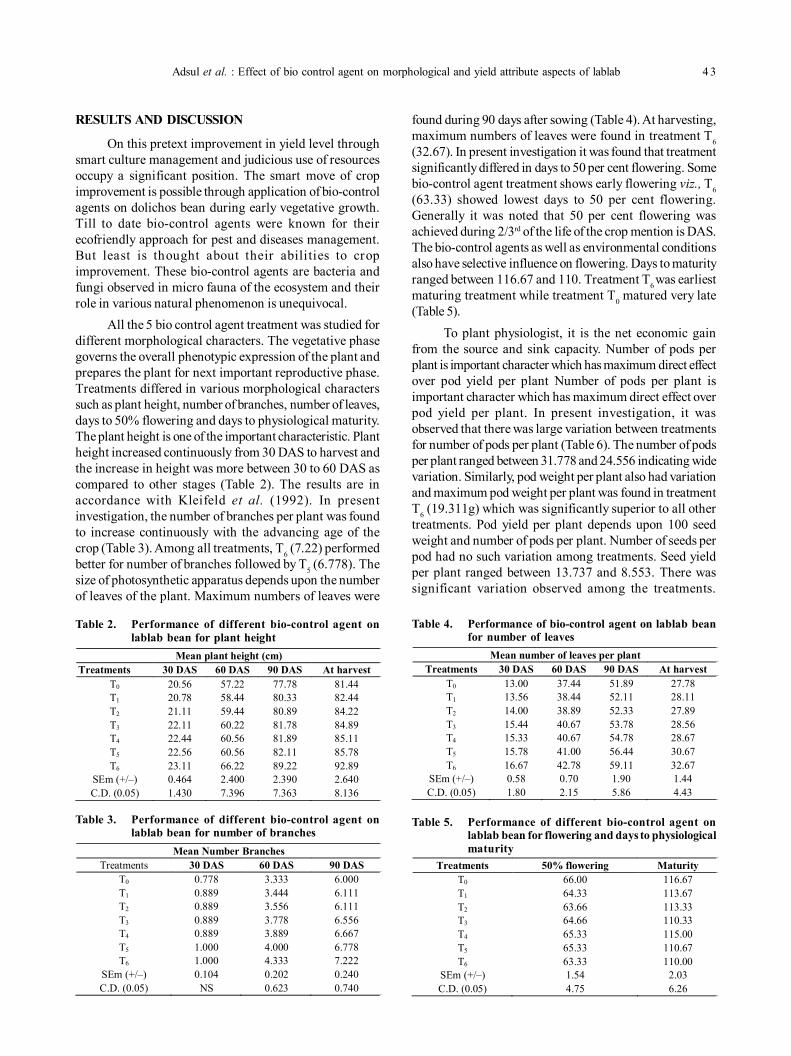
Adsul et al. : Effect of bio control agent on morphological and yield attribute aspects of lablab 4 3
RESULTS AND DISCUSSION
On this pretext improvement in yield level throughsmart culture management and judicious use of resourcesoccupy a significant position. The smart move of cropimprovement is possible through application of bio-controlagents on dolichos bean during early vegetative growth.Till to date bio-control agents were known for theirecofriendly approach for pest and diseases management.But least is thought about their abilities to cropimprovement. These bio-control agents are bacteria andfungi observed in micro fauna of the ecosystem and theirrole in various natural phenomenon is unequivocal.
All the 5 bio control agent treatment was studied fordifferent morphological characters. The vegetative phasegoverns the overall phenotypic expression of the plant andprepares the plant for next important reproductive phase.Treatments differed in various morphological characterssuch as plant height, number of branches, number of leaves,days to 50% flowering and days to physiological maturity.The plant height is one of the important characteristic. Plantheight increased continuously from 30 DAS to harvest andthe increase in height was more between 30 to 60 DAS ascompared to other stages (Table 2). The results are inaccordance with Kleifeld et al. (1992). In presentinvestigation, the number of branches per plant was foundto increase continuously with the advancing age of thecrop (Table 3). Among all treatments, T6 (7.22) performedbetter for number of branches followed by T5 (6.778). Thesize of photosynthetic apparatus depends upon the numberof leaves of the plant. Maximum numbers of leaves were
found during 90 days after sowing (Table 4). At harvesting,maximum numbers of leaves were found in treatment T6(32.67). In present investigation it was found that treatmentsignificantly differed in days to 50 per cent flowering. Somebio-control agent treatment shows early flowering viz., T6(63.33) showed lowest days to 50 per cent flowering.Generally it was noted that 50 per cent flowering wasachieved during 2/3rd of the life of the crop mention is DAS.The bio-control agents as well as environmental conditionsalso have selective influence on flowering. Days to maturityranged between 116.67 and 110. Treatment T6 was earliestmaturing treatment while treatment T0 matured very late(Table 5).
To plant physiologist, it is the net economic gainfrom the source and sink capacity. Number of pods perplant is important character which has maximum direct effectover pod yield per plant Number of pods per plant isimportant character which has maximum direct effect overpod yield per plant. In present investigation, it wasobserved that there was large variation between treatmentsfor number of pods per plant (Table 6). The number of podsper plant ranged between 31.778 and 24.556 indicating widevariation. Similarly, pod weight per plant also had variationand maximum pod weight per plant was found in treatmentT6 (19.311g) which was significantly superior to all othertreatments. Pod yield per plant depends upon 100 seedweight and number of pods per plant. Number of seeds perpod had no such variation among treatments. Seed yieldper plant ranged between 13.737 and 8.553. There wassignificant variation observed among the treatments.
Table 2. Performance of different bio-control agent onlablab bean for plant height
Mean plant height (cm) Treatments 30 DAS 60 DAS 90 DAS At harvest
T0 20.56 57.22 77.78 81.44 T1 20.78 58.44 80.33 82.44 T2 21.11 59.44 80.89 84.22 T3 22.11 60.22 81.78 84.89 T4 22.44 60.56 81.89 85.11 T5 22.56 60.56 82.11 85.78 T6 23.11 66.22 89.22 92.89
SEm (+/–) 0.464 2.400 2.390 2.640 C.D. (0.05) 1.430 7.396 7.363 8.136
Table 3. Performance of different bio-control agent on
lablab bean for number of branchesMean Number Branches
Treatments 30 DAS 60 DAS 90 DAS T0 0.778 3.333 6.000 T1 0.889 3.444 6.111 T2 0.889 3.556 6.111 T3 0.889 3.778 6.556 T4 0.889 3.889 6.667 T5 1.000 4.000 6.778 T6 1.000 4.333 7.222
SEm (+/–) 0.104 0.202 0.240 C.D. (0.05) NS 0.623 0.740
Table 4. Performance of bio-control agent on lablab beanfor number of leaves
Mean number of leaves per plant Treatments 30 DAS 60 DAS 90 DAS At harvest
T0 13.00 37.44 51.89 27.78 T1 13.56 38.44 52.11 28.11 T2 14.00 38.89 52.33 27.89 T3 15.44 40.67 53.78 28.56 T4 15.33 40.67 54.78 28.67 T5 15.78 41.00 56.44 30.67 T6 16.67 42.78 59.11 32.67
SEm (+/–) 0.58 0.70 1.90 1.44 C.D. (0.05) 1.80 2.15 5.86 4.43
Table 5. Performance of different bio-control agent on
lablab bean for flowering and days to physiologicalmaturity
Treatments 50% flowering Maturity T0 66.00 116.67 T1 64.33 113.67 T2 63.66 113.33 T3 64.66 110.33 T4 65.33 115.00 T5 65.33 110.67 T6 63.33 110.00
SEm (+/–) 1.54 2.03 C.D. (0.05) 4.75 6.26
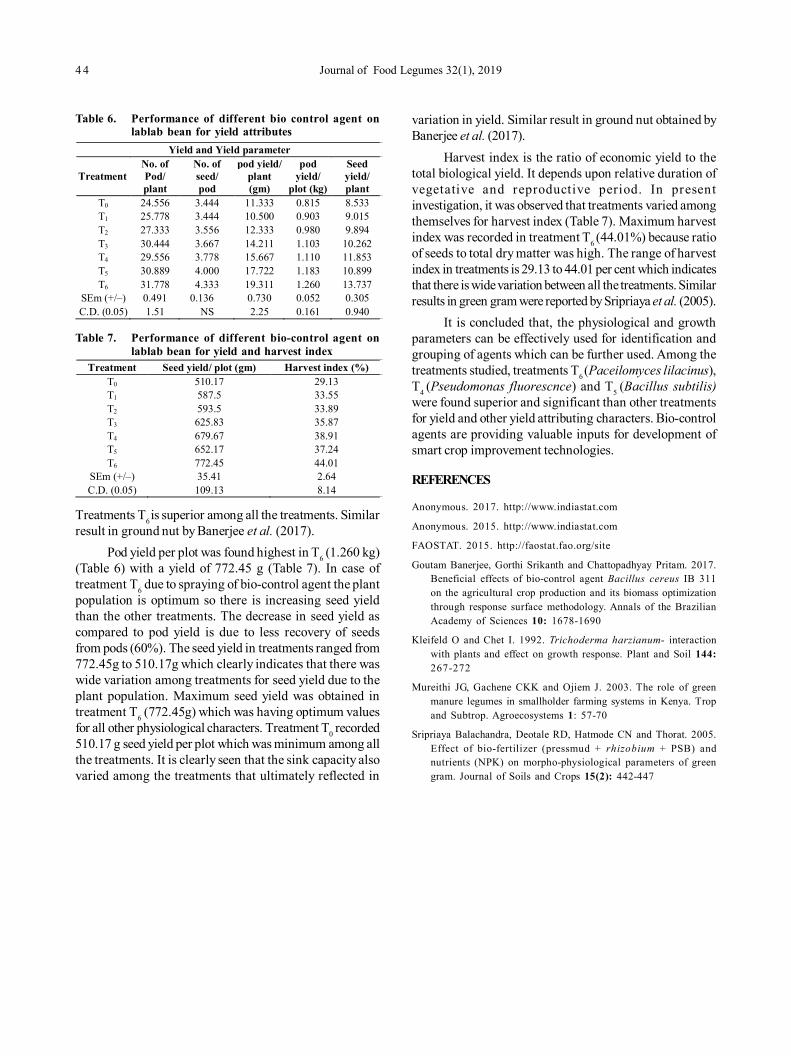
4 4 Journal of Food Legumes 32(1), 2019
Treatments T6 is superior among all the treatments. Similarresult in ground nut by Banerjee et al. (2017).
Pod yield per plot was found highest in T6 (1.260 kg)(Table 6) with a yield of 772.45 g (Table 7). In case oftreatment T6 due to spraying of bio-control agent the plantpopulation is optimum so there is increasing seed yieldthan the other treatments. The decrease in seed yield ascompared to pod yield is due to less recovery of seedsfrom pods (60%). The seed yield in treatments ranged from772.45g to 510.17g which clearly indicates that there waswide variation among treatments for seed yield due to theplant population. Maximum seed yield was obtained intreatment T6 (772.45g) which was having optimum valuesfor all other physiological characters. Treatment T0 recorded510.17 g seed yield per plot which was minimum among allthe treatments. It is clearly seen that the sink capacity alsovaried among the treatments that ultimately reflected in
Table 6. Performance of different bio control agent onlablab bean for yield attributes
Yield and Yield parameter
Treatment No. of Pod/ plant
No. of seed/ pod
pod yield/ plant (gm)
pod yield/
plot (kg)
Seed yield/ plant
T0 24.556 3.444 11.333 0.815 8.533 T1 25.778 3.444 10.500 0.903 9.015 T2 27.333 3.556 12.333 0.980 9.894 T3 30.444 3.667 14.211 1.103 10.262 T4 29.556 3.778 15.667 1.110 11.853 T5 30.889 4.000 17.722 1.183 10.899 T6 31.778 4.333 19.311 1.260 13.737
SEm (+/–) 0.491 0.136 0.730 0.052 0.305 C.D. (0.05) 1.51 NS 2.25 0.161 0.940
Table 7. Performance of different bio-control agent on
lablab bean for yield and harvest indexTreatment Seed yield/ plot (gm) Harvest index (%)
T0 510.17 29.13 T1 587.5 33.55 T2 593.5 33.89 T3 625.83 35.87 T4 679.67 38.91 T5 652.17 37.24 T6 772.45 44.01
SEm (+/–) 35.41 2.64 C.D. (0.05) 109.13 8.14
variation in yield. Similar result in ground nut obtained byBanerjee et al. (2017).
Harvest index is the ratio of economic yield to thetotal biological yield. It depends upon relative duration ofvegetative and reproductive period. In presentinvestigation, it was observed that treatments varied amongthemselves for harvest index (Table 7). Maximum harvestindex was recorded in treatment T6 (44.01%) because ratioof seeds to total dry matter was high. The range of harvestindex in treatments is 29.13 to 44.01 per cent which indicatesthat there is wide variation between all the treatments. Similarresults in green gram were reported by Sripriaya et al. (2005).
It is concluded that, the physiological and growthparameters can be effectively used for identification andgrouping of agents which can be further used. Among thetreatments studied, treatments T6 (Paceilomyces lilacinus),T4 (Pseudomonas fluorescnce) and T5 (Bacillus subtilis)were found superior and significant than other treatmentsfor yield and other yield attributing characters. Bio-controlagents are providing valuable inputs for development ofsmart crop improvement technologies.
REFERENCES
Anonymous. 2017. http://www.indiastat.com
Anonymous. 2015. http://www.indiastat.com
FAOSTAT. 2015. http://faostat.fao.org/site
Goutam Banerjee, Gorthi Srikanth and Chattopadhyay Pritam. 2017.Beneficial effects of bio-control agent Bacillus cereus IB 311on the agricultural crop production and its biomass optimizationthrough response surface methodology. Annals of the BrazilianAcademy of Sciences 10: 1678-1690
Kleifeld O and Chet I. 1992. Trichoderma harzianum- interactionwith plants and effect on growth response. Plant and Soil 144:267-272
Mureithi JG, Gachene CKK and Ojiem J. 2003. The role of greenmanure legumes in smallholder farming systems in Kenya. Tropand Subtrop. Agroecosystems 1: 57-70
Sripriaya Balachandra, Deotale RD, Hatmode CN and Thorat. 2005.Effect of bio-fertilizer (pressmud + rhizobium + PSB) andnutrients (NPK) on morpho-physiological parameters of greengram. Journal of Soils and Crops 15(2): 442-447
Journal of Food Legumes 32(1): 45-48, 2019
Pulse based bio-village sustainable models through participatory demonstrationsfor livelihood securityRAJESH KUMAR, NARENDRA PRASAD1, VK GAUTAM2, CHANDRA MANI TRIPATHI,RAVINDRA SINGH, ROHIT KUMAR and CS PRAHARAJ
ICAR-Indian Institute of Pulses Research, Kanpur, Uttar Pradesh, 1Krishi Vigyan Kendra, Shahjahanpur, UttarPradesh 2Krishi Vigyan Kendra, Chitrakoot, Uttar Pradesh; E-mail : [email protected](Received : July 08, 2018 ; Accepted : September 12, 2018)
ABSTRACT
A study to evaluate on sustainability of bio-village throughfarmers’ participation in pulses was carried out at two villagesnamely, Barapur in Shahjahanpur district and Kucharamin Chitrakoot district in Uttar Pradesh, India. This studywas based on a Department of Biotechnology (DBT),Government of India funded project on “Development ofpulses based bio-village sustainable models through actionresearch for livelihood security under different agro-ecosystems in Uttar Pradesh”. The project was implementedin collaboration with two Krishi Vigyan Kendras located atthe respective district of Chitrakoot and Shahjahanpur. Theprogrammes were selected for action research withdemonstrations and seed production of kharif and rabi pulsesamong 70 farmers. Farmers were also facilitated with fieldlevel trainings and meetings. The crops were managed withpesticides for control of pod borer in chickpea.Demonstrations on improved urdbean and mungbeanvarieties showed higher crop performance (853 kg/ha and883kg/ha, respectively) in Shahjahanpur district. Inaddition, still higher yields were recorded in Chitrakootdistrict in both these crops (urdbean with 1120 kg andmungbean with 1133 kg per hectare). Further, theperformance of chickpea varieties was reverse at both thesedistricts (JG 14 and JG 16 with 1450 and 1500 kg/ha,respectively at Shahjahanpur while the correspondingfigures at Chitrakoot were 1418 and 1337 kg/ha, respectively).Thus, promotion of mungbean & urdbean in Chitrakootwhile that of chickpea in Shahjahanpur could be made as itwas associated with ecology of the region. Besides cropperformance, a total 2768 kg quality seed of chickpea‘Ujjawal’ was distributed to 21 farmers under seed hubprogramme to enable the farmers self-sufficient in seedproduction. A rapidly multiplying earthworm ‘Eisenia foetida’was also given to farmers for improvising vermi-compostingthrough construction of 34 vermi-compost structures (of size10x3x2 ft) which generated great deal of interest andawareness among the farmers for promotion of organicagriculture in pulses. Besides these, the waste decomposerdeveloped by National Bio-fertilizer Development Centerwas also demonstrated to 40 farmers for production ofbiofertilizers. Two IIPR mini dal mills were alsodemonstrated and supplied for value addition andemployment creation through pulses. The implementationof the project was an eye opener to other farmers in theneighborhoods to follow and adopt.
Key words: Bio-pesticide, Pulse based bio-village, Vermi-compost, Waste decomposer
The concept of bio-village is not new now-a-days. Itis in fact based on sustainable models mainly acceptingthe principle of mutual cooperation and participation aimingat welfare of the community. The farmer needs are diverseas it is involved with sustaining his livelihood securitywhich may be a crop, animal enterprise or both. On aparticular commodity level, it includes the system in totalityright from initiation (of a particular enterprise) to finaldisposal/marketing of the same. Many of the concepts onsustainable models are in vogue in villages and in fact basedon welfare or holistic development of a farmer or a farmingcommunity. And the farmers’ active participation is a must(Mishra et al. 2012). The sustainable models again satisfyboth the state/country’s mandate and UN’s 17-pointsSustainability Development Goals (SDG).
Various activities orienting towards welfare of farmingcommunity are in force. Out of this sustainability of thebio-village is very important because it assists the farmingcommunity directly through raising their farm income/employment and maintaining livelihood security for them.However, evaluation of sustainability of bio-village throughfarmers’ participation in crops including pulses is necessaryto assess their progress so far and the objective to berealized (Ali and Gupta 2012). These programmes havealready been carried out across the country as a whole andUttar Pradesh in Particular (Singh et al. 2009-10, 2010). Thus,these studies aiming at evaluation of sustainability of bio-village through farmers’ participation are important becauseit helps to have a appraisal for mid-term correction/improvement required, if any besides plugging the loopholes to realize the objectives set forth (Ali and Kumar2006). Keeping in view of its importance, a project wasimplemented to evaluate sustainability of bio-villagethrough farmers’ participation in pulses at two villagesnamely, Barapur in district Shahjahanpur and Kucharam indistrict Chitrakoot in Uttar Pradesh, India.
MATERIALS AND METHODS
The study was carried out at two villages namely,Barapur in Shahjahanpur district and Kucharam inChitrakoot district of Uttar Pradesh, India. The study was,in fact, based on a Project funded by Department ofBiotechnology, Government of India on “Development ofpulses based bio-village sustainable models through actionresearch for livelihood security under different agro-
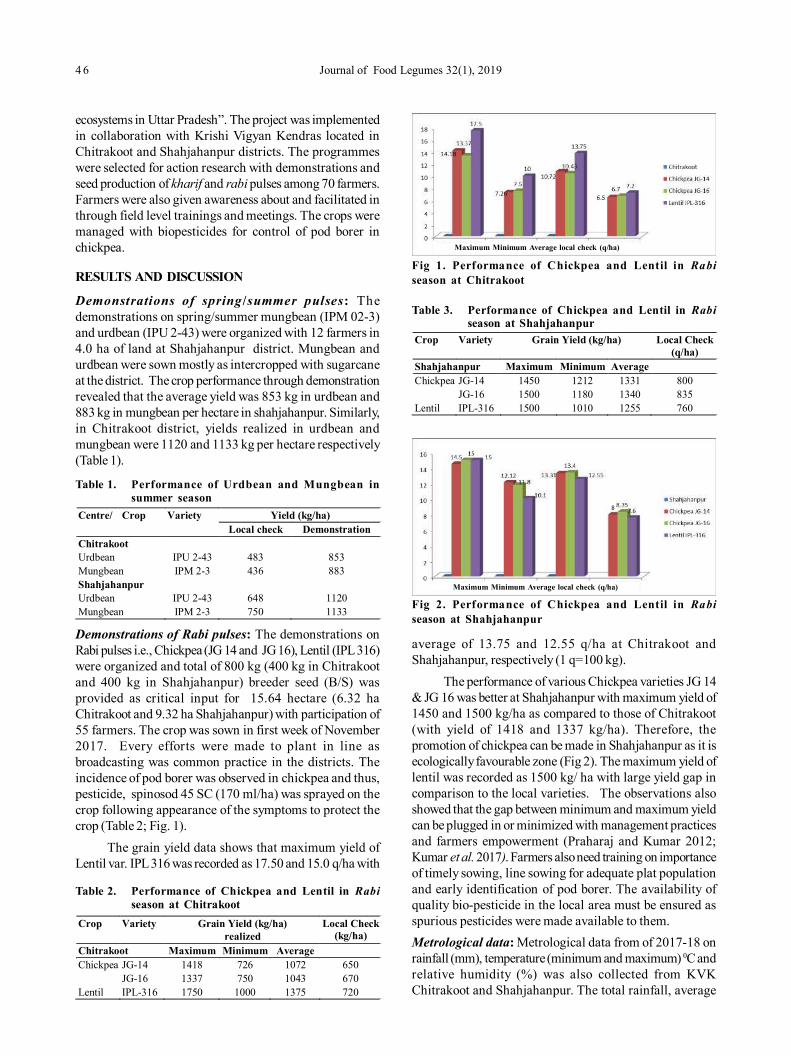
4 6 Journal of Food Legumes 32(1), 2019
ecosystems in Uttar Pradesh”. The project was implementedin collaboration with Krishi Vigyan Kendras located inChitrakoot and Shahjahanpur districts. The programmeswere selected for action research with demonstrations andseed production of kharif and rabi pulses among 70 farmers.Farmers were also given awareness about and facilitated inthrough field level trainings and meetings. The crops weremanaged with biopesticides for control of pod borer inchickpea.
RESULTS AND DISCUSSION
Demonstrations of spring/summer pulses: Thedemonstrations on spring/summer mungbean (IPM 02-3)and urdbean (IPU 2-43) were organized with 12 farmers in4.0 ha of land at Shahjahanpur district. Mungbean andurdbean were sown mostly as intercropped with sugarcaneat the district. The crop performance through demonstrationrevealed that the average yield was 853 kg in urdbean and883 kg in mungbean per hectare in shahjahanpur. Similarly,in Chitrakoot district, yields realized in urdbean andmungbean were 1120 and 1133 kg per hectare respectively(Table 1).
Table 1. Performance of Urdbean and Mungbean insummer season
Yield (kg/ha) Centre/ Crop Variety Local check Demonstration
Chitrakoot Urdbean IPU 2-43 483 853 Mungbean IPM 2-3 436 883 Shahjahanpur Urdbean IPU 2-43 648 1120 Mungbean IPM 2-3 750 1133
Demonstrations of Rabi pulses: The demonstrations onRabi pulses i.e., Chickpea (JG 14 and JG 16), Lentil (IPL 316)were organized and total of 800 kg (400 kg in Chitrakootand 400 kg in Shahjahanpur) breeder seed (B/S) wasprovided as critical input for 15.64 hectare (6.32 haChitrakoot and 9.32 ha Shahjahanpur) with participation of55 farmers. The crop was sown in first week of November2017. Every efforts were made to plant in line asbroadcasting was common practice in the districts. Theincidence of pod borer was observed in chickpea and thus,pesticide, spinosod 45 SC (170 ml/ha) was sprayed on thecrop following appearance of the symptoms to protect thecrop (Table 2; Fig. 1).
The grain yield data shows that maximum yield ofLentil var. IPL 316 was recorded as 17.50 and 15.0 q/ha with
Crop Variety Grain Yield (kg/ha) realized
Local Check (kg/ha)
Chitrakoot Maximum Minimum Average JG-14 1418 726 1072 650 Chickpea JG-16 1337 750 1043 670
Lentil IPL-316 1750 1000 1375 720
Table 2. Performance of Chickpea and Lentil in Rabiseason at Chitrakoot
average of 13.75 and 12.55 q/ha at Chitrakoot andShahjahanpur, respectively (1 q=100 kg).
The performance of various Chickpea varieties JG 14& JG 16 was better at Shahjahanpur with maximum yield of1450 and 1500 kg/ha as compared to those of Chitrakoot(with yield of 1418 and 1337 kg/ha). Therefore, thepromotion of chickpea can be made in Shahjahanpur as it isecologically favourable zone (Fig 2). The maximum yield oflentil was recorded as 1500 kg/ ha with large yield gap incomparison to the local varieties. The observations alsoshowed that the gap between minimum and maximum yieldcan be plugged in or minimized with management practicesand farmers empowerment (Praharaj and Kumar 2012;Kumar et al. 2017). Farmers also need training on importanceof timely sowing, line sowing for adequate plat populationand early identification of pod borer. The availability ofquality bio-pesticide in the local area must be ensured asspurious pesticides were made available to them.Metrological data: Metrological data from of 2017-18 onrainfall (mm), temperature (minimum and maximum) 0C andrelative humidity (%) was also collected from KVKChitrakoot and Shahjahanpur. The total rainfall, average
Table 3. Performance of Chickpea and Lentil in Rabiseason at Shahjahanpur
Crop Variety Grain Yield (kg/ha) Local Check (q/ha)
Shahjahanpur Maximum Minimum Average JG-14 1450 1212 1331 800 Chickpea JG-16 1500 1180 1340 835
Lentil IPL-316 1500 1010 1255 760
Fig 1. Performance of Chickpea and Lentil in Rabiseason at Chitrakoot
Maximum Minimum Average local check (q/ha)
Fig 2. Performance of Chickpea and Lentil in Rabiseason at Shahjahanpur
Maximum Minimum Average local check (q/ha)
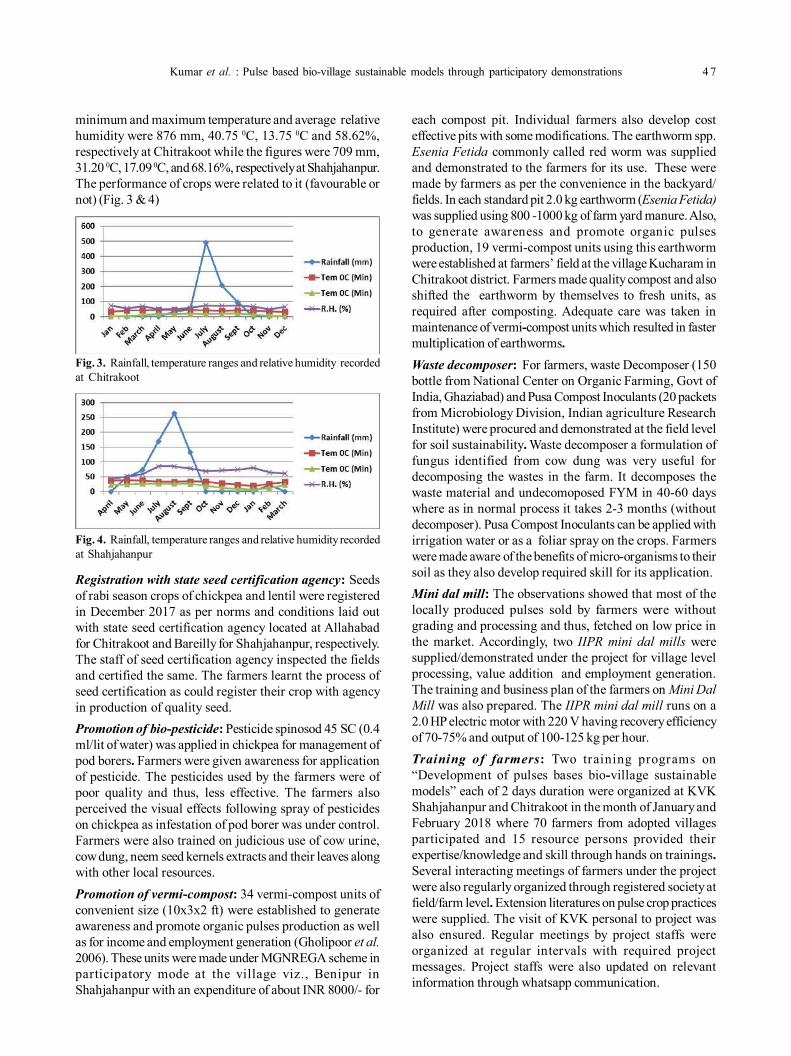
Kumar et al. : Pulse based bio-village sustainable models through participatory demonstrations 4 7
minimum and maximum temperature and average relativehumidity were 876 mm, 40.75 0C, 13.75 0C and 58.62%,respectively at Chitrakoot while the figures were 709 mm,31.20 0C, 17.09 0C, and 68.16%, respectively at Shahjahanpur.The performance of crops were related to it (favourable ornot) (Fig. 3 & 4)
each compost pit. Individual farmers also develop costeffective pits with some modifications. The earthworm spp.Esenia Fetida commonly called red worm was suppliedand demonstrated to the farmers for its use. These weremade by farmers as per the convenience in the backyard/fields. In each standard pit 2.0 kg earthworm (Esenia Fetida)was supplied using 800 -1000 kg of farm yard manure. Also,to generate awareness and promote organic pulsesproduction, 19 vermi-compost units using this earthwormwere established at farmers’ field at the village Kucharam inChitrakoot district. Farmers made quality compost and alsoshifted the earthworm by themselves to fresh units, asrequired after composting. Adequate care was taken inmaintenance of vermi-compost units which resulted in fastermultiplication of earthworms.Waste decomposer: For farmers, waste Decomposer (150bottle from National Center on Organic Farming, Govt ofIndia, Ghaziabad) and Pusa Compost Inoculants (20 packetsfrom Microbiology Division, Indian agriculture ResearchInstitute) were procured and demonstrated at the field levelfor soil sustainability. Waste decomposer a formulation offungus identified from cow dung was very useful fordecomposing the wastes in the farm. It decomposes thewaste material and undecomoposed FYM in 40-60 dayswhere as in normal process it takes 2-3 months (withoutdecomposer). Pusa Compost Inoculants can be applied withirrigation water or as a foliar spray on the crops. Farmerswere made aware of the benefits of micro-organisms to theirsoil as they also develop required skill for its application.Mini dal mill: The observations showed that most of thelocally produced pulses sold by farmers were withoutgrading and processing and thus, fetched on low price inthe market. Accordingly, two IIPR mini dal mills weresupplied/demonstrated under the project for village levelprocessing, value addition and employment generation.The training and business plan of the farmers on Mini DalMill was also prepared. The IIPR mini dal mill runs on a2.0 HP electric motor with 220 V having recovery efficiencyof 70-75% and output of 100-125 kg per hour.Training of farmers: Two training programs on“Development of pulses bases bio-village sustainablemodels” each of 2 days duration were organized at KVKShahjahanpur and Chitrakoot in the month of January andFebruary 2018 where 70 farmers from adopted villagesparticipated and 15 resource persons provided theirexpertise/knowledge and skill through hands on trainings.Several interacting meetings of farmers under the projectwere also regularly organized through registered society atfield/farm level. Extension literatures on pulse crop practiceswere supplied. The visit of KVK personal to project wasalso ensured. Regular meetings by project staffs wereorganized at regular intervals with required projectmessages. Project staffs were also updated on relevantinformation through whatsapp communication.
Registration with state seed certification agency: Seedsof rabi season crops of chickpea and lentil were registeredin December 2017 as per norms and conditions laid outwith state seed certification agency located at Allahabadfor Chitrakoot and Bareilly for Shahjahanpur, respectively.The staff of seed certification agency inspected the fieldsand certified the same. The farmers learnt the process ofseed certification as could register their crop with agencyin production of quality seed.Promotion of bio-pesticide: Pesticide spinosod 45 SC (0.4ml/lit of water) was applied in chickpea for management ofpod borers. Farmers were given awareness for applicationof pesticide. The pesticides used by the farmers were ofpoor quality and thus, less effective. The farmers alsoperceived the visual effects following spray of pesticideson chickpea as infestation of pod borer was under control.Farmers were also trained on judicious use of cow urine,cow dung, neem seed kernels extracts and their leaves alongwith other local resources.Promotion of vermi-compost: 34 vermi-compost units ofconvenient size (10x3x2 ft) were established to generateawareness and promote organic pulses production as wellas for income and employment generation (Gholipoor et al.2006). These units were made under MGNREGA scheme inparticipatory mode at the village viz., Benipur inShahjahanpur with an expenditure of about INR 8000/- for
Fig. 3. Rainfall, temperature ranges and relative humidity recordedat Chitrakoot
Fig. 4. Rainfall, temperature ranges and relative humidity recordedat Shahjahanpur
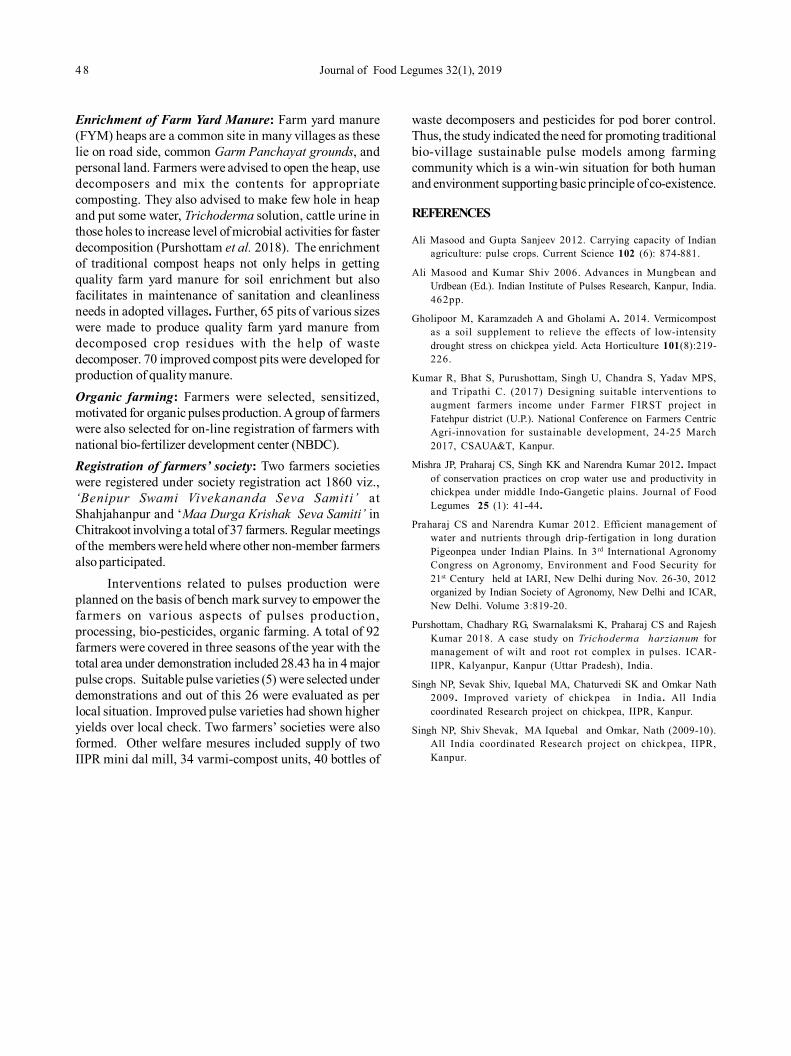
4 8 Journal of Food Legumes 32(1), 2019
Enrichment of Farm Yard Manure: Farm yard manure(FYM) heaps are a common site in many villages as theselie on road side, common Garm Panchayat grounds, andpersonal land. Farmers were advised to open the heap, usedecomposers and mix the contents for appropriatecomposting. They also advised to make few hole in heapand put some water, Trichoderma solution, cattle urine inthose holes to increase level of microbial activities for fasterdecomposition (Purshottam et al. 2018). The enrichmentof traditional compost heaps not only helps in gettingquality farm yard manure for soil enrichment but alsofacilitates in maintenance of sanitation and cleanlinessneeds in adopted villages. Further, 65 pits of various sizeswere made to produce quality farm yard manure fromdecomposed crop residues with the help of wastedecomposer. 70 improved compost pits were developed forproduction of quality manure.Organic farming: Farmers were selected, sensitized,motivated for organic pulses production. A group of farmerswere also selected for on-line registration of farmers withnational bio-fertilizer development center (NBDC).Registration of farmers’ society: Two farmers societieswere registered under society registration act 1860 viz.,‘Benipur Swami Vivekananda Seva Samiti’ atShahjahanpur and ‘Maa Durga Krishak Seva Samiti’ inChitrakoot involving a total of 37 farmers. Regular meetingsof the members were held where other non-member farmersalso participated.
Interventions related to pulses production wereplanned on the basis of bench mark survey to empower thefarmers on various aspects of pulses production,processing, bio-pesticides, organic farming. A total of 92farmers were covered in three seasons of the year with thetotal area under demonstration included 28.43 ha in 4 majorpulse crops. Suitable pulse varieties (5) were selected underdemonstrations and out of this 26 were evaluated as perlocal situation. Improved pulse varieties had shown higheryields over local check. Two farmers’ societies were alsoformed. Other welfare mesures included supply of twoIIPR mini dal mill, 34 varmi-compost units, 40 bottles of
waste decomposers and pesticides for pod borer control.Thus, the study indicated the need for promoting traditionalbio-village sustainable pulse models among farmingcommunity which is a win-win situation for both humanand environment supporting basic principle of co-existence.
REFERENCES
Ali Masood and Gupta Sanjeev 2012. Carrying capacity of Indianagriculture: pulse crops. Current Science 102 (6): 874-881.
Ali Masood and Kumar Shiv 2006. Advances in Mungbean andUrdbean (Ed.). Indian Institute of Pulses Research, Kanpur, India.462pp.
Gholipoor M, Karamzadeh A and Gholami A. 2014. Vermicompostas a soil supplement to relieve the effects of low-intensitydrought stress on chickpea yield. Acta Horticulture 101(8):219-226.
Kumar R, Bhat S, Purushottam, Singh U, Chandra S, Yadav MPS,and Tripathi C. (2017) Designing suitable interventions toaugment farmers income under Farmer FIRST project inFatehpur district (U.P.). National Conference on Farmers CentricAgri-innovation for sustainable development, 24-25 March2017, CSAUA&T, Kanpur.
Mishra JP, Praharaj CS, Singh KK and Narendra Kumar 2012. Impactof conservation practices on crop water use and productivity inchickpea under middle Indo-Gangetic plains. Journal of FoodLegumes 25 (1): 41-44.
Praharaj CS and Narendra Kumar 2012. Efficient management ofwater and nutrients through drip-fertigation in long durationPigeonpea under Indian Plains. In 3 rd International AgronomyCongress on Agronomy, Environment and Food Security for21st Century held at IARI, New Delhi during Nov. 26-30, 2012organized by Indian Society of Agronomy, New Delhi and ICAR,New Delhi. Volume 3:819-20.
Purshottam, Chadhary RG, Swarnalaksmi K, Praharaj CS and RajeshKumar 2018. A case study on Trichoderma harzianum formanagement of wilt and root rot complex in pulses. ICAR-IIPR, Kalyanpur, Kanpur (Uttar Pradesh), India.
Singh NP, Sevak Shiv, Iquebal MA, Chaturvedi SK and Omkar Nath2009 . Improved variety of chickpea in India . All Indiacoordinated Research project on chickpea, IIPR, Kanpur.
Singh NP, Shiv Shevak, MA Iquebal and Omkar, Nath (2009-10).All India coordinated Research project on chickpea, IIPR,Kanpur.
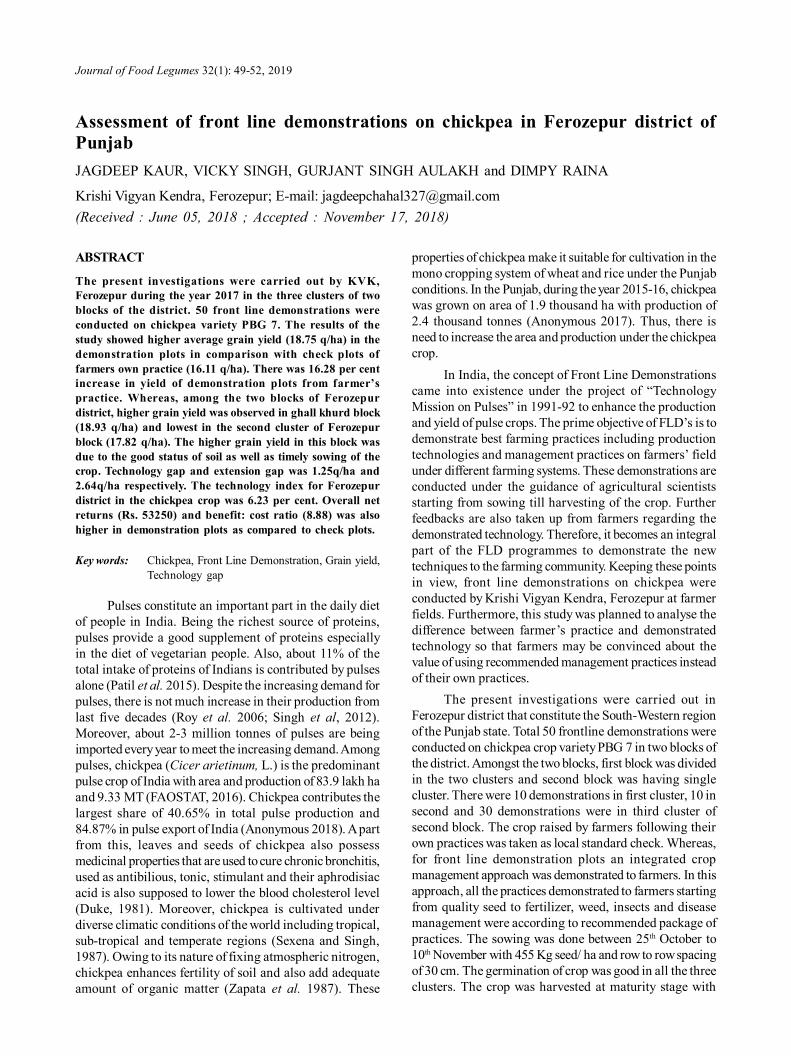
Journal of Food Legumes 32(1): 49-52, 2019
ABSTRACT
The present investigations were carried out by KVK,Ferozepur during the year 2017 in the three clusters of twoblocks of the district. 50 front line demonstrations wereconducted on chickpea variety PBG 7. The results of thestudy showed higher average grain yield (18.75 q/ha) in thedemonstration plots in comparison with check plots offarmers own practice (16.11 q/ha). There was 16.28 per centincrease in yield of demonstration plots from farmer’spractice. Whereas, among the two blocks of Ferozepurdistrict, higher grain yield was observed in ghall khurd block(18.93 q/ha) and lowest in the second cluster of Ferozepurblock (17.82 q/ha). The higher grain yield in this block wasdue to the good status of soil as well as timely sowing of thecrop. Technology gap and extension gap was 1.25q/ha and2.64q/ha respectively. The technology index for Ferozepurdistrict in the chickpea crop was 6.23 per cent. Overall netreturns (Rs. 53250) and benefit: cost ratio (8.88) was alsohigher in demonstration plots as compared to check plots.
Key words: Chickpea, Front Line Demonstration, Grain yield,Technology gap
Pulses constitute an important part in the daily dietof people in India. Being the richest source of proteins,pulses provide a good supplement of proteins especiallyin the diet of vegetarian people. Also, about 11% of thetotal intake of proteins of Indians is contributed by pulsesalone (Patil et al. 2015). Despite the increasing demand forpulses, there is not much increase in their production fromlast five decades (Roy et al. 2006; Singh et al, 2012).Moreover, about 2-3 million tonnes of pulses are beingimported every year to meet the increasing demand. Amongpulses, chickpea (Cicer arietinum, L.) is the predominantpulse crop of India with area and production of 83.9 lakh haand 9.33 MT (FAOSTAT, 2016). Chickpea contributes thelargest share of 40.65% in total pulse production and84.87% in pulse export of India (Anonymous 2018). A partfrom this, leaves and seeds of chickpea also possessmedicinal properties that are used to cure chronic bronchitis,used as antibilious, tonic, stimulant and their aphrodisiacacid is also supposed to lower the blood cholesterol level(Duke, 1981). Moreover, chickpea is cultivated underdiverse climatic conditions of the world including tropical,sub-tropical and temperate regions (Sexena and Singh,1987). Owing to its nature of fixing atmospheric nitrogen,chickpea enhances fertility of soil and also add adequateamount of organic matter (Zapata et al. 1987). These
Assessment of front line demonstrations on chickpea in Ferozepur district ofPunjabJAGDEEP KAUR, VICKY SINGH, GURJANT SINGH AULAKH and DIMPY RAINA
Krishi Vigyan Kendra, Ferozepur; E-mail: [email protected](Received : June 05, 2018 ; Accepted : November 17, 2018)
properties of chickpea make it suitable for cultivation in themono cropping system of wheat and rice under the Punjabconditions. In the Punjab, during the year 2015-16, chickpeawas grown on area of 1.9 thousand ha with production of2.4 thousand tonnes (Anonymous 2017). Thus, there isneed to increase the area and production under the chickpeacrop.
In India, the concept of Front Line Demonstrationscame into existence under the project of “TechnologyMission on Pulses” in 1991-92 to enhance the productionand yield of pulse crops. The prime objective of FLD’s is todemonstrate best farming practices including productiontechnologies and management practices on farmers’ fieldunder different farming systems. These demonstrations areconducted under the guidance of agricultural scientistsstarting from sowing till harvesting of the crop. Furtherfeedbacks are also taken up from farmers regarding thedemonstrated technology. Therefore, it becomes an integralpart of the FLD programmes to demonstrate the newtechniques to the farming community. Keeping these pointsin view, front line demonstrations on chickpea wereconducted by Krishi Vigyan Kendra, Ferozepur at farmerfields. Furthermore, this study was planned to analyse thedifference between farmer’s practice and demonstratedtechnology so that farmers may be convinced about thevalue of using recommended management practices insteadof their own practices.
The present investigations were carried out inFerozepur district that constitute the South-Western regionof the Punjab state. Total 50 frontline demonstrations wereconducted on chickpea crop variety PBG 7 in two blocks ofthe district. Amongst the two blocks, first block was dividedin the two clusters and second block was having singlecluster. There were 10 demonstrations in first cluster, 10 insecond and 30 demonstrations were in third cluster ofsecond block. The crop raised by farmers following theirown practices was taken as local standard check. Whereas,for front line demonstration plots an integrated cropmanagement approach was demonstrated to farmers. In thisapproach, all the practices demonstrated to farmers startingfrom quality seed to fertilizer, weed, insects and diseasemanagement were according to recommended package ofpractices. The sowing was done between 25th October to10th November with 455 Kg seed/ ha and row to row spacingof 30 cm. The germination of crop was good in all the threeclusters. The crop was harvested at maturity stage with
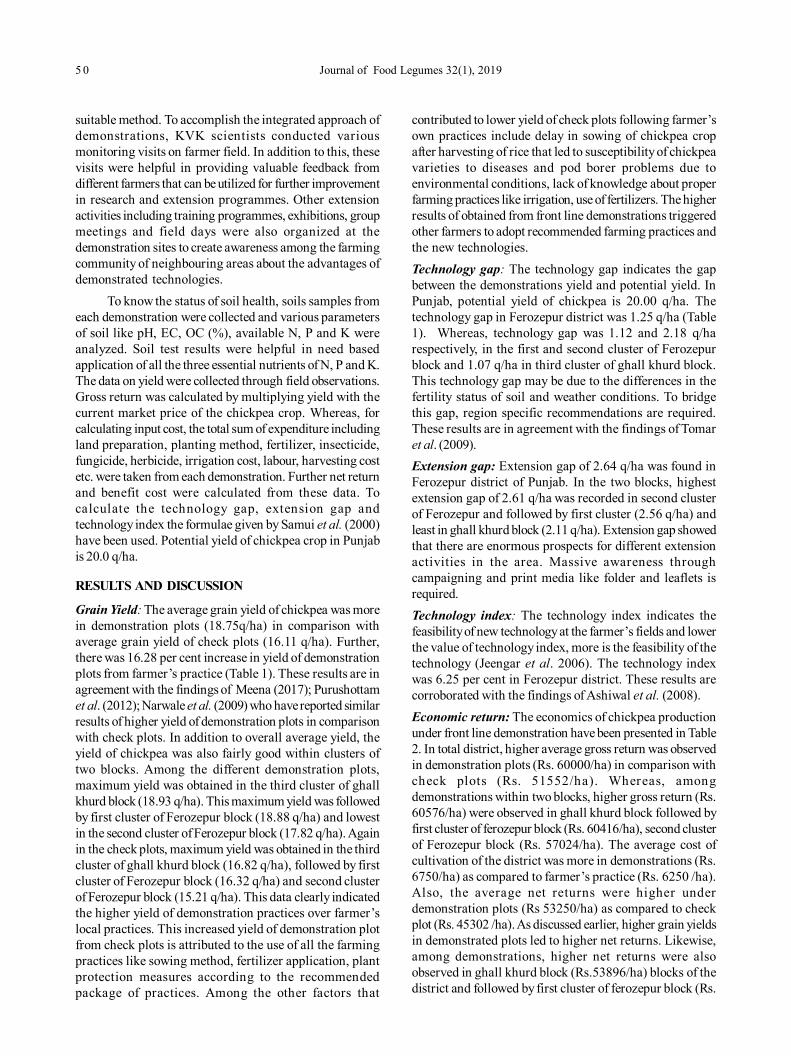
5 0 Journal of Food Legumes 32(1), 2019
suitable method. To accomplish the integrated approach ofdemonstrations, KVK scientists conducted variousmonitoring visits on farmer field. In addition to this, thesevisits were helpful in providing valuable feedback fromdifferent farmers that can be utilized for further improvementin research and extension programmes. Other extensionactivities including training programmes, exhibitions, groupmeetings and field days were also organized at thedemonstration sites to create awareness among the farmingcommunity of neighbouring areas about the advantages ofdemonstrated technologies.
To know the status of soil health, soils samples fromeach demonstration were collected and various parametersof soil like pH, EC, OC (%), available N, P and K wereanalyzed. Soil test results were helpful in need basedapplication of all the three essential nutrients of N, P and K.The data on yield were collected through field observations.Gross return was calculated by multiplying yield with thecurrent market price of the chickpea crop. Whereas, forcalculating input cost, the total sum of expenditure includingland preparation, planting method, fertilizer, insecticide,fungicide, herbicide, irrigation cost, labour, harvesting costetc. were taken from each demonstration. Further net returnand benefit cost were calculated from these data. Tocalculate the technology gap, extension gap andtechnology index the formulae given by Samui et al. (2000)have been used. Potential yield of chickpea crop in Punjabis 20.0 q/ha.
RESULTS AND DISCUSSION
Grain Yield: The average grain yield of chickpea was morein demonstration plots (18.75q/ha) in comparison withaverage grain yield of check plots (16.11 q/ha). Further,there was 16.28 per cent increase in yield of demonstrationplots from farmer’s practice (Table 1). These results are inagreement with the findings of Meena (2017); Purushottamet al. (2012); Narwale et al. (2009) who have reported similarresults of higher yield of demonstration plots in comparisonwith check plots. In addition to overall average yield, theyield of chickpea was also fairly good within clusters oftwo blocks. Among the different demonstration plots,maximum yield was obtained in the third cluster of ghallkhurd block (18.93 q/ha). This maximum yield was followedby first cluster of Ferozepur block (18.88 q/ha) and lowestin the second cluster of Ferozepur block (17.82 q/ha). Againin the check plots, maximum yield was obtained in the thirdcluster of ghall khurd block (16.82 q/ha), followed by firstcluster of Ferozepur block (16.32 q/ha) and second clusterof Ferozepur block (15.21 q/ha). This data clearly indicatedthe higher yield of demonstration practices over farmer’slocal practices. This increased yield of demonstration plotfrom check plots is attributed to the use of all the farmingpractices like sowing method, fertilizer application, plantprotection measures according to the recommendedpackage of practices. Among the other factors that
contributed to lower yield of check plots following farmer’sown practices include delay in sowing of chickpea cropafter harvesting of rice that led to susceptibility of chickpeavarieties to diseases and pod borer problems due toenvironmental conditions, lack of knowledge about properfarming practices like irrigation, use of fertilizers. The higherresults of obtained from front line demonstrations triggeredother farmers to adopt recommended farming practices andthe new technologies.Technology gap: The technology gap indicates the gapbetween the demonstrations yield and potential yield. InPunjab, potential yield of chickpea is 20.00 q/ha. Thetechnology gap in Ferozepur district was 1.25 q/ha (Table1). Whereas, technology gap was 1.12 and 2.18 q/harespectively, in the first and second cluster of Ferozepurblock and 1.07 q/ha in third cluster of ghall khurd block.This technology gap may be due to the differences in thefertility status of soil and weather conditions. To bridgethis gap, region specific recommendations are required.These results are in agreement with the findings of Tomaret al. (2009).Extension gap: Extension gap of 2.64 q/ha was found inFerozepur district of Punjab. In the two blocks, highestextension gap of 2.61 q/ha was recorded in second clusterof Ferozepur and followed by first cluster (2.56 q/ha) andleast in ghall khurd block (2.11 q/ha). Extension gap showedthat there are enormous prospects for different extensionactivities in the area. Massive awareness throughcampaigning and print media like folder and leaflets isrequired.Technology index: The technology index indicates thefeasibility of new technology at the farmer’s fields and lowerthe value of technology index, more is the feasibility of thetechnology (Jeengar et al. 2006). The technology indexwas 6.25 per cent in Ferozepur district. These results arecorroborated with the findings of Ashiwal et al. (2008).Economic return: The economics of chickpea productionunder front line demonstration have been presented in Table2. In total district, higher average gross return was observedin demonstration plots (Rs. 60000/ha) in comparison withcheck plots (Rs. 51552/ha). Whereas, amongdemonstrations within two blocks, higher gross return (Rs.60576/ha) were observed in ghall khurd block followed byfirst cluster of ferozepur block (Rs. 60416/ha), second clusterof Ferozepur block (Rs. 57024/ha). The average cost ofcultivation of the district was more in demonstrations (Rs.6750/ha) as compared to farmer’s practice (Rs. 6250 /ha).Also, the average net returns were higher underdemonstration plots (Rs 53250/ha) as compared to checkplot (Rs. 45302 /ha). As discussed earlier, higher grain yieldsin demonstrated plots led to higher net returns. Likewise,among demonstrations, higher net returns were alsoobserved in ghall khurd block (Rs.53896/ha) blocks of thedistrict and followed by first cluster of ferozepur block (Rs.
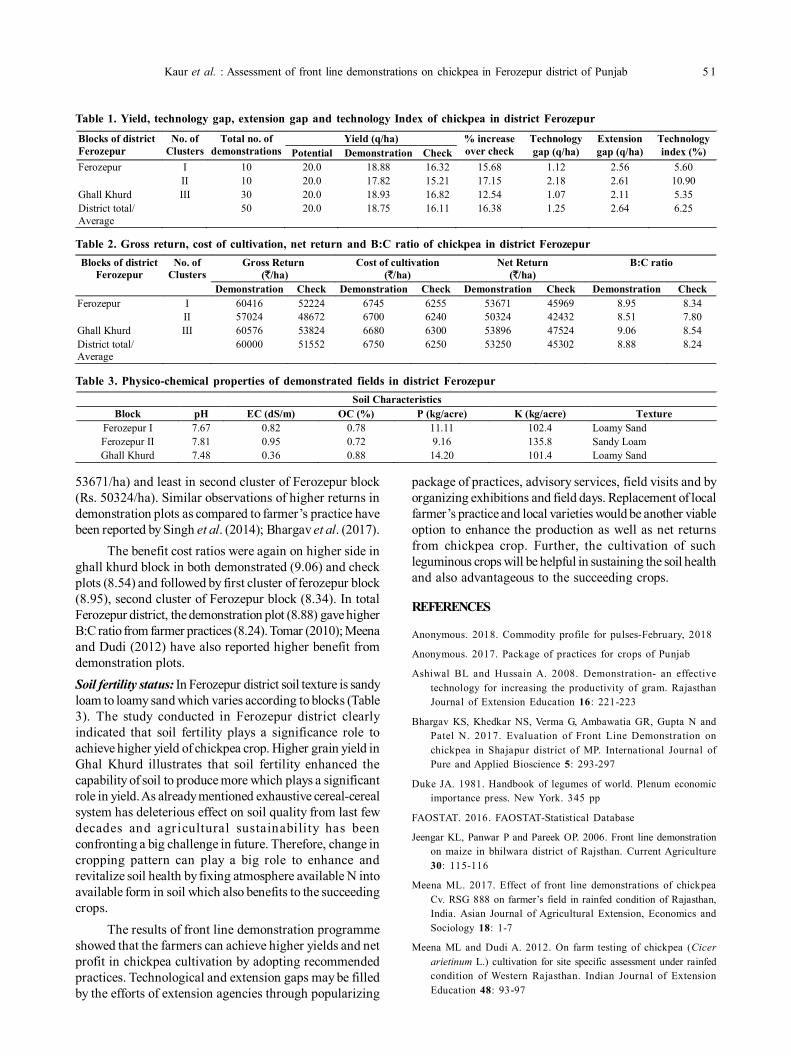
Kaur et al. : Assessment of front line demonstrations on chickpea in Ferozepur district of Punjab 5 1
53671/ha) and least in second cluster of Ferozepur block(Rs. 50324/ha). Similar observations of higher returns indemonstration plots as compared to farmer’s practice havebeen reported by Singh et al. (2014); Bhargav et al. (2017).
The benefit cost ratios were again on higher side inghall khurd block in both demonstrated (9.06) and checkplots (8.54) and followed by first cluster of ferozepur block(8.95), second cluster of Ferozepur block (8.34). In totalFerozepur district, the demonstration plot (8.88) gave higherB:C ratio from farmer practices (8.24). Tomar (2010); Meenaand Dudi (2012) have also reported higher benefit fromdemonstration plots.Soil fertility status: In Ferozepur district soil texture is sandyloam to loamy sand which varies according to blocks (Table3). The study conducted in Ferozepur district clearlyindicated that soil fertility plays a significance role toachieve higher yield of chickpea crop. Higher grain yield inGhal Khurd illustrates that soil fertility enhanced thecapability of soil to produce more which plays a significantrole in yield. As already mentioned exhaustive cereal-cerealsystem has deleterious effect on soil quality from last fewdecades and agricultural sustainability has beenconfronting a big challenge in future. Therefore, change incropping pattern can play a big role to enhance andrevitalize soil health by fixing atmosphere available N intoavailable form in soil which also benefits to the succeedingcrops.
The results of front line demonstration programmeshowed that the farmers can achieve higher yields and netprofit in chickpea cultivation by adopting recommendedpractices. Technological and extension gaps may be filledby the efforts of extension agencies through popularizing
package of practices, advisory services, field visits and byorganizing exhibitions and field days. Replacement of localfarmer’s practice and local varieties would be another viableoption to enhance the production as well as net returnsfrom chickpea crop. Further, the cultivation of suchleguminous crops will be helpful in sustaining the soil healthand also advantageous to the succeeding crops.
REFERENCES
Anonymous. 2018. Commodity profile for pulses-February, 2018
Anonymous. 2017. Package of practices for crops of Punjab
Ashiwal BL and Hussain A. 2008. Demonstration- an effectivetechnology for increasing the productivity of gram. RajasthanJournal of Extension Education 16: 221-223
Bhargav KS, Khedkar NS, Verma G, Ambawatia GR, Gupta N andPatel N. 2017. Evaluation of Front Line Demonstration onchickpea in Shajapur district of MP. International Journal ofPure and Applied Bioscience 5: 293-297
Duke JA. 1981. Handbook of legumes of world. Plenum economicimportance press. New York. 345 pp
FAOSTAT. 2016. FAOSTAT-Statistical Database
Jeengar KL, Panwar P and Pareek OP. 2006. Front line demonstrationon maize in bhilwara district of Rajsthan. Current Agriculture30: 115-116
Meena ML. 2017. Effect of front line demonstrations of chickpeaCv. RSG 888 on farmer’s field in rainfed condition of Rajasthan,India. Asian Journal of Agricultural Extension, Economics andSociology 18: 1-7
Meena ML and Dudi A. 2012. On farm testing of chickpea (Cicerarietinum L.) cultivation for site specific assessment under rainfedcondition of Western Rajasthan. Indian Journal of ExtensionEducation 48: 93-97
Table 1. Yield, technology gap, extension gap and technology Index of chickpea in district Ferozepur
Blocks of district Ferozepur
No. of Clusters
Total no. of demonstrations
Yield (q/ha) % increase over check
Technology gap (q/ha)
Extension gap (q/ha)
Technology index (%) Potential Demonstration Check
Ferozepur I 10 20.0 18.88 16.32 15.68 1.12 2.56 5.60 II 10 20.0 17.82 15.21 17.15 2.18 2.61 10.90
Ghall Khurd III 30 20.0 18.93 16.82 12.54 1.07 2.11 5.35 District total/ Average
50 20.0 18.75 16.11 16.38 1.25 2.64 6.25
Table 2. Gross return, cost of cultivation, net return and B:C ratio of chickpea in district FerozepurBlocks of district
Ferozepur No. of
Clusters Gross Return
(`/ha) Cost of cultivation
(`/ha) Net Return
(`/ha) B:C ratio
Demonstration Check Demonstration Check Demonstration Check Demonstration Check Ferozepur I 60416 52224 6745 6255 53671 45969 8.95 8.34
II 57024 48672 6700 6240 50324 42432 8.51 7.80 Ghall Khurd III 60576 53824 6680 6300 53896 47524 9.06 8.54 District total/ Average
60000 51552 6750 6250 53250 45302 8.88 8.24
Table 3. Physico-chemical properties of demonstrated fields in district FerozepurSoil Characteristics
Block pH EC (dS/m) OC (%) P (kg/acre) K (kg/acre) Texture Ferozepur I 7.67 0.82 0.78 11.11 102.4 Loamy Sand Ferozepur II 7.81 0.95 0.72 9.16 135.8 Sandy Loam Ghall Khurd 7.48 0.36 0.88 14.20 101.4 Loamy Sand
5 2 Journal of Food Legumes 32(1), 2019
Narwale SS, Pawar AD, Lambade BM and Ugle NS. 2009. Yieldmaximization of chickpea through INM applied to sorghum-chickpea cropping sequence under irrigated condition. LegumesResearch 4: 282-285
Patil LM, Modi DJ, Vasava HM and Gomkale SR. 2015. Evaluationof front line demonstration programme on green gram varietyMeha in Bharuch district of Gujarat. Journal of Agriculture andVeterinary Science 8: 1-3
Purushottam, Singh SK, Chaudhary RN, Kumar K, Praharaj CS andKrishana B. 2012. Assessment of technological inputs for majorpulses in Bundelkhan region. Journal of Food Legumes 25: 61-6 5
Roy B, Singh R, Singh SK, Singh Lakhan and Singh AK. 2006.Adoption of improved pulses production technologies and relatedconstraints in Uttar Pradesh. Indian Journal of Pulses Research19: 104-106
Samui SK, Maitra S, Roy DK, Mondal AK and Saha D. 2000.Evaluation on front line demonstration on groundnut (Arachishypogea L.). Journal of Indian Society of Coastal AgriculturalResearch 18: 180-183
Saxena MC and Singh KB. 1987. The chickpea (ed). ICARDA,CABI, Wallingford, UK
Singh J, Dhillon BS, Astha and Singh P. 2012. Front linedemonstration-an effective tool for increasing the productivityof summer moong in Amritsar district of Punjab. Asian Journalof Soil Science 7: 315-318
Singh D, Patel AK, Baghel MS, Singh SK, Singh Alka and Singh AK.2014. Impact of front line demonstration on the yield andeconomics of chickpea (Cicer arietinum L.) in Sidhi district ofMadhya Pradesh. Journal of Agricultural Search 1: 22-25
Tomar RKS, Sahu BL, Singh AK and Prajapati RK. 2009. Productivityenhancement of blackgram through improved productiontechnologies in farmers’ field. Journal of Food Legumes 22:202-204
Tomar RKS. 2010. Maxmization of productivity for chickpea (Cicerarietinum L.) through improved technologies in farmer’s field.Indian Journal of Natural Products and Resources 1: 515-517
Zapata F, Danso SKA, Hardarson G and Fried M. 1987. Nitrogenfixation and translocation in field-grown fababean. AgronomyJournal 79: 505-509
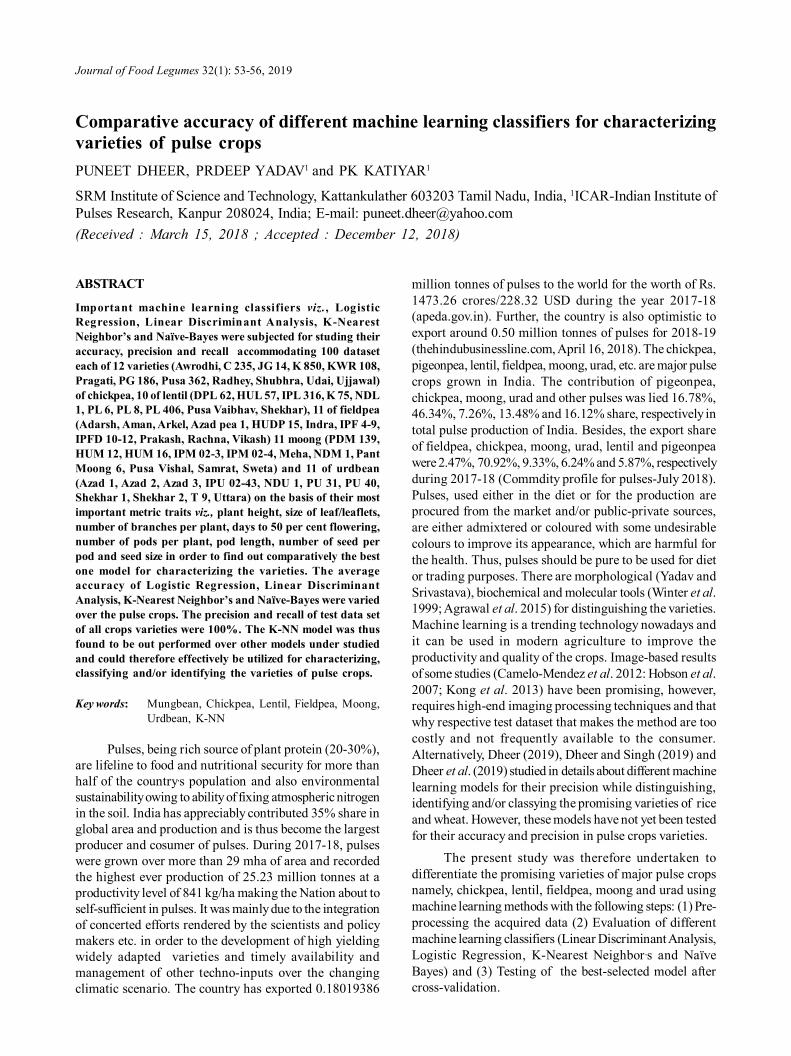
Journal of Food Legumes 32(1): 53-56, 2019
Comparative accuracy of different machine learning classifiers for characterizingvarieties of pulse cropsPUNEET DHEER, PRDEEP YADAV1 and PK KATIYAR1
SRM Institute of Science and Technology, Kattankulather 603203 Tamil Nadu, India, 1ICAR-Indian Institute ofPulses Research, Kanpur 208024, India; E-mail: [email protected](Received : March 15, 2018 ; Accepted : December 12, 2018)
ABSTRACT
Important machine learning classifiers viz., LogisticRegression, Linear Discriminant Analysis, K-NearestNeighbor’s and Naïve-Bayes were subjected for studing theiraccuracy, precision and recall accommodating 100 dataseteach of 12 varieties (Awrodhi, C 235, JG 14, K 850, KWR 108,Pragati, PG 186, Pusa 362, Radhey, Shubhra, Udai, Ujjawal)of chickpea, 10 of lentil (DPL 62, HUL 57, IPL 316, K 75, NDL1, PL 6, PL 8, PL 406, Pusa Vaibhav, Shekhar), 11 of fieldpea(Adarsh, Aman, Arkel, Azad pea 1, HUDP 15, Indra, IPF 4-9,IPFD 10-12, Prakash, Rachna, Vikash) 11 moong (PDM 139,HUM 12, HUM 16, IPM 02-3, IPM 02-4, Meha, NDM 1, PantMoong 6, Pusa Vishal, Samrat, Sweta) and 11 of urdbean(Azad 1, Azad 2, Azad 3, IPU 02-43, NDU 1, PU 31, PU 40,Shekhar 1, Shekhar 2, T 9, Uttara) on the basis of their mostimportant metric traits viz., plant height, size of leaf/leaflets,number of branches per plant, days to 50 per cent flowering,number of pods per plant, pod length, number of seed perpod and seed size in order to find out comparatively the bestone model for characterizing the varieties. The averageaccuracy of Logistic Regression, Linear DiscriminantAnalysis, K-Nearest Neighbor’s and Naïve-Bayes were variedover the pulse crops. The precision and recall of test data setof all crops varieties were 100%. The K-NN model was thusfound to be out performed over other models under studiedand could therefore effectively be utilized for characterizing,classifying and/or identifying the varieties of pulse crops.
Key words: Mungbean, Chickpea, Lentil, Fieldpea, Moong,Urdbean, K-NN
Pulses, being rich source of plant protein (20-30%),are lifeline to food and nutritional security for more thanhalf of the country,s population and also environmentalsustainability owing to ability of fixing atmospheric nitrogenin the soil. India has appreciably contributed 35% share inglobal area and production and is thus become the largestproducer and cosumer of pulses. During 2017-18, pulseswere grown over more than 29 mha of area and recordedthe highest ever production of 25.23 million tonnes at aproductivity level of 841 kg/ha making the Nation about toself-sufficient in pulses. It was mainly due to the integrationof concerted efforts rendered by the scientists and policymakers etc. in order to the development of high yieldingwidely adapted varieties and timely availability andmanagement of other techno-inputs over the changingclimatic scenario. The country has exported 0.18019386
million tonnes of pulses to the world for the worth of Rs.1473.26 crores/228.32 USD during the year 2017-18(apeda.gov.in). Further, the country is also optimistic toexport around 0.50 million tonnes of pulses for 2018-19(thehindubusinessline.com, April 16, 2018). The chickpea,pigeonpea, lentil, fieldpea, moong, urad, etc. are major pulsecrops grown in India. The contribution of pigeonpea,chickpea, moong, urad and other pulses was lied 16.78%,46.34%, 7.26%, 13.48% and 16.12% share, respectively intotal pulse production of India. Besides, the export shareof fieldpea, chickpea, moong, urad, lentil and pigeonpeawere 2.47%, 70.92%, 9.33%, 6.24% and 5.87%, respectivelyduring 2017-18 (Commdity profile for pulses-July 2018).Pulses, used either in the diet or for the production areprocured from the market and/or public-private sources,are either admixtered or coloured with some undesirablecolours to improve its appearance, which are harmful forthe health. Thus, pulses should be pure to be used for dietor trading purposes. There are morphological (Yadav andSrivastava), biochemical and molecular tools (Winter et al.1999; Agrawal et al. 2015) for distinguishing the varieties.Machine learning is a trending technology nowadays andit can be used in modern agriculture to improve theproductivity and quality of the crops. Image-based resultsof some studies (Camelo-Mendez et al. 2012: Hobson et al.2007; Kong et al. 2013) have been promising, however,requires high-end imaging processing techniques and thatwhy respective test dataset that makes the method are toocostly and not frequently available to the consumer.Alternatively, Dheer (2019), Dheer and Singh (2019) andDheer et al. (2019) studied in details about different machinelearning models for their precision while distinguishing,identifying and/or classying the promising varieties of riceand wheat. However, these models have not yet been testedfor their accuracy and precision in pulse crops varieties.
The present study was therefore undertaken todifferentiate the promising varieties of major pulse cropsnamely, chickpea, lentil, fieldpea, moong and urad usingmachine learning methods with the following steps: (1) Pre-processing the acquired data (2) Evaluation of differentmachine learning classifiers (Linear Discriminant Analysis,Logistic Regression, K-Nearest Neighbor ,s and NaïveBayes) and (3) Testing of the best-selected model aftercross-validation.
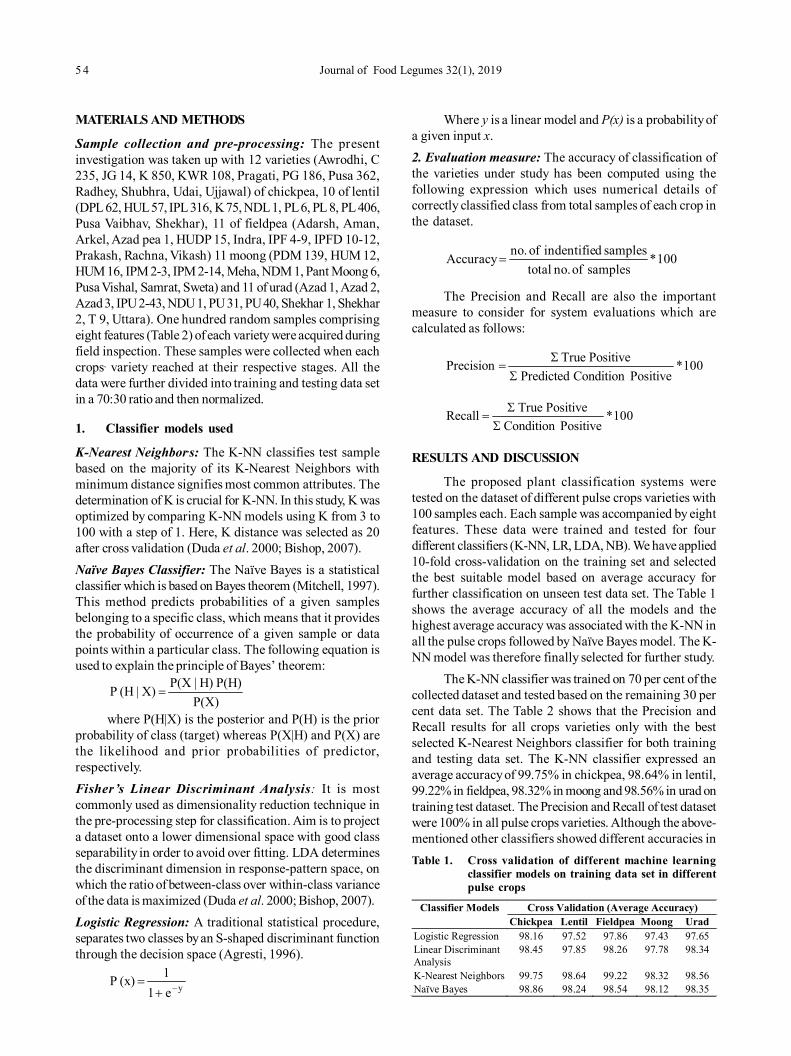
5 4 Journal of Food Legumes 32(1), 2019
MATERIALS AND METHODS
Sample collection and pre-processing: The presentinvestigation was taken up with 12 varieties (Awrodhi, C235, JG 14, K 850, KWR 108, Pragati, PG 186, Pusa 362,Radhey, Shubhra, Udai, Ujjawal) of chickpea, 10 of lentil(DPL 62, HUL 57, IPL 316, K 75, NDL 1, PL 6, PL 8, PL 406,Pusa Vaibhav, Shekhar), 11 of fieldpea (Adarsh, Aman,Arkel, Azad pea 1, HUDP 15, Indra, IPF 4-9, IPFD 10-12,Prakash, Rachna, Vikash) 11 moong (PDM 139, HUM 12,HUM 16, IPM 2-3, IPM 2-14, Meha, NDM 1, Pant Moong 6,Pusa Vishal, Samrat, Sweta) and 11 of urad (Azad 1, Azad 2,Azad 3, IPU 2-43, NDU 1, PU 31, PU 40, Shekhar 1, Shekhar2, T 9, Uttara). One hundred random samples comprisingeight features (Table 2) of each variety were acquired duringfield inspection. These samples were collected when eachcrops, variety reached at their respective stages. All thedata were further divided into training and testing data setin a 70:30 ratio and then normalized.
1. Classifier models used
K-Nearest Neighbor,s: The K-NN classifies test samplebased on the majority of its K-Nearest Neighbors withminimum distance signifies most common attributes. Thedetermination of K is crucial for K-NN. In this study, K wasoptimized by comparing K-NN models using K from 3 to100 with a step of 1. Here, K distance was selected as 20after cross validation (Duda et al. 2000; Bishop, 2007).Naïve Bayes Classifier: The Naïve Bayes is a statisticalclassifier which is based on Bayes theorem (Mitchell, 1997).This method predicts probabilities of a given samplesbelonging to a specific class, which means that it providesthe probability of occurrence of a given sample or datapoints within a particular class. The following equation isused to explain the principle of Bayes’ theorem:
P(X)P(H) H)|P(X X)|(H P
where P(H|X) is the posterior and P(H) is the priorprobability of class (target) whereas P(X|H) and P(X) arethe likelihood and prior probabilities of predictor,respectively.Fisher’s Linear Discriminant Analysis: It is mostcommonly used as dimensionality reduction technique inthe pre-processing step for classification. Aim is to projecta dataset onto a lower dimensional space with good classseparability in order to avoid over fitting. LDA determinesthe discriminant dimension in response-pattern space, onwhich the ratio of between-class over within-class varianceof the data is maximized (Duda et al. 2000; Bishop, 2007).Logistic Regression: A traditional statistical procedure,separates two classes by an S-shaped discriminant functionthrough the decision space (Agresti, 1996).
y–e 11 (x) P
Where y is a linear model and P(x) is a probability ofa given input x.2. Evaluation measure: The accuracy of classification ofthe varieties under study has been computed using thefollowing expression which uses numerical details ofcorrectly classified class from total samples of each crop inthe dataset.
100 * samples of no. total
samples dindentifie of no. Accuracy
The Precision and Recall are also the importantmeasure to consider for system evaluations which arecalculated as follows:
100 * PositiveCondition Predicted
Positive True Precision
100 * PositiveCondition
Positive True Recall
RESULTS AND DISCUSSION
The proposed plant classification systems weretested on the dataset of different pulse crops varieties with100 samples each. Each sample was accompanied by eightfeatures. These data were trained and tested for fourdifferent classifiers (K-NN, LR, LDA, NB). We have applied10-fold cross-validation on the training set and selectedthe best suitable model based on average accuracy forfurther classification on unseen test data set. The Table 1shows the average accuracy of all the models and thehighest average accuracy was associated with the K-NN inall the pulse crops followed by Naïve Bayes model. The K-NN model was therefore finally selected for further study.
The K-NN classifier was trained on 70 per cent of thecollected dataset and tested based on the remaining 30 percent data set. The Table 2 shows that the Precision andRecall results for all crops varieties only with the bestselected K-Nearest Neighbors classifier for both trainingand testing data set. The K-NN classifier expressed anaverage accuracy of 99.75% in chickpea, 98.64% in lentil,99.22% in fieldpea, 98.32% in moong and 98.56% in urad ontraining test dataset. The Precision and Recall of test datasetwere 100% in all pulse crops varieties. Although the above-mentioned other classifiers showed different accuracies inTable 1. Cross validation of different machine learning
classifier models on training data set in differentpulse crops
Classifier Models Cross Validation (Average Accuracy) Chickpea Lentil Fieldpea Moong Urad
Logistic Regression 98.16 97.52 97.86 97.43 97.65 Linear Discriminant Analysis
98.45 97.85 98.26 97.78 98.34
K-Nearest Neighbors 99.75 98.64 99.22 98.32 98.56 Naïve Bayes 98.86 98.24 98.54 98.12 98.35
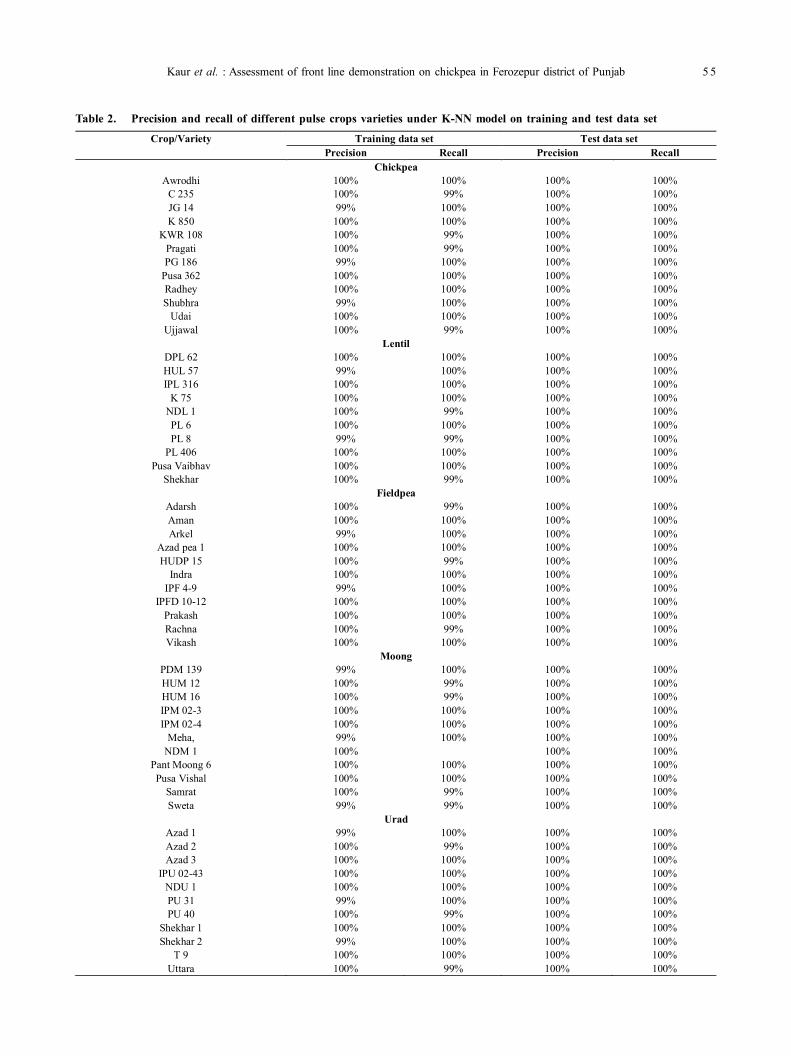
Kaur et al. : Assessment of front line demonstration on chickpea in Ferozepur district of Punjab 5 5
Table 2. Precision and recall of different pulse crops varieties under K-NN model on training and test data set
Crop/Variety Training data set Test data set Precision Recall Precision Recall
Chickpea Awrodhi 100% 100% 100% 100%
C 235 100% 99% 100% 100% JG 14 99% 100% 100% 100% K 850 100% 100% 100% 100%
KWR 108 100% 99% 100% 100% Pragati 100% 99% 100% 100% PG 186 99% 100% 100% 100%
Pusa 362 100% 100% 100% 100% Radhey 100% 100% 100% 100% Shubhra 99% 100% 100% 100%
Udai 100% 100% 100% 100% Ujjawal 100% 99% 100% 100%
Lentil DPL 62 100% 100% 100% 100% HUL 57 99% 100% 100% 100% IPL 316 100% 100% 100% 100%
K 75 100% 100% 100% 100% NDL 1 100% 99% 100% 100% PL 6 100% 100% 100% 100% PL 8 99% 99% 100% 100%
PL 406 100% 100% 100% 100% Pusa Vaibhav 100% 100% 100% 100%
Shekhar 100% 99% 100% 100% Fieldpea
Adarsh 100% 99% 100% 100% Aman 100% 100% 100% 100% Arkel 99% 100% 100% 100%
Azad pea 1 100% 100% 100% 100% HUDP 15 100% 99% 100% 100%
Indra 100% 100% 100% 100% IPF 4-9 99% 100% 100% 100%
IPFD 10-12 100% 100% 100% 100% Prakash 100% 100% 100% 100% Rachna 100% 99% 100% 100% Vikash 100% 100% 100% 100%
Moong PDM 139 99% 100% 100% 100% HUM 12 100% 99% 100% 100% HUM 16 100% 99% 100% 100% IPM 02-3 100% 100% 100% 100% IPM 02-4 100% 100% 100% 100%
Meha, 99% 100% 100% 100% NDM 1 100% 100% 100%
Pant Moong 6 100% 100% 100% 100% Pusa Vishal 100% 100% 100% 100%
Samrat 100% 99% 100% 100% Sweta 99% 99% 100% 100%
Urad Azad 1 99% 100% 100% 100% Azad 2 100% 99% 100% 100% Azad 3 100% 100% 100% 100%
IPU 02-43 100% 100% 100% 100% NDU 1 100% 100% 100% 100% PU 31 99% 100% 100% 100% PU 40 100% 99% 100% 100%
Shekhar 1 100% 100% 100% 100% Shekhar 2 99% 100% 100% 100%
T 9 100% 100% 100% 100% Uttara 100% 99% 100% 100%
5 6 Journal of Food Legumes 32(1), 2019
comparison to each other and K-NN outperformed all othersfor characterizing the varieties of chickpea, lentil, fieldpea,moong and urad. After experimenting with the proposedsystem, we concluded that K-Nearest Neighbor,s (K-NN)classifier model could successfully be utilized forcharacterizing, classifying and/or distinguishing thesevarieties of pulse crops. These findings are in very closeaffirmity to earlier study in rice (Dheer, 2019; Dheer andSingh, 2019) and wheat (Dheer et al. 2019).
Comparative accuracy of different machine learningclassifiers obtained based on employing featurenormalization revealed that K-NN model is quite promisingfor characterizing the varieties of chickpea, lentil, fieldpea,moong and lentil. The precision and recall scores ofcollected datasets were 100%. Thus, this model can providean accurate solution to the pulse varieties for theircharacterization/ classification and/or identification problemas alternative to sophisticated image segmentationtechniques. Further, this can also be used for mobileapplication, where even an occupational worker on the fieldcan take a measurement the required features of pulse cropsvarieties to find the specific class that the pulse belongs toavoid admixture. Our future thrust will being be morefocused towards more varieties/ genetic stocks of these aswell as other pulse crops.
REFERENCES
Agrawal PK, Singh P, Kanaujia P, Gangawar P, Das A and Dixit GP.2015. Molecular diversity and genetic enhancement amongmajor pulse crops of India. Pulses: challanges & opportunitiesunder changing climatic scenario (Eds: GP Dixit, Jagdish Singhand NP Singh), ICAR-IIPR, Kanpur, India. pp. 52-76
Agresti A. 1996. An introduction to categorical data analysis. wiley,New York.
Bishop CM. 2007. Pattern recognition and machine learning.Springer, New York.
Camelo-Méndez GA, Camacho-Díaz BH, Del Villar-Martínez AA,Arenas-Ocampo ML, Bello-Pérez LA and Jiménez-Aparicio AR.2012. Digital image analysis of diverse Mexican rice cultivars.Journal of Science, Food and Agriculture 92: 2709–2714
Hobson DM, Carter RM and Yan Y. 2007. Characterization andidentification of rice grains through digital image analysis. IEEEinstrumentation and measurement technology conference.Warsaw.pp.1-5
Dheer P. 2019. Distinguishing of rice varieties by using machinelearning models. International Journal of Advanced Research inComputer and Communication Engineering 8(1): 55-57
Dheer P and Singh RK. 2019. Identification of Indian rice varietiesusing machine learning classifiers. Plant Archives 19(1): 155-158
Dheer P, Purshottam and Singh V. 2019. Classifying wheat varietiesusing machine learning model. Journal of Pharmacognosy andPhytochemistry 1(3): 47-49
Duda RO, Hart P and Stork DG. 2000. Pattern classification. 2nd ed.John Wiley and Sons, New York.
Kong W, Zhang C, Liu F, Nie P and He Y. 2013. Rice seed cultivaridentification using near-infrared hyper spectral imaging andmultivariate data analysis. Sensors 13(7): 8916-8927
Mitchell T. 1997. Machine Learning. McGraw Hill, NY.
Winter P, Pfaff T, Udupa SM, Huttel B, Sharma PC, Sahi S, Arreguin-Espinoza R, Weigand F, Muehlbaur FJ and Kahl G. 1999.Characterization and mapping of sequence-tagged microsatellitesites in chickpea (Cicer arietinum L.) genome. MolecularGenomics and Genetics 262(1): 90-101
Yadav RDS and Srivastava JP. 2002. DUS characteristics of chickpeavarieties. Seed Tech News 32(1): 29-30
Journal of Food Legumes 32(1): 57-59, 2019
Short Communication
Genetic diversity for yield and yield component characters in rice fallowblackgram [Vigna mungo (L.) Hepper]K NAGENDRA RAO, HARI RAM KUMAR BANDI, K SRINIVASULU, J PADMAVATHI and K VAMSIKRISHNA
Acharya NG Ranga Agricultural University, Guntur, Andhra Pradesh; E-mail: [email protected](Received : May 11, 2018 ; Accepted : October 01, 2018)
ABSTRACT
A study was made for evaluating diversity genotypes ofblackgram (Vigna mungo (L.) Hepper) under rice fallowsituation for ten quantitative characters. It revealed that thegenotypes of diverse origin were grouped into seven differentclusters. Cluster I and cluster II consisted of twelve genotypesfollowed by cluster IV which included five genotypes, clustersIII consisted of four genotypes and cluster V, VI and VIIconsist of one genotypes. The highest intra cluster distancefor yield traits were found in cluster IV followed by clusterIII, clusters I and cluster II. The maximum inter clusterdistance (D2-values) was found between cluster III and VIIfollowed by cluster V and VII, cluster I and cluster VII, clusterIV and cluster VII and cluster VI and cluster VII. Theclustering pattern revealed that the genotypes originatingfrom different geographical regions got themselves groupedinto different clusters. Grain yield per plot showed highcontribution toward total divergence followed by 100 seedweight, number of branches, plant height and days to 50%flowering. However, the bio-divergent genotypes viz., LBG787, VBG 4-4, IPU 2-43, LBG 623, KKB 5011, TGBG 26, TU94-2, WBG 108, PU 40, TGBG 401 and LBG 648 were foundpromising by the studies of Mahalanobis D2 analysis andTocher’s method of clustering and may serve as potentialparental genotypes for future hybridization programme.
Key words: Blackgram, Divergence, Mahalanobis D2 analysisand Tocher’s method, Yield and its attributes
Blackgram is popularly known as urdbean, urid ormash. It was domesticated from V. mungo var. Silvestris(Lukoki et al. 1980). Blackgram is one of the most ancientand important legume crop of India, which contributes 70%of world’s total production. Urdbean consists of goodnutritional values of high seed protein (25-26%),carbohydrates (60%), fat (1.5%), minerals, amino acids andvitamins. Hence, like other pulses it is usually known as“poor man’s meat” particularly in the vegetarian populationof the Indian subcontinent (Chubatemsu and Malini, 2017).It has the ability to restore the soil fertility through symbioticnitrogen fixation and suitable for various crop rotationpractices and well suited in both dry and irrigatedconditions. This is one of the most important short durationlegume crops utilized in the food, fodder, soil conservation,integrated farming systems, reclaiming of degraded pasturesand symbiotic nitrogen fixation. It is essential to understand
the genetic architectrue and nature of gene action governingyield and its component traits. Yield is the resultant productof various morphological, physiological and biologicalcomponents. The present productivity levels of black gramin India is low.
Over the past century selection of desirable parentsfor hybridization programme has been found as an effectiveoperating implement in developing high yielding cropvarieties upon which, the modern agriculture can rely. Thepresence of genetic diversity and genetic relationshipsamong genotypes is a prerequisite and paramount importantfor successful blackgram breeding programme. Theselection of highly genetically divergent parents is expectedto throw superior and desirable segregants followingcrossing (Bhatt 1973). Thus, Multivariate analysis by D2
statistic is a powerful tool in quantifying the degree ofdivergence among all possible pairs of population atgenotypic level. Choice of parents for hybridization is oneof the important considerations for creating new variability.D2 analysis has been found most effective and, therefore,widely used for the classification of parental lines (Singh etal., 2012). Keeping all there, Thirty six genotypes ofblackgram were analyzed for ten quantitative traits underfield conditions.
Thirty six blackgram (Vigna mungo (L.) Hepper)genotypes of diverse origin were raised in a RandomizedBlock Design in three replications, each of 2 rows of 4 meterslength with spacing of row to row 30 cm and plant to plantof 10 cm at Agricultural Research Station, Ghantasala,Krishna District, during Rabi, 2016-17. Observations wererecorded for ten quantitative characters viz., days to 50%flowering, days to maturity, plant height (cm), number ofbranches per plant, number of clusters per plant, number ofpods per plant, pod length (cm), number of seeds per pod,100 seed weight (g) and grain yield per plot (g). Data wererecorded from five randomly selected plants from eachgenotype per replication and the average was taken foranalysis. All the recommended package of practices wasfollowed to raise a good crop. Standard statisticalprocedures were used for multivariate analysis given byMahalanobis (1936) and grouping of the biodiversifiedgenotypes into different clusters was done using Tocher’stechnique (Rao, 1952).
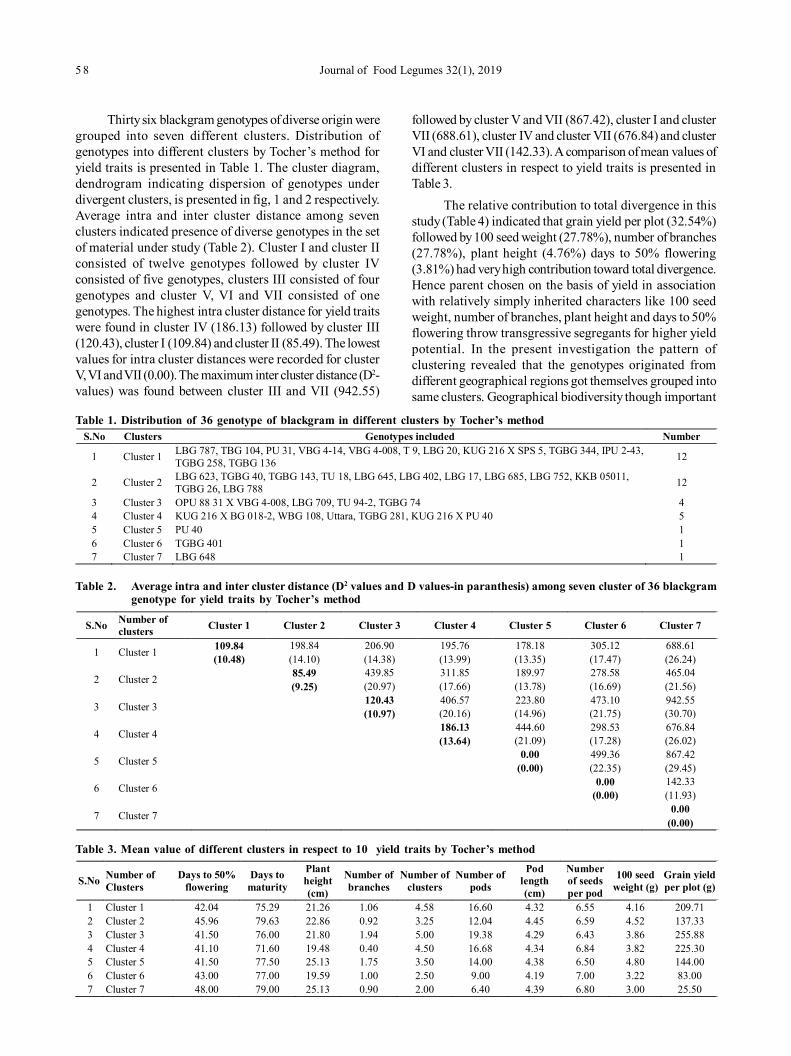
5 8 Journal of Food Legumes 32(1), 2019
Thirty six blackgram genotypes of diverse origin weregrouped into seven different clusters. Distribution ofgenotypes into different clusters by Tocher’s method foryield traits is presented in Table 1. The cluster diagram,dendrogram indicating dispersion of genotypes underdivergent clusters, is presented in fig, 1 and 2 respectively.Average intra and inter cluster distance among sevenclusters indicated presence of diverse genotypes in the setof material under study (Table 2). Cluster I and cluster IIconsisted of twelve genotypes followed by cluster IVconsisted of five genotypes, clusters III consisted of fourgenotypes and cluster V, VI and VII consisted of onegenotypes. The highest intra cluster distance for yield traitswere found in cluster IV (186.13) followed by cluster III(120.43), cluster I (109.84) and cluster II (85.49). The lowestvalues for intra cluster distances were recorded for clusterV, VI and VII (0.00). The maximum inter cluster distance (D2-values) was found between cluster III and VII (942.55)
followed by cluster V and VII (867.42), cluster I and clusterVII (688.61), cluster IV and cluster VII (676.84) and clusterVI and cluster VII (142.33). A comparison of mean values ofdifferent clusters in respect to yield traits is presented inTable 3.
The relative contribution to total divergence in thisstudy (Table 4) indicated that grain yield per plot (32.54%)followed by 100 seed weight (27.78%), number of branches(27.78%), plant height (4.76%) days to 50% flowering(3.81%) had very high contribution toward total divergence.Hence parent chosen on the basis of yield in associationwith relatively simply inherited characters like 100 seedweight, number of branches, plant height and days to 50%flowering throw transgressive segregants for higher yieldpotential. In the present investigation the pattern ofclustering revealed that the genotypes originated fromdifferent geographical regions got themselves grouped intosame clusters. Geographical biodiversity though important
S.No Clusters Genotypes included Number
1 Cluster 1 LBG 787, TBG 104, PU 31, VBG 4-14, VBG 4-008, T 9, LBG 20, KUG 216 X SPS 5, TGBG 344, IPU 2-43, TGBG 258, TGBG 136 12
2 Cluster 2 LBG 623, TGBG 40, TGBG 143, TU 18, LBG 645, LBG 402, LBG 17, LBG 685, LBG 752, KKB 05011, TGBG 26, LBG 788 12
3 Cluster 3 OPU 88 31 X VBG 4-008, LBG 709, TU 94-2, TGBG 74 4 4 Cluster 4 KUG 216 X BG 018-2, WBG 108, Uttara, TGBG 281, KUG 216 X PU 40 5 5 Cluster 5 PU 40 1 6 Cluster 6 TGBG 401 1 7 Cluster 7 LBG 648 1
Table 1. Distribution of 36 genotype of blackgram in different clusters by Tocher’s method
Table 2. Average intra and inter cluster distance (D2 values and D values-in paranthesis) among seven cluster of 36 blackgramgenotype for yield traits by Tocher’s method
S.No Number of clusters Cluster 1 Cluster 2 Cluster 3 Cluster 4 Cluster 5 Cluster 6 Cluster 7
1 Cluster 1 109.84 198.84 206.90 195.76 178.18 305.12 688.61 (10.48) (14.10) (14.38) (13.99) (13.35) (17.47) (26.24)
2 Cluster 2 85.49 439.85 311.85 189.97 278.58 465.04 (9.25) (20.97) (17.66) (13.78) (16.69) (21.56)
3 Cluster 3 120.43 406.57 223.80 473.10 942.55 (10.97) (20.16) (14.96) (21.75) (30.70)
4 Cluster 4 186.13 444.60 298.53 676.84 (13.64) (21.09) (17.28) (26.02)
5 Cluster 5 0.00 499.36 867.42 (0.00) (22.35) (29.45)
6 Cluster 6 0.00 142.33 (0.00) (11.93)
7 Cluster 7 0.00 (0.00)
Table 3. Mean value of different clusters in respect to 10 yield traits by Tocher’s method
S.No Number of Clusters
Days to 50% flowering
Days to maturity
Plant height (cm)
Number of branches
Number of clusters
Number of pods
Pod length (cm)
Number of seeds per pod
100 seed weight (g)
Grain yield per plot (g)
1 Cluster 1 42.04 75.29 21.26 1.06 4.58 16.60 4.32 6.55 4.16 209.71 2 Cluster 2 45.96 79.63 22.86 0.92 3.25 12.04 4.45 6.59 4.52 137.33 3 Cluster 3 41.50 76.00 21.80 1.94 5.00 19.38 4.29 6.43 3.86 255.88 4 Cluster 4 41.10 71.60 19.48 0.40 4.50 16.68 4.34 6.84 3.82 225.30 5 Cluster 5 41.50 77.50 25.13 1.75 3.50 14.00 4.38 6.50 4.80 144.00 6 Cluster 6 43.00 77.00 19.59 1.00 2.50 9.00 4.19 7.00 3.22 83.00 7 Cluster 7 48.00 79.00 25.13 0.90 2.00 6.40 4.39 6.80 3.00 25.50
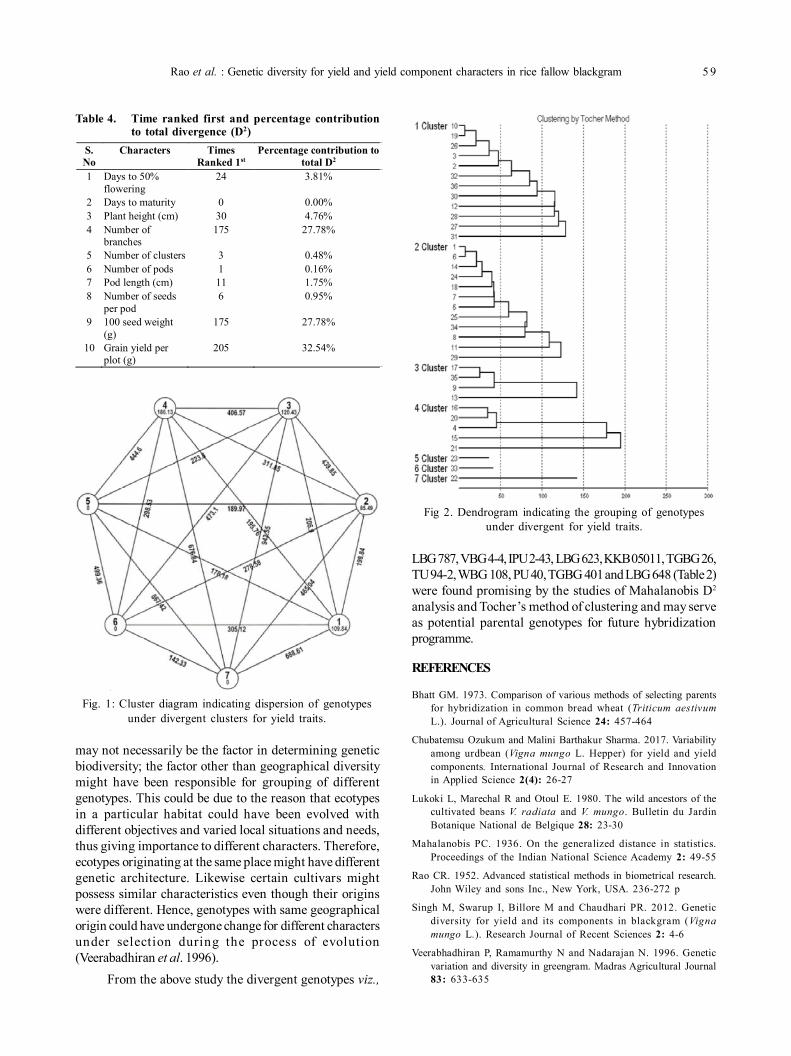
Rao et al. : Genetic diversity for yield and yield component characters in rice fallow blackgram 5 9
may not necessarily be the factor in determining geneticbiodiversity; the factor other than geographical diversitymight have been responsible for grouping of differentgenotypes. This could be due to the reason that ecotypesin a particular habitat could have been evolved withdifferent objectives and varied local situations and needs,thus giving importance to different characters. Therefore,ecotypes originating at the same place might have differentgenetic architecture. Likewise certain cultivars mightpossess similar characteristics even though their originswere different. Hence, genotypes with same geographicalorigin could have undergone change for different charactersunder selection during the process of evolution(Veerabadhiran et al. 1996).
From the above study the divergent genotypes viz.,
Table 4. Time ranked first and percentage contributionto total divergence (D2)
S. No
Characters Times Ranked 1st
Percentage contribution to total D2
1 Days to 50% flowering
24 3.81%
2 Days to maturity 0 0.00% 3 Plant height (cm) 30 4.76% 4 Number of
branches 175 27.78%
5 Number of clusters 3 0.48% 6 Number of pods 1 0.16% 7 Pod length (cm) 11 1.75% 8 Number of seeds
per pod 6 0.95%
9 100 seed weight (g)
175 27.78%
10 Grain yield per plot (g)
205 32.54%
Fig. 1: Cluster diagram indicating dispersion of genotypesunder divergent clusters for yield traits.
Fig 2. Dendrogram indicating the grouping of genotypesunder divergent for yield traits.
LBG 787, VBG 4-4, IPU 2-43, LBG 623, KKB 05011, TGBG 26,TU 94-2, WBG 108, PU 40, TGBG 401 and LBG 648 (Table 2)were found promising by the studies of Mahalanobis D2
analysis and Tocher’s method of clustering and may serveas potential parental genotypes for future hybridizationprogramme.
REFERENCES
Bhatt GM. 1973. Comparison of various methods of selecting parentsfor hybridization in common bread wheat (Triticum aestivumL.). Journal of Agricultural Science 24: 457-464
Chubatemsu Ozukum and Malini Barthakur Sharma. 2017. Variabilityamong urdbean (Vigna mungo L. Hepper) for yield and yieldcomponents. International Journal of Research and Innovationin Applied Science 2(4): 26-27
Lukoki L, Marechal R and Otoul E. 1980. The wild ancestors of thecultivated beans V. radiata and V. mungo. Bulletin du JardinBotanique National de Belgique 28: 23-30
Mahalanobis PC. 1936. On the generalized distance in statistics.Proceedings of the Indian National Science Academy 2: 49-55
Rao CR. 1952. Advanced statistical methods in biometrical research.John Wiley and sons Inc., New York, USA. 236-272 p
Singh M, Swarup I, Billore M and Chaudhari PR. 2012. Geneticdiversity for yield and its components in blackgram (Vignamungo L.). Research Journal of Recent Sciences 2: 4-6
Veerabhadhiran P, Ramamurthy N and Nadarajan N. 1996. Geneticvariation and diversity in greengram. Madras Agricultural Journal83: 633-635
Journal of Food Legumes 32(1): 60-63, 2019
Short Communication
Assessment of morphological variation for different qualitative characters inpigeonpea [Cajanus cajan (L.) Millsp.] germplasmSANDEEP KUMAR YADAV, NIRAJ KUMAR, HC LAL, KRISHNA PRASAD, CS MAHTO,SHREYA SEN and BINAY KUMAR
Birsa Agricultural University, Kanke, Ranchi; E-mail: [email protected](Received : March 18, 2018 ; Accepted : June 12, 2018)
ABSTRACT
The present study was conducted at the Birsa AgriculturalUniversity, Research Farm (Dryland Section), Kanke, Ranchiduring Kharif season 2016-17 utilizing 104 genotypes ofpigeonpea along with 4 checks viz., ASHA, BA 1, BAHAR andICPB 2078 evaluated in a augmented block design II with 4blocks having spacing 1.5 m × 20 cm. Observation wererecorded from each plants and checks for thirteen qualitativecharacters viz., plant branching pattern, plant growth habit,flower colour, flower streaks, stem colour, pod colour, podpubescence, pod surface stickiness, pod waxiness, podconstriction, seed shape, seed colour and seed colour pattern.Branching pattern was found to be either erect, semi-spreading or spreading while growth habit was eitherdeterminate or indeterminate. The characters like flowerstreaks, pod pubescence, pod stickiness and pod waxinesswas categorized on the basis of presence or absence of thefollowing characters. Stem colour was found either green orpurple while flower colour was either yellow or purple. Forpod colour five different categories were observed namelygreen, green with brown streaks, green with purple streaks,purple and dark purple. Hence the characterization of severalqualitative traits will help in selection of suitable parent informulating sound breeding programme.
Key words: Determinate, Indeterminate, Semi spreading,Spreading, Streak and qualitative traits
Pigeonpea [Cajanus cajan (L.) Millsp.] also knownas Arhar, Red gram, Tur, Angole and Aahar etc. is oftencross pollinated (20-70%) out crosses crop with 2n=2x=22diploid chromosome number belongs to the familyLeguminoseae. India is considered as the native ofpigeonpea (Van der Maesen, 1980) because of its naturalgenetic variability available in the local germplasm and thepresence of its wild relatives in the country. It is a deeprooted and drought-tolerant leguminous food crop and cangrow tropical and sub-tropical regions.
Pigeonpea contains 62.78 g carbohydrates, 1.49 gfats and 21.7 g proteins per 100 grams. In India, pigeonpeais second most important pulse crop after chickpea(Sodavadiya et al. 2009 and Vijayalakshmi et al. 2013). It iswidely grown in India accounting for 90 per cent of theworld production (Rangare et al. 2013). Pigeonpea is grownin the area 5.13 mha with the production 4.23 mt and 824 kg/ha productivity respectively (Anon, 2016-17).
The good genotypes with broad genetic base havecapability to perform good in adverse climatic situationand is most suitable for the region that faces moisture stress.Being a pulse, pigeonpea enriches soil through symbioticnitrogen fixation, release soil–bound phosphorus, recyclesthe soil nutrients and add organic matter and other nutrientsthat make pigeonpea an ideal crop for sustainableagriculture. It is chiefly grown for its seed which areconsumed either as dry splits (dal) or as a green vegetable.
It is also used on a limited scale as a fodder cropwhile its stem provides a good source of fuel. A flourishingplant breeding programme heavily relies upon existence ofgenetic variability present in the base population for varioustraits and information on genetic control of concerned traitis useful for effective execution of any breeding programme.Systematic study and characterization of germplasm is notonly important for utilizing the appropriate attribute baseddonors, but also essential in the present era for protectingthe unique pigeonpea genotypes.
The present study was conducted at the BirsaAgricultural University Research Farm (Dryland Section),Kanke, Ranchi during Kharif season 2016-17. A total of 104genotypes (Table 1) of pigeonpea along with 4 checks viz.,ASHA, BA 1, BAHAR and ICPB 2078 were evaluated in aaugmented block design II with 4 blocks. The spacing was1.5 m X 20 cm observation were recorded from each plantsand checks for thirteen qualitative characters viz., plantbranching pattern, plant growth habit, flower colour, flowerstreaks, stem colour, pod colour, pod pubescence, podsurface stickiness, pod waxiness, pod constriction seedshape, seed colour and seed colour pattern given indescriptor i.e. 1 to 9 scale (Table 3).
The collection, conservation and characterization ofgenotype is the backbone of any crop improvementprogramme which in turn depends on the extent of geneticdiversity in gene pool. Diversity in plant genotypesprovides opportunity for plant breeders to develop newand improved cultivars with desirable characteristics. Theprogress of breeding programme depends mainly upon themagnitude of variability present in the breeding materials.
In pigeonpea, plant branching pattern type isimportant qualitative characters which was classified intothree groups i.e. erect, semi-spreading and spreading (Table
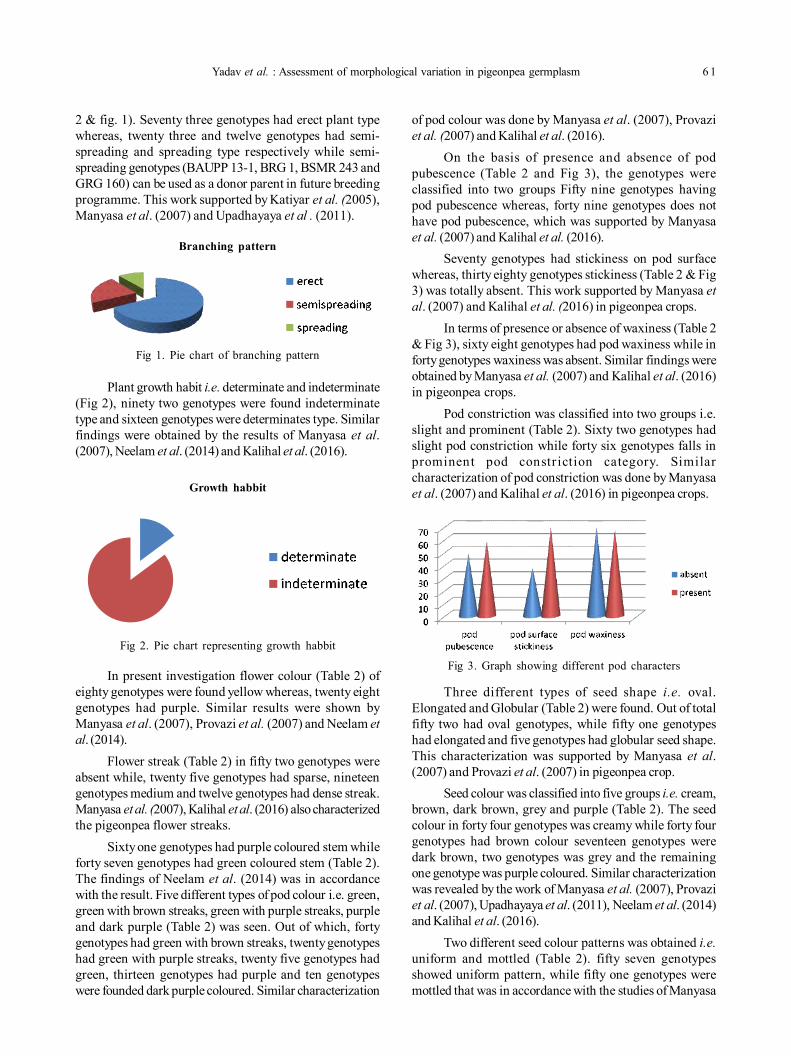
Yadav et al. : Assessment of morphological variation in pigeonpea germplasm 6 1
2 & fig. 1). Seventy three genotypes had erect plant typewhereas, twenty three and twelve genotypes had semi-spreading and spreading type respectively while semi-spreading genotypes (BAUPP 13-1, BRG 1, BSMR 243 andGRG 160) can be used as a donor parent in future breedingprogramme. This work supported by Katiyar et al. (2005),Manyasa et al. (2007) and Upadhayaya et al . (2011).
of pod colour was done by Manyasa et al. (2007), Provaziet al. (2007) and Kalihal et al. (2016).
On the basis of presence and absence of podpubescence (Table 2 and Fig 3), the genotypes wereclassified into two groups Fifty nine genotypes havingpod pubescence whereas, forty nine genotypes does nothave pod pubescence, which was supported by Manyasaet al. (2007) and Kalihal et al. (2016).
Seventy genotypes had stickiness on pod surfacewhereas, thirty eighty genotypes stickiness (Table 2 & Fig3) was totally absent. This work supported by Manyasa etal. (2007) and Kalihal et al. (2016) in pigeonpea crops.
In terms of presence or absence of waxiness (Table 2& Fig 3), sixty eight genotypes had pod waxiness while inforty genotypes waxiness was absent. Similar findings wereobtained by Manyasa et al. (2007) and Kalihal et al. (2016)in pigeonpea crops.
Pod constriction was classified into two groups i.e.slight and prominent (Table 2). Sixty two genotypes hadslight pod constriction while forty six genotypes falls inprominent pod constr iction category. Similarcharacterization of pod constriction was done by Manyasaet al. (2007) and Kalihal et al. (2016) in pigeonpea crops.
Plant growth habit i.e. determinate and indeterminate(Fig 2), ninety two genotypes were found indeterminatetype and sixteen genotypes were determinates type. Similarfindings were obtained by the results of Manyasa et al.(2007), Neelam et al. (2014) and Kalihal et al. (2016).
In present investigation flower colour (Table 2) ofeighty genotypes were found yellow whereas, twenty eightgenotypes had purple. Similar results were shown byManyasa et al. (2007), Provazi et al. (2007) and Neelam etal. (2014).
Flower streak (Table 2) in fifty two genotypes wereabsent while, twenty five genotypes had sparse, nineteengenotypes medium and twelve genotypes had dense streak.Manyasa et al. (2007), Kalihal et al. (2016) also characterizedthe pigeonpea flower streaks.
Sixty one genotypes had purple coloured stem whileforty seven genotypes had green coloured stem (Table 2).The findings of Neelam et al. (2014) was in accordancewith the result. Five different types of pod colour i.e. green,green with brown streaks, green with purple streaks, purpleand dark purple (Table 2) was seen. Out of which, fortygenotypes had green with brown streaks, twenty genotypeshad green with purple streaks, twenty five genotypes hadgreen, thirteen genotypes had purple and ten genotypeswere founded dark purple coloured. Similar characterization
Three different types of seed shape i.e. oval.Elongated and Globular (Table 2) were found. Out of totalfifty two had oval genotypes, while fifty one genotypeshad elongated and five genotypes had globular seed shape.This characterization was supported by Manyasa et al.(2007) and Provazi et al. (2007) in pigeonpea crop.
Seed colour was classified into five groups i.e. cream,brown, dark brown, grey and purple (Table 2). The seedcolour in forty four genotypes was creamy while forty fourgenotypes had brown colour seventeen genotypes weredark brown, two genotypes was grey and the remainingone genotype was purple coloured. Similar characterizationwas revealed by the work of Manyasa et al. (2007), Provaziet al. (2007), Upadhayaya et al. (2011), Neelam et al. (2014)and Kalihal et al. (2016).
Two different seed colour patterns was obtained i.e.uniform and mottled (Table 2). fifty seven genotypesshowed uniform pattern, while fifty one genotypes weremottled that was in accordance with the studies of Manyasa
Fig 3. Graph showing different pod characters
Fig 1. Pie chart of branching pattern
Branching pattern
Fig 2. Pie chart representing growth habbit
Growth habbit
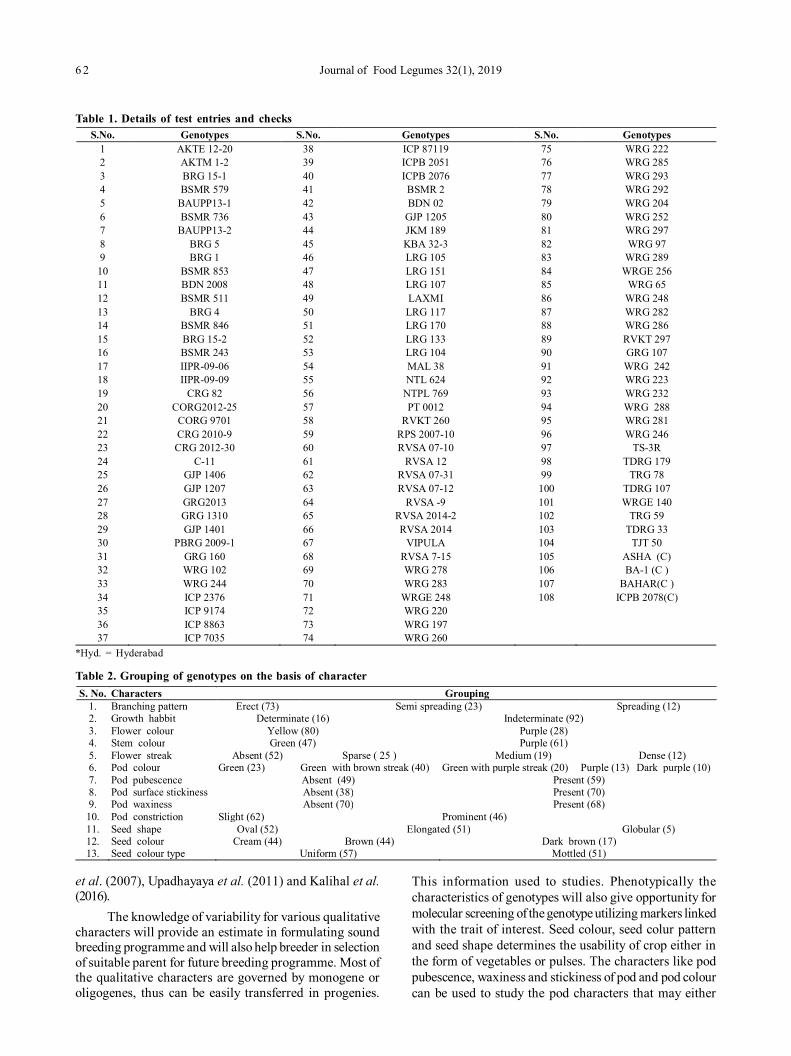
6 2 Journal of Food Legumes 32(1), 2019
Table 1. Details of test entries and checksS.No. Genotypes S.No. Genotypes S.No. Genotypes
1 AKTE 12-20 38 ICP 87119 75 WRG 222 2 AKTM 1-2 39 ICPB 2051 76 WRG 285 3 BRG 15-1 40 ICPB 2076 77 WRG 293 4 BSMR 579 41 BSMR 2 78 WRG 292 5 BAUPP13-1 42 BDN 02 79 WRG 204 6 BSMR 736 43 GJP 1205 80 WRG 252 7 BAUPP13-2 44 JKM 189 81 WRG 297 8 BRG 5 45 KBA 32-3 82 WRG 97 9 BRG 1 46 LRG 105 83 WRG 289 10 BSMR 853 47 LRG 151 84 WRGE 256 11 BDN 2008 48 LRG 107 85 WRG 65 12 BSMR 511 49 LAXMI 86 WRG 248 13 BRG 4 50 LRG 117 87 WRG 282 14 BSMR 846 51 LRG 170 88 WRG 286 15 BRG 15-2 52 LRG 133 89 RVKT 297 16 BSMR 243 53 LRG 104 90 GRG 107 17 IIPR-09-06 54 MAL 38 91 WRG 242 18 IIPR-09-09 55 NTL 624 92 WRG 223 19 CRG 82 56 NTPL 769 93 WRG 232 20 CORG2012-25 57 PT 0012 94 WRG 288 21 CORG 9701 58 RVKT 260 95 WRG 281 22 CRG 2010-9 59 RPS 2007-10 96 WRG 246 23 CRG 2012-30 60 RVSA 07-10 97 TS-3R 24 C-11 61 RVSA 12 98 TDRG 179 25 GJP 1406 62 RVSA 07-31 99 TRG 78 26 GJP 1207 63 RVSA 07-12 100 TDRG 107 27 GRG2013 64 RVSA -9 101 WRGE 140 28 GRG 1310 65 RVSA 2014-2 102 TRG 59 29 GJP 1401 66 RVSA 2014 103 TDRG 33 30 PBRG 2009-1 67 VIPULA 104 TJT 50 31 GRG 160 68 RVSA 7-15 105 ASHA (C) 32 WRG 102 69 WRG 278 106 BA-1 (C ) 33 WRG 244 70 WRG 283 107 BAHAR(C ) 34 ICP 2376 71 WRGE 248 108 ICPB 2078(C) 35 ICP 9174 72 WRG 220 36 ICP 8863 73 WRG 197 37 ICP 7035 74 WRG 260
*Hyd. = Hyderabad
et al. (2007), Upadhayaya et al. (2011) and Kalihal et al.(2016).
The knowledge of variability for various qualitativecharacters will provide an estimate in formulating soundbreeding programme and will also help breeder in selectionof suitable parent for future breeding programme. Most ofthe qualitative characters are governed by monogene oroligogenes, thus can be easily transferred in progenies.
This information used to studies. Phenotypically thecharacteristics of genotypes will also give opportunity formolecular screening of the genotype utilizing markers linkedwith the trait of interest. Seed colour, seed colur patternand seed shape determines the usability of crop either inthe form of vegetables or pulses. The characters like podpubescence, waxiness and stickiness of pod and pod colourcan be used to study the pod characters that may either
Table 2. Grouping of genotypes on the basis of characterS. No. Characters Grouping
1. Branching pattern Erect (73) Semi spreading (23) Spreading (12) 2. Growth habbit Determinate (16) Indeterminate (92) 3. Flower colour Yellow (80) Purple (28) 4. Stem colour Green (47) Purple (61) 5. Flower streak Absent (52) Sparse ( 25 ) Medium (19) Dense (12) 6. Pod colour Green (23) Green with brown streak (40) Green with purple streak (20) Purple (13) Dark purple (10) 7. Pod pubescence Absent (49) Present (59) 8. Pod surface stickiness Absent (38) Present (70) 9. Pod waxiness Absent (70) Present (68) 10. Pod constriction Slight (62) Prominent (46) 11. Seed shape Oval (52) Elongated (51) Globular (5) 12. Seed colour Cream (44) Brown (44) Dark brown (17) 13. Seed colour type Uniform (57) Mottled (51)
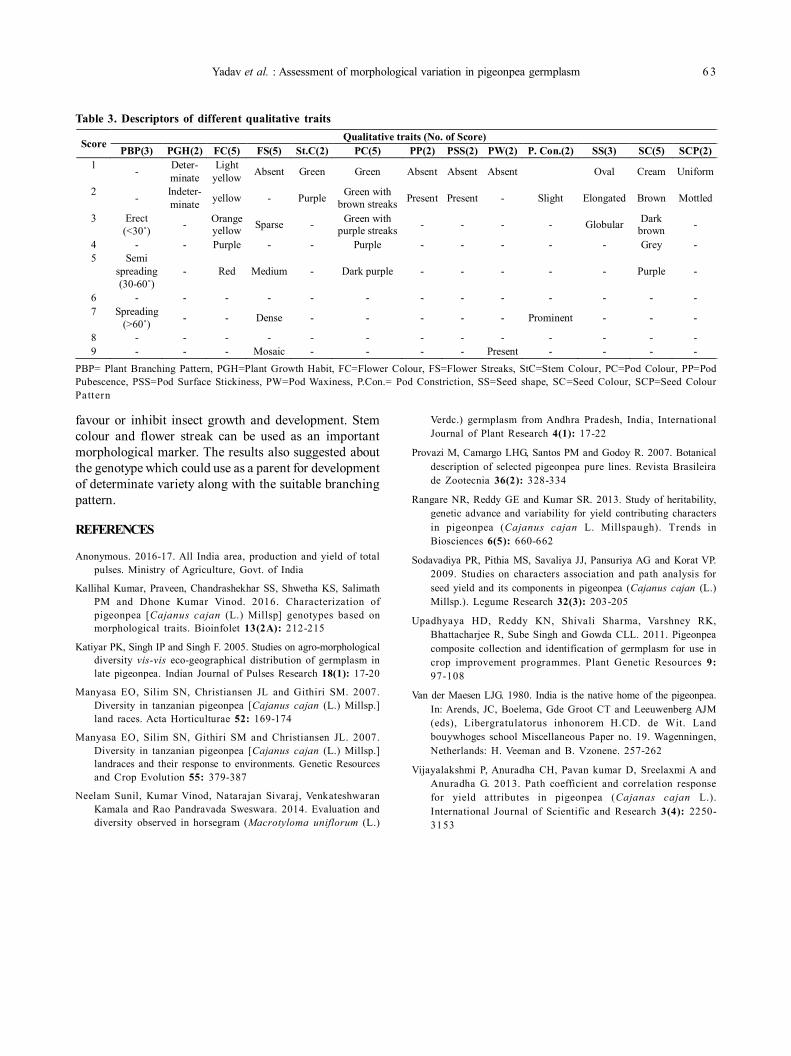
Yadav et al. : Assessment of morphological variation in pigeonpea germplasm 6 3
favour or inhibit insect growth and development. Stemcolour and flower streak can be used as an importantmorphological marker. The results also suggested aboutthe genotype which could use as a parent for developmentof determinate variety along with the suitable branchingpattern.
REFERENCES
Anonymous. 2016-17. All India area, production and yield of totalpulses. Ministry of Agriculture, Govt. of India
Kallihal Kumar, Praveen, Chandrashekhar SS, Shwetha KS, SalimathPM and Dhone Kumar Vinod. 2016. Characterization ofpigeonpea [Cajanus cajan (L.) Millsp] genotypes based onmorphological traits. Bioinfolet 13(2A): 212-215
Katiyar PK, Singh IP and Singh F. 2005. Studies on agro-morphologicaldiversity vis-vis eco-geographical distribution of germplasm inlate pigeonpea. Indian Journal of Pulses Research 18(1): 17-20
Manyasa EO, Silim SN, Christiansen JL and Githiri SM. 2007.Diversity in tanzanian pigeonpea [Cajanus cajan (L.) Millsp.]land races. Acta Horticulturae 52: 169-174
Manyasa EO, Silim SN, Githiri SM and Christiansen JL. 2007.Diversity in tanzanian pigeonpea [Cajanus cajan (L.) Millsp.]landraces and their response to environments. Genetic Resourcesand Crop Evolution 55: 379-387
Neelam Sunil, Kumar Vinod, Natarajan Sivaraj, VenkateshwaranKamala and Rao Pandravada Sweswara. 2014. Evaluation anddiversity observed in horsegram (Macrotyloma uniflorum (L.)
Table 3. Descriptors of different qualitative traits
PBP= Plant Branching Pattern, PGH=Plant Growth Habit, FC=Flower Colour, FS=Flower Streaks, StC=Stem Colour, PC=Pod Colour, PP=PodPubescence, PSS=Pod Surface Stickiness, PW=Pod Waxiness, P.Con.= Pod Constriction, SS=Seed shape, SC=Seed Colour, SCP=Seed ColourPattern
Score Qualitative traits (No. of Score) PBP(3) PGH(2) FC(5) FS(5) St.C(2) PC(5) PP(2) PSS(2) PW(2) P. Con.(2) SS(3) SC(5) SCP(2)
1 - Deter- minate
Light yellow Absent Green Green Absent Absent Absent Oval Cream Uniform
2 - Indeter- minate yellow - Purple Green with
brown streaks Present Present - Slight Elongated Brown Mottled
3 Erect (<30˚) - Orange
yellow Sparse - Green with purple streaks - - - - Globular Dark
brown -
4 - - Purple - - Purple - - - - - Grey - 5 Semi
spreading (30-60˚)
- Red Medium - Dark purple - - - - - Purple -
6 - - - - - - - - - - - - - 7 Spreading
(>60˚) - - Dense - - - - - Prominent - - -
8 - - - - - - - - - - - - - 9 - - - Mosaic - - - - Present - - - -
Verdc.) germplasm from Andhra Pradesh, India, InternationalJournal of Plant Research 4(1): 17-22
Provazi M, Camargo LHG, Santos PM and Godoy R. 2007. Botanicaldescription of selected pigeonpea pure lines. Revista Brasileirade Zootecnia 36(2): 328-334
Rangare NR, Reddy GE and Kumar SR. 2013. Study of heritability,genetic advance and variability for yield contributing charactersin pigeonpea (Cajanus cajan L. Millspaugh). Trends inBiosciences 6(5): 660-662
Sodavadiya PR, Pithia MS, Savaliya JJ, Pansuriya AG and Korat VP.2009. Studies on characters association and path analysis forseed yield and its components in pigeonpea (Cajanus cajan (L.)Millsp.). Legume Research 32(3): 203-205
Upadhyaya HD, Reddy KN, Shivali Sharma, Varshney RK,Bhattacharjee R, Sube Singh and Gowda CLL. 2011. Pigeonpeacomposite collection and identification of germplasm for use incrop improvement programmes. Plant Genetic Resources 9:97-108
Van der Maesen LJG. 1980. India is the native home of the pigeonpea.In: Arends, JC, Boelema, Gde Groot CT and Leeuwenberg AJM(eds), Libergratulatorus inhonorem H.CD. de Wit. Landbouywhoges school Miscellaneous Paper no. 19. Wagenningen,Netherlands: H. Veeman and B. Vzonene. 257-262
Vijayalakshmi P, Anuradha CH, Pavan kumar D, Sreelaxmi A andAnuradha G. 2013. Path coefficient and correlation responsefor yield attributes in pigeonpea (Cajanas cajan L.).International Journal of Scientific and Research 3(4): 2250-3153
Journal of Food Legumes 32(1): 64, 2019
List of Referees for Vol. 32(1)
The Editorial Board gratefully acknowledges the help rendered by following referees in reviewing manuscripts for theVol. 32(1): 2019.
Dr. C. S. Praharaj, ICAR-IIPR, Kanpur
Dr. D. K. Agarawal, ICAR-IISS, Mau
Dr. RDS Yadav, NDUA&T Ayodhya
Dr. Anita Babber, JNKVV, Jabalpur
Dr. Rajesh Kumar, ICAR-IIPR, Kanpur
Dr. K. K. Singh, ICAR-IIPR, Kanpur
Dr. Alok Das, ICAR-IIPR, Kanpur
Dr. Debjyoti Sen Gupta, ICAR-IIPR, Kanpur
Dr. Satish Nayak, ICAR-IIPR, Kanpur
Dr. Amrit Lamichaney, ICAR-IIPR, Kanpur
Dr. Baswaraj T., ICAR-IIPR, Kanpur
Dr. G. K. Sujayanand, ICAR-IIPR, Kanpur
Dr. Shripad Bath, ICAR-IIPR, Kanpur
Dr. C. P. Nath, ICAR-IIPR, Kanpur
Dr. Ashish Datta, ICAR-IIPR, Kanpur
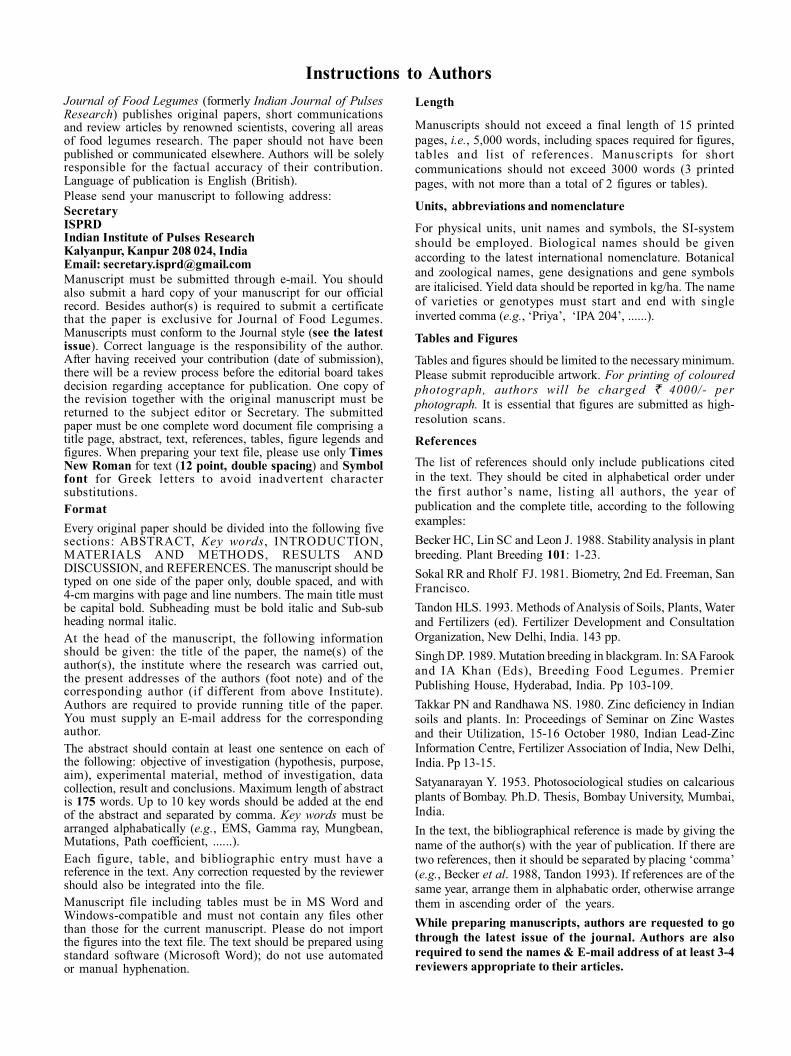
Instructions to AuthorsJournal of Food Legumes (formerly Indian Journal of PulsesResearch) publishes original papers, short communicationsand review articles by renowned scientists, covering all areasof food legumes research. The paper should not have beenpublished or communicated elsewhere. Authors will be solelyresponsible for the factual accuracy of their contribution.Language of publication is English (British).Please send your manuscript to following address:SecretaryISPRDIndian Institute of Pulses ResearchKalyanpur, Kanpur 208 024, IndiaEmail: [email protected] must be submitted through e-mail. You shouldalso submit a hard copy of your manuscript for our officialrecord. Besides author(s) is required to submit a certificatethat the paper is exclusive for Journal of Food Legumes.Manuscripts must conform to the Journal style (see the latestissue). Correct language is the responsibility of the author.After having received your contribution (date of submission),there will be a review process before the editorial board takesdecision regarding acceptance for publication. One copy ofthe revision together with the original manuscript must bereturned to the subject editor or Secretary. The submittedpaper must be one complete word document file comprising atitle page, abstract, text, references, tables, figure legends andfigures. When preparing your text file, please use only TimesNew Roman for text (12 point, double spacing) and Symbolfont for Greek letters to avoid inadvertent charactersubstitutions.FormatEvery original paper should be divided into the following fivesections: ABSTRACT, Key words, INTRODUCTION,MATERIALS AND METHODS, RESULTS ANDDISCUSSION, and REFERENCES. The manuscript should betyped on one side of the paper only, double spaced, and with4-cm margins with page and line numbers. The main title mustbe capital bold. Subheading must be bold italic and Sub-subheading normal italic.At the head of the manuscript, the following informationshould be given: the title of the paper, the name(s) of theauthor(s), the institute where the research was carried out,the present addresses of the authors (foot note) and of thecorresponding author (if different from above Institute).Authors are required to provide running title of the paper.You must supply an E-mail address for the correspondingauthor.The abstract should contain at least one sentence on each ofthe following: objective of investigation (hypothesis, purpose,aim), experimental material, method of investigation, datacollection, result and conclusions. Maximum length of abstractis 175 words. Up to 10 key words should be added at the endof the abstract and separated by comma. Key words must bearranged alphabatically (e.g., EMS, Gamma ray, Mungbean,Mutations, Path coefficient, ......).Each figure, table, and bibliographic entry must have areference in the text. Any correction requested by the reviewershould also be integrated into the file.Manuscript file including tables must be in MS Word andWindows-compatible and must not contain any files otherthan those for the current manuscript. Please do not importthe figures into the text file. The text should be prepared usingstandard software (Microsoft Word); do not use automatedor manual hyphenation.
Length
Manuscripts should not exceed a final length of 15 printedpages, i.e., 5,000 words, including spaces required for figures,tables and list of references. Manuscripts for shortcommunications should not exceed 3000 words (3 printedpages, with not more than a total of 2 figures or tables).
Units, abbreviations and nomenclature
For physical units, unit names and symbols, the SI-systemshould be employed. Biological names should be givenaccording to the latest international nomenclature. Botanicaland zoological names, gene designations and gene symbolsare italicised. Yield data should be reported in kg/ha. The nameof varieties or genotypes must start and end with singleinverted comma (e.g., ‘Priya’, ‘IPA 204’, ......).
Tables and Figures
Tables and figures should be limited to the necessary minimum.Please submit reproducible artwork. For printing of colouredphotograph, authors will be charged ` 4000/- perphotograph. It is essential that figures are submitted as high-resolution scans.
ReferencesThe list of references should only include publications citedin the text. They should be cited in alphabetical order underthe first author’s name, listing all authors, the year ofpublication and the complete title, according to the followingexamples:Becker HC, Lin SC and Leon J. 1988. Stability analysis in plantbreeding. Plant Breeding 101: 1-23.Sokal RR and Rholf FJ. 1981. Biometry, 2nd Ed. Freeman, SanFrancisco.Tandon HLS. 1993. Methods of Analysis of Soils, Plants, Waterand Fertilizers (ed). Fertilizer Development and ConsultationOrganization, New Delhi, India. 143 pp.Singh DP. 1989. Mutation breeding in blackgram. In: SA Farookand IA Khan (Eds), Breeding Food Legumes. PremierPublishing House, Hyderabad, India. Pp 103-109.Takkar PN and Randhawa NS. 1980. Zinc deficiency in Indiansoils and plants. In: Proceedings of Seminar on Zinc Wastesand their Utilization, 15-16 October 1980, Indian Lead-ZincInformation Centre, Fertilizer Association of India, New Delhi,India. Pp 13-15.Satyanarayan Y. 1953. Photosociological studies on calcariousplants of Bombay. Ph.D. Thesis, Bombay University, Mumbai,India.In the text, the bibliographical reference is made by giving thename of the author(s) with the year of publication. If there aretwo references, then it should be separated by placing ‘comma’(e.g., Becker et al. 1988, Tandon 1993). If references are of thesame year, arrange them in alphabatic order, otherwise arrangethem in ascending order of the years.While preparing manuscripts, authors are requested to gothrough the latest issue of the journal. Authors are alsorequired to send the names & E-mail address of at least 3-4reviewers appropriate to their articles.