Embed Size (px)
Citation preview
Executive Report
Global Knowledge Index 2017: Executive Report

Global Knowledge Index has been produced through a partnership between Mohammed Bin RashidAl Maktoum Knowledge Foundation (MBRF) and United Nations Development Programme/
Regional Bureau for Arab States (UNDP/RBAS)
Printed at Al Ghurair Printing and Publishing, Dubai – United Arab Emirateson Chlorine – Free paper and using plant-based ink manufactured according to environmentally-friendly
technologies.
Cover Design: Lucie Abi-NehmeLayout and Production: Al Ghurair Printing and Publishing, Dubai
Printed in Dubai - United Arab Emirates
The analyses and results presented in this publication do not necessarily reflect the views of Mohammed bin Rashid Al Maktoum Knowledge Foundation or United Nations Development Programme, its Executive Board Members or United Nations Member States. The report is an independent publication, produced by a
team of prominent consultants and experts.
This report has been originally written in Arabic. The English translation has been edited for flow and clarity, and as such may not reflect all part or sentences in the Arabic version.

With its ever-growing list of initiatives and outward-looking projects, the Mohammed Bin Rashid Al Maktoum Knowledge Foundation has broadened its scope to go far beyond the borders of the UAE, and those of the greater surrounding region, for that matter. The Foundation is now a global institution communicating with and spreading knowledge to all corners of the globe. With that, we are abiding closely by the forward-thinking vision of our wise leaders, and particularly, His Highness Sheikh Mohammed bin Rashid Al Maktoum, Vice President and Prime Minister of the UAE, Ruler of Dubai, who said: “Our objective is to show the world that we are able to contribute to humanity through quality knowledge and scientific discoveries.”
Driven by H.H.’s aspirations, we, at the Mohammed bin Rashid Al Maktoum Knowledge Foundation, have spared no effort to offer the world one knowledge-powered initiative after the other. Today, we’ve joined hands with our strategic partner, the United Nations Development Program (UNDP), to launch an all-new scientific instrument and a seismic shift towards sustainable development.
The Foundation is not out of touch with the rapid advancements taking place around the world, we strive to
remain abreast of all transformations brought about by the digital revolution, which have affected all aspects of our lives. To that end, we have launched a host of creative projects and initiatives, and today, we are gathered here to announce yet another ambitious project: the first-ever Global Knowledge Index, which promises to be a global knowledge platform, that tracks the realities of this sector in 140 countries around the world, highlighting challenges and proposing solutions for the sustainable development of societies.
With the Global Knowledge Index, we offer the world a scientific tool to accurately evaluate knowledge, identify challenges, strengths and weaknesses within the sector, and share valuable insight and expertise.
The Index provides timely and accurate data, organised based on a thorough and scientific classification system, in order to establish a competitive environment between governments and other competent authorities. It is a sophisticated instrument that supports decision-makers and lays the foundations for a holistic sustainable development strategy for peoples around the world.
Global Knowledge Index…
A Seismic Shift Towards Sustainable Development
Foreword
Mohammed Bin Rashid Al Maktoum Knowledge Foundation
Ahmed bin Mohammed bin Rashid Al Maktoum, Chairman of MBRF

I am pleased to present the Global Knowledge Index, the latest product of the successful partnership between the United Nations Development Programme (UNDP) and the Mohammed bin Rashid Al Maktoum Knowledge Foundation (MBRF).
We introduce this tool hoping that it will inspire policymakers and stakeholders across the world to design initiatives that best employ knowledge to achieve sustainable development, as we pursue our global shared vision to achieve a prosperous and just future for people and the planet – one that leaves no one behind as envisaged in the 2030 Agenda for Sustainable Development and the Sustainable Development Goals.
Knowledge is the cornerstone of sustainable development. Profound transformations triggered by globalisation and the unprecedented proliferation of information technologies have changed the rules of progress: now more than ever, a country’s ability to harness knowledge is pivotal to its ability to thrive. Indeed, the capacity to produce and apply knowledge in service of the economy, social progress and environmental sustainability is a distinguishing factor in sustainable development.
A key challenge to managing the knowledge transformation is the measurement of knowledge and its contribution to development. In 2015, UNDP and MBRF introduced the Arab Knowledge Index, in a pioneering effort to address the deficit in data and information about the nexus of
knowledge and development in the Arab region. The index provided policymakers with a practical tool to guide the assessment, planning and implementation of policies that maximize the employment of knowledge to further development.
The positive reception of the Arab Knowledge Index prompted this present endeavour to develop the Global Knowledge Index, which employs a comprehensive set of standardized indicators to measure the performance of vital knowledge sectors. The index offers objective data to help countries track progress trends over time to better employ knowledge in meeting changing development needs, and facilitates comparisons with other countries, enabling better learning from and adaptation of successful experiences.
At UNDP, we value our partnership with the Mohammed bin Rashid Al Maktoum Knowledge Foundation, and remain committed to our shared vision of promoting knowledge as a key driver of sustainable human development. I salute MBRF’s unwavering support to the endeavour of establishing knowledge societies, not only in the UAE, but across the Arab region and beyond.
Foreword
United Nations Development Programme
Mourad WahbaUnited Nations Assistant Secretary-General
Assistant Administrator & Director of the Regional Bureau for Arab States, United Nations Development Programme

Table of Contents
Introduction 1 Defining knowledge 3Linking knowledge with development 3Measuring knowledge: Review of other tools and approaches 4The Global Knowledge Index (GKI): Towards a multidimensional index 5General Methodology 6Statistical Methodology 9
Selection of variables 9Data collection 10Data treatment 10Index weighting 11Index calculation 11
Index structure 12Pre-University Education Index 12
Structure of the Pre-University Education Index 13 Knowledge capital 13 Educational enabling environment 15Relative weighting 16
Technical Vocational Education and Training (TVET) Index 16Structure of the TVET Index 18 Formation and professional training 18 Features of the labour market 18Relative weighting 19
Higher Education Index 19Structure of the Higher Education Index 20 Higher education inputs 20 Higher education outputs and quality 20Relative weighting 22
Research, Development and Innovation (RDI) Index 22Structure of the RDI Index 22 Research and development 23 Innovation in production 24 Social innovation 25Relative weighting 25
Information and Communications Technology (ICT) Index 26Structure of the ICT Index 27 ICT inputs 27 ICT outputs 27Relative weighting 29
Economy Index 29Structure of the Economy Index 30 Knowledge competitiveness 30 Economic openness 32
Financing and value added 32Relative weighting 33
General Enabling Environment Index 33Structure of the General Enabling Environment Index 33 Political and institutional 33 Socio-economic 34 Environment and health 35Relative Weighting 35
Key findings 36Concluding remarks 37
Endnotes 39
References 41
References in Arabic 41References in English 42References in French 48
List of figures Figure 1: The Knowledge Index: Support for Development Policies 6Figure 2: Construction of the Global Knowledge Index 7Figure 3: Structure of the Global Knowledge Index 9Figure 4: Structure of the Pre-University Education Index 14Figure 5: Structure of the Technical Vocational Education and Training Index 17Figure 6: Structure of the Higher Education Index 21Figure 7: Structure of the Research, Development and Innovation Index 23Figure 8: Structure of the Information and Communications Technology Index 28Figure 9: Structure of the Economy Index 31Figure 10: Structure of the General Enabling Environment Index 34Figure 11: Correlation of the GKI to the Human Development Index and SDG Index 35Figure 12: Comparison across Sectors 36
List of Tables
Table 1: Comparison of Sectoral Average Scores of Top Ranking and Lowest Ranking Countries 35


Contributors
AdvisorsAhmed El-Sherbini, Ali Hadi, Anuja Utz, Hugo Hollanders, Jan Sturesson, Jean-Louis Laville,
Laurent Probst, Leif Edvinsson, Luis Serven, Milorad Kovacevic, Shyamal Majumdar, Sid-Ahmed Soussi
Core TeamNajoua Fezza Ghriss (Main Author/ Pre-University Education), Youssef Sadik (TVET),
Ali Ibrahim (Higher Education), Ali Saeed Al-Kaabi (Higher Education), Motaz Khorshid (RDI), Yousry El Gamal (ICT), Khalid Al-Wazani (Economy), Mohamad Ismail (Expert Statistician)
Arab Knowledge Project Director (UNDP)Hany Torky
Mohammed bin Rashid Al Maktoum Knowledge FoundationJamal Bin Huwaireb (CEO), Saif Al-Mansoori (Corporate Affairs Advisor to the CEO)
United Nations Development Programme (UNDP)Mourad Wahba (United Nations Assistant Secretary-General, Assistant Administrator and Director of the
Regional Bureau for Arab States), Khaled Abdel Shafi (Regional Hub Director), Yakup Beris (Regional Programme Coordinator), Alberto Natta (Regional Programme Analyst)
Arab Knowledge Project (UNDP)Anthony Fakhoury, Hany Torky, Mariam Itani, Samah Hammoud, Sara Diab, Sara Salame,
Sirine Saghira, Stéphanie Boustany
Digital Platform and Mobile ApplicationDany Wazen (ICT Coordinator, UNDP)
Integrated Digital Systems (IDS)
Programme SupportAbusabeeb Elsadig (Results and Resource Management Specialist and Regional Programme Management
Support Unit Head), Maya Beydoun (Project Management Specialist), Tarek Abdelhadi (Project Management Consultant)
EditorsArabic: Mariam El-AliEnglish: Francis Field
Translation to EnglishAbdulrahman Bustani

1Global Knowledge Index 2017
Int roduction
This publication provides an introduction to the ‘Global Knowledge Index’ (GKI) - a joint initiative between the United Nations Development Programme and the Mohammed bin Rashid Al Maktoum Knowledge Foundation (MBRF).
The Index aims to measure the multidimensional concept of knowledge. The concept is a fluid one, often linked to related concepts such as ‘knowledge economy’ or ‘knowledge society’. It is also sometimes restricted to a narrow understanding that limits the focus to education or technology.
Given the variations in its use and meaning, the GKI aims to introduce a more systematic understanding of knowledge in two respects:
- It breaks down the concept into its constituent components - i.e. education, economy, research and technology. Therefore, it recognizes the multidimensional nature of knowledge systems in all contexts and applications relating to economic and social structures. This allows a more meaningful and insightful exploration of knowledge policies in relation to different sectors.
- It also enables a more scientific and evidence-based linkage between development and a multidimensional concept of knowledge, in keeping with the notion of human development as applied by the UNDP as well as the concept of sustainable development agreed by world leaders in 2015 in the 2030 Agenda for Sustainable Development.
Once the concept is clarified and the linkage with development is established, it is possible to introduce a more comprehensive approach to ‘knowledge-based development’. This can guide policymakers, researchers, civil society and the private sector to work together on different aspects of policies to foster a development process that seeks to invest individuals – from an early age – with the necessary skills to prepare them for the future.
A focus on knowledge in understanding development invites us to rethink gaps, imbalances and inequalities among and
within countries. The World Bank was among the first to consider this knowledge gap, noting that “the widening access to knowledge brought about by the technology and information revolution is transforming relationships between expert and amateur, government and citizen, aid donor and recipient”, and stressing that “knowledge cannot be static, nor can it move in one direction only. Instead it must flow constantly back and forth across an ever-changing web, involving all who create and use it”.1 This gap, however, should not be explained in overly-simplistic terms of who owns the knowledge and who does not, because the underlying social inequities that determine imbalances in terms of knowledge acquisition must also be considered.2
While information and communications technology has enabled broader and faster dissemination of knowledge from a greater variety of sources, this has not closed the widening knowledge gap between countries and regions, leading to profound and multifaceted development imbalances. UNESCO’s 2005 report on knowledge societies supports this argument, stating that all countries are not equal in confronting knowledge challenges, adding another fundamental ‘gap’ to existing inequalities.3
Consequently, the relationship between knowledge and development was reformulated, resulting in the consideration of knowledge as a major driver of development. In this sense, development becomes a comprehensive process that touches on multiple human dimensions such as education, economy, health, politics, culture and society. All these aspects refer to the broader concept of sustainable development, of which people are the essence, engine and purpose.
With such complexity, attempts to bridge these gaps cannot depend on improvizational processes or interpretations based on unreliable data and analysis. Rather, it is necessary to gather a precise and objective description of the reality of those gaps in their different manifestations. This requires a systematic assessment process based on scientific indicators that take into consideration the multidimensional nature of knowledge and its functional links to sustainable human development. The Global Knowledge Index has been developed in response to this specific need.

3Global Knowledge Index 2017
Defining knowledge
The concept of knowledge adopted by the Knowledge Project at its launch in 2008, which has matured during the course of the six reports produced up to 2016, encompasses all information acquired by mankind, as well as our perceptions of ourselves and our surroundings. However, it is not merely an accumulation of information; rather, it is a chain of research, scrutiny, analysis, criticism and selection that produces new useful ideas and tools.4 It includes all human creations in the fields of natural science, technology, humanities, social sciences, literature, arts and the breadth of human expertise.5 The value of this knowledge lies not only in its production and dissemination, but also in an equally important social sense, through sharing and integrating knowledge in work, family and society. Hence, the value of products in the knowledge society lies not in the raw materials used, nor in the capital expended, but in the knowledge incorporated in the end product6, and the extent to which the available knowledge base is utilized to drive development and innovation.7
There are two categories of knowledge: explicit knowledge, which is embodied, encoded or written so that it can be learned and utilized; and implicit knowledge, which is complex and embedded in the minds, behaviour, lives and professional experiences of individuals and groups. 8Another classification distinguishes between scientific knowledge, which is the driving force behind industrial development and is often encoded and acquired through institutional learning; and traditional knowledge, which is acquired through practice and experience and reflects the characteristics of the local cultural and physical environment.9 Whatever classification is used, there is common agreement that knowledge worthy of acquisition is that which is developed through intellectual efforts and innovative or creative activities that may employ that knowledge to bring about positive change, develop capabilities or expand opportunities.
Linking knowledge with development
There are various definitions of development. This report considers two main examples that are predominantly used in the international development community.
The first is the concept of ‘human development’, the definition of which itself has expanded with time. Originally confined only to economics, it was then extended to encompass all economic, political and social aspects of society. It became too broad to be confined to one field, because human development is centred around mankind, which by its very nature is multifaceted. More recently, the concept of development has been widely used to replace that of ‘progress’ or ‘advancement’, which had prevailed in the literature of economics and politics for the past century. Gradually, it has become associated with other equally important concepts, namely ‘knowledge’ and ‘sustainability’, which has increased both the importance and complexity of these three concepts.
The other commonly used term is ‘sustainable development’, which has many variations in use. The most prevalent among international economic organizations is that provided by the World Commission on Environment and Development (WCED) in its Brundtland Report: “Sustainable development is development that meets the needs of the present without compromising the ability of future generations to meet their own needs”.10
Sustainable human development theory has emerged as a maturation of these two development approaches: the human development strategy developed in the UNDP Human Development Report, based on the dissertations of Mahbub ul Haq and Amartya Sen; and the sustainable development approach adopted by the United Nations Conference on Environment and Development in Rio de Janeiro in 1992.11 Accordingly, development must be sustainable if it is to meet present needs without neglecting the future needs of a given society in these three basic dimensions (i.e. economic, social and environmental sustainability).12
4 Global Knowledge Index 2017
As for the relationship between knowledge and development, as will be further elaborated in the findings of this report, there is a strong statistical correlation between the two. This correlation is derived from a comparison of countries’ rankings in the Global Knowledge Index and in development-related indices such as the Human Development Index and the Sustainable Development Goals Index. This relation reinforces the conceptual foundations and assumptions of the Global Knowledge Index, whereby knowledge and development are closely linked and mutually influenced.
The World Bank pioneered the placing of the concept of knowledge at the centre of development in the World Development Report, ‘Knowledge for Development’, in which it recognized that the most significant imbalances exist in the ability to acquire knowledge – rather than income – and that being able to drive development is as important as earning physical capital. The difference between rich and poor countries is not only the lower availability of financial resources to the latter, but also their weak capacity to produce, share and use knowledge to meet the daily challenges they face. The report also stressed, in a remarkable departure from the embrace of absolute economic freedom, the need for active support on the part of states and regional blocs for efforts to acquire knowledge.13
Sustainable human development is a comprehensive, balanced and long-term process that is closely linked to the status of knowledge and can only be managed and achieved through careful planning, hard work, continuous monitoring and objective evaluation. Hence, the process of measuring knowledge for development is essential, especially given the risks to human life and the environment, the widening of development gaps and the multiple forms of deprivation and discrimination experienced around the world. Moreover, the problems hindering sustainable development affect all areas of human life, highlighting the need for sound solutions that take into consideration all social and economic developmental aspects, technological advances, environmental protection and changes in the daily lives of individuals and modern societies.
Measuring knowledge: Review of other tools and approaches
The need for a scientific approach to the measurement of knowledge has long been acknowledged. Below is a non-exhaustive list of attempts to introduce such measures in the context of understanding knowledge within the broader context of the economy or institutional structures:
- The World Bank’s Knowledge Assessment Methodology (KAM): in an effort to help countries identify the challenges and opportunities they face in their progress towards the knowledge economy, an interactive reference tool has been developed to monitor the overall level of countries’ readiness for a knowledge-based economy. This methodology is based on two indices: the Knowledge Index (KI) and the Knowledge Economy Index (KEI). The first is the simple average of three pillars: innovation; education; and ICT infrastructure. The second represents an arithmetic mean of four pillars, with the addition of the economic and institutional system. The World Bank stopped producing the index as of 2013.14
- The Lisbon Scorecard was used for the first time in 2004 in a World Economic Forum report as a tool for comparing the progress made by EU member states towards developing knowledge economies to that achieved by the USA and East Asian countries.15 The tool investigated eight pillars: information society; innovation, research and development; liberalization; network industries; financial services; enterprise environment; social inclusion; and sustainable development.16 In 2010, this structure was revised to be more responsive to the requirements of the Europe 2020 strategy. The ‘information society’ was integrated into the ‘innovation’ pillar, while ‘network industries’ and ‘financial services’ were integrated into the ‘liberalization’ pillar. Thus, the modified format covered five pillars: innovation; liberalization; enterprise; employment and social inclusion; and sustainable development and the environment.17
5Global Knowledge Index 2017
- The European Innovation Scoreboard, formerly known as the Innovation Union Scoreboard, has also been used to monitor the implementation of the Europe 2020 strategy by assessing the performance of national innovation systems in EU Member States, other European countries and neighbouring regions. The final tool (2017) includes 27 indicators under four main groups: framework conditions, investments, innovation activities and impacts. It covers the following 10 innovation dimensions: human resources; attractive research systems; innovation-friendly environment; finance and support; firm investments; innovators; linkages; intellectual assets; employment impacts; and sales impacts. 18
- Unlike the above indicators which measure the performance of states, the Kensho Index, launched in 2014, aims to measure the level of knowledge in organizations and companies. The real value of this tool lies in its ability to highlight institutions that are empowered to use the most important organizational resources – namely knowledge – with a high degree of efficiency. ‘Kensho New Economy Indices: 21st Century Sectors’ are comprehensive and objective tools that dynamically measure many of the industries that drive the ‘new economy’ (e.g. smart transportation, clean power index, intelligent infrastructure index, final frontiers index, future security index), and enable investors to understand the factors that make enterprises successful in benefiting from technological evolutions. 19
- At the Arab states level, attempts have been made to measure aspects of knowledge using sub-indices that form part of a comprehensive composite index. For example, the Arab Competitiveness Index includes a sub-index, the Implicit Competitiveness Index, that in turn comprises three main pillars: capacity for innovation/localization of technology; human capital; and technological infrastructure.20 In 2015, UNDP, in partnership with MBRF, launched the first Arab initiative to build six composite indicators to measure the state of knowledge in the Arab region from a development perspective, while focusing on
the sectors of education; economy; ICT; and research, development and innovation (RDI).21 In 2016, the second version of the Arab Knowledge Index was released, alongside a special index on reading in the Arab region as a knowledge-related component that should be viewed in the context of personal and environmental factors.22
The Global Knowledge Index (GKI): Towards a multidimensional index
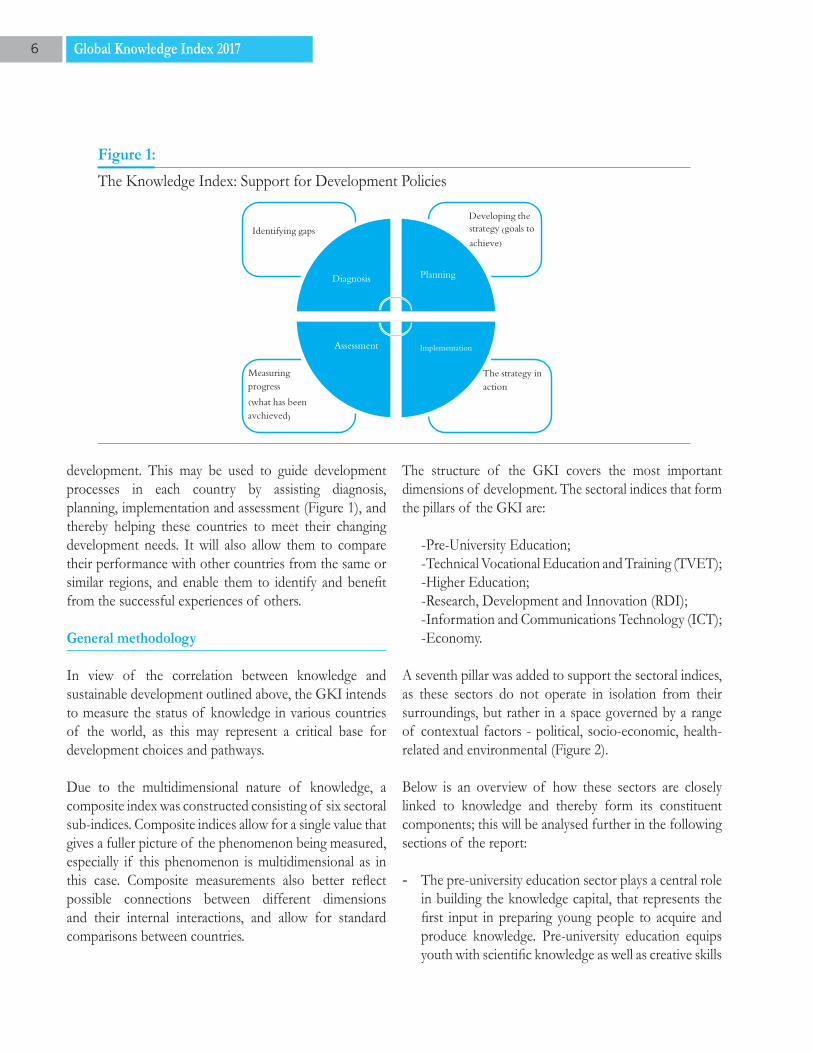
If we agree with Stewart that we cannot manage what we cannot measure,23 or with Bukh et al. that management and measurement are two sides of the same coin,24 we may also recognise the importance of developing systematic and scientific tools to measure and monitor progress towards knowledge-based development. Such tools will allow decision makers and specialists in various fields to identify the strengths and weaknesses of the development process, as well as factors of success and failure, and determine the precise parameters of progress. Indeed, the sustainable development goals emphasise the importance of the identification of quality indicators in the decision-making process and the need for good and reliable data for monitoring, tracking and measuring progress.25
From this perspective, the Global Knowledge Index aspires to evolve in the near future into a systematic tool that helps countries find realistic, objective and accurate answers to four fundamental questions concerning their knowledge status:
- Where are they now? (diagnosis of the status quo).- Where do they want to be? (the desired situation).- What path should they follow? (development strategy).- What progress are they making? (monitoring, tracking
and evaluation). Therefore, this knowledge initiative represents a direct contribution to global sustainable development efforts; it contributes to the creation of a tool to measure the availability of objective data regarding the various discrepancies between countries in terms of their ability to generate and use knowledge in a way that fosters
6 Global Knowledge Index 2017
development. This may be used to guide development processes in each country by assisting diagnosis, planning, implementation and assessment (Figure 1), and thereby helping these countries to meet their changing development needs. It will also allow them to compare their performance with other countries from the same or similar regions, and enable them to identify and benefit from the successful experiences of others.
General methodology
In view of the correlation between knowledge and sustainable development outlined above, the GKI intends to measure the status of knowledge in various countries of the world, as this may represent a critical base for development choices and pathways.
Due to the multidimensional nature of knowledge, a composite index was constructed consisting of six sectoral sub-indices. Composite indices allow for a single value that gives a fuller picture of the phenomenon being measured, especially if this phenomenon is multidimensional as in this case. Composite measurements also better reflect possible connections between different dimensions and their internal interactions, and allow for standard comparisons between countries.
The structure of the GKI covers the most important dimensions of development. The sectoral indices that form the pillars of the GKI are:
-Pre-University Education; -Technical Vocational Education and Training (TVET); -Higher Education; -Research, Development and Innovation (RDI); -Information and Communications Technology (ICT); -Economy.
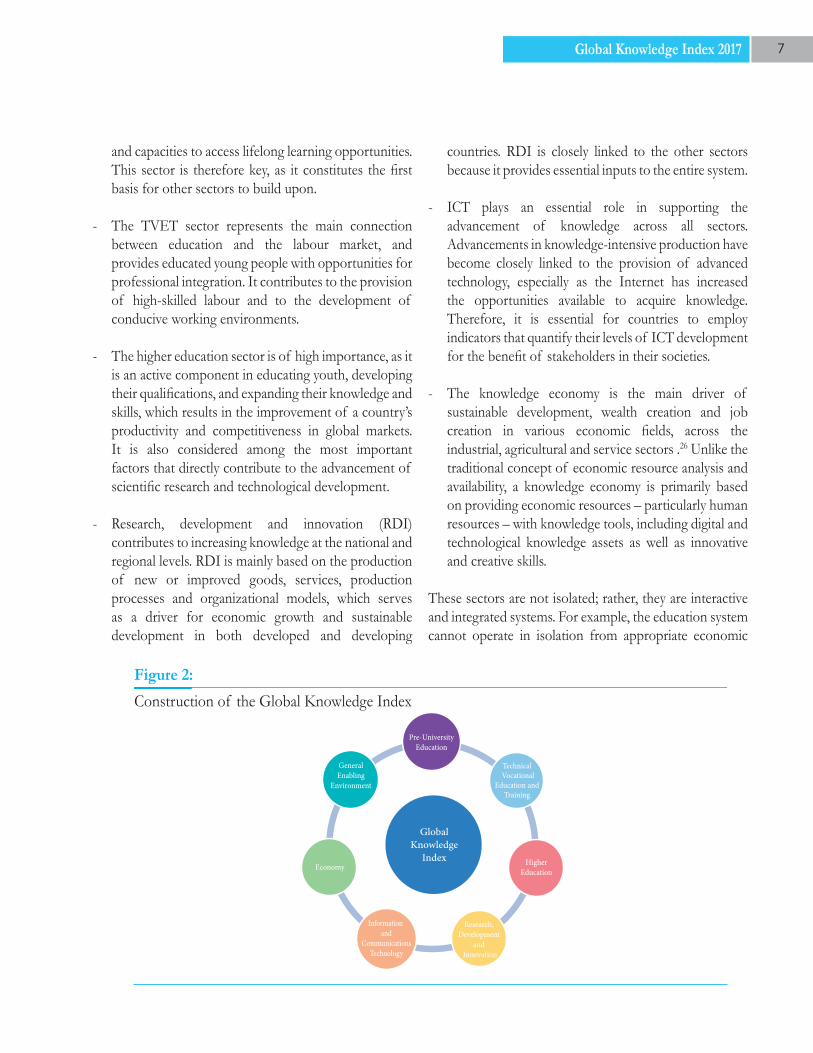
A seventh pillar was added to support the sectoral indices, as these sectors do not operate in isolation from their surroundings, but rather in a space governed by a range of contextual factors - political, socio-economic, health-related and environmental (Figure 2).
Below is an overview of how these sectors are closely linked to knowledge and thereby form its constituent components; this will be analysed further in the following sections of the report:
- The pre-university education sector plays a central role in building the knowledge capital, that represents the first input in preparing young people to acquire and produce knowledge. Pre-university education equips youth with scientific knowledge as well as creative skills
Figure 1:
The Knowledge Index: Support for Development Policies
7Global Knowledge Index 2017
and capacities to access lifelong learning opportunities. This sector is therefore key, as it constitutes the first basis for other sectors to build upon.
- The TVET sector represents the main connection between education and the labour market, and provides educated young people with opportunities for professional integration. It contributes to the provision of high-skilled labour and to the development of conducive working environments.
- The higher education sector is of high importance, as it is an active component in educating youth, developing their qualifications, and expanding their knowledge and skills, which results in the improvement of a country’s productivity and competitiveness in global markets. It is also considered among the most important factors that directly contribute to the advancement of scientific research and technological development.
- Research, development and innovation (RDI) contributes to increasing knowledge at the national and regional levels. RDI is mainly based on the production of new or improved goods, services, production processes and organizational models, which serves as a driver for economic growth and sustainable development in both developed and developing
countries. RDI is closely linked to the other sectors because it provides essential inputs to the entire system.
- ICT plays an essential role in supporting the advancement of knowledge across all sectors. Advancements in knowledge-intensive production have become closely linked to the provision of advanced technology, especially as the Internet has increased the opportunities available to acquire knowledge. Therefore, it is essential for countries to employ indicators that quantify their levels of ICT development for the benefit of stakeholders in their societies.
- The knowledge economy is the main driver of sustainable development, wealth creation and job creation in various economic fields, across the industrial, agricultural and service sectors .26 Unlike the traditional concept of economic resource analysis and availability, a knowledge economy is primarily based on providing economic resources – particularly human resources – with knowledge tools, including digital and technological knowledge assets as well as innovative and creative skills.
These sectors are not isolated; rather, they are interactive and integrated systems. For example, the education system cannot operate in isolation from appropriate economic
8 Global Knowledge Index 2017
conditions, or without due consideration to developments in the field of ICT. The same is true for the RDI sector, which is organically and functionally linked to the higher education sector and directly interacts with the economic system, etc. Therefore, we find that many variables or sub-pillars under the indices of the education sectors can directly or indirectly affect the production process and the use of production elements in a given economy. This is also true for ICT indicators that overlap horizontally and vertically with all other sectors. Higher education output variables are essential for the performance of the RDI sector, which in turn directly contributes to determining the level of knowledge in the economy, the level of development in the production process and the process of utilizing production elements. Accordingly, the importance of the variables chosen should not be viewed only from the perspective of their relationship to their respective sector, but also from that of their interaction with the other variables of other sectoral indices.
The significance of this structure is that in addition to allowing the construction of a comprehensive index that reflects the status of a country and its ranking vis-à-vis other countries (comparison of countries), it offers deeper insight into the specific conditions of each sector and a comparison of their performances (comparison of sectors in the same country).27 This goes beyond providing an ‘average position’ in order to allow a deep understanding of each system and its role in supporting or impeding progress.28
The complementary nature of the variables does not mean that some replace others, but it does call for ‘minimum critical thresholds’ and an ‘irreversibility line’ approach - a methodology that the GKI applies. This involves setting the minimum levels required for a positive interaction and integration between sectors. An example of the possible overlaps and integrative effects of sectors is the connection between ‘health capital’ and ‘social capital’, as key components of human welfare. Human welfare cannot be achieved without a minimum level of both components (which means that the absence of this minimum level in one is an obstacle to welfare, even if the other element reaches the maximum value).29 This is
also true of the relationship between social capital and human capital. A rise in social capital that coincides with a decline in human capital can increase the risk of instability and economic and social decline through conflict and division. This highlights the importance of the optimal distribution of the various elements affecting knowledge performance, which justifies assigning equal weights to the different sectors that constitute the Index. Knowledge performance is not the simple sum of the performance of each sector but rather reflects how the sectors contribute to each other to achieve the highest level of knowledge effectiveness. The performance of each sector is thus interdependent.
Therefore, the structure of the GKI reflects the fact that knowledge has many dimensions that can be seen in all areas of human life, reflected in key components that relate to vital sectors closely linked to sustainable development. Hence, it is assumed that the more these sectors interact with each other and are integrated in a given country, the more the level of knowledge in that country increases, rendering it more capable of achieving sustainable human development.
A key challenge facing the formulation of a GKI is creating an index that combines different development areas yet is flexible enough to be adapted for use in countries with varying levels of development. In addition, there is a need to produce reliable data that can contribute to the growth of the global knowledge base. Perhaps the biggest challenge is to achieve the difficult balance of being ‘brief yet comprehensive’; that is to say, to build indices that offer a focused view of vital knowledge - development conditions, but comprise sufficient essential elements to avoid a misleading simplification of an already complex reality. This means that variables were carefully selected so that sectoral indices have the necessary and sufficient number of variables to support policymakers.
As for the principles that led the development of the index, this work is intended to complement global knowledge, leveraging previous work and following methodological approaches that have proven scientific value. Therefore, the research team reviewed previous work in the field
9Global Knowledge Index 2017
of building composite indices while maintaining the participatory approach of the Knowledge Project, which relies on the collective effort of a central team, as well as regular consultations with external partners from regional and international organizations in disciplines related to the pillars of the index. In all stages of index construction, careful consideration was given to ensure systematic rigour by adhering to a set of methodological and technical measures that include the following:
- Observing standard criteria in the literature on scientific index building, which can be classified into three categories: representation criteria (validity, sensibility and reproducibility); procedural criteria (measurability, availability and ethicality); and decision-assisting criteria (transparency, interpretability, links to specific objectives and links to factors that can be modified by a decision).30
- Selecting necessary data from credible international data sets and/or reports, fully verifying all data and ensuring that sources are accurate and hold sufficient scientific integrity.
- Subjecting all selected data to a rigorous set of statistical analyses to ensure their internal consistency and interrelations, verify the consistency and sensitivity of variables and the distribution of relative weights, and address unavailable and deviant values.
- Presenting the developed indices to a group of external referees for their discussion and review to ensure that they meet the required conditions.
As for data publication dates, it was decided to use data published no earlier than 2007 to allow access to as much data as possible for the calculation of indices. This range may need to be reduced in subsequent releases.
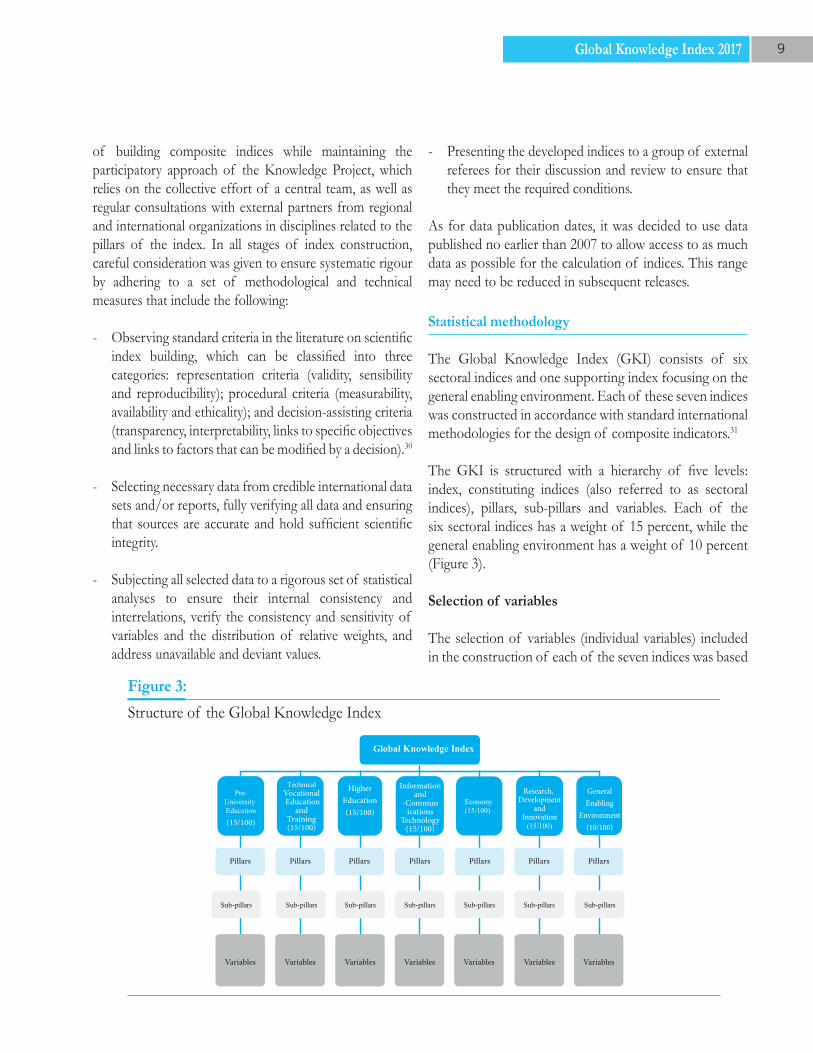
Statistical methodology
The Global Knowledge Index (GKI) consists of six sectoral indices and one supporting index focusing on the general enabling environment. Each of these seven indices was constructed in accordance with standard international methodologies for the design of composite indicators.31
The GKI is structured with a hierarchy of five levels: index, constituting indices (also referred to as sectoral indices), pillars, sub-pillars and variables. Each of the six sectoral indices has a weight of 15 percent, while the general enabling environment has a weight of 10 percent (Figure 3).
Selection of variables
The selection of variables (individual variables) included in the construction of each of the seven indices was based
10 Global Knowledge Index 2017
on a well-defined scientific methodology drawn from an extensive review of relevant local and international literature, as well as the experiences and concepts of international organizations and agencies. It also relied on an intensive consultation process that engaged experts -from different countries, including Canada, Egypt, Jordan, the UAE, the United Kingdom and the United States - each of them specialized in fields related to the sectors of the GKI. Experts expressed their agreement, rejection or proposed additions or amendments to a selected list of variables and aggregations. Based on their feedback, and that of the core team who prepared the report, a final list of variables was produced.
Principal components analysis was used to confirm the consistency of the selected variables and the structure of their classification into the various sub-indices, further supporting the consistency of the broader conceptual context across the variables and their classification in the sub groups - for which the explained variance ratio in most cases exceeded 50 percent.32
The results of the in-depth correlation analysis and Cronbach’s Alpha coefficient (exceeding 0.70 in most cases) confirmed the validity of the selection and classification of the variables. Furthermore, the correlation matrix for normalized variables was analysed to ensure that they followed the same direction as the composite index, confirming the need to include variables with high correlation coefficients (above 0.9) with other variables.
Data collection
The 133 variables employed in the 2017 GKI were obtained from sources including the United Nations Educational, Scientific and Cultural Organization (UNESCO); the World Bank; the International Telecommunication Union (ITU); the World Economic Forum (WEF); the International Monetary Fund (IMF); the Organisation for Economic Co-operation and Development (OECD); the International Labour Organization (ILO) and other UN and international agencies. The team reviewed the data multiple times to ensure no errors had occurred during data entry; consequently, data was processed on the
assumption that it was error-free. In the cases where those variables were linked to other size-dependent variables – such as population or GDP – results were recalculated after adjusting for the effect of the size. Variables included are in the form of hard data, composite indicators and survey questions/responses.
The most recent data for each variable within the period 2007–2017 was used, with very few exceptions in which data for 2006 were used, because the index is incapable of providing estimates or values for missing figures at this stage.
As a prerequisite, data employed in the construction of the composite indices have met certain statistical criteria. For example, each country was required to have at least 50 percent of the figures for variables in each sectoral index for it to be included in the general index (GKI). The team had to ensure these criteria were met before calculating the composite index. The methods used to identify and treat outliers, severe skewness and severe kurtosis are outlined below.
Data treatment
Skewness and kurtosis
A variable was considered to have severe skewness if its absolute skewness coefficient was above 2.25, while an absolute kurtosis coefficient above 3.5 indicated that the variable had severe kurtosis.33 Conditions were relaxed due to the small sample size (131 countries), but those variables with severe skewness and/or severe kurtosis required statistical treatment before they could be employed. Variables with one to five outliers were winsorized, whereby those values considered outliers were assigned the next highest value until the skewness and kurtosis were brought into acceptable ranges.
However, five variables with more than five outliers required additional calculation and were treated as follows: logarithm transformation was used to treat three variables: values and shares of creative goods exports (percentage of total trade); international Internet bandwidth per Internet
11Global Knowledge Index 2017
user (Kbit/s); and SJR ranking of the best scientific journal in the country. Adding factor f and log transformation were used to treat foreign direct investment, net inflows (percentage of GDP)34; and the square root method was applied to ICT/PCT patents, million.
Outliers
The value of a variable was considered an outlier if its instance fell outside the range of the specific data fence defined as follows:
Lower bound = first quartile – (1.5 x interquartile range)
Upper bound = third quartile + (1.5 x interquartile range)
Outliers were treated by replacing each outlier with the second highest value in the case of high values, or the second lowest value in the case of low values.
Normalization
The rescaling or ‘maximum–minimum’ method was used for normalization. The values of variables were normalized into the 0-100 range, in which higher values indicated better results. The normalization criterion depends on whether the variable is good (has a positive relation with the overall Index) or bad (has a negative relation with the overall Index).
The good variables were normalised using the following formula:
In the case of bad variables (i.e. those with an inversely correlated relation) the formula was adjusted as follows:
For survey data or composite indices, the original series’ range of values was retained in the form of minimum
and maximum values; for instance, in the case of the 1-7 range for the World Economic Forum Executive Opinion Survey variables.
Index weighting
It should be noted that weighting across the index components (indices, pillars and sub-pillars) was not unified, and varied according to the nature of the components and their relative importance. Weightings identified for the seven constituent indices range from equal weighting and budget allocation to factor analysis. Equal weights were used in the absence of any clear evidence of a diversity of significance among variables, as well as in the absence of sound and complete information concerning the existence of causal relationships, or where a lack of consensus exists on a classical method for estimating weights.
The budget allocation method was also used for weighting. A group of specialists and experienced experts were invited to attend a workshop for each of the knowledge sectors. Each expert was given a budget consisting of 100 points to award to the variables. If the variable was believed to have greater relative importance, it was allocated a greater number of points. Subsequently, the weights were calculated according to the average of the total points allocated to each variable.35
The weights were also assessed using factor analysis, which is based on aggregating the linked sub-indicators to form a single factor containing as much information as possible that is shared between these linked indicators. The weights produced by using both the budget allocation and factor analysis methods were consistent with each other and with the initial weights estimates, based on the intellectual and conceptual framework.
Index calculation
The 2017 GKI was calculated for 131 countries in this first edition, using the most recent and best available data to calculate the variables for each country, with 2007 as a cut-off year and 2006 being exceptionally
12 Global Knowledge Index 2017
used for specific countries that required additional data to qualify for inclusion in the Index. The values of the composite sub-index were calculated by applying a series of successive aggregations starting with the (more detailed) variables and ending with the production of the index.
Owing to the lack of availability of data covering all the components for each country, and in view of the need to maintain an adequate level of accuracy, the composite index was calculated in a bottom-up pattern, where the upper level index is calculated only where at least two thirds of its components are available. This applies to all knowledge sub-indices and for all countries. In cases where data for a variable was not available for at least half of the countries, this variable was excluded from the calculation of the overall composite indicators (i.e. excluded from the index structure).
The arithmetic aggregation formula was used to calculate all composite indicators of the Index. The composite indicator (CI) is calculated by aggregating its sub-components (SIj ) as follows:
CI is the proposed composite indicator to be computed; wj is the relative weight of the sub-component SI; and n is the number of sub-components aggregated to form the composite indicator.
Index structure
Pre-University Education Index
Education is a key sector in promoting knowledge-based development. Its role today is not limited to providing students with basic skills such as literacy and mathematics, or readying them to pursue a certain profession. Education seeks to prepare young people for life, actively contributing to lifelong self-development and the pursuit of positive social and cultural change.
Education is also essential to the protection of human rights, as it provides the basic foundations for ensuring freedom, economic independence and participation in social and political activities. Education is a ‘public good’, with benefits extending far beyond economic progress and national development.36 Hence it is considered by many to be an investment of guaranteed return:
“There is no more powerful transformative force than education - to promote human rights and dignity, to eradicate poverty and deepen sustainability, to build a better future for all, founded on equal rights and social justice, respect for cultural diversity, and international solidarity and shared responsibility, all of which are fundamental aspects of our common humanity”.37
The past decade has witnessed increasing focus on the quality of education systems around the world, rather than solely on their delivery and accessibility. Today, it is essential to consider the appropriateness of the education being provided and to verify learning outcomes among children, adolescents and adults. Monitoring and evaluation are essential for decision makers to eradicate the weaknesses and accentuate the strengths of a given education system. The Incheon Declaration (2015) was clear in this respect, linking good education with enhanced evaluation and established mechanisms for measuring progress. It called for effective global and regional monitoring of the implementation of the education agenda through comprehensive national systems that support data collection, analysis and reporting at the country level, but which remain within the framework of existing regional entities, mechanisms and strategies.38
Therefore, to be truly able to guide the reform and development of education systems, there is a need for indicators that can capture multiple aspects of education. On one side, they must represent the strengths and shortcomings of education systems; on the other, they must capture those changes in technology and human knowledge that require adaptation of the education system.
13Global Knowledge Index 2017
The methodology employed to construct the Pre-University Education index has three main foundations:
- The intellectual foundation of the Index is the cumulative experience gained from working on the development of previous knowledge reports that have firmly established the intricate relationship between knowledge and sustainable development. This focuses on individuals as efficient and effective human capital which, with the required knowledge, skills and values, can drive development. It also focuses on the provision of enabling environments and incubators that motivate the acquisition of knowledge and help to achieve development.
- The methodological foundation of the Index seeks to avoid measuring the performance of education systems solely through attainment-related variables. Instead it aims to measure performance using a matrix of personal factors, family factors and political, social and economic conditions. This approach is supported by existing experiences in this field (the International Association for the Evaluation of Educational Achievement [IEA], UNESCO and OECD) affirming that any evaluation of outputs that does not consider contributing factors and conditions will necessarily be incomplete.
- The pragmatic foundation of the Index posits that indicators and indices are not an end in themselves. Their significance must not be measured by the quantitative data they present, but rather by the information derived from this data which can guide educational decision-making and help formulate effective and appropriate development policies. This is only possible if the structure of the Index covers several basic components of the educational system.
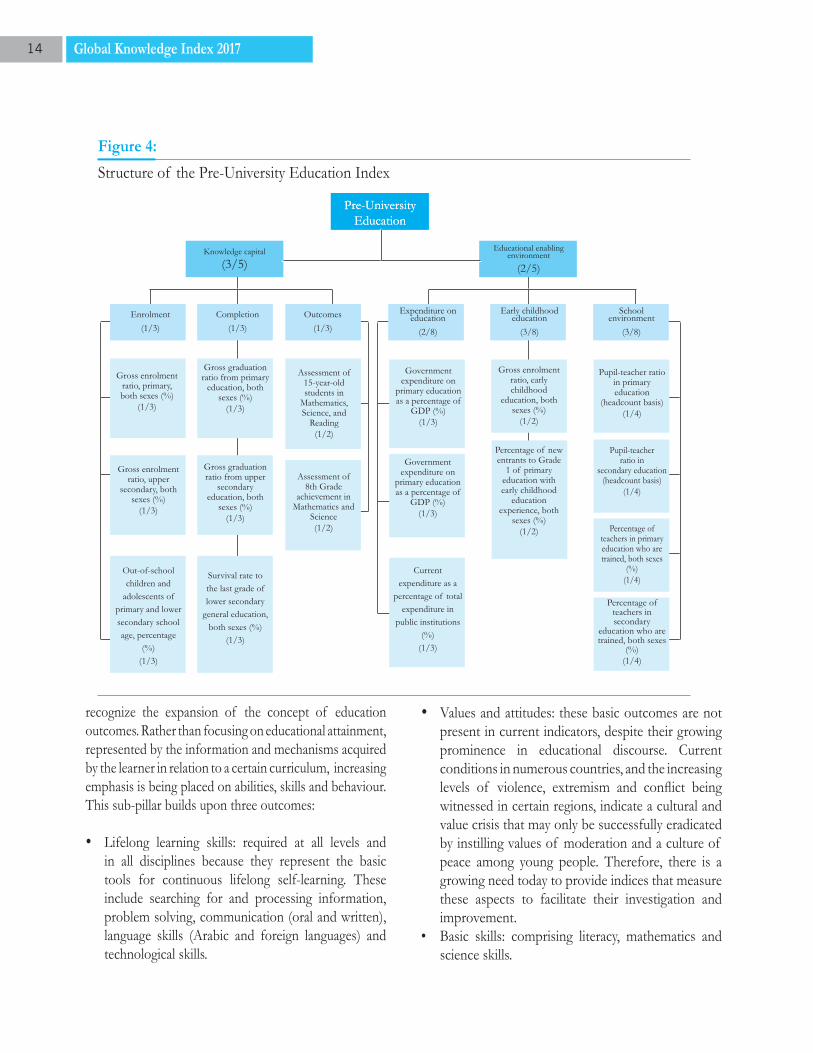
Structure of the Pre-University Education Index
The structure of the Pre-University Education index consists of two pillars - knowledge capital and educational enabling environment (Figure 4) - reflecting the global commitment to ensure inclusive
and equitable quality education and promote lifelong learning opportunities for all.
Knowledge capital
To say that people are the real wealth of nations and that human development ‘expands the choices of individuals’ implies that the ability of any country to achieve progress is dependent on its trained and qualified human capital. The effectiveness of any education system is measured by the learning opportunities it offers and by its quantitative and qualitative outcomes; therefore, the following three sub-pillars have been identified:
- Enrolment: this sub-pillar measures the extent to which children and young people have access to schooling. The availability of inclusive education for all – regardless of class, ethnicity or gender – will form the basis both for eradicating illiteracy and achieving the scientific and cultural advancement of society. This sub-pillar comprises three variables, two of which measure gross enrolment ratios for both sexes in primary and upper secondary levels, while the third measures out-of-school children and adolescents of primary and lower secondary school age.
- Completion: statistics related to the completion (of the required years) of schooling at each level of education represent important data that can inform educational indicators. It is not enough for educational systems to provide universal access to schools; they must have the capacity to attract and retain students until they complete the required levels of education. High enrolment rates at the beginning of each stage of education are most indicative where supported by high completion rates and low dropout rates. For this purpose, three variables were selected, describing gross graduation ratios from primary and upper secondary education, and survival rates to the last grade of lower secondary general education.
- Outcomes: this sub-pillar measures the various skills acquired by students through the education process. Recent literature and global trends in education
14 Global Knowledge Index 2017
recognize the expansion of the concept of education outcomes. Rather than focusing on educational attainment, represented by the information and mechanisms acquired by the learner in relation to a certain curriculum, increasing emphasis is being placed on abilities, skills and behaviour. This sub-pillar builds upon three outcomes:
• Lifelong learning skills: required at all levels and in all disciplines because they represent the basic tools for continuous lifelong self-learning. These include searching for and processing information, problem solving, communication (oral and written), language skills (Arabic and foreign languages) and technological skills.
• Values and attitudes: these basic outcomes are not present in current indicators, despite their growing prominence in educational discourse. Current conditions in numerous countries, and the increasing levels of violence, extremism and conflict being witnessed in certain regions, indicate a cultural and value crisis that may only be successfully eradicated by instilling values of moderation and a culture of peace among young people. Therefore, there is a growing need today to provide indices that measure these aspects to facilitate their investigation and improvement.
• Basic skills: comprising literacy, mathematics and science skills.
15Global Knowledge Index 2017
Unfortunately, insufficient data availability for several of these indicators limited the current model to reliance on data presented by international studies of student attainment. Hence, two basic variables were selected: the overall ranking of countries in the PISA (literacy, mathematics and science skills) and TIMSS (mathematics and science) studies. Despite the recognition that these skills - although important - are no longer sufficient in the current age, they remain essential for acquiring academic and higher skills. In this respect, the UN Secretary-General’s Global Education First initiative states:
“Getting children into school is a first step. Some drop out before receiving the four years of schooling recommended for one to become fully literate and numerate. Many more stay in school but learn very little year after year. We have a learning deficit that poses huge challenges for development. […] When we fail to convey those skills, we fail a generation of children whose prospects in life will depend on them”.39
Educational enabling environment
Empowerment in education entails investing in individuals with the ability to absorb knowledge and contribute to its production. This requires an enabling environment that motivates learning and active participation in the process of knowledge generation. Considering the available data, emphasis was placed on three sub-pillars that reflect the readiness of countries to provide inclusive quality education for all.
- Expenditure on education: education is a process of production that requires suitable conditions and investment in financial and human resources to ensure knowledge production that delivers high returns. This cannot be achieved without sufficient funding and prudent expenditure policies that benefit both students and the education process itself. Given the positive correlation identified in numerous reports and studies between education quality and expenditure per pupil, this sub-pillar utilizes three variables to reflect trends
in education expenditure: government expenditure on 1) primary and 2) secondary education as a percentage of GDP; and 3) current expenditure as a percentage of the total expenditure in public institutions. According to the Incheon Declaration (2015), international and regional benchmarks set the allocation of “at least 4-6% of Gross Domestic Product and/or at least 15-20% of total public expenditure to education”.40
- Early childhood education (ECE): this sub-pillar was identified given the importance of early childhood in building individuals’ personalities, social awareness and preparation for learning in later life, as well as the potential for early childhood education to influence later performance. The Convention on the Rights of the Child emphasizes the importance of early childhood development, declaring the rights of children to develop ‘to the maximum extent possible’ (Article 6).41 Likewise, the Sustainable Development Goals clearly state the need to “ensure that all girls and boys have access to quality early childhood development, care and pre-primary education so that they are ready for primary education” by 2030 (Targets, Goal 4: Education; Agenda for Sustainable Development).42 Two variables were chosen in this context: gross enrolment ratio in early childhood education for both sexes; and percentage of new entrants to grade 1 of primary education with early childhood education experience for both sexes.
- School environment: with an atmosphere that is conducive to education, and both facilities and infrastructure that are designed to serve learning, schools comprise the second main environment in the formation of youth and their social upbringing, after the home and family environment. Schools are responsible for providing young people with the ability to acquire and employ knowledge, as well as to achieve mental, emotional and social development. For schools to succeed they must provide a true ‘enabling’ environment, which requires at least three elements: good teaching in the classroom; an efficient educational framework; and an effective school organization and leadership. However, data limitations prevent coverage
16 Global Knowledge Index 2017
of all these aspects and restrict the sub-pillar to four variables that relate to teacher training - as an important factor for ensuring quality educational processes - and pupil-teacher ratios, which provide insight on the suitability of education and learning conditions.
The ideal model of the index would be more comprehensive in terms of variables included, to provide a more holistic picture of the education system. However, lack of relevant data precludes this approach in the present index. Some of the pillars that might have been included are family upbringing, educational practices, school management, and effective management and governance of the educational system.
Relative weighting
Regarding the relative weight of each pillar, the first (knowledge capital) was allocated (3/5) and the second pillar (educational enabling environment) with (2/5). This reflects the importance of human capital as a key target of development, and the role of the enabling environment as the means through which it may be achieved. The quality and performance of these environments are judged according to their outputs; they are assessed on the basis of their ability to provide the critical knowledge necessary to drive sustainable human development.
Equal weights were assigned to the three sub-pillars of knowledge capital (1/3 each) due to the equal importance of enrolment, completion and outcomes; enrolment is most efficient when students complete all the required years of education (i.e. graduate), and both enrolment and completion are most meaningful upon acquiring skills and capabilities at graduation, thus marking the successful conclusion of this level of education. Similarly, the two sub-pillars of educational enabling environment- i.e. early childhood education and school environment - were given an equal relative weight of (3/8) each, while expenditure on education was assigned a weight of (2/8). This reflects the fact that despite its importance, rising expenditure will have a limited impact on education in the absence of appropriate planning to transform investments into positive outputs from the education process; there are
several examples in this context, wherein countries’ increasing expenditures have failed to translate into improvements in their underdeveloped educational systems.
Technical Vocational Education and Training (TVET) Index
The technical vocational education and training (TVET) sector plays a pivotal role in the education system and provides a means to measure the linkage between education and the labour market. It also allows for assessments of training institutions’ capacities to develop and qualify young educated people and ensure access to professional opportunities.
Various international studies of technical and vocational education and training (conducted by UNESCO-UNEVOC, the European Training Foundation, and the World Bank, etc.) identify strong links between TVET and national economic dynamics, and view TVET as the gateway to developing the workforce, ensuring appropriate conditions for the labour force and production, and providing new opportunities for lifelong learning and training.43
TVET is a field in which various sectors overlap. Public policies on education, labour, economy, knowledge and innovation all contribute to TVET; it has therefore been addressed in numerous international studies examining the role of youth as drivers of social development. Previous Arab Knowledge Reports (2009, 2010/2011 and 2014) and the Arab Knowledge Index in its two versions (2015 and 2016) recognize TVET as a key contributor to - and an integral component of - knowledge.
The Shanghai Consensus, which strongly supports TVET initiatives, sets several strategic priorities for the sector. These mainly focus on developing administrative and educational human resources by improving pedagogical and didactic approaches to TVET; adopting innovative economic concepts such as green economy; promoting sustainable development and modern technology in educational programmes; and offering better opportunities
17Global Knowledge Index 2017
for females and people with special needs.44 These goals are reiterated in UNESCO’s ‘Strategy for TVET (2016-2021)’45 and by Education 2030.46 The Strategy identifies the challenge posed by the high youth unemployment rate - 73 million - which is expected to grow by 40 million each year, necessitating the creation of more than 475 million new jobs over the next decade (2016-2026).47
The benefits of TVET are not limited to improving the lives of individuals; they also affect national and regional economies and societies in varying degrees. TVET assists in improving job opportunities, salaries and career prospects for individuals, which inevitably results in increased productivity and innovation as well as improved organizational culture and national competitiveness.48
18 Global Knowledge Index 2017
Given the importance of this sector to improving social and economic welfare, it is essential that the factors that contribute to its performance are monitored and evaluated. This should take the form of targeted studies and research to support decision making and policy development by governments and stakeholders. It is also important that relevant experience and information produced by local and international stakeholders be shared to assist others seeking to improve performance in the sector.
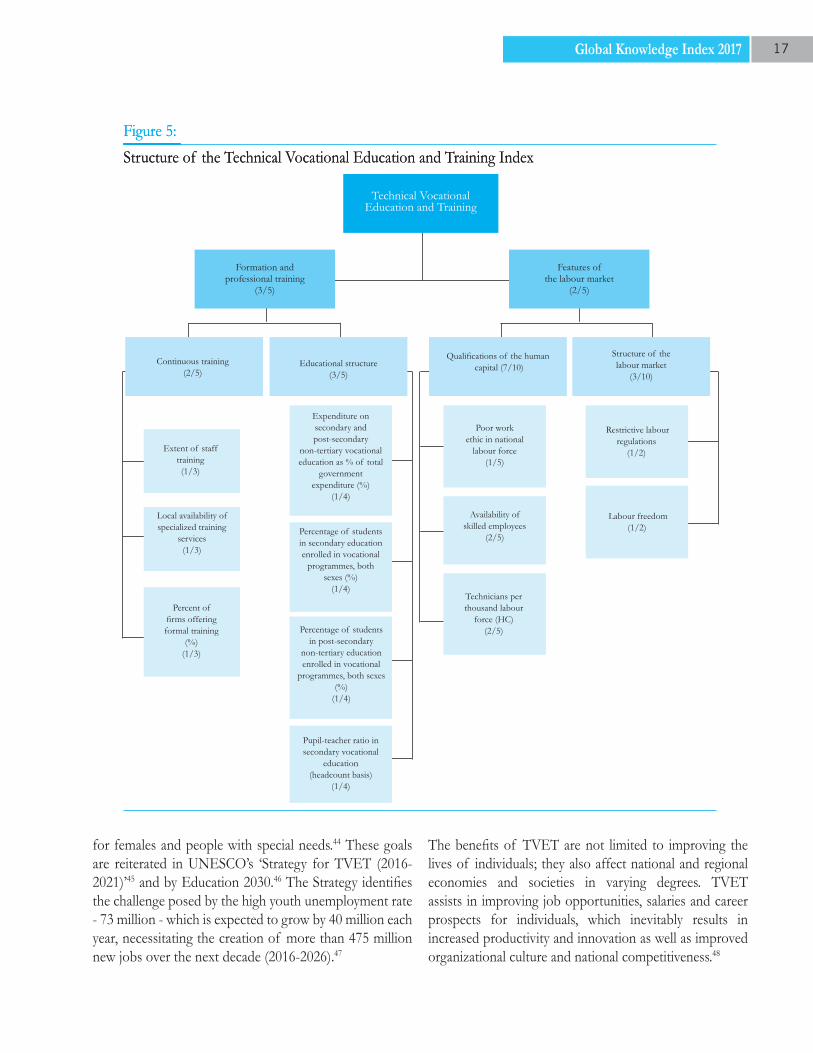
Structure of the TVET Index
Following careful consideration and consultations with project experts and international specialists from a variety of disciplines, the TVET index was based on two main pillars: formation and professional training and features of the labour market (Figure 5).
Formation and professional training
This pillar aims to determine the efficiency of the labour market in providing training services, and identify the responses of companies to the demand for continuous training. It also investigates the adoption of such training as a priority in national economies. It consists of two sub-pillars:
- Continuous training comprises three variables: extent of staff training, availability of specialized training services and percentage of firms offering formal training. This sub-pillar reflects the availability of training services and programmes in the relevant country, and the dynamics of the sector in terms of training opportunities that are appropriate to the labour market and meet the needs of individuals, companies and organizations.
- Educational structure comprises four variables: expenditure on secondary and post-secondary non-tertiary vocational education as a percentage of total government expenditure; percentage of students in secondary education enrolled in vocational programmes; percentage of students in post-secondary non-tertiary education enrolled in vocational programmes; and pupil-teacher ratio in secondary
vocational education. This sub-pillar aims to reflect: the capacity of the sector to attract and retain youth; the relative importance of the sector in governments’ financial resource allocations for development; and education quality in terms of human resources and number of students per class.
Features of the labour market
This pillar aims to chart the general features of the labour market in terms of training, working conditions and labour rights and freedoms in accordance with international standards, laws and regulations. It also seeks to determine the competency of the workforce and the percentage of those with technical and professional skills. This pillar comprises two sub-pillars:
- Qualifications of the human capital comprises three variables: poor work ethic in national labour force; availability of skilled employees; and technicians per thousand labour force. The first variable is a measure of the moral and ethical standards of performance among the national labour force, as well as their ethics in dealing with officials, authorities and commercial counterparts. It also reflects the rigour of auditing and reporting processes and the extent of management accountability to shareholders and directors. The technicians per thousand labour force variable identifies the percentage of the labour force that has the technical knowledge and experience in the fields of engineering, physics, life sciences, social sciences, humanities and/or professional skilfulness to perform their roles.
- Structure of the labour market has two variables: restrictive labour regulations and labour freedom. This sub-pillar reflects the legal framework governing investment in the economy, which heavily influences employment dynamics in the labour market. It considers various aspects of the legal and regulatory framework of the labour market, such as laws governing minimum wages, layoffs and dismissals, as well as restrictive regulations in relation to hiring, working hours and participation rates in the labour force (to indicate availability of employment opportunities in the labour market).
19Global Knowledge Index 2017
Relative weighting
The first pillar (formation and professional training) is assigned a weight of (3/5) against (2/5) for the second pillar (features of the labour market). This is because the variables of the first pillar - especially those under the educational structure sub-pillar - are directly related to the TVET sector and inevitably affect training processes and outcomes. Within this first pillar, the educational structure sub-pillar is assigned a relative weight of (3/5) because it constitutes variables that relate to capacity, qualified workforce and ratio of TVET students to all students. The continuous training sub-pillar is assigned a weight of (2/5) owing to the effect of commercial activities and services on the availability of specialized training and continuous development in general. Within the features of the labour market pillar, the qualifications of the human capital sub-pillar is assigned a weight of (7/10) due to the importance of the availability of specialized skills and competences to companies in the labour market. Finally, the structure of the labour market sub-pillar is assigned a relative weight of (3/10), reflecting the effects of its variables on the legal framework of the TVET sector.
Higher Education Index
The World Bank defines higher education as all “post-secondary education, including both public and private universities, colleges, technical training institutes, and vocational schools”.49 For the purposes of this Index, higher education will be limited to ISCED 6, ISCED 7 and ISCED 8 programmes offered by public and private tertiary education institutions, as per the classification of UNESCO.50
Many countries ascribe significant importance to higher education, as it provides the labour market with qualified and trained human capital, and drives knowledge and innovation.51 As such, higher education is a major foundation of economic competitiveness52 and plays a vital role in achieving economic development.53
The importance of this sector is demonstrated by its designation as one of the key focus areas of the UN 2030
Agenda for Sustainable Development. SDG4 calls for the provision of inclusive and equitable quality education, including tertiary education, as a goal of gender equality and a prerequisite for achieving development and full social participation.54
In the same context, in a speech delivered in 2000, former UN Secretary General Kofi Annan talked of the important role played by universities in our age, stating that “the greatest natural resource any nation possesses […] is the potential of its young to learn, to deepen their knowledge, and to put their skills to proper use”, concluding that “the key to prosperity in the twenty-first century is knowledge and education”.55
Hence, higher education contributes to improving a country’s competitiveness in global markets, raising individual income levels and driving the productive growth of society. This is, however, conditional on the provision of a conducive and productive labour market accommodating human capital with higher skills, and balanced coordination between industrial and social institutions.
The higher education sector has demonstrated its ability to keep pace with developments and adapt at all levels; but it now faces various challenges associated with the acceleration of globalization.56 It is particularly important that stakeholders do not ignore these developments, as this may result in reducing the quality and effectiveness of the sector and a decline in a country’s ability to conduct research and generate knowledge in various fields, thereby threatening a country’s prosperity.
Given the importance of measures to ensure the quality of higher education, the OECD’s ‘Assessment of higher education learning outcomes’ highlights the lack of tools to compare the quality of education and learning in higher education at the international level. It points out that the few available studies focus on national-level comparisons.57
It is worth mentioning that there is a difference between developing a higher education index that examines the status of this sector across various countries, and a ranking which reviews the existing international rankings
20 Global Knowledge Index 2017
of universities and higher education institutions. A study published by UNESCO in 2013 warned that international rankings of universities use the research outputs of well-reputed institutions as a standard for measuring other universities, which represents a key limitation to the usefulness and relevance of such systems. Furthermore, these rankings do not evaluate the success of a higher education system considering the broader enabling environment in the reference country.58 Indices, instead, aim to analyse performance, and identify areas for improvement and corrective intervention. An index can also be a useful reference tool that allows decision makers and stakeholders to evaluate the progress of a certain education system over time.
Structure of the Higher Education Index
In developing the Higher Education index, the core team reviewed international indices relevant to higher education and knowledge, such as the World Bank Knowledge Economy Index (KEI),59 the Global Competitiveness Index (GCI)60 and the Global Innovation Index (GII).61 The team also reviewed relevant studies that contributed to the selection of the components of the index, including a UNESCO study published in 2011 on the development of an index for higher education and the University of Melbourne’s rankings of national higher education systems in fifty countries (Universitas 21).62 Based on the above, the Higher Education index comprises two main pillars: inputs and outputs and quality (Figure 6).
Higher education inputs
This pillar comprises three sub-pillars that reflect, to the best extent possible, the inputs of higher education in terms of expenditure, capacity and availability of human resources.
- Expenditure: this consists of two variables: government expenditure on tertiary education as a percentage of GDP; and government expenditure per tertiary student. These two variables show the overall percentage of GDP allocated by the government for higher education and average government expenditure per student.
Sufficient government funding reflects on the quality of higher education institutions in terms of both infrastructure and human resources. It also contributes to improving the quality of education and the extent to which it embraces technological developments, thereby increasing knowledge generation and driving the country’s economic growth.
- Enrolment: this encompasses three variables that reflect the percentages of students in higher education enrolled at ISCED levels 6, 7 and 8, and hence the capacity, accessibility and attractiveness of the higher education sector in each country.
- Human resources: this comprises two variables: pupil–teacher ratio in higher education and percentage of researchers in higher education institutions. A high pupil–teacher ratio indicates that less time is allocated for student–teacher interaction, which could result in less exchanges of ideas and knowledge. This often affects students’ academic performance and scholarly development in the long term. The second variable shows the percentage of researchers in the institution whose time is fully devoted to research, development and knowledge production, which affects research and knowledge generation more generally.
Higher education outputs and quality
This pillar comprises four sub-pillars. The first two relate to the direct outputs of higher education, namely percentages of graduates and employment after graduation. As such, they reflect the ability of the higher education sector to provide society with graduates who are able to satisfy the requirements of development. The other two sub-pillars relate to the quality of the higher education system in terms of the quality of universities and the competency of students.
- Graduation: this is measured through three variables: percentage of graduates from ISCED 6 programmes; percentage of graduates from ISCED 7 programmes; and percentage of graduates from ISCED 8 programmes. This allows for comparisons
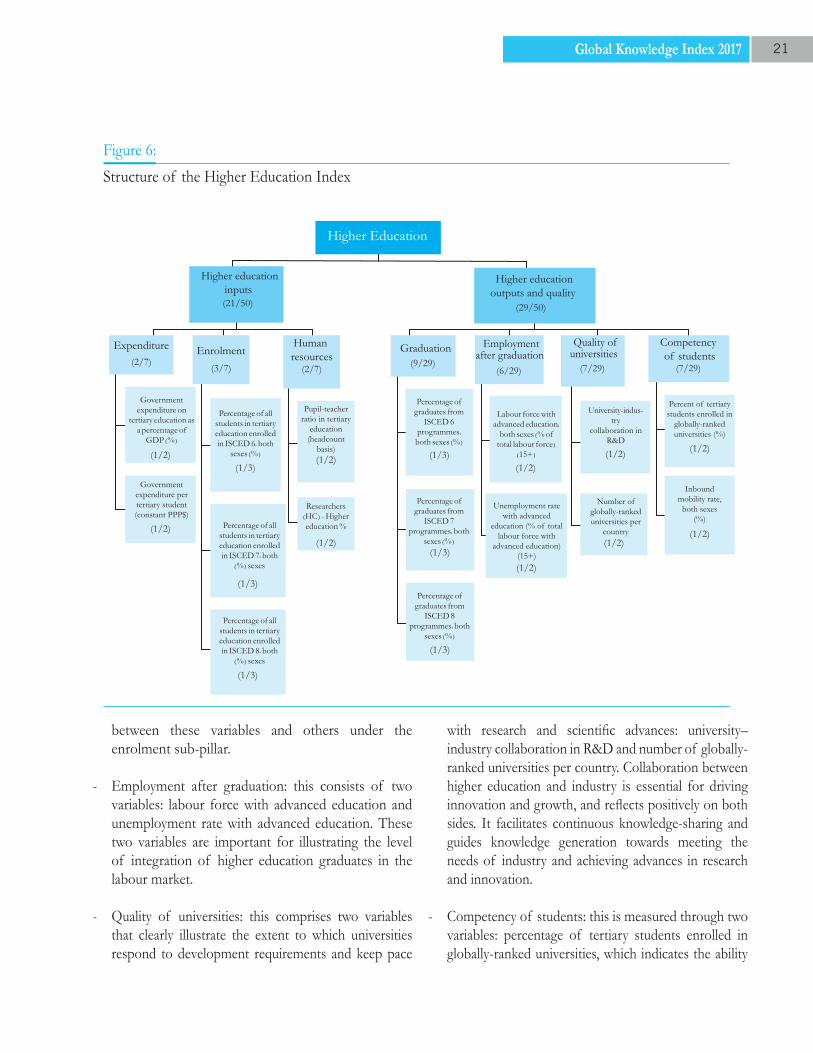
21Global Knowledge Index 2017
between these variables and others under the enrolment sub-pillar.
- Employment after graduation: this consists of two variables: labour force with advanced education and unemployment rate with advanced education. These two variables are important for illustrating the level of integration of higher education graduates in the labour market.
- Quality of universities: this comprises two variables that clearly illustrate the extent to which universities respond to development requirements and keep pace
with research and scientific advances: university–industry collaboration in R&D and number of globally-ranked universities per country. Collaboration between higher education and industry is essential for driving innovation and growth, and reflects positively on both sides. It facilitates continuous knowledge-sharing and guides knowledge generation towards meeting the needs of industry and achieving advances in research and innovation.
- Competency of students: this is measured through two variables: percentage of tertiary students enrolled in globally-ranked universities, which indicates the ability
22 Global Knowledge Index 2017
of students to compete and gain admission to globally-ranked universities; and inbound mobility rate, which also reflects the quality of the national higher education sector in terms of its ability to attract students from abroad.
Relative weighting
Weights were assigned within the Higher Education index based on two criteria. First, more weight was assigned to the outputs pillar in accordance with the recommendations of higher education indices, such as the University of Melbourne’s rankings.63 Second, equal weights were assigned to variables where there is a lack of justification for assigning different weights within each sub-pillar. As the inputs pillar comprised seven variables and the outputs pillar comprised nine variables, with a total of 16 variables, the team decided to assign each variable a weight of (6/100). This resulted in the inputs and outputs pillars having relative weights of (42/100) and (54/100) respectively, with a total of (96/100), which led to the remaining (4/100) weight being assigned to the outputs pillar, thereby increasing its relative weight to (58/100).
Following a closer examination of the variables under the outputs and quality pillar, the team decided to increase the relative weights of the four variables that measure the competency of students and quality of universities. These variables are: percent of tertiary students enrolled in globally-ranked universities; inbound mobility rate; university-industry collaboration in R&D; and number of globally-ranked universities per country. Weights are presented in Figure 6.
Research, Development and Innovation (RDI) Index
The transition of countries to knowledge societies and economies is necessary to achieve the goals of sustainable economic and social development and the well-being of citizens. Research, development and innovation (RDI) are important determinants of a country’s success in building its knowledge economy and society. Global indices show that countries of high rank in terms of research and innovation - such as Denmark, Finland,
Germany, Ireland, the Netherlands, Singapore, Sweden, Switzerland, the United Kingdom and the United States - have demonstrated excellent performance in economic and social development indicators. 46As scientific research contributes mainly to increasing knowledge at the national and regional levels, and since innovation is based on the production of new or improved goods, services, production processes and organizational and marketing models, scientific research and innovation serve as drivers for economic growth and sustainable development in both developed and developing countries. Although an RDI system needs to be developed in order to support the UN sustainable development goals in general, SDG 9 specifically emphasizes the need to “build resilient infrastructure, promote inclusive and sustainable industrialization and foster innovation”.65
The RDI Index is based on the proposition that to formulate effective scientific research and innovation policies and keep pace with developments in the knowledge age, decision makers need reliable indicators to measure their comparative progress in building the knowledge economy, and evaluate their options for the future. UNESCO’s analytical indicators for research and development, as well as those for science prepared by the OECD and the World Bank are among the most important global and regional sources for evaluating the progress of countries towards knowledge economies and societies.66 Taking all the above into consideration, the RDI methodology is based on diverse indicators and measurements that reflect the modernity of society and its knowledge capabilities through an integrated R&D system, high added value knowledge-intensive industries, creative products, skilled human capital and appropriate infrastructure.
Structure of the RDI Index
The RDI Index consists of three pillars: research and development; innovation in production; and social innovation. Each pillar is divided into two sub-pillars: inputs and outputs, each being an indicator on its own, with a specific nature reflected through its respective variables, as shown in Figure 7.
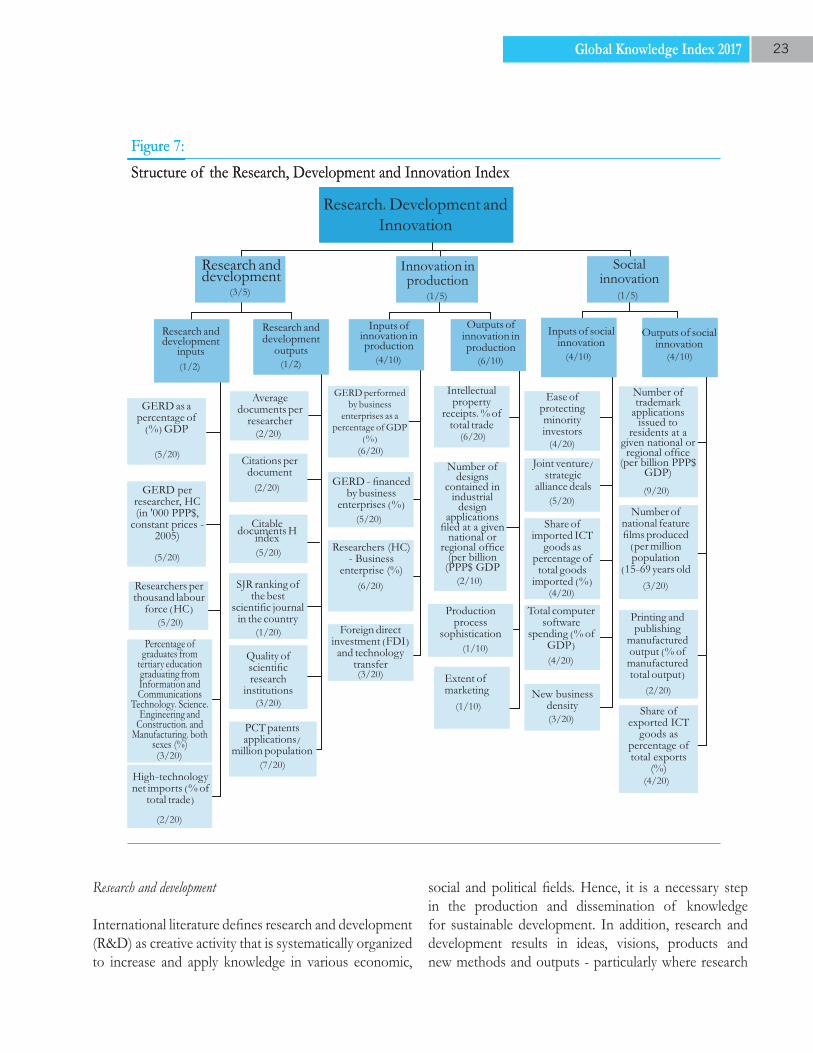
23Global Knowledge Index 2017
Research and development
International literature defines research and development (R&D) as creative activity that is systematically organized to increase and apply knowledge in various economic,
social and political fields. Hence, it is a necessary step in the production and dissemination of knowledge for sustainable development. In addition, research and development results in ideas, visions, products and new methods and outputs - particularly where research
Figure 7:
Structure of the Research, Development and Innovation Index
GERD as a percentage of
(%) GDP
Research, Development andInnovation
Research anddevelopment
Innovation inproduction
Socialinnovation
Research and development
inputs
Research and development
outputs
Outputs of innovation in
production
Inputs of innovation in
production Inputs of social
innovationOutputs of social
innovation
GERD per researcher, HC (in '000 PPP$,
constant prices - 2005)
Average documents per
researcher
Researchers per thousand labour
force (HC)
GERD performed by business
enterprises as a percentage of GDP
(%)
Researchers (HC) - Business
enterprise (%)
Foreign direct investment (FDI)
and technologytransfer
Citations per document
Citable documents H
index
SJR ranking of the best
scientific journal in the country
Quality of scientific research
institutions
PCT patents applications/
million population
Percentage of graduates from
tertiary education graduating from Information and Communications
Technology, Science, Engineering and
Construction, and Manufacturing, both
sexes (%)
High-technology net imports (% of
total trade)
GERD - financed by business
enterprises (%)
Production process
sophistication
Extent of marketing
Number of designs
contained in industrial
design applications
filed at a given national or
regional office (per billion(PPP$ GDP
Intellectual property
receipts, % oftotal trade
(3/5) (1/5) (1/5)
(1/2) (1/2) (4/10) (6/10) (4/10) (4/10)
(2/20)
(2/20)
(5/20)
(1/20)
(3/20)
(7/20)
(3/20)
(6/20)
(5/20)
(2/10)
(1/10)
(1/10)
Ease of protecting
minorityinvestors
Joint venture/ strategic
alliance deals
Share of imported ICT
goods as percentage of total goods
imported (%)
Total computer software
spending (% of GDP)
New business density(3/20)
(4/20)
(4/20)
(5/20)
(4/20)
Number of trademark
applications issued to
residents at a given national or regional office
(per billion PPP$ GDP)
Number of national feature films produced
(per million population
(15-69 years old
Printing and publishing
manufactured output (% of manufactured total output)
Share of exported ICT
goods as percentage of total exports
(%)
(9/20)
(3/20)
(2/20)
(4/20)
(6/20)(6/20)
(5/20)
(5/20)
(5/20)
(3/20)
(2/20)
24 Global Knowledge Index 2017
efforts succeed in bringing about development that can be regarded as creative or innovative.67
- R&D inputs: research and development inputs comprise three categories of variables: the size of a state’s expenditure on R&D activity; the human capital undertaking research activity; and the technology used in research production. Of course, R&D in a country is affected by both its expenditure as a percentage of GDP and its expenditure per researcher (the first and second variables). This expenditure is allocated for the payment of compensation or salaries for researchers, the development of research infrastructure and the purchase of equipment, devices and materials. Expenditure is calculated as a percentage of GDP or per researcher to allow comparisons between countries. Since R&D requires human capital with a high level of learning, individual and collective skills and scientific ability, one variable is specific to the number of researchers per million inhabitants. R&D inputs are also measured by the percentage of graduates of scientific and engineering disciplines among total graduates from higher education. The last variable under R&D inputs is technology transfer, which is a prerequisite in providing appropriate infrastructure including laboratories and research centres.
- R&D outputs: variables that determine the quality of the outputs of scientific research are identified as being related to scientific publishing, the competency of research institutions and the number of patents per million inhabitants. Scientific publishing variables included are: average documents per researcher; citations per document; citable documents H index (which is calculated by dividing the number of scientific citations in the years following the publication of scientific research by the number of research articles published by the state in the same year); and the SJR ranking of the best scientific journal in the country. To complete the assessment of R&D outputs, two variables are added: PCT patent applications per million inhabitants and quality of scientific research institutions.
Innovation in production
The OECD’s Oslo Manual identifies two forms of innovation in production: technological and non-technological. In cooperation with UNESCO, the OECD has designed a survey that captures the variables used to assess innovation in production in different countries.68 The European Union is also currently undertaking similar efforts.
Innovative activities can be assessed through three interconnected perspectives. Innovation is partly generated through the full cycle of scientific research, which begins with exploring natural phenomena and conducting basic research, then moves to applied research and experimental models, and ends with the production of new or innovative goods and services. Additionally, there is innovation that is generated by businesses and units of production, based on the development of new or improved goods and services, the development of a marketing system, or modern and sophisticated organizational models of management.
- Inputs of innovation in production: this sub-pillar consists of four variables: GERD (gross expenditure on research and development) performed by business enterprises as a percentage of GDP; GERD financed by business enterprises; percentage of researchers in business enterprise; and total volume of foreign direct investment and technology transfer. These inputs reflect the economy’s efforts to expand into high value added knowledge-intensive industries, and measure the availability of research opportunities in production enterprises.
- Outputs of innovation in production: this consists of four variables where returns on intellectual property rights, i.e. intellectual property receipts (percentage of total trade), is a variable that represents the returns for companies that have registered technological or non-technological patent applications or other forms of intellectual property. Innovation and development in production processes (technological innovation) is measured using two variables. The first relates to the design of new industrial products, number of
25Global Knowledge Index 2017
designs contained in industrial design applications filed at a given national or regional office, and the second measures the complexity and technological development of production processes, production process sophistication. The last variable, extent of marketing, measures the success of marketing policies of industrial companies in differentiating their products from those of their peers, which will enable them to enlarge their market share or enter new markets.
Social innovation
Social innovation includes a specific class of creative products that are based on ‘creative’ human capital, architecture, design, interactive computer software, cinema and television production, music, publishing, cultural and other performing arts as well as intangible assets such as trademarks. Creative industries produce symbolic goods and services such as ideas, experiences and images.69 Societal innovation does not necessarily occur in research institutions or industries that produce goods and services; it represents a quality of innovation that requires a modern community setting, a knowledge workforce with multiple skills and a supportive enabling environment. For this sub-pillar to function, it is necessary to have a comprehensive set of variables that reflect the capacity and readiness of a society to develop its R&D system and achieve innovation across multiple societal activities.
- Inputs of social innovation: this sub-pillar comprises variables that relate to the business sector and the economy. These are: ease of protecting minority investors by applying policies and rules that are more flexible and transparent and ensure the rights of shareholders and investors; joint ventures/ strategic alliance deals among national companies and between them and foreign companies, because innovative activities require cooperation between research institutions, universities and other civil society institutions; share of imported ICT goods as a percentage of total goods imported; total computer software spending as a percentage of GDP, because computer software represents the intangible assets that are creative goods; and new business density -
the number of new businesses registered annually per thousand inhabitants in the 15-64 year age group.
- Outputs of social innovation: this sub-pillar comprises four variables. The first is number of trademark applications issued at a given national or regional office, since a trademark represents the differentiation of a new product from other products (goods or services) of the same category in markets as well as its innovative advantages. Statistical analysis shows a high correlation between the number of trademarks and other innovation indicators. Other variables include the number of national feature films produced per million inhabitants; printing and publishing manufactured output as a percentage of manufactured total output; and share of exported ICT goods as a percentage of total goods exported. These variables represent innovative outputs based on the concept of creative products from investment in intangible assets.
Relative weighting
Given the centrality of scientific research and development efforts in increasing knowledge stock and developing innovation, the research and development pillar is assigned a weight of (3/5), while the remaining weight is distributed equally between innovation in production and societal innovation, with (1/5) each. This is mainly due to the important role of R&D as a systemic activity that aims to produce and apply knowledge on the one hand, and its contribution to supporting innovation and creativity on the other. Due to the importance of building an advanced scientific research basis or infrastructure as a necessary condition for the success of the R&D sector, its inputs and outputs are assigned equal weights of (1/2) each. Since the outputs of innovation are not necessarily related to specific inputs, they are assigned a relative weight of (3/5), which is higher than that of inputs (2/5). As for variables under these sub-pillars, they are assigned weights as follows:
- R&D inputs: GERD as a percentage of GDP and GERD per researcher are assigned (5/20) each, while researchers per thousand labour force and percentage of graduates from tertiary education
26 Global Knowledge Index 2017
graduating from Information and Communications Technology, Science, Engineering and Construction, and Manufacturing) are assigned (4/20) each, with the remaining (2/20) assigned to high-technology net imports (% of total trade).
- R&D outputs: given the relative importance of patent applications, which represent an essential step for developing new or greatly improved products, processes and methods, the variable PCT patents applications is assigned a weight of (7/20). The citable documents H index is assigned (5/20) as it involves several scientific publishing components, such as publishing in scientific journals, citations of scientific research and level of research achievements. The remaining variables are assigned weights depending on their relative importance and contribution to developing research outputs in the relevant country.
- Inputs of innovation in production: the relative weights of GERD and percentage of researchers in business enterprise vary slightly (ranging from 3/20 to 6/20).
- Outputs of innovation in production: intellectual property receipts is assigned the biggest relative weight (6/10), with number of designs contained in industrial design applications assigned (2/10). The other two variables, production process sophistication and extent of marketing, are assigned equal weights of (1/10) each.
- Inputs of social innovation: joint venture/ strategic alliance deals is assigned the biggest relative weight (5/20) due to the importance of local and international institutional collaboration for innovation. The variables, ease of protecting minority investors; total computer software spending; and share of ICT imported goods, are assigned (4/20) each.
- Outputs of social innovation: number of trademark applications issued to residents has the biggest relative weight of (9/20). The next two variables, printing and publishing manufactured output and share of
exported ICT goods as a percentage of total goods exported, are assigned (4/20) each. Finally, number of national feature films produced per million population is assigned (3/20).
Information and Communications Technology (ICT) Index
Information and communications technology (ICT) has significantly evolved in recent years, producing advances that have been systematically applied across all economic and social fields and brought about a paradigm shift in production and services. ICT has also become an integral aspect of research, innovation and modernization; the efficacy of communication connects manufacturers, service providers and consumers, and allows for advanced information sharing. This has produced greater variety and quality among products, enhanced competitiveness and contributed to innovation, while the Internet offers unprecedented opportunities for compiling, acquiring, sharing and disseminating knowledge.
Digitization has contributed significantly to economic development in many countries, especially where it has been accompanied by organizational change and enhanced labour skills.70 It increases productivity, creates jobs, reduces the cost of transactions and information sharing, improves labour efficiency and offers flexible working conditions. Furthermore, it creates opportunities for businesses and organizations to share models and experiences and offers access to new modes of financing such as crowdfunding, 71 while the use of ICT services by small and micro-enterprises improves growth and livelihoods. The revolution in mobile technology, especially in developing countries, has provided entrepreneurs with significantly improved connectivity across local and international value chains. This has prompted leaders and decision makers to support the expansion of digital infrastructure - particularly broadband Internet services - and ensure its availability to users at all levels with a view to developing countries’ national competitive advantages.
At the social level, ICT offers access to basic services, including financial services, education, healthcare,
27Global Knowledge Index 2017
government transactions and information-sharing through open data initiatives and social media. Efficient communication and increased connectivity have also resulted in significant changes within societies, offering the potential for improved relations between individuals and organizations.72
ICT plays an essential role in supporting the advancement of knowledge across all sectors – including pre-university education, technical vocational education and training, higher education, research, development and innovation – and in facilitating the evolution of knowledge economies. The ICT index is strongly shaped by the outputs of educational processes at all stages, the country’s RDI capabilities, economic and legislative environments, the efficiency of capital and business management, and labour and investment laws. Therefore, it is essential for countries to employ indicators that quantify their levels of ICT development for the benefit of stakeholders in their societies.
Structure of the ICT Index
ICT inputs
Given the importance of the ICT sector and the increasingly significant role it plays in facilitating and enriching the lives of users, driving economic growth and keeping pace with globalization, the primary factor in the evaluation of this sector is the readiness of a country to take full advantage of the benefits ICT provides. To achieve balanced growth in all areas and among all social classes, economies must provide efficient, comprehensive infrastructure that supports knowledge production and associated digital content at affordable prices. In addition, a legal framework is required to govern and protect ICT activities, encourage investment and provide quality assurance.
From a development perspective, these efforts offer added value for those with relatively low incomes living in rural areas with poor infrastructure and limited access to public services compared to urban populations73. They increase opportunities for balanced and sustainable development, and greater cohesion across regions, while also creating
new jobs for people without the need to migrate to densely-populated cities. The inputs pillar consists of two sub-pillars: infrastructure and sector competitiveness.
- Infrastructure: this sub-pillar comprises three variables: percentage of the population covered by a mobile-cellular network, regardless of the quantity of subscriptions or users; international Internet bandwidth per Internet user; and availability of secure Internet servers. These variables indicate the extent to which the state is providing its people with the required means to benefit from basic services and enhance communication between national regions and countries. The International Telecom munication Union (ITU) stresses that:
“A well-developed information and communication network infrastructure and applications, adapted to regional, national and local conditions, easily-accessible and affordable, and making greater use of broadband and other innovative technologies where possible, can accelerate the social and economic progress of countries, and the well-being of all individuals, communities and peoples”.74
- Sector competitiveness: this sub-pillar reflects the extent to which residents can afford high quality ICT services. It therefore reflects ease of Internet access in terms of cost and availability. The constituent variables under this sub-pillar are: ICT Price Basket; IInternet and telephony level of competition; and laws relating to ICTs. They reflect the relative price of ICT services across countries over time, as well as their quality and ease of access.
ICT outputs
The availability of an advanced, integrated ICT infrastructure is a necessary precondition for realizing the benefits of these technologies, but it is not sufficient. Balanced use of these services by individuals, organizations and governments is the third and most vital condition. The
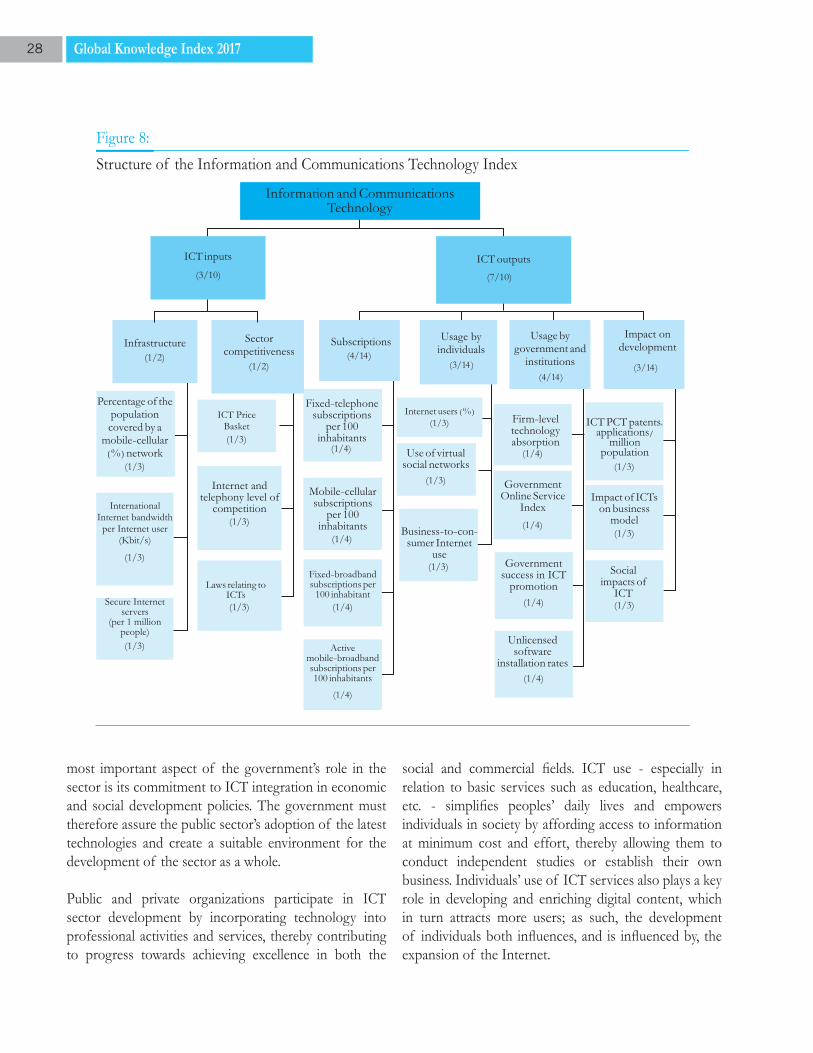
28 Global Knowledge Index 2017
most important aspect of the government’s role in the sector is its commitment to ICT integration in economic and social development policies. The government must therefore assure the public sector’s adoption of the latest technologies and create a suitable environment for the development of the sector as a whole.
Public and private organizations participate in ICT sector development by incorporating technology into professional activities and services, thereby contributing to progress towards achieving excellence in both the
social and commercial fields. ICT use - especially in relation to basic services such as education, healthcare, etc. - simplifies peoples’ daily lives and empowers individuals in society by affording access to information at minimum cost and effort, thereby allowing them to conduct independent studies or establish their own business. Individuals’ use of ICT services also plays a key role in developing and enriching digital content, which in turn attracts more users; as such, the development of individuals both influences, and is influenced by, the expansion of the Internet.
29Global Knowledge Index 2017
The outputs pillar comprises four sub-pillars that reflect the contribution of ICT to comprehensive and sustainable development through its effects on business, organizational and social models:
- Subscriptions: this sub-pillar covers fixed-telephone subscriptions, mobile–cellular subscriptions, fixed-broadband subscriptions and active mobile-broadband subscriptions, all measured per 100 inhabitants. It reflects the penetration of ICT services among the population of a given country.
- Usage by individuals: this sub-pillar comprises three variables: percentage of IInternet users; use of virtual social networks; and business-to-consumer Internet use. Measuring individuals’ use of the Internet is important because the number of users and the extent of their usage play a key role in Internet growth. Social networks connect large numbers of people and constitute a fast and effective means for sharing information and solutions to common issues facing users across regions and nations. The growth of social networks offers increasing opportunities for trade as companies embrace the Internet as a channel for marketing and selling their commodities and services. This results in a growing number of commercial transactions being conducted through the Internet, including via e-commerce or in the form of financial or customer services, which leads to higher cash flows into the country’s traditional economy from the digital economy.75
- Usage by government and institutions: this sub-pillar consists of four variables with equal weights. They relate directly to the absorption of modern technology; use of the Internet for business-to-business transactions; the importance of ICT to government strategies for achieving comprehensive and sustainable development; and the availability of e-government services, which reflects the levels of efficiency of public administration, transparency, governance and accountability. This sub-pillar also includes government success in ICT promotion, and another variable that illustrates unlicensed software installation rates - in cases where
such rates are high, they negatively affect creative and innovative products and investments in the sector.
- Impact on development: measuring innovation in ICT and its effects on society provides another indicator for evaluating the efficacy of the sector. An increase in the use of, investment in and competitiveness of the ICT sector results in more innovative products and impacts labour market dynamics, which affect the broader economy and society. This sub-pillar comprises three variables with equal weights, illustrating the outputs of innovation in ICT, the impact of ICT on new business models, and the social impacts of ICT.
Relative weighting
The weights of the indicators were distributed as follows:
- The inputs pillar: this pillar was assigned a relative weight of only (3/10) in view of the fact that inputs are necessary, but not sufficient, for evaluating the position of a country in this sector. Each of the two sub-pillars was assigned a weight of (1/2), equally distributed among its variables.
- The outputs pillar: this pillar was assigned a relative weight of (7/10) to highlight the importance of the use of available technology by all social categories. The weights of its sub-pillars vary as follows: subscriptions (4/14); usage by individuals (3/14); usage by government and institutions (4/14); and impact on development (3/14). Variables under each sub-pillar had equal weights.
Economy Index
If the essence of economics is the optimal utilization of scarce resources to meet seemingly unlimited human needs, the knowledge economy is the best available solution for bridging the gap between scarce resources and demand, both in terms of quantity and quality. With the advent of the knowledge economy, a paradigm shift has occurred in the way limited national resources can be transformed into global wealth that is less restricted by factors of time
30 Global Knowledge Index 2017
and space. Knowledge is transferred quickly, expanding horizons and driving the development and progress of nations; as such, the concept of the knowledge economy is broader than ever before, and for the past two editions of the Arab Knowledge Index, economy was incorporated as one of its six main sectoral indices.76
Studies have shown that the introduction of knowledge economy is essentially related to levels of knowledge production, dissemination and use, whether such knowledge is implicit (as represented by individuals’ experiences, knowledge, relations and interactions) or explicit (in the form of databases, information and software). Unlike the traditional concept of economic resource analysis and availability, knowledge economy is primarily based on providing economic resources - particularly human resources - with knowledge tools, including digital and technological knowledge assets as well as innovative and creative skills.
In his review of the methodological framework of the relationship between knowledge and economic development, Peter Meusburger points out that this issue relates not only to the availability of knowledge, but also to differences in the timing and the speed of adoption of advances in the competitiveness of individuals, institutions and nations.77 This means that the transmission and dissemination of information does not guarantee its acceptance and use by recipients, which depends on political and economic will, and the acceptance by society of new knowledge which may initially appear unfamiliar.78 It is logical today to classify countries according to their levels of development based on their ‘openness’ to knowledge, rather than traditional determinants like wealth, trade openness or even relative economic weight within the global economy. Those economies that are most open to new knowledge - including its generation, localization, dissemination and/or use – rank highest on the scale of economic development and are best able to move to a higher level of development.
Therefore, in developing the indicators for this sector, the Global Knowledge Index took into account the fact that the size of an economy is no longer the primary
determining factor of its nation’s level of economic development; rather, the main determining factor is now the openness of the state to the integration and use of knowledge.
Structure of the Economy Index
The Economy Index is based on a group of select knowledge enablers that strongly influence the six other indices of the Global Knowledge Index. The Economy Index comprises three pillars, namely: financing and value added; economic openness; and knowledge competitiveness. Each of these has several sub-pillars and variables to measure aspects within the broader relationship between the knowledge economy and economic development (Figure 9).
Knowledge competitiveness
Competitiveness is one of the most important elements of knowledge exchange. The more competitive an economy is, the more it is able to penetrate other markets with its commodities and services; and the more competitive the investment environment is in a given country, the more successful it will be in attracting foreign investment and inward knowledge transfer. Competitiveness, and its two primary components (a competitive enabling environment; and the response to that environment), is the real catalyst for the transfer, localization and use of knowledge. Thus, economic infrastructure and competition and competitiveness drivers are the two sub-pillars that primarily aim to describe the role of competitiveness in general, and in particular the positive correlation between competitiveness and knowledge, and its role in supporting the overall development of an economy.
- Economic infrastructure and competition: this sub-pillar consists of several variables that reflect two key aspects. The first illustrates the competitiveness of the economic environment in terms of local and foreign investment; and the second indicates the presence of a local environment that is a catalyst for knowledge. The variables of this sub-pillar represent the key enablers of competitiveness, starting with the ease of starting a business, which covers ease of transferring
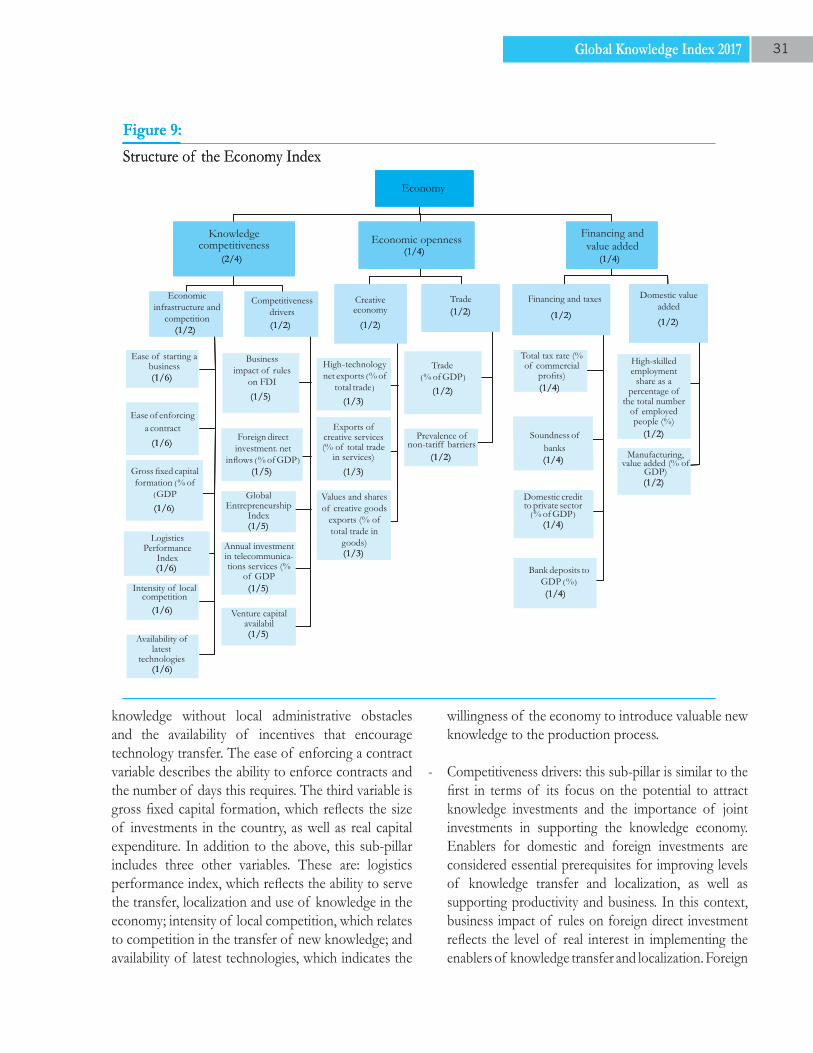
31Global Knowledge Index 2017
knowledge without local administrative obstacles and the availability of incentives that encourage technology transfer. The ease of enforcing a contract variable describes the ability to enforce contracts and the number of days this requires. The third variable is gross fixed capital formation, which reflects the size of investments in the country, as well as real capital expenditure. In addition to the above, this sub-pillar includes three other variables. These are: logistics performance index, which reflects the ability to serve the transfer, localization and use of knowledge in the economy; intensity of local competition, which relates to competition in the transfer of new knowledge; and availability of latest technologies, which indicates the
willingness of the economy to introduce valuable new knowledge to the production process.
- Competitiveness drivers: this sub-pillar is similar to the first in terms of its focus on the potential to attract knowledge investments and the importance of joint investments in supporting the knowledge economy. Enablers for domestic and foreign investments are considered essential prerequisites for improving levels of knowledge transfer and localization, as well as supporting productivity and business. In this context, business impact of rules on foreign direct investment reflects the level of real interest in implementing the enablers of knowledge transfer and localization. Foreign
Financing and value added
Trade Domestic valueadded
Figure 9:
Structure of the Economy Index
Economy
Economic openness
Economic infrastructure and
competition
Competitiveness drivers
Creativeeconomy
Financing and taxes
Ease of starting abusiness
Gross fixed capital formation (% of
(GDP
Ease of enforcinga contract
Logistics Performance
Index
Business impact of rules
on FDI
High-technology net exports (% of
total trade)
Trade (% of GDP)
Venture capital availabil
Intensity of local competition
Prevalence of non-tariff barriers
Foreign direct investment, net
inflows (% of GDP)
Annual investment in telecommunica-tions services (%
of GDP
Global Entrepreneurship
Index
Exports of creative services (% of total trade
in services)
Values and shares of creative goods
exports (% of total trade in
goods)
Total tax rate (% of commercial
profits)
Soundness of banks
Domestic credit to private sector
(% of GDP)
Bank deposits to GDP (%)
High-skilled employment
share as a percentage of
the total number of employed people (%)
Manufacturing, value added (% of
GDP)
Availability of latest
technologies
(1/2) (1/2) (1/2)(1/2)
(1/5)
(1/5)
(1/5)
(1/5)
(1/6)
(1/6)
(1/6)
(1/6)
(1/6)
(1/6)
(1/5)
(1/3)
(1/3)
(1/3)
(1/2) (1/4)
(1/4)(1/4)
(2/4)
(1/4)
(1/4)
(1/4)
(1/2)
(1/2)(1/2)
(1/2)
(1/2)
32 Global Knowledge Index 2017
direct investment, net inflows as a percentage of GDP enhances these enablers. Finally, annual investment in telecommunications services (percentage of GDP) and venture capital availability indicate the willingness to apply new knowledge developments in the ICT sector to support its role in the transfer, localization and use of knowledge.
Economic openness
The economic openness pillar is key to understanding the role of knowledge - be it exported or imported - in developing the production of a given country, and therefore in driving economic growth and local development. The more a country imports products and services from abroad, the more it can access and develop the knowledge of others. The same applies in the case of knowledge exports; where a country provides the world with knowledge services or products, adding value from a combination of local and imported knowledge. Variables under this pillar are grouped into two sub-pillars:
- Creative economy: this sub-pillar comprises three variables: high-technology net exports, exports of creative services and share of creative goods exports from total goods exports. These reflect the extent of creative knowledge transferred, which necessarily leads to improved levels of global development and general knowledge exchange, especially in relation to innovation and creativity in technologies, commodities and services. Although technological exports are one of the most important examples of the transfer of knowledge between countries, this sub-pillar is expanded to include all levels of creative exchange between countries through exported goods and services.
- Trade: this sub-pillar reflects the extent to which obstacles to trade are overcome to enable cross-border knowledge exchange. Hence, the variable foreign trade as a percentage of GDP is a real indicator of the level of knowledge exchange between states and the openness of states to others. Prevalence of non-tariff barriers is another variable that also reflects this willingness, by
illustrating the real openness of countries to importing products from other countries, and thus importing the knowledge of others.
Financing and value added
The third pillar represents the efficacy of local financing and institutional components in supporting the country’s knowledge capacity and demonstrates the willingness of countries to transfer, localize and use knowledge. This pillar comprises two sub-pillars:
- Financing and taxes: this sub-pillar illustrates streams of public financing from country revenues and private financing from banking institutions. In terms of public financing, the first variable, total tax rate (percentage of commercial profits), describes whether sufficient incentives are provided for companies to operate and invest in the economy. This is an important factor in enabling the transfer, localization and use of knowledge. Private financing under this sub-pillar is represented by three variables: soundness of banks; domestic credit to private sector (percentage of GDP); and bank deposits to GDP (percentage). This sub-pillar reflects the premise that the knowledge economy is enabled by an institutional environment in which the banking system acts as a catalyst. The more credit is available to the private sector, the more likely it is that development, economic expansion, investment, and knowledge transfer, localization and use will occur.
- Domestic value added: this sub-pillar is essential for illustrating the extent to which countries are able to localize and use knowledge, and contribute to its transfer abroad through skilled human resources and local industry components. Hence, the high-skilled employment (percentage of total employed people) variable within this sub-pillar reflects the human component of the economy and its importance in terms of national added value. It also reflects the level of workforce participation in knowledge activities, including knowledge transfer, localization and use. The last variable, manufacturing, value added (percentage of GDP), refers to the ability to make better use of
33Global Knowledge Index 2017
local resources and combine them with those from abroad to create a local product that represents a contribution to knowledge.
Relative weighting
The three pillars vary in terms of their weight, while the variables are assigned equal weights in the absence of justifications for unequal relative allocations. The knowledge competitiveness pillar is assigned a weight of 50 percent because it comprises 11 variables distributed over two sub-pillars: economic infrastructure and competition and competitiveness drivers. The other two pillars, economic openness and financing and value added, are assigned equal weights.
General Enabling Environment Index
Based on the methodological framework of the Index, and in order to avoid repetition of variables that could undermine the accuracy of weighting or the overall value of the Index, the project team agreed to group the general enabling environment components of the six sectors under a single separate index. Considering these multi-contextual dimensions, three main pillars were devised: the political and institutional context; the socio-economic context; and the health and environment context (Figure 10), which cut across and influence all the other sectoral indices.
Improving the performance and quality of outputs from all stages of the education system requires a safe environment; an appropriate system to ensure the provision of basic health services; and a clean environment free from pollution and hazards. It also requires an enlightened societal culture that promotes social justice and high levels of education among all levels of society. There is also a clear need for a stable political environment where individuals’ rights and duties are respected, freedoms are exercised and rule of law prevails.
The same is true of the ICT sector; it is clearly influenced by a society’s enabling environment - especially its legislative and political environment. Political stability
provides the impetus for increasing investment and the participation of international companies in the provision of communication services including Internet and mobile applications. Similarly, international studies indicate that the success of countries in research, development and innovation (RDI) is linked to economic performance, the political and legal environment, and the fulfilment of social development goals. Preserving the natural environment and safeguarding public health are also key actions in providing an environment conducive to RDI.The general enabling environment of a national socio-economic framework - especially in terms of gender equality - is a key factor in supporting knowledge indicators in the economy, especially those representing local value added and the knowledge competitiveness of countries. Furthermore, institutional political empowerment provides an environment that acts as a major enabler of knowledge creation in an economy. Value added, internal and external competitiveness and economic openness are strongly related to the institutional capacity and organization of the economy, particularly the quality of its procedures and litigation, the efficiency of government apparatus, and the existence of political stability. The health service, and quality of life and environment in a specific country are also general factors that enable the economy to create a competitive environment and attract sustainability-oriented investments.
Structure of the General Enabling Environment Index
The general enabling environment index consists of three pillars: political and institutional, which is concerned with governance and the democratic/political aspects of a country; socio-economic, which brings together different socio-economic indicators, with a focus on gender equality; and health and environment, which explores development in the context of the health of a country’s natural environment and citizens. These three pillars each contain two sub-pillars and their related variables.
Political and institutional
This pillar encompasses a political sub-pillar and an institutional sub-pillar. The former is mainly concerned
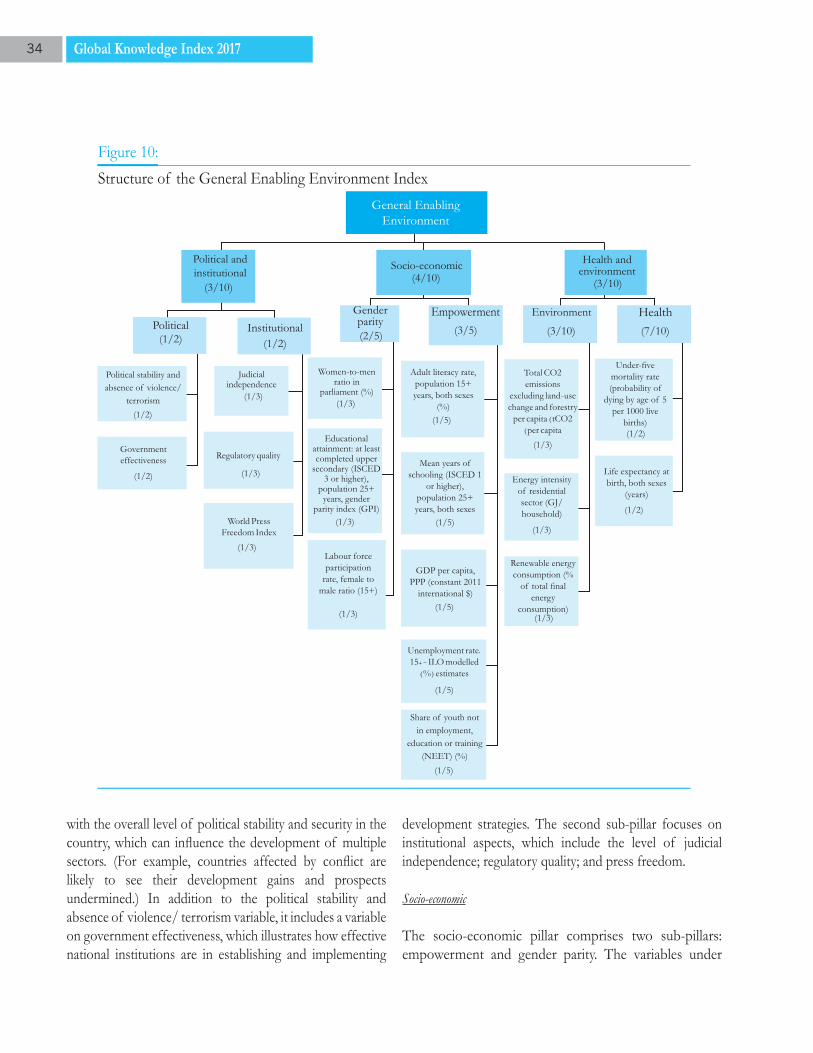
34 Global Knowledge Index 2017
with the overall level of political stability and security in the country, which can influence the development of multiple sectors. (For example, countries affected by conflict are likely to see their development gains and prospects undermined.) In addition to the political stability and absence of violence/ terrorism variable, it includes a variable on government effectiveness, which illustrates how effective national institutions are in establishing and implementing
development strategies. The second sub-pillar focuses on institutional aspects, which include the level of judicial independence; regulatory quality; and press freedom.
Socio-economic
The socio-economic pillar comprises two sub-pillars: empowerment and gender parity. The variables under
(1/5)
(1/5)
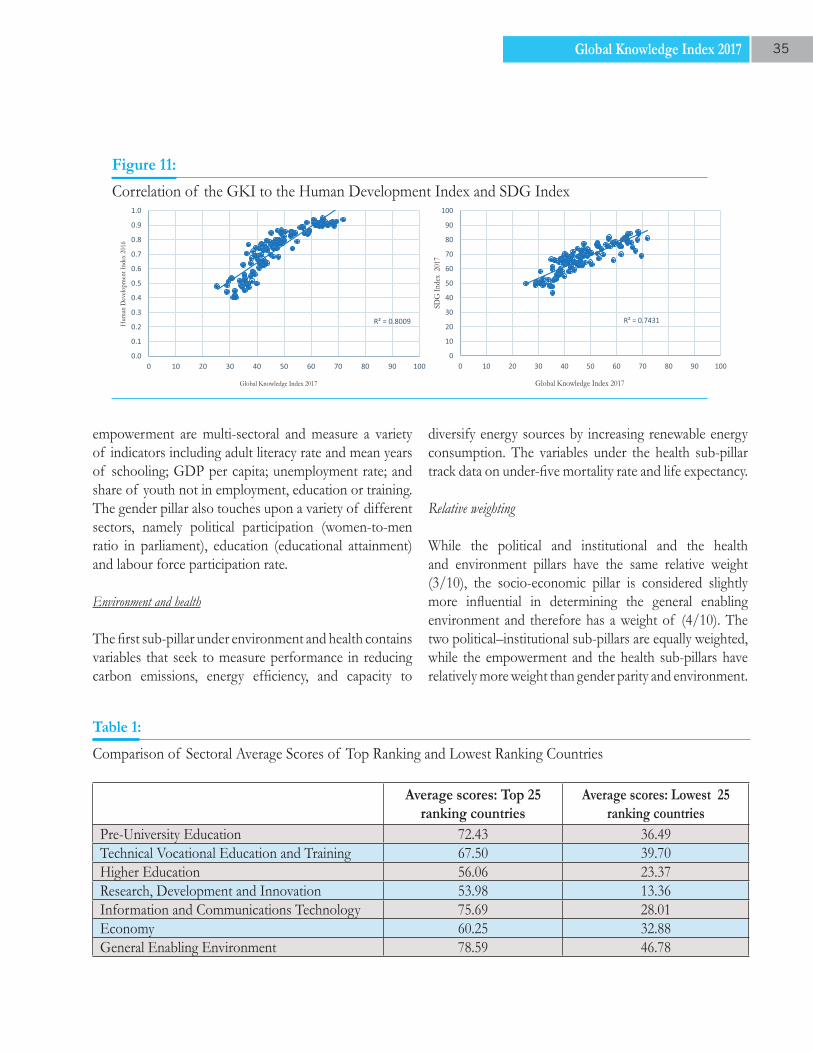
35Global Knowledge Index 2017
empowerment are multi-sectoral and measure a variety of indicators including adult literacy rate and mean years of schooling; GDP per capita; unemployment rate; and share of youth not in employment, education or training. The gender pillar also touches upon a variety of different sectors, namely political participation (women-to-men ratio in parliament), education (educational attainment) and labour force participation rate.
Environment and health
The first sub-pillar under environment and health contains variables that seek to measure performance in reducing carbon emissions, energy efficiency, and capacity to
diversify energy sources by increasing renewable energy consumption. The variables under the health sub-pillar track data on under-five mortality rate and life expectancy.
Relative weighting
While the political and institutional and the health and environment pillars have the same relative weight (3/10), the socio-economic pillar is considered slightly more influential in determining the general enabling environment and therefore has a weight of (4/10). The two political–institutional sub-pillars are equally weighted, while the empowerment and the health sub-pillars have relatively more weight than gender parity and environment.
Figure 11:
Correlation of the GKI to the Human Development Index and SDG Index
R² = 0.7431
0
10
20
30
40
50
60
70
80
90
100
0 10 20 30 40 50 60 70 80 90 100
R² = 0.8009
0.0
0.1
0.2
0.3
0.4
0.5
0.6
0.7
0.8
0.9
1.0
0 10 20 30 40 50 60 70 80 90 100
Table 1:
Comparison of Sectoral Average Scores of Top Ranking and Lowest Ranking Countries
Average scores: Top 25ranking countries
Average scores: Lowest 25ranking countries
Pre-University Education 72.43 36.49Technical Vocational Education and Training 67.50 39.70Higher Education 56.06 23.37Research, Development and Innovation 53.98 13.36Information and Communications Technology 75.69 28.01Economy 60.25 32.88General Enabling Environment 78.59 46.78
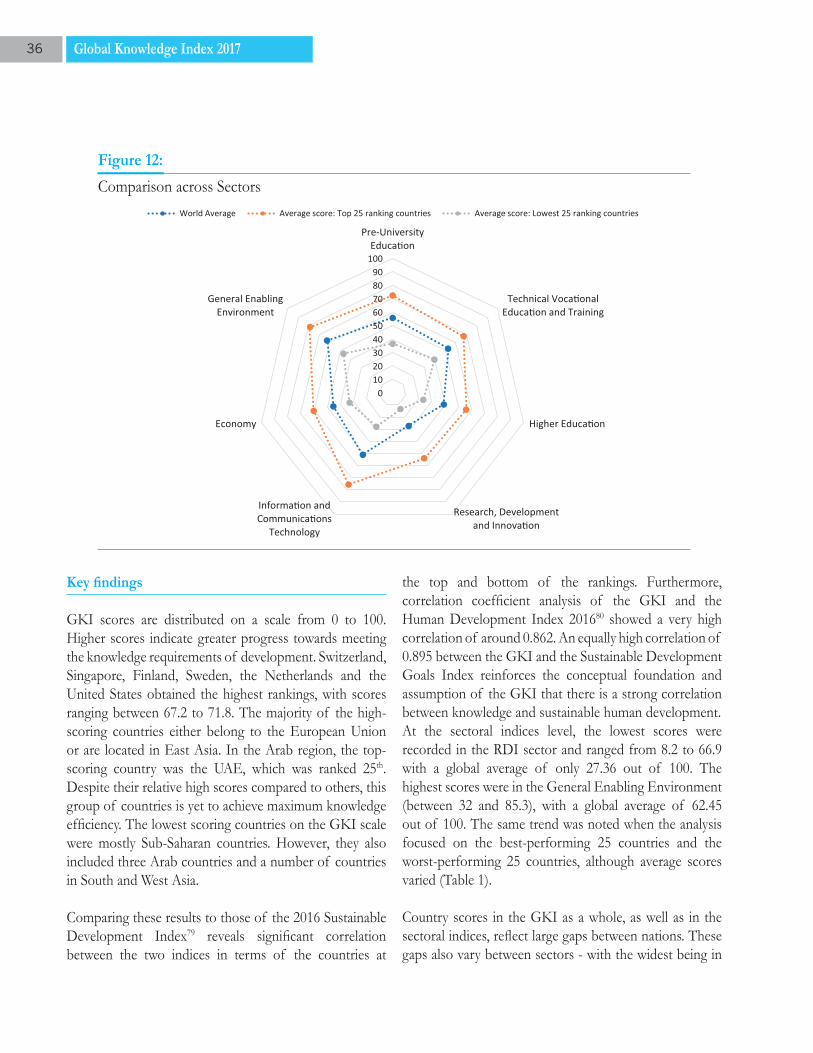
36 Global Knowledge Index 2017
Key findings
GKI sco res are distributed on a scale from 0 to 100. Higher scores indicate greater progress towards meeting the knowledge requirements of development. Switzerland, Singapore, Finland, Sweden, the Netherlands and the United States obtained the highest rankings, with scores ranging between 67.2 to 71.8. The majority of the high-scoring countries either belong to the European Union or are located in East Asia. In the Arab region, the top-scoring country was the UAE, which was ranked 25th. Despite their relative high scores compared to others, this group of countries is yet to achieve maximum knowledge efficiency. The lowest scoring countries on the GKI scale were mostly Sub-Saharan countries. However, they also included three Arab countries and a number of countries in South and West Asia.
Comparing these results to those of the 2016 Sustainable Development Index79 reveals significant correlation between the two indices in terms of the countries at
the top and bottom of the rankings. Furthermore, correlation coefficient analysis of the GKI and the Human Development Index 201680 showed a very high correlation of around 0.862. An equally high correlation of 0.895 between the GKI and the Sustainable Development Goals Index reinforces the conceptual foundation and assumption of the GKI that there is a strong correlation between knowledge and sustainable human development. At the sectoral indices level, the lowest scores were recorded in the RDI sector and ranged from 8.2 to 66.9 with a global average of only 27.36 out of 100. The highest scores were in the General Enabling Environment (between 32 and 85.3), with a global average of 62.45 out of 100. The same trend was noted when the analysis focused on the best-performing 25 countries and the worst-performing 25 countries, although average scores varied (Table 1).
Country scores in the GKI as a whole, as well as in the sectoral indices, reflect large gaps between nations. These gaps also vary between sectors - with the widest being in
37Global Knowledge Index 2017
the ICT, RDI and pre-university education sectors (Figure 12 ) - and can be categorized as follows:
- Gaps between sectors in the same country: this may indicate unbalanced development approaches, which are inconsistent with the concept of comprehensive and interconnected human development. It could also indicate ineffective implementation, which would require improved development management and more effective governance.
- Gaps between countries: these gaps require the attention of the international community and serve as a reminder, especially for rich countries, of the global commitment of the 2030 Agenda for Sustainable Development to scale up the support to developing and least-developed countries. This not only entails the provision of financial aid and technical assistance, but also the establishment and consolidation of avenues for ‘knowledge cooperation’.
Further analysis of gaps between sectors and countries could present opportunities for partnerships and exchange among top-ranking nations; looking at the top five ranks, it becomes clear that aside from Switzerland - which was among the top five in all sectors except for pre-university education - countries’ ranks varied by sector.
In terms of intersectoral interactions, statistical analysis showed a very strong correlation between sectors. The ICT sector emerged as an important component, showing high correlation coefficients to all sectors. This is not surprising, given the increasing importance of technology and its role in the development of knowledge in all fields. Meanwhile, the TVET sector seems to be relatively less connected to other sectors, its highest correlation being with the ICT sector (0.634). The TVET’s lowest correlation was with the pre-university education and higher education sectors, which indicates low consistency among the three education systems in several countries. It was also noted that gaps between scores on the TVET, pre-university education and higher education indices varied between top-ranking and lowest-ranking countries; while top-ranking countries scored higher on the pre-university education index than
on the TVET, lowest-ranking countries scored higher on the TVET index than on the pre-university index. Higher scores were recorded for both groups of countries on the higher education index than on the TVET index.
Regarding the relationship between the sectoral indices and the General Enabling Environment index, the political climate proved to be essential in determining the performance of most sectors, and may therefore be considered a key factor in determining the success of knowledge development. Its impact was felt most in the ICT sector, followed by the economy, higher education and RDI sectors. It was least felt in the pre-university education sector. The TVET index was equally influenced by the political environment and the socio-economic environment.
This brief description of major trends drawn from the results of the Index must be complemented by further analytical work at two levels:
- First, by the institution responsible for the development of the Index. Further, more detailed studies of the various index components and their relationships are required. This necessitates the development of an integrated analytical model that will help determine minimum thresholds for sectoral indices and facilitate cross-country comparisons.
- Second, more detailed analysis must be undertaken at the country level, by further exploring indicators and national context. Countries have different political, economic and cultural conditions that produce different needs and challenges. Therefore, despite the importance of analytical studies conducted regionally and internationally, countries should be encouraged to conduct national studies that are tailored to their specific development goals and resources.
Concluding remarks
‘Sustainable knowledge-based human development’ is a multidimensional concept combining a number of intertwined elements, including: quality education;
38 Global Knowledge Index 2017
scientific research oriented towards development and innovation; a sophisticated technological system to disseminate knowledge within society; and a strong economy that invests in human welfare and in the equitable and sustainable advancement of society. In order to identify priorities and drive efforts to achieve sustainable knowledge-based human development, a systematic measuring tool is required to gauge and track progress in achieving the optimal conditions for both knowledge and development. Hence the Global Knowledge Index was created, comprising six sectoral composite indices and a seventh index measuring the availability of a general enabling environment.
The importance of this initiative stems from the need to support sound, evidence-based and effective decision- and policymaking. However, the Index alone will not be sufficient to devise new policies or interventions. The true function of the Index is to shed light on the strengths and weaknesses of a given system, not to provide suggestions for how to respond to these strengths and weaknesses. Additional, tailored analysis by relevant national, regional and international actors is required to identify appropriate actions and interventions. Furthermore, it is important to ensure continuity in data collection in order to amass information over a sufficient period of time to allow accurate analysis of positive and negative trends, rather than providing a snapshot of the situation at a single point in time.81
Another intended benefit of the Index is the facilitation of partnerships and exchanges between relevant actors such as governments, decision makers, scholars and all other concerned authorities at the local, regional
and international levels. In this regard, the Index may facilitate collaborative projects among institutions and organizations that seek to build their own indices to fill the gaps in existing knowledge and measurement systems.
Finally, it is also hoped that the findings of the Global Knowledge Index will contribute to creating a competitive environment that encourages decision makers and stakeholders to initiate more programs to promote the dissemination and utilization of knowledge to achieve sustainable human development.
While recognizing the strength of the methodology and structure of this first edition, the Global Knowledge Index will be subject to regular updates, revisions and refinement. This will allow us to develop an increasingly credible and relevant product that can adapt to global transformations and remain responsive to evolving development requirements. In its next edition, more space will be allocated to the environment component, which constitutes an important pillar in achieving sustainable human development in its contemporary sense. The process of refining the Index will not be free from challenges, such as creating comprehensive, accurate and regularly updated databases, expanding data sources and developing methodologies that allow accurate utilization of big data.
This first edition will be followed by detailed analytical studies on the results and interactions of the indices in order to further our understanding of the status of both knowledge and development, as well as the nature of their correlation.
39Global Knowledge Index 2017
Endnotes
1 World Bank, 1999.2 Eubanks, 2011.3 United Nations Educational, Scientific and Cultural Organization, 2005.4 Sharma et al., 2009.5 United Nations Development Programme and Mohammed bin Rashid Al Maktoum Foundation, 2012.6 Drucker, 19947 Roberts, 2009.8 Dancy et al., 1992.9 Thakuria, 2014.10 World Commission on Environment and Development, 1987.11 United Nations Development Programme, 2010.12 World Bank, 2012.13 World Bank, 1999.14 World Bank, 200415 World Economic Forum, 2004.16 Leon, 2017.17 World Economic Forum, 2010.18 Leon, 2017.19 Kensho Technologies Inc., 2017.20 Arab Institute for Planning, 2012.21 United Nations Development Programme and Mohammed bin Rashid Al Maktoum Foundation, 2015.22 United Nations Development Programme and Mohammed bin Rashid Al Maktoum Foundation, 2016.23 Stewart, 1997.24 Bukh et al., 2001.25 United Nations, 2015.26 Diab, 200827 Gadrey and Florence, 2003.28 Booysen, 2002.29 Boidin, 2004.30 Joumard, 2016.31 Organisation for Economic Co-operation and Development, 2008.32 For more information about Principal Components Analysis see: Hair et al., 2015.33 The condition was relatively relaxed because the qualifying sample size is 131 countries (conditioned by data
availability in credible international sources)34 f=235 For more information about the Budget Allocation Process method, see OECD, 2008.36 United Nations Educational, Scientific and Cultural Organization, 2016a.37 United Nations Educational, Scientific and Cultural Organization, 2015b.38 United Nations Educational, Scientific and Cultural Organization, 2015a.39 Ki-moon, 2015.40 United Nations Educational, Scientific and Cultural Organization, 2015a.
40 Global Knowledge Index 2017
41 United Nations Office of the High Commissioner for Human Rights, 1989.42 United Nations, 2015.43 See for example: World Bank (https://openknowledge.worldbank.org/discover?scope=%2F&query=vocational
&submit=); UNESCO–UNEVOC (http://www.unevoc.unesco.org/go.php?q=page_unevoc_publications); and European Training Foundation (http://www.etf.europa.eu/web.nsf/pages/publications_by_topic).
44 United Nations Educational, Scientific and Cultural Organization, 2012.45 United Nations Educational, Scientific and Cultural Organization, International Centre for Technical and
Vocational Education and Training, 2016.46 United Nations Educational, Scientific and Cultural Organization, 2016a.47 United Nations Educational, Scientific and Cultural Organization, 2016b.48 European Centre for the Development of Vocational Training, 2011. 49 World Bank, 2015.50 United Nations Educational, Scientific and Cultural Organization Institute for Statistics, 2011. 51 Wilkens, 2011. 52 World Economic Forum, 2015. 53 Shaffer and Wright, 2010.54 United Nations, 2015.55 Annan, 2000.56 United Nations Educational, Scientific and Cultural Organization, 2010.57 Lalancette, 2010.58 United Nations Educational, Scientific and Cultural Organization, 2013.59 World Bank Institute, 2008.60 World Economic Forum, 2016.61 Cornell University et al., 2017.62 University of Melbourne, 2017.63 University of Melbourne, 2017.64 Cornell University et al., 2017.65 United Nations, 2015.66 United Nations Educational, Scientific and Cultural Organization, World Bank and OECD datasets.67 Organisation for Economic Co-operation and Development, 2015.68 Organisation for Economic Co-operation and Developmentand Eurostat, 2005.69 Khorshid, 2017.70 Organisation for Economic Co-operation and Development, 2000.71 World Economic Forum et al., 2015.72 World Economic Forum et al., 2015.73 World Economic Forum et al., 2015.74 International Telecommunication Union, 2005.75 World Economic Forum et al., 2015.76 United Nations Development Programme and Mohammed bin Rashid Al Maktoum Foundation, 2015 and
2016.77 Meusburger et al., 2013.78 Meusburger et al., 2013.79 Sachs et al., 2017.80 See United Nations Development Programme, 2016.81 Demeuse and Blondin, 2001.
41Global Knowledge Index 2017
References
References in Arabic
Al-Assaf, G. (2015). Indices of the Knowledge Economy. [In Arabic]. Background paper for the Arab Knowledge Index 2016. Not published.
Arab Institute for Planning (2012). Arab Competitiveness Report 2012. [In Arabic]. Kuwait: Arab Planning Institute. Available from: http://www.arab-api.org/images/publication/pdfs/310/310_compissue2012.pdfDiab, M. (2008). Knowledge Economy: A new era in economic development. [In Arabic]. Lebanese Defense Magazine. Issue 65. July 2008. Available from: https://www.lebarmy.gov.lb/ar/content/
Farjani, N. (2014). Towards Establishing the Knowledge Society in Egypt. [In Arabic]. The Arab Center for Research and Studies. Available from: http://www.acrseg.org/2474
Khorshid, M. (2017). Creative Industries and the Future of the Egyptian Economy. [In Arabic]. Al Masry Al Yaum Newspaper. August 2, 2017. Available from: http://www.almasryalyoum.com/news/details/1171348
Labib, Al. (2007). Arab Knowledge Encyclopedia for Sustainable Development. [In Arabic]. Vol. 3, The Social Dimension, Arab Scientific Publishers, First Edition.
Mohammad, K. (2010). Knowledge Capital and its Measuring Indices: A Philosophical Study. [In Arabic], Al-Anbar Journal for Economic and Managerial Science. Available from:https://www.iasj.net/iasj?func=fulltext&aId=45535
Talabah (2006). Arab Knowledge Encyclopedia for Sustainable Development. [In Arabic]. Vol. 1, A General Introduction, Arab Scientific Publishers, First Edition.
Wahbeh, N. (2003). The Issue of Quality in Education. [In Arabic]. Nawfal Publishing House: Beirut.
42 Global Knowledge Index 2017
References in English
Annan, K. (2000). Information Technology Should be Used to Tap Knowledge from Greatest Universities to Bring Learning to All, Kofi Annan Says. United Nations Information Service. Press Release No: UNIS/SG/2625. Retrieved on September 26, 2017 from: http://www.unis.unvienna.org/unis/pressrels/2000/sg2625.html
Booysen, F. (2002). An Overview and Evaluation of Composite Indices of Development. Social Indicators Research, vol. 59, No. 2.
Bukh, P. N., Larsen, H. T., & Mouritsen, J. (2001). Constructing Intellectual Capital Statements. Scandinavian Journal of Management, 17(1), 87–108.
Clark, W. C., L. van Kerkhoff, L. Lebel and G. C. Gallopin (2016). Crafting Usable Knowledge for Sustainable Development. Proceedings of the National Academy of Sciences, vol. 113, No. 17. Available from:http://www.belfercenter.org/sites/default/files/legacy/files/RWP16-005_Clark.pdf
Cornell University, INSEAD and WIPO (2017). The Global Innovation Index 2017: Innovation Feeding the World. Tenth Edition. Ithaca, Fontainebleau, and Geneva. Available from: https://www.globalinnovationindex.org/gii-2017-report
Cornell University, INSEAD and WIPO (2015). The Global Innovation Index 2015: Effective Innovation Policies for Development. Ithaca, Fontainebleau and Geneva. Available from: https://www.globalinnovationindex.org/userfiles/file/reportpdf/GII-2015-v5.pdf
Dancy, J., E. Sosa and M. Steup (2010). A Companion to Epistemology. Second Edition. Oxford: Blackwell.
Drucker, P.F. (1994). The Theory of the Business. Harvard Business Review, September – October 1994. Retrieved on October 30, 2017 from:https://hbr.org/1994/09/the-theory-of-the-business
Eubanks, V. (2011). Digital Dead End: Fighting for Social Justice in the Information Age. Massachusetts: Massachusetts Institute of Technology.
European Centre for the Development of Vocational Training (2011). The Benefits of Vocational Education and Training. Research Paper No. 10. Luxembourg. Available from: http://www.cedefop.europa.eu/files/5510_en.pdf
Fantom, N., T. Khokhar, and E. Purdie (2017). The 2016 Edition of World Development Indicators: Three Features you Won’t Want to Miss. World Bank blogs. Available from: https://blogs.worldbank.org/opendata/2016-edition-world-development-indicators-out-three-features-you-won-t-want-missGroeneveld, R.A., and G. Meeden (1984). “Measuring Skewness and Kurtosis”. The Statistician, vol. 33, no. 4, pp. 391–99.
43Global Knowledge Index 2017
Hair, J., R. Anderson, R. Tatham and W. Black (2015). Multivariate Data Analysis (7th ed.). Upper Saddle River, NJ: Prentice-Hall International.
Hicks, N., and P. Streeten (1979). Indicators of Development: The Search for a Basic Needs Yardstick. World Development, vol. 7, pp. 567-580. Washington, D.C.: World Bank. Available from: http://documents.worldbank.org/curated/en/653921468327325043/pdf/REP104000Indic0asic0needs0yardstick.pdf
International Telecommunication Union (2005). World Summit on the Information Society Outcome Documents: Geneva 2003 - Tunis 2005. Geneva. Available from: https://www.itu.int/net/wsis/outcome/booklet.pdf
Kensho Technologies Inc. (2017). New Economies: Kensho 21st Century Sectors. Retrieved on October 29, 2017 from: http://kenshoindices.com/
Ki-moon, B. (2012). Education First: An Initiative of the United Nations Secretary-General. Available from:http://www.unaids.org/sites/default/files/media_asset/20120927_EducationFirst_en_0.pdf
Labe, O. (2010). Key Indicators on Tertiary Education: Calculation and Interpretation. Retrieved on September 26, 2017 from:http://docplayer.net/24264960-Key-indicators-on-tertiary-education-calculation-and-interpretation.html
Lalancette, D. (2010). The OECD Initiative for an Assessment of Higher Education Learning Outcomes. Intellectual Economics, vol. 2, No. 8. Available from:http://www.oecd.org/edu/imhe/46832947.pdf
Leon, R.D. (2017). Measuring the Knowledge Economy: A National and Organizational Perspective. Management Dynamics in the Knowledge Economy, vol. 5, No. 2. Available from:http://www.managementdynamics.ro/index.php/journal/article/view/212/173
Martin, M, and C. Sauvageot (2011). Constructing an Indicator System or Scorecard for Higher Education: A Practical Guide. Paris: International Institute for Educational Planning. Available from: http://unesdoc.unesco.org/images/0018/001824/182453e.pdf
Melnikas, B. (2010). Sustainable Development and Creation of the Knowledge Economy: The New Theoretical Approach. Ukio Technologinis ir Ekonominis Vystymas, vol. 16. No. 3. Available from:http://www.tandfonline.com/doi/pdf/10.3846/tede.2010.32
Meusburger, P., J. Glückler and M. El Meskioui (2013). Knowledge and the Economy, vol. 5. Springer.
Organisation for Economic Co-operation and Development (2015). Frascati Manual 2015: Guidelines for Collecting and Reporting Data on Research and Experimental Development. Paris. Available from:http://www.oecd-ilibrary.org/docserver/download/9215001e.pdf?expires=1506418891&id=id&accname=guest&checksum=6E9A93AC9FBADE6F6D5934B0898E04AD
44 Global Knowledge Index 2017
Organisation for Economic Co-operation Development (OECD), (2008). Handbook on Constructing Composite Indicators: Methodology and User Guide. Paris.
Organisation for Economic Co-operation and Development, and Eurostat (2005). Oslo Manual: Guidelines for Collecting and Interpreting Innovation Data. 3rd ed. Paris. Available from:http://www.oecd-ilibrary.org/docserver/download/9205111e.pdf?expires=1506419162&id=id&accname=guest&checksum=59F8487A6216A047012101F94EB9EFE6
Organisation for Economic Co-operation and Development (2000). Science, Technology and Innovation in the New Economy. Policy Brief. Available from: http://www.oecd.org/science/sci-tech/1918259.pdf
Organisation for Economic Co-operation and Development (1996). The Knowledge-Based Economy. Paris. Available from:https://www.oecd.org/sti/sci-tech/1913021.pdf
Roberts, J. (2009). The Global Knowledge Economy in Question. Critical Perspectives on International Business, vol. 5, No. 4.
Saltelli, A., M. Ratto, T. Andres, F. Campolongo, J. Cariboni, D. Gatelli, M. Saisana and S. Tarantola (2008). Global Sensitivity Analysis: The Primer. Chichester: John Wiley & Sons.
Sachs, J., G. Schmidt-Traub, C. Kroll, D. Durand-Delacre, and K. Teksoz (2017). SDG Index and Dashboards Report 2017. New York: Bertelsmann Stiftung and Sustainable Development Solutions Network (SDSN). Available from: http://www.sdgindex.org/assets/files/2017/2017-SDG-Index-and-Dashboards-Report--full.pdf
Shaffer, D., and D. Wright (2010). A New Paradigm for Economic Development: How Higher Education Institutions are Working to Revitalize their Regional and State Economies. Albany, NY: Rockefeller Institute of Government. Available from: http://www.rockinst.org/pdf/education/2010-03-18-A_New_Paradigm.pdf
Sharma, R. S., E. M. Samuel, and E. Ng (2009). Beyond The Digital Divide: Policy Analysis for Knowledge Societies. Journal of Management, vol. 13, No. 5.
Stewart, T. A. (1997). Intellectual Capital: The New Wealth of Organisations. New York: Doubleday Publishing Group 1997. New York: Doubleday / Currency.
Tavakol, M. and R. Dennick (2011). Making Sense of Cronbach’s Alpha. International Journal of Medical Education vol. 2, pp. 53–55.
Tiana, A. (2001). Le monde comme laboratoire éducatif. Politiques d’éducation et de formation: analyses et comparaisons internationales, vol. 3.
Thakuria, G. (2014). Traditional Knowledge for Sustainable Development: A Geographical Analysis. IMPACT: International Journal of Research in Applied, Natural and Social Sciences, vol. 2, No. 9.
45Global Knowledge Index 2017
United Nations (2015). Transforming our World: The 2030 Agenda for Sustainable Development. General Assembly Resolution A/RES/70/1. Available from:http://www.un.org/ga/search/view_doc.asp?symbol=A/RES/70/1&Lang=E
United Nations Development Programme (2016). Human Development Report 2016: Human Development for Everyone. New York. Available from: hdr.undp.org/sites/default/files/2016_human_development_report.pdf
United Nations Development Programme (2010). The Real Wealth of Nations: Pathways in Human Development. Human Development Report 2010. New York: United Nations. Available from: http://hdr.undp.org/sites/default/files/reports/270/hdr_2010_en_complete_reprint.pdf
United Nations Development Programme (1990). Human Development Report 1990. New York: Oxford University Press. Available from: http://hdr.undp.org/sites/default/files/reports/219/hdr_1990_en_complete_nostats.pdf
United Nations Development Programme and Mohammed bin Rashid Al Maktoum Foundation (2016). Arab Knowledge Index 2016. Dubai: Al Ghurair Printing and Publishing. Available from:http://knowledge4all.com/admin/uploads/files/AKI2016/En/ArabKnowledgeIndex2016.pdf
United Nations Development Programme and Mohammed bin Rashid Al Maktoum Foundation (2015). Arab Knowledge Index 2015. Dubai: Al Ghurair Printing and Publishing. Available from: http://www.knowledge4all.com/uploads/files/AKI2015/PDFEn/AKI2015_Full_En.pdf
United Nations Development Programme and Mohammed bin Rashid Al Maktoum Foundation (2014). Arab Knowledge Report 2014: Youth and Localisation of Knowledge. Dubai: Al Ghurair Printing and Publishing. Available from: http://www.knowledge4all.com/uploads/files/AKR2014Gen/en/AKR2014_Full_En.pdf
United Nations Development Programme and Mohammed bin Rashid Al Maktoum Foundation (2012). Arab Knowledge Report 2010/2011: Preparing Future Generations for the Knowledge Society. Dubai: Al Ghurair Printing and Publishing. Available from: http://www.knowledge4all.com/uploads/files/AKR2011/en/AKR2011_Full_En.pdf
United Nations Development Programme and Mohammed bin Rashid Al Maktoum Foundation (2009). Arab Knowledge Report 2009: Towards Productive Intercommunication for Knowledge. Dubai: Al Ghurair Printing and Publishing. Available from: http://www.knowledge4all.com/uploads/files/AKR2009/en/AKR2009_Full_En.pdf
United Nations Educational, Scientific and Cultural Organization (2016a). Mainstreaming SDG4 Education 2030 in Sector-Wide Policy and Planning: Technical Guidelines for Field Offices. Paris. Available from: http://unesdoc.unesco.org/images/0024/002464/246475e.pdf
United Nations Educational, Scientific and Cultural Organization (2016b). Strategy for Technical and Vocational Education and Training (TVET) (2016-2021). Paris. Available from: unesdoc.unesco.org/images/0024/002452/245239e.pdf
46 Global Knowledge Index 2017
United Nations Educational, Scientific and Cultural Organization (2015a). Incheon Declaration Education 2030: Towards Inclusive and Equitable Quality Education and Lifelong Learning for All. Available from: http://www.unesco.org/new/fileadmin/MULTIMEDIA/HQ/ED/ED/pdf/FinalVersion-IncheonDeclaration.pdf
United Nations Educational, Scientific and Cultural Organization (2015b). Rethinking Education: Towards a Global Common Good?. Paris. Available from: http://unesdoc.unesco.org/images/0023/002325/232555e.pdf
United Nations Educational, Scientific and Cultural Organization (2013). Rankings and Accountability in Higher Education: Uses and Misuses. Paris. Available from: http://unesdoc.unesco.org/images/0022/002207/220789e.pdf
United Nations Educational, Scientific and Cultural Organization (2012). Shanghai Consensus: Recommendations of the Third International Congress on Technical and Vocational Education and Training. Transforming TVET: Building skills for work and life. Shanghai, PRC. May 14-16, 2012. Available from:http://www.unesco.org/fileadmin/MULTIMEDIA/HQ/ED/pdf/outcomesdocumentFinalwithlogo.pdf
United Nations Educational, Scientific and Cultural Organization, Institute for Statistics (2011). International Standard Classification of Education: ISCED 2011. Montreal. Available from: http://uis.unesco.org/sites/default/files/documents/international-standard-classification-of-education-isced-2011-en.pdf
United Nations Educational, Scientific and Cultural Organization (2010). World Conference on Higher Education 2009. Final Report. Paris. Available from: http://unesdoc.unesco.org/images/0018/001892/189242e.pdf
United Nations Educational, Scientific and Cultural Organization (2005). Toward Knowledge Societies. UNESCO World Report. Paris. Available from:http://unesdoc.unesco.org/images/0014/001418/141843e.pdf
United Nations Office of the High Commissioner for Human Rights (1989). Convention on the Rights of the Child adopted and opened for signature, ratification and accession by General Assembly resolution 44/25 of 20 November 1989. Available from: http://www.ohchr.org/EN/ProfessionalInterest/Pages/CRC.aspx
University of Melbourne (2017). U21 Ranking of National Higher Education Systems 2017. Melbourne Institute of Applied Economic and Social Research and Universitas 21. Retrieved on September 26, 2017 from:http://www.universitas21.com/article/projects/details/153/executive-summary-and-full-2017-report
Wilkens, K. (2011). Higher Education Reform in the Arab World. Brookings Institution, Saban Center. Available from:https://www.brookings.edu/wp-content/uploads/2016/06/08_education_reform_wilkins.pdf
World Bank (2015). Higher Education. Retrieved on September 25, 2017 from: http://www.worldbank.org/en/topic/tertiaryeducation#what_why
47Global Knowledge Index 2017
World Bank (2012). Inclusive Green Growth: The Pathway to Sustainable Development. Washington, D.C. Available from: https://openknowledge.worldbank.org/bitstream/handle/10986/6058/9780821395516.pdf
World Bank (2004). Benchmarking Countries in the Knowledge Economy: Presentation of the Knowledge Assessment Methodology (KAM). Knowledge for Development Program. Available from:http://siteresources.worldbank.org/KFDLP/Resources/KAMBoardBriefing.pdf
World Bank (1999). Knowledge for Development. World Development Report. Washington, D.C.: Oxford University Press. Available from: https://openknowledge.worldbank.org/bitstream/handle/10986/5981/WDR%201998_99%20-%20English.pdf?sequence=1&isAllowed=y
World Bank Institute (2008). Measuring Knowledge in the World’s Economies. Knowledge Assessment Methodology and Knowledge Economy Index. Knowledge Development Program. Available from: http://web.worldbank.org/archive/website01030/WEB/IMAGES/KAM_V4.PDF
World Commission on Environment and Development (1987). Report of the World Commission on Environment and Development: Our Common Future (Brundtland Report). Available from:http://www.un-documents.net/our-common-future.pdf
World Economic Forum (2016). The Global Competitiveness Report 2016-2017. Insight Report. Geneva. Available from: www3.weforum.org/docs/GCR2016-2017/05FullReport/TheGlobalCompetitivenessReport2016-2017_FINAL.pdf
World Economic Forum (2010). The Lisbon Review 2010: Towards a More Competitive Europe?. Geneva. Available from:https://www.weforum.org/reports/lisbon-review-2010
World Economic Forum (2004). The Lisbon Review 2004: An Assessment of Policies and Reforms in Europe. World Economic Forum. Geneva. (2004). Available from: http://www.enriccanela.cat/wp-content/uploads/2006/12/lisbon-review-report2004.pdf
World Economic Forum, INSEAD and Cornell University (2015). The Global Information Technology Report 2015: ICTs for Inclusive Growth. Insight Report. Geneva. Available from: http://www3.weforum.org/docs/WEF_Global_IT_Report_2015.pdf
48 Global Knowledge Index 2017
References in French
Boidin, B. (2004). Développement humain, développement durable et « pays en développement » : comment articuler et mesurer les différentes dimensions? Développement durable et territoires, dossier 3. Disponible à l’URL: https://developpementdurable.revues.org/1120#text
Bouchard, F. (2015). 1ère allocution présidentielle prononcée durant l’Assemblée générale annuelle de l’Acfas, 10 décembre 2015. Disponible à l’URL:http://www.acfas.ca/sites/default/files/fichiers/discoursfbouchardaga2015-12-10.pdf
Demeuse, M., and C. Blondin (2001). Construire des Indicateurs de la qualité de l’éducation au niveau européen. Colloque international « l’éducation dans tous ses états ». Bruxelles. 9-12 mai, 2001. CEDEF/AFEC.
Evers, H.D., M. Kaiser and C. Müller (2010). Savoir et développement: les appareils épistémiques dans le contexte mondial. Revue internationale des sciences sociales, vol. 1, No. 195. Récupéré le 27 octobre, 2017 à l’URL:https://www.cairn.info/revue-internationale-des-sciences-sociales-2010-1-page-67.htm
Gadrey, J., and J.C. Florence (2003). Les indicateurs de richesse et de développement: Un bilan international en vue d’une initiative française. Rapport de recherche pour la DARES. [In French]. Available from: http://travail-emploi.gouv.fr/IMG/pdf/rapport-indicateurs-richesse-developpement.pdf
Joumard, R. (2016). Mise au point d’indicateurs de développement durable. 20e Colloque international en évaluation environnementale, Antananarivo, Madagascar. 26-28 octobre 2016. Disponible à l’URL: http://ecastats.uneca.org/acsweb/Portals/0/FDES/Etraining/Session4/SM_Session4_2.pdf
Vedura (2016). Principes du développement durable. Récupéré le 27 octobre, 2017 à l’URL:http://www.vedura.fr/developpement-durable/
Executive Report