Embed Size (px)
Citation preview
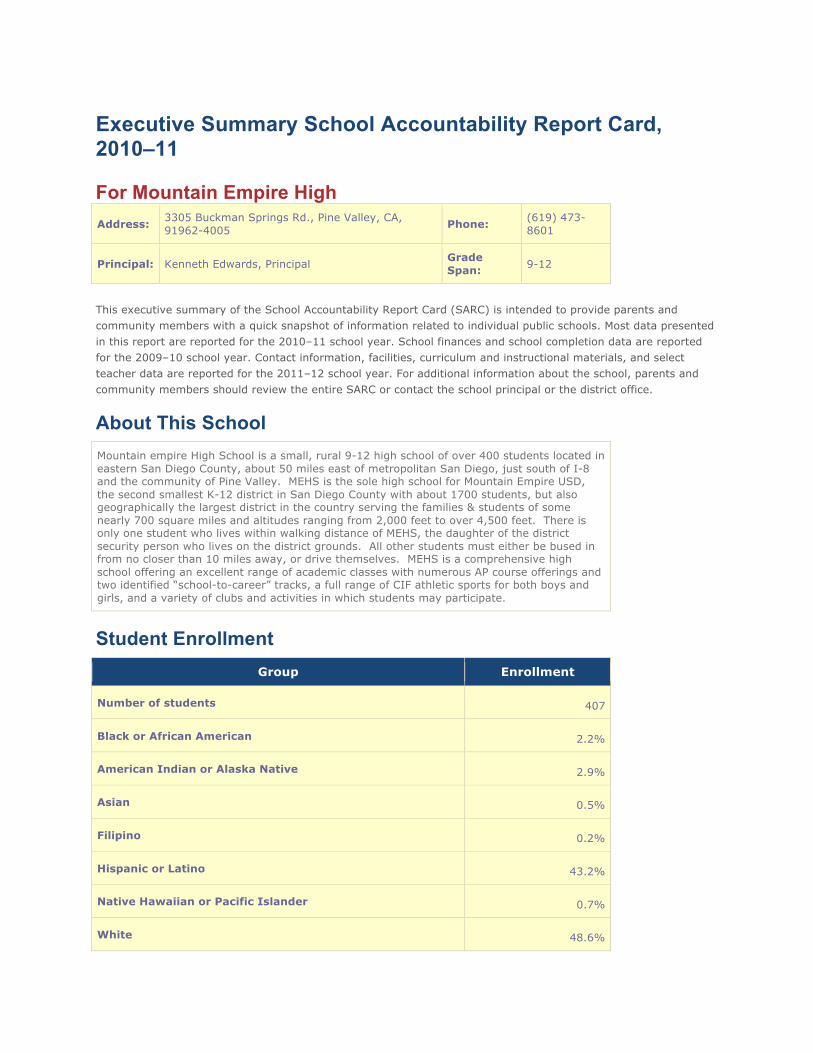
Executive Summary School Accountability Report Card, 2010–11
For Mountain Empire High Address: 3305 Buckman Springs Rd., Pine Valley, CA,
91962-4005 Phone: (619) 473-8601
Principal: Kenneth Edwards, Principal Grade Span: 9-12
This executive summary of the School Accountability Report Card (SARC) is intended to provide parents and community members with a quick snapshot of information related to individual public schools. Most data presented in this report are reported for the 2010–11 school year. School finances and school completion data are reported for the 2009–10 school year. Contact information, facilities, curriculum and instructional materials, and select teacher data are reported for the 2011–12 school year. For additional information about the school, parents and community members should review the entire SARC or contact the school principal or the district office.
About This School Mountain empire High School is a small, rural 9-12 high school of over 400 students located in eastern San Diego County, about 50 miles east of metropolitan San Diego, just south of I-8 and the community of Pine Valley. MEHS is the sole high school for Mountain Empire USD, the second smallest K-12 district in San Diego County with about 1700 students, but also geographically the largest district in the country serving the families & students of some nearly 700 square miles and altitudes ranging from 2,000 feet to over 4,500 feet. There is only one student who lives within walking distance of MEHS, the daughter of the district security person who lives on the district grounds. All other students must either be bused in from no closer than 10 miles away, or drive themselves. MEHS is a comprehensive high school offering an excellent range of academic classes with numerous AP course offerings and two identified “school-to-career” tracks, a full range of CIF athletic sports for both boys and girls, and a variety of clubs and activities in which students may participate.
Student Enrollment Group Enrollment
Number of students 407
Black or African American 2.2%
American Indian or Alaska Native 2.9%
Asian 0.5%
Filipino 0.2%
Hispanic or Latino 43.2%
Native Hawaiian or Pacific Islander 0.7%
White 48.6%
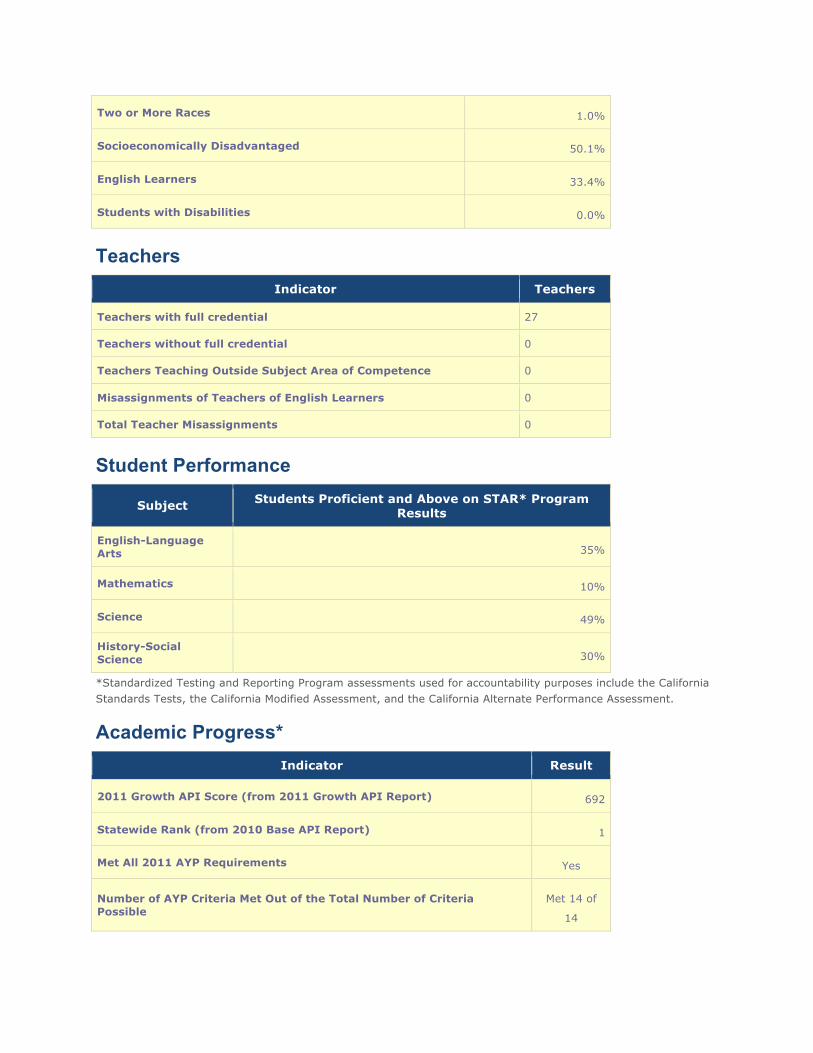
Two or More Races 1.0%
Socioeconomically Disadvantaged 50.1%
English Learners 33.4%
Students with Disabilities 0.0%
Teachers Indicator Teachers
Teachers with full credential 27
Teachers without full credential 0
Teachers Teaching Outside Subject Area of Competence 0
Misassignments of Teachers of English Learners 0
Total Teacher Misassignments 0
Student Performance
Subject Students Proficient and Above on STAR* Program Results
English-Language Arts 35%
Mathematics 10%
Science 49%
History-Social Science 30%
*Standardized Testing and Reporting Program assessments used for accountability purposes include the California Standards Tests, the California Modified Assessment, and the California Alternate Performance Assessment.
Academic Progress* Indicator Result
2011 Growth API Score (from 2011 Growth API Report) 692
Statewide Rank (from 2010 Base API Report) 1
Met All 2011 AYP Requirements Yes
Number of AYP Criteria Met Out of the Total Number of Criteria Possible
Met 14 of
14
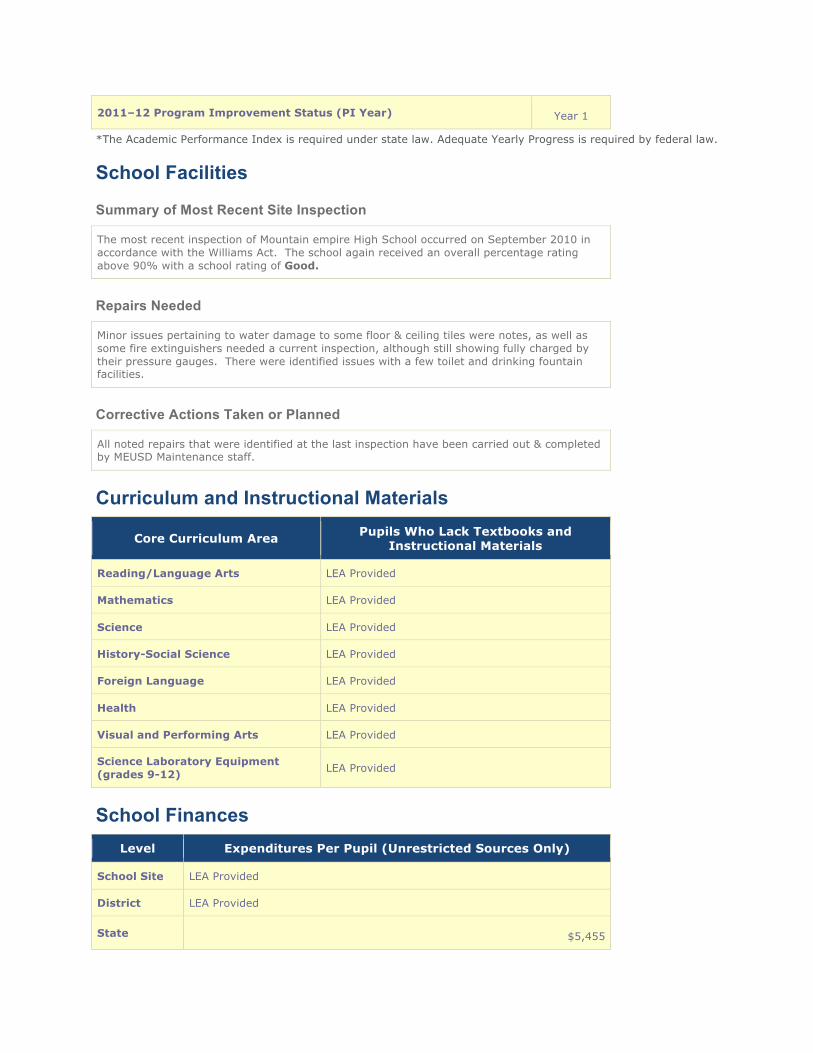
2011–12 Program Improvement Status (PI Year) Year 1
*The Academic Performance Index is required under state law. Adequate Yearly Progress is required by federal law.
School Facilities
Summary of Most Recent Site Inspection
The most recent inspection of Mountain empire High School occurred on September 2010 in accordance with the Williams Act. The school again received an overall percentage rating above 90% with a school rating of Good.
Repairs Needed
Minor issues pertaining to water damage to some floor & ceiling tiles were notes, as well as some fire extinguishers needed a current inspection, although still showing fully charged by their pressure gauges. There were identified issues with a few toilet and drinking fountain facilities.
Corrective Actions Taken or Planned
All noted repairs that were identified at the last inspection have been carried out & completed by MEUSD Maintenance staff.
Curriculum and Instructional Materials
Core Curriculum Area Pupils Who Lack Textbooks and Instructional Materials
Reading/Language Arts LEA Provided
Mathematics LEA Provided
Science LEA Provided
History-Social Science LEA Provided
Foreign Language LEA Provided
Health LEA Provided
Visual and Performing Arts LEA Provided
Science Laboratory Equipment (grades 9-12) LEA Provided
School Finances Level Expenditures Per Pupil (Unrestricted Sources Only)
School Site LEA Provided
District LEA Provided
State $5,455
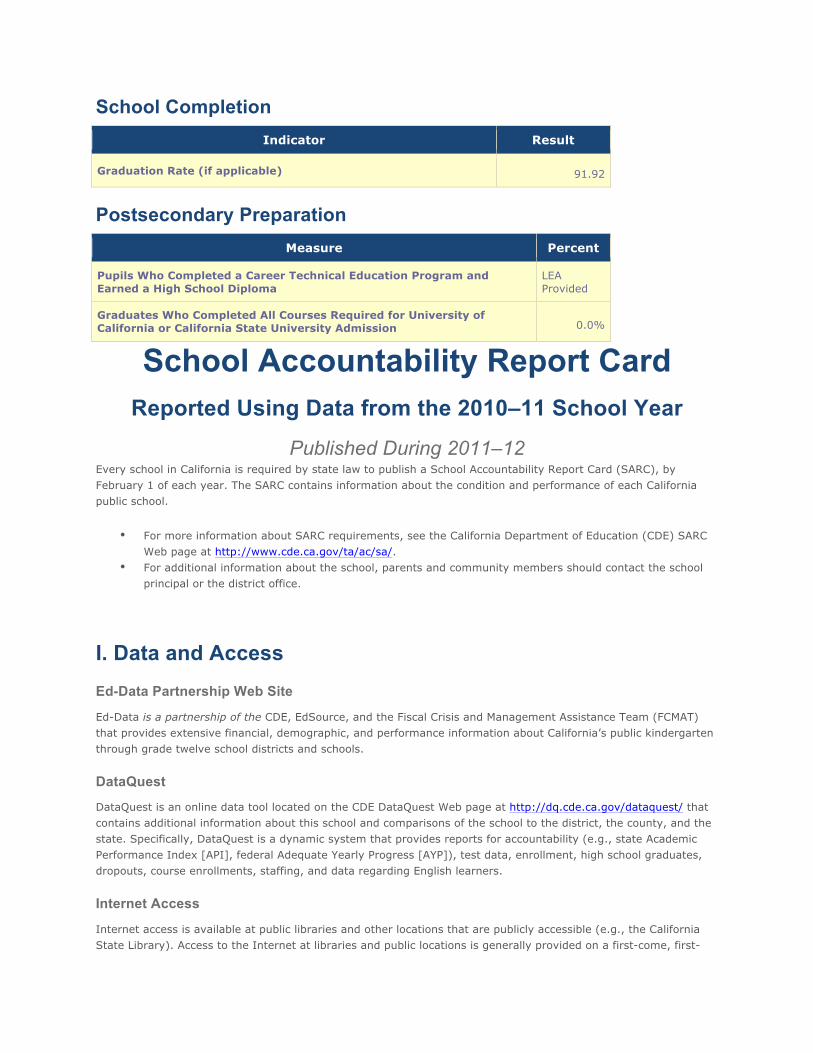
School Completion Indicator Result
Graduation Rate (if applicable) 91.92
Postsecondary Preparation Measure Percent
Pupils Who Completed a Career Technical Education Program and Earned a High School Diploma
LEA Provided
Graduates Who Completed All Courses Required for University of California or California State University Admission 0.0%
School Accountability Report Card
Reported Using Data from the 2010–11 School Year
Published During 2011–12 Every school in California is required by state law to publish a School Accountability Report Card (SARC), by February 1 of each year. The SARC contains information about the condition and performance of each California public school.
• For more information about SARC requirements, see the California Department of Education (CDE) SARC Web page at http://www.cde.ca.gov/ta/ac/sa/.
• For additional information about the school, parents and community members should contact the school principal or the district office.
I. Data and Access Ed-Data Partnership Web Site
Ed-Data is a partnership of the CDE, EdSource, and the Fiscal Crisis and Management Assistance Team (FCMAT) that provides extensive financial, demographic, and performance information about California’s public kindergarten through grade twelve school districts and schools.
DataQuest
DataQuest is an online data tool located on the CDE DataQuest Web page at http://dq.cde.ca.gov/dataquest/ that contains additional information about this school and comparisons of the school to the district, the county, and the state. Specifically, DataQuest is a dynamic system that provides reports for accountability (e.g., state Academic Performance Index [API], federal Adequate Yearly Progress [AYP]), test data, enrollment, high school graduates, dropouts, course enrollments, staffing, and data regarding English learners.
Internet Access
Internet access is available at public libraries and other locations that are publicly accessible (e.g., the California State Library). Access to the Internet at libraries and public locations is generally provided on a first-come, first-
served basis. Other use restrictions may include the hours of operation, the length of time that a workstation may be used (depending on availability), the types of software programs available on a workstation, and the ability to print documents.
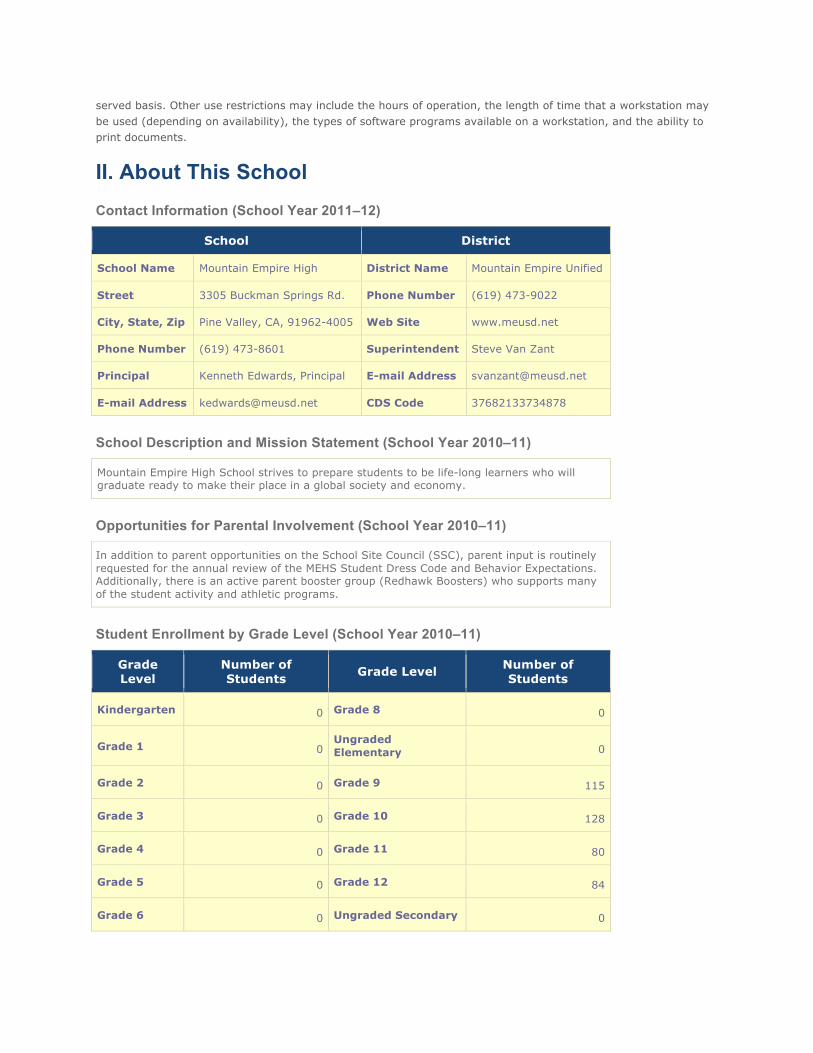
II. About This School Contact Information (School Year 2011–12)
School District
School Name Mountain Empire High District Name Mountain Empire Unified
Street 3305 Buckman Springs Rd. Phone Number (619) 473-9022
City, State, Zip Pine Valley, CA, 91962-4005 Web Site www.meusd.net
Phone Number (619) 473-8601 Superintendent Steve Van Zant
Principal Kenneth Edwards, Principal E-mail Address [email protected]
E-mail Address [email protected] CDS Code 37682133734878
School Description and Mission Statement (School Year 2010–11)
Mountain Empire High School strives to prepare students to be life-long learners who will graduate ready to make their place in a global society and economy.
Opportunities for Parental Involvement (School Year 2010–11)
In addition to parent opportunities on the School Site Council (SSC), parent input is routinely requested for the annual review of the MEHS Student Dress Code and Behavior Expectations. Additionally, there is an active parent booster group (Redhawk Boosters) who supports many of the student activity and athletic programs.
Student Enrollment by Grade Level (School Year 2010–11)
Grade Level
Number of Students Grade Level Number of
Students
Kindergarten 0 Grade 8 0
Grade 1 0 Ungraded Elementary 0
Grade 2 0 Grade 9 115
Grade 3 0 Grade 10 128
Grade 4 0 Grade 11 80
Grade 5 0 Grade 12 84
Grade 6 0 Ungraded Secondary 0
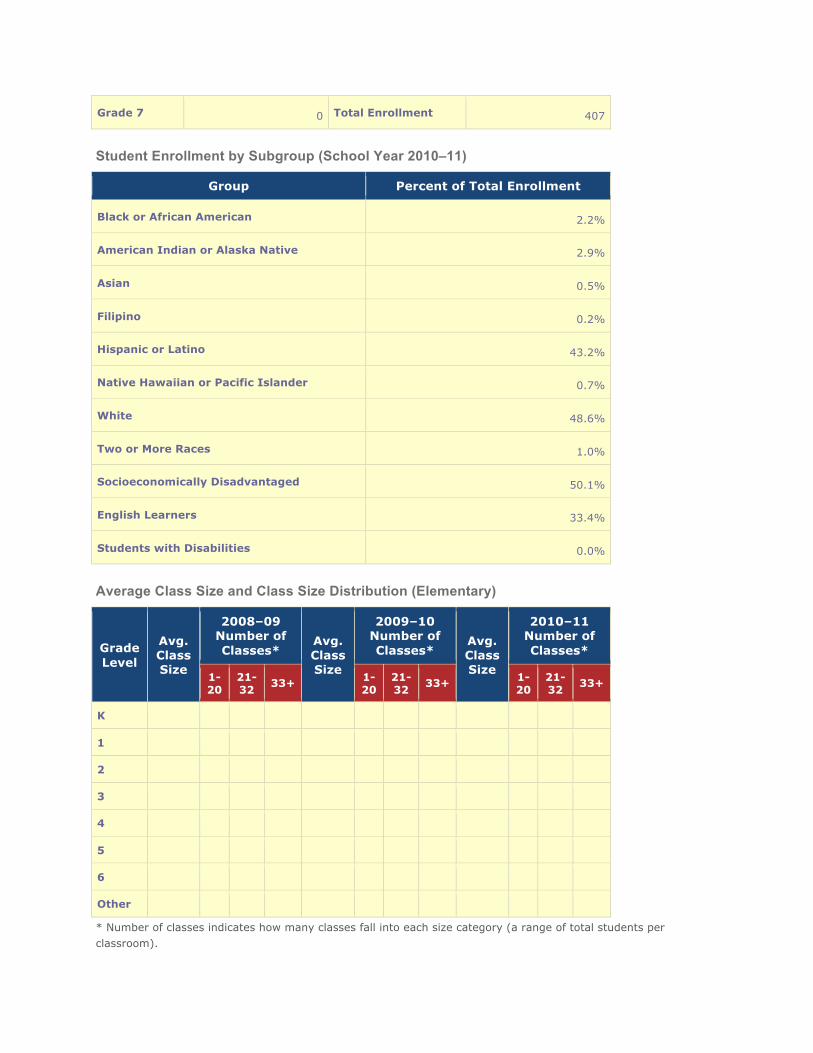
Grade 7 0 Total Enrollment 407
Student Enrollment by Subgroup (School Year 2010–11)
Group Percent of Total Enrollment
Black or African American 2.2%
American Indian or Alaska Native 2.9%
Asian 0.5%
Filipino 0.2%
Hispanic or Latino 43.2%
Native Hawaiian or Pacific Islander 0.7%
White 48.6%
Two or More Races 1.0%
Socioeconomically Disadvantaged 50.1%
English Learners 33.4%
Students with Disabilities 0.0%
Average Class Size and Class Size Distribution (Elementary)
Grade Level
Avg. Class Size
2008–09 Number of Classes*
Avg. Class Size
2009–10 Number of Classes*
Avg. Class Size
2010–11 Number of Classes*
1-20
21-32 33+ 1-
20 21-32 33+ 1-
20 21-32 33+
K
1
2
3
4
5
6
Other
* Number of classes indicates how many classes fall into each size category (a range of total students per classroom).
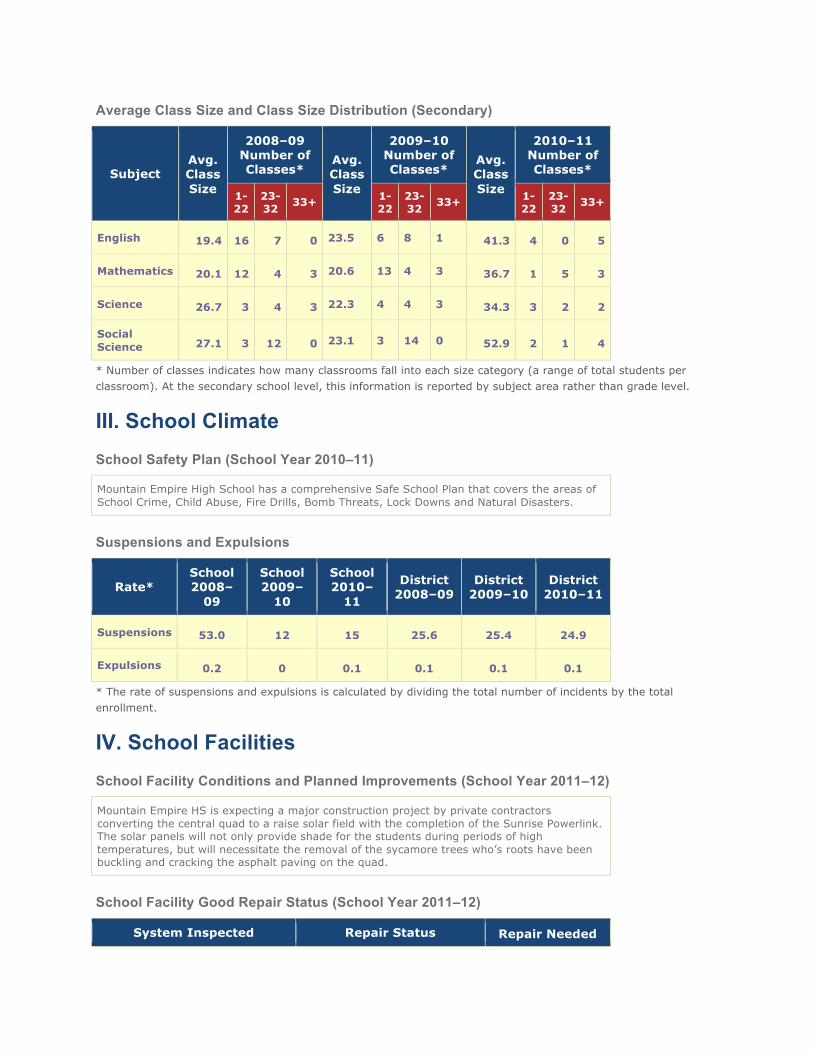
Average Class Size and Class Size Distribution (Secondary)
Subject Avg. Class Size
2008–09 Number of Classes*
Avg. Class Size
2009–10 Number of Classes*
Avg. Class Size
2010–11 Number of Classes*
1-22
23-32 33+ 1-
22 23-32 33+ 1-
22 23-32 33+
English 19.4 16 7 0 23.5 6 8 1 41.3 4 0 5
Mathematics 20.1 12 4 3 20.6 13 4 3 36.7 1 5 3
Science 26.7 3 4 3 22.3 4 4 3 34.3 3 2 2
Social Science 27.1 3 12 0 23.1 3 14 0 52.9 2 1 4
* Number of classes indicates how many classrooms fall into each size category (a range of total students per classroom). At the secondary school level, this information is reported by subject area rather than grade level.
III. School Climate School Safety Plan (School Year 2010–11)
Mountain Empire High School has a comprehensive Safe School Plan that covers the areas of School Crime, Child Abuse, Fire Drills, Bomb Threats, Lock Downs and Natural Disasters.
Suspensions and Expulsions
Rate* School 2008–
09
School 2009–
10
School 2010–
11
District 2008–09
District 2009–10
District 2010–11
Suspensions 53.0 12 15 25.6 25.4 24.9
Expulsions 0.2 0 0.1 0.1 0.1 0.1
* The rate of suspensions and expulsions is calculated by dividing the total number of incidents by the total enrollment.
IV. School Facilities School Facility Conditions and Planned Improvements (School Year 2011–12)
Mountain Empire HS is expecting a major construction project by private contractors converting the central quad to a raise solar field with the completion of the Sunrise Powerlink. The solar panels will not only provide shade for the students during periods of high temperatures, but will necessitate the removal of the sycamore trees who’s roots have been buckling and cracking the asphalt paving on the quad.
School Facility Good Repair Status (School Year 2011–12)
System Inspected Repair Status Repair Needed
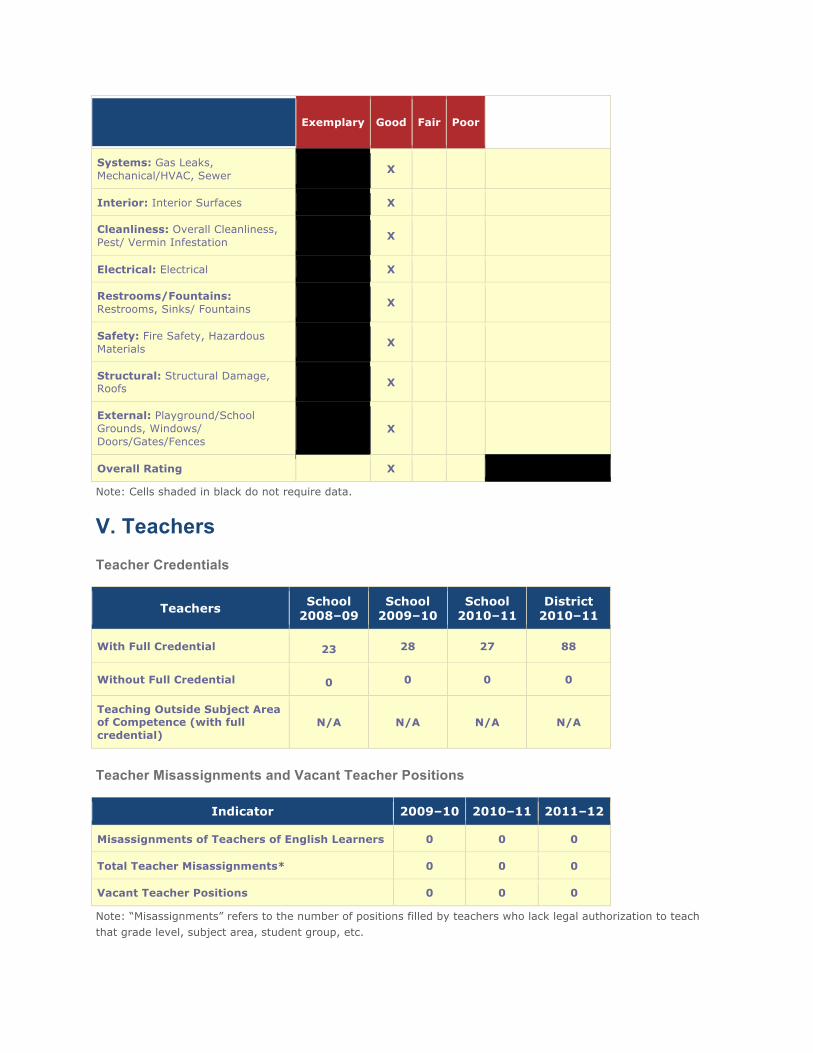
Exemplary Good Fair Poor and Action Taken or Planned
Systems: Gas Leaks, Mechanical/HVAC, Sewer
X
Interior: Interior Surfaces
X
Cleanliness: Overall Cleanliness, Pest/ Vermin Infestation
X
Electrical: Electrical
X
Restrooms/Fountains: Restrooms, Sinks/ Fountains
X
Safety: Fire Safety, Hazardous Materials
X
Structural: Structural Damage, Roofs
X
External: Playground/School Grounds, Windows/ Doors/Gates/Fences
X
Overall Rating
X
Note: Cells shaded in black do not require data.
V. Teachers Teacher Credentials
Teachers School
2008–09 School
2009–10 School
2010–11 District
2010–11
With Full Credential 23 28 27 88
Without Full Credential 0 0 0 0
Teaching Outside Subject Area of Competence (with full credential)
N/A N/A N/A N/A
Teacher Misassignments and Vacant Teacher Positions
Indicator 2009–10 2010–11 2011–12
Misassignments of Teachers of English Learners 0 0 0
Total Teacher Misassignments* 0 0 0
Vacant Teacher Positions 0 0 0
Note: “Misassignments” refers to the number of positions filled by teachers who lack legal authorization to teach that grade level, subject area, student group, etc.
* Total Teacher Misassignments includes the number of Misassignments of Teachers of English Learners.
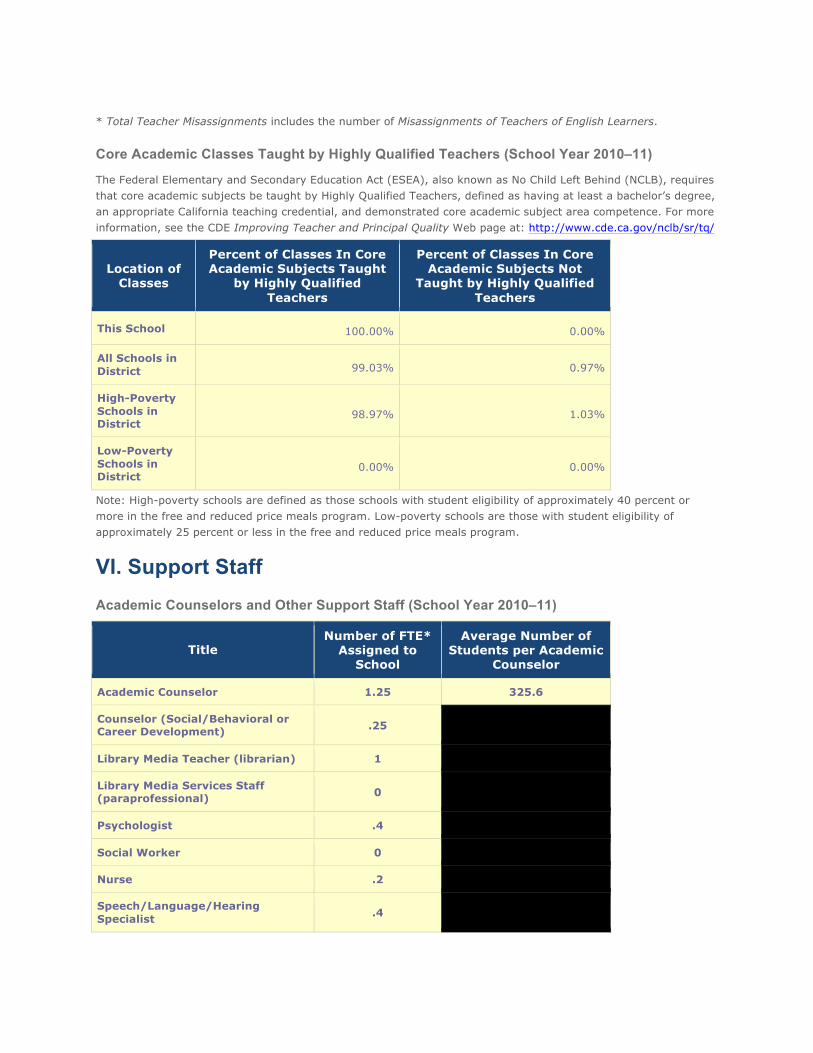
Core Academic Classes Taught by Highly Qualified Teachers (School Year 2010–11)
The Federal Elementary and Secondary Education Act (ESEA), also known as No Child Left Behind (NCLB), requires that core academic subjects be taught by Highly Qualified Teachers, defined as having at least a bachelor’s degree, an appropriate California teaching credential, and demonstrated core academic subject area competence. For more information, see the CDE Improving Teacher and Principal Quality Web page at: http://www.cde.ca.gov/nclb/sr/tq/
Location of Classes
Percent of Classes In Core Academic Subjects Taught
by Highly Qualified Teachers
Percent of Classes In Core Academic Subjects Not
Taught by Highly Qualified Teachers
This School 100.00% 0.00%
All Schools in District 99.03% 0.97%
High-Poverty Schools in District
98.97% 1.03%
Low-Poverty Schools in District
0.00% 0.00%
Note: High-poverty schools are defined as those schools with student eligibility of approximately 40 percent or more in the free and reduced price meals program. Low-poverty schools are those with student eligibility of approximately 25 percent or less in the free and reduced price meals program.
VI. Support Staff Academic Counselors and Other Support Staff (School Year 2010–11)
Title Number of FTE*
Assigned to School
Average Number of Students per Academic
Counselor
Academic Counselor 1.25 325.6
Counselor (Social/Behavioral or Career Development) .25
Library Media Teacher (librarian) 1
Library Media Services Staff (paraprofessional) 0
Psychologist .4
Social Worker 0
Nurse .2
Speech/Language/Hearing Specialist .4
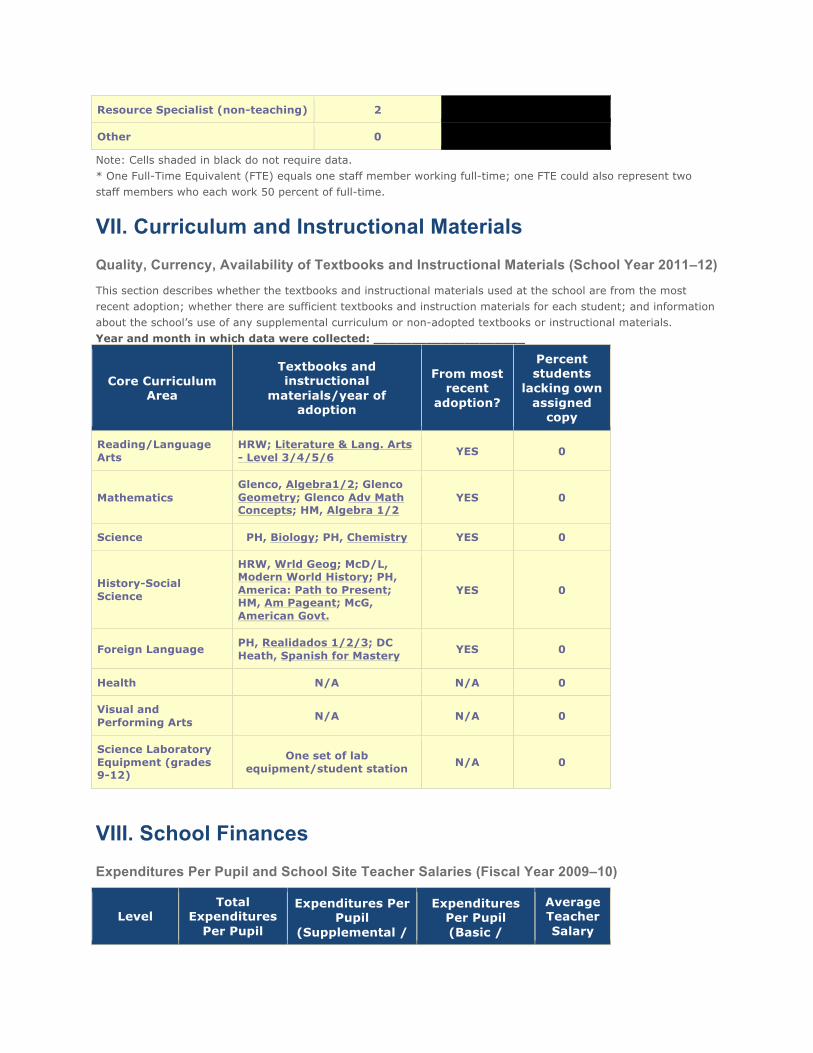
Resource Specialist (non-teaching) 2
Other 0
Note: Cells shaded in black do not require data. * One Full-Time Equivalent (FTE) equals one staff member working full-time; one FTE could also represent two staff members who each work 50 percent of full-time.
VII. Curriculum and Instructional Materials Quality, Currency, Availability of Textbooks and Instructional Materials (School Year 2011–12)
This section describes whether the textbooks and instructional materials used at the school are from the most recent adoption; whether there are sufficient textbooks and instruction materials for each student; and information about the school’s use of any supplemental curriculum or non-adopted textbooks or instructional materials. Year and month in which data were collected: ____________________
Core Curriculum Area
Textbooks and instructional
materials/year of adoption
From most recent
adoption?
Percent students
lacking own assigned
copy
Reading/Language Arts
HRW; Literature & Lang. Arts - Level 3/4/5/6 YES 0
Mathematics Glenco, Algebra1/2; Glenco Geometry; Glenco Adv Math Concepts; HM, Algebra 1/2
YES 0
Science PH, Biology; PH, Chemistry YES 0
History-Social Science
HRW, Wrld Geog; McD/L, Modern World History; PH, America: Path to Present; HM, Am Pageant; McG, American Govt.
YES 0
Foreign Language PH, Realidados 1/2/3; DC Heath, Spanish for Mastery YES 0
Health N/A N/A 0
Visual and Performing Arts N/A N/A 0
Science Laboratory Equipment (grades 9-12)
One set of lab equipment/student station N/A 0
VIII. School Finances Expenditures Per Pupil and School Site Teacher Salaries (Fiscal Year 2009–10)
Level Total
Expenditures Per Pupil
Expenditures Per Pupil
(Supplemental /
Expenditures Per Pupil (Basic /
Average Teacher Salary
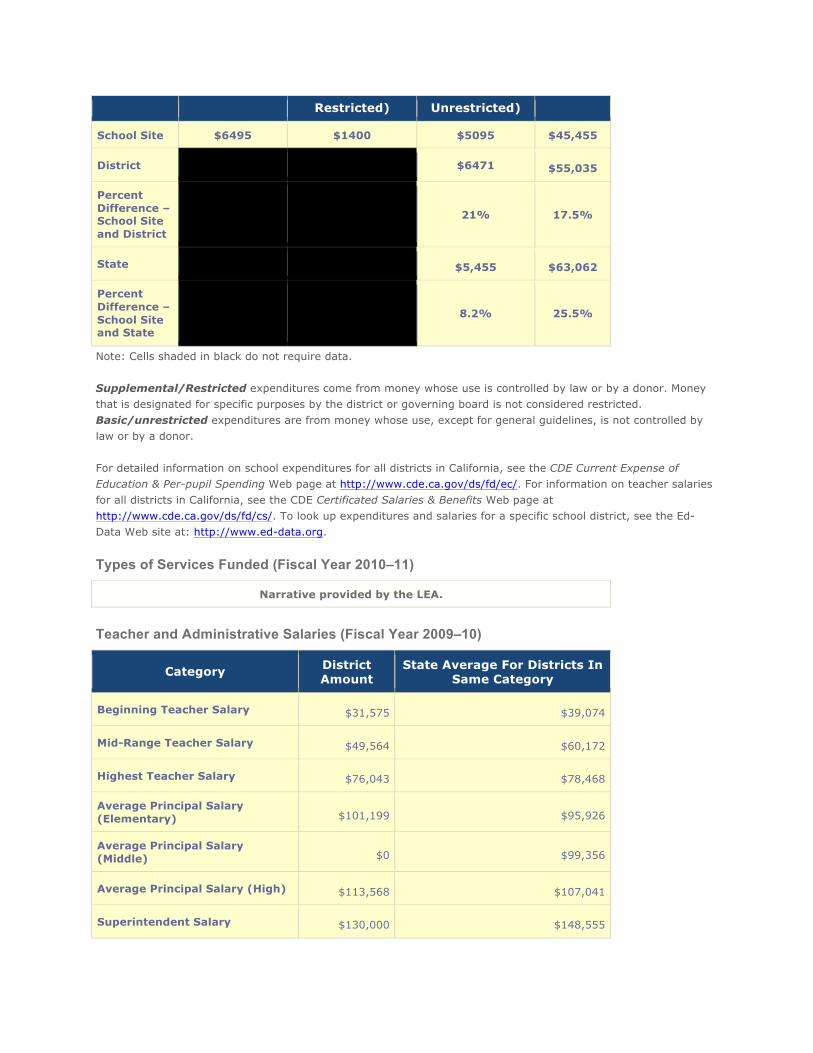
Restricted) Unrestricted)
School Site $6495 $1400 $5095 $45,455
District
$6471 $55,035
Percent Difference – School Site and District
21% 17.5%
State $5,455 $63,062
Percent Difference – School Site and State
8.2% 25.5%
Note: Cells shaded in black do not require data. Supplemental/Restricted expenditures come from money whose use is controlled by law or by a donor. Money that is designated for specific purposes by the district or governing board is not considered restricted. Basic/unrestricted expenditures are from money whose use, except for general guidelines, is not controlled by law or by a donor. For detailed information on school expenditures for all districts in California, see the CDE Current Expense of Education & Per-pupil Spending Web page at http://www.cde.ca.gov/ds/fd/ec/. For information on teacher salaries for all districts in California, see the CDE Certificated Salaries & Benefits Web page at http://www.cde.ca.gov/ds/fd/cs/. To look up expenditures and salaries for a specific school district, see the Ed-Data Web site at: http://www.ed-data.org.
Types of Services Funded (Fiscal Year 2010–11)
Narrative provided by the LEA.
Teacher and Administrative Salaries (Fiscal Year 2009–10)
Category District Amount
State Average For Districts In Same Category
Beginning Teacher Salary $31,575 $39,074
Mid-Range Teacher Salary $49,564 $60,172
Highest Teacher Salary $76,043 $78,468
Average Principal Salary (Elementary) $101,199 $95,926
Average Principal Salary (Middle) $0 $99,356
Average Principal Salary (High) $113,568 $107,041
Superintendent Salary $130,000 $148,555
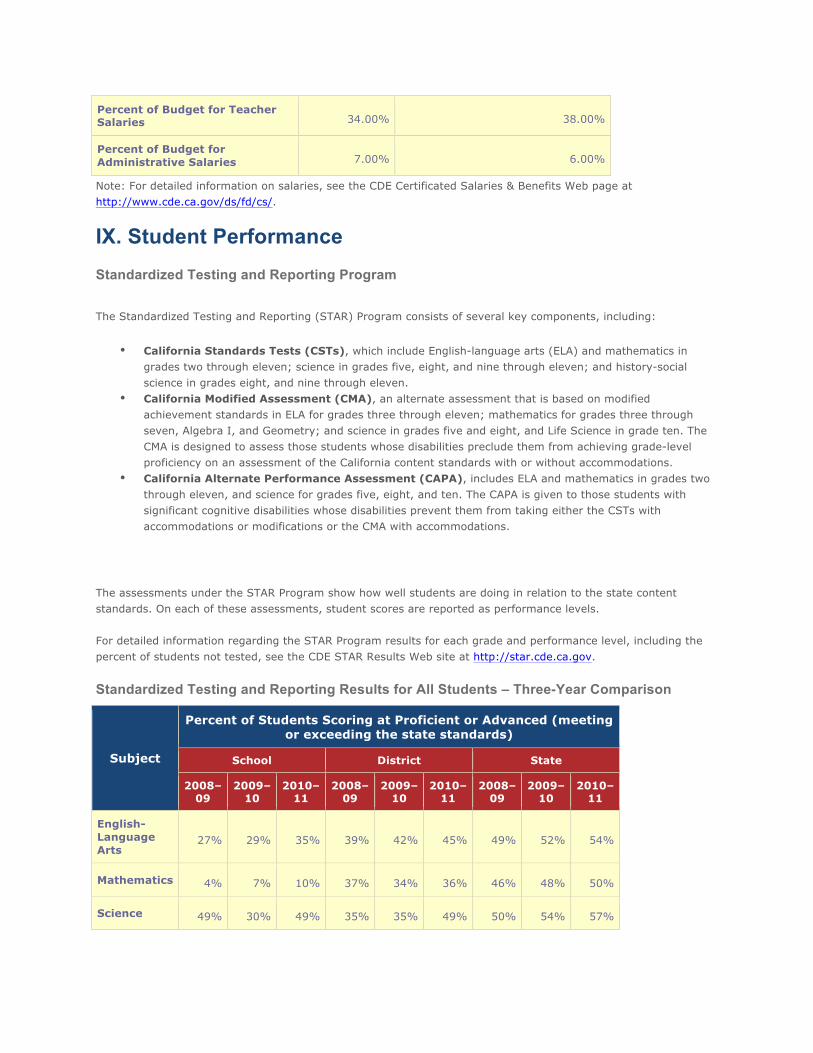
Percent of Budget for Teacher Salaries 34.00% 38.00%
Percent of Budget for Administrative Salaries 7.00% 6.00%
Note: For detailed information on salaries, see the CDE Certificated Salaries & Benefits Web page at http://www.cde.ca.gov/ds/fd/cs/.
IX. Student Performance Standardized Testing and Reporting Program
The Standardized Testing and Reporting (STAR) Program consists of several key components, including:
• California Standards Tests (CSTs), which include English-language arts (ELA) and mathematics in grades two through eleven; science in grades five, eight, and nine through eleven; and history-social science in grades eight, and nine through eleven.
• California Modified Assessment (CMA), an alternate assessment that is based on modified achievement standards in ELA for grades three through eleven; mathematics for grades three through seven, Algebra I, and Geometry; and science in grades five and eight, and Life Science in grade ten. The CMA is designed to assess those students whose disabilities preclude them from achieving grade-level proficiency on an assessment of the California content standards with or without accommodations.
• California Alternate Performance Assessment (CAPA), includes ELA and mathematics in grades two through eleven, and science for grades five, eight, and ten. The CAPA is given to those students with significant cognitive disabilities whose disabilities prevent them from taking either the CSTs with accommodations or modifications or the CMA with accommodations.
The assessments under the STAR Program show how well students are doing in relation to the state content standards. On each of these assessments, student scores are reported as performance levels. For detailed information regarding the STAR Program results for each grade and performance level, including the percent of students not tested, see the CDE STAR Results Web site at http://star.cde.ca.gov.
Standardized Testing and Reporting Results for All Students – Three-Year Comparison
Subject
Percent of Students Scoring at Proficient or Advanced (meeting or exceeding the state standards)
School District State
2008–09
2009–10
2010–11
2008–09
2009–10
2010–11
2008–09
2009–10
2010–11
English-Language Arts
27% 29% 35% 39% 42% 45% 49% 52% 54%
Mathematics 4% 7% 10% 37% 34% 36% 46% 48% 50%
Science 49% 30% 49% 35% 35% 49% 50% 54% 57%
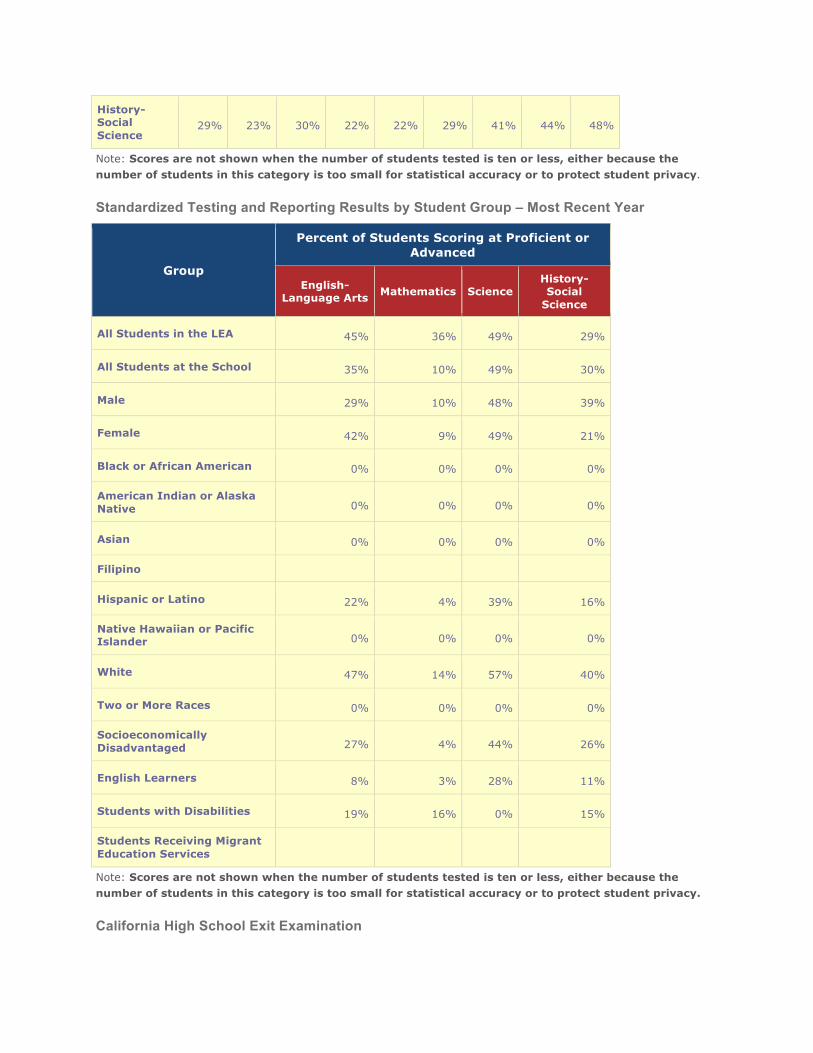
History-Social Science
29% 23% 30% 22% 22% 29% 41% 44% 48%
Note: Scores are not shown when the number of students tested is ten or less, either because the number of students in this category is too small for statistical accuracy or to protect student privacy.
Standardized Testing and Reporting Results by Student Group – Most Recent Year
Group
Percent of Students Scoring at Proficient or Advanced
English- Language Arts Mathematics Science
History- Social
Science
All Students in the LEA 45% 36% 49% 29%
All Students at the School 35% 10% 49% 30%
Male 29% 10% 48% 39%
Female 42% 9% 49% 21%
Black or African American 0% 0% 0% 0%
American Indian or Alaska Native 0% 0% 0% 0%
Asian 0% 0% 0% 0%
Filipino
Hispanic or Latino 22% 4% 39% 16%
Native Hawaiian or Pacific Islander 0% 0% 0% 0%
White 47% 14% 57% 40%
Two or More Races 0% 0% 0% 0%
Socioeconomically Disadvantaged 27% 4% 44% 26%
English Learners 8% 3% 28% 11%
Students with Disabilities 19% 16% 0% 15%
Students Receiving Migrant Education Services
Note: Scores are not shown when the number of students tested is ten or less, either because the number of students in this category is too small for statistical accuracy or to protect student privacy.
California High School Exit Examination
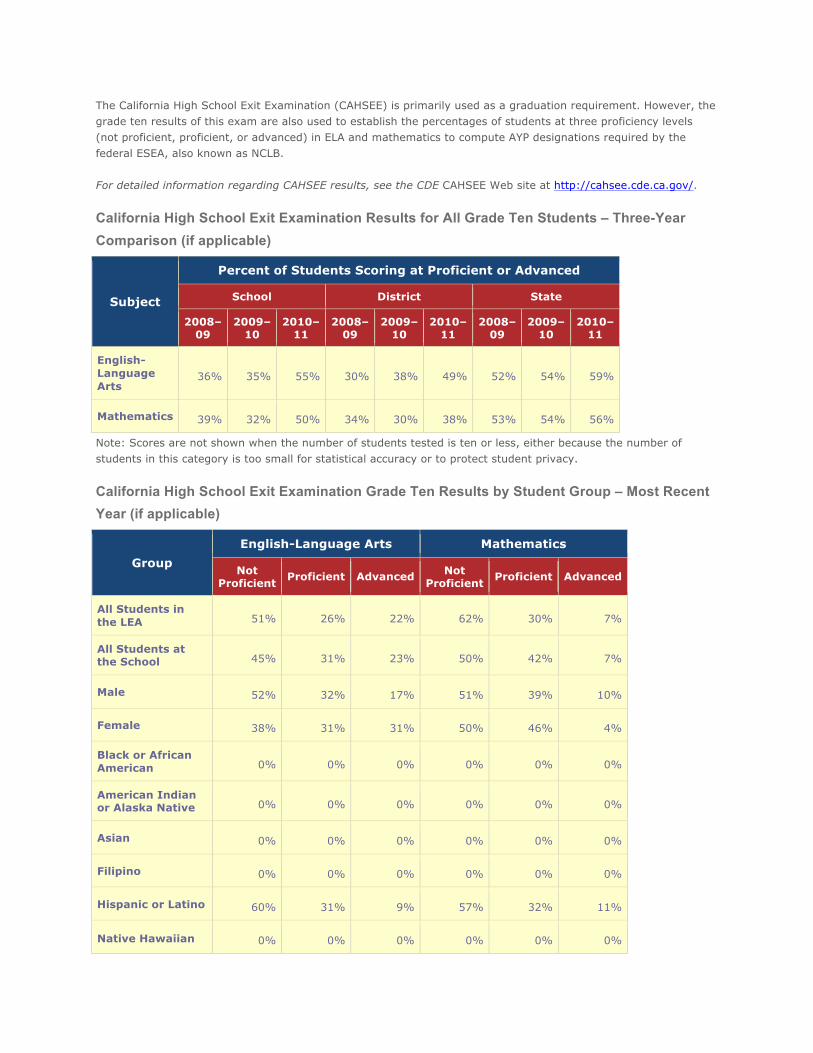
The California High School Exit Examination (CAHSEE) is primarily used as a graduation requirement. However, the grade ten results of this exam are also used to establish the percentages of students at three proficiency levels (not proficient, proficient, or advanced) in ELA and mathematics to compute AYP designations required by the federal ESEA, also known as NCLB. For detailed information regarding CAHSEE results, see the CDE CAHSEE Web site at http://cahsee.cde.ca.gov/.
California High School Exit Examination Results for All Grade Ten Students – Three-Year Comparison (if applicable)
Subject
Percent of Students Scoring at Proficient or Advanced
School District State
2008–09
2009–10
2010–11
2008–09
2009–10
2010–11
2008–09
2009–10
2010–11
English-Language Arts
36% 35% 55% 30% 38% 49% 52% 54% 59%
Mathematics 39% 32% 50% 34% 30% 38% 53% 54% 56%
Note: Scores are not shown when the number of students tested is ten or less, either because the number of students in this category is too small for statistical accuracy or to protect student privacy.
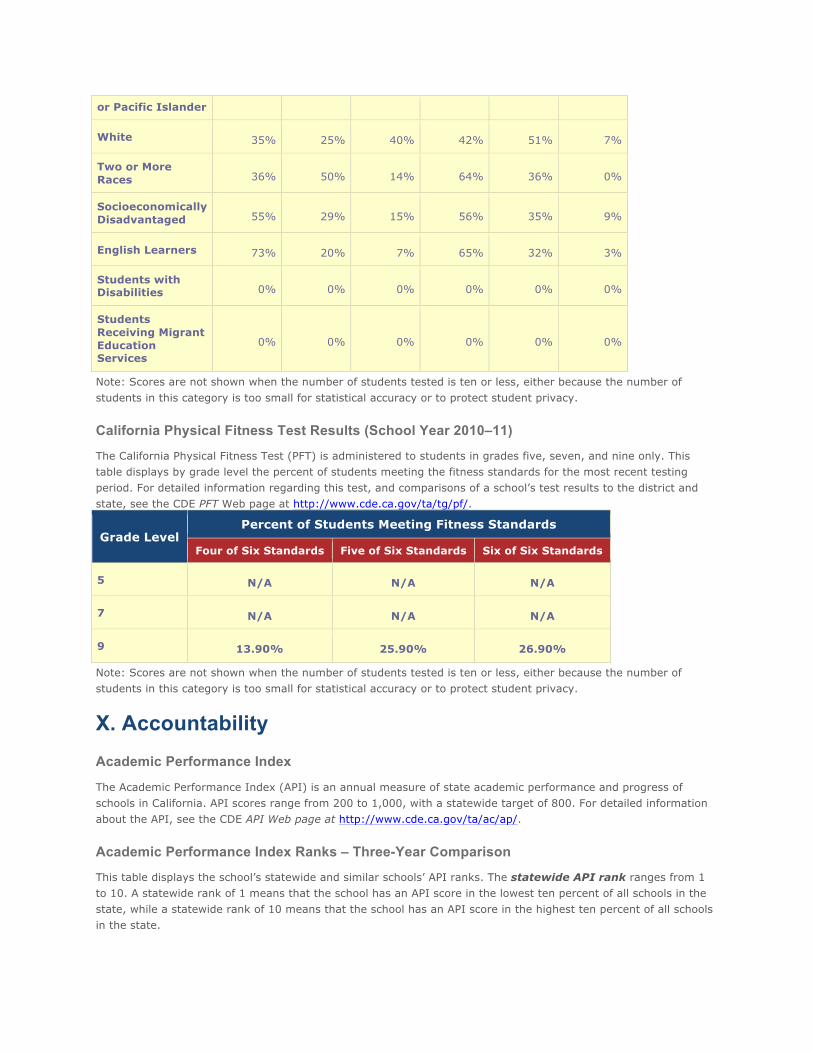
California High School Exit Examination Grade Ten Results by Student Group – Most Recent Year (if applicable)
Group English-Language Arts Mathematics
Not Proficient Proficient Advanced Not
Proficient Proficient Advanced
All Students in the LEA 51% 26% 22% 62% 30% 7%
All Students at the School 45% 31% 23% 50% 42% 7%
Male 52% 32% 17% 51% 39% 10%
Female 38% 31% 31% 50% 46% 4%
Black or African American 0% 0% 0% 0% 0% 0%
American Indian or Alaska Native 0% 0% 0% 0% 0% 0%
Asian 0% 0% 0% 0% 0% 0%
Filipino 0% 0% 0% 0% 0% 0%
Hispanic or Latino 60% 31% 9% 57% 32% 11%
Native Hawaiian 0% 0% 0% 0% 0% 0%
or Pacific Islander
White 35% 25% 40% 42% 51% 7%
Two or More Races 36% 50% 14% 64% 36% 0%
Socioeconomically Disadvantaged 55% 29% 15% 56% 35% 9%
English Learners 73% 20% 7% 65% 32% 3%
Students with Disabilities 0% 0% 0% 0% 0% 0%
Students Receiving Migrant Education Services
0% 0% 0% 0% 0% 0%
Note: Scores are not shown when the number of students tested is ten or less, either because the number of students in this category is too small for statistical accuracy or to protect student privacy.
California Physical Fitness Test Results (School Year 2010–11)
The California Physical Fitness Test (PFT) is administered to students in grades five, seven, and nine only. This table displays by grade level the percent of students meeting the fitness standards for the most recent testing period. For detailed information regarding this test, and comparisons of a school’s test results to the district and state, see the CDE PFT Web page at http://www.cde.ca.gov/ta/tg/pf/.
Grade Level Percent of Students Meeting Fitness Standards
Four of Six Standards Five of Six Standards Six of Six Standards
5 N/A N/A N/A
7 N/A N/A N/A
9 13.90% 25.90% 26.90%
Note: Scores are not shown when the number of students tested is ten or less, either because the number of students in this category is too small for statistical accuracy or to protect student privacy.
X. Accountability Academic Performance Index
The Academic Performance Index (API) is an annual measure of state academic performance and progress of schools in California. API scores range from 200 to 1,000, with a statewide target of 800. For detailed information about the API, see the CDE API Web page at http://www.cde.ca.gov/ta/ac/ap/.
Academic Performance Index Ranks – Three-Year Comparison
This table displays the school’s statewide and similar schools’ API ranks. The statewide API rank ranges from 1 to 10. A statewide rank of 1 means that the school has an API score in the lowest ten percent of all schools in the state, while a statewide rank of 10 means that the school has an API score in the highest ten percent of all schools in the state.
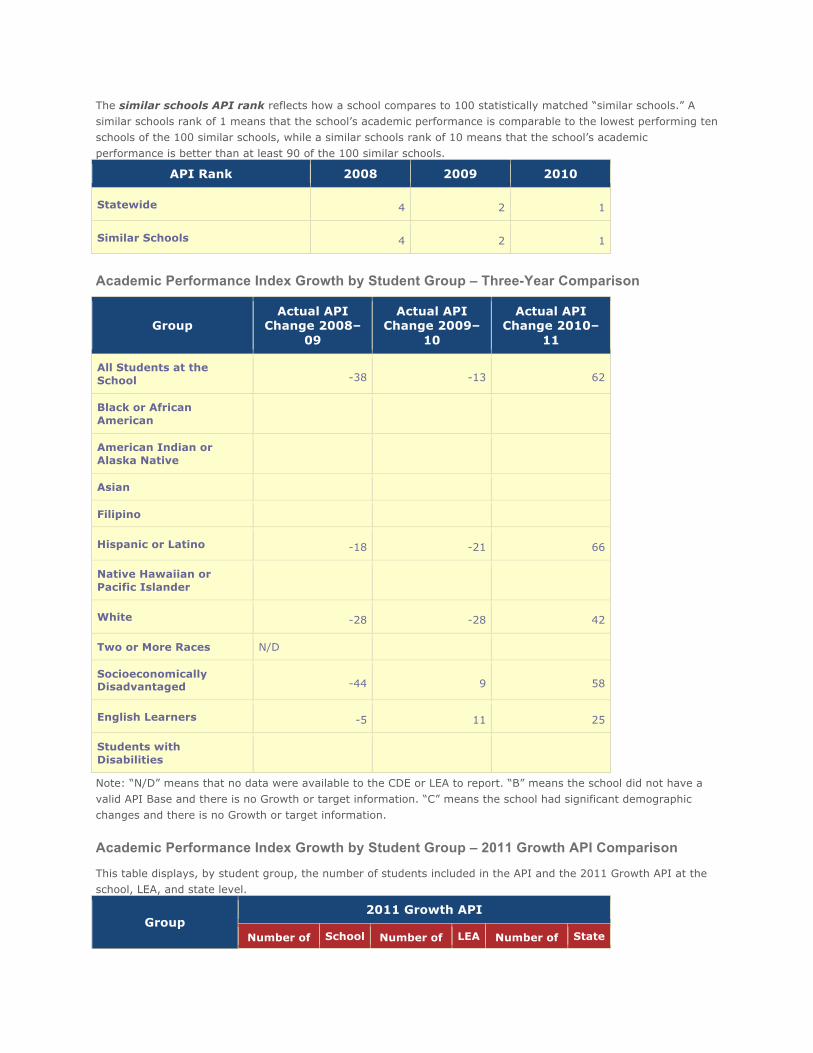
The similar schools API rank reflects how a school compares to 100 statistically matched “similar schools.” A similar schools rank of 1 means that the school’s academic performance is comparable to the lowest performing ten schools of the 100 similar schools, while a similar schools rank of 10 means that the school’s academic performance is better than at least 90 of the 100 similar schools.
API Rank 2008 2009 2010
Statewide 4 2 1
Similar Schools 4 2 1
Academic Performance Index Growth by Student Group – Three-Year Comparison
Group Actual API
Change 2008–09
Actual API Change 2009–
10
Actual API Change 2010–
11
All Students at the School -38 -13 62
Black or African American
American Indian or Alaska Native
Asian
Filipino
Hispanic or Latino -18 -21 66
Native Hawaiian or Pacific Islander
White -28 -28 42
Two or More Races N/D
Socioeconomically Disadvantaged -44 9 58
English Learners -5 11 25
Students with Disabilities
Note: “N/D” means that no data were available to the CDE or LEA to report. “B” means the school did not have a valid API Base and there is no Growth or target information. “C” means the school had significant demographic changes and there is no Growth or target information.
Academic Performance Index Growth by Student Group – 2011 Growth API Comparison
This table displays, by student group, the number of students included in the API and the 2011 Growth API at the school, LEA, and state level.
Group 2011 Growth API
Number of School Number of LEA Number of State
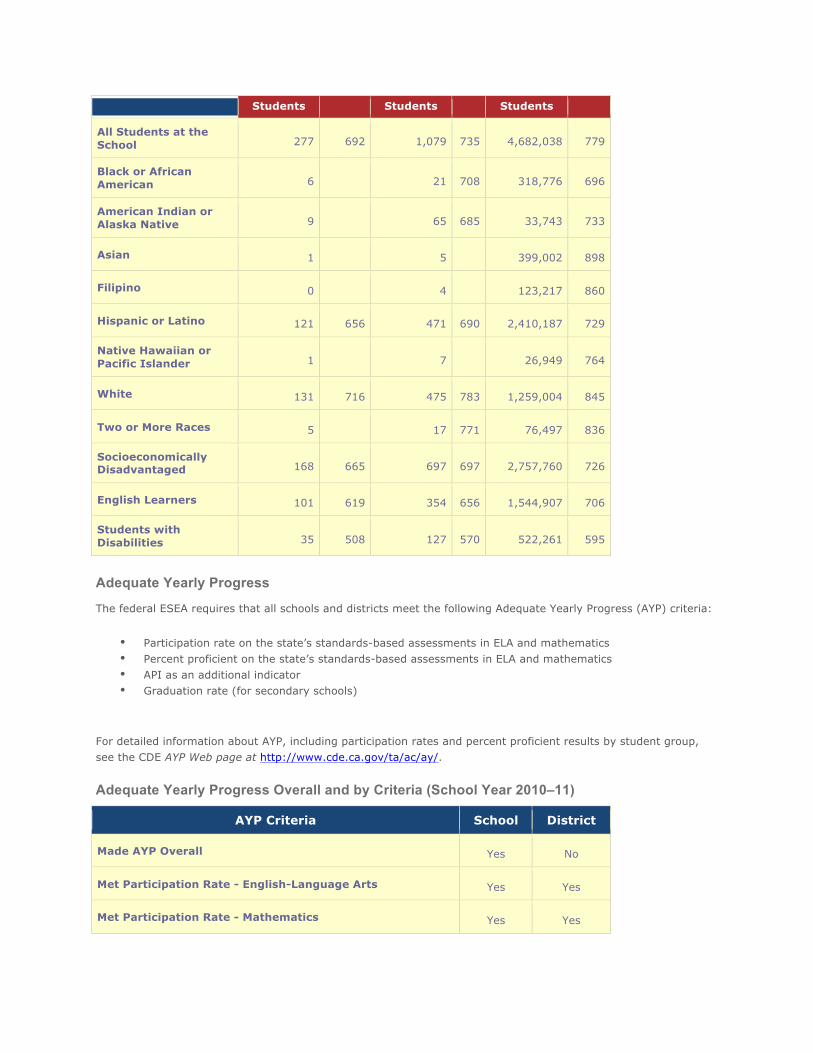
Students Students Students
All Students at the School 277 692 1,079 735 4,682,038 779
Black or African American 6
21 708 318,776 696
American Indian or Alaska Native 9
65 685 33,743 733
Asian 1
5
399,002 898
Filipino 0
4
123,217 860
Hispanic or Latino 121 656 471 690 2,410,187 729
Native Hawaiian or Pacific Islander 1
7
26,949 764
White 131 716 475 783 1,259,004 845
Two or More Races 5
17 771 76,497 836
Socioeconomically Disadvantaged 168 665 697 697 2,757,760 726
English Learners 101 619 354 656 1,544,907 706
Students with Disabilities 35 508 127 570 522,261 595
Adequate Yearly Progress
The federal ESEA requires that all schools and districts meet the following Adequate Yearly Progress (AYP) criteria:
• Participation rate on the state’s standards-based assessments in ELA and mathematics • Percent proficient on the state’s standards-based assessments in ELA and mathematics • API as an additional indicator • Graduation rate (for secondary schools)
For detailed information about AYP, including participation rates and percent proficient results by student group, see the CDE AYP Web page at http://www.cde.ca.gov/ta/ac/ay/.
Adequate Yearly Progress Overall and by Criteria (School Year 2010–11)
AYP Criteria School District
Made AYP Overall Yes No
Met Participation Rate - English-Language Arts Yes Yes
Met Participation Rate - Mathematics Yes Yes
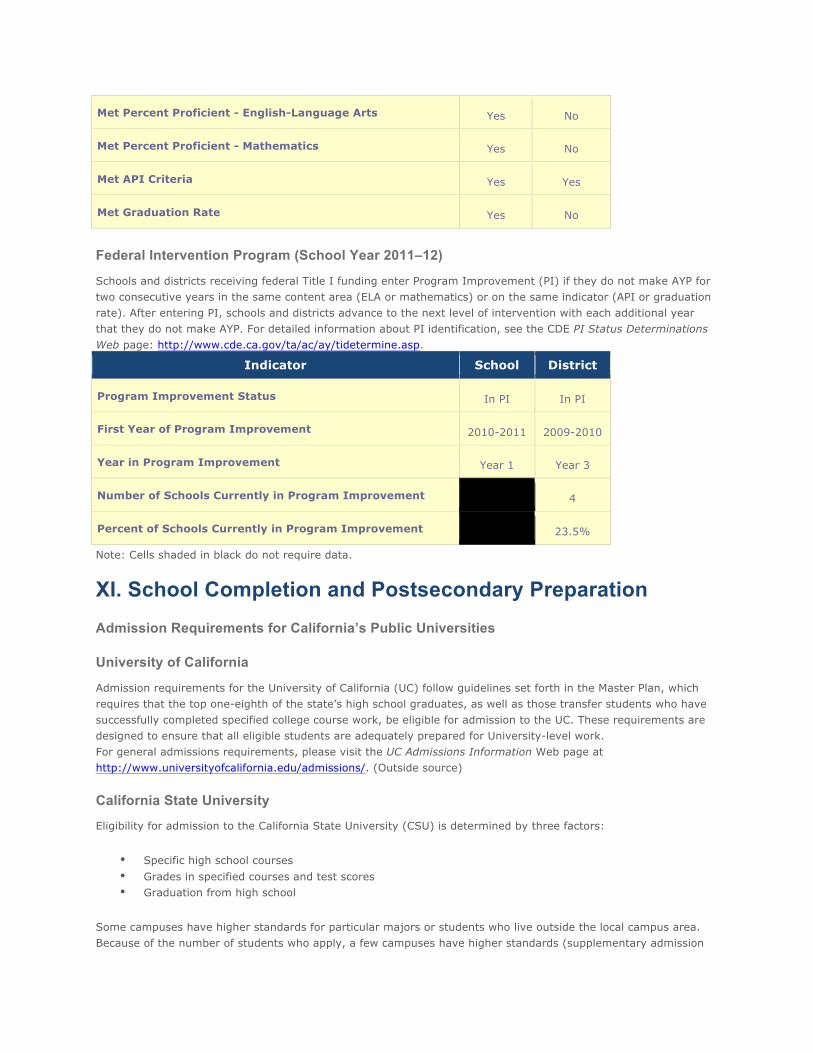
Met Percent Proficient - English-Language Arts Yes No
Met Percent Proficient - Mathematics Yes No
Met API Criteria Yes Yes
Met Graduation Rate Yes No
Federal Intervention Program (School Year 2011–12)
Schools and districts receiving federal Title I funding enter Program Improvement (PI) if they do not make AYP for two consecutive years in the same content area (ELA or mathematics) or on the same indicator (API or graduation rate). After entering PI, schools and districts advance to the next level of intervention with each additional year that they do not make AYP. For detailed information about PI identification, see the CDE PI Status Determinations Web page: http://www.cde.ca.gov/ta/ac/ay/tidetermine.asp.
Indicator School District
Program Improvement Status In PI In PI
First Year of Program Improvement 2010-2011 2009-2010
Year in Program Improvement Year 1 Year 3
Number of Schools Currently in Program Improvement 4
Percent of Schools Currently in Program Improvement 23.5%
Note: Cells shaded in black do not require data.
XI. School Completion and Postsecondary Preparation Admission Requirements for California’s Public Universities
University of California
Admission requirements for the University of California (UC) follow guidelines set forth in the Master Plan, which requires that the top one-eighth of the state’s high school graduates, as well as those transfer students who have successfully completed specified college course work, be eligible for admission to the UC. These requirements are designed to ensure that all eligible students are adequately prepared for University-level work. For general admissions requirements, please visit the UC Admissions Information Web page at http://www.universityofcalifornia.edu/admissions/. (Outside source)
California State University
Eligibility for admission to the California State University (CSU) is determined by three factors:
• Specific high school courses • Grades in specified courses and test scores • Graduation from high school
Some campuses have higher standards for particular majors or students who live outside the local campus area. Because of the number of students who apply, a few campuses have higher standards (supplementary admission
criteria) for all applicants. Most CSU campuses have local admission guarantee policies for students who graduate or transfer from high schools and colleges that are historically served by a CSU campus in that region. For admission, application, and fee information see the CSU Web page at http://www.calstate.edu/admission/admission.shtml. (Outside source)
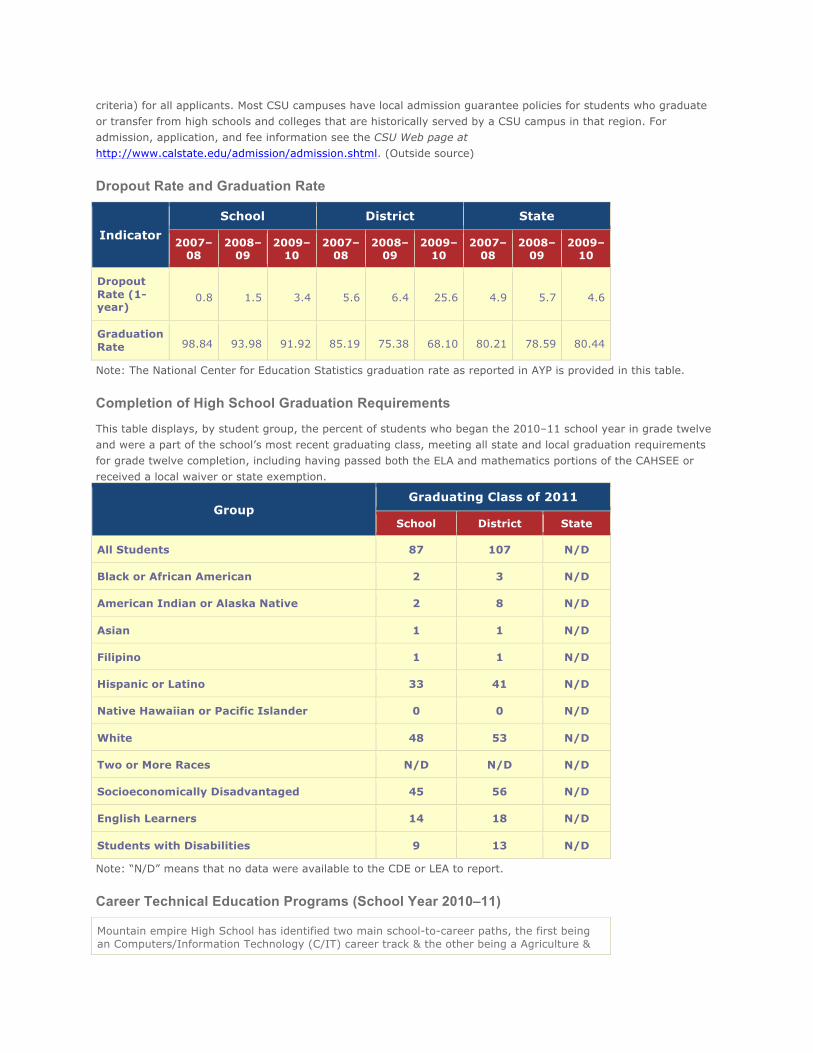
Dropout Rate and Graduation Rate
Indicator School District State
2007–08
2008–09
2009–10
2007–08
2008–09
2009–10
2007–08
2008–09
2009–10
Dropout Rate (1-year)
0.8 1.5 3.4 5.6 6.4 25.6 4.9 5.7 4.6
Graduation Rate 98.84 93.98 91.92 85.19 75.38 68.10 80.21 78.59 80.44
Note: The National Center for Education Statistics graduation rate as reported in AYP is provided in this table.
Completion of High School Graduation Requirements
This table displays, by student group, the percent of students who began the 2010–11 school year in grade twelve and were a part of the school’s most recent graduating class, meeting all state and local graduation requirements for grade twelve completion, including having passed both the ELA and mathematics portions of the CAHSEE or received a local waiver or state exemption.
Group Graduating Class of 2011
School District State
All Students 87 107 N/D
Black or African American 2 3 N/D
American Indian or Alaska Native 2 8 N/D
Asian 1 1 N/D
Filipino 1 1 N/D
Hispanic or Latino 33 41 N/D
Native Hawaiian or Pacific Islander 0 0 N/D
White 48 53 N/D
Two or More Races N/D N/D N/D
Socioeconomically Disadvantaged 45 56 N/D
English Learners 14 18 N/D
Students with Disabilities 9 13 N/D
Note: “N/D” means that no data were available to the CDE or LEA to report.
Career Technical Education Programs (School Year 2010–11)
Mountain empire High School has identified two main school-to-career paths, the first being an Computers/Information Technology (C/IT) career track & the other being a Agriculture &
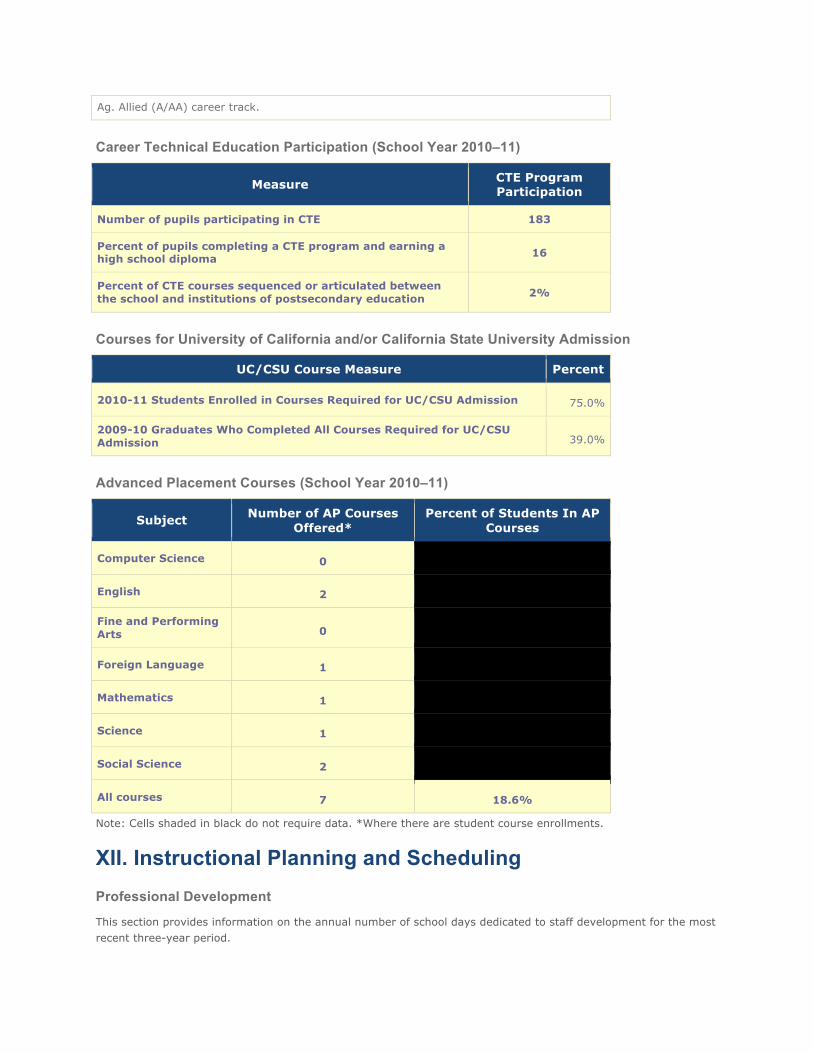
Ag. Allied (A/AA) career track.
Career Technical Education Participation (School Year 2010–11)
Measure CTE Program Participation
Number of pupils participating in CTE 183
Percent of pupils completing a CTE program and earning a high school diploma 16
Percent of CTE courses sequenced or articulated between the school and institutions of postsecondary education 2%
Courses for University of California and/or California State University Admission
UC/CSU Course Measure Percent
2010-11 Students Enrolled in Courses Required for UC/CSU Admission 75.0%
2009-10 Graduates Who Completed All Courses Required for UC/CSU Admission 39.0%
Advanced Placement Courses (School Year 2010–11)
Subject Number of AP Courses Offered*
Percent of Students In AP Courses
Computer Science 0
English 2
Fine and Performing Arts 0
Foreign Language 1
Mathematics 1
Science 1
Social Science 2
All courses 7 18.6%
Note: Cells shaded in black do not require data. *Where there are student course enrollments.
XII. Instructional Planning and Scheduling Professional Development
This section provides information on the annual number of school days dedicated to staff development for the most recent three-year period.
MEUSD provides eight minimum school days within each school year for staff professional development. MEHS staff has been using the staff development days this year to finalize the school self-study for their upcoming WASC accreditation visit. They have also been using the staff development days to develop a locally produced Character Education curriculum as specified in a previous WASC self-study.
Mountain Empire High School Accountability Report Card, 2010-2011
Mountain Empire Unified Provided by the Ed-Data Partnership
For more information visit www.ed-data.org