Embed Size (px)
Citation preview

1
Executive Summary School Accountability Report Card, 2011–12
For John F. Cruikshank, Jr. Address: PO Box 213030, Stockton, CA, 95213-9030 Phone: (209) 468-9265
Principal: Janine Cuaresma, Director Grade Span: K-12
This executive summary of the School Accountability Report Card (SARC) is intended to
provide parents and community members with a quick snapshot of information related to
individual public schools. Most data presented in this report are reported for the 2011–12
school year. School finances and school completion data are reported for the 2010–11
school year. Contact information, facilities, curriculum and instructional materials, and
select teacher data are reported for the 2012–13 school year. For additional information
about the school, parents and community members should review the entire SARC or
contact the school principal or the district office.
About This School
The San Joaquin County Court School program serves K-12 youth at Peterson Juvenile Hall, The Camp and Dorothy Biddick School. Peterson Juvenile Hall and The Camp are located at the county juvenile justice center. Dorothy Biddick is located at the Mary Graham Children’s Shelter. The average length of stay in these programs was 16 days for the 2011-12 school year. The high student mobility and transition rate present challenges in meeting NCLB targets. The San Joaquin County Court School program uses an integrated, thematic approach to instruction. Lessons, assignments, and projects are centered on quarterly themes that bring continuity to the learning experience. Students complete grade appropriate, standards-based academic courses and work on basic skills to complete requirements or earn high school credits. Educational strategies are highly interactive, and are both process and product oriented in the classroom. Students develop an appreciation of self and others, individual talents, critical thinking and problem solving skills, workforce readiness, and complete a course of study resulting in a high school diploma, Certificate of Completion, CHSPE or GED. The program offers relevant instruction, geared toward assisting students to become productive members of the community. Students who have been identified as needing special education services are provided those services by credentialed special education teachers and an aide using an inclusion model. A special education instructional assistant is used to deliver instruction in a 1:1 or small group setting. Parents of Special Education students are active participants in the IEP team meetings for their child.
Student Enrollment
Group Enrollment
Number of students 159
Black or African American 29.6%
American Indian or Alaska Native 0.0%
Asian 9.4%
Filipino 0.0%
Hispanic or Latino 44.7%

2
Native Hawaiian or Pacific Islander 0.0%
White 11.9%
Two or More Races 3.8%
Socioeconomically Disadvantaged 59.1%
English Learners 25.8%
Students with Disabilities 1.9%
Teachers
Indicator Teachers
Teachers with full credential 12
Teachers without full credential 0
Teachers Teaching Outside Subject Area of Competence 0
Misassignments of Teachers of English Learners 0
Total Teacher Misassignments 0
Student Performance
Subject Students Proficient and Above on STAR* Program Results
English-Language Arts 2%
Mathematics 7%
Science 3%
History-Social Science 2%
*Standardized Testing and Reporting Program assessments used for accountability purposes include the California Standards Tests, the California Modified Assessment, and the California Alternate
Performance Assessment.
Academic Progress*
Indicator Result
2012 Growth API Score (from 2012 Growth API Report) 482
Statewide Rank (from 2011 Base API Report) 1
Met All 2012 AYP Requirements no
Number of AYP Criteria Met Out of the Total Number of Criteria Possible Met 2 of 5
2012–13 Program Improvement Status (PI Year) *The Academic Performance Index is required under state law. Adequate Yearly Progress is required
by federal law.
School Facilities

3
Summary of Most Recent Site Inspection
NA*
Repairs Needed
NA*
Corrective Actions Taken or Planned
NA*
*San Joaquin County Juvenile Hall operates in facilities owned and maintained by San Joaquin County
(not the Office of Education)
Curriculum and Instructional Materials
Core Curriculum Area Pupils Who Lack Textbooks and Instructional
Materials
Reading/Language Arts 0
Mathematics 0
Science 0
History-Social Science 0
Foreign Language 0
Health 0
Visual and Performing Arts 0
Science Laboratory Equipment (grades 9-12)
0
School Finances
Level Expenditures Per Pupil (Unrestricted Sources Only)
School Site NA for County Office of Education
District NA for County Office of Education
State $5,455

4
School Completion
Indicator Result
Graduation Rate (if applicable) 72.59
Postsecondary Preparation
Measure Percent
Pupils Who Completed a Career Technical Education Program and Earned a High School Diploma
.02%
Graduates Who Completed All Courses Required for University of California or California State University Admission
0.0%
School Accountability Report Card
Reported Using Data from the 2011–12 School Year
Published During 2012–13 Every school in California is required by state law to publish a School Accountability Report
Card (SARC), by February 1 of each year. The SARC contains information about the
condition and performance of each California public school.
For more information about SARC requirements, see the California Department of
Education (CDE) SARC Web page at http://www.cde.ca.gov/ta/ac/sa/.
For additional information about the school, parents and community members should contact the school principal or the district office.
I. Data and Access
Ed-Data Partnership Web Site
Ed-Data is a partnership of the CDE, EdSource, and the Fiscal Crisis and Management
Assistance Team (FCMAT) that provides extensive financial, demographic, and performance
information about California’s public kindergarten through grade twelve school districts and
schools.
DataQuest
DataQuest is an online data tool located on the CDE DataQuest Web page at
http://dq.cde.ca.gov/dataquest/ that contains additional information about this school and
comparisons of the school to the district, the county, and the state. Specifically, DataQuest
is a dynamic system that provides reports for accountability (e.g., state Academic
Performance Index [API], federal Adequate Yearly Progress [AYP]), test data, enrollment,
high school graduates, dropouts, course enrollments, staffing, and data regarding English
learners.

5
Internet Access
Internet access is available at public libraries and other locations that are publicly accessible
(e.g., the California State Library). Access to the Internet at libraries and public locations is
generally provided on a first-come, first-served basis. Other use restrictions may include the
hours of operation, the length of time that a workstation may be used (depending on
availability), the types of software programs available on a workstation, and the ability to
print documents.
II. About This School
Contact Information (School Year 2012–13)
School District
School Name John F. Cruikshank, Jr. District Name San Joaquin County Office of Education
Street PO Box 213030 Phone Number (209) 468-4800
City, State, Zip Stockton, CA, 95213-9030 Web Site www.sjcoe.org
Phone Number (209) 468-9265 Superintendent Mick Founts
Principal Janine Cuaresma, Director E-mail Address [email protected]
E-mail Address [email protected] CDS Code 39103973930195
School Description and Mission Statement (School Year 2011–12)
The San Joaquin County Court School program serves K-12 youth at Peterson Juvenile Hall, The Camp and Dorothy Biddick School. Peterson Juvenile Hall and The Camp are located at the county juvenile justice center. Dorothy Biddick
is located at the Mary Graham Children’s Shelter. Students who have been identified as needing special education services are provided those services by credentialed special education teachers and an aide using an inclusion model. A special education instructional assistant is used to deliver instruction in a 1:1 or small group setting. The average length of stay in these programs is 16 days. The high student mobility and transition rate present challenges in meeting NCLB targets. one.Mission We ensure that ALL students attain the skills and confidence to make a positive difference and thrive in our ever-changing world. one.Vision
We maintain high expectations and an academic focus that is rigorous, relevant, and founded on relationships. We inspire and empower our students to be tomorrow’s leaders. They are innovative thinkers who transcend boundaries to achieve the extraordinary. They are resilient and self-aware, able to overcome all obstacles in their pursuit of excellence. Our students have a strong sense of self-worth and value working with others to make miracles occur
Opportunities for Parental Involvement (School Year 2011–12)
Peterson Juvenile Hall and Camp students are incarcerated and have limited visitation rights with their parents. Dorothy Biddick students have been removed from abusive home environments and placed in protective care at the children’s shelter. Parents of student with special needs are involved in the IEP team meetings for his/her child.
Each site provides agency support staff including counselors, probation staff, therapist and other personnel to deal with the education rights and social/emotional needs of the students.
Parents are recruited for and sit on school site council, and other academic committees.
Student Enrollment by Grade Level (School Year 2011–12)

6
Grade Level Number of Students Grade Level Number of Students
Kindergarten 0 Grade 8 7
Grade 1 0 Ungraded Elementary 0
Grade 2 1 Grade 9 10
Grade 3 1 Grade 10 28
Grade 4 1 Grade 11 40
Grade 5 2 Grade 12 68
Grade 6 0 Ungraded Secondary 0
Grade 7 1 Total Enrollment 159
Student Enrollment by Student Group (School Year 2011-12)
Group Percent of Total Enrollment
Black or African American 29.6%
American Indian or Alaska Native 0.0%
Asian 9.4%
Filipino 0.0%
Hispanic or Latino 44.7%
Native Hawaiian or Pacific Islander 0.0%
White 11.9%
Two or More Races 3.8%
Socioeconomically Disadvantaged 59.1%
English Learners 25.8%
Students with Disabilities 1.9%
Average Class Size and Class Size Distribution (Elementary)
Grade
Level
Avg.
Class
Size
2009–10
Number of
Classes* Avg.
Class
Size
2010–11
Number of
Classes* Avg.
Class
Size
2011–12
Number of
Classes*
1-
20
21-
32 33+
1-
20
21-
32 33+
1-
20
21-
32 33+
K
1
2
3
4

7
5
6
Other 15 1
15 1
15 1 0 0
* Number of classes indicates how many classes fall into each size category (a range of total students per classroom).
Average Class Size and Class Size Distribution (Secondary)
Subject
Avg.
Class
Size
2009–10
Number of
Classes* Avg.
Class
Size
2010–11
Number of
Classes* Avg.
Class
Size
2011–12
Number of
Classes*
1-
22
23-
32 33+
1-
22
23-
32 33+
1-
22
23-
32 33+
English 18 12
17 12
20 11
Mathematics 18 12
17 12
20 9
Science 18 12
17 12
20 7
Social Science
18 12
17 12
20 13
* Number of classes indicates how many classrooms fall into each size category (a range of total students per classroom). At the secondary school level, this information is reported by subject area rather than grade level.
III. School Climate
School Safety Plan (School Year 2011–12)
All COSP school sites have a comprehensive school safety plan in accordance with the Safe Schools policy, which includes a specific emergency operations plan. In compliance with SB 187, the plan is reviewed and revised annually for each school site. Site safety plans are aligned with the National Incident Management System (NIMS) and California Standardized Emergency Management Systems (SEMS) utilizing Incident Command System (ICS). Each document is prepared for the use of employees at a specific school site in the event of an emergency, disaster, or crisis situation. At the beginning of each school year, COSP school site staff update their site specific Emergency Plan. The site specific Emergency plan includes the site safety plan, San Joaquin County Office of Education's Disaster Plan, updated site maps/evacuation routes, and Emergency Medical Services Authority, EMSA emergency first aid guidelines of California Schools. Schools are issued first aid kits and “grab and go” emergency packs in the event of an evacuation. The school nurse collaborates with parents/guardians of students with special needs in order to provide medical emergency kits in accordance with their Individualized School Health Plan, ISHP. A copy of the Emergency Plan binder is housed at the school site and the COSP Director's office and is available for parent/guardian review. The counseling staff creates a crisis file for every teacher in the program. Community school teachers are given the file at the beginning of the year, along with instructions on how they are to be utilized. The information is reviewed and updated as needed throughout the year. The following information is displayed at each site and is also included in the crisis file:
- Directions to follow in case of an emergency, crisis or injury - COSP Emergency Hotline phone number - A bomb threat checklist - Listing of emergency phone numbers - Tips for de-escalating a conflict - Suicide intervention information, suicide hotline and San Joaquin County Mental Health contact information
- Resource numbers (Runaway hotline, shelter and “safe house” contact numbers, Public Health immunization and HIV/AIDS information)
- Child abuse prevention information

8
- CPS reporting form - State laws pertaining to unlawful conduct and sexual intercourse with a minor - Smoking cessation resource list - Community Resources
Suspensions and Expulsions
Rate* School
2009–10
School
2010–11
School
2011–12
District
2009–10
District
2010–11
District
2011–12
Suspensions 127.5% 78.73% 51% 53.23% 68.10% 39%
Expulsions 0% .04% 0% .26% .05% .035%
* The rate of suspensions and expulsions is calculated by dividing the total number of incidents by the
total enrollment.
These rates were calculated based on “cumulative” enrollments, per SARC Data Definitions 11-12.
IV. School Facilities
School Facility Conditions and Planned Improvements (School Year 2012–13)
NA*
*San Joaquin County Juvenile Hall operates in facilities owned and maintained by San Joaquin County
(not the Office of Education)
School Facility Good Repair Status (School Year 2012–13)
System Inspected
Repair Status Repair Needed and
Action Taken or
Planned Exemplary Good Fair Poor
Systems: Gas Leaks, Mechanical/HVAC, Sewer
NA
NA
Interior: Interior Surfaces
NA
NA
Cleanliness: Overall Cleanliness, Pest/ Vermin Infestation
NA
NA
Electrical: Electrical
NA
NA
Restrooms/Fountains: Restrooms, Sinks/ Fountains
NA
NA
Safety: Fire Safety, Hazardous Materials
NA
NA

9
Structural: Structural Damage, Roofs
NA
NA
External: Playground/School Grounds, Windows/ Doors/Gates/Fences
NA
NA
Overall Rating
NA
Note: Cells shaded in black do not require data.
V. Teachers
Teacher Credentials
Teachers School
2009–10
School
2010–11
School
2011–12
District
2011–12
With Full Credential 11 12 12 180
Without Full Credential 0 0 0 13
Teaching Outside Subject Area of Competence (with full credential)
0 0 0 0
Teacher Misassignments and Vacant Teacher Positions
Indicator 2010–11 2011–12 2012–13
Misassignments of Teachers of English Learners 0 0 0
Total Teacher Misassignments* 0 0 0
Vacant Teacher Positions 0 0 0
Note: “Misassignments” refers to the number of positions filled by teachers who lack legal authorization to teach that grade level, subject area, student group, etc.
* Total Teacher Misassignments includes the number of Misassignments of Teachers of English Learners.
Core Academic Classes Taught by Highly Qualified Teachers (School Year 2011–12)
The Federal Elementary and Secondary Education Act (ESEA), also known as No Child Left
Behind (NCLB), requires that core academic subjects be taught by Highly Qualified
Teachers, defined as having at least a bachelor’s degree, an appropriate California teaching
credential, and demonstrated core academic subject area competence. For more
information, see the CDE Improving Teacher and Principal Quality Web page at:
http://www.cde.ca.gov/nclb/sr/tq/
Location of
Classes
Percent of Classes In Core
Academic Subjects Taught by
Highly Qualified Teachers
Percent of Classes In Core
Academic Subjects Not Taught by
Highly Qualified Teachers
This School 57% 43%
All Schools in District
73% 27%

10
High-Poverty Schools in District
NA NA
Low-Poverty Schools in District
NA NA
Note: High-poverty schools are defined as those schools with student eligibility of approximately 40
percent or more in the free and reduced price meals program. Low-poverty schools are those with student eligibility of approximately 25 percent or less in the free and reduced price meals program.
VI. Support Staff
Academic Counselors and Other Support Staff (School Year 2011–12)
Title Number of FTE*
Assigned to School
Average Number of
Students per Academic
Counselor
Academic Counselor
Counselor (Social/Behavioral or Career Development)
.5
Library Media Teacher (librarian)
Library Media Services Staff (paraprofessional)
Psychologist
Social Worker
Nurse
Speech/Language/Hearing Specialist
Resource Specialist (non-teaching) 1.0
Other (Clerk) 1.0
Note: Cells shaded in black do not require data.
* One Full-Time Equivalent (FTE) equals one staff member working full-time; one FTE could also represent two staff members who each work 50 percent of full-time.
VII. Curriculum and Instructional Materials
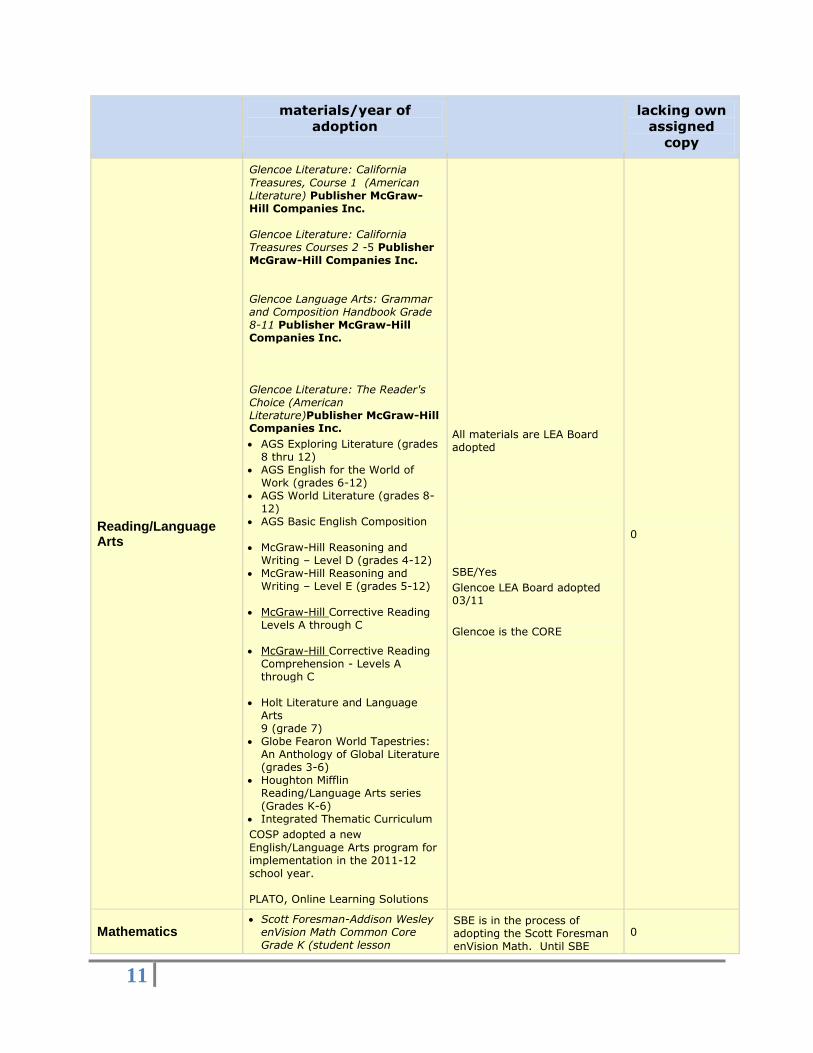
Quality, Currency, Availability of Textbooks and Instructional Materials (School Year 2012–13)
This section describes whether the textbooks and instructional materials used at the school
are from the most recent adoption; whether there are sufficient textbooks and instruction
materials for each student; and information about the school’s use of any supplemental
curriculum or non-adopted textbooks or instructional materials.
Year and month in which data were collected: ________12/12____________
Core Curriculum
Area Textbooks and
instructional
From most recent
adoption? Percent
students
11
materials/year of
adoption
lacking own
assigned
copy
Reading/Language Arts
Glencoe Literature: California
Treasures, Course 1 (American Literature) Publisher McGraw-Hill Companies Inc. Glencoe Literature: California Treasures Courses 2 -5 Publisher McGraw-Hill Companies Inc. Glencoe Language Arts: Grammar and Composition Handbook Grade 8-11 Publisher McGraw-Hill Companies Inc. Glencoe Literature: The Reader's Choice (American Literature)Publisher McGraw-Hill Companies Inc.
AGS Exploring Literature (grades 8 thru 12)
AGS English for the World of Work (grades 6-12)
AGS World Literature (grades 8-12)
AGS Basic English Composition McGraw-Hill Reasoning and
Writing – Level D (grades 4-12) McGraw-Hill Reasoning and
Writing – Level E (grades 5-12)
McGraw-Hill Corrective Reading Levels A through C
McGraw-Hill Corrective Reading Comprehension - Levels A through C
Holt Literature and Language
Arts 9 (grade 7)
Globe Fearon World Tapestries: An Anthology of Global Literature (grades 3-6)
Houghton Mifflin Reading/Language Arts series (Grades K-6)
Integrated Thematic Curriculum
COSP adopted a new
English/Language Arts program for implementation in the 2011-12 school year. PLATO, Online Learning Solutions
All materials are LEA Board adopted
SBE/Yes
Glencoe LEA Board adopted 03/11
Glencoe is the CORE
0
Mathematics Scott Foresman-Addison Wesley
enVision Math Common Core Grade K (student lesson
SBE is in the process of adopting the Scott Foresman enVision Math. Until SBE
0

12
packet)Publisher Pearson Education, Inc. Scott Foresman-Addison Wesley enVision Math Common Core Grade 1-2 (Workbook) Publisher Pearson Education, Inc. Scott Foresman-Addison Wesley enVision Math Common Core Grade 3-6 Publisher Pearson Education, Inc. Glencoe – Algebra Readiness (grades 6-8)
Holt - Algebra I (grades 8-12) PLATO, Online Learning Solutions
adopted, these materials are used as “supplemental.”
LEA Board/Yes 2012
Science
AGS Physical Science (grades 9-12)
AGS Biology (grades 9-12) Biology: The Dynamics Of Life
(grades 9-12) Glencoe Physical Science with
Earth Science (grades 9-12) Glencoe Life Science (grades 9-
12) Fearon Biology (grades 3-6)
Houghton Mifflin Discovery Works
(grade 6)
Integrated Thematic Curriculum
PLATO, Online Learning Solutions
All Materials are LEA Board approved
0
History-Social Science
AGS World Geography (grades 9-12)
AGS World History (grades 9-12) AGS United States History
(grades 9-12) AGS United States Government
(grades 9-12) Glencoe The American Journey
(Grades 6 – 9) Glencoe World History; Modern
Times (Grades 9-12) D.C. Heath World History:
Perspectives on the Past (grades 9-12)
Globe Fearon World Geography and Cultures (grades 9-12)
Integrated Thematic Curriculum
PLATO, Online Learning Solutions
All Materials are LEA Board approved
0
Foreign Language NA
Health Integrated Thematic Curriculum
PLATO, Online Learning Solutions
All Materials are LEA Board approved
0
Visual and Performing Arts
Integrated Thematic Curriculum
PLATO, Online Learning Solutions
All Materials are LEA Board approved
0
Science Laboratory Equipment (grades 9-12)
Basic science lab materials are available. “Wet lab equipment” NA
LEA Board approved 0

13
Explanation of Integrated Thematic Curriculum:
The Community Schools Program uses an integrated, thematic curriculum, with subjects taught around a yearly theme delivered
in four, two-month units. The integrated thematic curriculum is written each year by a group of teachers. It is developed to
address our Expected School wide Learning Results (ESLRs), to work toward the State of California, Department of Education
Content Standards, and to address the philosophy of the program.
Subjects such as language arts and history are combined in an effort to make learning more relevant and to help students process
and retain information more efficiently. Lessons, assignments, and projects are centered on themes that bring continuity to the
learning experience.
What is taught at each school varies by student age, ability levels, the focus of the site, and by the creativity and special skills of
the teachers at the specific sites.
Students have opportunities to individualize their instruction. Expectations are modified based on the abilities of each student.
Teachers, parents, and students may conference with one another to determine what content areas they will emphasize in the
work they do based upon the credits they need. However, final determination of credits awarded in a specific content area rests
with the teacher and is based on evidence of student progress.
Teachers are supplied with a copy of the thematic units. Each unit contains at least six weeks of lesson plans, suggested
materials, and project and field trip ideas.
Other resources for curriculum are: Books, textbooks, novels, videos, and science and technology equipment to be checked out
through our library/inventory system and internet access. For students who need individualized instruction to meet academic
requirements, PLATO Online Learning Solutions is available in core content.
Throughout the program, high school credits are earned in many subject areas via direct instruction in math, reading, and writing,
and physical education, but many subjects are taught in an integrated approach, with emphasis on one subject over a grading
period. Over a period of a few years, students are able to earn credits in a variety of subjects.
The 2012-2013 theme is “E Pluribus Unum.” Units are as follows: Unit 1: The Great Experiment Unit 2: Of the People, By the People, For the People Unit 3: American Democracy Unit 4: We Are Americans
VIII. School Finances
Expenditures Per Pupil and School Site Teacher Salaries (Fiscal Year 2010–11)
Level
Total
Expenditures
Per Pupil
Expenditures Per
Pupil
(Supplemental /
Restricted)
Expenditures Per
Pupil (Basic /
Unrestricted)
Average
Teacher
Salary
School Site $7,509 $7,509 NA/County Office of
Ed $58,808
District
NA/County Office of Ed
$58,808
Percent Difference – School Site and District
NA/County Office of Ed
0%
State
$5,455 $68,369

14
Percent Difference – School Site and State
NA/County Office of Ed
Ave state salary is 16.26%
higher than site ave salary
Note: Cells shaded in black do not require data.
Supplemental/Restricted expenditures come from money whose use is controlled by law or by a donor. Money that is designated for specific purposes by the district or governing board is not considered restricted. Basic/unrestricted expenditures are from money whose use, except for general guidelines, is not controlled by law or by a donor.
For detailed information on school expenditures for all districts in California, see the CDE Current Expense of Education & Per-pupil Spending Web page at http://www.cde.ca.gov/ds/fd/ec/. For
information on teacher salaries for all districts in California, see the CDE Certificated Salaries & Benefits Web page at http://www.cde.ca.gov/ds/fd/cs/. To look up expenditures and salaries for a specific school district, see the Ed-Data Web site at: http://www.ed-data.org.
Types of Services Funded (Fiscal Year 2011–12)
CAHSEE tutoring two days per week for students in grades 10-12 Foster Youth tutoring two days per week for all Foster Youth students CAHSEE writing prep for English Learners Program-wide MAP testing twice a year Program-wide PWA testing twice a year
PLATO (Individualized computer-based instruction)
Teacher and Administrative Salaries (Fiscal Year 2010–11)
Category District
Amount
State Average For Districts In
Same Category
Beginning Teacher Salary $40,308 $31,438
Mid-Range Teacher Salary $59,328 $66,920
Highest Teacher Salary $78,348 $102,402
Average Principal Salary (Elementary)
NA NA
Average Principal Salary (Middle) NA NA
Average Principal Salary (High) NA NA
Superintendent Salary $235,052 NA
Percent of Budget for Teacher Salaries
9.87% NA
Percent of Budget for Administrative Salaries
7.32% NA
Note: For detailed information on salaries, see the CDE Certificated Salaries & Benefits Web
page at http://www.cde.ca.gov/ds/fd/cs/
15
IX. Student Performance
Standardized Testing and Reporting Program
The Standardized Testing and Reporting (STAR) Program consists of several key
components, including:
California Standards Tests (CSTs), which include English-language arts (ELA) and
mathematics in grades two through eleven; science in grades five, eight, and nine
through eleven; and history-social science in grades eight, and nine through eleven.
California Modified Assessment (CMA), an alternate assessment that is based on
modified achievement standards in ELA for grades three through eleven; mathematics
for grades three through seven, Algebra I, and Geometry; and science in grades five
and eight, and Life Science in grade ten. The CMA is designed to assess those students
whose disabilities preclude them from achieving grade-level proficiency on an
assessment of the California content standards with or without accommodations.
California Alternate Performance Assessment (CAPA), includes ELA and
mathematics in grades two through eleven, and science for grades five, eight, and ten.
The CAPA is given to those students with significant cognitive disabilities whose
disabilities prevent them from taking either the CSTs with accommodations or modifications or the CMA with accommodations.
The assessments under the STAR Program show how well students are doing in relation to
the state content standards. On each of these assessments, student scores are reported as
performance levels.
For detailed information regarding the STAR Program results for each grade and
performance level, including the percent of students not tested, see the CDE STAR Results
Web site at http://star.cde.ca.gov.
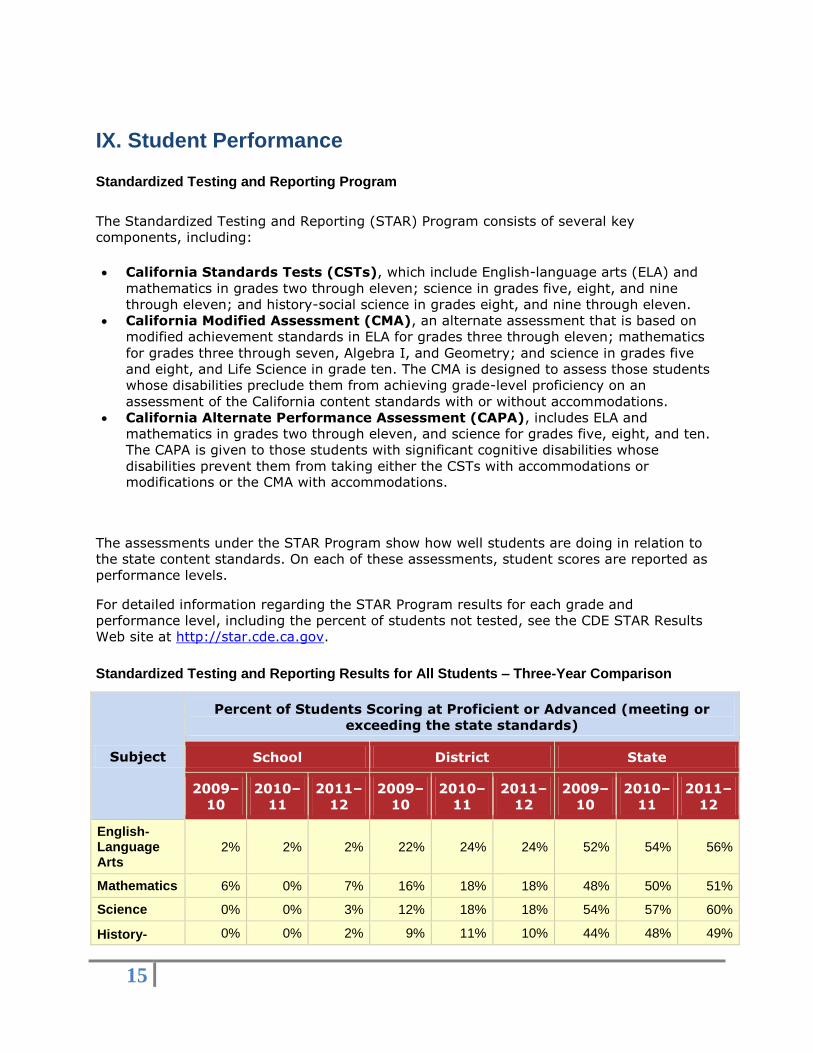
Standardized Testing and Reporting Results for All Students – Three-Year Comparison
Subject
Percent of Students Scoring at Proficient or Advanced (meeting or
exceeding the state standards)
School District State
2009–
10
2010–
11
2011–
12
2009–
10
2010–
11
2011–
12
2009–
10
2010–
11
2011–
12
English-Language Arts
2% 2% 2% 22% 24% 24% 52% 54% 56%
Mathematics 6% 0% 7% 16% 18% 18% 48% 50% 51%
Science 0% 0% 3% 12% 18% 18% 54% 57% 60%
History- 0% 0% 2% 9% 11% 10% 44% 48% 49%

16
Social Science
Note: Scores are not shown when the number of students tested is ten or less, either because the number of students in this category is too small for statistical accuracy or to protect student privacy.
Standardized Testing and Reporting Results by Student Group – Most Recent Year
Group
Percent of Students Scoring at Proficient or Advanced
English-
Language Arts Mathematics Science
History- Social
Science
All Students in the LEA 24% 18% 18% 10%
All Students at the School 2% 7% 3% 2%
Male 1% 0% 3% 3%
Female 0% 0% 0% 0%
Black or African American 0% 0% 0% 0%
American Indian or Alaska Native
Asian 0% 0% 0% 0%
Filipino
Hispanic or Latino 4% 0% 6% 0%
Native Hawaiian or Pacific Islander
White 0% 0% 0% 0%
Two or More Races 0% 0% 0% 0%
Socioeconomically Disadvantaged
2% 0% 6% 0%
English Learners 0% 0% 0% 0%
Students with Disabilities 0% 0% 0% 0%
Students Receiving Migrant Education Services
0% 0% 0% 0%
Note: Scores are not shown when the number of students tested is ten or less, either because the number of students in this category is too small for statistical accuracy or to protect student privacy.
California High School Exit Examination
The California High School Exit Examination (CAHSEE) is primarily used as a graduation
requirement. However, the grade ten results of this exam are also used to establish the
percentages of students at three proficiency levels (not proficient, proficient, or advanced)
in ELA and mathematics to compute AYP designations required by the federal ESEA, also
known as NCLB.
For detailed information regarding CAHSEE results, see the CDE CAHSEE Web site at
http://cahsee.cde.ca.gov/.

17
California High School Exit Examination Results for All Grade Ten Students – Three-Year
Comparison (if applicable)
Subject
Percent of Students Scoring at Proficient or Advanced
School District State
2009–
10
2010–
11
2011–
12
2009–
10
2010–
11
2011–
12
2009–
10
2010–
11
2011–
12
English-Language Arts
6% 7% 13% 21% 19% 19% 54% 59% 56%
Mathematics 13% 5% 6% 19% 13% 17% 54% 56% 58%
Note: Scores are not shown when the number of students tested is ten or less, either because the number of students in this category is too small for statistical accuracy or to protect student privacy.
California High School Exit Examination Grade Ten Results by Student Group – Most Recent
Year (if applicable)
Group
English-Language Arts Mathematics
Not
Proficient Proficient Advanced
Not
Proficient Proficient Advanced
All Students in the LEA
81% 11% 8% 83% 14% 3%
All Students at the School
87% 10% 3% 94% 6% 0%
Male 86% 10% 3% 93% 7% 0%
Female
Black or African American
91% 9% 0%
American Indian or Alaska Native
Asian
Filipino
Hispanic or Latino 87% 7% 7% 88% 13% 0%
Native Hawaiian or Pacific Islander
White
Two or More Races
Socioeconomically Disadvantaged
100% 0% 0% 100% 0% 0%

18
English Learners
Students with Disabilities
Students Receiving Migrant Education Services
Note: Scores are not shown when the number of students tested is ten or less, either because the number of students in this category is too small for statistical accuracy or to protect student privacy.
California Physical Fitness Test Results (School Year 2011–12)
The California Physical Fitness Test (PFT) is administered to students in grades five, seven,
and nine only. This table displays by grade level the percent of students meeting the fitness
standards for the most recent testing period. For detailed information regarding this test,
and comparisons of a school’s test results to the district and state, see the CDE PFT Web
page at http://www.cde.ca.gov/ta/tg/pf/.
Grade Level Percent of Students Meeting Fitness Standards
Four of Six Standards Five of Six Standards Six of Six Standards
5 0.00% 0.00% 0.00%
7
9
Note: Scores are not shown when the number of students tested is ten or less, either because the number of students in this category is too small for statistical accuracy or to protect student privacy.
X. Accountability
Academic Performance Index
The Academic Performance Index (API) is an annual measure of state academic
performance and progress of schools in California. API scores range from 200 to 1,000, with
a statewide target of 800. For detailed information about the API, see the CDE API Web
page at http://www.cde.ca.gov/ta/ac/ap/.
Academic Performance Index Ranks – Three-Year Comparison
This table displays the school’s statewide and similar schools’ API ranks. The statewide
API rank ranges from 1 to 10. A statewide rank of 1 means that the school has an API
score in the lowest ten percent of all schools in the state, while a statewide rank of 10
means that the school has an API score in the highest ten percent of all schools in the state.
The similar schools API rank reflects how a school compares to 100 statistically matched
“similar schools.” A similar schools rank of 1 means that the school’s academic performance
is comparable to the lowest performing ten schools of the 100 similar schools, while a
similar schools rank of 10 means that the school’s academic performance is better than at
least 90 of the 100 similar schools.
API Rank 2009 2010 2011
19
Statewide 2
1
Similar Schools
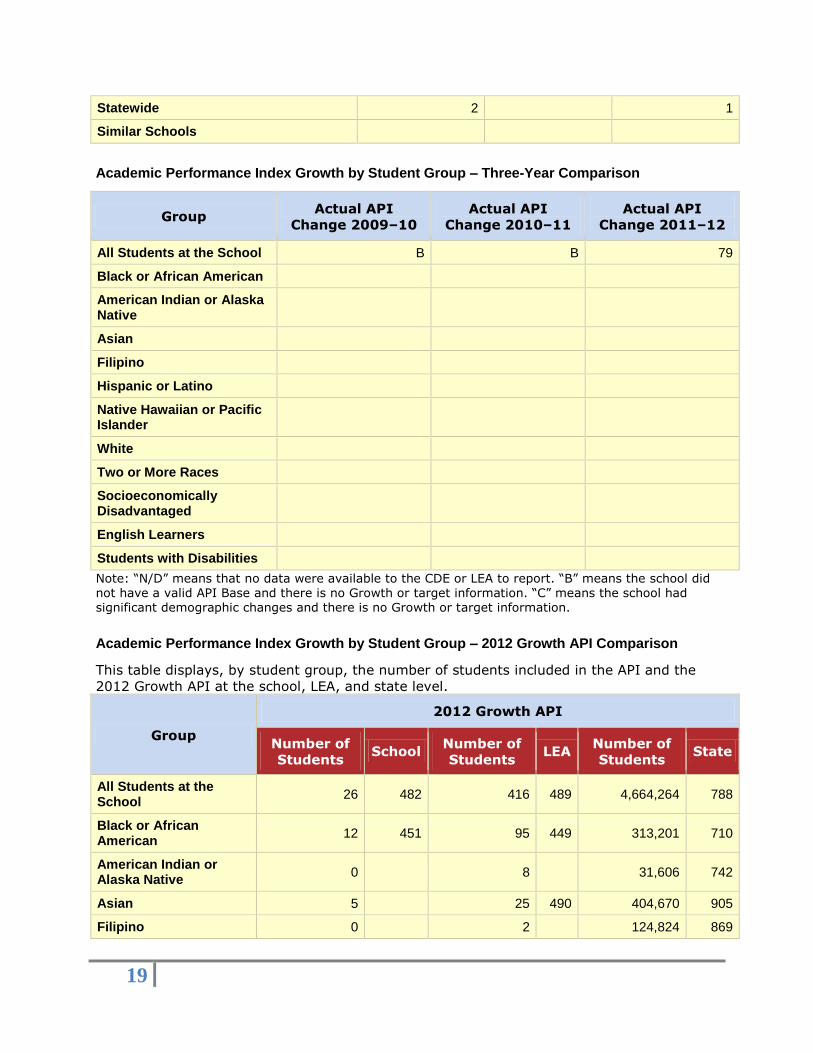
Academic Performance Index Growth by Student Group – Three-Year Comparison
Group Actual API
Change 2009–10
Actual API
Change 2010–11
Actual API
Change 2011–12
All Students at the School B B 79
Black or African American
American Indian or Alaska Native
Asian
Filipino
Hispanic or Latino
Native Hawaiian or Pacific Islander
White
Two or More Races
Socioeconomically Disadvantaged
English Learners
Students with Disabilities
Note: “N/D” means that no data were available to the CDE or LEA to report. “B” means the school did not have a valid API Base and there is no Growth or target information. “C” means the school had significant demographic changes and there is no Growth or target information.
Academic Performance Index Growth by Student Group – 2012 Growth API Comparison
This table displays, by student group, the number of students included in the API and the
2012 Growth API at the school, LEA, and state level.
Group
2012 Growth API
Number of
Students School
Number of
Students LEA
Number of
Students State
All Students at the School
26 482 416 489 4,664,264 788
Black or African American
12 451 95 449 313,201 710
American Indian or Alaska Native
0
8
31,606 742
Asian 5
25 490 404,670 905
Filipino 0
2
124,824 869

20
Hispanic or Latino 9
217 471 2,425,230 740
Native Hawaiian or Pacific Islander
0
4
26,563 775
White 0
57 598 1,221,860 853
Two or More Races 0
2
88,428 849
Socioeconomically Disadvantaged
16 463 394 479 2,779,680 737
English Learners 5
85 427 1,530,297 716
Students with Disabilities
1
36 440 530,935 607
Adequate Yearly Progress
The federal ESEA requires that all schools and districts meet the following Adequate Yearly
Progress (AYP) criteria:
Participation rate on the state’s standards-based assessments in ELA and mathematics
Percent proficient on the state’s standards-based assessments in ELA and mathematics
API as an additional indicator Graduation rate (for secondary schools)
For detailed information about AYP, including participation rates and percent proficient
results by student group, see the CDE AYP Web page at http://www.cde.ca.gov/ta/ac/ay/.
Adequate Yearly Progress Overall and by Criteria (School Year 2011–12)
AYP Criteria School District
Made AYP Overall No No
Met Participation Rate - English-Language Arts Yes No
Met Participation Rate - Mathematics Yes No
Met Percent Proficient - English-Language Arts No No
Met Percent Proficient - Mathematics No No
Met API Criteria N/A Yes
Met Graduation Rate No No
Federal Intervention Program (School Year 2012–13)
Schools and districts receiving federal Title I funding enter Program Improvement (PI) if
they do not make AYP for two consecutive years in the same content area (ELA or
mathematics) or on the same indicator (API or graduation rate). After entering PI, schools
and districts advance to the next level of intervention with each additional year that they do
not make AYP. For detailed information about PI identification, see the CDE PI Status
Determinations Web page: http://www.cde.ca.gov/ta/ac/ay/tidetermine.asp.

21
Indicator School District
Program Improvement Status
In PI
First Year of Program Improvement
2005-2006
Year in Program Improvement
Year 3
Number of Schools Currently in Program Improvement
1
Percent of Schools Currently in Program Improvement
14.3%
Note: Cells shaded in black do not require data.
XI. School Completion and Postsecondary Preparation
Admission Requirements for California’s Public Universities
University of California
Admission requirements for the University of California (UC) follow guidelines set forth in
the Master Plan, which requires that the top one-eighth of the state’s high school graduates,
as well as those transfer students who have successfully completed specified college course
work, be eligible for admission to the UC. These requirements are designed to ensure that
all eligible students are adequately prepared for University-level work.
For general admissions requirements, please visit the UC Admissions Information Web page
at http://www.universityofcalifornia.edu/admissions/. (Outside source)
California State University
Eligibility for admission to the California State University (CSU) is determined by three
factors:
Specific high school courses
Grades in specified courses and test scores
Graduation from high school
Some campuses have higher standards for particular majors or students who live outside
the local campus area. Because of the number of students who apply, a few campuses have
higher standards (supplementary admission criteria) for all applicants. Most CSU campuses
have local admission guarantee policies for students who graduate or transfer from high
schools and colleges that are historically served by a CSU campus in that region. For
admission, application, and fee information see the CSU Web page at
http://www.calstate.edu/admission/admission.shtml. (Outside source)
Dropout Rate and Graduation Rate
Indicator
School District State
2008–
09
2009–
10
2010–
11
2008–
09
2009–
10
2010–
11
2008–
09
2009–
10
2010–
11
Dropout
22.4 19.7
22.4 19.7
16.6 14.4

22
Rate
Graduation Rate
70.79 72.59
70.79 72.59
74.72 76.26
Note: Cells shaded in black do not require data.
Completion of High School Graduation Requirements
This table displays, by student group, the percent of students who began the 2011–12
school year in grade twelve and were a part of the school’s most recent graduating class,
meeting all state and local graduation requirements for grade twelve completion, including
having passed both the ELA and mathematics portions of the CAHSEE or received a local
waiver or state exemption.
Group Graduating Class of 2012
School District State
All Students 3 % (2 students) 34.4% (283 students) N/D
Black or African American 0 .5% (45 students) N/D
American Indian or Alaska Native 0 .6% (5 students) N/D
Asian 0 1.7% (14 students) N/D
Filipino 0 .6% (5 students) N/D
Hispanic or Latino 1.5% (1 student) 15.8% (130 students) N/D
Native Hawaiian or Pacific Islander 0 .2% (2 students) N/D
White 1.5% (1 student) 9% (74 students) N/D
Two or More Races 0 1% (8 students) N/D
Socioeconomically Disadvantaged 3% (2students) (10%) 80 students) N/D
English Learners 0 1% (9 students) N/D
Students with Disabilities 0 .6% (5 students N/D
Note: “N/D” means that no data were available to the CDE or LEA to report. Students generally move out of the program due to their legal status, not due to graduation.
Career Technical Education Programs (School Year 2011–12)
Our program serves adjudicated youth, who have access to one CTE program: Small Business Administration
Career Technical Education Participation (School Year 2011–12)
Measure CTE Program
Participation
Number of pupils participating in CTE 494
Percent of pupils completing a CTE program and earning a high school diploma
.02%
Percent of CTE courses sequenced or articulated between the school 0%

23
and institutions of postsecondary education
Courses for University of California and/or California State University Admission
UC/CSU Course Measure Percent
2011-12 Students Enrolled in Courses Required for UC/CSU Admission 0%
2010-11 Graduates Who Completed All Courses Required for UC/CSU Admission 0%
Advanced Placement Courses (School Year 2011–12)
Subject Number of AP Courses
Offered*
Percent of Students In AP
Courses
Computer Science 0
English 0
Fine and Performing Arts
0
Foreign Language 0
Mathematics 0
Science 0
Social Science 0
All courses 0
Note: Cells shaded in black do not require data. *Where there are student course enrollments.
XII. Instructional Planning and Scheduling
Professional Development
This section provides information on the annual number of school days dedicated to staff
development for the most recent three-year period. San Joaquin County Community Schools devote 4 full school days and 28 one and a half to two hour sessions to professional development. A comprehensive professional development plan is in place, which includes the following elements:
- Targeted Standards in specific subject areas - Standards maps in specific subject areas, outlining scope and sequence of what should be taught
during each grading period - Quarterly review and training in District Adopted Curriculum - Monthly meetings to support teachers with Subject Matter Competency and becoming Highly Qualified
Teachers (HQT), through a partnership with Professional Development Department of the San Joaquin County Office of Education to provide subject matter competency for all teachers through the Verification Process for Special Settings (VPSS). These subject matter consultants provide training to teachers once a month in the core content areas of mathematics, English/language arts, social studies and science. The consultants may observe individual teachers in the classroom and teach model lessons to provide peer-to-peer coaching that focuses on subject matter competency and engaging instructional strategies
- Rigor, Relevance and Relationships (RRR) training began in 2008. Consultants from the International Center for Leadership in Education were brought in to train the teaching staff and administrators. The RRR focus was supported through monthly meetings led first by teams of administrators and teachers, then through teacher leaders and continues with teacher leaders and our curriculum coordinator. The teachers have yearly professional goals that are tied to RRR. The teachers submit and peer-evaluate Lessons designed in this format quarterly.

24
- Monthly English Learner training through the San Joaquin County Office of Education Multi-lingual Department is embedded into subject matter presentations. These trainings have included Structures and Strategies, along with A Look At Learning (ALL). Teachers were initially trained in the concepts of Structures and Strategies. The following year, the strategies were woven into our curriculum and lessons were modeled at the monthly meetings. In addition, the consultants work with individual teaching using a coaching strategy. Teachers participate in CAHSEE WRITE training, and creation of curriculum, pacing guides and assessments for English Learners through the leadership of our consultants.
- Monthly On Site Collaboration time is provided to teachers to review curriculum and site goals with their teams.
- Teacher participation in textbook adoptions, which includes review, pilot and subsequent program alignment training to ensure effectiveness of implementation.
- Site Data Team discussions occur the second Wednesday of each month. A data team leader, who is trained in extracting, examining and drawing conclusions, facilitates the meetings. These trainings occur monthly. The sites examine best practice using multiple measures to ensure student achievement. Goals are set and reviewed at each meeting.
- Professional development for teachers and administrators through Leadership Cadres sponsored by San Joaquin County Office of Education.
- Various workshops, conferences and training which include, but are not limited to: Great Valley Writing Project Northwestern Evaluation Assessment PLATO Online Learning Solutions CTAP Regional Workshops CA Science Teachers Association’s Annual Conference CUE Conferences 2012 Accountability Leadership Institute for English Learners and Immigrant Students Bully Proof your Classroom and School Safety conferences
John F. Cruikshank, Jr. School Accountability Report Card, 2011-2012
San Joaquin County Office of Education Provided by the Ed-Data Partnership
For more information visit www.ed-data.org