Embed Size (px)
Citation preview
Systematic review of the evidence for the relationship between arabinoxylan or
arabinoxylan-rich fibre and peak postprandial blood glucose concentration
Prepared by: Food Standards Australia New Zealand
Date completed: November 2016
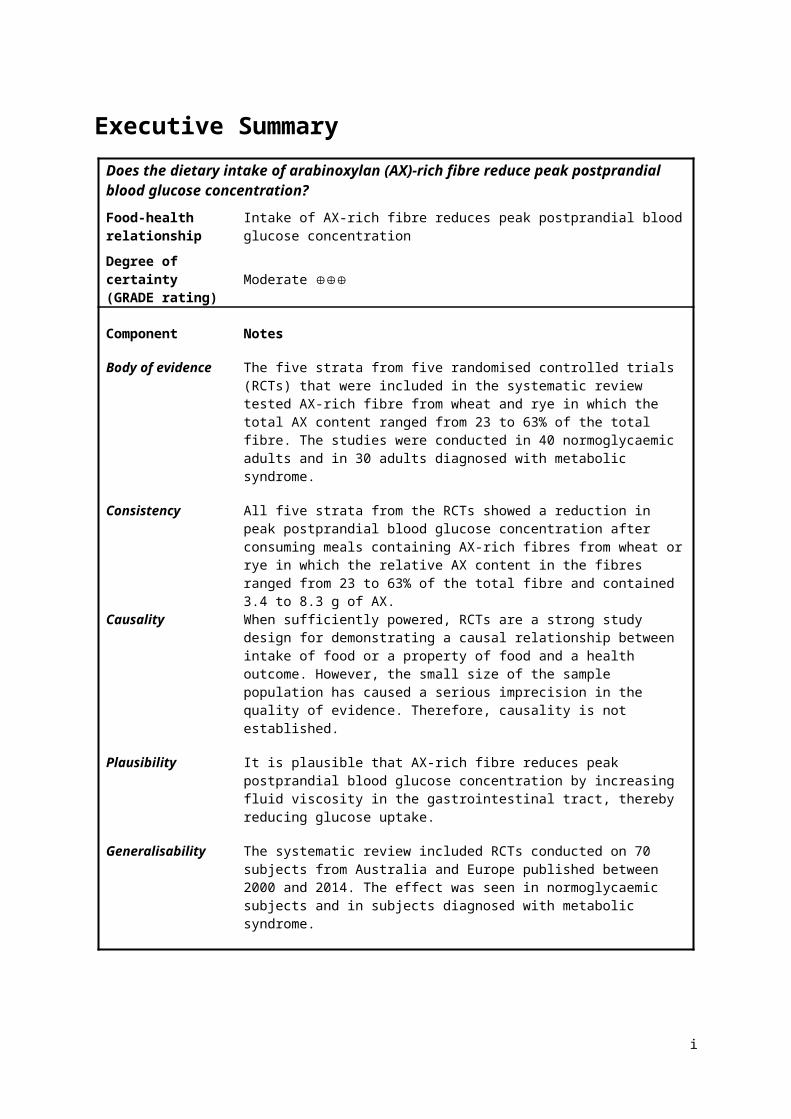
Executive SummaryDoes the dietary intake of arabinoxylan (AX)-rich fibre reduce peak postprandial blood glucose concentration?
Food-health relationship
Intake of AX-rich fibre reduces peak postprandial blood glucose concentration
Degree of certainty (GRADE rating) Moderate
Component Notes
Body of evidence The five strata from five randomised controlled trials (RCTs) that were included in the systematic review tested AX-rich fibre from wheat and rye in which the total AX content ranged from 23 to 63% of the total fibre. The studies were conducted in 40 normoglycaemic adults and in 30 adults diagnosed with metabolic syndrome.
Consistency All five strata from the RCTs showed a reduction in peak postprandial blood glucose concentration after consuming meals containing AX-rich fibres from wheat or rye in which the relative AX content in the fibres ranged from 23 to 63% of the total fibre and contained 3.4 to 8.3 g of AX.
Causality When sufficiently powered, RCTs are a strong study design for demonstrating a causal relationship between intake of food or a property of food and a health outcome. However, the small size of the sample population has caused a serious imprecision in the quality of evidence. Therefore, causality is not established.
Plausibility It is plausible that AX-rich fibre reduces peak postprandial blood glucose concentration by increasing fluid viscosity in the gastrointestinal tract, thereby reducing glucose uptake.
Generalisability The systematic review included RCTs conducted on 70 subjects from Australia and Europe published between 2000 and 2014. The effect was seen in normoglycaemic subjects and in subjects diagnosed with metabolic syndrome.
i
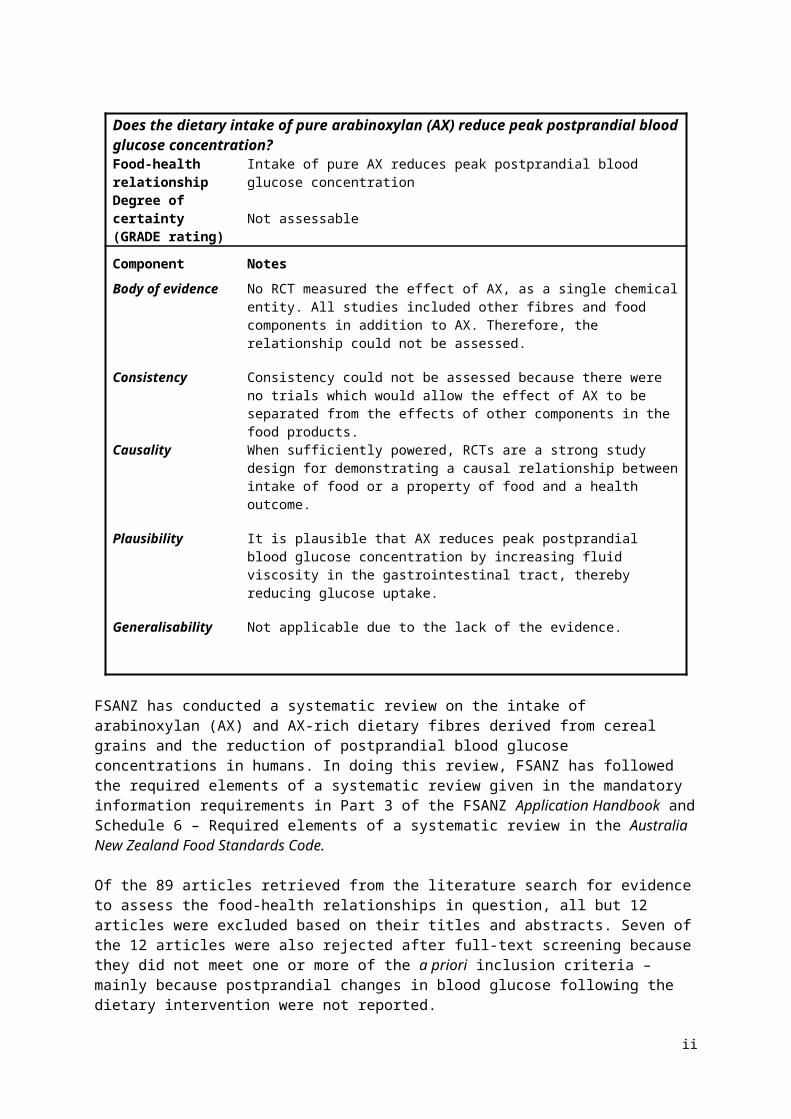
Does the dietary intake of pure arabinoxylan (AX) reduce peak postprandial blood glucose concentration?Food-health relationship Intake of pure AX reduces peak postprandial blood glucose concentration
Degree of certainty (GRADE rating)
Not assessable
Component Notes
Body of evidence No RCT measured the effect of AX, as a single chemical entity. All studies included other fibres and food components in addition to AX. Therefore, the relationship could not be assessed.
Consistency Consistency could not be assessed because there were no trials which would allow the effect of AX to be separated from the effects of other components in the food products.
Causality When sufficiently powered, RCTs are a strong study design for demonstrating a causal relationship between intake of food or a property of food and a health outcome.
Plausibility It is plausible that AX reduces peak postprandial blood glucose concentration by increasing fluid viscosity in the gastrointestinal tract, thereby reducing glucose uptake.
Generalisability Not applicable due to the lack of the evidence.
FSANZ has conducted a systematic review on the intake of arabinoxylan (AX) and AX-rich dietary fibres derived from cereal grains and the reduction of postprandial blood glucose concentrations in humans. In doing this review, FSANZ has followed the required elements of a systematic review given in the mandatory information requirements in Part 3 of the FSANZ Application Handbook and Schedule 6 – Required elements of a systematic review in the Australia New Zealand Food Standards Code.
Of the 89 articles retrieved from the literature search for evidence to assess the food-health relationships in question, all but 12 articles were excluded based on their titles and abstracts. Seven of the 12 articles were also rejected after full-text screening because they did not meet one or more of the a priori inclusion criteria – mainly because postprandial changes in blood glucose following the dietary intervention were not reported.
Five strata from five articles were included in the systematic review and the meta-analysis. All of the identified strata used AX-rich fibre from either wheat or rye in which the AX content ranged from 23 to 63% w/w of the total fibre and contained 3.4 to 8.3 g of AX. The studies were conducted in normoglycaemic adults (n = 40) and in adults diagnosed with metabolic syndrome (n = 30). FSANZ concludes that there is a ‘Moderate’ degree of certainty in the relationship between the intake of AX-rich fibre within a meal and a reduction in the peak postprandial blood glucose concentration.
No studies were identified where AX, as a single chemical entity, was used as an intervention in a clinical trial that measured postprandial blood glucose concentrations. FSANZ concludes that the relationship between the intake of pure AX within a meal and a reduction in the peak postprandial blood glucose concentration is ‘Not assessable’.
ii
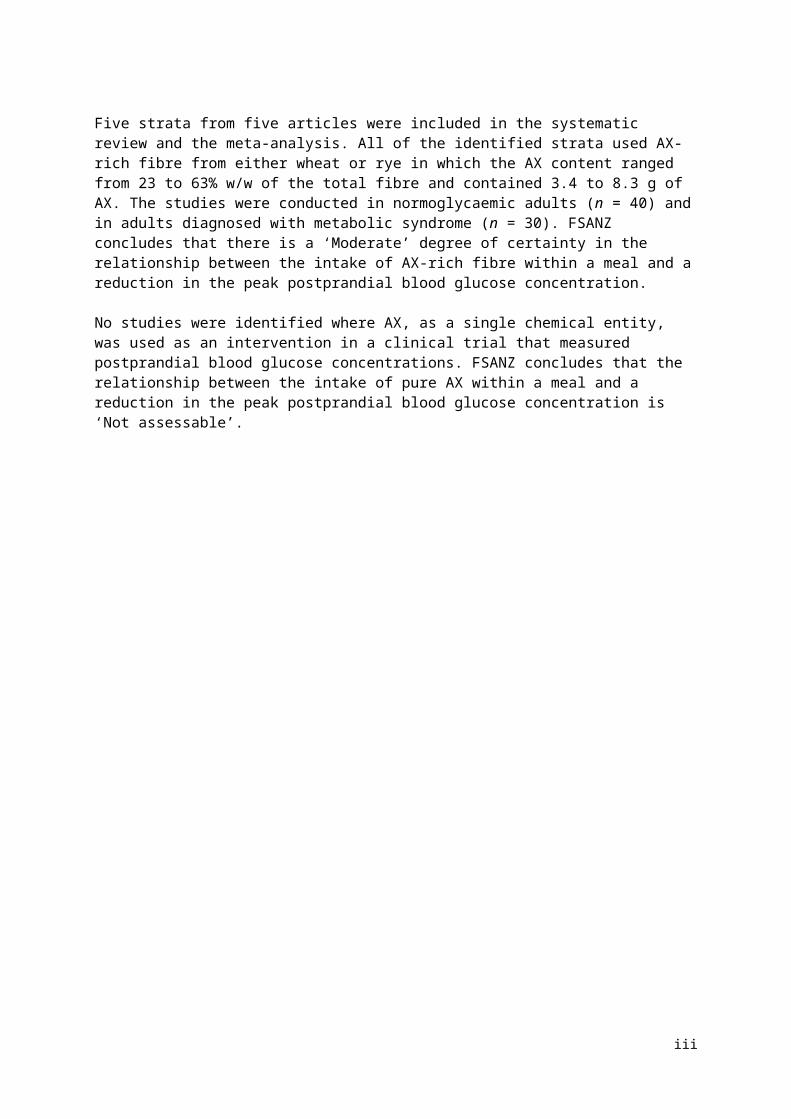
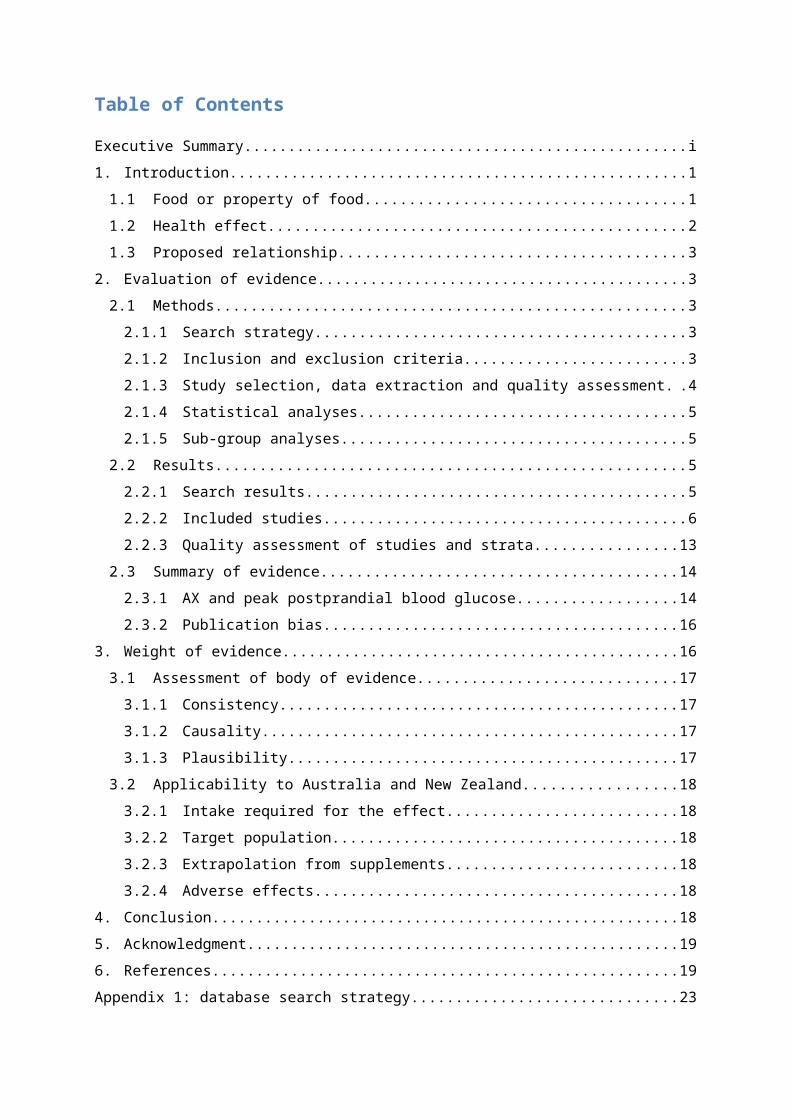
Table of Contents
Executive Summary...................................................................................................................i
1. Introduction........................................................................................................................11.1 Food or property of food.............................................................................................1
1.2 Health effect...............................................................................................................21.3 Proposed relationship.................................................................................................3
2. Evaluation of evidence.......................................................................................................32.1 Methods......................................................................................................................3
2.1.1 Search strategy...................................................................................................32.1.2 Inclusion and exclusion criteria...........................................................................3
2.1.3 Study selection, data extraction and quality assessment....................................42.1.4 Statistical analyses..............................................................................................5
2.1.5 Sub-group analyses............................................................................................52.2 Results........................................................................................................................5
2.2.1 Search results.....................................................................................................52.2.2 Included studies..................................................................................................6
2.2.3 Quality assessment of studies and strata.........................................................132.3 Summary of evidence...............................................................................................14
2.3.1 AX and peak postprandial blood glucose..........................................................142.3.2 Publication bias.................................................................................................16
3. Weight of evidence..........................................................................................................163.1 Assessment of body of evidence..............................................................................17
3.1.1 Consistency.......................................................................................................173.1.2 Causality............................................................................................................17
3.1.3 Plausibility.........................................................................................................173.2 Applicability to Australia and New Zealand..............................................................18
3.2.1 Intake required for the effect.............................................................................183.2.2 Target population..............................................................................................18
3.2.3 Extrapolation from supplements........................................................................183.2.4 Adverse effects..................................................................................................18
4. Conclusion.......................................................................................................................185. Acknowledgment.............................................................................................................19
6. References......................................................................................................................19Appendix 1: database search strategy...................................................................................23
Appendix 2: Studies excluded at full text review.....................................................................24Appendix 3: Risk of bias of strata included in the systematic review......................................25
Appendix 4: GRADE summary of findings tables...................................................................28
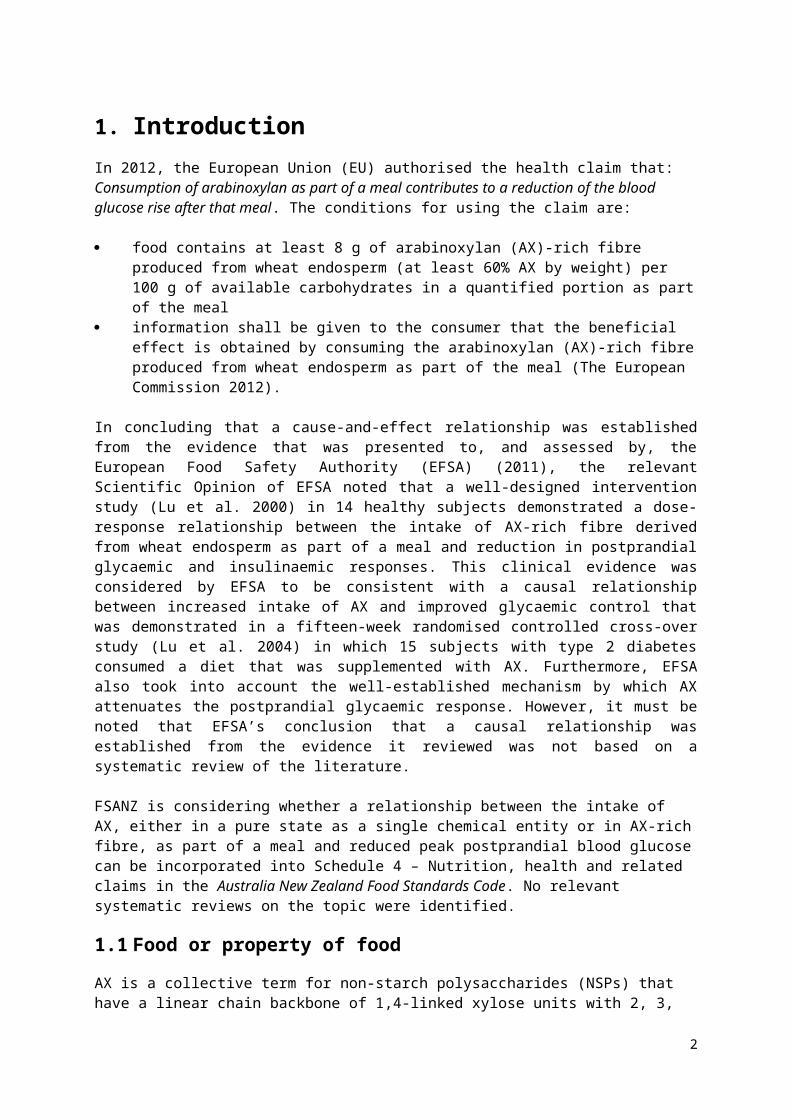
1. IntroductionIn 2012, the European Union (EU) authorised the health claim that: Consumption of arabinoxylan as part of a meal contributes to a reduction of the blood glucose rise after that meal. The conditions for using the claim are:
food contains at least 8 g of arabinoxylan (AX)-rich fibre produced from wheat endosperm (at least 60% AX by weight) per 100 g of available carbohydrates in a quantified portion as part of the meal
information shall be given to the consumer that the beneficial effect is obtained by consuming the arabinoxylan (AX)-rich fibre produced from wheat endosperm as part of the meal (The European Commission 2012).
In concluding that a cause-and-effect relationship was established from the evidence that was presented to, and assessed by, the European Food Safety Authority (EFSA) (2011), the relevant Scientific Opinion of EFSA noted that a well-designed intervention study (Lu et al. 2000) in 14 healthy subjects demonstrated a dose-response relationship between the intake of AX-rich fibre derived from wheat endosperm as part of a meal and reduction in postprandial glycaemic and insulinaemic responses. This clinical evidence was considered by EFSA to be consistent with a causal relationship between increased intake of AX and improved glycaemic control that was demonstrated in a fifteen-week randomised controlled cross-over study (Lu et al. 2004) in which 15 subjects with type 2 diabetes consumed a diet that was supplemented with AX. Furthermore, EFSA also took into account the well-established mechanism by which AX attenuates the postprandial glycaemic response. However, it must be noted that EFSA’s conclusion that a causal relationship was established from the evidence it reviewed was not based on a systematic review of the literature.
FSANZ is considering whether a relationship between the intake of AX, either in a pure state as a single chemical entity or in AX-rich fibre, as part of a meal and reduced peak postprandial blood glucose can be incorporated into Schedule 4 – Nutrition, health and related claims in the Australia New Zealand Food Standards Code. No relevant systematic reviews on the topic were identified.
1.1 Food or property of food
AX is a collective term for non-starch polysaccharides (NSPs) that have a linear chain backbone of 1,4-linked xylose units with 2, 3, or 2 and 3-linked arabinose side chains (Izydorczyk and Biliaderis 1995; Saulnier et al. 2007). AX is a major dietary fibre component of a variety of cereals (Saeed et al. 2011; Damen et al. 2011) such as rye (Secale cereale, 8-12% w/w) and wheat (Triticum spp., 4-9% w/w). The NSPs also occur in rice (Oryza sativa), sorghum (Sorghum bicolor), barley (Hordeum vulgare) and oats (Avena sativa) (Izydorczyk and Biliaderis 1995; Cummings et al. 2009; Pritchard et al. 2011), although the amounts vary depending on genetic variation and environmental conditions (Martinant et al. 1999; Andersson et al. 2009). AX can be classified as either water-soluble or water-insoluble. Water-soluble AX is loosely bound to the surface of the cell wall. By contrast, water-insoluble AX is retained in the cell wall by covalent and non-covalent bonds with other cell wall components, such as proteins, lignans or lignin (Courtin and Delcour 2002; Hromádková et al. 2013; Rosicka-Kaczmarek et al. 2016).
In both wheat and rye, approximately 30% of the AX content is water-soluble (Hansen et al. 2003; Ordaz-Ortiz and Saulnier 2005) and the extent of solubility depends primarily on the degree of branching, the branching profile, and the arabinose-to-xylan ratio (Ebringerová et al. 1990; Hromádková et al. 2013). Water-soluble AX increases the viscosity of the intestinal
1

fluids, whereas water-insoluble AX coats highly digestible nutrients making them inaccessible to digestive enzymes (Rosicka-Kaczmarek et al. 2016).
When extracted, purified, and added as an ingredient, AX can impart technological properties to food (e.g. bakery products) such as an increased water binding capacity, foam stability, modified textural properties and improved shelf-life (Vinkx and Delcour 1996; Döring et al. 2016).
For the purpose of these food-health relationships, AX-rich fibres and AX (as a single chemical entity) derived from any cereal grain were considered. Furthermore, AX-rich fibre is, for the purpose of the review, defined as a product obtained from cereals and grains by a process that concentrates the AX content by removing digestible starch. Whole grain cereals or their products that are not enriched in AX are not considered in this review.
1.2 Health effect
Blood glucose rise after a meal is a normal physiological response as glucose is liberated from food and then absorbed or generated from the carbohydrate content of food (Venn and Green 2007). This rise in plasma glucose induces insulin release from the islet cells of the pancreas into the bloodstream, which in turn facilitates uptake into muscle and fat cells. When blood glucose concentrations fall too low, the peptide hormone glucagon is released from α-cells in the pancreas, which stimulates the liver to convert stored glycogen into glucose. Thus, the interplay between insulin and glucagon keeps blood glucose concentrations tightly controlled.
However, in the case of insulin insensitivity, the glucose present in the blood is inefficiently transported into cells, most likely due to a lipid-induced breakdown in insulin initiated signal transduction (Samuel and Shulman 2012). Therefore it is relevant to examine whether the dietary intervention causes unexpected changes in insulin concentrations.
There are a number of ways of measuring changes in blood glucose concentration after a meal. Researchers report fasting serum values and then following an intervention, typically every 10, 15 or 30 minutes for anywhere between 120 minutes to 5 hours. These serial clinical measures are taken using an indwelling catheter under laboratory conditions. In the literature, commonly reported serum measures of postprandial blood glucose concentrations include: time to peak, rate of rise, peak, incremental peak, mean, incremental mean, 2-hour glucose concentration, area under the blood glucose concentration curve (AUC) (which may be over differing time points), and incremental area under the blood glucose concentration curve (iAUC). The highest value measured is often referred to as ‘peak glucose’ even though most studies measure glucose intermittently and so cannot determine the true peak. In addition, the true peak might occur at different times in people consuming different types of food or in people with normal as compared to those with abnormal glucose metabolism. There is no agreement among researchers as to which of these various outcome measures is the most relevant for assessing the physiological impact of changes in postprandial blood glucose concentrations.
After consultation with FSANZ’s Health Claims Scientific Advisory Group, peak glucose was chosen as the most appropriate measure of postprandial blood glucose concentrations because this is the most uniformly reported measurement and also measures immediate postprandial effect. FSANZ has selected the highest reported blood glucose concentration measurement after ingestion of a meal or glucose drink as the parameter to quantitatively evaluate in a meta-analysis. This will hereafter be referred to as the peak. FSANZ is aware that the true peak may not have been measured or reported.
2
Normal fasting glucose concentration was defined as ≤5.5 mmol/L, impaired glucose tolerance was defined as 5.6–6.9 mmol/L and diabetes was defined as ≥7.0 mmol/L (Diabetes Australia 2012).
1.3 Proposed relationship
FSANZ regards the reference to ‘as part of a meal’ in the EU claim under consideration to be a wording condition of function claims under Article 13.1 in the EU. The relationships assessed by FSANZ therefore examined relevant evidence from studies in which the interventions were presented as ‘meals’ that did not necessarily contain macronutrients such as fat and protein.
The food-health relationships being assessed in this report are:
Dietary intake of AX-rich fibre reduces peak postprandial blood glucose concentration.
Dietary intake of pure AX reduces peak postprandial blood glucose concentration.
2. Evaluation of evidenceA systematic review of the literature was performed to assess the proposed food-health relationships. The effect of AX-rich fibres and pure AX on peak blood insulin concentrations was also assessed because an increase in postprandial blood insulin concentration that occurred with a decrease in blood glucose concentration would be considered an adverse effect.
2.1 Methods
2.1.1 Search strategy
A search was conducted in Embase® (OVID) on 29 July 2016 and in PubMed and Cochrane CENTRAL on 1 August 2016 to retrieve literature on evidence to assess the food-health relationships. Detailed search strategies are presented in Appendix 1. Hand-searching was performed on the reference lists of articles screened on full-text.
2.1.2 Inclusion and exclusion criteria
The eligibility criteria are summarised in Table 1. To be included in the systematic review, an article must state that the trial was randomised or describe an allocation method that suggests randomisation, such as Latin Square, and include an appropriate control group. Parallel and cross-over designs were acceptable. Sequential designs were excluded because in such designs all subjects receive meals in the same order without randomisation.
With a sufficient washout period before the intervention, the absence of double-blinding for participants or observers was not treated as an exclusion criterion because the postprandial blood glucose concentration is measured within two hours of the intervention by standard laboratory methods. Therefore, there is very limited opportunity for non-compliance factors by participants or observers to affect the assessment results.
There were no restrictions on the grain from which AX had been extracted or concentrated as long as the dietary fibre contained AX higher than the naturally occurring average content in the source material.
3
Table 1: PICOTS criteria for study selection
Population Non-acutely ill people.
Intervention Pure AX or AX-rich fibre from a grain source consumed with a meal.
Comparator Placebo or the same food with a differing amount of pure AX or AX-rich fibre.
Outcome Peak postprandial blood glucose concentration.
Time At least 90 minutes of reported postprandial blood glucose concentration measurements.
Study design Randomised controlled trial (RCT).
The intervention had to occur at a single eating occasion, with blood glucose concentrations measured after consumption of the meal for at least 90 minutes.
Trials involving acutely ill subjects were excluded. However, studies involving subjects using medication that affect or control blood glucose were not excluded unless the medication regimes between control and test groups differed. Subjects diagnosed with metabolic syndrome have been defined according to the International Diabetes Federation’s definition (Alberti et al. 2005; Hartvigsen et al. 2014b; Hartvigsen et al. 2014a) following certain measurements such as the levels of blood cholesterol (HDL < 1.03-1.29 mmol/L in men and women, respectively), blood pressure (systolic ≥ 130 mmHg, diastolic ≥ 85 mmHg) and fasting plasma glucose concentrations (≥ 5.6 mmol/L).
2.1.3 Study selection, data extraction and quality assessment
Records identified during the search process were imported into EPPI-Reviewer 4 (http://eppi.ioe.ac.uk/cms/er4). Following removal of duplicates, records were screened on title and abstract. Candidate full-text articles were retrieved and assessed against the inclusion and exclusion criteria. Screening was conducted by one researcher.
Peak postprandial blood glucose concentration was, for the purpose of our meta-analysis, defined as the maximum point on the blood glucose concentration-time curve or the maximum result that was recorded over the blood sampling period. If blood glucose concentration-time curves were reported, then the web-based open access software package WebPlotDigitizer V3.9 was used to extract data, otherwise numerical data was used to calculate the mean effect size.
Some studies had several intervention arms. To prevent double counting of the control group by using it to calculate more than one difference (Higgins and Green 2011), only one intervention group was chosen from multi-arm studies. Furthermore, the arms chosen in multi strata studies that tested the same amounts of both available carbohydrate and AX were those that most closely approximated a meal in a normal diet.
4
Blood glucose concentration results, information regarding the composition of the interventions and the risk of bias assessment were extracted by two investigators. An assessment of the quality of each of the included strata was based on consideration of the following: a) a clearly stated hypothesisb) minimisation of biasc) adequate control for confounding d) the study participants’ background diets and other relevant lifestyle factorse) study duration and follow-up adequate to demonstrate the health effectf) the statistical power to test the hypothesis.
The individual and the overall risk of bias of included studies was conducted according to the Cochrane Handbook (Higgins and Green 2011). The quality of the body of evidence was assessed using the GRADE Framework (Guyatt et al. 2008; Guyatt et al. 2011).
2.1.4 Statistical analyses
Following data extraction, changes in peak postprandial blood glucose concentrations were calculated. Given that the included studies used a crossover design, the difference in peak postprandial blood glucose concentrations was calculated as the following:
Difference = Glucose(peak in intervention) – Glucose(peak in control)
The standard error (SEM) for the difference in blood glucose concentrations was calculated as:
SEM = √[(SEM(peak in intervention)2 + SEM(peak in control)
2) – 2r(SEM(peak in intervention))(SEM(peak in control))]
The correlation coefficient (r) in the above formula was imputed as 0.6 based on the intra-class correlation obtained from a linear mixed model fitted on 150 people with between one and 12 replicate measurements of capillary blood glucose taken at baseline and 30 minutes after consuming 50 g of glucose in a fasting state (data supplied by Sydney University’s Glycaemic Index Research Service, personal communication, 2015).
Meta-analysis was performed using a random effects model and the generic inverse variance method. The meta-analysis was performed using RevMan version 5.3 (The Nordic Cochrane Centre 2014).
I2 was used to assess heterogeneity among the strata. It describes the “percentage of total variation across studies that is due to heterogeneity rather than chance”. 0%, 25%, 50% and 75% can be interpreted as indicating no, low, medium and high heterogeneity, respectively (Higgins et al. 2003; Higgins and Green 2011).
2.1.5 Sub-group analyses
Sub-group analysis was carried out to explore the effect sizes in normoglycaemic subjects and in subjects diagnosed with metabolic syndrome.
2.2 Results
2.2.1 Search results
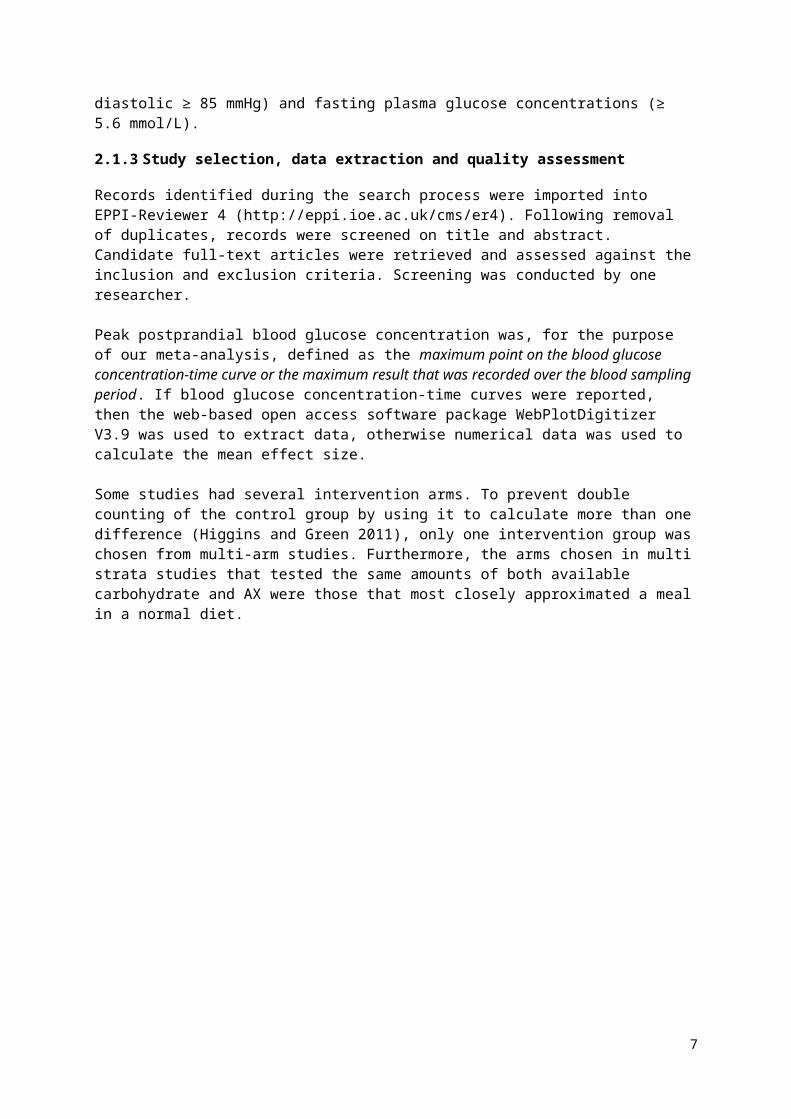
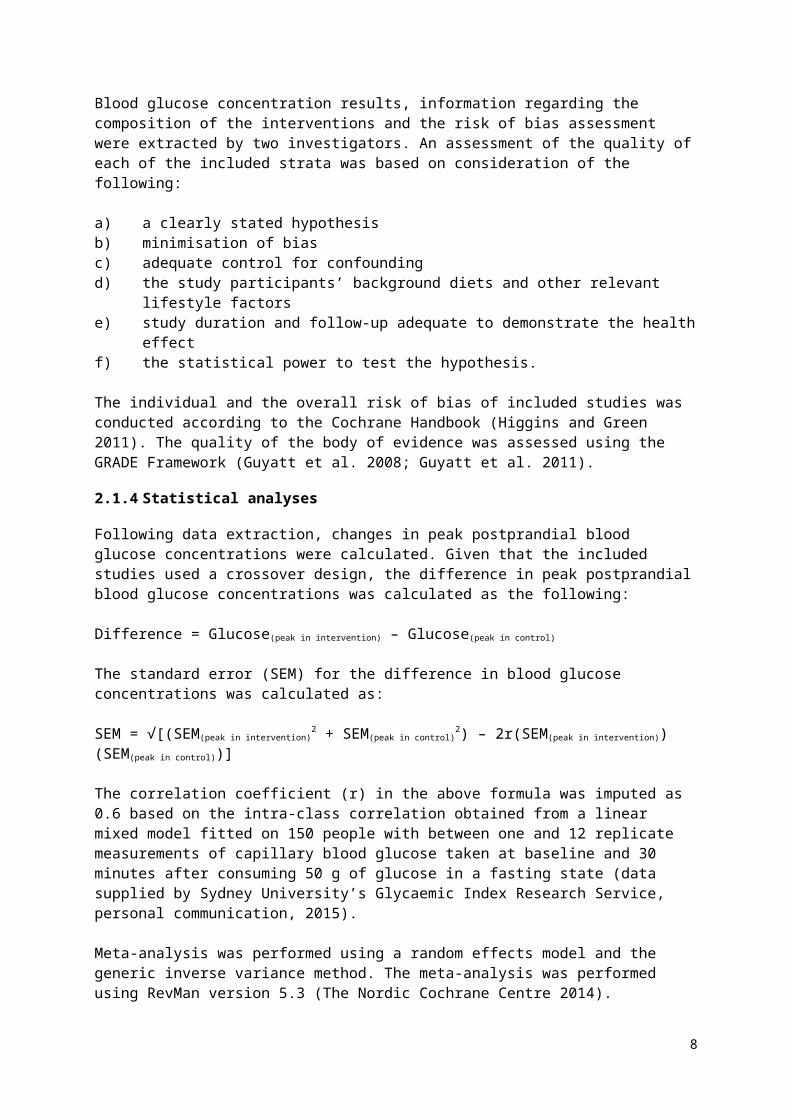
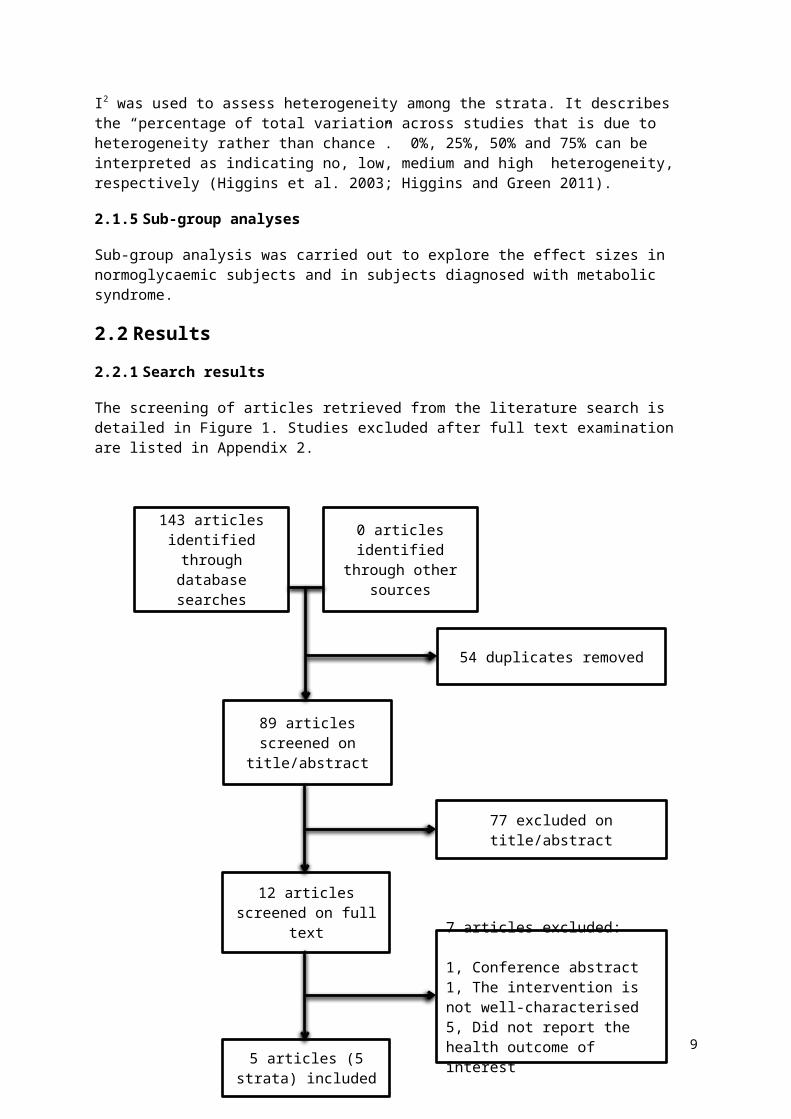
The screening of articles retrieved from the literature search is detailed in Figure 1. Studies excluded after full text examination are listed in Appendix 2.
5
Figure 1. PRISMA diagram of the study identification process.
2.2.2 Included studies
There were 12 articles screened on full text of which 7 were excluded because the studies reported in those articles did not meet one or more of the PICOTS criteria (Appendix 2). The included strata were from studies conducted in Australia (1 RCT) and in Europe (4 RCTs).
6
0 articles identified through other
sources
7 articles excluded:
1, Conference abstract1, The intervention is not well-characterised5, Did not report the health outcome of interest
5 articles (5 strata) included
77 excluded on title/abstract
12 articles screened on full text
54 duplicates removed
89 articles screened on title/abstract
143 articles identified through
database searches
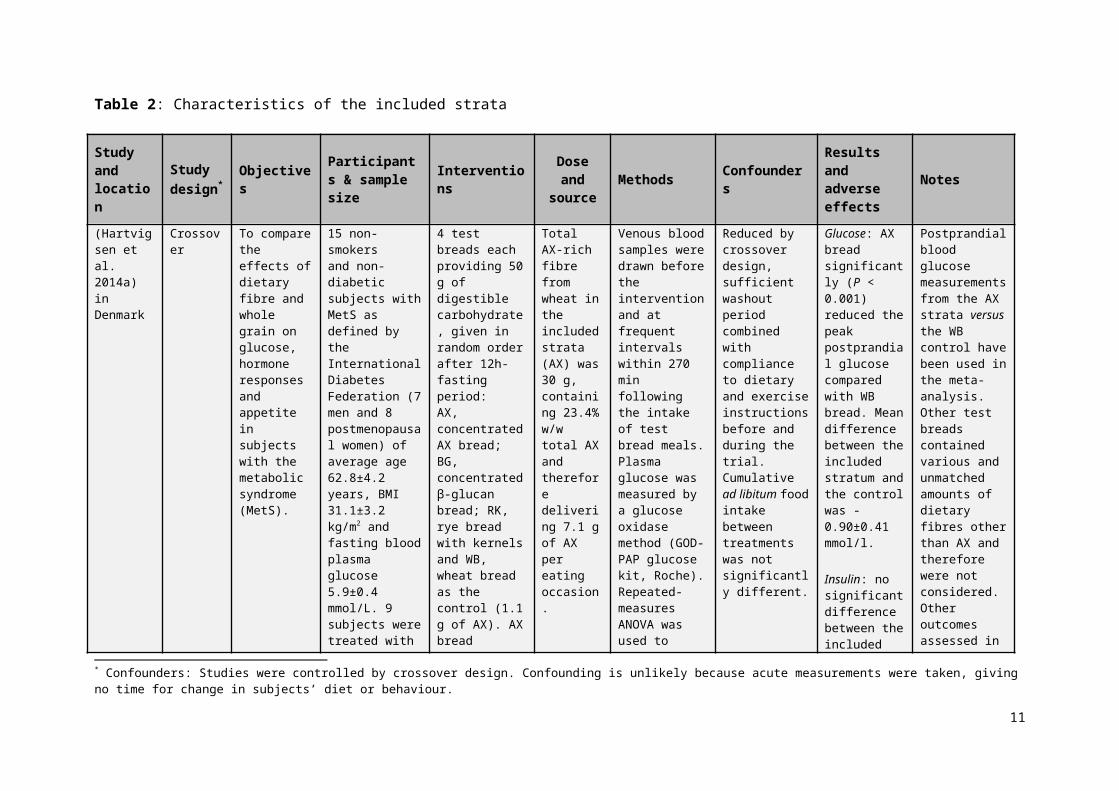
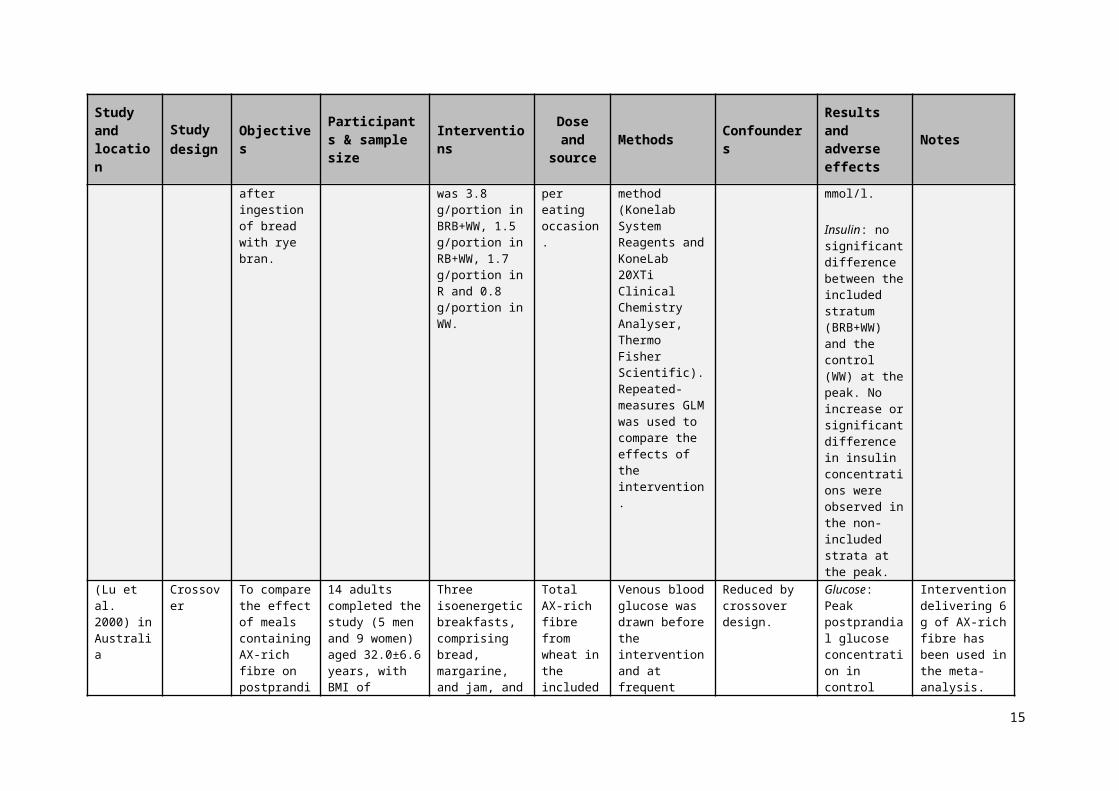
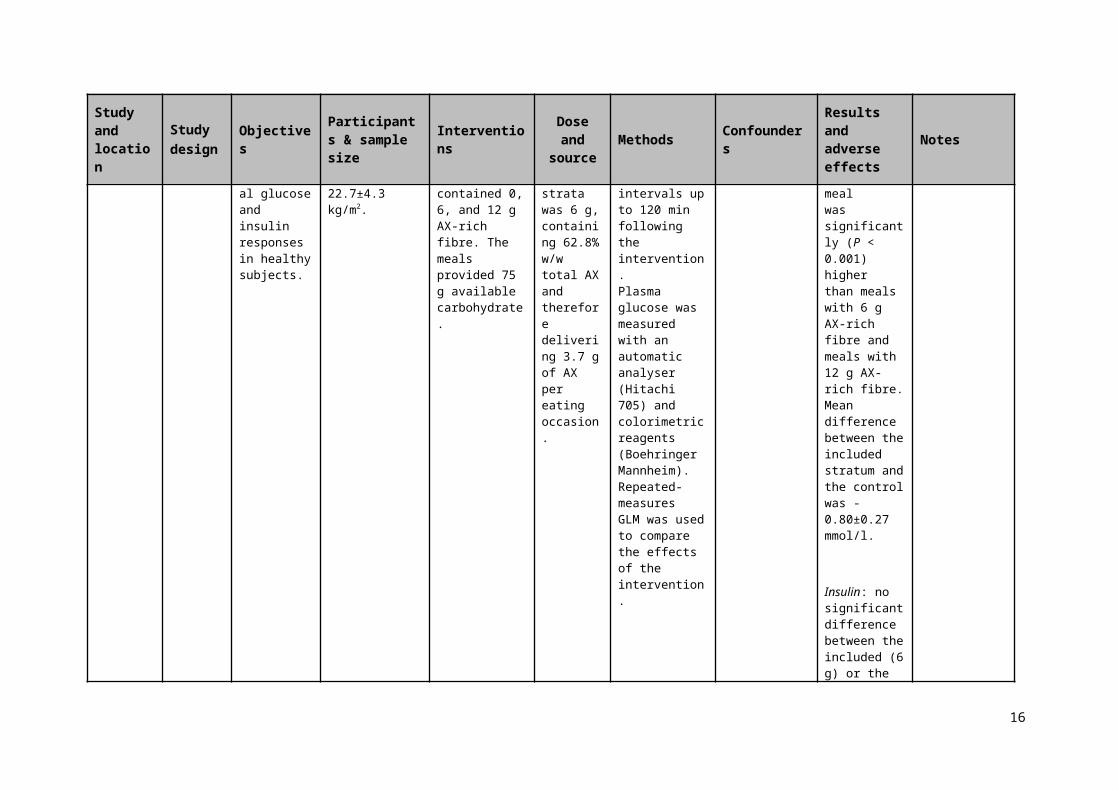
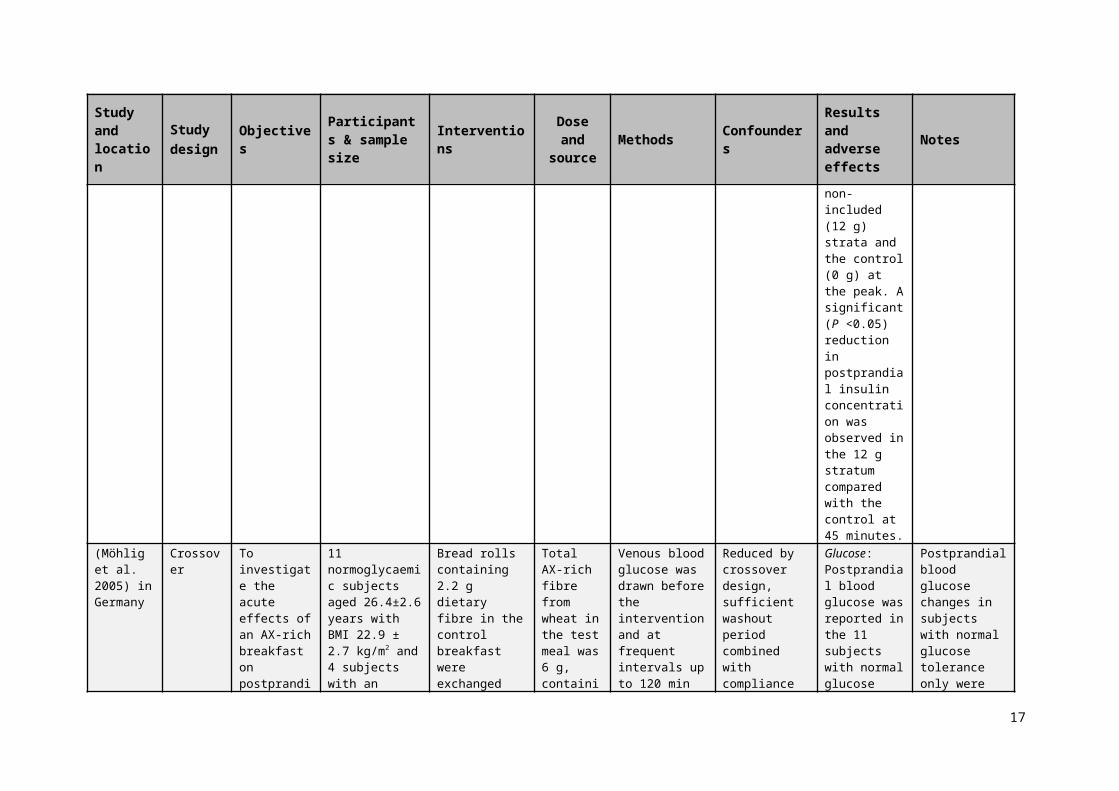
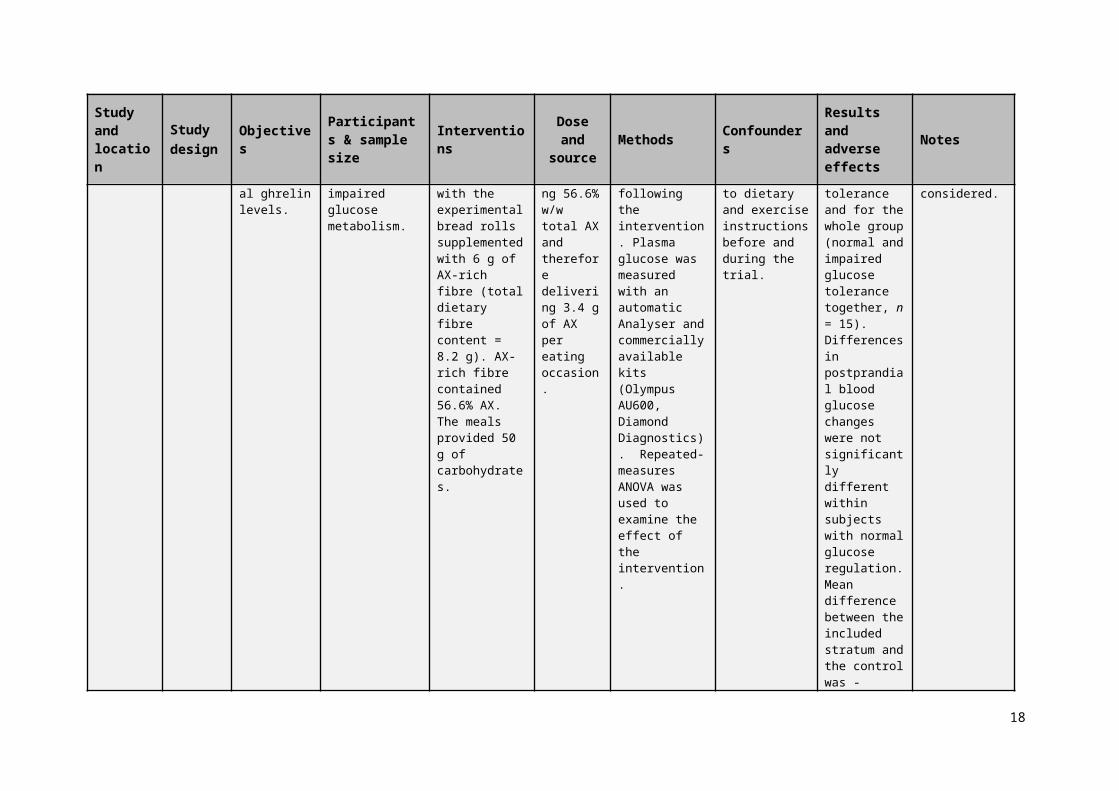
Table 2: Characteristics of the included strata
Study and location
Study design* Objectives Participants &
sample size Interventions Dose and source Methods Confounders
Results and adverse effects
Notes
(Hartvigsen et al. 2014a) in Denmark
Crossover To compare the effects of dietary fibre and whole grain on glucose, hormone responses and appetite in subjects with the metabolicsyndrome (MetS).
15 non-smokersand non-diabetic subjects with MetS as defined by the International DiabetesFederation (7 men and 8 postmenopausal women) of average age 62.8±4.2 years, BMI 31.1±3.2 kg/m2 and fasting blood plasma glucose 5.9±0.4 mmol/L. 9 subjects were treated with blood pressure-lowering medication and 7 with cholesterol-lowering medication. Power calculation was conducted a priori.
4 test breads each providing 50 g of digestible carbohydrate, given in random order after 12h- fasting period:AX, concentrated AX bread; BG, concentrated β-glucan bread; RK, rye bread with kernels and WB, wheat bread as the control (1.1 g of AX). AX bread contained 7.1 g AX-rich fibre (contained 23.4% AX) with minor amounts of β-glucan (0.3 g) and resistant starch (0.7 g) per portion (136 g).
Total AX-rich fibre from wheat in the included strata (AX) was 30 g, containing 23.4% w/w total AX and therefore delivering 7.1 g of AX per eating occasion.
Venous blood samples were drawn before the intervention and at frequent intervals within 270 min following the intake of test bread meals. Plasma glucose was measured by a glucose oxidase method (GOD-PAP glucose kit, Roche). Repeated-measures ANOVA was used to examine the effect of test breads and time on the postprandial glucose responses.
Reduced by crossover design, sufficient washout period combined with compliance to dietary and exercise instructions before and during the trial. Cumulative ad libitum food intake between treatments was not significantly different.
Glucose: AX bread significantly (P < 0.001) reduced the peak postprandial glucose compared with WB bread. Mean difference between the included stratum and the control was -0.90±0.41 mmol/l.
Insulin: no significant difference between the included strata (AX) and the control (WB) at the peak. No increase or significant difference in insulin concentrations were observed
Postprandial blood glucose measurements from the AX strata versus the WB control have been used in the meta-analysis. Other test breads contained various and unmatched amounts of dietary fibres other than AX and therefore were not considered. Other outcomes assessed in this trial (e.g. satiety) are not relevant to this review. The authors have been contacted and confirmed that the peak postprandial glucose concentrations in Table 4 are
* Confounders: Studies were controlled by crossover design. Confounding is unlikely because acute measurements were taken, giving no time for change in subjects’ diet or behaviour.
7
Study and location
Study design
Objectives Participants & sample size Interventions Dose and
source Methods ConfoundersResults and adverse effects
Notes
in the non-included strata at the peak.
the accurate values compared to the mismatching values in Figure 1a.
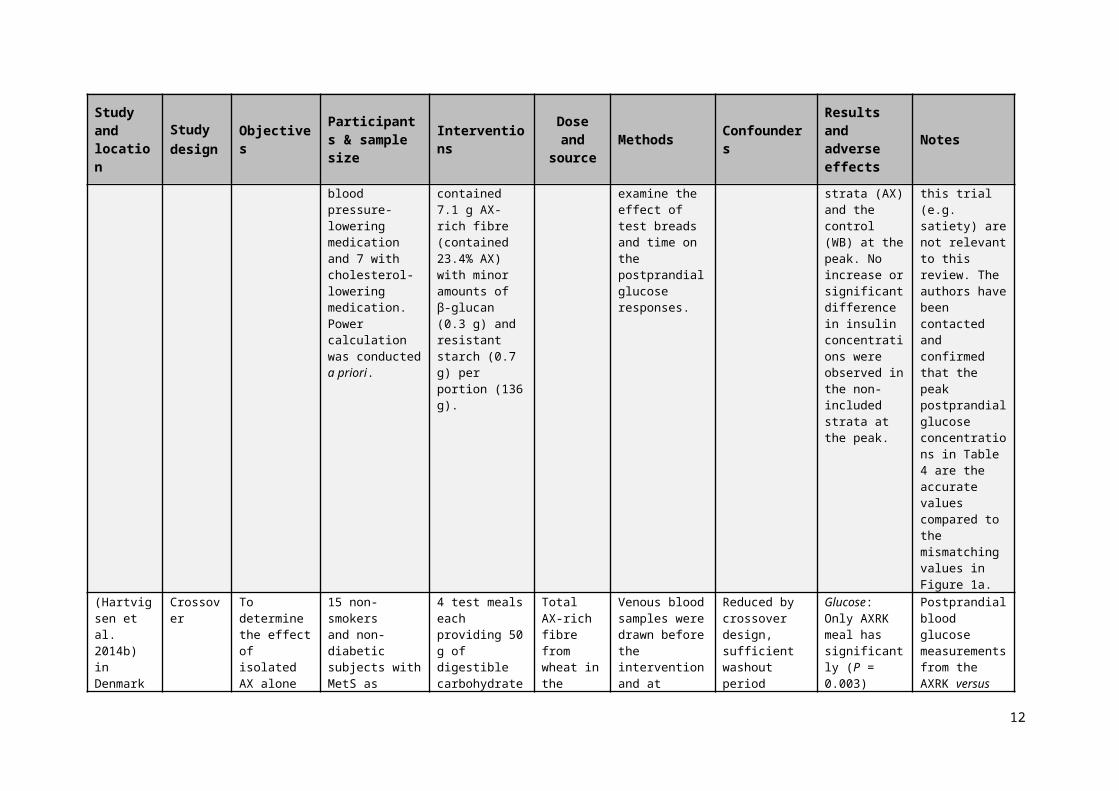
(Hartvigsen et al. 2014b) in Denmark
Crossover To determine the effect of isolatedAX alone or in combination with whole grain rye kernels on postprandial glucose, insulin, FFA, gut hormones, SCFA and appetite in subjects with MetS.
15 non-smokersand non-diabetic subjects with MetS as defined by the International DiabetesFederation (8 men and 7 postmenopausal women) of average age 63.5± 5 years, BMI 31.3± 2.7 kg/m2 and fasting blood plasma glucose 5.9±0.4 mmol/L. 12 subjects were treated with blood pressure lowering medication and 7 with cholesterol-lowering medication. Power calculation was conducted a priori.
4 test meals eachproviding 50 g of digestible carbohydrate were given in random order after 12h- fasting period as follows: semolina porridge with concentrated arabinoxylan (AX) has 3.5 g AX, rye kernels (RK) has 4.7 g AX or concentrated arabinoxylan combined with rye kernels (AXRK) has 4.4 g AX and semolina porridge as control (SE) which has 0.9 AX.
Total AX-rich fibre from wheat in the included strata (AXRK) was 19 g, containing 23.1% w/w total AX and therefore delivering 4.4 g of AX per eating occasion.
Venous blood samples were drawn before the intervention and at frequent intervals within 270 min following the intake of test bread meals. Plasma glucose was measured by a glucose oxidase method (GOD-PAP glucose kit, Roche). Repeated-measures ANOVA was used to examine the effect of test breads and time on the postprandial glucose responses.
Reduced by crossover design, sufficient washout period combined with compliance to dietary and exercise instructions before and during the trial.
Glucose: Only AXRK meal has significantly (P = 0.003) reduced thepeak postprandial glucose compared with SE.Mean difference between the included strata and the control was -0.94±0.40 mmol/l.
Insulin: significantly (P <0.001) lower in the included stratum (AXRK) compared with the control at the peak. No increase or significant difference in
Postprandial blood glucose measurements from the AXRK versus the SE control have been used in the meta-analysis. Other outcomes assessed in this trial (e.g. satiety) are not relevant to this review.
8
Study and location
Study design
Objectives Participants & sample size Interventions Dose and
source Methods ConfoundersResults and adverse effects
Notes
insulin concentrations were observed in the non-included strata at the peak.
(Lappi et al. 2013) in Finland
Crossover To investigate whether bioprocessed rye branin bread can improve postprandialglucose and insulin responses. Also to investigate phenolic acids absorption after ingestion of bread with rye bran.
15 healthy subjects (9 females and six males) with average age of 52 years and average BMI of 26 kg/m2 started and finished the study.
White wheat breads providing 50 g of carbohydrates and fortified withbioprocessed (BRB+WW) or native rye bran (RB+WW), and wholegrain rye bread (R) and white wheat bread (WW) as controls. Soluble AX was 3.8 g/portion in BRB+WW, 1.5 g/portion in RB+WW, 1.7 g/portion in R and 0.8 g/portion in WW.
Total AX-rich fibre from rye in the included strata (BRB+WW) was 17 g, containing 50% w/w total AX and therefore delivering 8.3 g of AX per eating occasion.
Venous blood glucose was drawn before the intervention and at frequent intervals up to 240 min following the intervention. Plasma glucose was measured using the glucose dehydrogenasephotometric method (Konelab System Reagents and KoneLab20XTi Clinical Chemistry Analyser, Thermo Fisher Scientific). Repeated-measures GLM was used to compare the effects of the intervention.
Minimised by crossover design, sufficient washout period and the subjects’ compliance to dietary instructions before and during the trial.
Glucose: Postprandial blood glucose responses, including at the peak, were similar between the test breads. Mean difference between the included stratum and the control was -0.40±0.21 mmol/l.
Insulin: no significant difference between the included stratum (BRB+WW) and the control (WW) at the peak. No increase or significant difference in insulin
Peak postprandial blood glucose in BRB+WW was compared with that in WW as a control.
9
Study and location
Study design
Objectives Participants & sample size Interventions Dose and
source Methods ConfoundersResults and adverse effects
Notes
concentrations were observed in the non-included strata at the peak.
(Lu et al. 2000) in Australia
Crossover To compare the effect of meals containingAX-rich fibre on postprandial glucose and insulin responses in healthy subjects.
14 adults completed the study (5 men and 9 women) aged 32.0±6.6 years, with BMI of 22.7±4.3 kg/m2.
Three isoenergetic breakfasts, comprisingbread, margarine, and jam, and contained 0, 6, and 12 g AX-rich fibre. The meals provided 75 g available carbohydrate.
Total AX-rich fibre from wheat in the included strata was 6 g, containing 62.8% w/w total AX and therefore delivering 3.7 g of AX per eating occasion.
Venous blood glucose was drawn before the intervention and at frequent intervals up to 120 min following the intervention.Plasma glucose was measured with an automaticanalyser (Hitachi 705) and colorimetric reagents (Boehringer Mannheim).Repeated-measuresGLM was used to compare the effects of the intervention.
Reduced by crossover design.
Glucose: Peak postprandial glucose concentration incontrol mealwas significantly (P < 0.001) higher than meals with 6 g AX-rich fibre and meals with 12 g AX-rich fibre. Mean difference between the included stratum and the control was -0.80±0.27 mmol/l.
Insulin: no significant difference between the included (6 g) or the non-included (12 g) strata and the control (0 g) at
Intervention delivering 6 g of AX-rich fibre has been used in the meta-analysis.
10
Study and location
Study design
Objectives Participants & sample size Interventions Dose and
source Methods ConfoundersResults and adverse effects
Notes
the peak. A significant (P <0.05) reduction in postprandial insulin concentration was observed in the 12 g stratum compared with the control at 45 minutes.
(Möhlig et al. 2005) in Germany
Crossover To investigate the acute effects of an AX-rich breakfast on postprandial ghrelin levels.
11 normoglycaemic subjects aged 26.4±2.6 years with BMI 22.9 ± 2.7 kg/m2 and 4 subjects with an impaired glucose metabolism.
Bread rolls containing 2.2 g dietary fibre in the control breakfast were exchanged with the experimental bread rolls supplemented with 6 g of AX-rich fibre (total dietary fibre content = 8.2 g). AX-rich fibre contained 56.6% AX. The meals provided 50 g of carbohydrates.
Total AX-rich fibre from wheat in the test meal was 6 g, containing 56.6% w/w total AX and therefore delivering 3.4 g of AX per eating occasion.
Venous blood glucose was drawn before the intervention and at frequent intervals up to 120 min following the intervention. Plasma glucose was measured with an automaticAnalyser and commercially available kits (Olympus AU600, Diamond Diagnostics). Repeated-measures ANOVA was used to examine the effect of the
Reduced by crossover design, sufficient washout period combined with compliance to dietary and exercise instructions before and during the trial.
Glucose: Postprandial blood glucose was reported in the 11 subjects with normal glucose tolerance and for the whole group (normal and impaired glucose tolerance together, n = 15). Differences in postprandial blood glucose changes were not significantly different within subjects with normal glucose regulation.
Postprandial blood glucose changes in subjects with normal glucose tolerance only were considered.
11
Study and location
Study design
Objectives Participants & sample size Interventions Dose and
source Methods ConfoundersResults and adverse effects
Notes
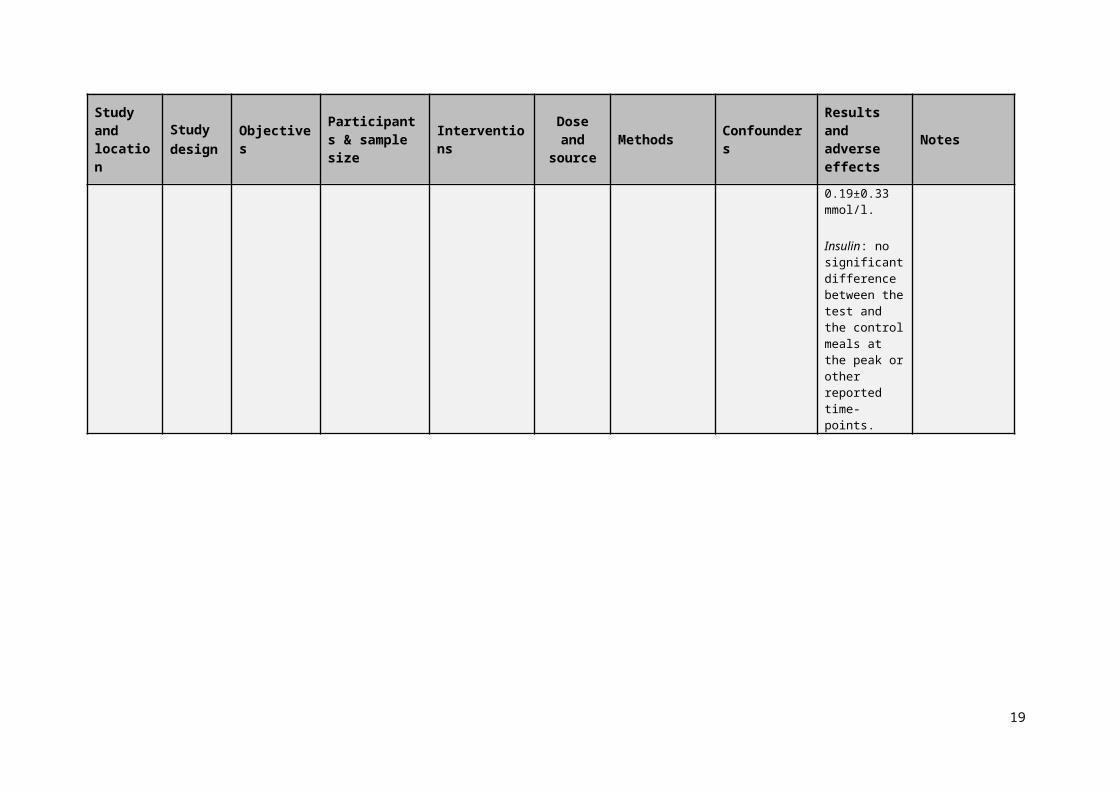
intervention. Mean difference between the included stratum and the control was -0.19±0.33 mmol/l.
Insulin: no significant difference between the test and the control meals at the peak or other reported time-points.
12
2.2.3 Quality assessment of studies and strata
All of the included studies had a clearly stated hypothesis and purpose of testing pure AX or AX-rich fibre and measured the health outcome of interest, i.e. changes in postprandial blood glucose concentration, and reported peak concentrations for each of the treatments.
Adequate control for confounders in the included strata was achieved by designing the studies as crossover RCTs.
Most of the included articles reported that sufficient washout periods and appropriate compliance to the study instructions regarding exercise and the background diet were followed by the subjects. It is important to note that washout periods may not necessarily be an issue because blood glucose concentrations return to baseline within a few hours following the intervention. Moreover, and for the purpose of the current meta-analysis, changes in peak postprandial blood glucose concentrations have been calculated as the difference between the peaks in the intervention and the control groups.
The outcome was measured at different time intervals within at least 2 hours following the intervention which is a sufficient duration to assess changes in postprandial blood glucose. A follow-up on measuring the health outcome is not required due to the short-term effect of the intervention and the changes in the health outcome of interest. Two of the included studies performed a priori power analysis and all of the included studies started with a sample size of subjects that was sufficient to detect the difference (Table 2). The results were analysed by appropriate statistical methods between each time point. One study (Lu et al. 2000) had a high level (23%) of attrition while the other studies had low attrition bias. Reporting bias was considered to be low in the body of evidence.
Venous blood samples were collected and the health outcome was assessed by well-defined analytical methods. Therefore, there is a low risk of detection bias.
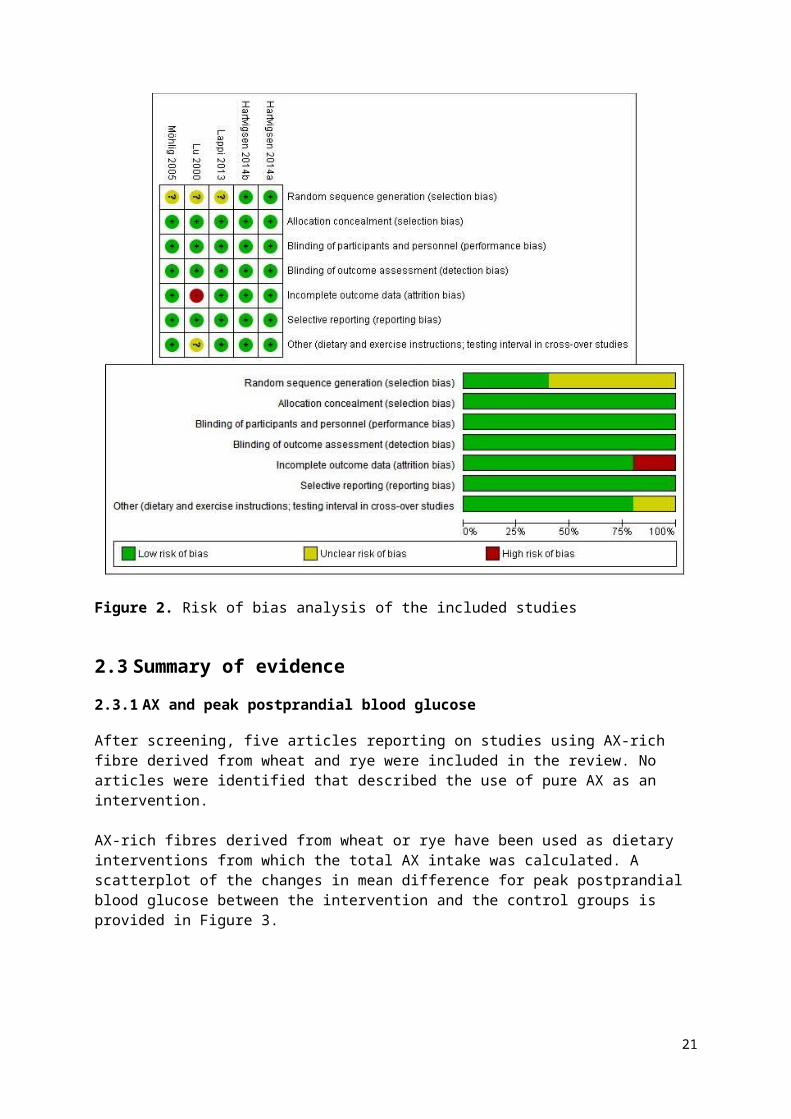
Risk of bias analysis was used to assess the quality of the evidence. There was a low degree of variability in the quality of included trials (Figure 2 and Appendix 3). Overall, the risk of bias was low in the included strata and therefore has no serious effect on the quality of the body of evidence (Appendix 4).
13
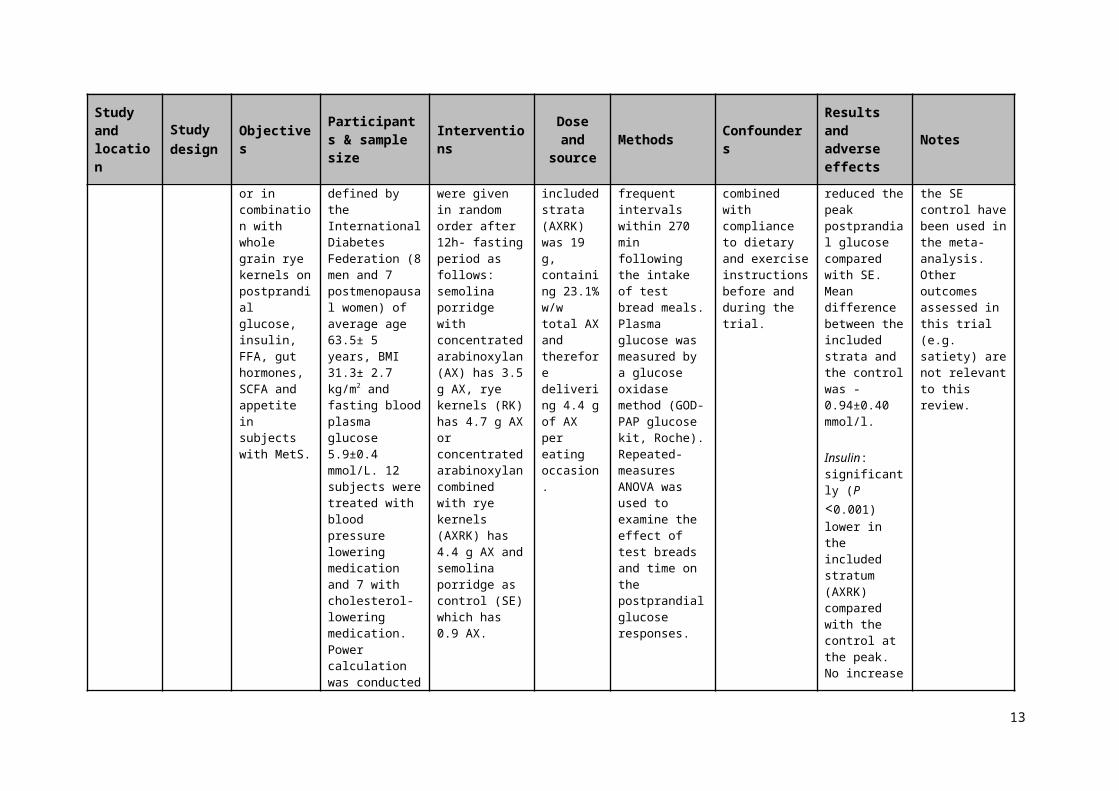
Figure 2. Risk of bias analysis of the included studies
2.3 Summary of evidence
2.3.1 AX and peak postprandial blood glucose
After screening, five articles reporting on studies using AX-rich fibre derived from wheat and rye were included in the review. No articles were identified that described the use of pure AX as an intervention.
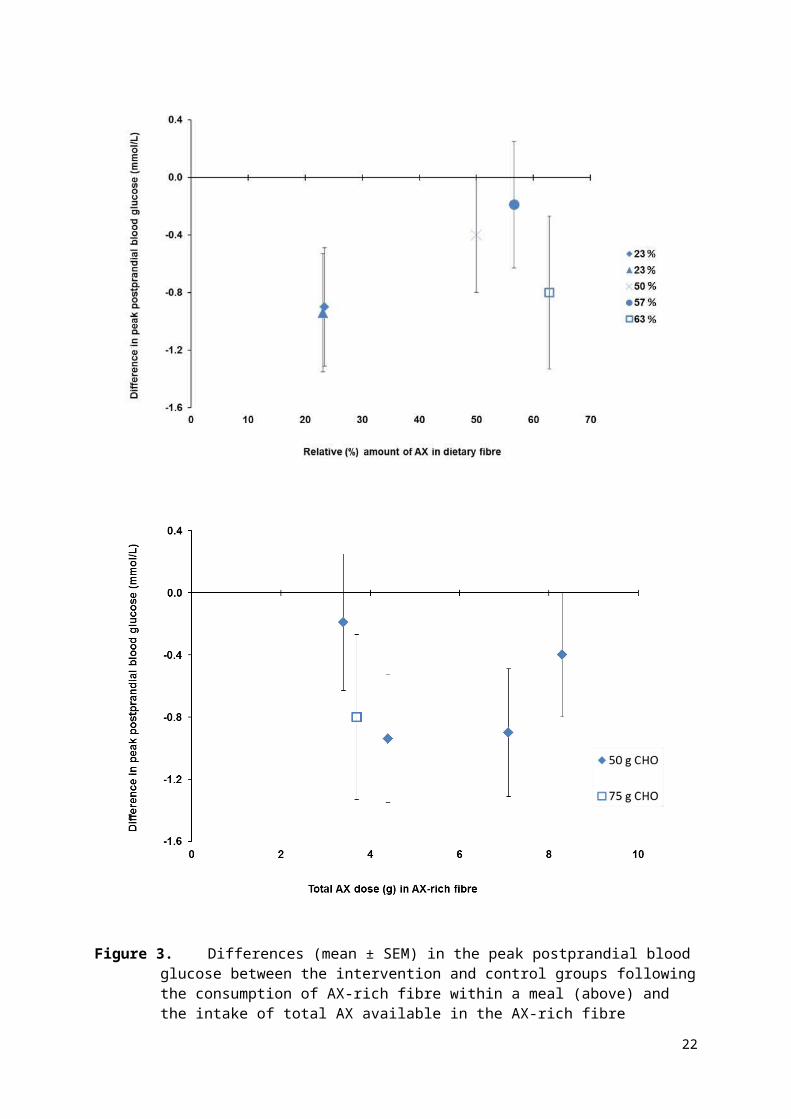
AX-rich fibres derived from wheat or rye have been used as dietary interventions from which the total AX intake was calculated. A scatterplot of the changes in mean difference for peak postprandial blood glucose between the intervention and the control groups is provided in Figure 3.
14
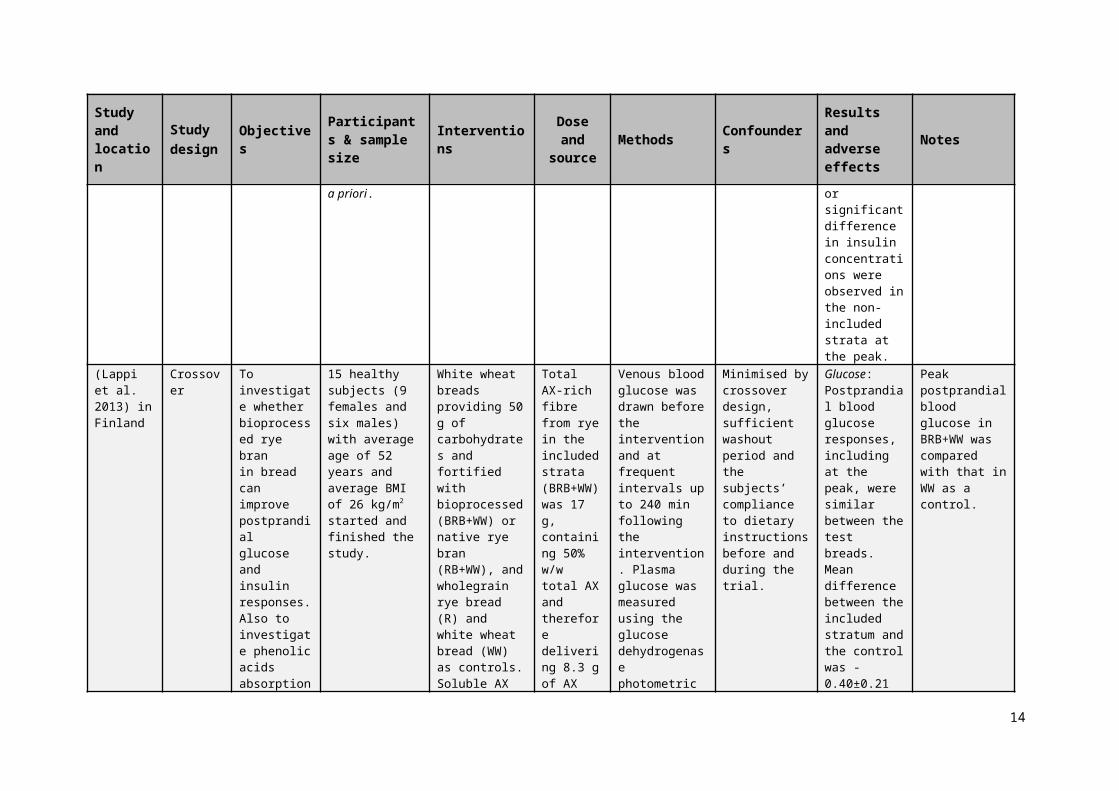
Figure 3. Differences (mean ± SEM) in the peak postprandial blood glucose between the intervention and control groups following the consumption of AX-rich fibre within a meal (above) and the intake of total AX available in the AX-rich fibre consumed within a meal (below). Dietary interventions provided: 50 g of carbohydrate () or 75 g of carbohydrate () from the included strata.
15
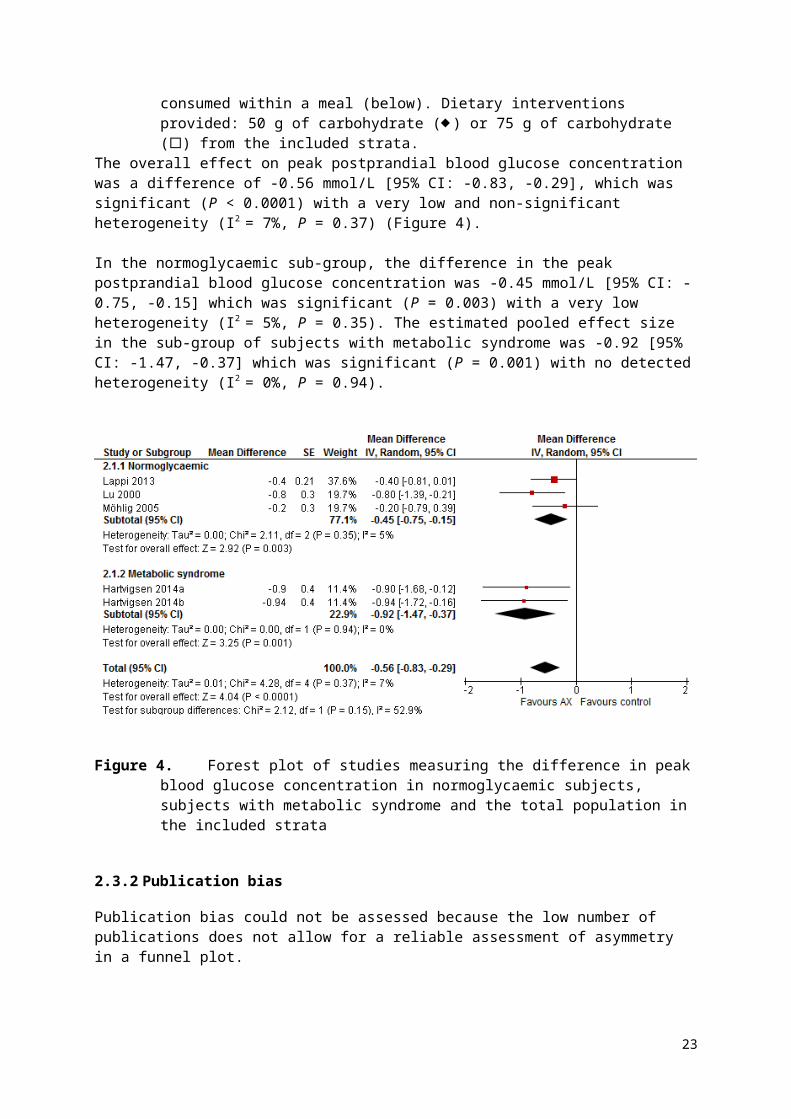
The overall effect on peak postprandial blood glucose concentration was a difference of -0.56 mmol/L [95% CI: -0.83, -0.29], which was significant (P < 0.0001) with a very low and non-significant heterogeneity (I2 = 7%, P = 0.37) (Figure 4).
In the normoglycaemic sub-group, the difference in the peak postprandial blood glucose concentration was -0.45 mmol/L [95% CI: -0.75, -0.15] which was significant (P = 0.003) with a very low heterogeneity (I2 = 5%, P = 0.35). The estimated pooled effect size in the sub-group of subjects with metabolic syndrome was -0.92 [95% CI: -1.47, -0.37] which was significant (P = 0.001) with no detected heterogeneity (I2 = 0%, P = 0.94).
Figure 4. Forest plot of studies measuring the difference in peak blood glucose concentration in normoglycaemic subjects, subjects with metabolic syndrome and the total population in the included strata
2.3.2 Publication bias
Publication bias could not be assessed because the low number of publications does not allow for a reliable assessment of asymmetry in a funnel plot.
3. Weight of evidenceFive strata from five articles were included in the systematic review and the meta-analysis. All of the included strata used AX-rich fibre derived from either wheat or rye, had a relative AX content in the fibre that ranged from 23 to 63% (w/w) and delivered amounts that ranged from 3.4 to 8.3 g of AX per test meal. The studies were conducted in normoglycaemic adults (n = 40) and in adults diagnosed with metabolic syndrome (n = 30). The authors diagnosed the metabolic syndrome symptoms following the definition set by the International Diabetes Federation (Alberti et al. 2005; Hartvigsen et al. 2014b; Hartvigsen et al. 2014a). There were significant reductions in the peak postprandial blood glucose concentration in the total population (n = 70) as well as in each of the two sub-groups of the total population with no and low heterogeneity in the metabolic syndrome subgroup and the normoglycaemic subgroup, respectively.
16
No studies were identified that used the single chemical entity of AX as an intervention in a clinical trial that measured postprandial blood glucose concentrations.
3.1 Assessment of body of evidence
3.1.1 Consistency
There was no serious inconsistency in the evidence base for the effects of AX-rich fibre on the peak postprandial blood glucose concentrations as the 95% confidence intervals for the overall or the sub-groups pooled effect estimates did not reach zero, and overlapped with those for all the studies. All of the included strata showed a reduction in peak postprandial glucose concentration after consuming AX-rich fibre. Heterogeneity was unimportant in the overall or the sub-groups estimates, which suggests that the variation in results among trials can be attributed to random variation around a central value rather than methodological differences between studies or an unexplainable reason.
The consistency of the effects of AX as a single chemical entity on peak postprandial blood glucose could not be assessed because there were no reported trials that would allow the effect of the single chemical entity of AX to be separated from the effects of other components in the food products.
3.1.2 Causality
A RCT is a strong study design for detecting causal relationships. However, the literature search did not identify any RCTs that assessed the effects of consuming pure AX, as a single chemical entity, on peak postprandial blood glucose. Therefore, a causal relationship cannot be demonstrated and the relationship between pure AX as a single chemical entity and peak postprandial blood glucose is non-assessable (Appendix 4).
The meta-analysis of five strata from the five studies that use AX-rich fibre showed a consistent reduction in peak postprandial blood glucose across studies, albeit, with serious imprecision because of the low number of participants (n = 70).The overall body of evidence was derived from high quality studies and was considered to have a low risk of bias. The outcome was measured directly; the confidence intervals were tight and excluded the null effect. However, due to the low number of participants and the resulting uncertainty of their representativeness of the general population, the food-health relationship was down-rated for imprecision, leading to a “Moderate” degree of certainty (Appendix 4).
3.1.3 Plausibility
AX-rich fibre extracted from wheat and rye and taken as part of a meal significantly reduced peak postprandial glucose concentration. Different hypotheses suggest several mechanisms by which AX may affect postprandial blood glucose concentration. The high viscosity of water soluble AX is likely to slow the rate of gastric emptying (Brennan 2005; Hlebowicz et al. 2009) and reduce small intestinal motility (Cherbut et al. 1994; Cloetens et al. 2008), which results in delayed glucose absorption and consequently, a reduced peak postprandial blood glucose concentration. Consumption of non-starch polysaccharides increases the viscosity of the meal bolus in the stomach which reduces mixing of the food with digestive enzymes and delays gastric emptying (Marciani et al. 2001).
17
3.2 Applicability to Australia and New Zealand
3.2.1 Intake required for the effect
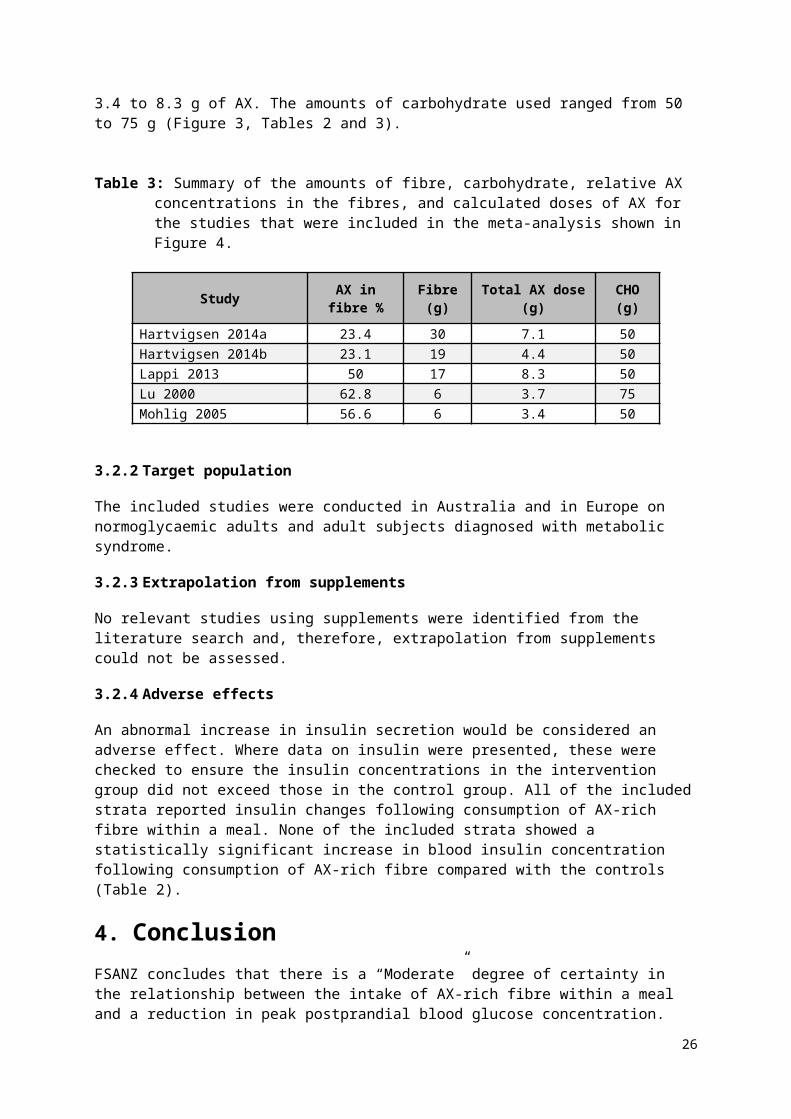
Because the relationship relates to changes in peak postprandial blood glucose concentration, the AX-rich fibre must be consumed in a single eating occasion with a “meal” that raises blood glucose concentration. The amounts of fibre used in the studies that were included in the meta-analysis ranged from 6 to 30 g and contained 3.4 to 8.3 g of AX. The amounts of carbohydrate used ranged from 50 to 75 g (Figure 3, Tables 2 and 3).
Table 3: Summary of the amounts of fibre, carbohydrate, relative AX concentrations in the fibres, and calculated doses of AX for the studies that were included in the meta-analysis shown in Figure 4.
Study AX in fibre % Fibre (g) Total AX dose (g) CHO (g)
Hartvigsen 2014a 23.4 30 7.1 50Hartvigsen 2014b 23.1 19 4.4 50Lappi 2013 50 17 8.3 50Lu 2000 62.8 6 3.7 75Mohlig 2005 56.6 6 3.4 50
3.2.2 Target population
The included studies were conducted in Australia and in Europe on normoglycaemic adults and adult subjects diagnosed with metabolic syndrome.
3.2.3 Extrapolation from supplements
No relevant studies using supplements were identified from the literature search and, therefore, extrapolation from supplements could not be assessed.
3.2.4 Adverse effects
An abnormal increase in insulin secretion would be considered an adverse effect. Where data on insulin were presented, these were checked to ensure the insulin concentrations in the intervention group did not exceed those in the control group. All of the included strata reported insulin changes following consumption of AX-rich fibre within a meal. None of the included strata showed a statistically significant increase in blood insulin concentration following consumption of AX-rich fibre compared with the controls (Table 2).
4. ConclusionFSANZ concludes that there is a “Moderate” degree of certainty in the relationship between the intake of AX-rich fibre within a meal and a reduction in peak postprandial blood glucose concentration. Although the effect reported in available evidence was consistent with a low risk of bias, due to the small number (n = 70) of subjects in the meta-analysis, there were “Serious” imprecision.
18
FSANZ also concludes that the relationship between the intake of pure AX within a meal and a reduction in peak postprandial blood glucose concentration is “Not assessable” due to the lack of evidence.
5. AcknowledgmentWe acknowledge the permission from The Cochrane Collaboration to use the Review Manager software.
6. ReferencesAlberti KGM, Zimmet P, Shaw J (2005) The metabolic syndrome—a new worldwide definition. Lancet 366:1059–1062
Andersson R, Fransson G, Tietjen M, Åman P (2009) Content and molecular-weight distribution of dietary fiber components in whole-grain rye flour and bread. J Agric Food Chem 57:2004–2008
Brennan CS (2005) Dietary fibre, glycaemic response, and diabetes. Mol Nutr Food Res 49:560–570
Cherbut C, Bruley Des Varannes S, Schnee M, Rival M, Galmiche J-P, Delort-Laval J (1994) Involvement of small intestinal motility in blood glucose response to dietary fibre in man. Br J Nutr 71:675
Cloetens L, Broekaert WF, Delaedt Y, Ollevier F, Courtin CM, Delcour JA, Rutgeerts P, Verbeke K (2010) Tolerance of arabinoxylan-oligosaccharides and their prebiotic activity in healthy subjects: a randomised, placebo-controlled cross-over study. Br J Nutr 103:703
Cloetens L, De Preter V, Swennen K, Broekaert WF, Courtin CM, Delcour JA, Rutgeerts P, Verbeke K (2008) Dose-response effect of arabinoxylooligosaccharides on gastrointestinal motility and on colonic bacterial metabolism in healthy volunteers. J Am Coll Nutr 27:512–518
Courtin CM, Delcour JA (2002) Arabinoxylans and endoxylanases in wheat flour bread-making. J Cereal Sci 35:225–243
Cummings J, Mann J, Nishida C, Vorster H (2009) Dietary fibre: an agreed definition. Lancet 373:365–366
Damen B, Verspreet J, Pollet A, Broekaert WF, Delcour JA, Courtin CM (2011) Prebiotic effects and intestinal fermentation of cereal arabinoxylans and arabinoxylan oligosaccharides in rats depend strongly on their structural properties and joint presence. Mol Nutr Food Res 55:1862–1874
Diabetes Australia (2012) Diabetes management in general practice, 18th edn. Diabetes Australia
Döring C, Jekle M, Becker T (2016) Technological and analytical methods for arabinoxylan quantification from cereals. Crit Rev Food Sci Nutr 56:999–1011
Ebringerová A, Hromádková Z, Petráková E, Hricovíni M (1990) Structural features of a water-soluble L-arabino-D-xylan from rye bran. Carbohydr Res 198:57–66
19
EFSA (2011) Scientific Opinion on the substantiation of health claims related to arabinoxylan produced from wheat endosperm and reduction of post-prandial glycaemic responses (ID 830) pursuant to Article 13(1) of Regulation (EC) No 1924/2006. EFSA J 9:2205
Garcia AL, Otto B, Reich S-C, Weickert MO, Steiniger J, Machowetz A, Rudovich NN, Mohlig M, Katz N, Speth M, Meuser F, Doerfer J, Zunft H-JF, Pfeiffer AHF, Koebnick C (2007) Arabinoxylan consumption decreases postprandial serum glucose, serum insulin and plasma total ghrelin response in subjects with impaired glucose tolerance. Eur J Clin Nutr 61:334–341
Garcia AL, Steiniger J, Reich SC, Weickert MO, Harsch I, Machowetz A, Mohlig M, Spranger J, Rudovich NN, Meuser F, Doerfer J, Katz N, Speth M, Zunft H-JF, Pfeiffer AHF, Koebnick C (2006) Arabinoxylan fibre consumption improved glucose metabolism, but did not affect serum adipokines in subjects with impaired glucose tolerance. Horm. Metab. Res. 38:761–766
Guyatt G, Oxman AD, Akl E a., Kunz R, Vist G, Brozek J, Norris S, Falck-Ytter Y, Glasziou P, Debeer H, Jaeschke R, Rind D, Meerpohl J, Dahm P, Schünemann HJ (2011) GRADE guidelines: 1. Introduction - GRADE evidence profiles and summary of findings tables. J Clin Epidemiol 64:383–394
Guyatt GH, Oxman AD, Kunz R, Vist GE (2008) Rating quality of evidence and strength of recommendations: what is “quality of evidence” and why is it important to clinicians. Br Med J 336:995–998
Hansen HB, Rasmussen C V., Bach Knudsen KE, Hansen Å (2003) Effects of genotype and harvest year on content and composition of dietary fibre in rye (Secale cereal L) grain. J Sci Food Agric 83:76–85
Hartvigsen ML, Gregersen S, Lærke HN, Holst JJ, Bach Knudsen KE, Hermansen K (2014a) Effects of concentrated arabinoxylan and β-glucan compared with refined wheat and whole grain rye on glucose and appetite in subjects with the metabolic syndrome: a randomized study. Eur J Clin Nutr 68:84–90
Hartvigsen ML, Laerke HN, Overgaard A, Holst JJ, K.E BK, Hermansen K (2014b) Postprandial effects of test meals including concentrated arabinoxylan and whole grain rye in subjects with the metabolic syndrome: A randomised study. Eur J Clin Nutr 68:567–574
Higgins JPT, Green S (2011) Cochrane handbook for systematic reviews of interventions. Cochrane Collaboration
Higgins JPT, Thompson SG, Deeks JJ, Altman DG (2003) Measuring inconsistency in meta-analyses. BMJ 327:557–60
Hlebowicz J, Jönsson JM, Lindstedt S, Björgell O, Darwich G, Almér L-O (2009) Effect of commercial rye whole-meal bread on postprandial blood glucose and gastric emptying in healthy subjects. Nutr J 8:26
Hromádková Z, Paulsen BS, Polovka M, Košťálová Z, Ebringerová A (2013) Structural features of two heteroxylan polysaccharide fractions from wheat bran with anti-complementary and antioxidant activities. Carbohydr Polym 93:22–30
Izydorczyk MS, Biliaderis CG (1995) Cereal arabinoxylans: advances in structure and physicochemical properties. Carbohydr Polym 28:33–48
Lafond DW, Greaves KA, Maki KC, Leidy HJ, Romsos DR (2015) Effects of two dietary fibers
20
as part of ready-to-eat cereal (RTEC) breakfasts on perceived appetite and gut hormones in overweight women. Nutrients 7:1245–1266
Lappi J, Aura AM, Katina K, Nordlund E, Kolehmainen M, Mykkanen H, Poutanen K (2013) Comparison of postprandial phenolic acid excretions and glucose responses after ingestion of breads with bioprocessed or native rye bran. Food Funct 4:972–981
Lu ZX, Walker KZ, Muir JG, Mascara T, O’Dea K (2000) Arabinoxylan fiber, a byproduct of wheat flour processing, reduces the postprandial glucose response in normoglycemic subjects. Am J Clin Nutr 71:1123–1128
Lu ZX, Walker KZ, Muir JG, O’Dea K (2004) Arabinoxylan fibre improves metabolic control in people with Type II diabetes. Eur J Clin Nutr 58:621–628
Maki KC, Gibson GR, Dickmann RS, W.C KC, YO CC, Costabile A, Comelli EM, McKay DL, Almeida NG, Jenkins D, Zello GA, Blumberg JB, Kendall CWC, Chen C-YO, Costabile A, Comelli EM, McKay DL, Almeida NG, Jenkins D, Zello GA, Blumberg JB (2012) Digestive and physiologic effects of a wheat bran extract, arabino-xylan-oligosaccharide, in breakfast cereal. Nutrition 28:1115–1121
Marciani L, Gowland P a, Spiller RC, Manoj P, Moore RJ, Young P, Fillery-Travis a J (2001) Effect of meal viscosity and nutrients on satiety, intragastric dilution, and emptying assessed by MRI. Am J Physiol - Gastrointest Liver Physiol 280:G1227–33
Martinant J-P, Billot A, Bouguennec A, Charmet G, Saulnier L, Branlard G (1999) Genetic and environmental variations in water-extractable arabinoxylans content and flour extract viscosity. J Cereal Sci 30:45–48
Möhlig M, Koebnick C, Weickert MO, Lueder W, Otto B, Steiniger J, Twilfert M, Meuser F, Pfeiffer AF, Zunft HJ (2005) Arabinoxylan-enriched meal increases serum ghrelin levels in healthy humans. Horm Metab Res 37:303–308
Ordaz-Ortiz JJ, Saulnier L (2005) Structural variability of arabinoxylans from wheat flour. Comparison of water-extractable and xylanase-extractable arabinoxylans. J Cereal Sci 42:119–125
Pritchard JR, Lawrence GJ, Larroque O, Li Z, Laidlaw HKC, Morell MK, Rahman S (2011) A survey of β-glucan and arabinoxylan content in wheat. J Sci Food Agric 91:1298–1303
Rosicka-Kaczmarek J, Komisarczyk A, Nebesny E, Makowski B (2016) The influence of arabinoxylans on the quality of grain industry products. Eur Food Res Technol 242:295–303
Saeed F, Pasha I, Anjum FM, Sultan MT (2011) Arabinoxylans and arabinogalactans: a comprehensive treatise. Crit Rev Food Sci Nutr 51:467–476
Samuel VT, Shulman GI (2012) Mechanisms for insulin resistance: Common threads and missing links. Cell 148:852–871
Saulnier L, Sado PE, Branlard G, Charmet G, Guillon F (2007) Wheat arabinoxylans: Exploiting variation in amount and composition to develop enhanced varieties. J Cereal Sci 46:261–281
Schioldan AG, Gregersen S, Hald S, Erik K, Knudsen B, Holst JJ, Hermansen K (2015) Dietary fibers in the prevention of type 2 diabetes: A randomized crossover study. Diabetes 64:A629
21
The European Commission (2012) Comission Regulation (EU) No 432/2012 of 16 May 2012 establishing a list of permitted health claims made on foods, other than those referring to the reduction of disease risk and to children’s development and health. Off J Eur Union L136:1–40
The Nordic Cochrane Centre TCC (2014) Review Manager (RevMan) Version 5.3
Venn BJ, Green TJ (2007) Glycemic index and glycemic load: measurement issues and their effect on diet-disease relationships. Eur J Clin Nutr 61 Suppl 1:S122–S131
Vinkx CJA, Delcour JA (1996) Rye (Secale cereale L.) arabinoxylans: a critical review. J Cereal Sci 24:1–14
22
Appendix 1: database search strategy- PubMed: on 01/08/2016
Search Query Items found
#1(arabinoxylan[Supplementary Concept]) OR arabinoxylan[Text Word] 867
#2
(("randomized controlled trial"[Publication Type] OR "controlled clinical trial"[Publication Type] OR randomi*ed[Title/Abstract] OR placebo[Title/Abstract] OR randomly[Title/Abstract] OR trial[Title/Abstract] OR groups[Title/Abstract])) 2291997
#3 #1 and #2 105
#4 ((animals[MeSH Terms] NOT "humans"[MeSH Terms])) 4236012
#5 #3 NOT #4 80
- Embase: on 29/07/2016
Search
Query Items found
1. exp *arabinoxylan/ 1962. arabinoxylan.mp. or exp *arabinoxylan/ 10123. arabinoxylan.mp. [mp=title, abstract, heading word, drug trade
name, original title, device manufacturer, drug manufacturer, device trade name, keyword]
1012
4. 1 or 2 or 3 10125. limit 4 to (human and (randomized controlled trial or controlled
clinical trial)) 27
- Cochrane trials (CENTRAL): on 01/08/2016
ID Search Hits
#1 "arabinoxylan" in Trials (Word variations have been searched) 36
23
Appendix 2: Studies excluded at full text review
Study Reason for Exclusion
1. (Cloetens et al. 2010) Postprandial blood glucose was not measured at intervals or periods to determine the peak.
2. (Garcia et al. 2006) Postprandial blood glucose was not measured at intervals or periods to determine the peak. The contact author has confirmed not collecting this data in this study.
3. (Garcia et al. 2007) Postprandial blood glucose was not measured after dietary intervention with AX. The contact author has confirmed not collecting this data in this study.
4. (Lafond et al. 2015) The fibre in the dietary intervention is not sufficiently characterised with respect to the relative amount of AX.
5. (Lu et al. 2004) Postprandial blood glucose was not measured after a dietary intervention with AX. Moreover, postprandial blood glucose was not measured at intervals to determine the peak.
6. (Maki et al. 2012) Postprandial blood glucose was not measured at intervals or periods to determine the peak.
7. (Schioldan et al. 2015)
Conference poster not published elsewhere as a full article. There are no sufficient details available on the subjects, intervention or health effect.
24
Appendix 3: Risk of bias of strata included in the systematic reviewStudy Random sequence
generation (selection bias)
Allocation concealment
(selection bias)
Blinding of participants and
personnel (performance
bias)*
Blinding of outcome
assessors (detection
bias)
Incomplete outcome data (attrition bias)
Selective reporting
(reporting bias)Other (dietary and
exercise instructions; testing interval in cross-over
studies)Hartvigsen
2014aLow Subjects were
randomly assigned to the sequence of the test breads by the study coordinator by use of a Latin-Square design.
Low The sequence for each subject was kept in a
closed numbered envelope
until interventions
were assigned.
Low
Crossover design.
Subjects complied to instructions before and during the
trial.
Low Not stated
Low All 15 subjects completed the
test according to the protocol.
Low Relevant results from
performed analyses
were reported.
Low Reduced by overnight fasting,
sufficient (1 week)
washout periods
combined with
compliance to dietary
and exercise
instructions before and during the
trial.
** Because the outcome is measured within hours of the test, and test foods are supplied, there is no opportunity for lack of blinding to affect adherence during the testing phase, studies which did not describe their methods clearly were considered to have low risk of bias for allocation concealment if they used a cross-over design, or low risk of performance bias if they used a cross-over design and there was no choice by subjects in the quantity consumed and low risk of detection bias if they collected a venous blood sample and was analysed using an autoanalyser or a point of care method that could not involve technician variation.
25
Study Random sequence generation (selection
bias)
Allocation concealment
(selection bias)
Blinding of participants and
personnel (performance bias)
Blinding of outcome
assessors (detection
bias)
Incomplete outcome data (attrition bias)
Selective reporting
(reporting bias)Other (dietary and
exercise instructions; testing interval in cross-over
studies)Hartvigsen
2014bLow Subjects were
randomly assigned to
the sequence of the test
meals by the study
coordinator by the use of a Latin-Square
design.
Low To conceal the
sequence until
interventions were
assigned, the
sequence for each subject was kept in a
closed numbered envelope.
Low
Crossover design.
Subjects complied to instructions before and during the
trial.
Low Not stated
Low All 15 subjects completed the
test according to the protocol.
Low Relevant results from
performed analyses
were reported.
Low Sufficient (1 week)
washout periods
combined with
compliance to dietary
and exercise
instructions before and during the
trial.Lappi 2013
Unclear
Crossover design but no
details are given on the
randomisation method.
Low Not stated Low
Crossover design.
Subjects complied to instructions before and during the trial. The short time
between the intervention
and measuring the health outcome makes
performance bias unlikely.
Low Not stated
Low 15 subjects started and finished the
study.
Low Relevant results from
performed analyses
were reported.
Low Sufficient washout
period and the
subjects’ compliance to dietary
instructions before and during the
trial.
Lu 2000 Unclear
Subjects consumed the test meals in random order on 3 separate
Low Not stated. Low
Crossover design. The
subjects were blinded as to the test
Low Not stated
High 23% of the subjects initially recruited did not
complete the study.
Low Relevant results from
performed analyses
Unclear Not stated.
26
Study Random sequence generation (selection
bias)
Allocation concealment
(selection bias)
Blinding of participants and
personnel (performance bias)
Blinding of outcome
assessors (detection
bias)
Incomplete outcome data (attrition bias)
Selective reporting
(reporting bias)Other (dietary and
exercise instructions; testing interval in cross-over
studies)mornings but
not further details on the
random sequence generation were given.
meals they received.
Test breads were cut into similar small triangles and
randomly coded with a
3-digit number to blind the
assessors.
were reported.
Möhlig 2005
Unclear
Crossover design but no
details are given on the
randomisation method.
Low Not stated. Low
Not stated. Low Not stated
Low All of the normoglycaemic
sub-cohort completed the
test
Low Relevant results from
performed analyses
were reported.
Low Sufficient washout period
combined with
compliance to dietary
and exercise
instructions before and during the
trial.
27
Appendix 4: GRADE summary of findings tablesQuestion: Does the dietary intake of arabinoxylan (AX) reduce peak postprandial blood glucose concentration?
Source: FSANZ systematic review of evidence.
Quality assessment of body of evidence Participant numbers
Mean difference
mmol/L [95% CI]
Quality (degree of certainty in relationship)
Number of
studiesDesign Risk of
biasInconsistenc
y Indirectness Imprecision Considerations Parallel
Cross-over
Changes in postprandial blood glucose concentration are related to consuming AX-rich fibre
5 RCT Low None None Serious1 None 0 70 -0.56 [-0.83, -0.29]
Moderate
Changes in postprandial blood glucose concentration are related to consuming pure AX
0 NA Not assessable Not applicable Not
applicableNot
applicableNot
applicable 0 0 Not assessable Not assessable
1 Down-rated owing to the small size of the overall population sample, despite the confidence intervals not approaching the line of no effect.
28