Embed Size (px)
Citation preview
AbstractThe Agilent 1260 Infi nity Multi-Detector GPC/SEC System is a powerful tool for polymer characterization. The signals from a concentration sensitive detector such as refractive index (RI) or ultra-violet (UV) coupled with light scattering and viscometry can be used to determine the absolute molecular weight, size, and shape of the polymer in solution. This Application Note shows the value of the technique applied to the analysis of three very structurally different materials and illustrates the advantages of using multi-detection GPC/SEC to study a range of polymers.
Expanding the GPC/SEC Experiment Beyond Conventional Limits usingViscometry and Light Scattering Detection
Application Note
AuthorAnthony Grice Warwick Polymer GroupUniversity of Warwick, UK
Ben MacCreathAgilent Technologies, Inc.Craven Arms, UK
Verified for Agilent 1260 Infinity II LC
lent II LC
GPC/SEC System
2
IntroductionGPC/SEC is an essential tool for the analysis of polymers, providing information required to understand how a polymer will process and perform. When using a concentration detector such as RI, the process is known as Conventional GPC/SEC. The chromatographic mechanism separates by the size of the polymer coil in solution, and is useful to determine the distribution of component chain lengths within a given sample. The information obtained can be increased considerably by adding viscometry and light scattering detection to create a multi-detector system. High performance modules are required to control temperature and maintain precise fl ow rates to ensure reproducible results. As with any chromatographic system, minimal band-broadening is critical to ensure data integrity is maintained.
This Application Note highlights the advantages multi-detection brings to the GPC/SEC experiment with a range of polymer examples.
ExperimentalInstrumentationThe Agilent 1260 Infi nity Multi-Detector GPC/SEC System used in the experiments consisted of the following individual modules:
1. Agilent 1260 Infi nity Standard Degasser (G1322A)
2. Agilent 1260 Infi nity Isocratic Pump (G1310B)
3. Agilent 1260 Infi nity Standard Autosampler (G1329B)
4. Agilent 1260 Infi nity Thermostatted Column Compartment (G1316A)
5. Agilent 1260 Infi nity GPC/SEC Multi-Detector Suite (G7800A)
6. Agilent 1260 Infi nity MDS RID (G7801A)
7. Agilent 1260 Infi nity MDS Viscometer (G7802A)
8. Agilent 1260 Infi nity MDS Light Scattering (G7803A)
SoftwareAll instrument control, data collection and data analysis was performed with the Agilent GPC/SEC Software CDS consisting of:
• Agilent GPC/SEC Software (G7850AA)
• Agilent GPC/SEC Multi-Detector Upgrade (G7852AA)
• Agilent GPC/SEC Instrument Control (G7854AA)
Column Set and Calibrants• 3 × PLgel 10 µm Mixed-B, 300 ×
7.5 mm (PL1110-6100)
• PS nominal Mp 100 k (PL2013-5001)
• EasiVial PS-H 4 mL (PL2010-0200)
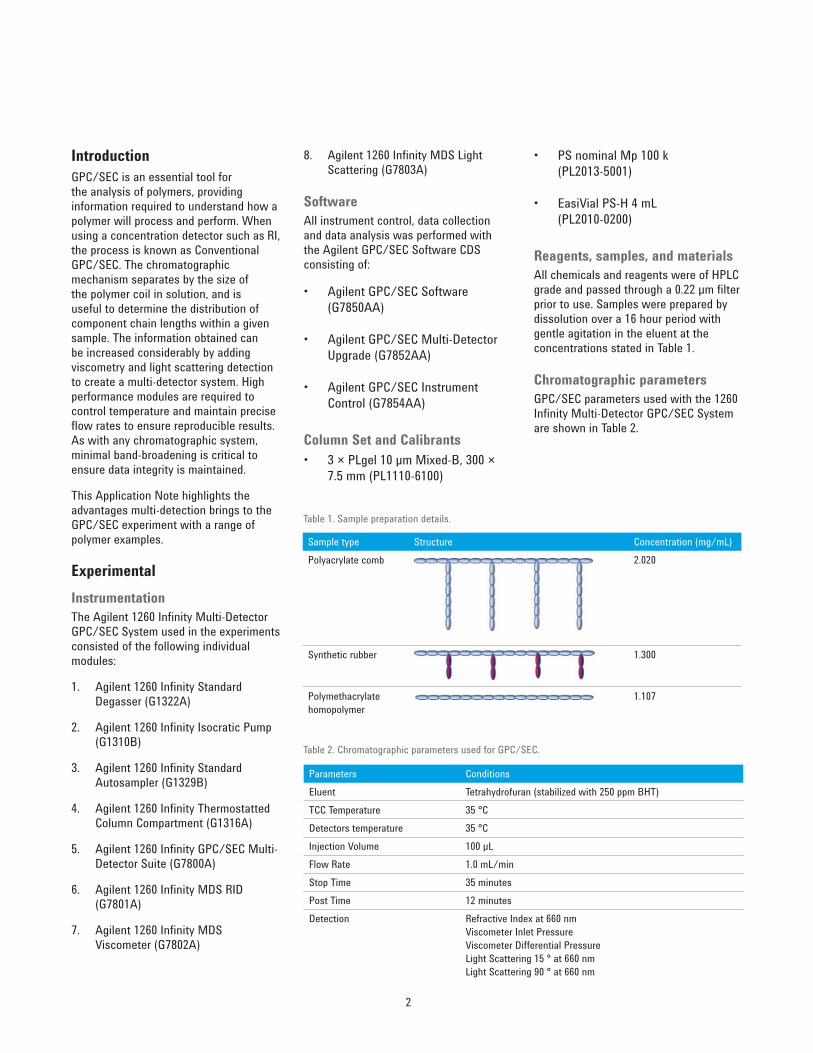
Reagents, samples, and materialsAll chemicals and reagents were of HPLC grade and passed through a 0.22 µm fi lter prior to use. Samples were prepared by dissolution over a 16 hour period with gentle agitation in the eluent at the concentrations stated in Table 1.
Chromatographic parameters GPC/SEC parameters used with the 1260 Infi nity Multi-Detector GPC/SEC System are shown in Table 2.
Sample type Structure Concentration (mg/mL)Polyacrylate comb 2.020
Synthetic rubber 1.300
Polymethacrylatehomopolymer
1.107
Parameters ConditionsEluent Tetrahydrofuran (stabilized with 250 ppm BHT)TCC Temperature 35 °CDetectors temperature 35 °CInjection Volume 100 µLFlow Rate 1.0 mL/minStop Time 35 minutesPost Time 12 minutesDetection Refractive Index at 660 nm
Viscometer Inlet Pressure Viscometer Differential Pressure Light Scattering 15 ° at 660 nm Light Scattering 90 ° at 660 nm
Table 1. Sample preparation details.
Table 2. Chromatographic parameters used for GPC/SEC.
3
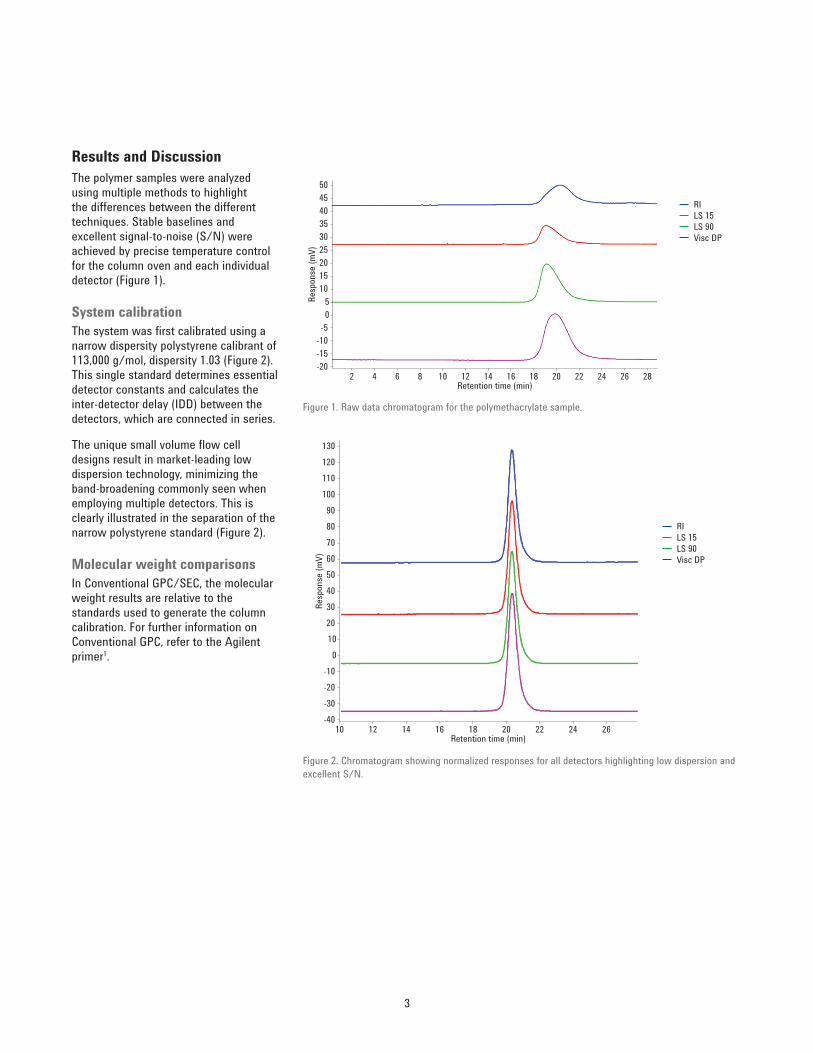
Results and DiscussionThe polymer samples were analyzed using multiple methods to highlight the differences between the different techniques. Stable baselines and excellent signal-to-noise (S/N) were achieved by precise temperature control for the column oven and each individual detector (Figure 1).
System calibration The system was fi rst calibrated using a narrow dispersity polystyrene calibrant of 113,000 g/mol, dispersity 1.03 (Figure 2). This single standard determines essential detector constants and calculates the inter-detector delay (IDD) between the detectors, which are connected in series.
The unique small volume fl ow cell designs result in market-leading low dispersion technology, minimizing the band-broadening commonly seen when employing multiple detectors. This is clearly illustrated in the separation of the narrow polystyrene standard (Figure 2).
Molecular weight comparisonsIn Conventional GPC/SEC, the molecular weight results are relative to the standards used to generate the column calibration. For further information on Conventional GPC, refer to the Agilent primer1.
Figure 1. Raw data chromatogram for the polymethacrylate sample.
504540353025201510
50
2 4 6 8 10 12 14Retention time (min)
Resp
onse
(mV)
16 18 20 22 24 26 28
-5-10-15-20
RILS 15LS 90Visc DP
Figure 2. Chromatogram showing normalized responses for all detectors highlighting low dispersion and excellent S/N.
100110120130
9080706050403020100
10 12 14 16 18Retention time (min)
Resp
onse
(mV)
20 22 24 26
-10-20-30-40
RILS 15LS 90Visc DP
4
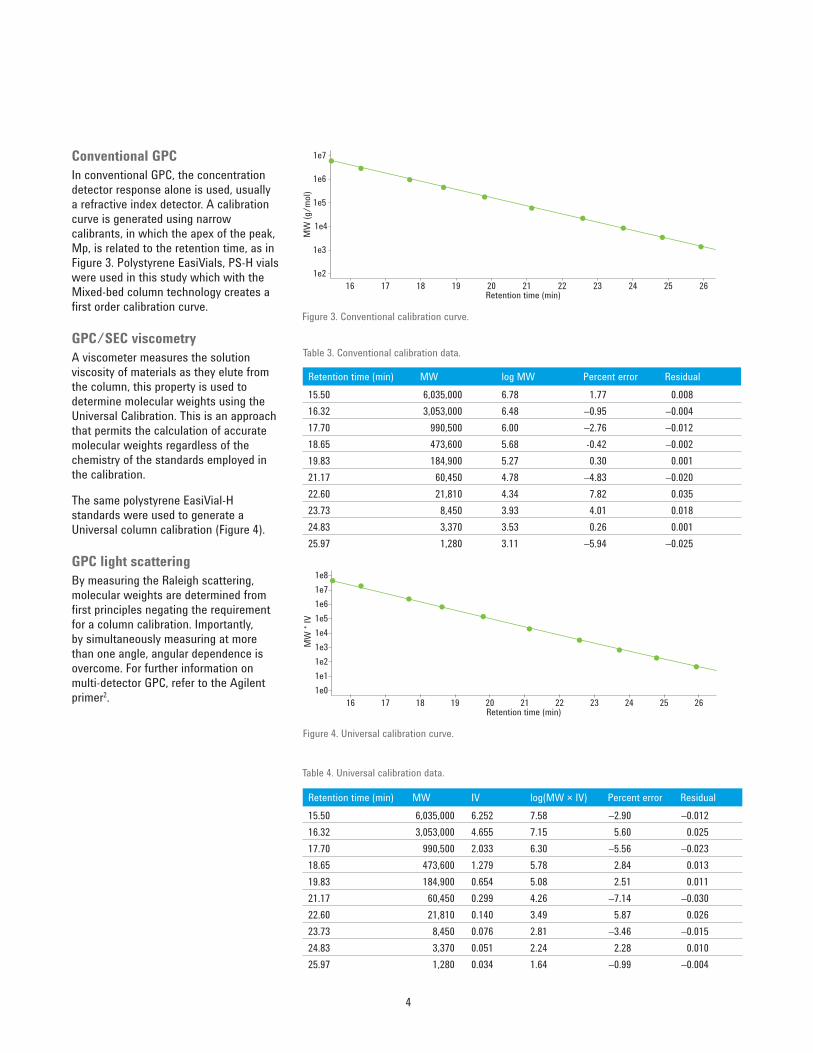
Conventional GPCIn conventional GPC, the concentration detector response alone is used, usually a refractive index detector. A calibration curve is generated using narrow calibrants, in which the apex of the peak, Mp, is related to the retention time, as in Figure 3. Polystyrene EasiVials, PS-H vials were used in this study which with the Mixed-bed column technology creates a fi rst order calibration curve.
GPC/SEC viscometryA viscometer measures the solution viscosity of materials as they elute from the column, this property is used to determine molecular weights using the Universal Calibration. This is an approach that permits the calculation of accurate molecular weights regardless of the chemistry of the standards employed in the calibration.
The same polystyrene EasiVial-H standards were used to generate a Universal column calibration (Figure 4).
GPC light scatteringBy measuring the Raleigh scattering, molecular weights are determined from fi rst principles negating the requirement for a column calibration. Importantly, by simultaneously measuring at more than one angle, angular dependence is overcome. For further information on multi-detector GPC, refer to the Agilent primer2.
Retention time (min) MW log MW Percent error Residual15.50 6,035,000 6.78 1.77 0.00816.32 3,053,000 6.48 –0.95 –0.00417.70 990,500 6.00 –2.76 –0.01218.65 473,600 5.68 -0.42 –0.00219.83 184,900 5.27 0.30 0.00121.17 60,450 4.78 –4.83 –0.02022.60 21,810 4.34 7.82 0.03523.73 8,450 3.93 4.01 0.01824.83 3,370 3.53 0.26 0.00125.97 1,280 3.11 –5.94 –0.025
Table 3. Conventional calibration data.
Retention time (min) MW IV log(MW × IV) Percent error Residual15.50 6,035,000 6.252 7.58 –2.90 –0.01216.32 3,053,000 4.655 7.15 5.60 0.02517.70 990,500 2.033 6.30 –5.56 –0.02318.65 473,600 1.279 5.78 2.84 0.01319.83 184,900 0.654 5.08 2.51 0.01121.17 60,450 0.299 4.26 –7.14 –0.03022.60 21,810 0.140 3.49 5.87 0.02623.73 8,450 0.076 2.81 –3.46 –0.01524.83 3,370 0.051 2.24 2.28 0.01025.97 1,280 0.034 1.64 –0.99 –0.004
Table 4. Universal calibration data.
Figure 3. Conventional calibration curve.
1e7
1e6
1e5
1e4
16 17 18 19 20Retention time (min)
MW
(g/m
ol)
21 22 23 24 25 26
1e3
1e2
Figure 4. Universal calibration curve.
1e8
1e61e7
1e5
1e3
16 17 18 19 20Retention time (min)
MW
* IV
21 22 23 24 25 26
1e11e2
1e4
1e0
5
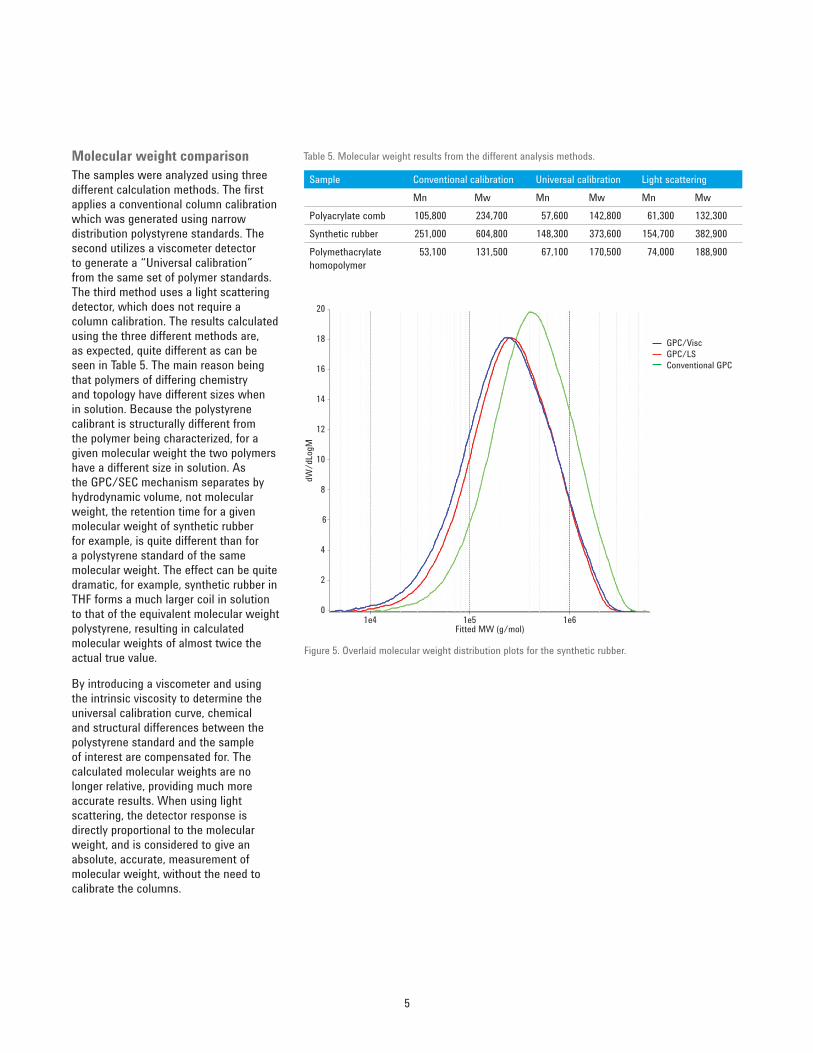
Table 5. Molecular weight results from the different analysis methods.
Sample Conventional calibration Universal calibration Light scatteringMn Mw Mn Mw Mn Mw
Polyacrylate comb 105,800 234,700 57,600 142,800 61,300 132,300Synthetic rubber 251,000 604,800 148,300 373,600 154,700 382,900Polymethacrylate homopolymer
53,100 131,500 67,100 170,500 74,000 188,900
Molecular weight comparisonThe samples were analyzed using three different calculation methods. The fi rst applies a conventional column calibration which was generated using narrow distribution polystyrene standards. The second utilizes a viscometer detector to generate a “Universal calibration” from the same set of polymer standards. The third method uses a light scattering detector, which does not require a column calibration. The results calculated using the three different methods are, as expected, quite different as can be seen in Table 5. The main reason being that polymers of differing chemistry and topology have different sizes when in solution. Because the polystyrene calibrant is structurally different from the polymer being characterized, for a given molecular weight the two polymers have a different size in solution. As the GPC/SEC mechanism separates by hydrodynamic volume, not molecular weight, the retention time for a given molecular weight of synthetic rubber for example, is quite different than for a polystyrene standard of the same molecular weight. The effect can be quite dramatic, for example, synthetic rubber in THF forms a much larger coil in solution to that of the equivalent molecular weight polystyrene, resulting in calculated molecular weights of almost twice the actual true value.
By introducing a viscometer and using the intrinsic viscosity to determine the universal calibration curve, chemical and structural differences between the polystyrene standard and the sample of interest are compensated for. The calculated molecular weights are no longer relative, providing much more accurate results. When using light scattering, the detector response is directly proportional to the molecular weight, and is considered to give an absolute, accurate, measurement of molecular weight, without the need to calibrate the columns.
Figure 5. Overlaid molecular weight distribution plots for the synthetic rubber.
16
18
20
14
12
10
8
6
1e4 1e5Fitted MW (g/mol)
dW/d
LogM
1e6
4
2
0
GPC/ViscGPC/LSConventional GPC
6
It is not only chemistry that has an effect on the hydrodynamic size, for example certain types of polymer have extended side chains (also known as branching). One such example being a polyacrylate graft polymer, where a large relative difference is observed between molecular weights calculated using conventional GPC and using light scattering and/or viscometry. The Agilent GPC Software contains powerful sub routines to be able to identify and quantify these branched polymer structures3. The results for a polymethacrylate homopolymer show less of a difference in molecular weight between the different calculation methods. This is because, when dissolved in THF, it has only a slightly smaller hydrodynamic volume than that of polystyrene standard of the same molecular weight.
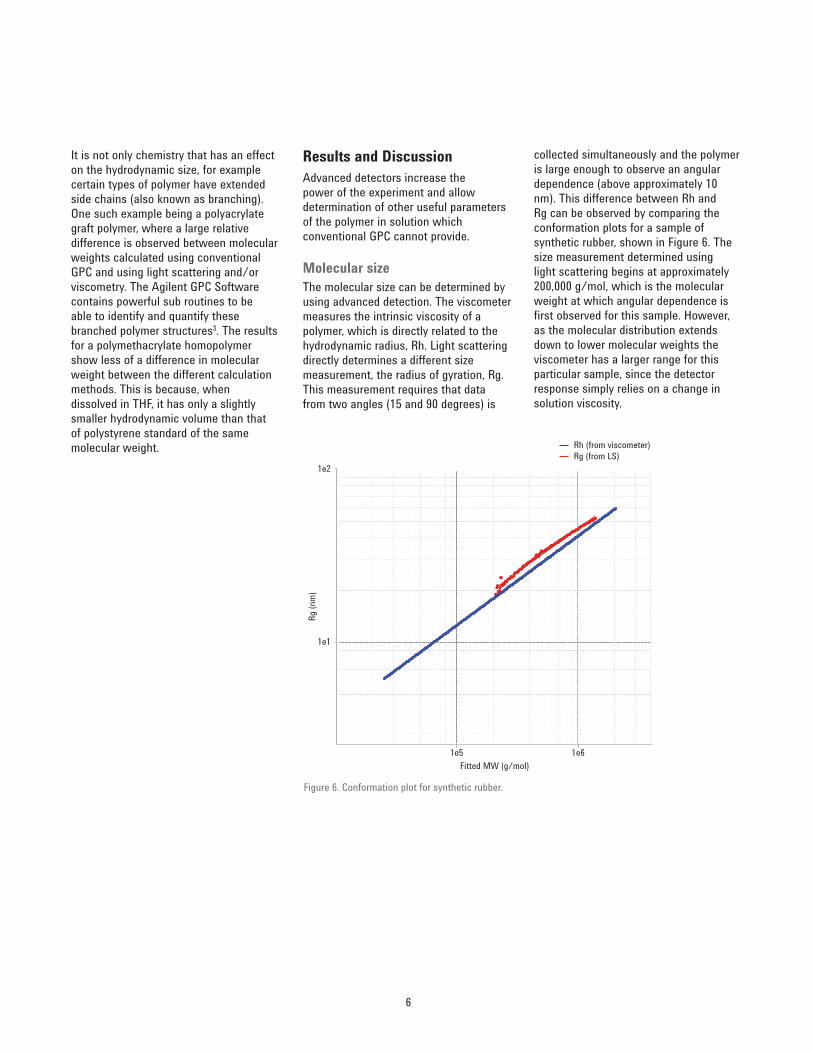
Figure 6. Conformation plot for synthetic rubber.
1e2
1e1
1e5 1e6Fitted MW (g/mol)
Rg (n
m)
Rh (from viscometer)Rg (from LS)
Results and DiscussionAdvanced detectors increase the power of the experiment and allow determination of other useful parameters of the polymer in solution which conventional GPC cannot provide.
Molecular sizeThe molecular size can be determined by using advanced detection. The viscometer measures the intrinsic viscosity of a polymer, which is directly related to the hydrodynamic radius, Rh. Light scattering directly determines a different size measurement, the radius of gyration, Rg. This measurement requires that data from two angles (15 and 90 degrees) is
collected simultaneously and the polymer is large enough to observe an angular dependence (above approximately 10 nm). This difference between Rh and Rg can be observed by comparing the conformation plots for a sample of synthetic rubber, shown in Figure 6. The size measurement determined using light scattering begins at approximately 200,000 g/mol, which is the molecular weight at which angular dependence is fi rst observed for this sample. However, as the molecular distribution extends down to lower molecular weights the viscometer has a larger range for this particular sample, since the detector response simply relies on a change in solution viscosity.
7
Molecular weight results from GPC/SEC can be quite different depending on the method used in the calculations. Concentration only data, for example just a RI or UV, are relative to the standards used to generate the column calibration and therefore the molecular weight results are often not accurate. The advanced detectors are sensitive to molecular weight and overcome the relative nature of GPC. Through the use of the Universal Calibration, a viscometer provides this by producing molecular weights independent of the calibrants used. The most accurate molecular weight data is determined using a light scattering detector, which responds directly to molecular weight and therefore requires no column calibration.
The advantages of advanced detectors is not limited to just more accurate molecular weights. Molecular sizes can be calculated from both viscometry and Light Scattering detection, each having its own strengths. The light scattering detector directly calculates the size
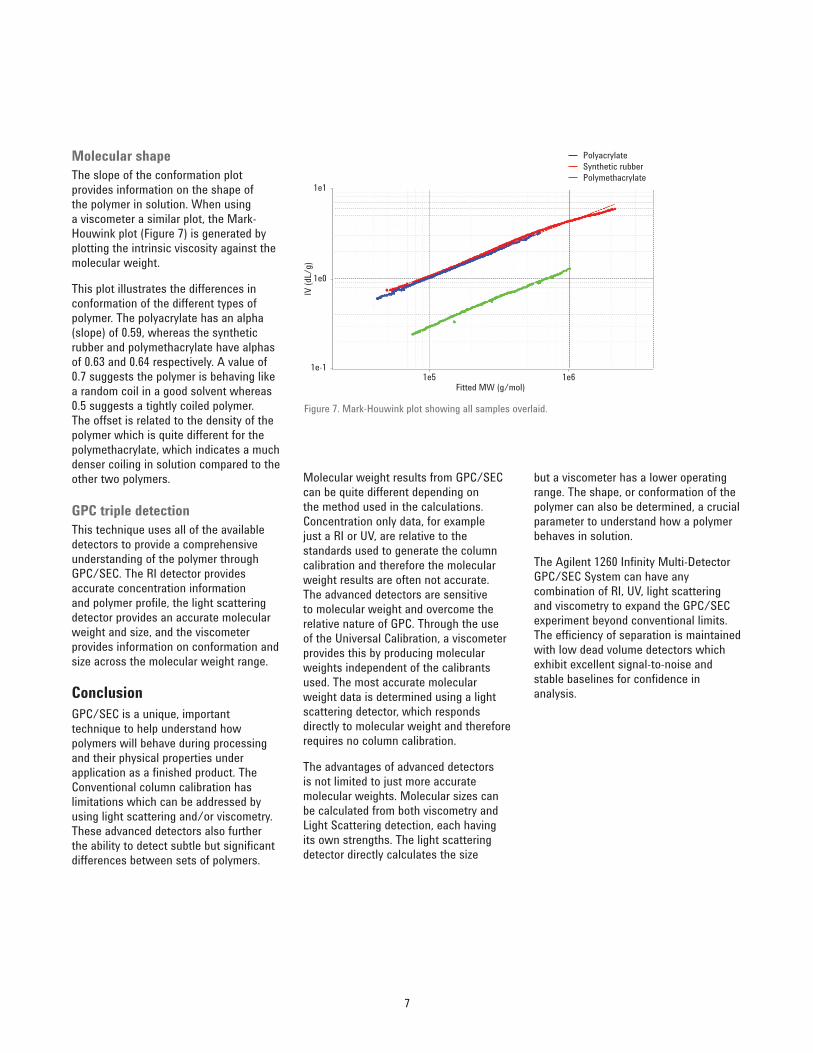
Molecular shapeThe slope of the conformation plot provides information on the shape of the polymer in solution. When using a viscometer a similar plot, the Mark-Houwink plot (Figure 7) is generated by plotting the intrinsic viscosity against the molecular weight.
This plot illustrates the differences in conformation of the different types of polymer. The polyacrylate has an alpha (slope) of 0.59, whereas the synthetic rubber and polymethacrylate have alphas of 0.63 and 0.64 respectively. A value of 0.7 suggests the polymer is behaving like a random coil in a good solvent whereas 0.5 suggests a tightly coiled polymer. The offset is related to the density of the polymer which is quite different for the polymethacrylate, which indicates a much denser coiling in solution compared to the other two polymers.
GPC triple detectionThis technique uses all of the available detectors to provide a comprehensive understanding of the polymer through GPC/SEC. The RI detector provides accurate concentration information and polymer profi le, the light scattering detector provides an accurate molecular weight and size, and the viscometer provides information on conformation and size across the molecular weight range.
ConclusionGPC/SEC is a unique, important technique to help understand how polymers will behave during processing and their physical properties under application as a fi nished product. The Conventional column calibration has limitations which can be addressed by using light scattering and/or viscometry. These advanced detectors also further the ability to detect subtle but signifi cant differences between sets of polymers.
Figure 7. Mark-Houwink plot showing all samples overlaid.
1e1
1e0
1e-11e5 1e6
Fitted MW (g/mol)
IV (d
L/g)
PolyacrylateSynthetic rubberPolymethacrylate
but a viscometer has a lower operating range. The shape, or conformation of the polymer can also be determined, a crucial parameter to understand how a polymer behaves in solution.
The Agilent 1260 Infi nity Multi-Detector GPC/SEC System can have any combination of RI, UV, light scattering and viscometry to expand the GPC/SEC experiment beyond conventional limits. The effi ciency of separation is maintained with low dead volume detectors which exhibit excellent signal-to-noise and stable baselines for confi dence in analysis.
www.agilent.com/chem
This information is subject to change without notice.
© Agilent Technologies, Inc., 2013-2016Published in the USA, May 1, 20165991-2891EN
References1. “An Introduction to GPC/SEC”, Agilent
publication, 5990-6969EN.
2. “An Introduction to Multi-Detector GPC/SEC”, Agilent publication, 5990-7196EN.
3. “Analysis of Star Polymers Using the Agilent 1260 Infi nity Multi-Detector GPC/SEC System”, Agilent Application Note 5991-2887EN.