Embed Size (px)
Citation preview
Reply to Issues Raised by EAC (Violation) Committee
Expansion of Selected Dhori Group of Mines (11 MTPA)
(Dhori Area) Project Area: 264.85 Ha
Central COALFIELD LIMITED (A Subsidiary of Coal India Limited)
April 2019
Central Mine Planning and Design Institute Limited Regional Institute-III
Gondwana Place, Kanke Road, Ranchi
NF
+225 +255
+225
+255
+250
+250
+220
+190
+250
1
Table of Contents
1. Submission of Air Pollution Control Measure at workshop and other location in the impact zone. ............................................................................................................................... 2 2. Submission of exiting greenbelt details and proposed revised green belt details. 5
4. Length of existing of toe wall and garland drain constructed and proposed to be constructed. ....................................................................................................................................... 9
5. Submission of final mine closure plan. ............................................................................... 9
6. Time bound action plan for noncompliance, partially complied and assure to complied earlier EC condition as per report of RO MOEF&CC. .......................................... 10
7. Details about Economic benefit derived due to violation ........................................... 15
8. Submission of revised assessment of ecological damage, remediation plan and natural and community resource augmentation plan......................................................... 16
Brief Details of Violation ........................................................................................................................ 16 Assessment of Ecological Damage ....................................................................................................... 16 Impact on Air Environment................................................................................................................... 17 Impact on Land Environment ............................................................................................................... 20 Impact on Water Environment ............................................................................................................. 21 Noise and Vibration ................................................................................................................................. 31 Impact on Flora Fauna ............................................................................................................................ 32 Impact on Socio Economic Profile ....................................................................................................... 33 Occupational Health and Safety ........................................................................................................... 36 Assessment of Damage due to violation ............................................................................................ 38 Proposed Remediation Plan and Natural and Community Resource Augmentation Plan (NCRAP) ...................................................................................................................................................... 44
2
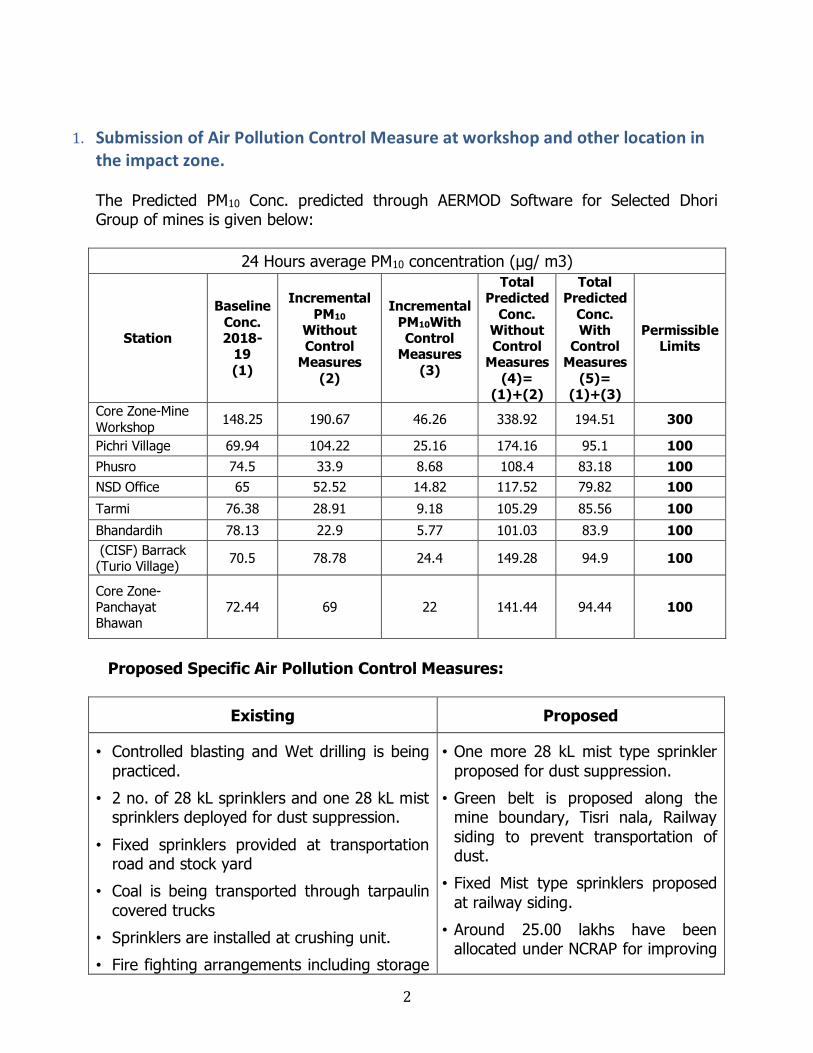
1. Submission of Air Pollution Control Measure at workshop and other location in the impact zone. The Predicted PM10 Conc. predicted through AERMOD Software for Selected Dhori Group of mines is given below:
24 Hours average PM10 concentration (µg/ m3)
Station
Baseline Conc. 2018-
19 (1)
Incremental PM10
Without Control
Measures (2)
Incremental PM10With Control
Measures (3)
Total Predicted
Conc. Without Control
Measures (4)=
(1)+(2)
Total Predicted
Conc. With
Control Measures
(5)= (1)+(3)
Permissible Limits
Core Zone-Mine Workshop 148.25 190.67 46.26 338.92 194.51 300
Pichri Village 69.94 104.22 25.16 174.16 95.1 100 Phusro 74.5 33.9 8.68 108.4 83.18 100 NSD Office 65 52.52 14.82 117.52 79.82 100 Tarmi 76.38 28.91 9.18 105.29 85.56 100 Bhandardih 78.13 22.9 5.77 101.03 83.9 100 (CISF) Barrack (Turio Village) 70.5 78.78 24.4 149.28 94.9 100
Core Zone-Panchayat Bhawan
72.44 69 22 141.44 94.44 100
Proposed Specific Air Pollution Control Measures:
Existing Proposed
• Controlled blasting and Wet drilling is being practiced.
• 2 no. of 28 kL sprinklers and one 28 kL mist sprinklers deployed for dust suppression.
• Fixed sprinklers provided at transportation road and stock yard
• Coal is being transported through tarpaulin covered trucks
• Sprinklers are installed at crushing unit. • Fire fighting arrangements including storage
• One more 28 kL mist type sprinkler proposed for dust suppression.
• Green belt is proposed along the mine boundary, Tisri nala, Railway siding to prevent transportation of dust.
• Fixed Mist type sprinklers proposed at railway siding.
• Around 25.00 lakhs have been allocated under NCRAP for improving
3
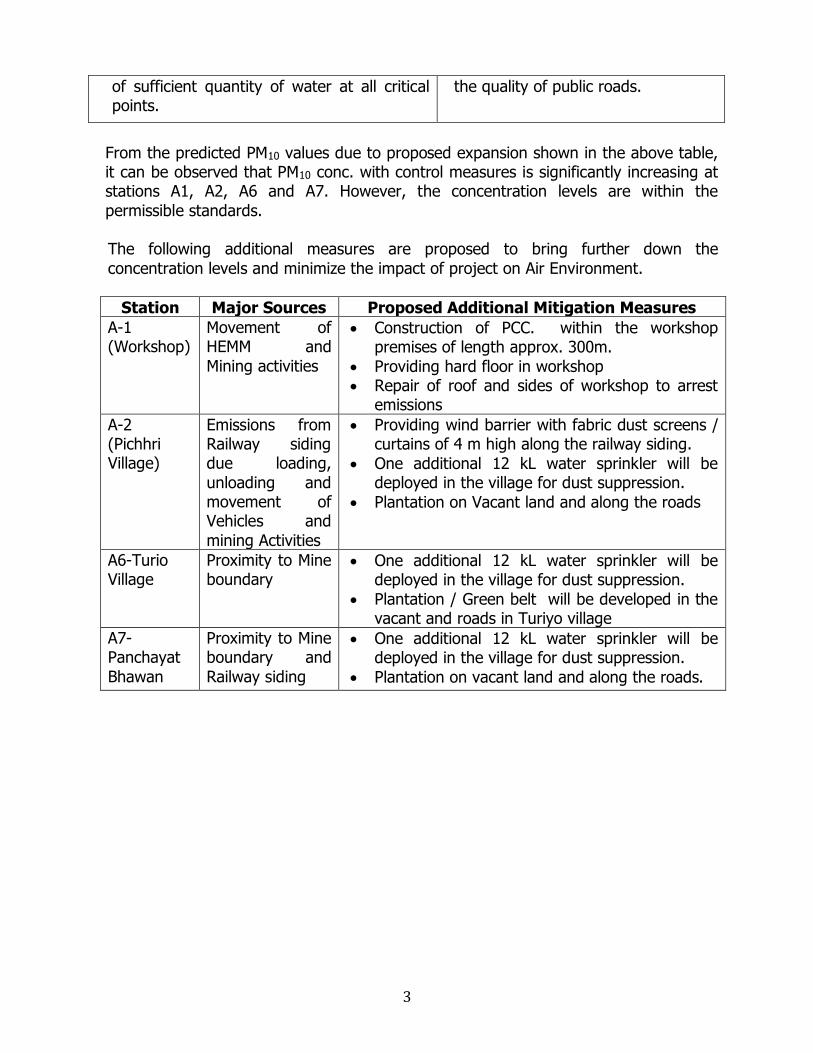
of sufficient quantity of water at all critical points.
the quality of public roads.
From the predicted PM10 values due to proposed expansion shown in the above table, it can be observed that PM10 conc. with control measures is significantly increasing at stations A1, A2, A6 and A7. However, the concentration levels are within the permissible standards. The following additional measures are proposed to bring further down the concentration levels and minimize the impact of project on Air Environment.
Station Major Sources Proposed Additional Mitigation Measures A-1 (Workshop)
Movement of HEMM and Mining activities
x Construction of PCC. within the workshop premises of length approx. 300m.
x Providing hard floor in workshop x Repair of roof and sides of workshop to arrest
emissions A-2 (Pichhri Village)
Emissions from Railway siding due loading, unloading and movement of Vehicles and mining Activities
x Providing wind barrier with fabric dust screens / curtains of 4 m high along the railway siding.
x One additional 12 kL water sprinkler will be deployed in the village for dust suppression.
x Plantation on Vacant land and along the roads
A6-Turio Village
Proximity to Mine boundary
x One additional 12 kL water sprinkler will be deployed in the village for dust suppression.
x Plantation / Green belt will be developed in the vacant and roads in Turiyo village
A7- Panchayat Bhawan
Proximity to Mine boundary and Railway siding
x One additional 12 kL water sprinkler will be deployed in the village for dust suppression.
x Plantation on vacant land and along the roads.
4
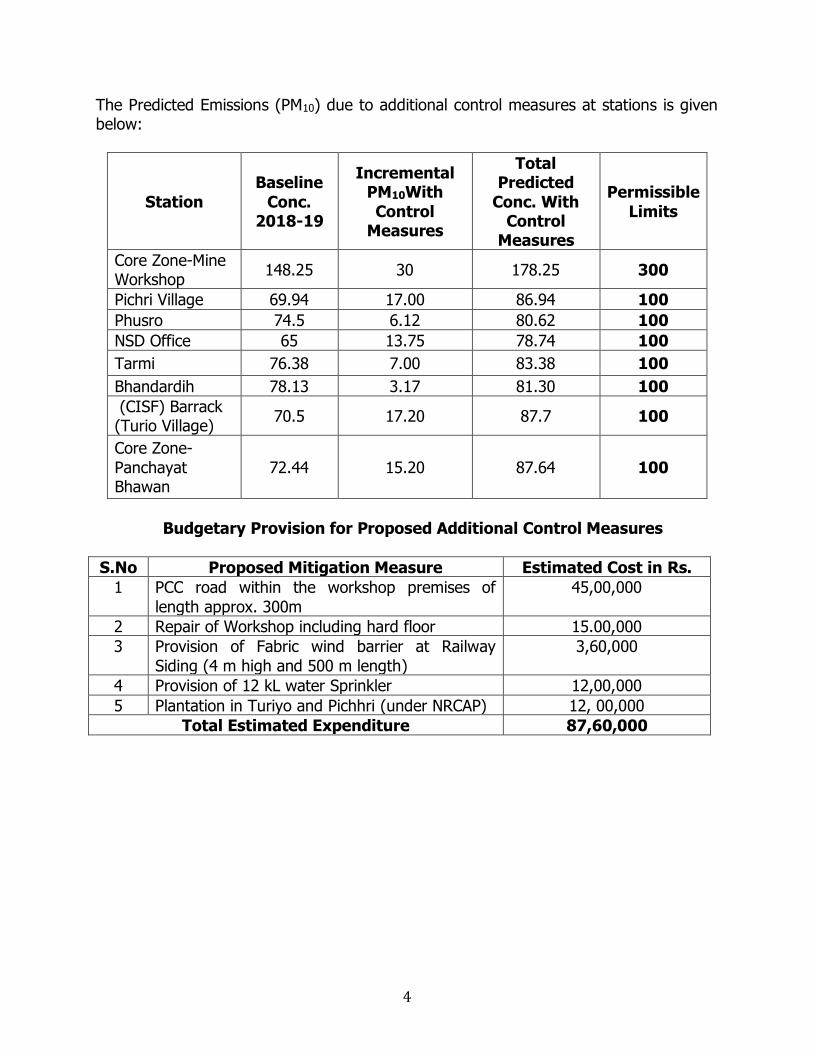
The Predicted Emissions (PM10) due to additional control measures at stations is given below:
Station Baseline
Conc. 2018-19
Incremental PM10With Control
Measures
Total Predicted
Conc. With Control
Measures
Permissible Limits
Core Zone-Mine Workshop 148.25 30 178.25 300
Pichri Village 69.94 17.00 86.94 100 Phusro 74.5 6.12 80.62 100 NSD Office 65 13.75 78.74 100 Tarmi 76.38 7.00 83.38 100 Bhandardih 78.13 3.17 81.30 100 (CISF) Barrack (Turio Village) 70.5 17.20 87.7 100
Core Zone-Panchayat Bhawan
72.44 15.20 87.64 100
Budgetary Provision for Proposed Additional Control Measures
S.No Proposed Mitigation Measure Estimated Cost in Rs.
1 PCC road within the workshop premises of length approx. 300m
45,00,000
2 Repair of Workshop including hard floor 15.00,000 3 Provision of Fabric wind barrier at Railway
Siding (4 m high and 500 m length) 3,60,000
4 Provision of 12 kL water Sprinkler 12,00,000 5 Plantation in Turiyo and Pichhri (under NRCAP) 12, 00,000
Total Estimated Expenditure 87,60,000
5
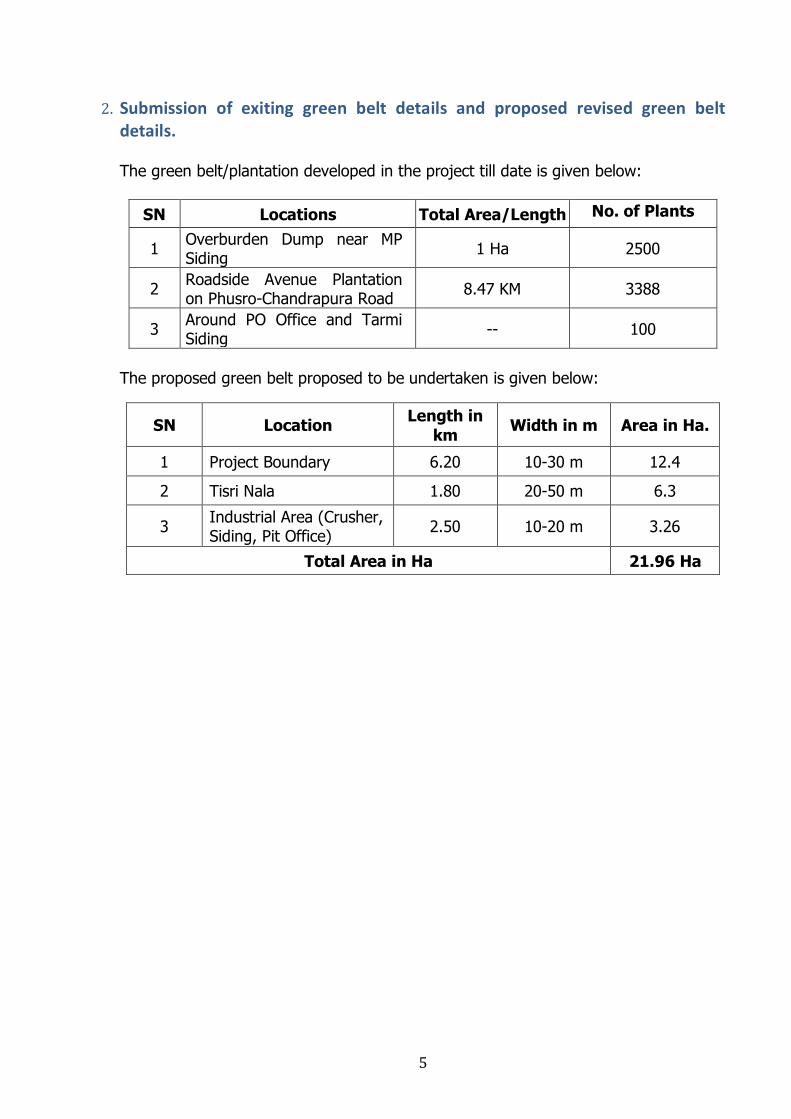
2. Submission of exiting green belt details and proposed revised green belt details. The green belt/plantation developed in the project till date is given below:
SN Locations Total Area/Length No. of Plants
1 Overburden Dump near MP Siding 1 Ha 2500
2 Roadside Avenue Plantation on Phusro-Chandrapura Road 8.47 KM 3388
3 Around PO Office and Tarmi Siding -- 100
The proposed green belt proposed to be undertaken is given below:
SN Location Length in km Width in m Area in Ha.
1 Project Boundary 6.20 10-30 m 12.4
2 Tisri Nala 1.80 20-50 m 6.3
3 Industrial Area (Crusher, Siding, Pit Office) 2.50 10-20 m 3.26
Total Area in Ha 21.96 Ha
6
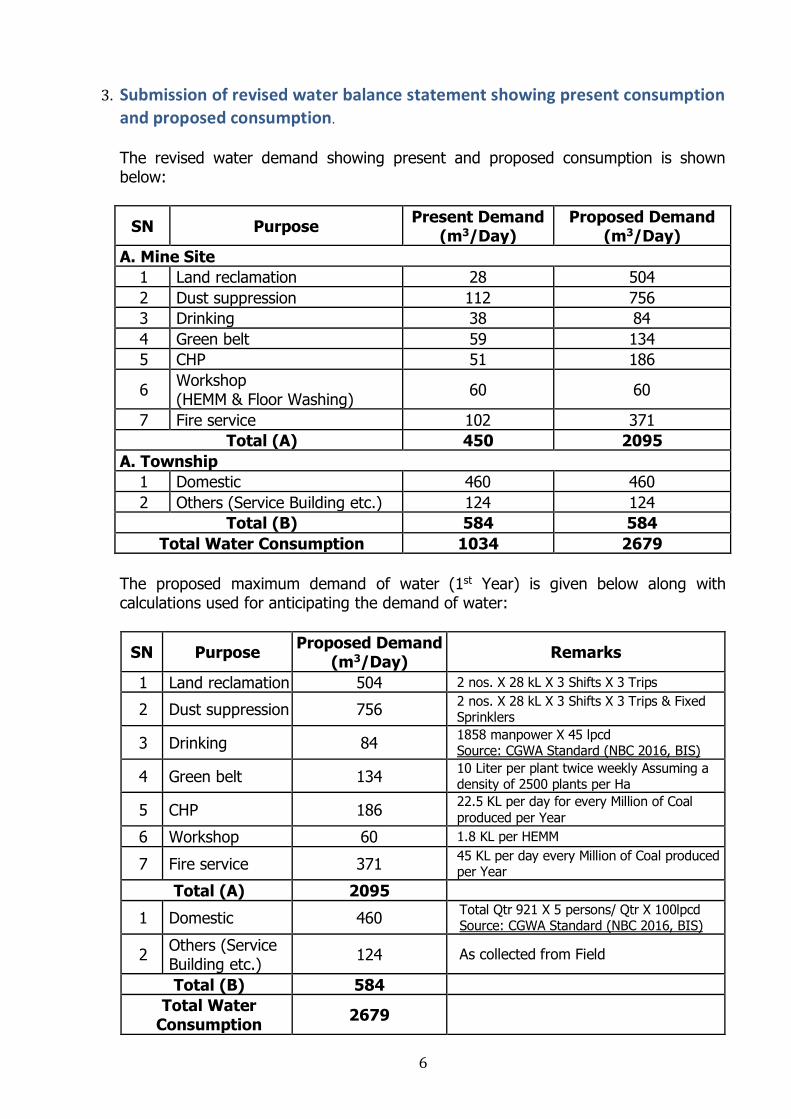
3. Submission of revised water balance statement showing present consumption
and proposed consumption. The revised water demand showing present and proposed consumption is shown below:
SN Purpose Present Demand (m3/Day)
Proposed Demand (m3/Day)
A. Mine Site 1 Land reclamation 28 504 2 Dust suppression 112 756 3 Drinking 38 84 4 Green belt 59 134 5 CHP 51 186
6 Workshop (HEMM & Floor Washing) 60 60
7 Fire service 102 371 Total (A) 450 2095
A. Township 1 Domestic 460 460 2 Others (Service Building etc.) 124 124
Total (B) 584 584 Total Water Consumption 1034 2679
The proposed maximum demand of water (1st Year) is given below along with calculations used for anticipating the demand of water:
SN Purpose Proposed Demand (m3/Day) Remarks
1 Land reclamation 504 2 nos. X 28 kL X 3 Shifts X 3 Trips
2 Dust suppression 756 2 nos. X 28 kL X 3 Shifts X 3 Trips & Fixed Sprinklers
3 Drinking 84 1858 manpower X 45 lpcd Source: CGWA Standard (NBC 2016, BIS)
4 Green belt 134 10 Liter per plant twice weekly Assuming a density of 2500 plants per Ha
5 CHP 186 22.5 KL per day for every Million of Coal produced per Year
6 Workshop 60 1.8 KL per HEMM
7 Fire service 371 45 KL per day every Million of Coal produced per Year
Total (A) 2095
1 Domestic 460 Total Qtr 921 X 5 persons/ Qtr X 100lpcd Source: CGWA Standard (NBC 2016, BIS)
2 Others (Service Building etc.) 124 As collected from Field
Total (B) 584 Total Water
Consumption 2679
7
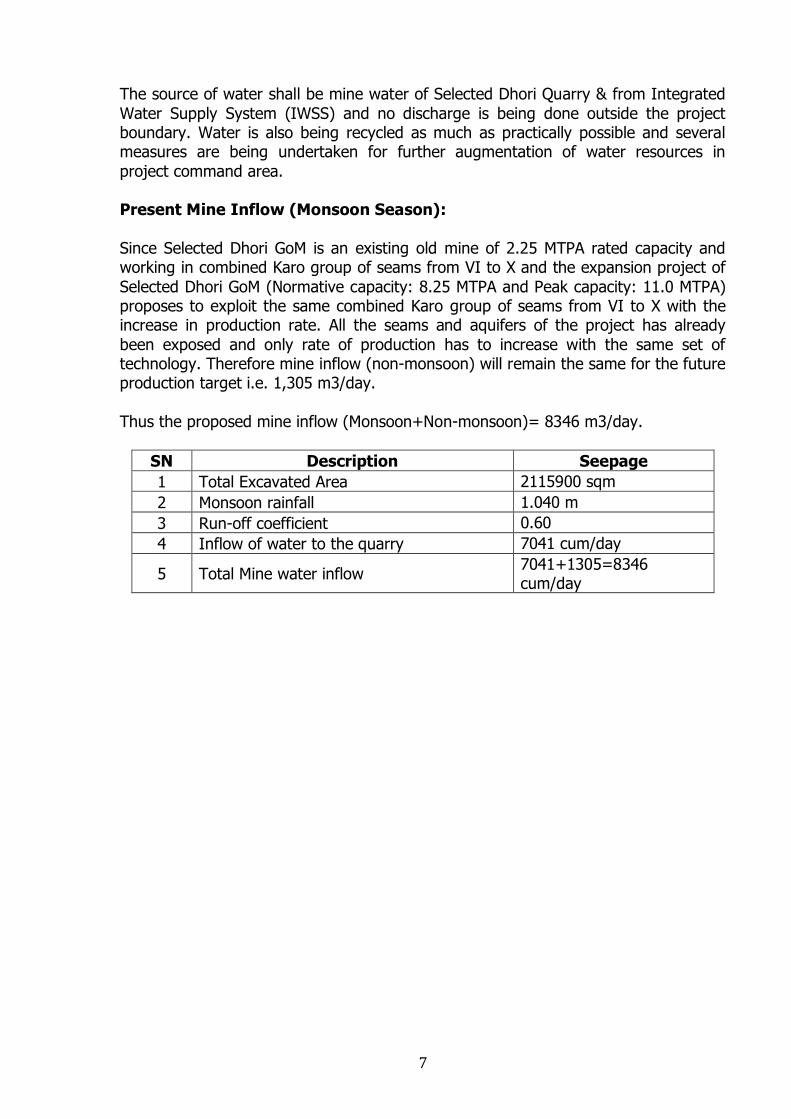
The source of water shall be mine water of Selected Dhori Quarry & from Integrated Water Supply System (IWSS) and no discharge is being done outside the project boundary. Water is also being recycled as much as practically possible and several measures are being undertaken for further augmentation of water resources in project command area. Present Mine Inflow (Monsoon Season): Since Selected Dhori GoM is an existing old mine of 2.25 MTPA rated capacity and working in combined Karo group of seams from VI to X and the expansion project of Selected Dhori GoM (Normative capacity: 8.25 MTPA and Peak capacity: 11.0 MTPA) proposes to exploit the same combined Karo group of seams from VI to X with the increase in production rate. All the seams and aquifers of the project has already been exposed and only rate of production has to increase with the same set of technology. Therefore mine inflow (non-monsoon) will remain the same for the future production target i.e. 1,305 m3/day. Thus the proposed mine inflow (Monsoon+Non-monsoon)= 8346 m3/day.
SN Description Seepage 1 Total Excavated Area 2115900 sqm 2 Monsoon rainfall 1.040 m 3 Run-off coefficient 0.60 4 Inflow of water to the quarry 7041 cum/day
5 Total Mine water inflow 7041+1305=8346 cum/day
8
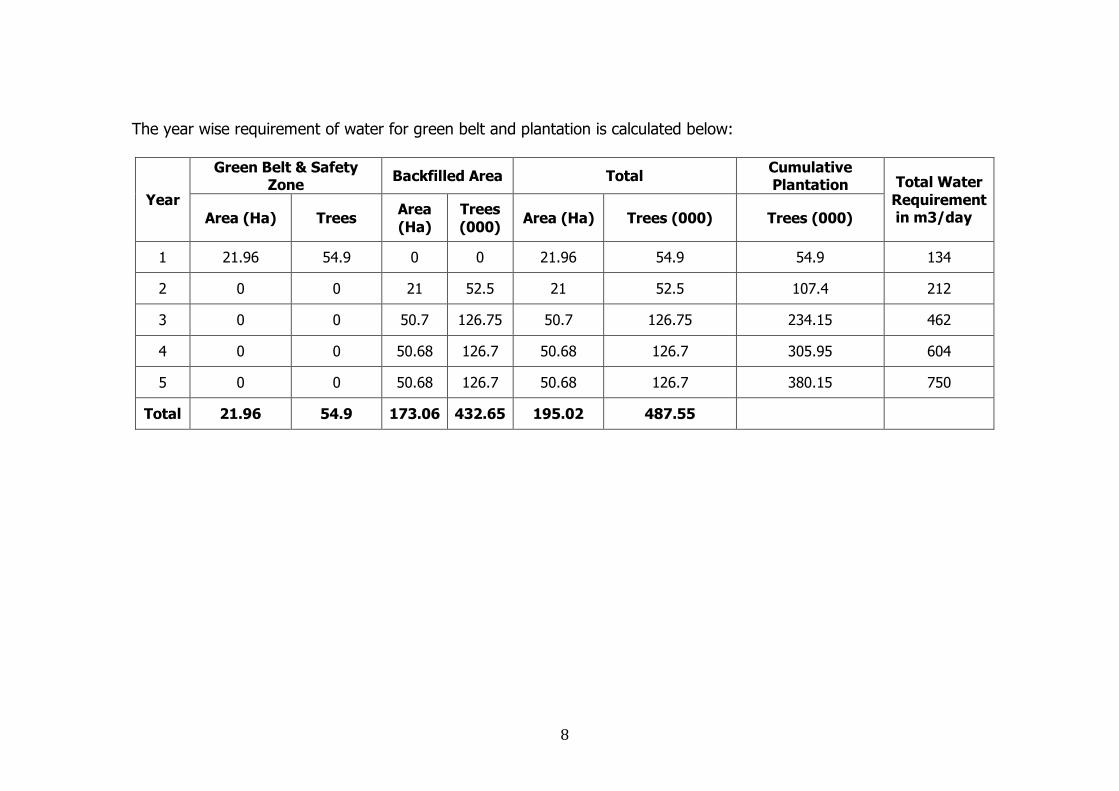
The year wise requirement of water for green belt and plantation is calculated below:
Year
Green Belt & Safety Zone Backfilled Area Total Cumulative
Plantation Total Water Requirement in m3/day Area (Ha) Trees Area
(Ha) Trees (000) Area (Ha) Trees (000) Trees (000)
1 21.96 54.9 0 0 21.96 54.9 54.9 134
2 0 0 21 52.5 21 52.5 107.4 212
3 0 0 50.7 126.75 50.7 126.75 234.15 462
4 0 0 50.68 126.7 50.68 126.7 305.95 604
5 0 0 50.68 126.7 50.68 126.7 380.15 750
Total 21.96 54.9 173.06 432.65 195.02 487.55
9
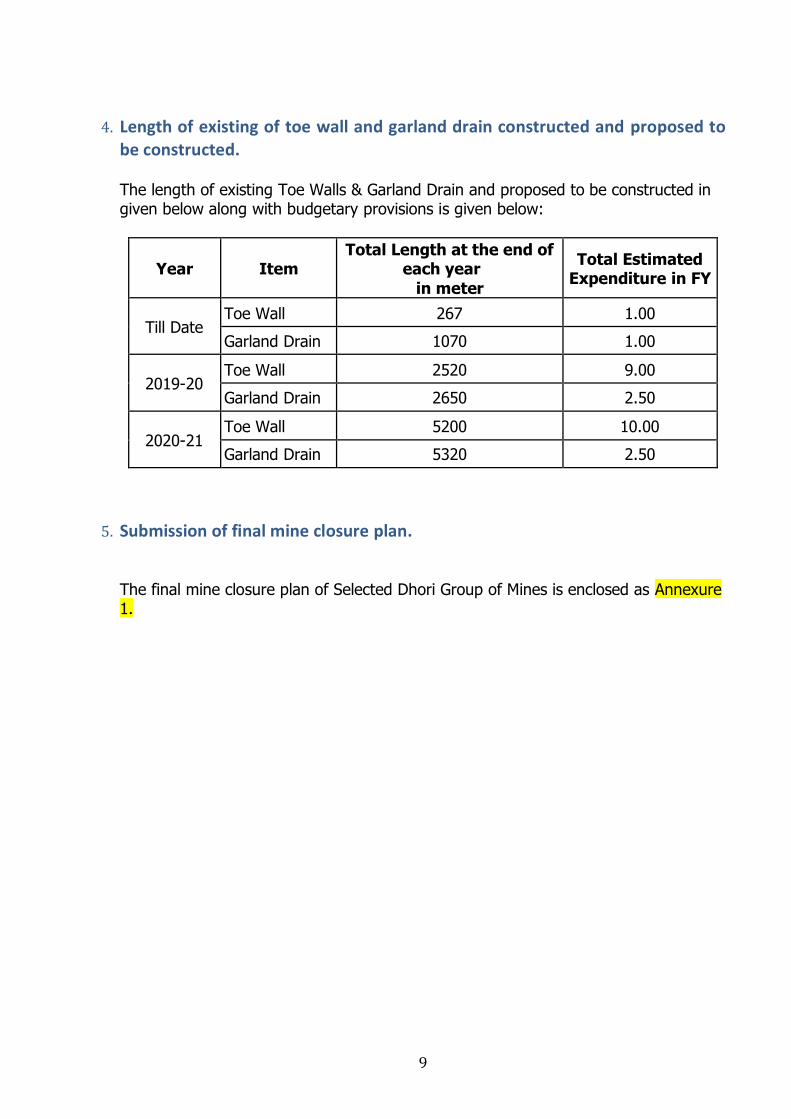
4. Length of existing of toe wall and garland drain constructed and proposed to be constructed. The length of existing Toe Walls & Garland Drain and proposed to be constructed in given below along with budgetary provisions is given below:
Year Item Total Length at the end of
each year in meter
Total Estimated Expenditure in FY
Till Date Toe Wall 267 1.00 Garland Drain 1070 1.00
2019-20 Toe Wall 2520 9.00 Garland Drain 2650 2.50
2020-21 Toe Wall 5200 10.00 Garland Drain 5320 2.50
5. Submission of final mine closure plan. The final mine closure plan of Selected Dhori Group of Mines is enclosed as Annexure 1.
10
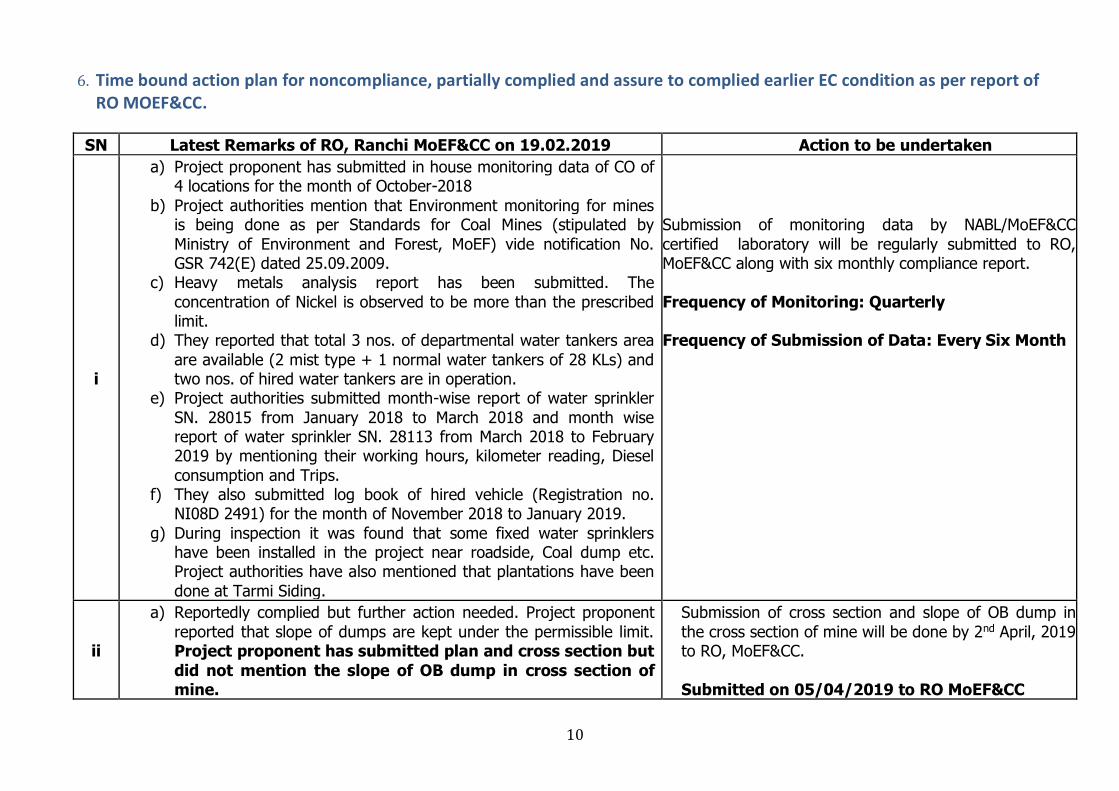
6. Time bound action plan for noncompliance, partially complied and assure to complied earlier EC condition as per report of RO MOEF&CC.
SN Latest Remarks of RO, Ranchi MoEF&CC on 19.02.2019 Action to be undertaken
i
a) Project proponent has submitted in house monitoring data of CO of 4 locations for the month of October-2018
b) Project authorities mention that Environment monitoring for mines is being done as per Standards for Coal Mines (stipulated by Ministry of Environment and Forest, MoEF) vide notification No. GSR 742(E) dated 25.09.2009.
c) Heavy metals analysis report has been submitted. The concentration of Nickel is observed to be more than the prescribed limit.
d) They reported that total 3 nos. of departmental water tankers area are available (2 mist type + 1 normal water tankers of 28 KLs) and two nos. of hired water tankers are in operation.
e) Project authorities submitted month-wise report of water sprinkler SN. 28015 from January 2018 to March 2018 and month wise report of water sprinkler SN. 28113 from March 2018 to February 2019 by mentioning their working hours, kilometer reading, Diesel consumption and Trips.
f) They also submitted log book of hired vehicle (Registration no. NI08D 2491) for the month of November 2018 to January 2019.
g) During inspection it was found that some fixed water sprinklers have been installed in the project near roadside, Coal dump etc. Project authorities have also mentioned that plantations have been done at Tarmi Siding.
Submission of monitoring data by NABL/MoEF&CC certified laboratory will be regularly submitted to RO, MoEF&CC along with six monthly compliance report. Frequency of Monitoring: Quarterly Frequency of Submission of Data: Every Six Month
ii
a) Reportedly complied but further action needed. Project proponent reported that slope of dumps are kept under the permissible limit. Project proponent has submitted plan and cross section but did not mention the slope of OB dump in cross section of mine.
Submission of cross section and slope of OB dump in the cross section of mine will be done by 2nd April, 2019 to RO, MoEF&CC. Submitted on 05/04/2019 to RO MoEF&CC
11
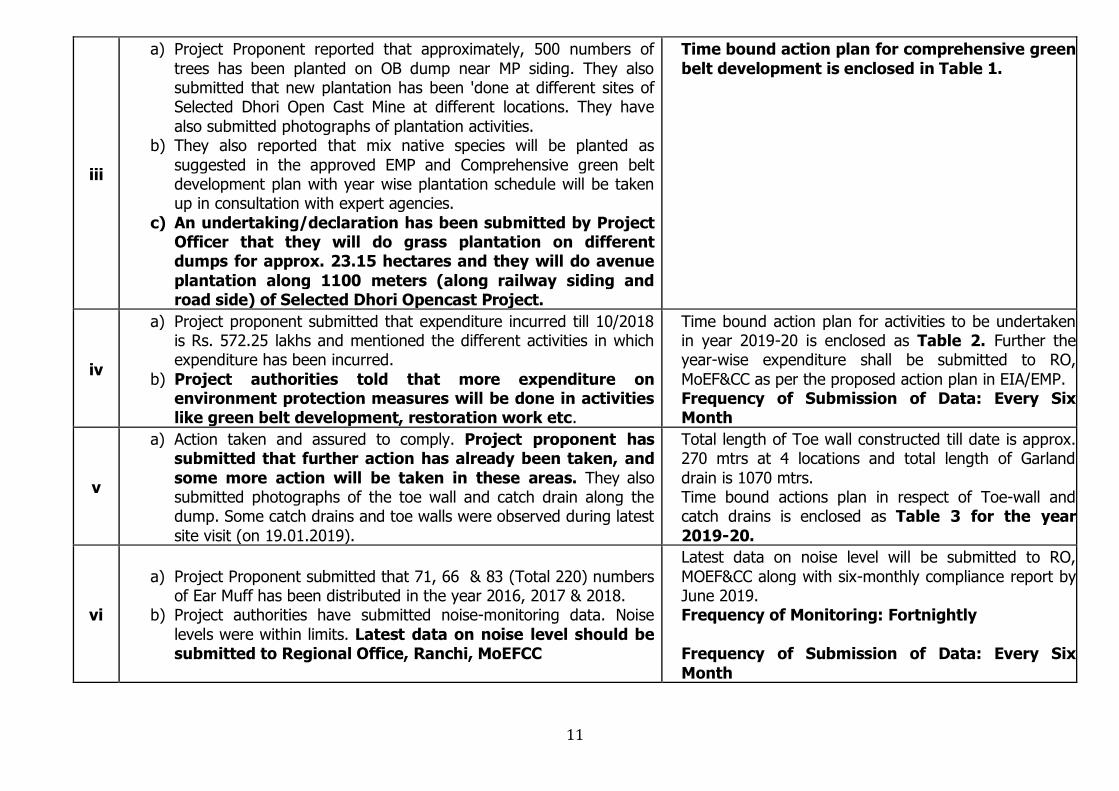
iii
a) Project Proponent reported that approximately, 500 numbers of trees has been planted on OB dump near MP siding. They also submitted that new plantation has been 'done at different sites of Selected Dhori Open Cast Mine at different locations. They have also submitted photographs of plantation activities.
b) They also reported that mix native species will be planted as suggested in the approved EMP and Comprehensive green belt development plan with year wise plantation schedule will be taken up in consultation with expert agencies.
c) An undertaking/declaration has been submitted by Project Officer that they will do grass plantation on different dumps for approx. 23.15 hectares and they will do avenue plantation along 1100 meters (along railway siding and road side) of Selected Dhori Opencast Project.
Time bound action plan for comprehensive green belt development is enclosed in Table 1.
iv
a) Project proponent submitted that expenditure incurred till 10/2018 is Rs. 572.25 lakhs and mentioned the different activities in which expenditure has been incurred.
b) Project authorities told that more expenditure on environment protection measures will be done in activities like green belt development, restoration work etc.
Time bound action plan for activities to be undertaken in year 2019-20 is enclosed as Table 2. Further the year-wise expenditure shall be submitted to RO, MoEF&CC as per the proposed action plan in EIA/EMP. Frequency of Submission of Data: Every Six Month
v
a) Action taken and assured to comply. Project proponent has submitted that further action has already been taken, and some more action will be taken in these areas. They also submitted photographs of the toe wall and catch drain along the dump. Some catch drains and toe walls were observed during latest site visit (on 19.01.2019).
Total length of Toe wall constructed till date is approx. 270 mtrs at 4 locations and total length of Garland drain is 1070 mtrs. Time bound actions plan in respect of Toe-wall and catch drains is enclosed as Table 3 for the year 2019-20.
vi
a) Project Proponent submitted that 71, 66 & 83 (Total 220) numbers of Ear Muff has been distributed in the year 2016, 2017 & 2018.
b) Project authorities have submitted noise-monitoring data. Noise levels were within limits. Latest data on noise level should be submitted to Regional Office, Ranchi, MoEFCC
Latest data on noise level will be submitted to RO, MOEF&CC along with six-monthly compliance report by June 2019. Frequency of Monitoring: Fortnightly
Frequency of Submission of Data: Every Six Month
12
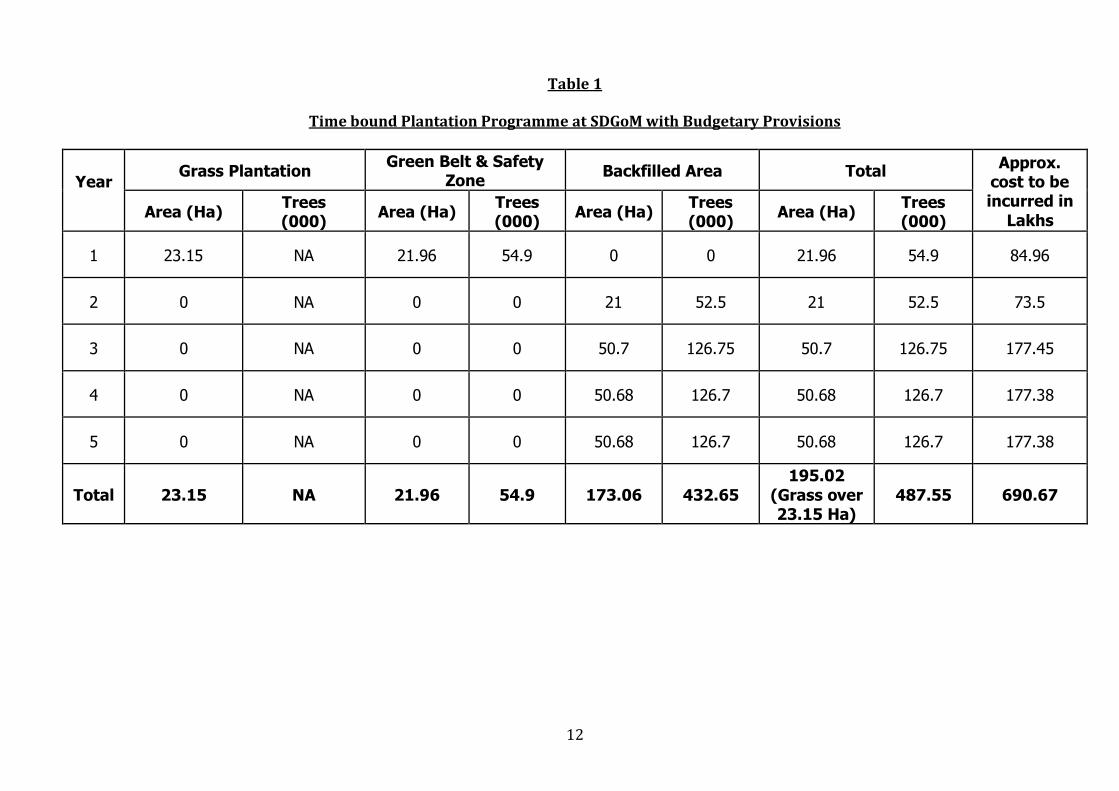
Table 1
Time bound Plantation Programme at SDGoM with Budgetary Provisions
Year
Grass Plantation Green Belt & Safety Zone Backfilled Area Total Approx.
cost to be incurred in
Lakhs Area (Ha) Trees (000) Area (Ha) Trees
(000) Area (Ha) Trees (000) Area (Ha) Trees
(000)
1 23.15 NA 21.96 54.9 0 0 21.96 54.9 84.96
2 0 NA 0 0 21 52.5 21 52.5 73.5
3 0 NA 0 0 50.7 126.75 50.7 126.75 177.45
4 0 NA 0 0 50.68 126.7 50.68 126.7 177.38
5 0 NA 0 0 50.68 126.7 50.68 126.7 177.38
Total 23.15 NA 21.96 54.9 173.06 432.65 195.02
(Grass over 23.15 Ha)
487.55 690.67
13
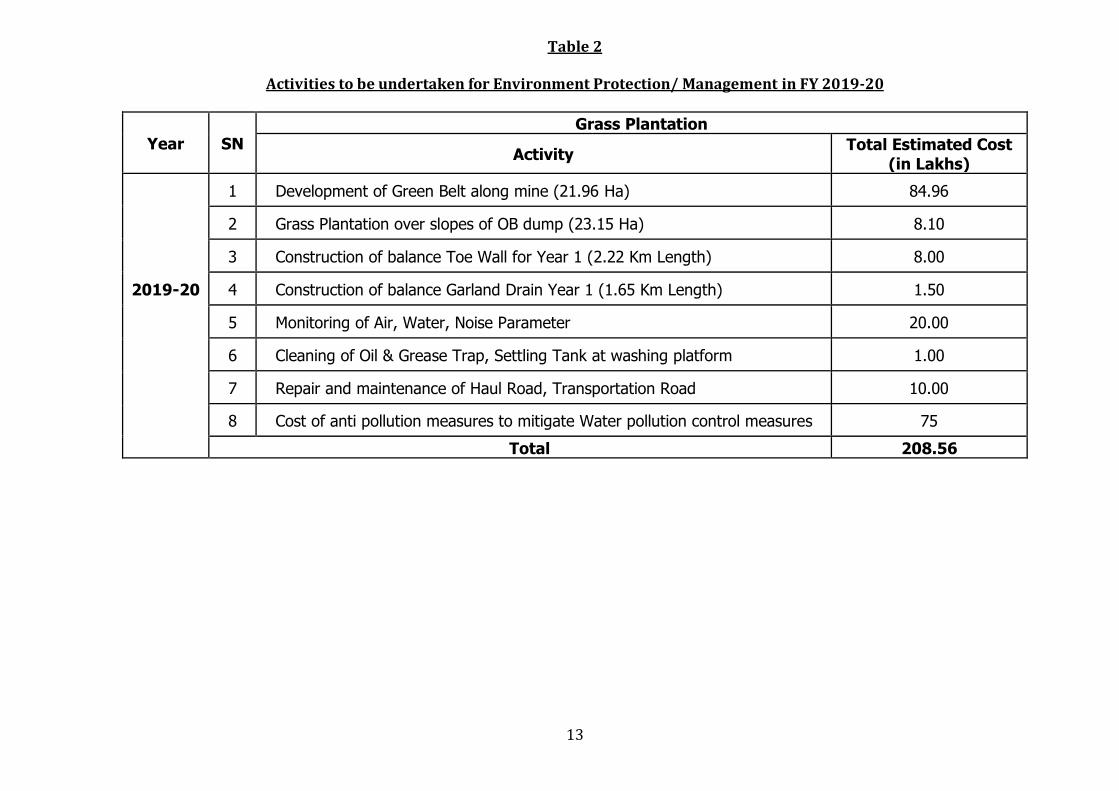
Table 2
Activities to be undertaken for Environment Protection/ Management in FY 2019-20
Year SN Grass Plantation
Activity Total Estimated Cost (in Lakhs)
2019-20
1 Development of Green Belt along mine (21.96 Ha) 84.96
2 Grass Plantation over slopes of OB dump (23.15 Ha) 8.10
3 Construction of balance Toe Wall for Year 1 (2.22 Km Length) 8.00
4 Construction of balance Garland Drain Year 1 (1.65 Km Length) 1.50
5 Monitoring of Air, Water, Noise Parameter 20.00
6 Cleaning of Oil & Grease Trap, Settling Tank at washing platform 1.00
7 Repair and maintenance of Haul Road, Transportation Road 10.00 8 Cost of anti pollution measures to mitigate Water pollution control measures 75 Total 208.56
14
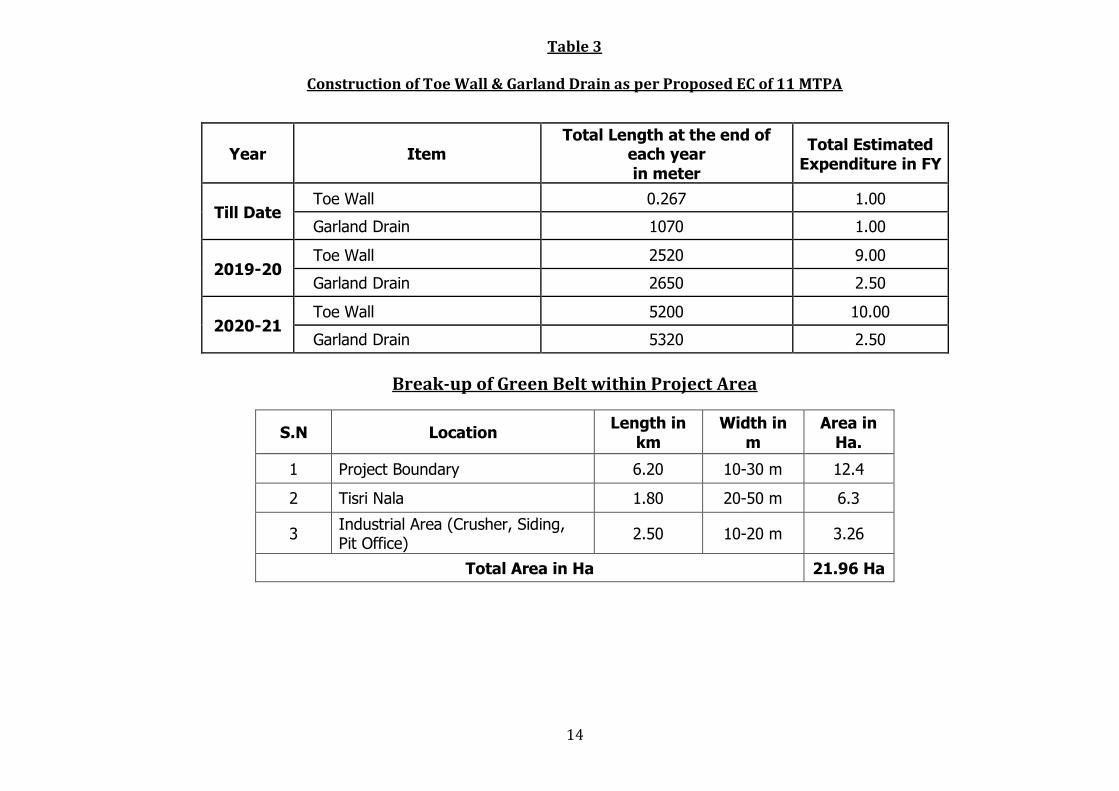
Table 3
Construction of Toe Wall & Garland Drain as per Proposed EC of 11 MTPA
Year Item Total Length at the end of
each year in meter
Total Estimated Expenditure in FY
Till Date Toe Wall 0.267 1.00 Garland Drain 1070 1.00
2019-20 Toe Wall 2520 9.00 Garland Drain 2650 2.50
2020-21 Toe Wall 5200 10.00 Garland Drain 5320 2.50
Break-up of Green Belt within Project Area
S.N Location Length in km
Width in m
Area in Ha.
1 Project Boundary 6.20 10-30 m 12.4
2 Tisri Nala 1.80 20-50 m 6.3
3 Industrial Area (Crusher, Siding, Pit Office) 2.50 10-20 m 3.26
Total Area in Ha 21.96 Ha

15
7. Details about Economic benefit derived due to violation
The tentative economic benefit derived in Selected Dhori Group of Mines due to excess production in year 2017-18 is approximately 41.91 Crores.
16
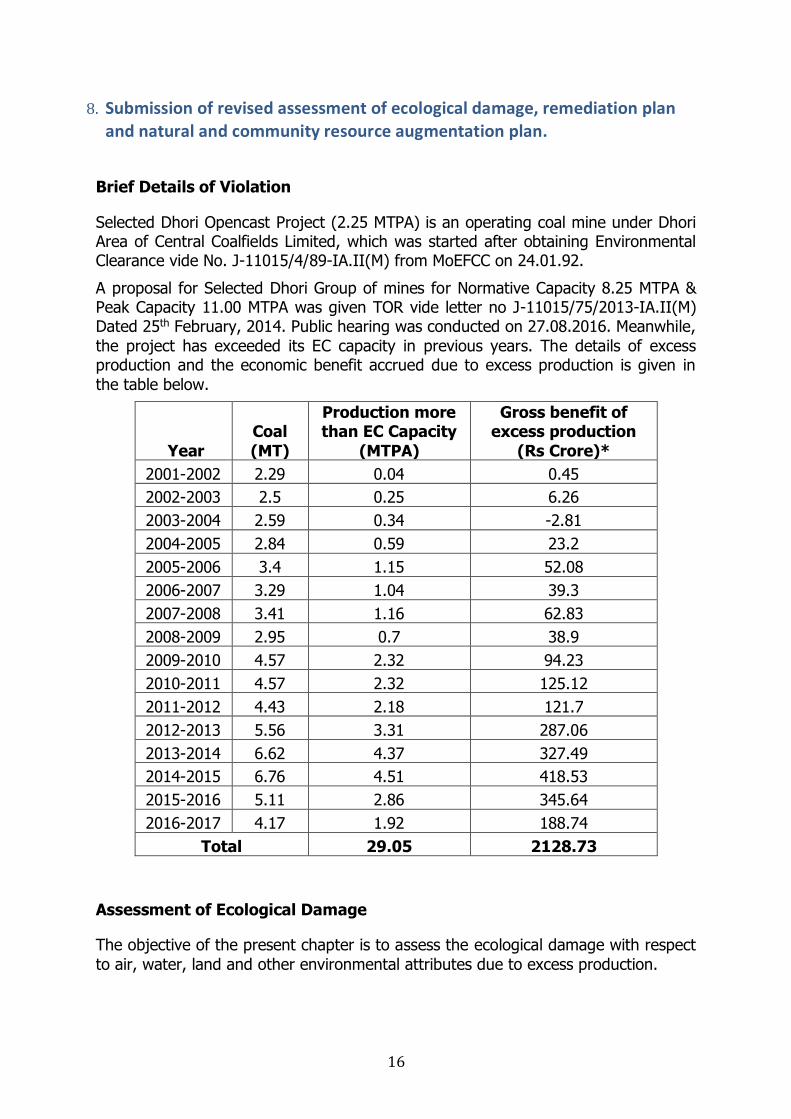
8. Submission of revised assessment of ecological damage, remediation plan and natural and community resource augmentation plan.
Brief Details of Violation
Selected Dhori Opencast Project (2.25 MTPA) is an operating coal mine under Dhori Area of Central Coalfields Limited, which was started after obtaining Environmental Clearance vide No. J-11015/4/89-IA.II(M) from MoEFCC on 24.01.92. A proposal for Selected Dhori Group of mines for Normative Capacity 8.25 MTPA & Peak Capacity 11.00 MTPA was given TOR vide letter no J-11015/75/2013-IA.II(M) Dated 25th February, 2014. Public hearing was conducted on 27.08.2016. Meanwhile, the project has exceeded its EC capacity in previous years. The details of excess production and the economic benefit accrued due to excess production is given in the table below.
Year Coal (MT)
Production more than EC Capacity
(MTPA)
Gross benefit of excess production
(Rs Crore)* 2001-2002 2.29 0.04 0.45 2002-2003 2.5 0.25 6.26 2003-2004 2.59 0.34 -2.81 2004-2005 2.84 0.59 23.2 2005-2006 3.4 1.15 52.08 2006-2007 3.29 1.04 39.3 2007-2008 3.41 1.16 62.83 2008-2009 2.95 0.7 38.9 2009-2010 4.57 2.32 94.23 2010-2011 4.57 2.32 125.12 2011-2012 4.43 2.18 121.7 2012-2013 5.56 3.31 287.06 2013-2014 6.62 4.37 327.49 2014-2015 6.76 4.51 418.53 2015-2016 5.11 2.86 345.64 2016-2017 4.17 1.92 188.74
Total 29.05 2128.73
Assessment of Ecological Damage
The objective of the present chapter is to assess the ecological damage with respect to air, water, land and other environmental attributes due to excess production.
17
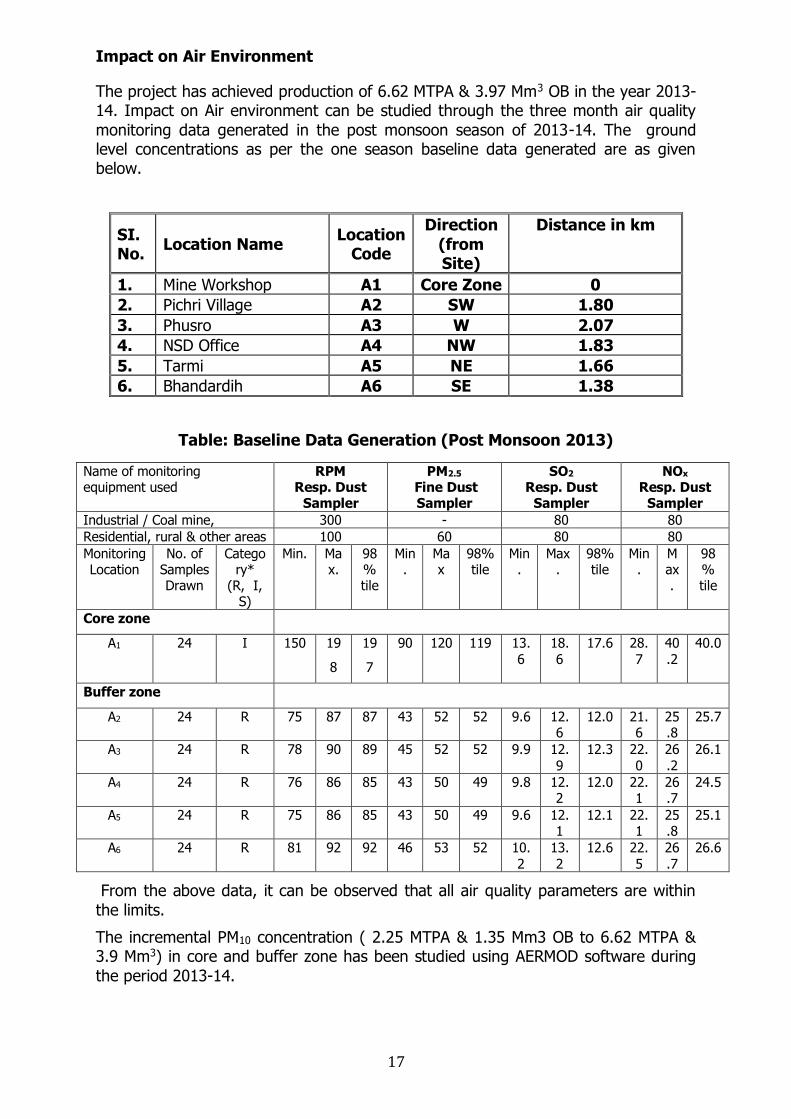
Impact on Air Environment
The project has achieved production of 6.62 MTPA & 3.97 Mm3 OB in the year 2013-14. Impact on Air environment can be studied through the three month air quality monitoring data generated in the post monsoon season of 2013-14. The ground level concentrations as per the one season baseline data generated are as given below.
SI. No. Location Name Location
Code
Direction (from Site)
Distance in km
1. Mine Workshop A1 Core Zone 0 2. Pichri Village A2 SW 1.80 3. Phusro A3 W 2.07 4. NSD Office A4 NW 1.83 5. Tarmi A5 NE 1.66 6. Bhandardih A6 SE 1.38
Table: Baseline Data Generation (Post Monsoon 2013)
Name of monitoring equipment used
RPM Resp. Dust
Sampler
PM2.5 Fine Dust Sampler
SO2 Resp. Dust
Sampler
NOx Resp. Dust
Sampler Industrial / Coal mine, 300 - 80 80 Residential, rural & other areas 100 60 80 80 Monitoring Location
No. of Samples Drawn
Category*
(R, I, S)
Min. Max.
98% tile
Min.
Max
98% tile
Min.
Max.
98% tile
Min.
Max.
98% tile
Core zone
A1 24 I 150 198
197
90 120 119 13.6
18.6
17.6 28.7
40.2
40.0
Buffer zone
A2 24 R 75 87 87 43 52 52 9.6 12.6
12.0 21.6
25.8
25.7
A3 24 R 78 90 89 45 52 52 9.9 12.9
12.3 22.0
26.2
26.1
A4 24 R 76 86 85 43 50 49 9.8 12.2
12.0 22.1
26.7
24.5
A5 24 R 75 86 85 43 50 49 9.6 12.1
12.1 22.1
25.8
25.1
A6 24 R 81 92 92 46 53 52 10.2
13.2
12.6 22.5
26.7
26.6
From the above data, it can be observed that all air quality parameters are within the limits. The incremental PM10 concentration ( 2.25 MTPA & 1.35 Mm3 OB to 6.62 MTPA & 3.9 Mm3) in core and buffer zone has been studied using AERMOD software during the period 2013-14.
18
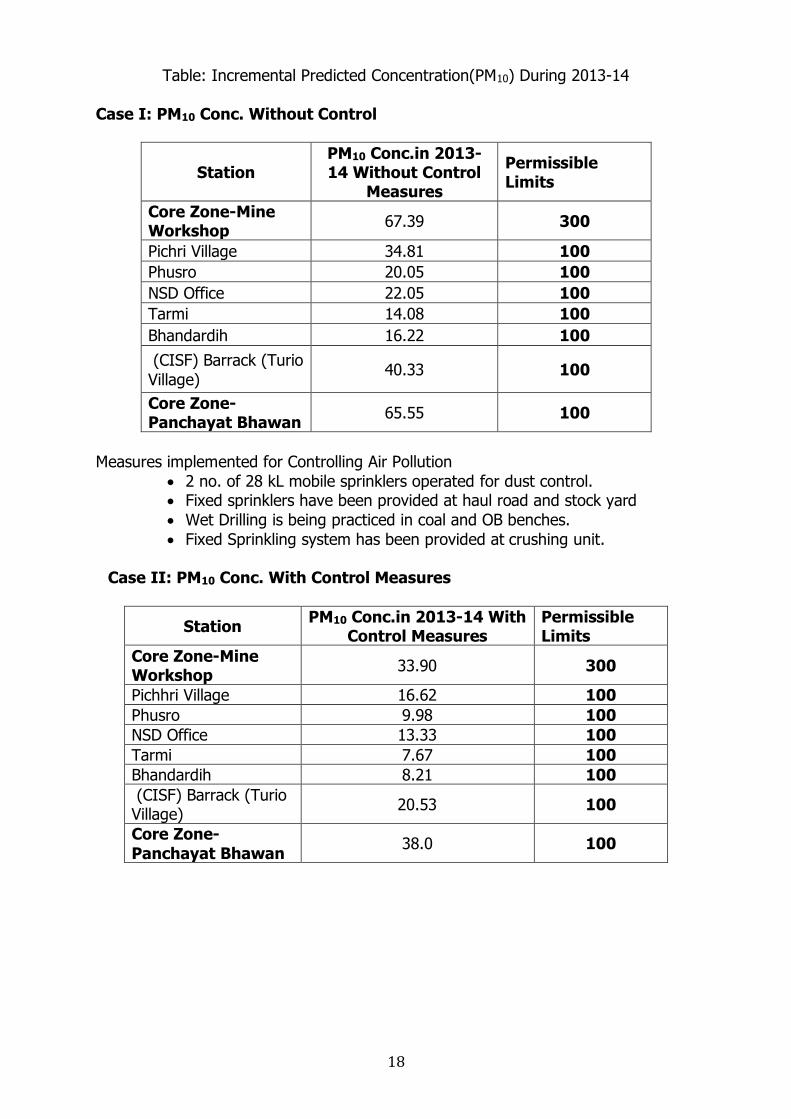
Table: Incremental Predicted Concentration(PM10) During 2013-14
Case I: PM10 Conc. Without Control
Station PM10 Conc.in 2013-14 Without Control
Measures Permissible Limits
Core Zone-Mine Workshop 67.39 300
Pichri Village 34.81 100 Phusro 20.05 100 NSD Office 22.05 100 Tarmi 14.08 100 Bhandardih 16.22 100 (CISF) Barrack (Turio Village) 40.33 100
Core Zone-Panchayat Bhawan 65.55 100
Measures implemented for Controlling Air Pollution
x 2 no. of 28 kL mobile sprinklers operated for dust control. x Fixed sprinklers have been provided at haul road and stock yard x Wet Drilling is being practiced in coal and OB benches. x Fixed Sprinkling system has been provided at crushing unit.
Case II: PM10 Conc. With Control Measures
Station PM10 Conc.in 2013-14 With Control Measures
Permissible Limits
Core Zone-Mine Workshop 33.90 300
Pichhri Village 16.62 100 Phusro 9.98 100 NSD Office 13.33 100 Tarmi 7.67 100 Bhandardih 8.21 100 (CISF) Barrack (Turio Village) 20.53 100
Core Zone-Panchayat Bhawan 38.0 100
19
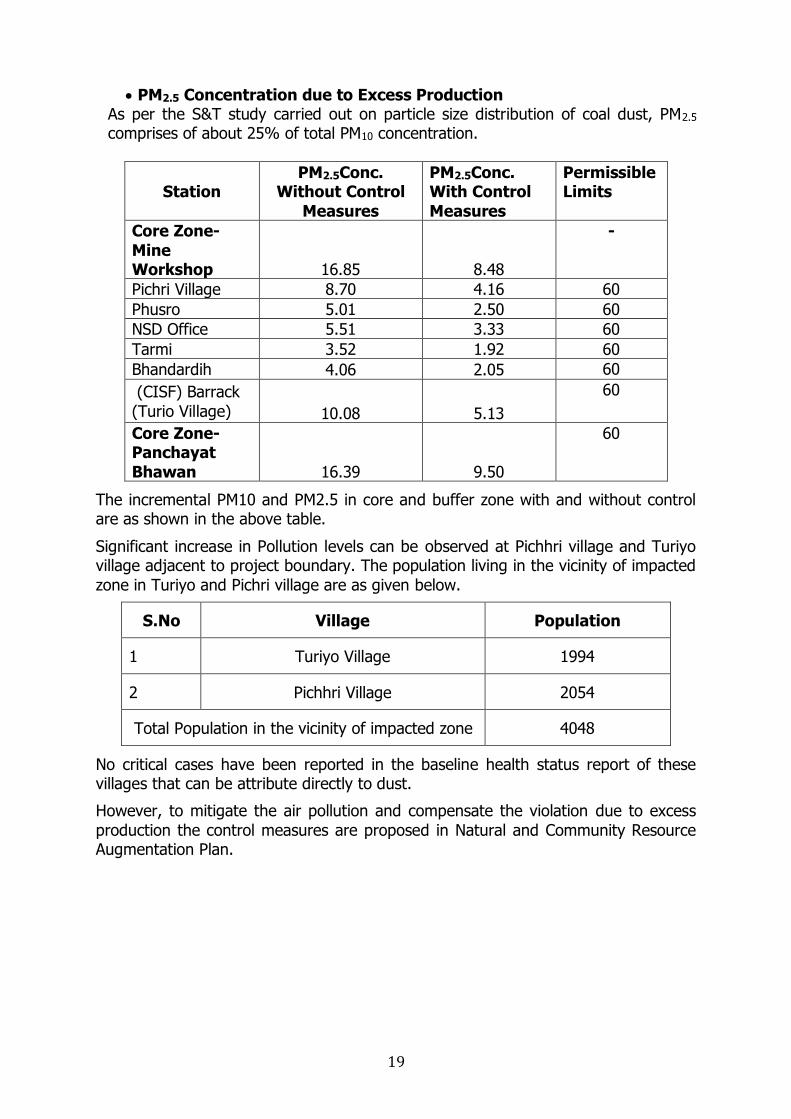
x PM2.5 Concentration due to Excess Production As per the S&T study carried out on particle size distribution of coal dust, PM2.5 comprises of about 25% of total PM10 concentration.
Station PM2.5Conc.
Without Control Measures
PM2.5Conc. With Control Measures
Permissible Limits
Core Zone-Mine Workshop 16.85 8.48
-
Pichri Village 8.70 4.16 60 Phusro 5.01 2.50 60 NSD Office 5.51 3.33 60 Tarmi 3.52 1.92 60 Bhandardih 4.06 2.05 60 (CISF) Barrack (Turio Village) 10.08 5.13
60
Core Zone-Panchayat Bhawan 16.39 9.50
60
The incremental PM10 and PM2.5 in core and buffer zone with and without control are as shown in the above table. Significant increase in Pollution levels can be observed at Pichhri village and Turiyo village adjacent to project boundary. The population living in the vicinity of impacted zone in Turiyo and Pichri village are as given below.
S.No Village Population
1 Turiyo Village 1994
2 Pichhri Village 2054
Total Population in the vicinity of impacted zone 4048
No critical cases have been reported in the baseline health status report of these villages that can be attribute directly to dust. However, to mitigate the air pollution and compensate the violation due to excess production the control measures are proposed in Natural and Community Resource Augmentation Plan.
20
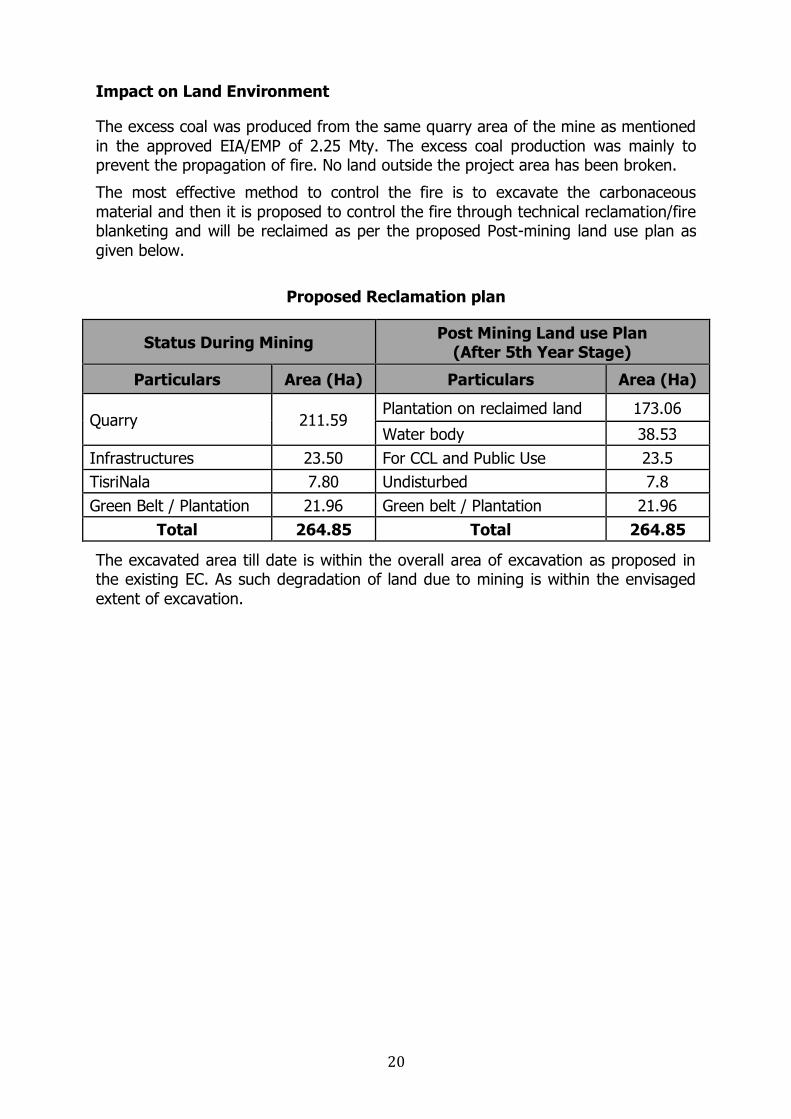
Impact on Land Environment
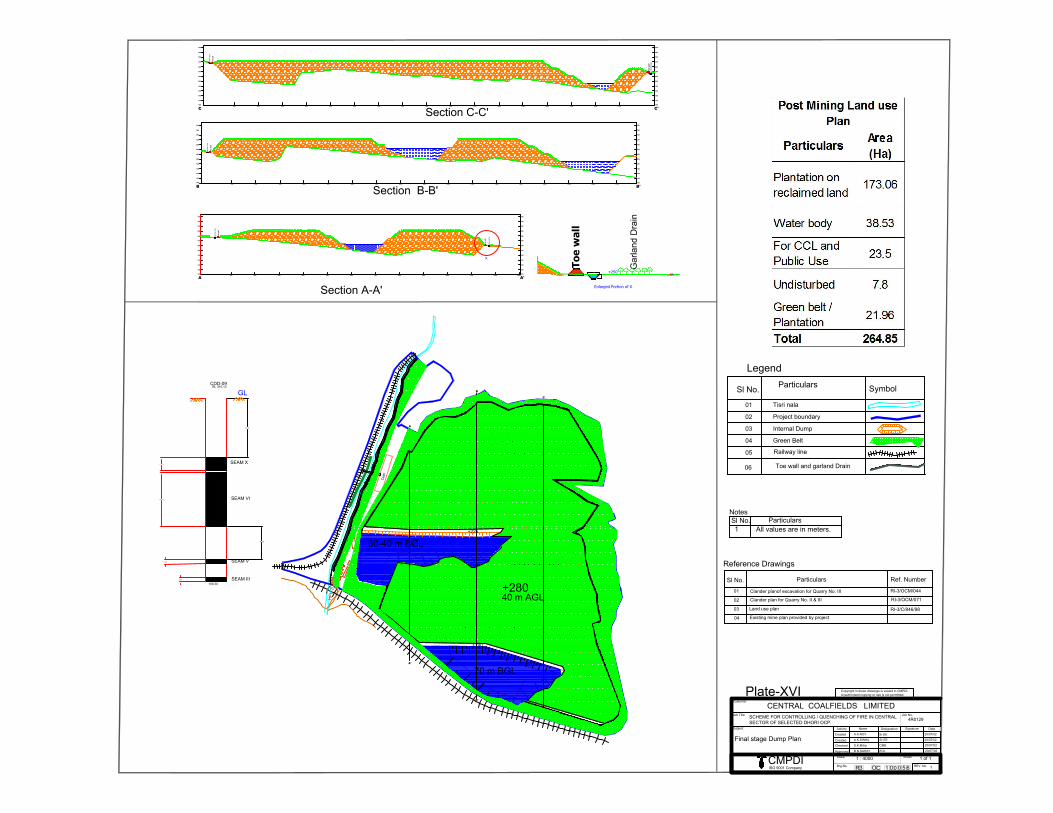
The excess coal was produced from the same quarry area of the mine as mentioned in the approved EIA/EMP of 2.25 Mty. The excess coal production was mainly to prevent the propagation of fire. No land outside the project area has been broken. The most effective method to control the fire is to excavate the carbonaceous material and then it is proposed to control the fire through technical reclamation/fire blanketing and will be reclaimed as per the proposed Post-mining land use plan as given below.
Proposed Reclamation plan
Status During Mining Post Mining Land use Plan (After 5th Year Stage)
Particulars Area (Ha) Particulars Area (Ha)
Quarry 211.59 Plantation on reclaimed land 173.06 Water body 38.53
Infrastructures 23.50 For CCL and Public Use 23.5 TisriNala 7.80 Undisturbed 7.8 Green Belt / Plantation 21.96 Green belt / Plantation 21.96
Total 264.85 Total 264.85
The excavated area till date is within the overall area of excavation as proposed in the existing EC. As such degradation of land due to mining is within the envisaged extent of excavation.
21
Impact on Water Environment
Water can be categorized in two categories: a. Ground Water b. Surface Water
Ground Water Potential Damage on Ground water due to Excess Production are as given below:
1. Depletion of ground water level due to mine seepage and obstruction of
Rainwater infiltration due to mining Activities 2. Impact on ground water quality.
1. Depletion of Ground Water Level:
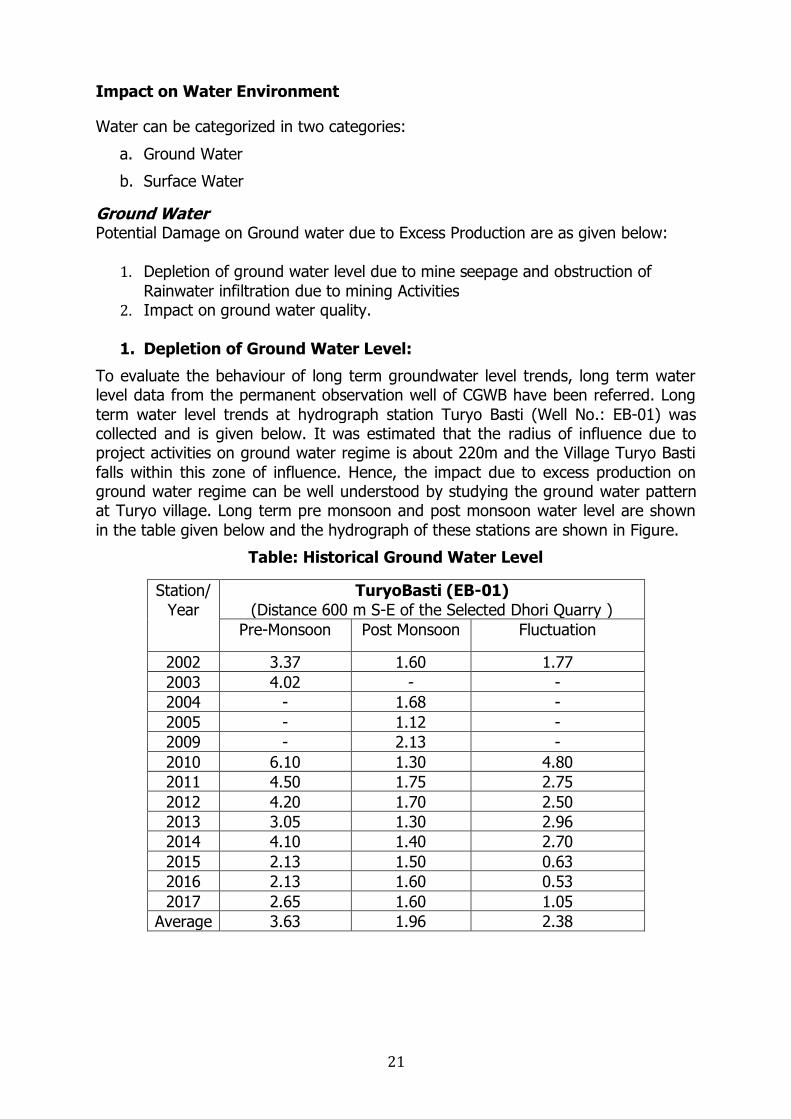
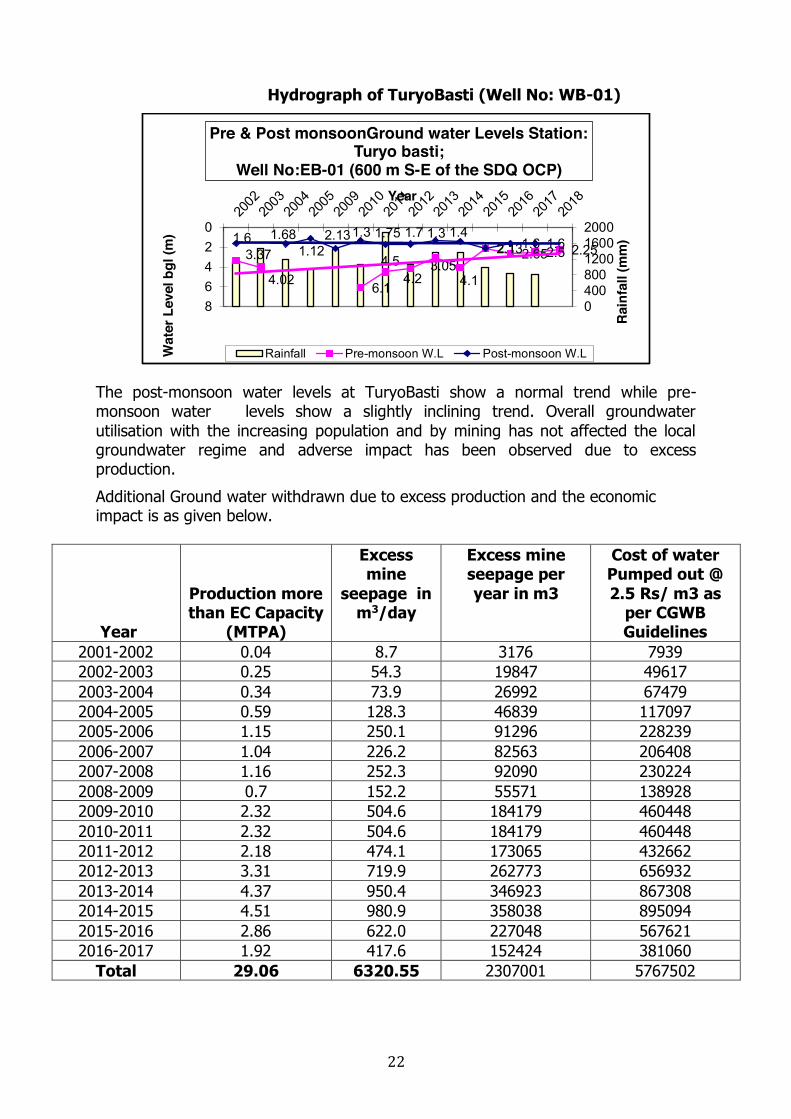
To evaluate the behaviour of long term groundwater level trends, long term water level data from the permanent observation well of CGWB have been referred. Long term water level trends at hydrograph station Turyo Basti (Well No.: EB-01) was collected and is given below. It was estimated that the radius of influence due to project activities on ground water regime is about 220m and the Village Turyo Basti falls within this zone of influence. Hence, the impact due to excess production on ground water regime can be well understood by studying the ground water pattern at Turyo village. Long term pre monsoon and post monsoon water level are shown in the table given below and the hydrograph of these stations are shown in Figure.
Table: Historical Ground Water Level
Station/ Year
TuryoBasti (EB-01) (Distance 600 m S-E of the Selected Dhori Quarry )
Pre-Monsoon Post Monsoon Fluctuation
2002 3.37 1.60 1.77 2003 4.02 - - 2004 - 1.68 - 2005 - 1.12 - 2009 - 2.13 - 2010 6.10 1.30 4.80 2011 4.50 1.75 2.75 2012 4.20 1.70 2.50 2013 3.05 1.30 2.96 2014 4.10 1.40 2.70 2015 2.13 1.50 0.63 2016 2.13 1.60 0.53 2017 2.65 1.60 1.05
Average 3.63 1.96 2.38
22
Hydrograph of TuryoBasti (Well No: WB-01)
The post-monsoon water levels at TuryoBasti show a normal trend while pre-monsoon water levels show a slightly inclining trend. Overall groundwater utilisation with the increasing population and by mining has not affected the local groundwater regime and adverse impact has been observed due to excess production. Additional Ground water withdrawn due to excess production and the economic impact is as given below.
Year
Production more than EC Capacity
(MTPA)
Excess mine
seepage in m3/day
Excess mine seepage per year in m3
Cost of water Pumped out @ 2.5 Rs/ m3 as
per CGWB Guidelines
2001-2002 0.04 8.7 3176 7939 2002-2003 0.25 54.3 19847 49617 2003-2004 0.34 73.9 26992 67479 2004-2005 0.59 128.3 46839 117097 2005-2006 1.15 250.1 91296 228239 2006-2007 1.04 226.2 82563 206408 2007-2008 1.16 252.3 92090 230224 2008-2009 0.7 152.2 55571 138928 2009-2010 2.32 504.6 184179 460448 2010-2011 2.32 504.6 184179 460448 2011-2012 2.18 474.1 173065 432662 2012-2013 3.31 719.9 262773 656932 2013-2014 4.37 950.4 346923 867308 2014-2015 4.51 980.9 358038 895094 2015-2016 2.86 622.0 227048 567621 2016-2017 1.92 417.6 152424 381060
Total 29.06 6320.55 2307001 5767502
3.37
4.02 6.1
4.54.2
3.054.1
2.132.652.5 2.251.6 1.68
1.122.131.3 1.75 1.7 1.3 1.4
2.1 1.6 1.6
04008001200160020000
2468
Rain
fall
(mm
)
Wat
er L
evel
bgl
(m)
Year
Pre & Post monsoonGround water Levels Station: Turyo basti;
Well No:EB-01 (600 m S-E of the SDQ OCP)
Rainfall Pre-monsoon W.L Post-monsoon W.L
23
2. Impact on ground water quality The ground water quality was monitored at two locations Phusro Hand Pump (GW1) and Pichri Hand Pump (GW2) during the baseline study carried out during the period (22/10/2018 – 15/01/2019).
Table: Ground water Quality Sampling Date: 30.10.18
SN Parameter Sampling Stations Detection
Limit IS:10500 Standards
Standard / Test Method
GW1 GW2
1 Boron (as B), mg/l, Max
<0.20 <0.20 0.20 0.5 APHA, 22nd Edition ,Carmine
2 Cadmium (as Cd), mg/l, Max
<0.0005 <0.0005 0.0005 0.003 APHA, 22nd Edition, AAS-GTA
3 Calcium (as Ca), mg/l, Max
73.6 84.8 1.60 75 IS-3025/40:1991, EDTA
4 Chloride (as Cl), mg/l, Max
142 60 2.00 250 IS-3025/32:1988, R-2007, Argentometric
5 Copper (as Cu), mg/l, Max
<0.03 <0.03 0.03 0.05 IS 3025/42 : 1992 R : 2009, AAS-Flame
6 Fluoride (as F) mg/l, Max
0.37 0.29 0.02 1.0 APHA, 22nd Edition , SPADNS
7
Free Residual Chlorine, mg/l, Min
<0.02 <0.02 0.02 0.2 APHA, 22nd Edition, DPD
8 Iron (as Fe), mg/l, Max
<0.06 <0.06 0.06 0.3 IS 3025 /53 : 2003, R : 2009 , AAS-Flame
9 Lead (as Pb), mg/l, Max
<0.005 <0.005 0.005 0.01 APHA, 22nd Edition, AAS-GTA
24
10 Manganese (as Mn), mg/l, Max
<0.02 <0.02 0.02 0.1 IS-3025/59:2006,AAS-Flame
11 Nickel (as Ni), mg/l, Max
0.01 0.01 0.01 0.02 IS-3025/54:2003, AAS-Flame
12 Nitrate (as NO3), mg/l, Max
6.95 5.76 0.5 45 APHA, 22nd Edition, UV-Spectrophotometric
13 Odour Agreeable Agreeable Qualitative Agreeable IS 3025 /05:1983,R-2012, Qualitative
14 pH value 8.11 7.77 0.2 6.5 to 8.5 IS-3025/11:1983, R-1996, Electrometric
15
Phenolic compounds (as C6H5OH), mg/l, Max
<0.001 <0.001 0.001 0.001 APHA, 22nd Edition,4-Amino Autipyrine
16 Selenium (as Se), mg/l, Max
<0.002 <0.002 0.002 0.01 APHA, 22nd Edition, AAS-GTA
17 Sulphate (as SO4) mg/l, Max
67 30 2.00 200 APHA, 22nd Edition. Turbidity
18 Total Alkalinity (caco3), mg/l, Max
280 296 4.00 200 IS-3025/23:1986,Titration
19
Total Arsenic (as As), mg/l, Max
<0.002 <0.002 0.002 0.01 IS 3025/ 37:1988 R : 2003, AAS-VGA
20 Total Chromium (as Cr), mg/l, Max
0.06 0.06 0.04 0.05 IS-3025/52:2003, AAS-Flame
21 Total Dissolved Solids,
624 492 25.00 500 IS 3025 /16:1984 R : 2006, Gravimetric
25
mg/l, Max
22
Total Hardness (caco3), mg/l, Max
312 356 4.00 200 IS-3025/21:1983, R-2002, EDTA
23 Turbidity, NTU, Max 1.0 1.0 1.0 1 IS-3025/10:1984 R-
1996, Nephelometric
24 Zinc (as Zn), mg/l, Max
0.21 0.03 0.01 5.0 IS 3025/ 49 : 1994, R : 2009, AAS-Flame
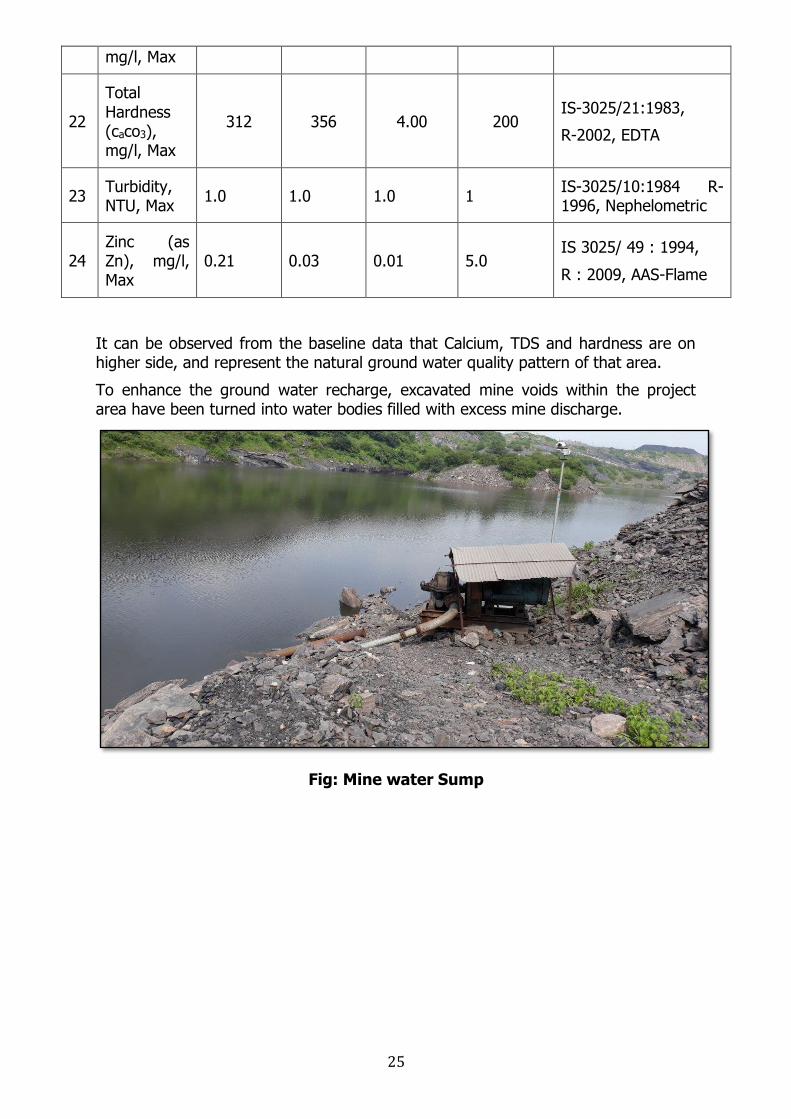
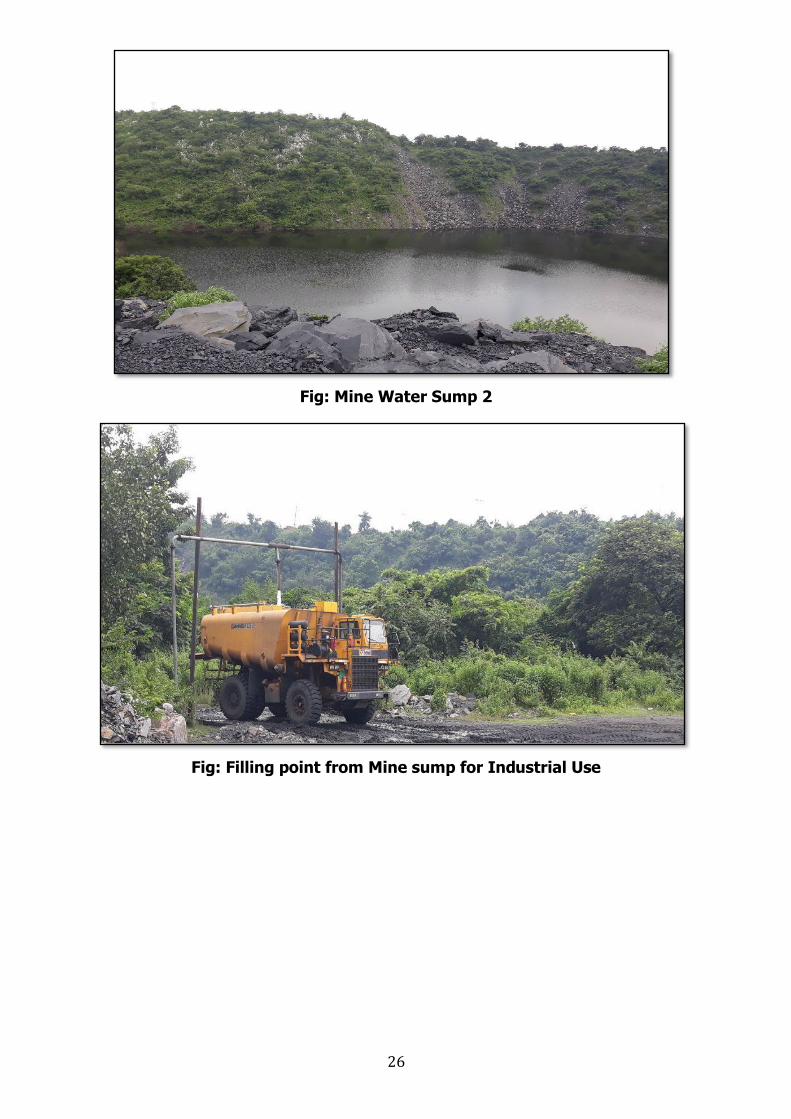
It can be observed from the baseline data that Calcium, TDS and hardness are on higher side, and represent the natural ground water quality pattern of that area. To enhance the ground water recharge, excavated mine voids within the project area have been turned into water bodies filled with excess mine discharge.
Fig: Mine water Sump
26
Fig: Mine Water Sump 2
Fig: Filling point from Mine sump for Industrial Use
27
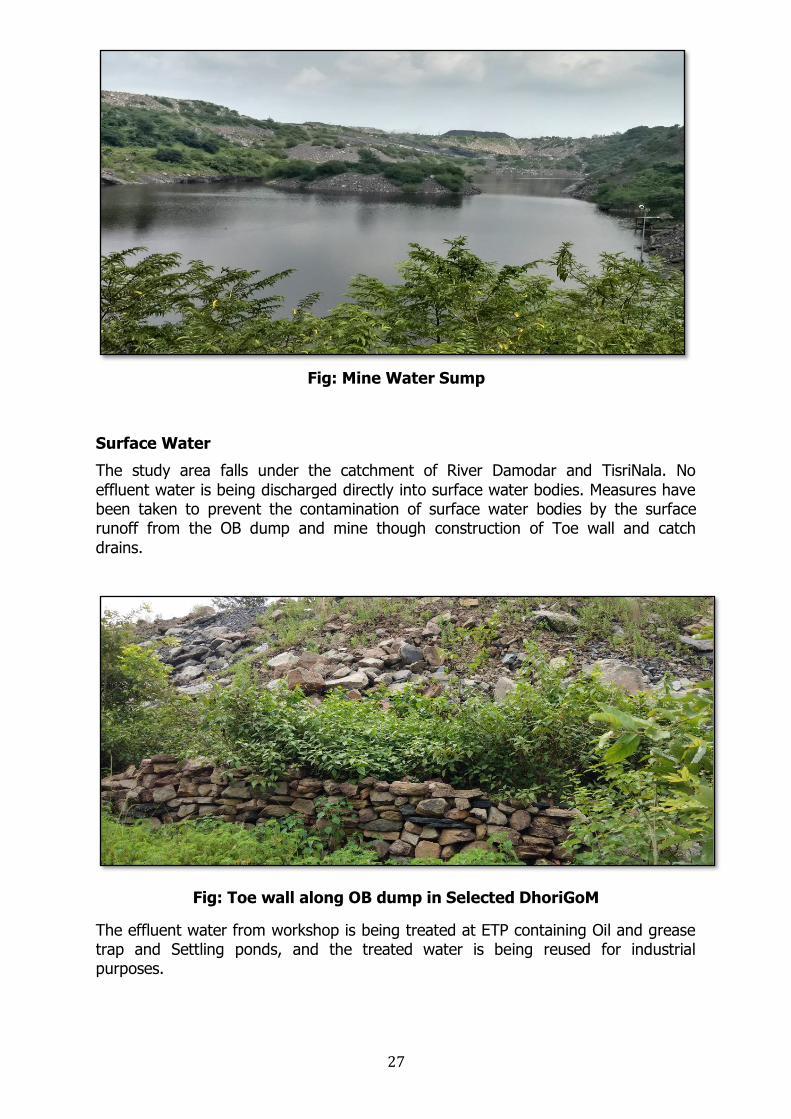
Fig: Mine Water Sump
Surface Water The study area falls under the catchment of River Damodar and TisriNala. No effluent water is being discharged directly into surface water bodies. Measures have been taken to prevent the contamination of surface water bodies by the surface runoff from the OB dump and mine though construction of Toe wall and catch drains.
Fig: Toe wall along OB dump in Selected DhoriGoM
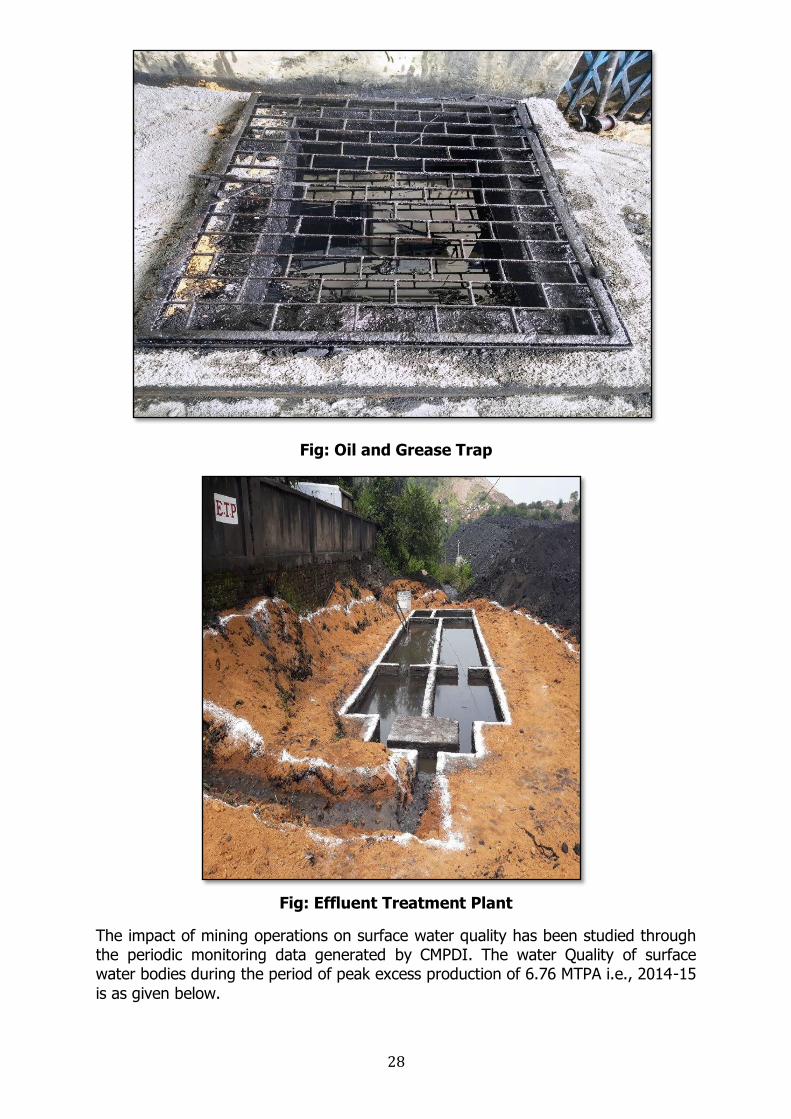
The effluent water from workshop is being treated at ETP containing Oil and grease trap and Settling ponds, and the treated water is being reused for industrial purposes.
28
Fig: Oil and Grease Trap
Fig: Effluent Treatment Plant
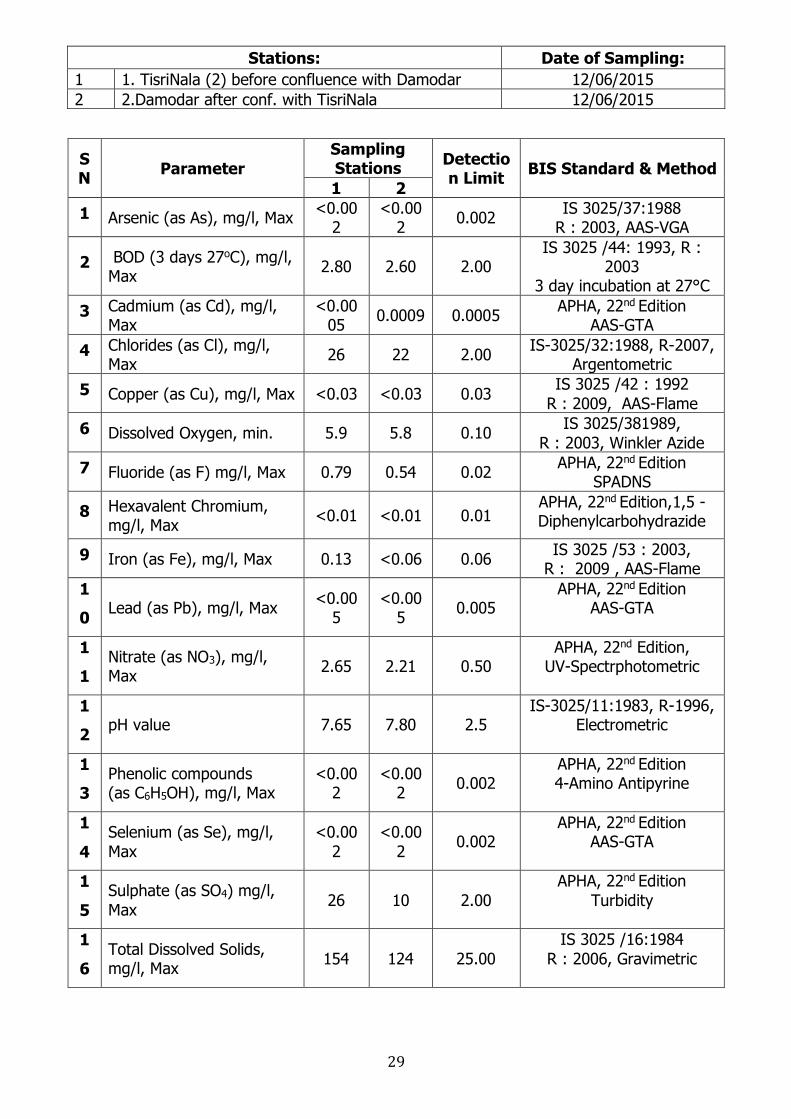
The impact of mining operations on surface water quality has been studied through the periodic monitoring data generated by CMPDI. The water Quality of surface water bodies during the period of peak excess production of 6.76 MTPA i.e., 2014-15 is as given below.
29
Stations: Date of Sampling: 1 1. TisriNala (2) before confluence with Damodar 12/06/2015 2 2.Damodar after conf. with TisriNala 12/06/2015
SN Parameter
Sampling Stations Detectio
n Limit BIS Standard & Method 1 2
1 Arsenic (as As), mg/l, Max <0.002
<0.002 0.002 IS 3025/37:1988
R : 2003, AAS-VGA
2 BOD (3 days 27oC), mg/l, Max 2.80 2.60 2.00
IS 3025 /44: 1993, R : 2003
3 day incubation at 27°C 3 Cadmium (as Cd), mg/l,
Max <0.00
05 0.0009 0.0005 APHA, 22nd Edition AAS-GTA
4 Chlorides (as Cl), mg/l, Max 26 22 2.00 IS-3025/32:1988, R-2007,
Argentometric 5 Copper (as Cu), mg/l, Max <0.03 <0.03 0.03 IS 3025 /42 : 1992
R : 2009, AAS-Flame 6 Dissolved Oxygen, min. 5.9 5.8 0.10 IS 3025/381989,
R : 2003, Winkler Azide 7 Fluoride (as F) mg/l, Max 0.79 0.54 0.02 APHA, 22nd Edition
SPADNS
8 Hexavalent Chromium, mg/l, Max <0.01 <0.01 0.01
APHA, 22nd Edition,1,5 - Diphenylcarbohydrazide
9 Iron (as Fe), mg/l, Max 0.13 <0.06 0.06 IS 3025 /53 : 2003, R : 2009 , AAS-Flame
10 Lead (as Pb), mg/l, Max <0.00
5 <0.00
5 0.005 APHA, 22nd Edition
AAS-GTA
11
Nitrate (as NO3), mg/l, Max 2.65 2.21 0.50
APHA, 22nd Edition, UV-Spectrphotometric
12 pH value 7.65 7.80 2.5
IS-3025/11:1983, R-1996, Electrometric
13
Phenolic compounds (as C6H5OH), mg/l, Max
<0.002
<0.002 0.002
APHA, 22nd Edition 4-Amino Antipyrine
1
4 Selenium (as Se), mg/l, Max
<0.002
<0.002 0.002
APHA, 22nd Edition AAS-GTA
1
5 Sulphate (as SO4) mg/l, Max 26 10 2.00
APHA, 22nd Edition Turbidity
1
6 Total Dissolved Solids, mg/l, Max 154 124 25.00
IS 3025 /16:1984 R : 2006, Gravimetric
30
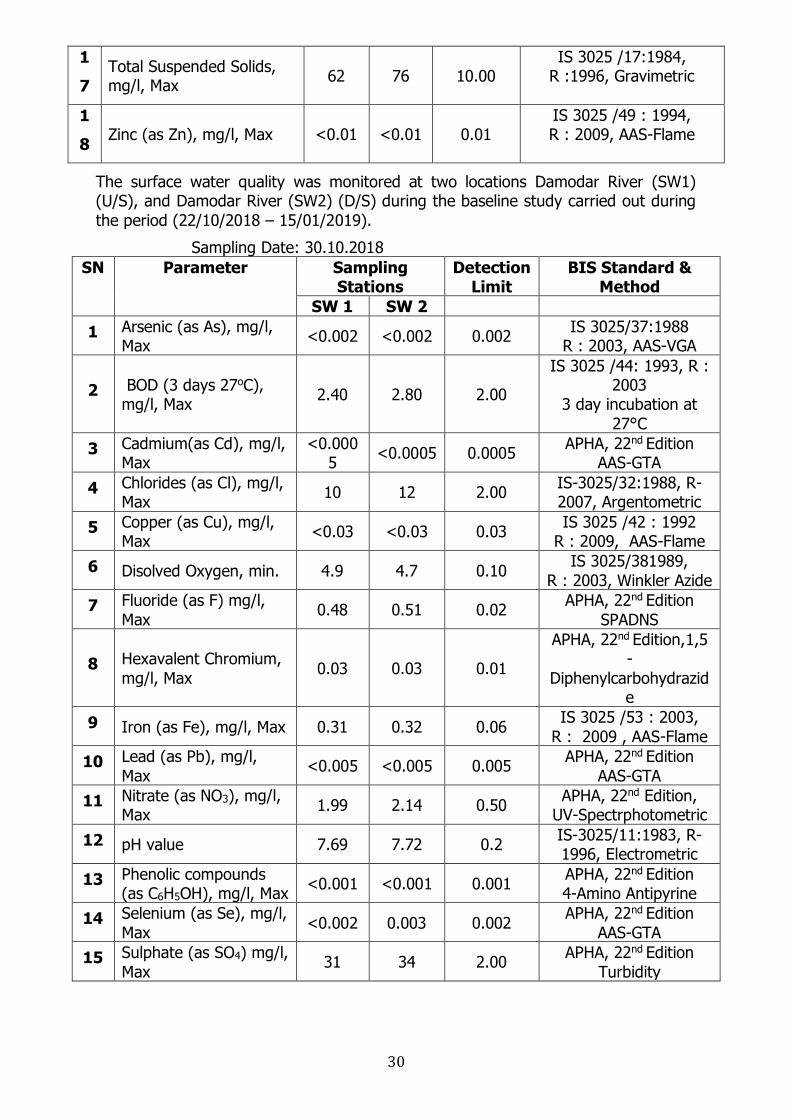
17
Total Suspended Solids, mg/l, Max 62 76 10.00
IS 3025 /17:1984, R :1996, Gravimetric
18 Zinc (as Zn), mg/l, Max <0.01 <0.01 0.01
IS 3025 /49 : 1994, R : 2009, AAS-Flame
The surface water quality was monitored at two locations Damodar River (SW1) (U/S), and Damodar River (SW2) (D/S) during the baseline study carried out during the period (22/10/2018 – 15/01/2019). Sampling Date: 30.10.2018
SN Parameter Sampling Stations
Detection Limit
BIS Standard & Method
SW 1 SW 2 1 Arsenic (as As), mg/l,
Max <0.002 <0.002 0.002 IS 3025/37:1988 R : 2003, AAS-VGA
2 BOD (3 days 27oC), mg/l, Max 2.40 2.80 2.00
IS 3025 /44: 1993, R : 2003
3 day incubation at 27°C
3 Cadmium(as Cd), mg/l, Max
<0.0005 <0.0005 0.0005 APHA, 22nd Edition
AAS-GTA 4 Chlorides (as Cl), mg/l,
Max 10 12 2.00 IS-3025/32:1988, R-2007, Argentometric
5 Copper (as Cu), mg/l, Max <0.03 <0.03 0.03 IS 3025 /42 : 1992
R : 2009, AAS-Flame 6 Disolved Oxygen, min. 4.9 4.7 0.10 IS 3025/381989,
R : 2003, Winkler Azide 7 Fluoride (as F) mg/l,
Max 0.48 0.51 0.02 APHA, 22nd Edition SPADNS
8 Hexavalent Chromium, mg/l, Max 0.03 0.03 0.01
APHA, 22nd Edition,1,5 -
Diphenylcarbohydrazide
9 Iron (as Fe), mg/l, Max 0.31 0.32 0.06 IS 3025 /53 : 2003, R : 2009 , AAS-Flame
10 Lead (as Pb), mg/l, Max <0.005 <0.005 0.005 APHA, 22nd Edition
AAS-GTA 11 Nitrate (as NO3), mg/l,
Max 1.99 2.14 0.50 APHA, 22nd Edition, UV-Spectrphotometric
12 pH value 7.69 7.72 0.2 IS-3025/11:1983, R-1996, Electrometric
13 Phenolic compounds (as C6H5OH), mg/l, Max <0.001 <0.001 0.001 APHA, 22nd Edition
4-Amino Antipyrine 14 Selenium (as Se), mg/l,
Max <0.002 0.003 0.002 APHA, 22nd Edition AAS-GTA
15 Sulphate (as SO4) mg/l, Max 31 34 2.00 APHA, 22nd Edition
Turbidity
31
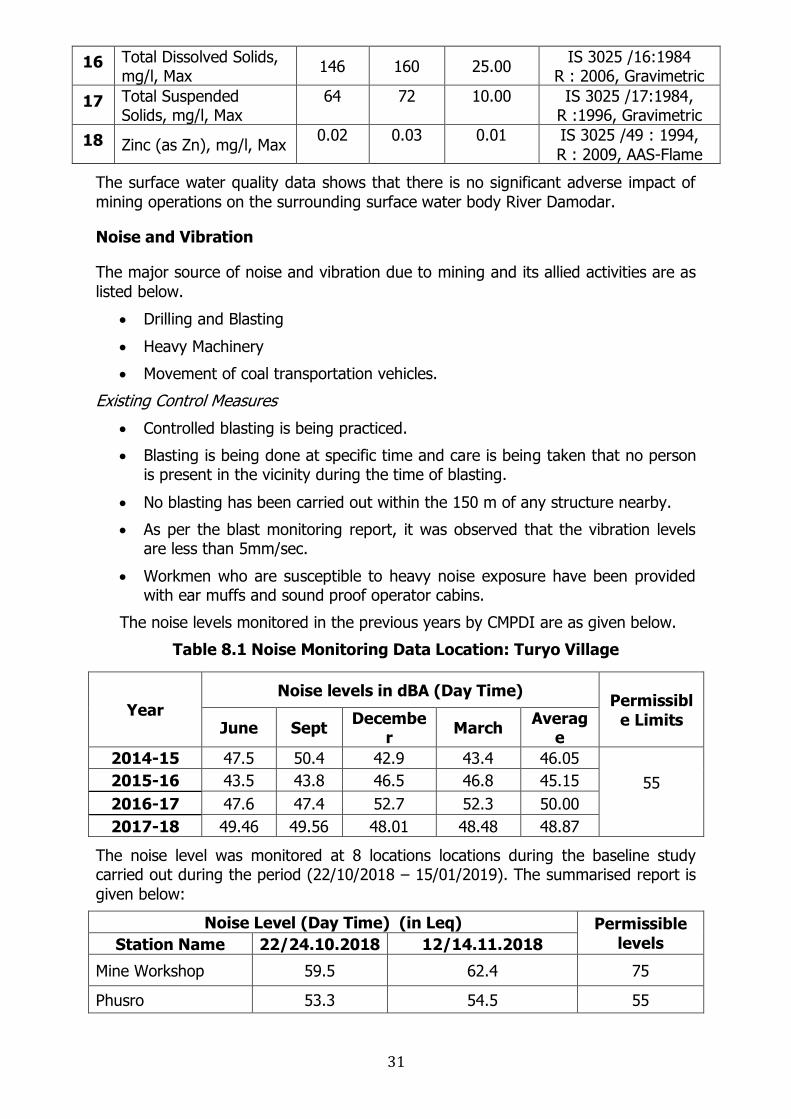
16 Total Dissolved Solids, mg/l, Max 146 160 25.00 IS 3025 /16:1984
R : 2006, Gravimetric 17 Total Suspended
Solids, mg/l, Max 64 72 10.00 IS 3025 /17:1984,
R :1996, Gravimetric 18 Zinc (as Zn), mg/l, Max 0.02 0.03 0.01 IS 3025 /49 : 1994,
R : 2009, AAS-Flame The surface water quality data shows that there is no significant adverse impact of mining operations on the surrounding surface water body River Damodar.
Noise and Vibration
The major source of noise and vibration due to mining and its allied activities are as listed below.
x Drilling and Blasting x Heavy Machinery x Movement of coal transportation vehicles.
Existing Control Measures x Controlled blasting is being practiced. x Blasting is being done at specific time and care is being taken that no person
is present in the vicinity during the time of blasting. x No blasting has been carried out within the 150 m of any structure nearby. x As per the blast monitoring report, it was observed that the vibration levels
are less than 5mm/sec. x Workmen who are susceptible to heavy noise exposure have been provided
with ear muffs and sound proof operator cabins. The noise levels monitored in the previous years by CMPDI are as given below.
Table 8.1 Noise Monitoring Data Location: Turyo Village
Year Noise levels in dBA (Day Time) Permissibl
e Limits June Sept December March Averag
e 2014-15 47.5 50.4 42.9 43.4 46.05
55
2015-16 43.5 43.8 46.5 46.8 45.15 2016-17 47.6 47.4 52.7 52.3 50.00 2017-18 49.46 49.56 48.01 48.48 48.87
The noise level was monitored at 8 locations locations during the baseline study carried out during the period (22/10/2018 – 15/01/2019). The summarised report is given below:
Noise Level (Day Time) (in Leq) Permissible levels Station Name 22/24.10.2018 12/14.11.2018
Mine Workshop 59.5 62.4 75
Phusro 53.3 54.5 55
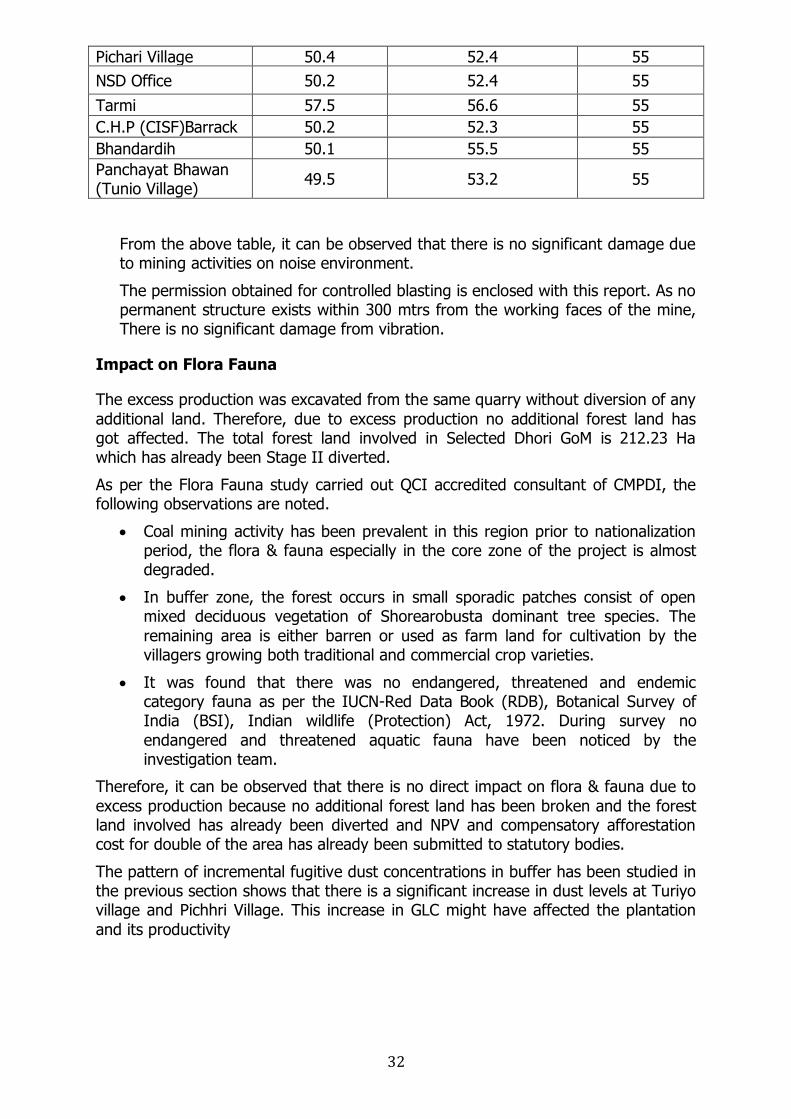
32
Pichari Village 50.4 52.4 55 NSD Office 50.2 52.4 55 Tarmi 57.5 56.6 55 C.H.P (CISF)Barrack 50.2 52.3 55 Bhandardih 50.1 55.5 55 Panchayat Bhawan (Tunio Village) 49.5 53.2 55
From the above table, it can be observed that there is no significant damage due to mining activities on noise environment. The permission obtained for controlled blasting is enclosed with this report. As no permanent structure exists within 300 mtrs from the working faces of the mine, There is no significant damage from vibration.
Impact on Flora Fauna
The excess production was excavated from the same quarry without diversion of any additional land. Therefore, due to excess production no additional forest land has got affected. The total forest land involved in Selected Dhori GoM is 212.23 Ha which has already been Stage II diverted. As per the Flora Fauna study carried out QCI accredited consultant of CMPDI, the following observations are noted.
x Coal mining activity has been prevalent in this region prior to nationalization period, the flora & fauna especially in the core zone of the project is almost degraded.
x In buffer zone, the forest occurs in small sporadic patches consist of open mixed deciduous vegetation of Shorearobusta dominant tree species. The remaining area is either barren or used as farm land for cultivation by the villagers growing both traditional and commercial crop varieties.
x It was found that there was no endangered, threatened and endemic category fauna as per the IUCN-Red Data Book (RDB), Botanical Survey of India (BSI), Indian wildlife (Protection) Act, 1972. During survey no endangered and threatened aquatic fauna have been noticed by the investigation team.
Therefore, it can be observed that there is no direct impact on flora & fauna due to excess production because no additional forest land has been broken and the forest land involved has already been diverted and NPV and compensatory afforestation cost for double of the area has already been submitted to statutory bodies. The pattern of incremental fugitive dust concentrations in buffer has been studied in the previous section shows that there is a significant increase in dust levels at Turiyo village and Pichhri Village. This increase in GLC might have affected the plantation and its productivity
33
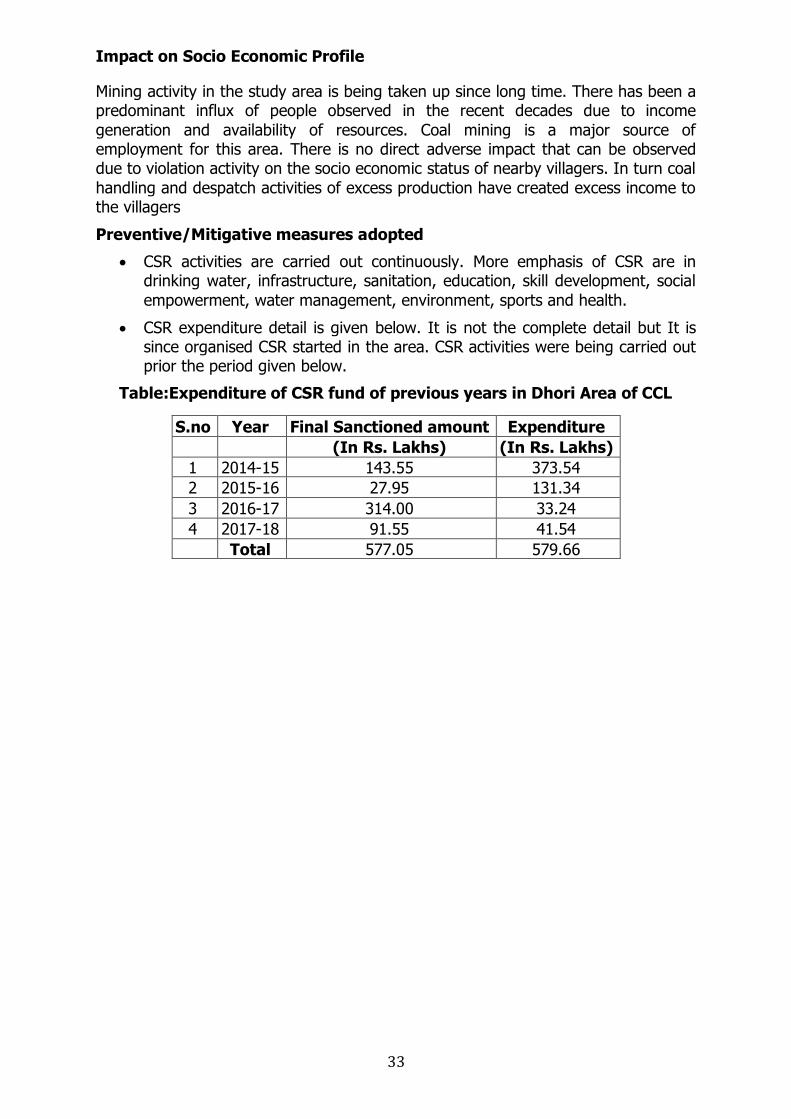
Impact on Socio Economic Profile
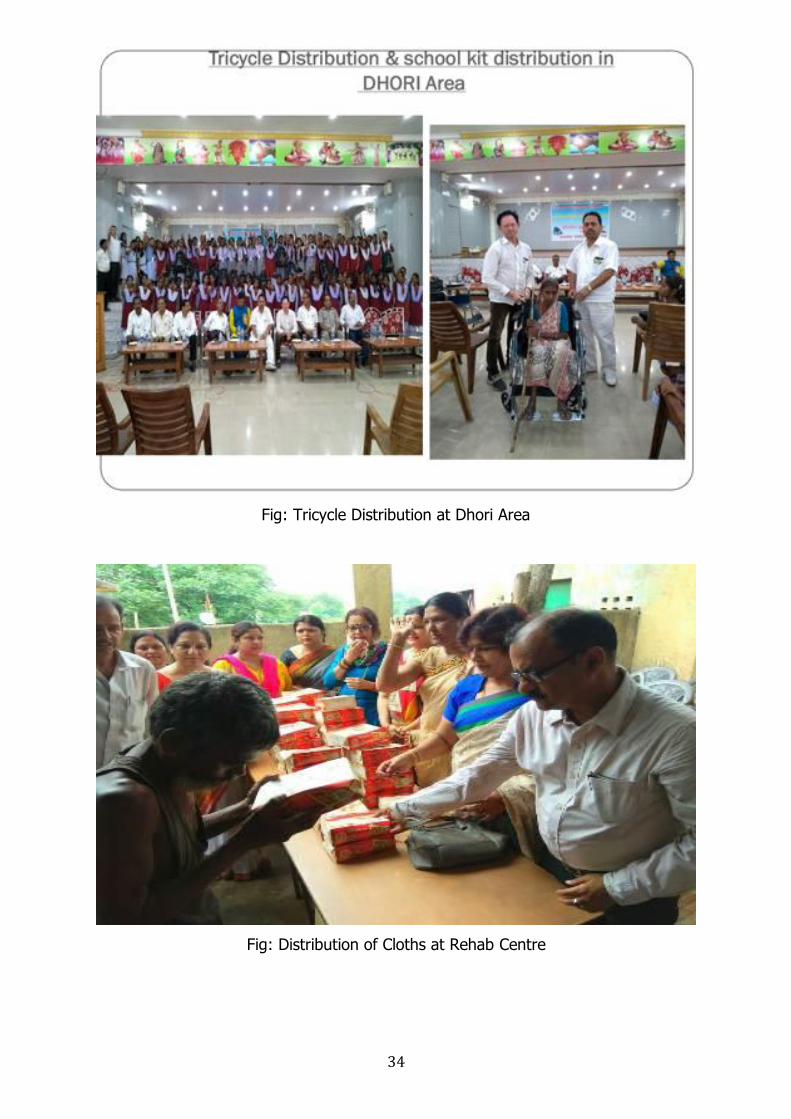
Mining activity in the study area is being taken up since long time. There has been a predominant influx of people observed in the recent decades due to income generation and availability of resources. Coal mining is a major source of employment for this area. There is no direct adverse impact that can be observed due to violation activity on the socio economic status of nearby villagers. In turn coal handling and despatch activities of excess production have created excess income to the villagers Preventive/Mitigative measures adopted
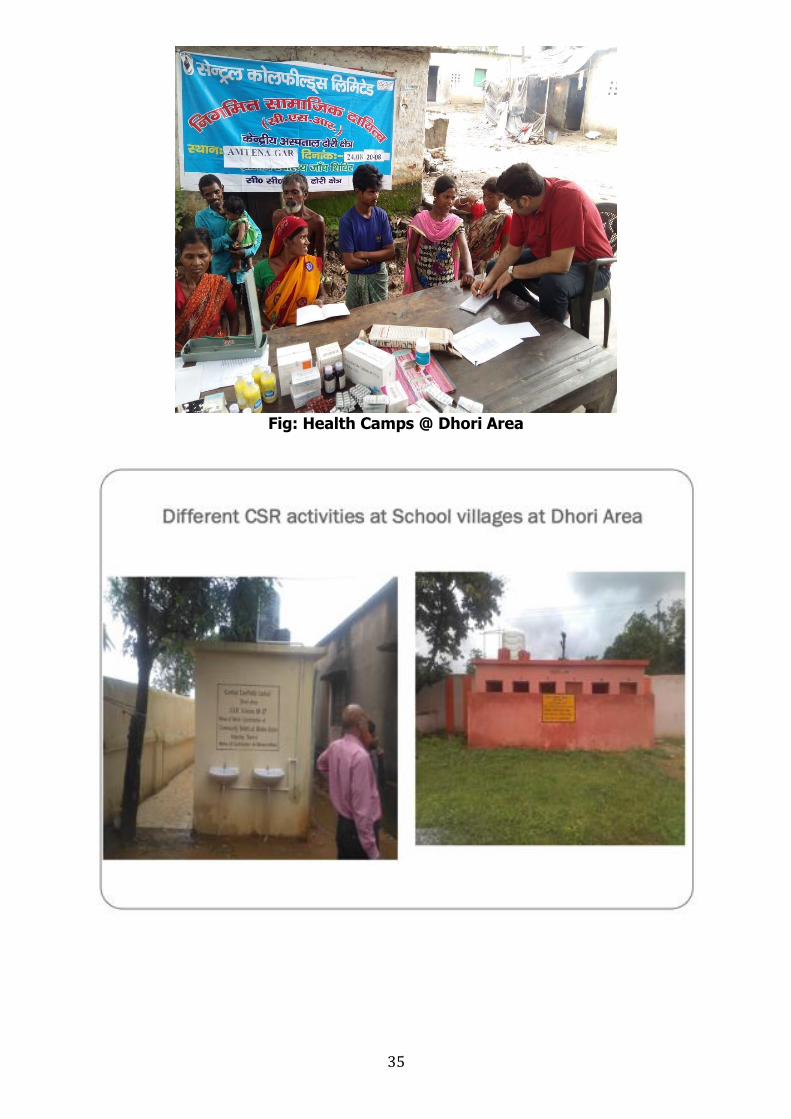
x CSR activities are carried out continuously. More emphasis of CSR are in drinking water, infrastructure, sanitation, education, skill development, social empowerment, water management, environment, sports and health.
x CSR expenditure detail is given below. It is not the complete detail but It is since organised CSR started in the area. CSR activities were being carried out prior the period given below.
Table:Expenditure of CSR fund of previous years in Dhori Area of CCL
S.no Year Final Sanctioned amount Expenditure
(In Rs. Lakhs) (In Rs. Lakhs) 1 2014-15 143.55 373.54 2 2015-16 27.95 131.34 3 2016-17 314.00 33.24 4 2017-18 91.55 41.54
Total 577.05 579.66
34
Fig: Tricycle Distribution at Dhori Area
Fig: Distribution of Cloths at Rehab Centre
35
Fig: Health Camps @ Dhori Area
36
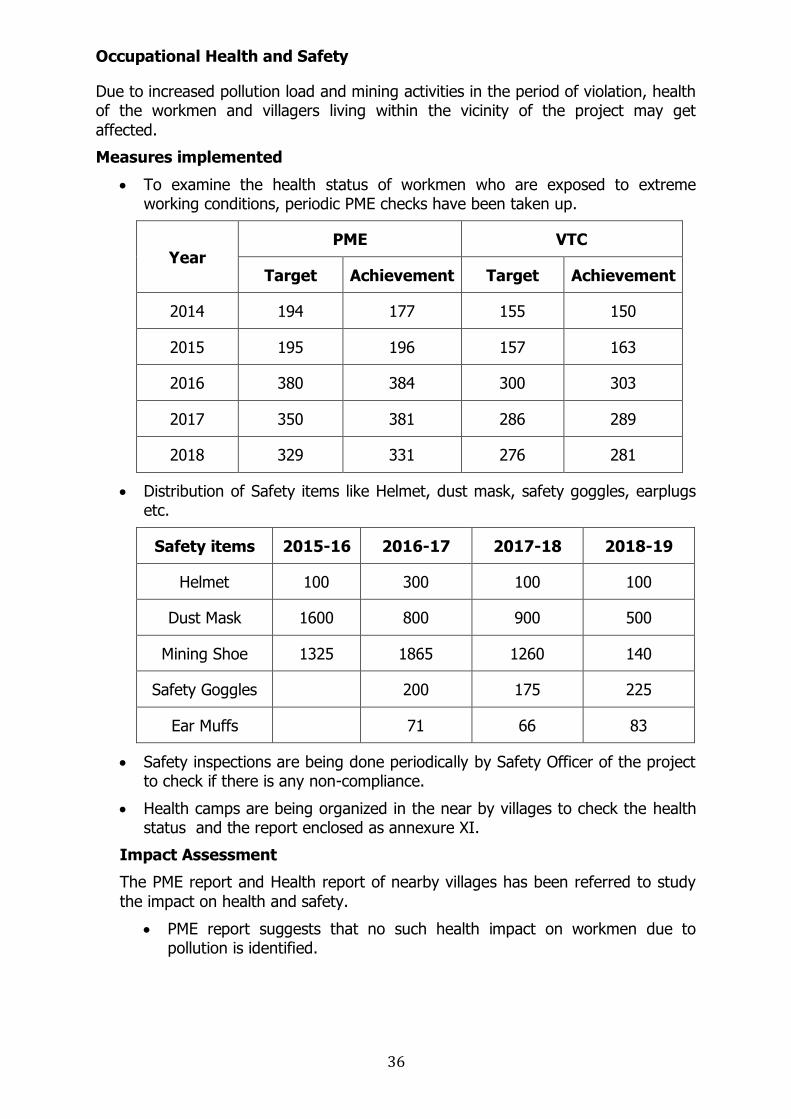
Occupational Health and Safety
Due to increased pollution load and mining activities in the period of violation, health of the workmen and villagers living within the vicinity of the project may get affected. Measures implemented
x To examine the health status of workmen who are exposed to extreme working conditions, periodic PME checks have been taken up.
Year PME VTC
Target Achievement Target Achievement
2014 194 177 155 150
2015 195 196 157 163
2016 380 384 300 303
2017 350 381 286 289
2018 329 331 276 281
x Distribution of Safety items like Helmet, dust mask, safety goggles, earplugs etc.
Safety items 2015-16 2016-17 2017-18 2018-19
Helmet 100 300 100 100
Dust Mask 1600 800 900 500
Mining Shoe 1325 1865 1260 140
Safety Goggles 200 175 225
Ear Muffs 71 66 83
x Safety inspections are being done periodically by Safety Officer of the project to check if there is any non-compliance.
x Health camps are being organized in the near by villages to check the health status and the report enclosed as annexure XI.
Impact Assessment The PME report and Health report of nearby villages has been referred to study the impact on health and safety.
x PME report suggests that no such health impact on workmen due to pollution is identified.

37
x From the last 5 years health status of villagers, the major health defects identified were Bodyaches, Anaemia, Dermatties, chest infection etc. and there was no instance of occupational diseases such as pneumoconiosis.
However, to get a clear picture of the health status of villagers, more health camps will be organized in nearby villages as a part of NCRAP
38
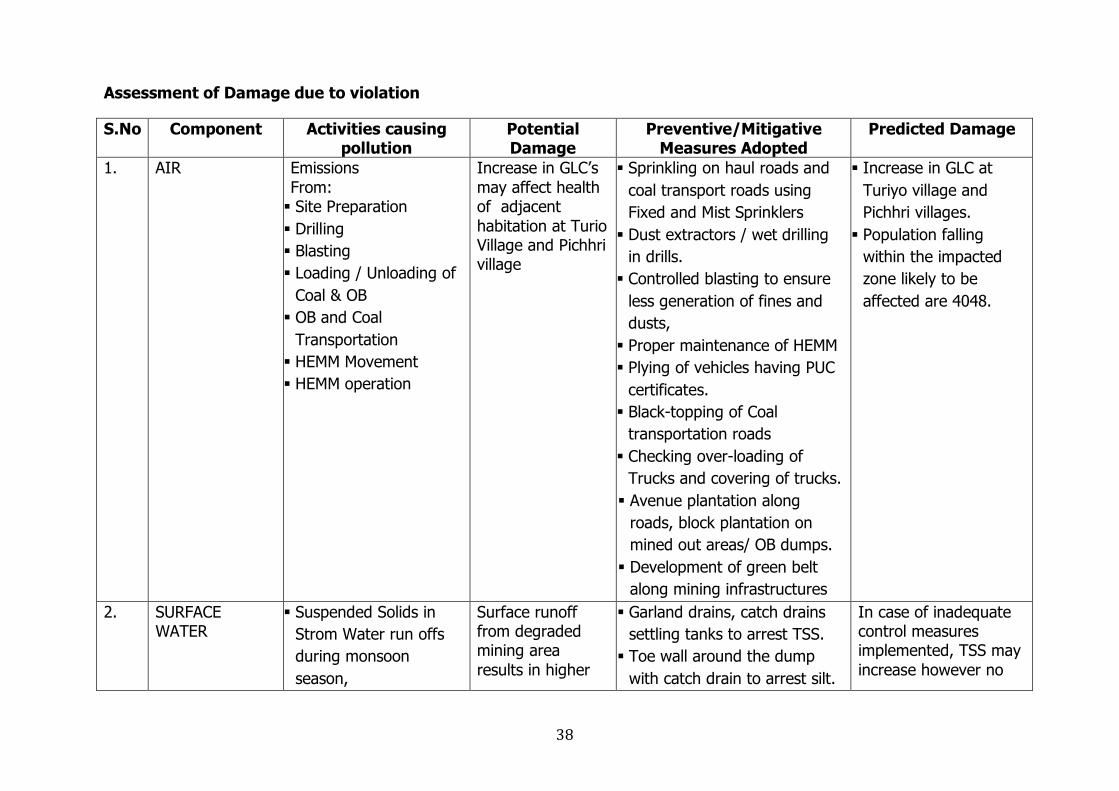
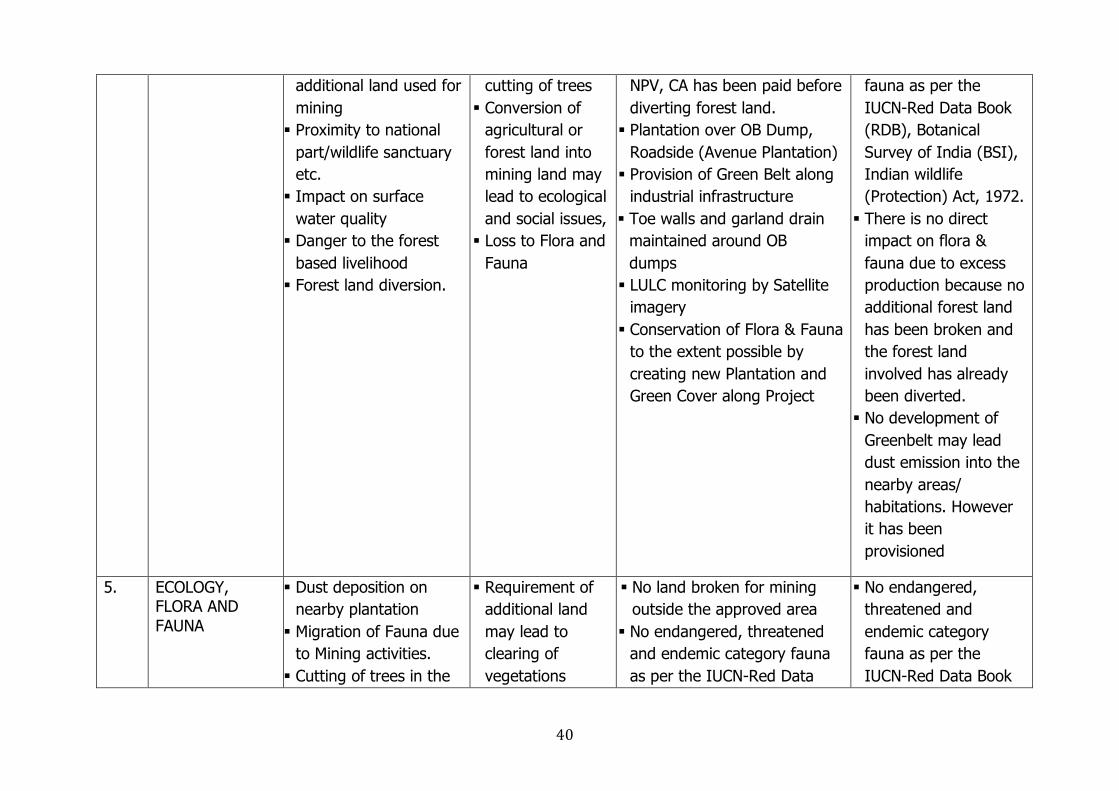
Assessment of Damage due to violation
S.No Component Activities causing pollution
Potential Damage
Preventive/Mitigative Measures Adopted
Predicted Damage
1. AIR Emissions From: � Site Preparation � Drilling � Blasting � Loading / Unloading of
Coal & OB � OB and Coal
Transportation � HEMM Movement � HEMM operation
Increase in GLC’s may affect health of adjacent habitation at Turio Village and Pichhri village
� Sprinkling on haul roads and coal transport roads using Fixed and Mist Sprinklers
� Dust extractors / wet drilling in drills.
� Controlled blasting to ensure less generation of fines and dusts,
� Proper maintenance of HEMM � Plying of vehicles having PUC
certificates. � Black-topping of Coal
transportation roads � Checking over-loading of
Trucks and covering of trucks. � Avenue plantation along
roads, block plantation on mined out areas/ OB dumps.
� Development of green belt along mining infrastructures
� Increase in GLC at Turiyo village and Pichhri villages.
� Population falling within the impacted zone likely to be affected are 4048.
2. SURFACE WATER
� Suspended Solids in Strom Water run offs during monsoon season,
Surface runoff from degraded mining area results in higher
� Garland drains, catch drains settling tanks to arrest TSS.
� Toe wall around the dump with catch drain to arrest silt.
In case of inadequate control measures implemented, TSS may increase however no
39
� Mine discharge TSS load in surface water streams
� Periodic cleaning of Catch drains
� Rain water harvesting through and storm drain
� Checkdam over Tisri Nallah
significant impact was observed on the water quality of the surrounding water bodies.
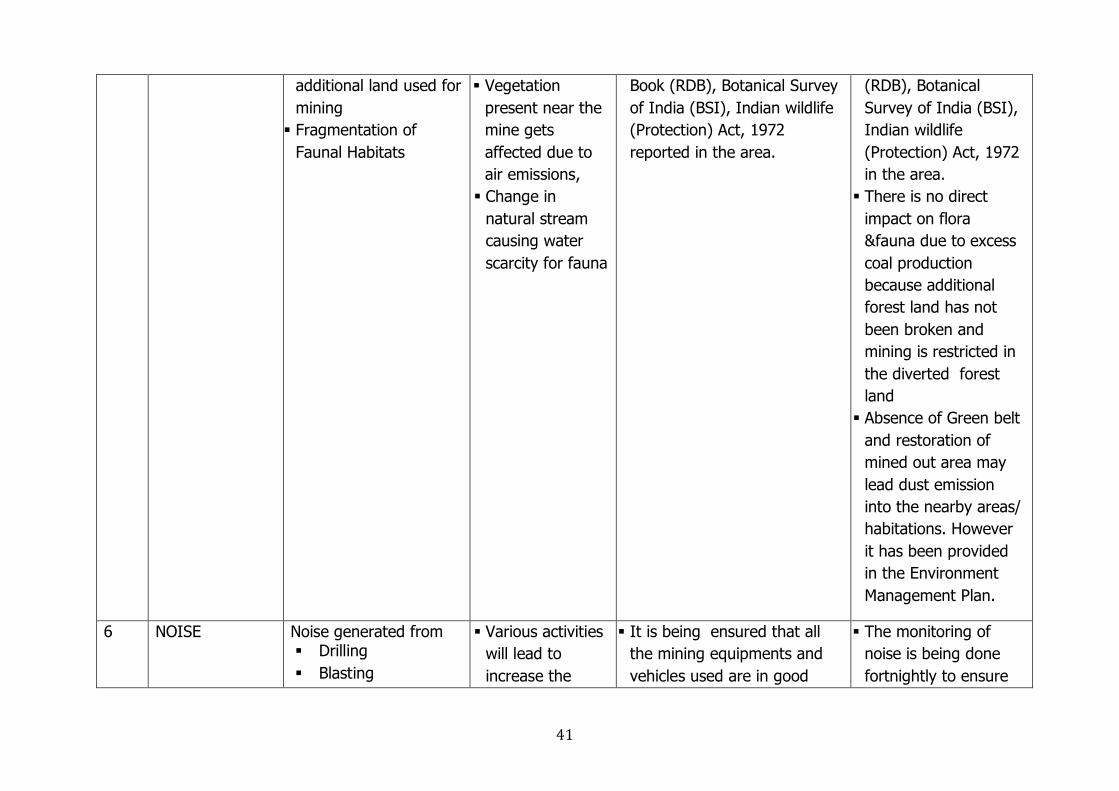
3 GROUND WATER
� Effect on ground water table
� Use of Ground Water for mining activities
� Obstruction of rainwater percolation
� Percolation of contaminated water near the mine
� Waste water from workshop
� Contamination due to Domestic effluent
� Disturbance of Natural Drain
� Discharge of Mine water
� Wash out from Ob dumps/coal stocks
� Depletion of Ground water table may resulting water shortage in nearby villages
� Contamination of Ground Water,
� Discharge of Polluted water to natural streams
� Mine Discharge used for dust suppression/green belt/drinking purpose and domestic purpose
� Provision of ETP in workshops to ensure no discharge outside workshop without treatment
� Toe walls and garland drain maintained around OB dumps
� Plantation cover on OB dumps
� Historical ground water trend in buffer zone shows that there is no significant impact of excess coal production on ground water level.
� Total excess water seepage from Ground is 2.30 Mm3 and Total cost incurred is Rs. 5767501/-
4. LAND USE LAND COVER &FLORA/FAUNA
� Change of Land Use & Land Cover
� Cutting of trees in the
� Requirement of additional land may lead to
� No land broken for mining outside the approved area.
� All Statutory dues such as
� No endangered, threatened and endemic category
40
additional land used for mining
� Proximity to national part/wildlife sanctuary etc.
� Impact on surface water quality
� Danger to the forest based livelihood
� Forest land diversion.
cutting of trees � Conversion of
agricultural or forest land into mining land may lead to ecological and social issues,
� Loss to Flora and Fauna
NPV, CA has been paid before diverting forest land.
� Plantation over OB Dump, Roadside (Avenue Plantation)
� Provision of Green Belt along industrial infrastructure
� Toe walls and garland drain maintained around OB dumps
� LULC monitoring by Satellite imagery
� Conservation of Flora & Fauna to the extent possible by creating new Plantation and Green Cover along Project
fauna as per the IUCN-Red Data Book (RDB), Botanical Survey of India (BSI), Indian wildlife (Protection) Act, 1972.
� There is no direct impact on flora & fauna due to excess production because no additional forest land has been broken and the forest land involved has already been diverted.
� No development of Greenbelt may lead dust emission into the nearby areas/ habitations. However it has been provisioned
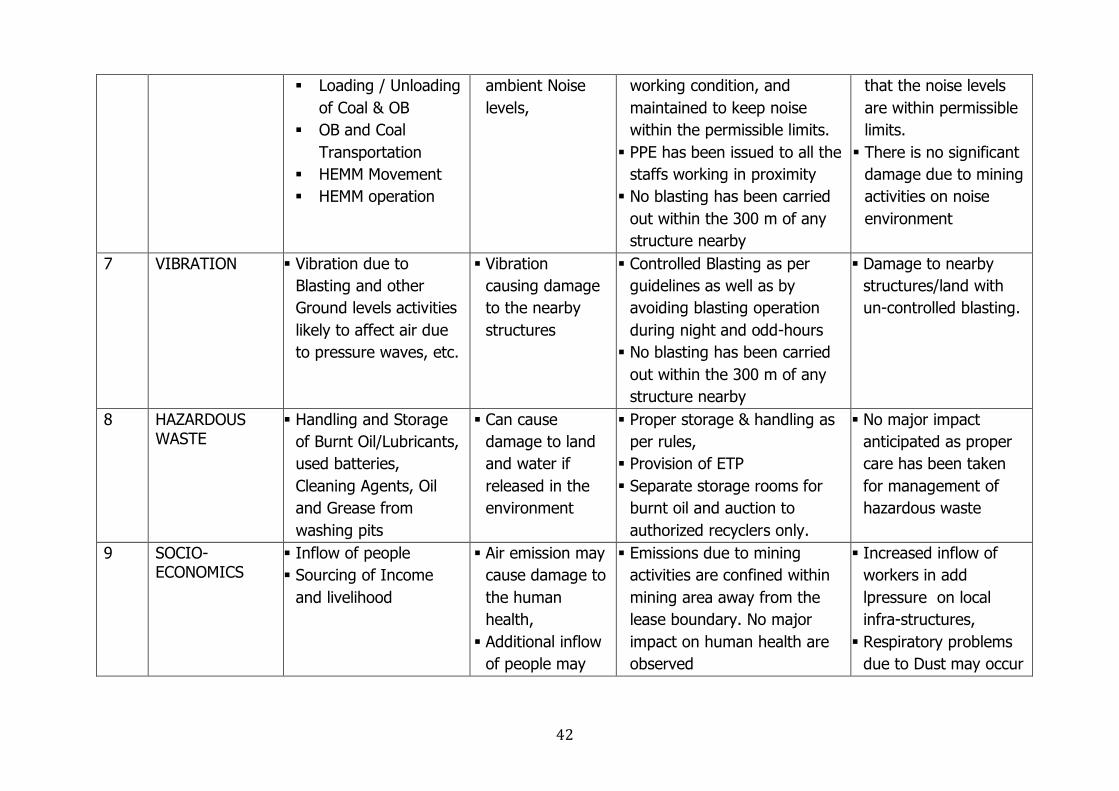
5. ECOLOGY, FLORA AND FAUNA
� Dust deposition on nearby plantation
� Migration of Fauna due to Mining activities.
� Cutting of trees in the
� Requirement of additional land may lead to clearing of vegetations
� No land broken for mining outside the approved area
� No endangered, threatened and endemic category fauna as per the IUCN-Red Data
� No endangered, threatened and endemic category fauna as per the IUCN-Red Data Book
41
additional land used for mining
� Fragmentation of Faunal Habitats
� Vegetation present near the mine gets affected due to air emissions,
� Change in natural stream causing water scarcity for fauna
Book (RDB), Botanical Survey of India (BSI), Indian wildlife (Protection) Act, 1972 reported in the area.
(RDB), Botanical Survey of India (BSI), Indian wildlife (Protection) Act, 1972 in the area.
� There is no direct impact on flora &fauna due to excess coal production because additional forest land has not been broken and mining is restricted in the diverted forest land
� Absence of Green belt and restoration of mined out area may lead dust emission into the nearby areas/ habitations. However it has been provided in the Environment Management Plan.
6 NOISE Noise generated from � Drilling � Blasting
� Various activities will lead to increase the
� It is being ensured that all the mining equipments and vehicles used are in good
� The monitoring of noise is being done fortnightly to ensure
42
� Loading / Unloading of Coal & OB
� OB and Coal Transportation
� HEMM Movement � HEMM operation
ambient Noise levels,
working condition, and maintained to keep noise within the permissible limits.
� PPE has been issued to all the staffs working in proximity
� No blasting has been carried out within the 300 m of any structure nearby
that the noise levels are within permissible limits.
� There is no significant damage due to mining activities on noise environment
7 VIBRATION � Vibration due to Blasting and other Ground levels activities likely to affect air due to pressure waves, etc.
� Vibration causing damage to the nearby structures
� Controlled Blasting as per guidelines as well as by avoiding blasting operation during night and odd-hours
� No blasting has been carried out within the 300 m of any structure nearby
� Damage to nearby structures/land with un-controlled blasting.
8 HAZARDOUS WASTE
� Handling and Storage of Burnt Oil/Lubricants, used batteries, Cleaning Agents, Oil and Grease from washing pits
� Can cause damage to land and water if released in the environment
� Proper storage & handling as per rules,
� Provision of ETP � Separate storage rooms for
burnt oil and auction to authorized recyclers only.
� No major impact anticipated as proper care has been taken for management of hazardous waste
9 SOCIO-ECONOMICS
� Inflow of people � Sourcing of Income
and livelihood
� Air emission may cause damage to the human health,
� Additional inflow of people may
� Emissions due to mining activities are confined within mining area away from the lease boundary. No major impact on human health are observed
� Increased inflow of workers in add lpressure on local infra-structures,
� Respiratory problems due to Dust may occur
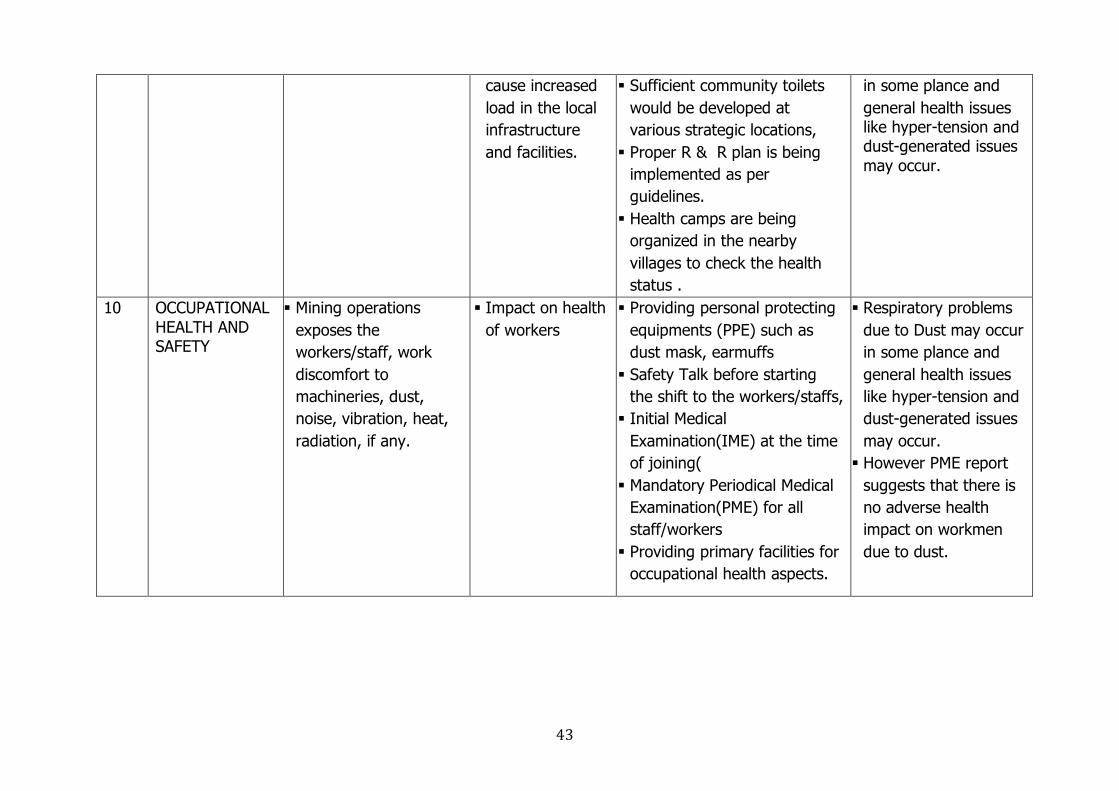
43
cause increased load in the local infrastructure and facilities.
� Sufficient community toilets would be developed at various strategic locations,
� Proper R & R plan is being implemented as per guidelines.
� Health camps are being organized in the nearby villages to check the health status .
in some plance and general health issues like hyper-tension and dust-generated issues may occur.
10 OCCUPATIONAL HEALTH AND SAFETY
� Mining operations exposes the workers/staff, work discomfort to machineries, dust, noise, vibration, heat, radiation, if any.
� Impact on health of workers
� Providing personal protecting equipments (PPE) such as dust mask, earmuffs
� Safety Talk before starting the shift to the workers/staffs,
� Initial Medical Examination(IME) at the time of joining(
� Mandatory Periodical Medical Examination(PME) for all staff/workers
� Providing primary facilities for occupational health aspects.
� Respiratory problems due to Dust may occur in some plance and general health issues like hyper-tension and dust-generated issues may occur.
� However PME report suggests that there is no adverse health impact on workmen due to dust.
44
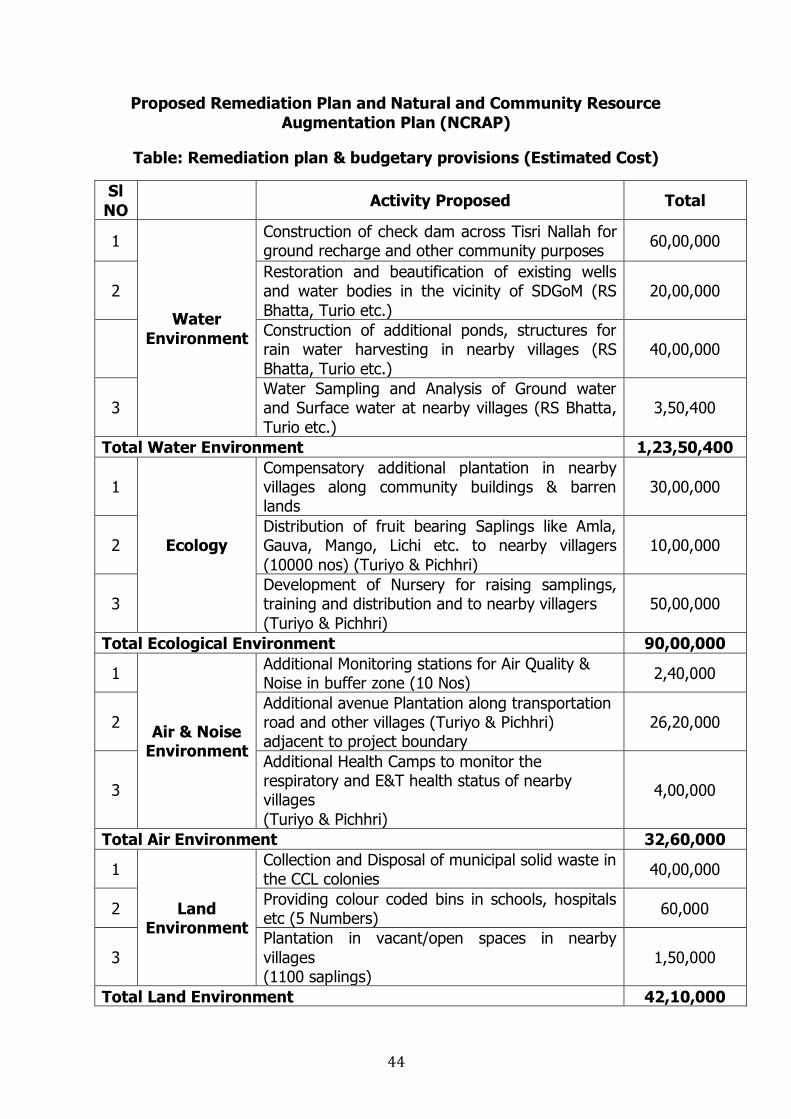
Proposed Remediation Plan and Natural and Community Resource Augmentation Plan (NCRAP)
Table: Remediation plan & budgetary provisions (Estimated Cost)
Sl NO Activity Proposed Total
1
Water Environment
Construction of check dam across Tisri Nallah for ground recharge and other community purposes 60,00,000
2 Restoration and beautification of existing wells and water bodies in the vicinity of SDGoM (RS Bhatta, Turio etc.)
20,00,000
Construction of additional ponds, structures for rain water harvesting in nearby villages (RS Bhatta, Turio etc.)
40,00,000
3 Water Sampling and Analysis of Ground water and Surface water at nearby villages (RS Bhatta, Turio etc.)
3,50,400
Total Water Environment 1,23,50,400
1
Ecology
Compensatory additional plantation in nearby villages along community buildings & barren lands
30,00,000
2 Distribution of fruit bearing Saplings like Amla, Gauva, Mango, Lichi etc. to nearby villagers (10000 nos) (Turiyo & Pichhri)
10,00,000
3 Development of Nursery for raising samplings, training and distribution and to nearby villagers (Turiyo & Pichhri)
50,00,000
Total Ecological Environment 90,00,000
1
Air & Noise Environment
Additional Monitoring stations for Air Quality & Noise in buffer zone (10 Nos) 2,40,000
2 Additional avenue Plantation along transportation road and other villages (Turiyo & Pichhri) adjacent to project boundary
26,20,000
3 Additional Health Camps to monitor the respiratory and E&T health status of nearby villages (Turiyo & Pichhri)
4,00,000
Total Air Environment 32,60,000
1
Land Environment
Collection and Disposal of municipal solid waste in the CCL colonies 40,00,000
2 Providing colour coded bins in schools, hospitals etc (5 Numbers) 60,000
3 Plantation in vacant/open spaces in nearby villages (1100 saplings)
1,50,000
Total Land Environment 42,10,000
45
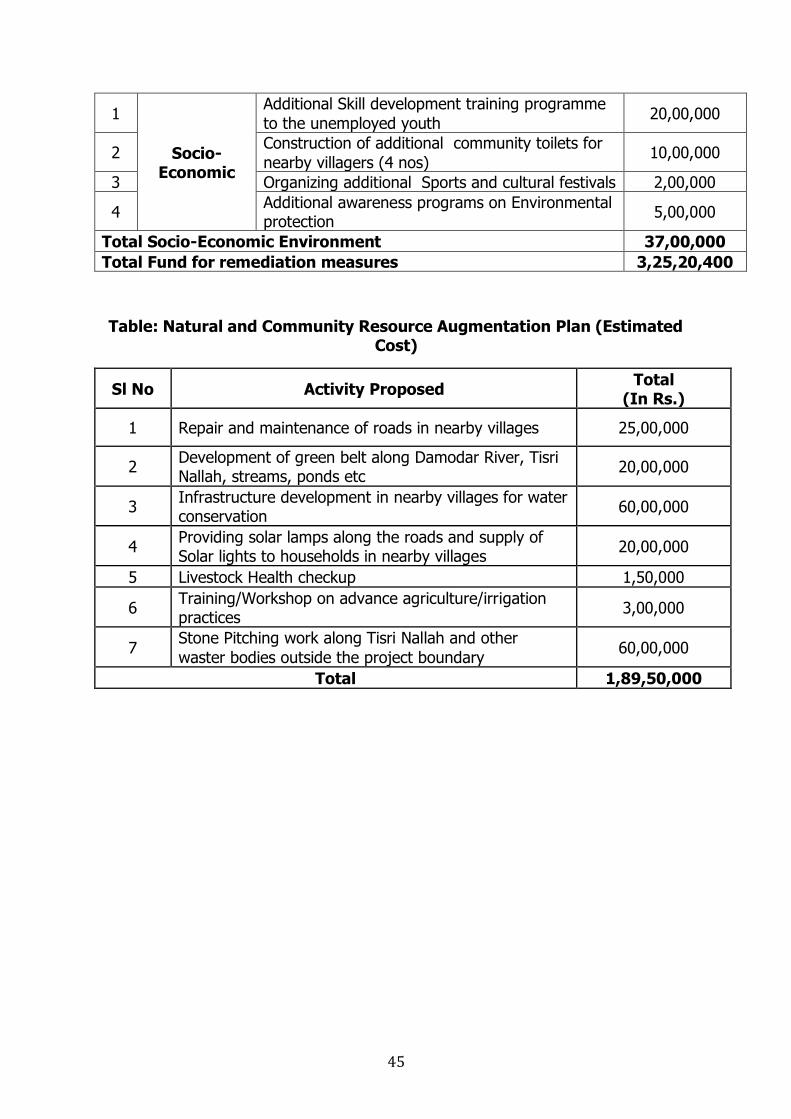
1
Socio-Economic
Additional Skill development training programme to the unemployed youth 20,00,000
2 Construction of additional community toilets for nearby villagers (4 nos) 10,00,000
3 Organizing additional Sports and cultural festivals 2,00,000
4 Additional awareness programs on Environmental protection 5,00,000
Total Socio-Economic Environment 37,00,000 Total Fund for remediation measures 3,25,20,400
Table: Natural and Community Resource Augmentation Plan (Estimated Cost)
Sl No Activity Proposed Total (In Rs.)
1 Repair and maintenance of roads in nearby villages 25,00,000
2 Development of green belt along Damodar River, Tisri Nallah, streams, ponds etc 20,00,000
3 Infrastructure development in nearby villages for water conservation 60,00,000
4 Providing solar lamps along the roads and supply of Solar lights to households in nearby villages 20,00,000
5 Livestock Health checkup 1,50,000
6 Training/Workshop on advance agriculture/irrigation practices 3,00,000
7 Stone Pitching work along Tisri Nallah and other waster bodies outside the project boundary 60,00,000
Total 1,89,50,000
46
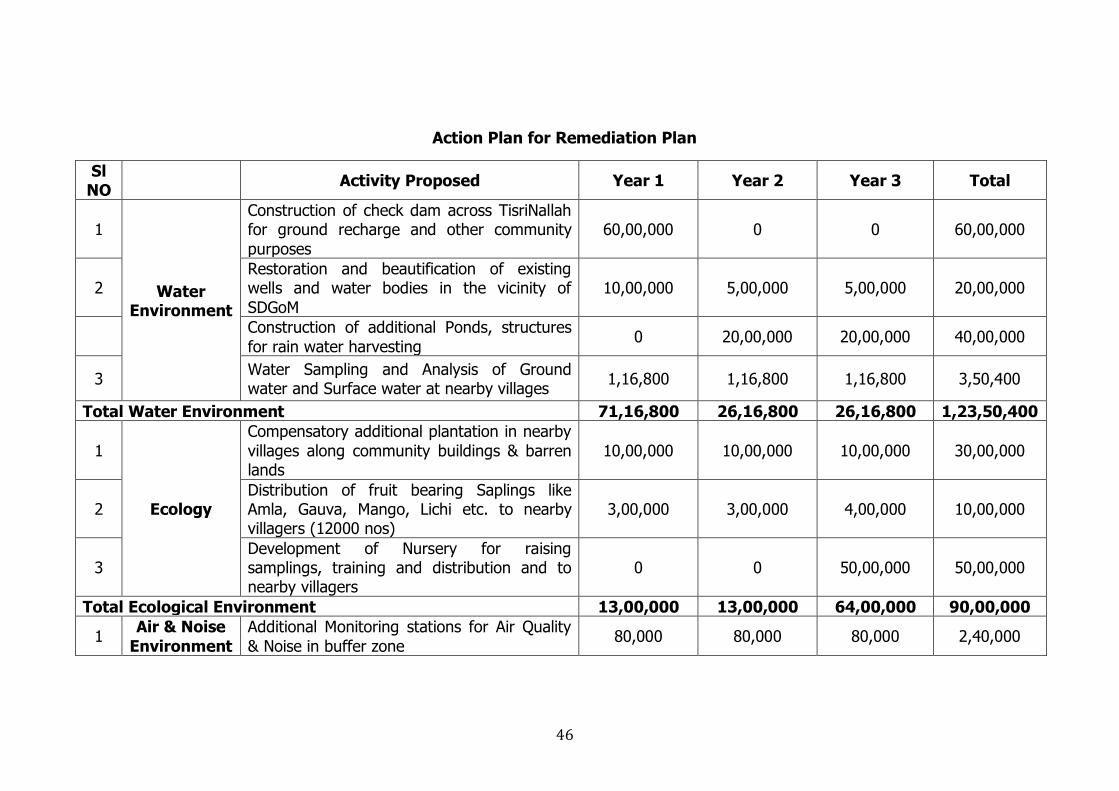
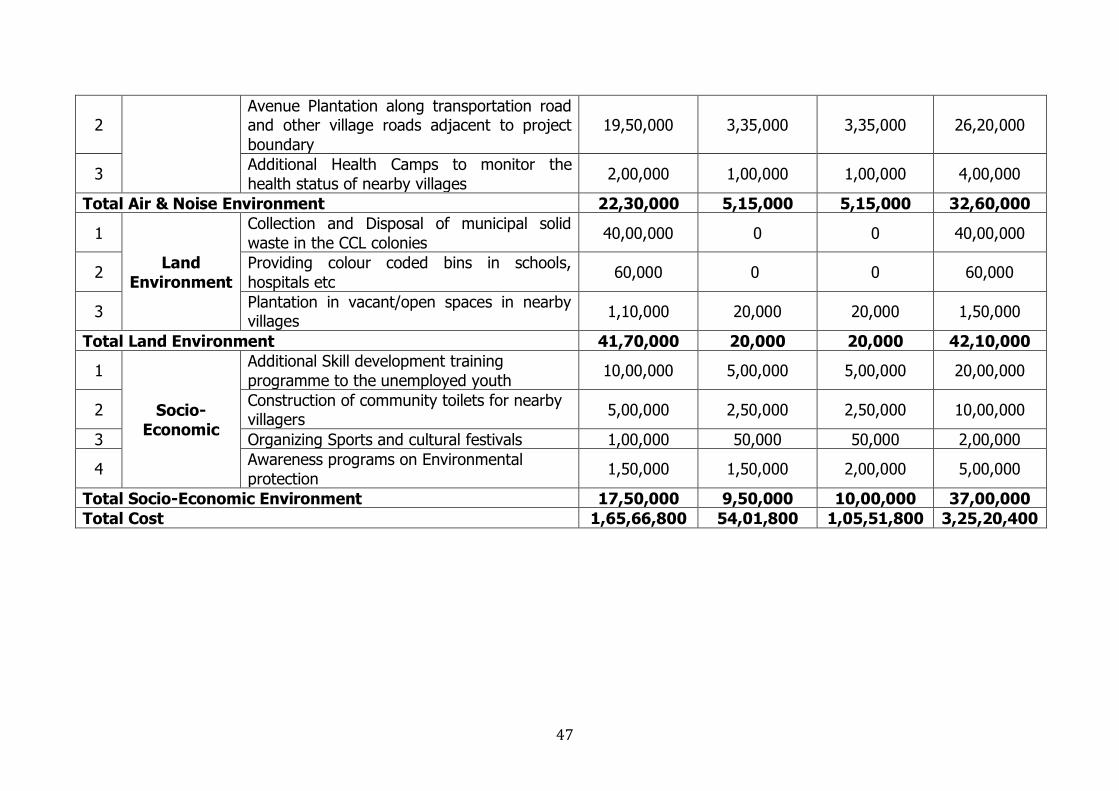
Action Plan for Remediation Plan
Sl NO Activity Proposed Year 1 Year 2 Year 3 Total
1
Water Environment
Construction of check dam across TisriNallah for ground recharge and other community purposes
60,00,000 0 0 60,00,000
2 Restoration and beautification of existing wells and water bodies in the vicinity of SDGoM
10,00,000 5,00,000 5,00,000 20,00,000
Construction of additional Ponds, structures for rain water harvesting 0 20,00,000 20,00,000 40,00,000
3 Water Sampling and Analysis of Ground water and Surface water at nearby villages 1,16,800 1,16,800 1,16,800 3,50,400
Total Water Environment 71,16,800 26,16,800 26,16,800 1,23,50,400
1
Ecology
Compensatory additional plantation in nearby villages along community buildings & barren lands
10,00,000 10,00,000 10,00,000 30,00,000
2 Distribution of fruit bearing Saplings like Amla, Gauva, Mango, Lichi etc. to nearby villagers (12000 nos)
3,00,000 3,00,000 4,00,000 10,00,000
3 Development of Nursery for raising samplings, training and distribution and to nearby villagers
0 0 50,00,000 50,00,000
Total Ecological Environment 13,00,000 13,00,000 64,00,000 90,00,000
1 Air & Noise Environment
Additional Monitoring stations for Air Quality & Noise in buffer zone 80,000 80,000 80,000 2,40,000
47
2 Avenue Plantation along transportation road and other village roads adjacent to project boundary
19,50,000 3,35,000 3,35,000 26,20,000
3 Additional Health Camps to monitor the health status of nearby villages 2,00,000 1,00,000 1,00,000 4,00,000
Total Air & Noise Environment 22,30,000 5,15,000 5,15,000 32,60,000
1
Land Environment
Collection and Disposal of municipal solid waste in the CCL colonies 40,00,000 0 0 40,00,000
2 Providing colour coded bins in schools, hospitals etc 60,000 0 0 60,000
3 Plantation in vacant/open spaces in nearby villages 1,10,000 20,000 20,000 1,50,000
Total Land Environment 41,70,000 20,000 20,000 42,10,000
1
Socio-Economic
Additional Skill development training programme to the unemployed youth 10,00,000 5,00,000 5,00,000 20,00,000
2 Construction of community toilets for nearby villagers 5,00,000 2,50,000 2,50,000 10,00,000
3 Organizing Sports and cultural festivals 1,00,000 50,000 50,000 2,00,000
4 Awareness programs on Environmental protection 1,50,000 1,50,000 2,00,000 5,00,000
Total Socio-Economic Environment 17,50,000 9,50,000 10,00,000 37,00,000 Total Cost 1,65,66,800 54,01,800 1,05,51,800 3,25,20,400
48
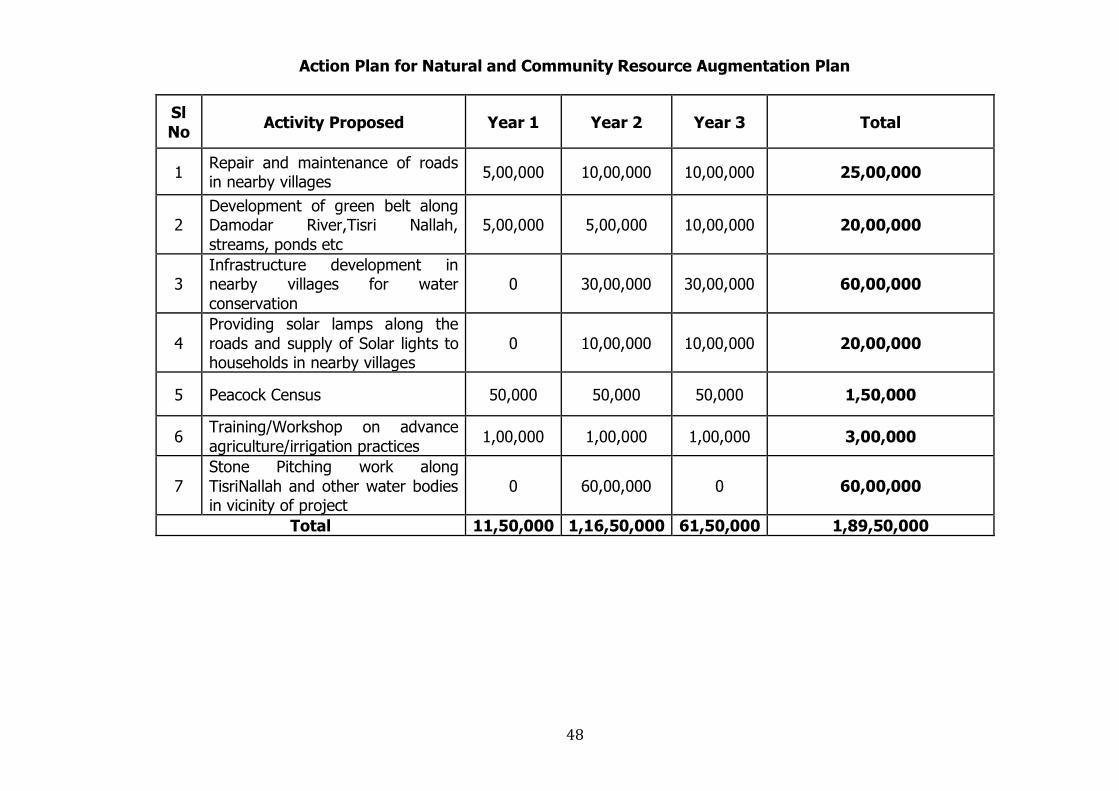
Action Plan for Natural and Community Resource Augmentation Plan
Sl No Activity Proposed Year 1 Year 2 Year 3 Total
1 Repair and maintenance of roads in nearby villages 5,00,000 10,00,000 10,00,000 25,00,000
2 Development of green belt along Damodar River,Tisri Nallah, streams, ponds etc
5,00,000 5,00,000 10,00,000 20,00,000
3 Infrastructure development in nearby villages for water conservation
0 30,00,000 30,00,000 60,00,000
4 Providing solar lamps along the roads and supply of Solar lights to households in nearby villages
0 10,00,000 10,00,000 20,00,000
5 Peacock Census 50,000 50,000 50,000 1,50,000
6 Training/Workshop on advance agriculture/irrigation practices 1,00,000 1,00,000 1,00,000 3,00,000
7 Stone Pitching work along TisriNallah and other water bodies in vicinity of project
0 60,00,000 0 60,00,000
Total 11,50,000 1,16,50,000 61,50,000 1,89,50,000
49
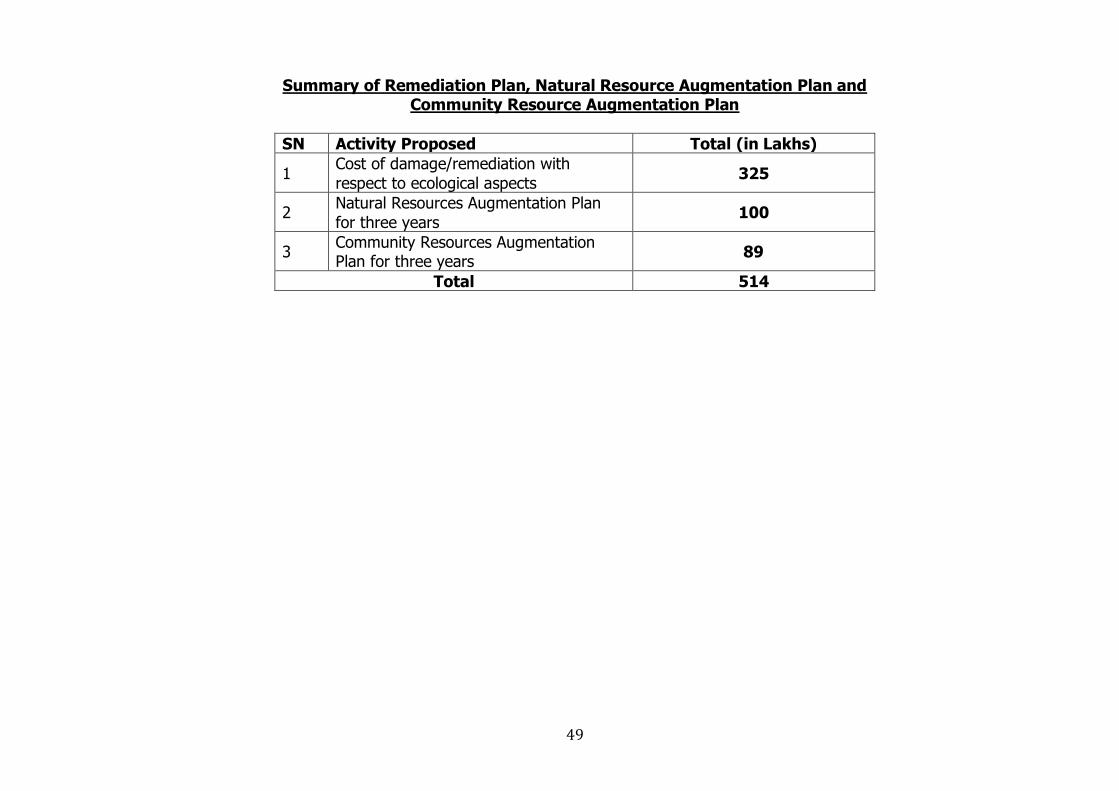
Summary of Remediation Plan, Natural Resource Augmentation Plan and Community Resource Augmentation Plan
SN Activity Proposed Total (in Lakhs)
1 Cost of damage/remediation with respect to ecological aspects 325
2 Natural Resources Augmentation Plan for three years 100
3 Community Resources Augmentation Plan for three years 89
Total 514

Annexure1
MineClosurePlan
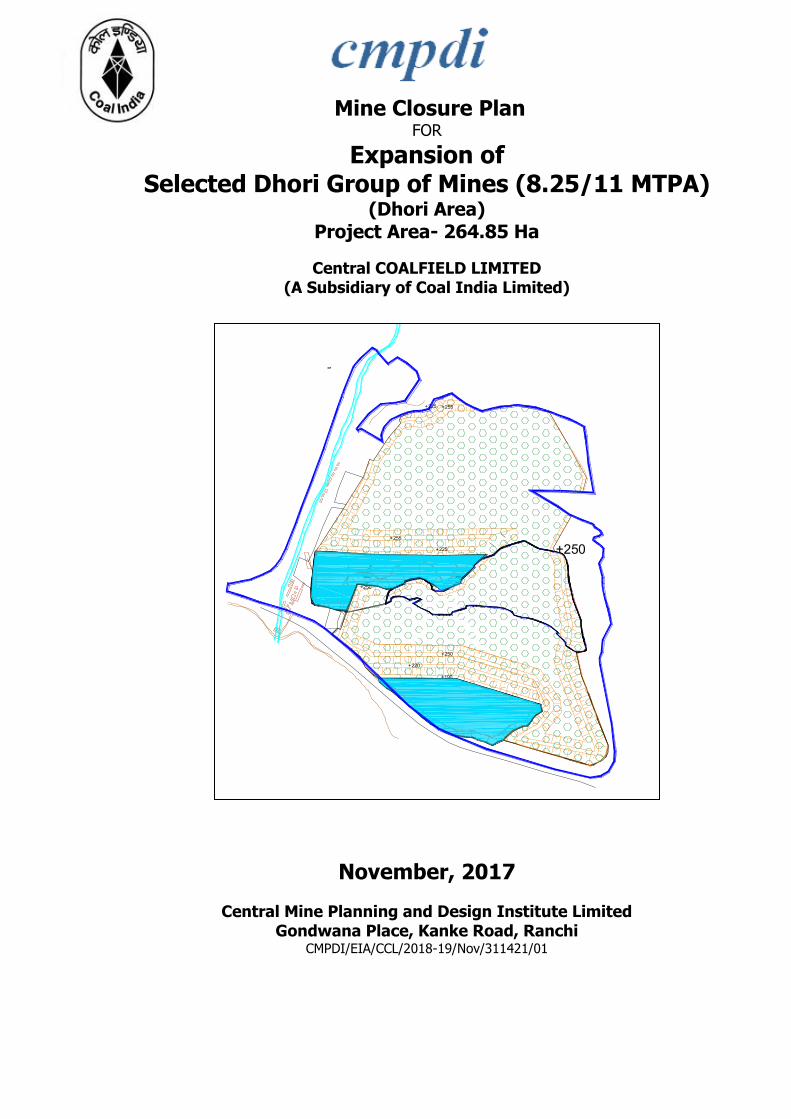
Mine Closure Plan FOR
Expansion of Selected Dhori Group of Mines (8.25/11 MTPA)
(Dhori Area) Project Area- 264.85 Ha
Central COALFIELD LIMITED (A Subsidiary of Coal India Limited)
November, 2017
Central Mine Planning and Design Institute Limited Gondwana Place, Kanke Road, Ranchi
CMPDI/EIA/CCL/2018-19/Nov/311421/01
NF
+225 +255
+225
+255
+250
+250
+220
+190
+250
Mine Closure Plan of Selected Dhori Group of Mines
1
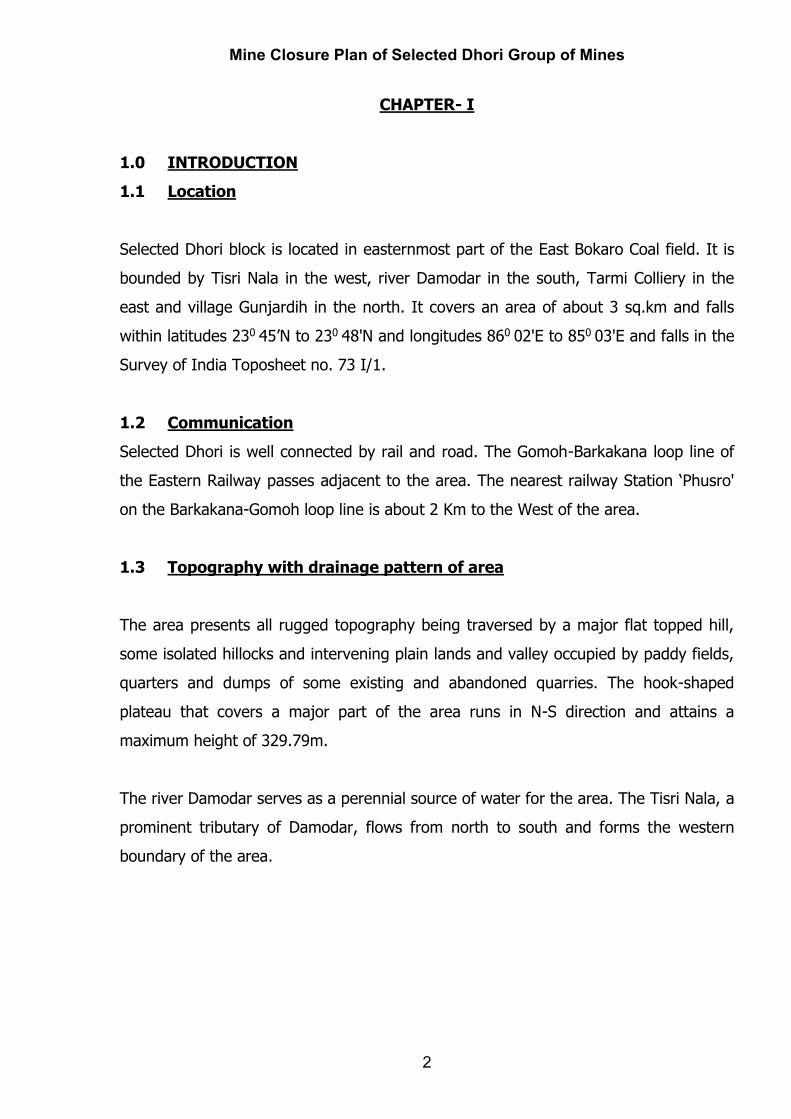
1. BASIC INFORMATION
i) Name of the Project : Selected Dhori Group of Mines ii) Total Mineable Reserves : 58.98 Million Te iii) Balance Mineable Reserves : 12.32 Million Te (as on April 2017) iv) Total Balance Overburden : 3.04 Mcum v) Balance Stripping Ratio : 0.25 cum/te vi) Target Capacity of Mine : 8.25 MTY vii) Balance Life : 2 years viii) Coalfield : East Bokaro Coalfield ix) Location : Bokaro District, Jharkhand x) Average Grade of Coal : ‘F’ xi) End Use of Coal : BTPS Units.
2. Land use Plan: (Area in Ha)
Sl. No Land Use
Area (in Ha)
Forest Non-Forest Total
1 Quarry Area 183.35 28.24 211.59
2 Infrastructure like W/S, Haul Road, Colony, etc 23.5 0 23.5
3 Safety Zone/ Green Belt and Tisri Nala 5.38 24.38 29.76
Total 212.23 52.62 264.85
Mine Closure Plan of Selected Dhori Group of Mines
2
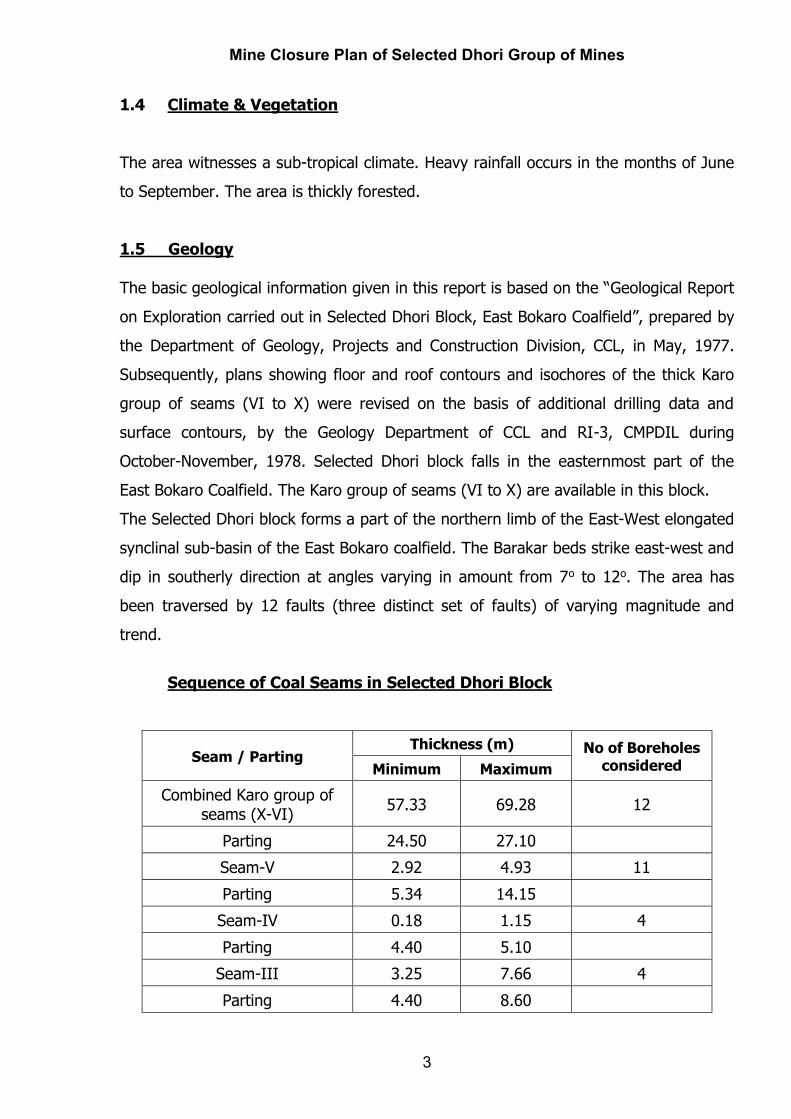
CHAPTER- I 1.0 INTRODUCTION 1.1 Location Selected Dhori block is located in easternmost part of the East Bokaro Coal field. It is bounded by Tisri Nala in the west, river Damodar in the south, Tarmi Colliery in the east and village Gunjardih in the north. It covers an area of about 3 sq.km and falls within latitudes 230 45’N to 230 48'N and longitudes 860 02'E to 850 03'E and falls in the Survey of India Toposheet no. 73 I/1.
1.2 Communication Selected Dhori is well connected by rail and road. The Gomoh-Barkakana loop line of the Eastern Railway passes adjacent to the area. The nearest railway Station ‘Phusro' on the Barkakana-Gomoh loop line is about 2 Km to the West of the area. 1.3 Topography with drainage pattern of area The area presents all rugged topography being traversed by a major flat topped hill, some isolated hillocks and intervening plain lands and valley occupied by paddy fields, quarters and dumps of some existing and abandoned quarries. The hook-shaped plateau that covers a major part of the area runs in N-S direction and attains a maximum height of 329.79m. The river Damodar serves as a perennial source of water for the area. The Tisri Nala, a prominent tributary of Damodar, flows from north to south and forms the western boundary of the area.
Mine Closure Plan of Selected Dhori Group of Mines
3
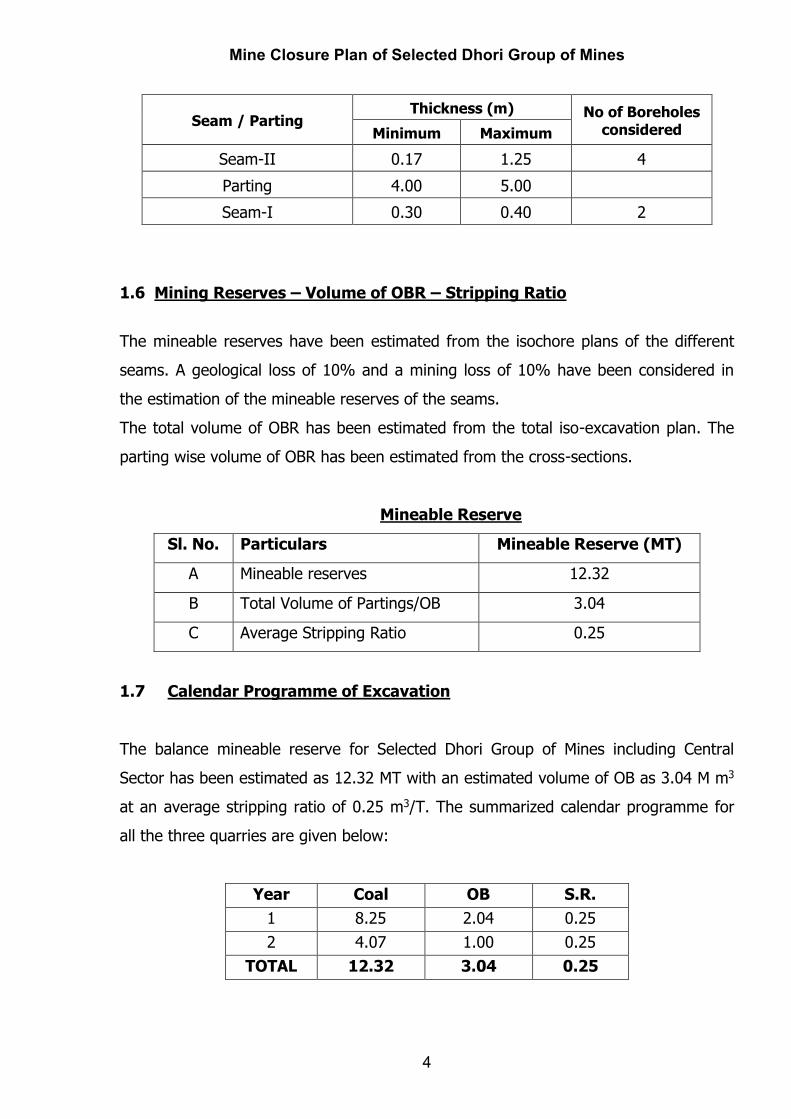
1.4 Climate & Vegetation The area witnesses a sub-tropical climate. Heavy rainfall occurs in the months of June to September. The area is thickly forested. 1.5 Geology The basic geological information given in this report is based on the “Geological Report on Exploration carried out in Selected Dhori Block, East Bokaro Coalfield”, prepared by the Department of Geology, Projects and Construction Division, CCL, in May, 1977. Subsequently, plans showing floor and roof contours and isochores of the thick Karo group of seams (VI to X) were revised on the basis of additional drilling data and surface contours, by the Geology Department of CCL and RI-3, CMPDIL during October-November, 1978. Selected Dhori block falls in the easternmost part of the East Bokaro Coalfield. The Karo group of seams (VI to X) are available in this block. The Selected Dhori block forms a part of the northern limb of the East-West elongated synclinal sub-basin of the East Bokaro coalfield. The Barakar beds strike east-west and dip in southerly direction at angles varying in amount from 7o to 12o. The area has been traversed by 12 faults (three distinct set of faults) of varying magnitude and trend. Sequence of Coal Seams in Selected Dhori Block
Seam / Parting Thickness (m) No of Boreholes
considered Minimum Maximum Combined Karo group of
seams (X-VI) 57.33 69.28 12
Parting 24.50 27.10 Seam-V 2.92 4.93 11 Parting 5.34 14.15
Seam-IV 0.18 1.15 4 Parting 4.40 5.10
Seam-III 3.25 7.66 4 Parting 4.40 8.60
Mine Closure Plan of Selected Dhori Group of Mines
4
Seam / Parting Thickness (m) No of Boreholes
considered Minimum Maximum Seam-II 0.17 1.25 4 Parting 4.00 5.00 Seam-I 0.30 0.40 2
1.6 Mining Reserves – Volume of OBR – Stripping Ratio
The mineable reserves have been estimated from the isochore plans of the different seams. A geological loss of 10% and a mining loss of 10% have been considered in the estimation of the mineable reserves of the seams. The total volume of OBR has been estimated from the total iso-excavation plan. The parting wise volume of OBR has been estimated from the cross-sections.
Mineable Reserve
Sl. No. Particulars Mineable Reserve (MT)
A Mineable reserves 12.32
B Total Volume of Partings/OB 3.04
C Average Stripping Ratio 0.25
1.7 Calendar Programme of Excavation
The balance mineable reserve for Selected Dhori Group of Mines including Central Sector has been estimated as 12.32 MT with an estimated volume of OB as 3.04 M m3 at an average stripping ratio of 0.25 m3/T. The summarized calendar programme for all the three quarries are given below:
Year Coal OB S.R. 1 8.25 2.04 0.25 2 4.07 1.00 0.25
TOTAL 12.32 3.04 0.25
Mine Closure Plan of Selected Dhori Group of Mines
5
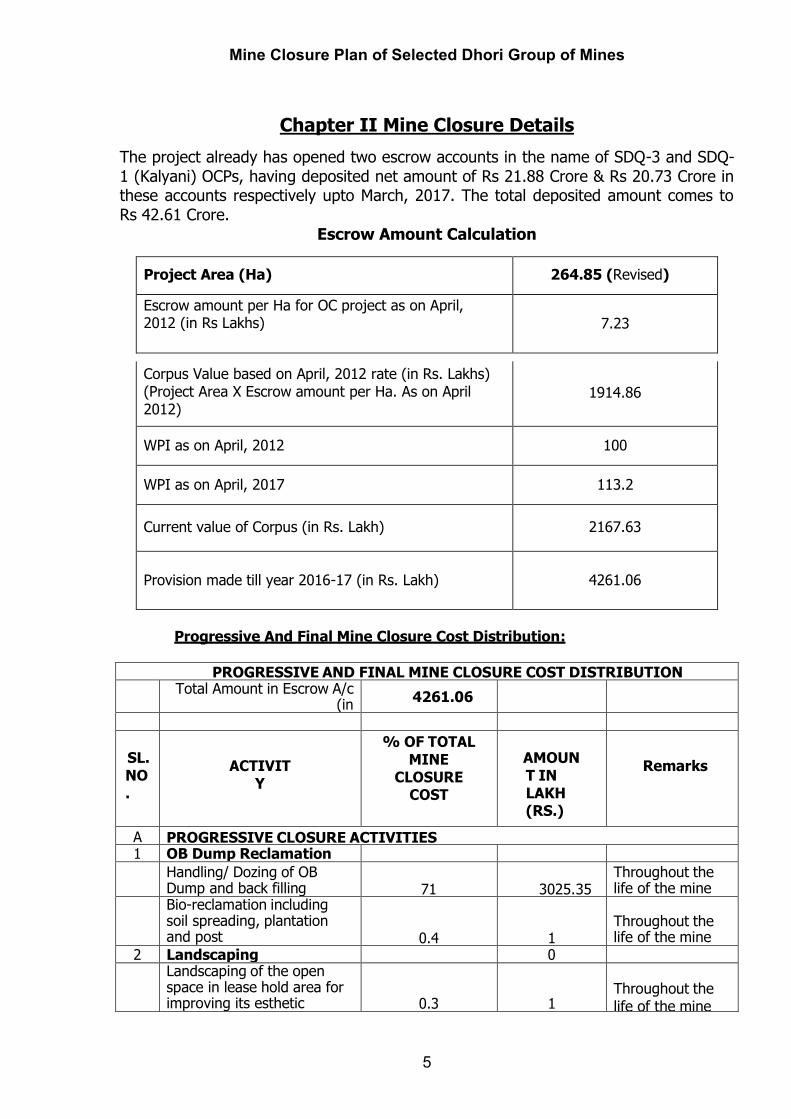
Chapter II Mine Closure Details The project already has opened two escrow accounts in the name of SDQ-3 and SDQ-1 (Kalyani) OCPs, having deposited net amount of Rs 21.88 Crore & Rs 20.73 Crore in these accounts respectively upto March, 2017. The total deposited amount comes to Rs 42.61 Crore.
Escrow Amount Calculation Project Area (Ha)
264.85 (Revised)
Escrow amount per Ha for OC project as on April, 2012 (in Rs Lakhs)
7.23
Corpus Value based on April, 2012 rate (in Rs. Lakhs) (Project Area X Escrow amount per Ha. As on April 2012)
1914.86
WPI as on April, 2012
100
WPI as on April, 2017
113.2
Current value of Corpus (in Rs. Lakh)
2167.63
Provision made till year 2016-17 (in Rs. Lakh)
4261.06
Progressive And Final Mine Closure Cost Distribution:
PROGRESSIVE AND FINAL MINE CLOSURE COST DISTRIBUTION
Total Amount in Escrow A/c (in
Rs Lakhs)
4261.06
SL. NO.
ACTIVITY
% OF TOTAL MINE
CLOSURE COST
AMOUNT IN LAKH (RS.)
Remarks
A PROGRESSIVE CLOSURE ACTIVITIES 1 OB Dump Reclamation
Handling/ Dozing of OB Dump and back filling
71
3025.35
Throughout the life of the mine
Bio-reclamation including soil spreading, plantation and post care
0.4
17.04
Throughout the life of the mine
2 Landscaping 0.00
Landscaping of the open
space in lease hold area for improving its esthetic
0.3
12.78
Throughout the life of the mine
Mine Closure Plan of Selected Dhori Group of Mines
6
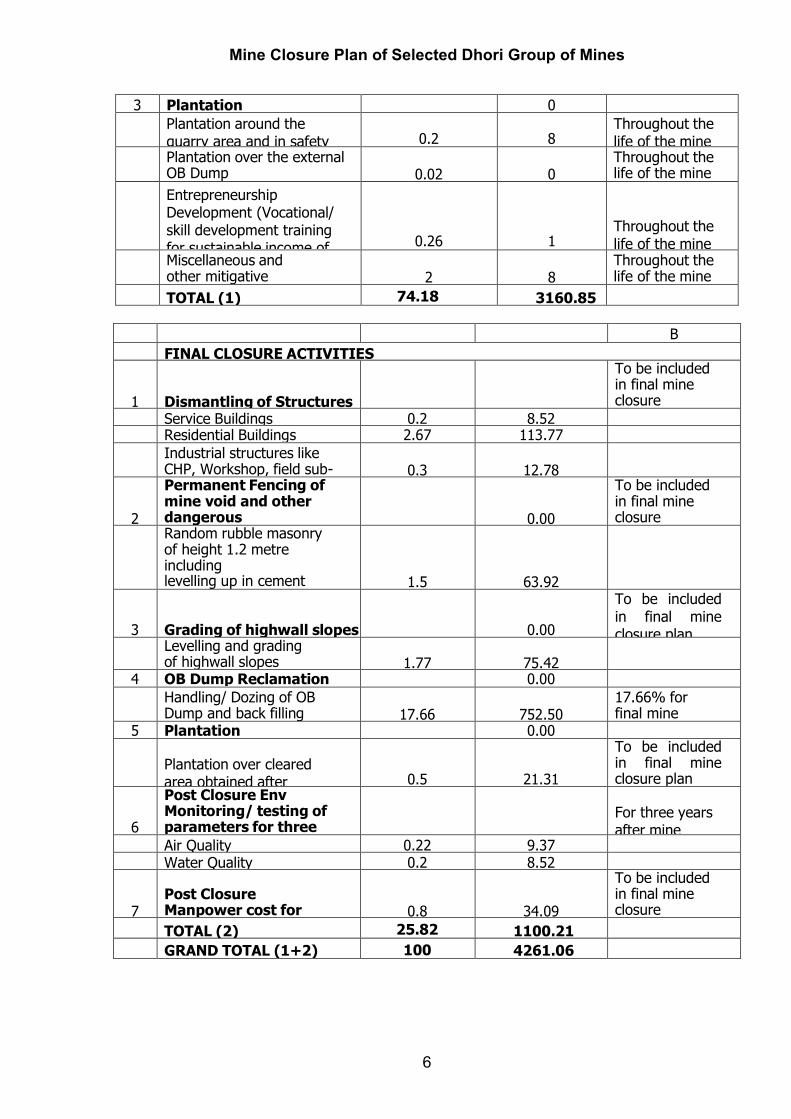
3 Plantation 0.00
Plantation around the
quarry area and in safety zone
0.2
8.52
Throughout the life of the mine
Plantation over the external OB Dump
0.02
0.85
Throughout the life of the mine
Entrepreneurship Development (Vocational/ skill development training for sustainable income of affected people
0.26
11.08
Throughout the life of the mine
Miscellaneous and other mitigative measures
2
85.22
Throughout the life of the mine
TOTAL (1) 74.18 3160.85
B FINAL CLOSURE ACTIVITIES
1
Dismantling of Structures
To be included in final mine closure plan Service Buildings 0.2 8.52
Residential Buildings 2.67 113.77 Industrial structures like
CHP, Workshop, field sub-station etc.
0.3
12.78
2
Permanent Fencing of mine void and other dangerous area
0.00
To be included in final mine closure plan Random rubble masonry
of height 1.2 metre including levelling up in cement concrete 1:6:12 in mud mortar
1.5
63.92
3
Grading of highwall slopes
0.00
To be included in final mine closure plan
Levelling and grading of highwall slopes
1.77
75.42
4 OB Dump Reclamation 0.00 Handling/ Dozing of OB
Dump and back filling
17.66
752.50 17.66% for final mine closure 5 Plantation 0.00
Plantation over cleared area obtained after dismantling
0.5
21.31
To be included in final mine closure plan
6
Post Closure Env Monitoring/ testing of parameters for three years
For three years after mine closure Air Quality 0.22 9.37
Water Quality 0.2 8.52
7
Post Closure Manpower cost for supervision
0.8
34.09
To be included in final mine closure plan TOTAL (2) 25.82 1100.21
GRAND TOTAL (1+2) 100 4261.06
Mine Closure Plan of Selected Dhori Group of Mines
7
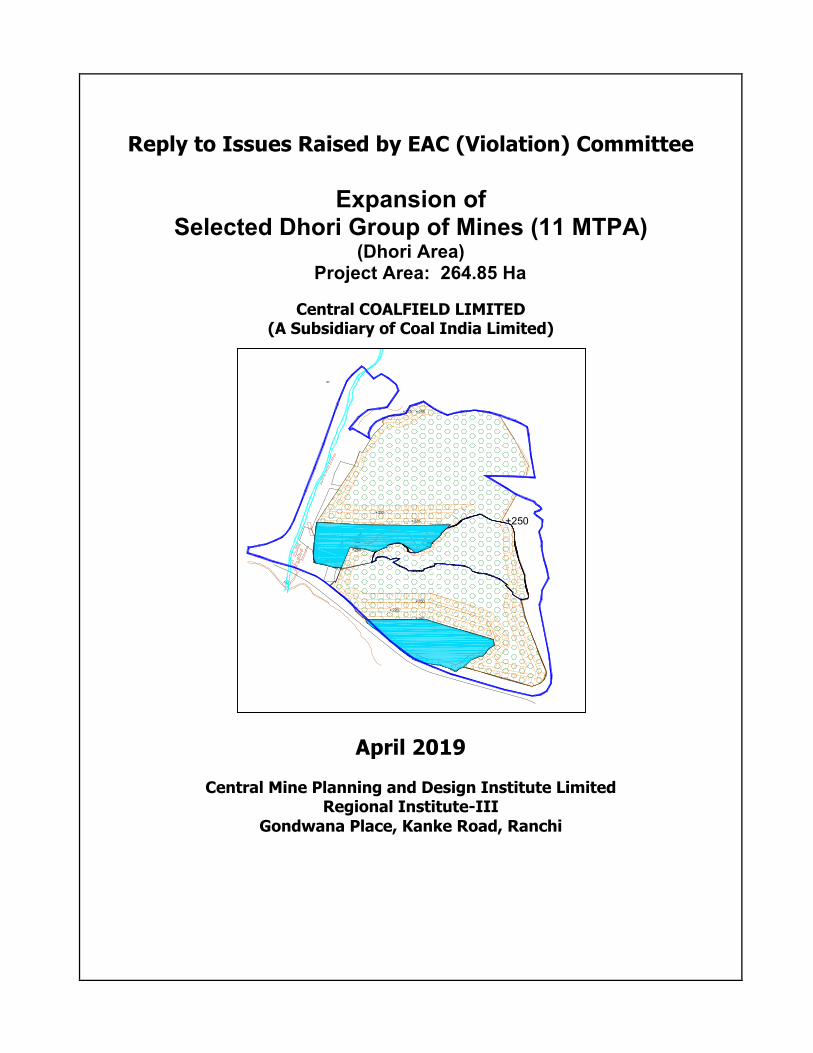
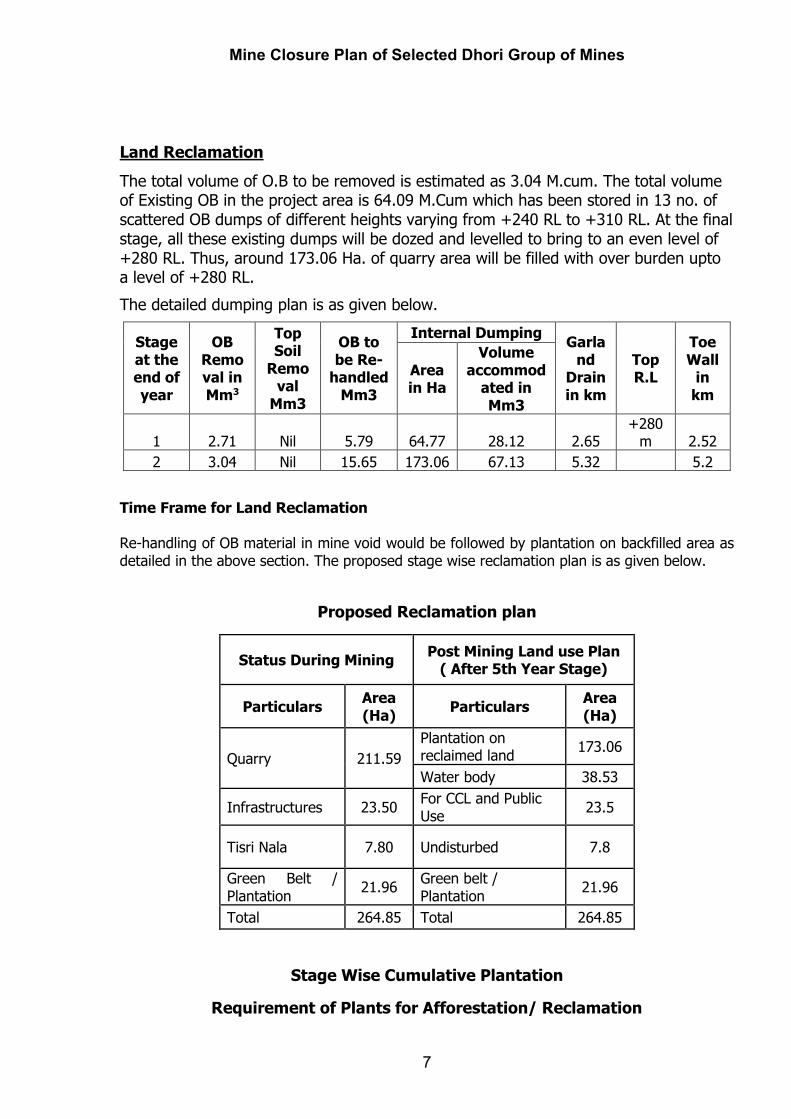
Land Reclamation The total volume of O.B to be removed is estimated as 3.04 M.cum. The total volume of Existing OB in the project area is 64.09 M.Cum which has been stored in 13 no. of scattered OB dumps of different heights varying from +240 RL to +310 RL. At the final stage, all these existing dumps will be dozed and levelled to bring to an even level of +280 RL. Thus, around 173.06 Ha. of quarry area will be filled with over burden upto a level of +280 RL. The detailed dumping plan is as given below.
Stage at the end of year
OB Removal in Mm3
Top Soil
Removal
Mm3
OB to be Re-
handled Mm3
Internal Dumping Garland
Drain in km
Top R.L
Toe Wall
in km
Area in Ha
Volume accommod
ated in Mm3
1 2.71 Nil 5.79 64.77 28.12 2.65 +280
m 2.52 2 3.04 Nil 15.65 173.06 67.13 5.32 5.2
Time Frame for Land Reclamation
Re-handling of OB material in mine void would be followed by plantation on backfilled area as detailed in the above section. The proposed stage wise reclamation plan is as given below.
Proposed Reclamation plan
Status During Mining Post Mining Land use Plan ( After 5th Year Stage)
Particulars Area (Ha) Particulars Area
(Ha)
Quarry 211.59 Plantation on reclaimed land 173.06
Water body 38.53
Infrastructures 23.50 For CCL and Public Use 23.5
Tisri Nala 7.80 Undisturbed 7.8
Green Belt / Plantation 21.96 Green belt /
Plantation 21.96
Total 264.85 Total 264.85
Stage Wise Cumulative Plantation
Requirement of Plants for Afforestation/ Reclamation
Mine Closure Plan of Selected Dhori Group of Mines
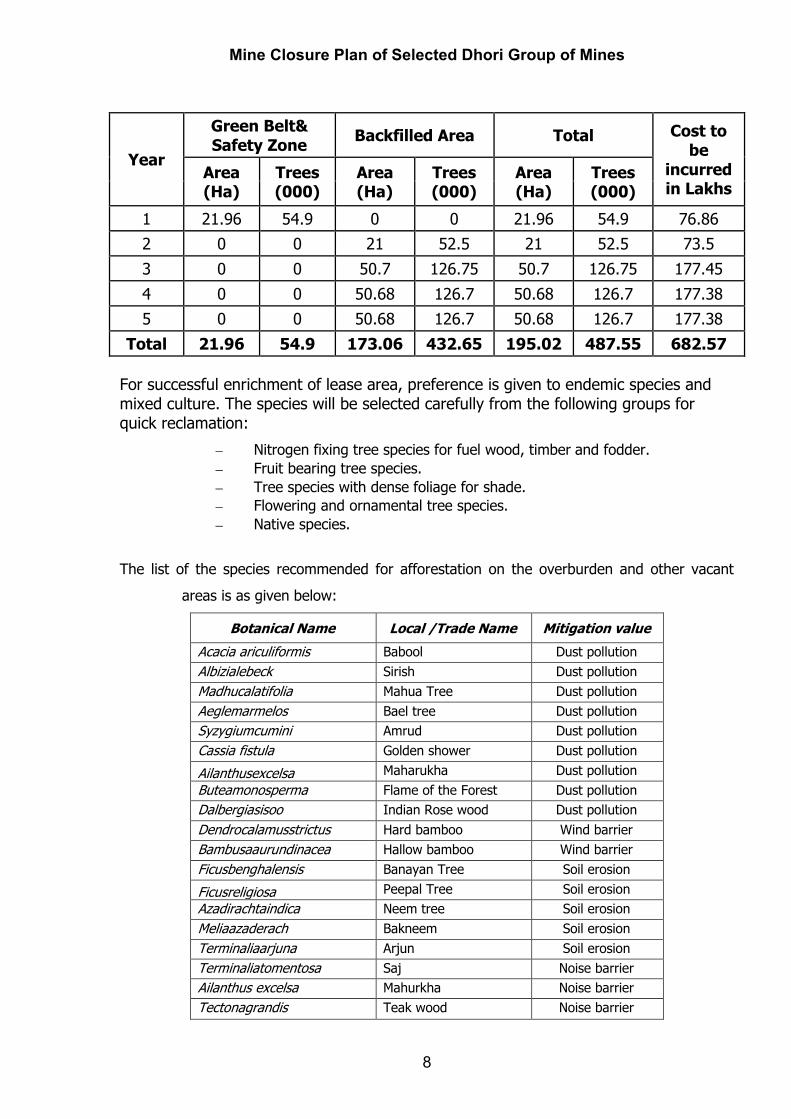
8
Year
Green Belt& Safety Zone Backfilled Area Total Cost to
be incurred in Lakhs
Area (Ha)
Trees (000)
Area (Ha)
Trees (000)
Area (Ha)
Trees (000)
1 21.96 54.9 0 0 21.96 54.9 76.86 2 0 0 21 52.5 21 52.5 73.5 3 0 0 50.7 126.75 50.7 126.75 177.45 4 0 0 50.68 126.7 50.68 126.7 177.38 5 0 0 50.68 126.7 50.68 126.7 177.38
Total 21.96 54.9 173.06 432.65 195.02 487.55 682.57
For successful enrichment of lease area, preference is given to endemic species and mixed culture. The species will be selected carefully from the following groups for quick reclamation:
f Nitrogen fixing tree species for fuel wood, timber and fodder. f Fruit bearing tree species. f Tree species with dense foliage for shade. f Flowering and ornamental tree species. f Native species.
The list of the species recommended for afforestation on the overburden and other vacant
areas is as given below:
Botanical Name Local /Trade Name Mitigation value Acacia ariculiformis Babool Dust pollution Albizialebeck Sirish Dust pollution Madhucalatifolia Mahua Tree Dust pollution Aeglemarmelos Bael tree Dust pollution Syzygiumcumini Amrud Dust pollution Cassia fistula Golden shower Dust pollution Ailanthusexcelsa Maharukha Dust pollution Buteamonosperma Flame of the Forest Dust pollution Dalbergiasisoo Indian Rose wood Dust pollution Dendrocalamusstrictus Hard bamboo Wind barrier Bambusaaurundinacea Hallow bamboo Wind barrier Ficusbenghalensis Banayan Tree Soil erosion Ficusreligiosa Peepal Tree Soil erosion Azadirachtaindica Neem tree Soil erosion Meliaazaderach Bakneem Soil erosion Terminaliaarjuna Arjun Soil erosion Terminaliatomentosa Saj Noise barrier Ailanthus excelsa Mahurkha Noise barrier Tectonagrandis Teak wood Noise barrier

Mine Closure Plan of Selected Dhori Group of Mines
9
3-tier plantation will be done all along the periphery of the colony for dust and noise attenuation. This will protect colony from air & noise pollution.
+225
+255
+250
+250
+220
+190
+250
+280
QUARRY-I
QUARRY-III
QUARRY-II
30 m AGL
HFL
206
.31m
Emba
nkm
ent A
gain
st T
isri N
ala
CH
P
650001C3R
1 : 4000
20/07/02Sr EE
Sr EE
CME
R.D.B.N.SAHAY
S.K.Mitra
A.K.SINHA
A.K.ROY
1ISO 9001 CompanyCMPDI
O
1 of 1
Created
Created
CENTRAL COALFIELDS LIMITED
REV. No.
Sheet
Drg.No.
Scale
Approved
Checked
DateSignatureDesignationNameActivity
Job No.
Subject
Job Title
Customer
Copyright in these drawings is vested in CMPDI.Unauthorised copying or use is not permitted.
4R0129
Final stage Dump Plan
SCHEME FOR CONTROLLING / QUENCHING OF FIRE IN CENTRALSECTOR OF SELECTED DHORI OCP.
20/07/02
20/07/02
20/07/02
Plate-XVI
A
B
C
A'
B'
C'
100
120
140
160
180
200
220
240
260
280
300
320
340
100
120
140
160
180
200
220
240
260
280
300
320
340
100 200 300 400 500 600 700 800 900 1000 1100 1200 1300
A A'
100
120
140
160
180
200
220
240
260
280
300
320
340
100
120
140
160
180
200
220
240
260
280
300
320
340
100 200 300 400 500 600 700 800 900 1000 1100
B B'1200 1300 1400 1500 1600 1700
100
120
140
160
180
200
220
240
260
280
300
320
340
100
120
140
160
180
200
220
240
260
280
300
320
340
100 200 300 400 500 600 700 800 900 1000 1100
C C'1200 1300 1400 1500 1600 1700
Section C-C'
Section B-B'
Section A-A'
+28040 m AGL
Toe
wal
l
Gar
land
Dra
in
Toe
wal
l
Gar
land
Dra
in
Toe
wal
l
Gar
land
Dra
in
Toe
wal
l
Gar
land
Dra
in
1 All values are in meters.ParticularsSl No.
Notes
Reference Drawings
Ref. NumberParticularsSl No.
Clander planof excavation for Quarry No. III
Clander plan for Quarry No. II & III
Land use plan
Existing mine plan provided by project04
03
02
01 RI-3/OCM/044
RI-3/OCM/071
RI-3/C/846/98
Project boundary
Green Belt
Internal Dump
Tisri nala
05
04
03
02
01
Sl No.
LegendParticulars Symbol
Railway line
06 Toe wall and garland Drain
CDD-09RL 315.13
166.50
SEAM X
SEAM VI
SEAM V
SEAM III
11.75
48.45
3.65
3.90
54.0
30.26
GL
Toe
wal
lG
arla
nd D
rain
Enlarged Portion of X
+250
Toe
wal
l
Gar
land
Dra
in
GL
X
30-40 m BGL
70 m BGL