Embed Size (px)
DESCRIPTION
Expenditure Analysis of Criminal Justice in Canada. Ottawa, Canada, March 2013. 2011-12 Criminal Justice Expenditure. $20.3 billion Nationally. $582. 27% $5.5 billion. 73% $14.8 billion. 2011-12 Criminal Justice Expenditure. $20.3 billion Nationally. $582. 27% $5.5 billion. 73% - PowerPoint PPT Presentation
Citation preview
Expenditure Analysis of Criminal Justice in Canada
Ottawa, Canada, March 2013

Federal Provincial
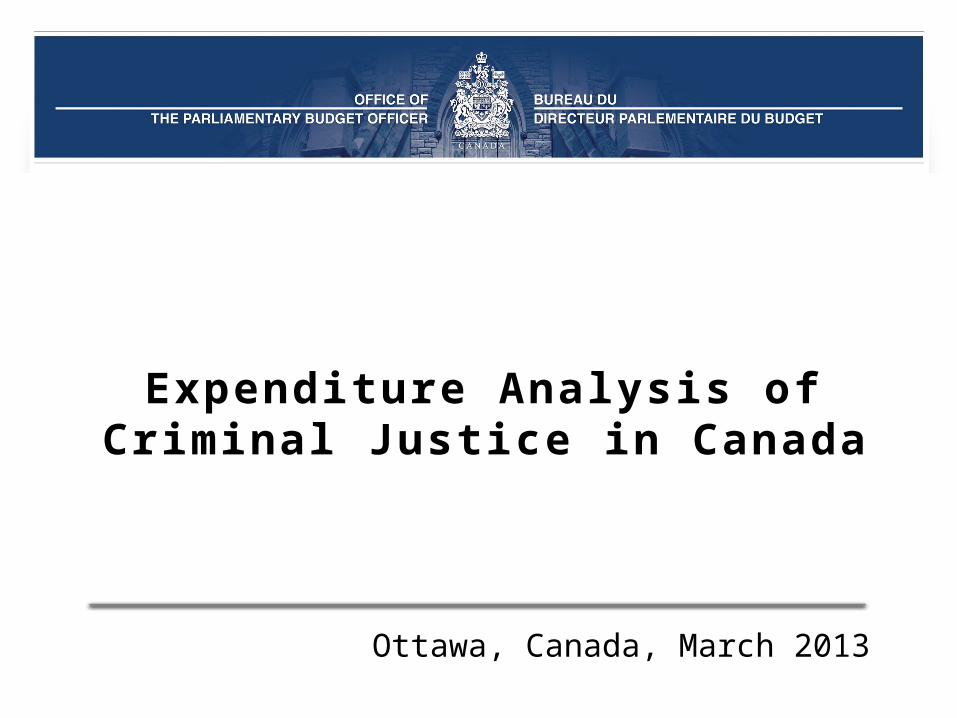
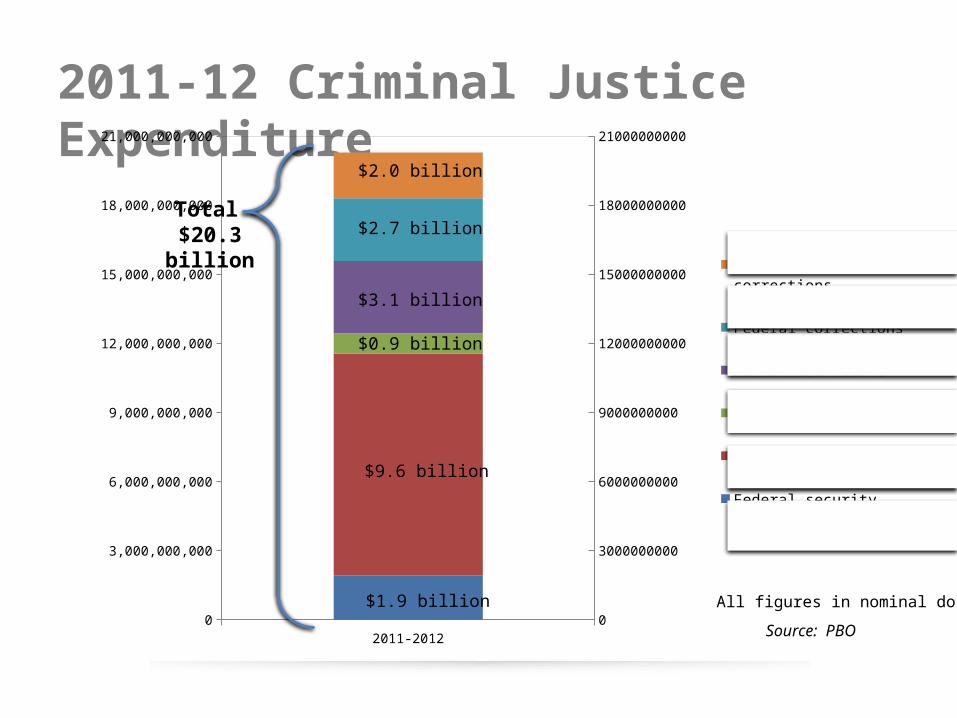
2011-12 Criminal Justice Expenditure
27%$5.5 billion
73%$14.8 billion
$582$20.3 billionNationally
Federal Provincial
2011-12 Criminal Justice Expenditure
27%$5.5 billion
73%$14.8 billion
$582$20.3 billionNationally
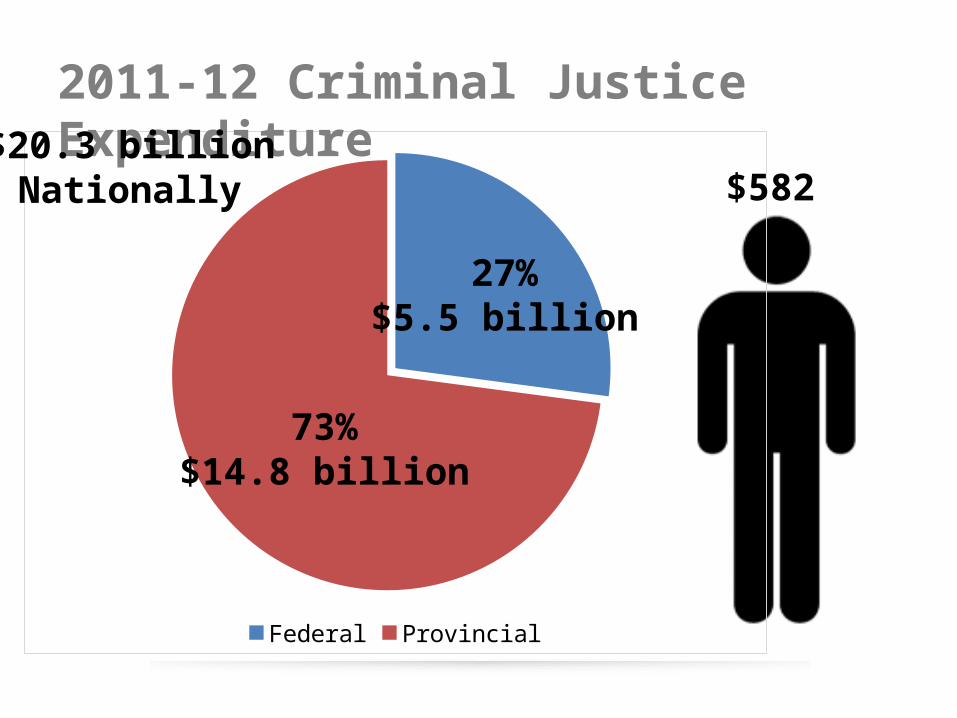
2011-12 Criminal Justice Expenditure$20.3 billionNationally
Criminal Justice
DND HRSDC IAND
$20.3 $20.5
$48.1
$7.9
Expenditure (in billions)
AANDC
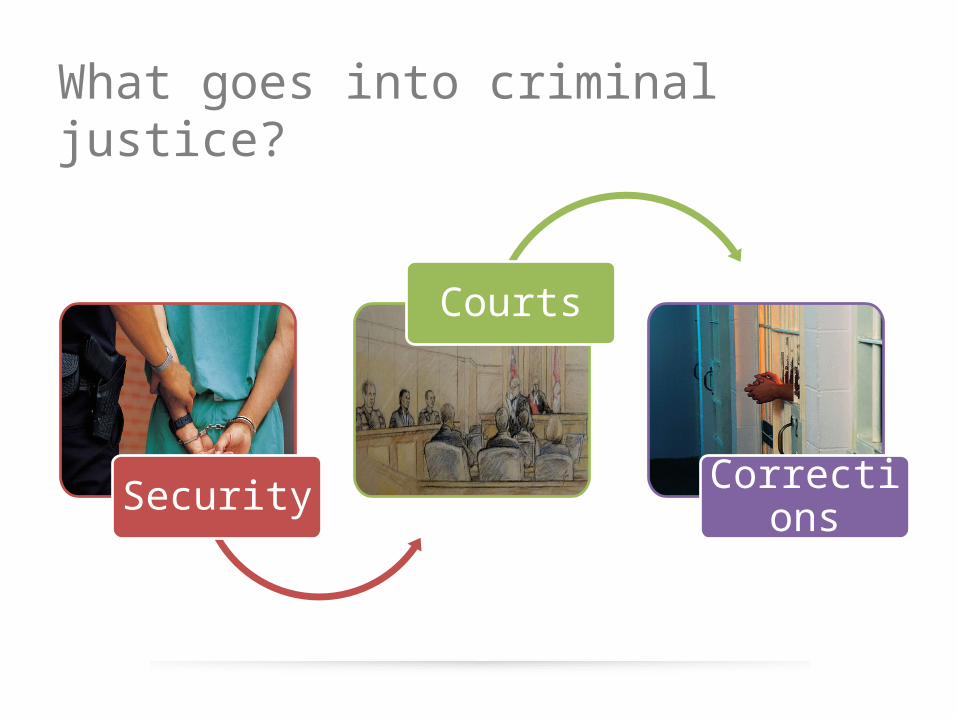
What goes into criminal justice?
Security
Courts
Corrections
2011-12 Criminal Justice Expenditure
2011-20120
3,000,000,000
6,000,000,000
9,000,000,000
12,000,000,000
15,000,000,000
18,000,000,000
21,000,000,000
0
3000000000
6000000000
9000000000
12000000000
15000000000
18000000000
21000000000
Provincial corrections
Federal corrections
Provincial courts
Federal courts
Provincial security
Federal security
$1.9 billion
$9.6 billion
$0.9 billion
$3.1 billion
$2.7 billion
$2.0 billion
All figures in nominal dollars
Source: PBO
Total
$20.3 billion
Sources: Statistics Canada, PBO
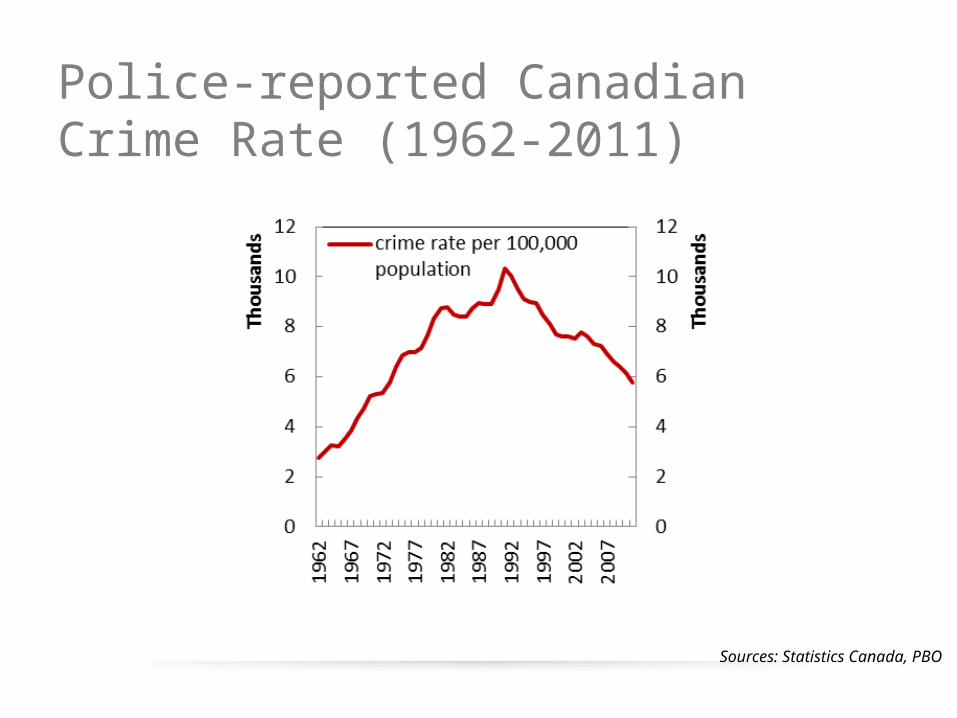
Police-reported Canadian Crime Rate (1962-2011)
Source: PBO
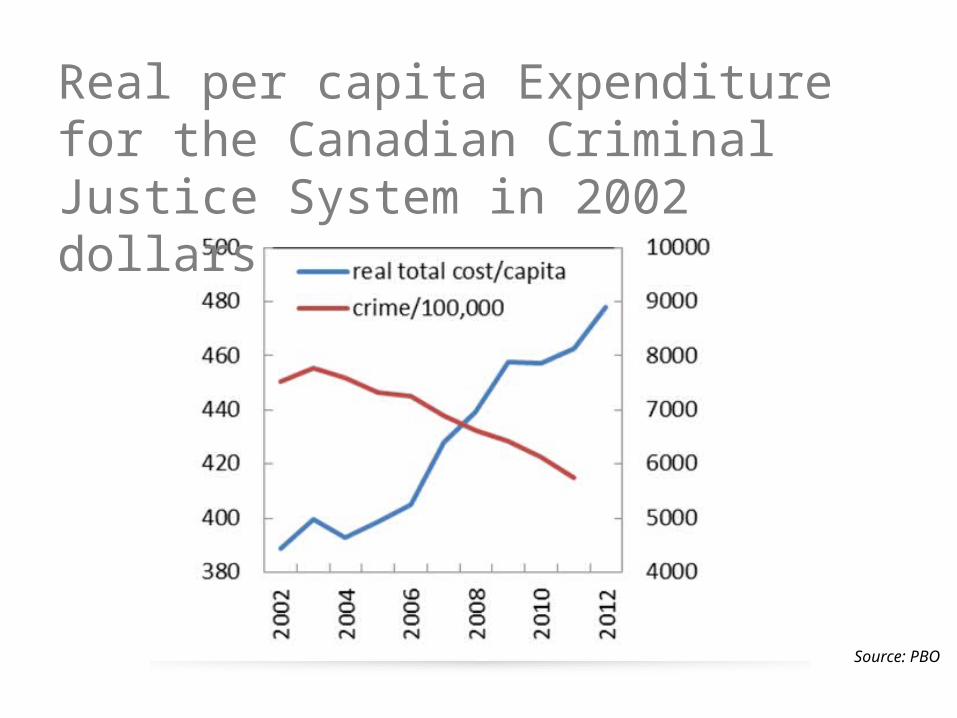
Real per capita Expenditure for the Canadian Criminal Justice System in 2002 dollars
Sources: Statistics Canada, PBO
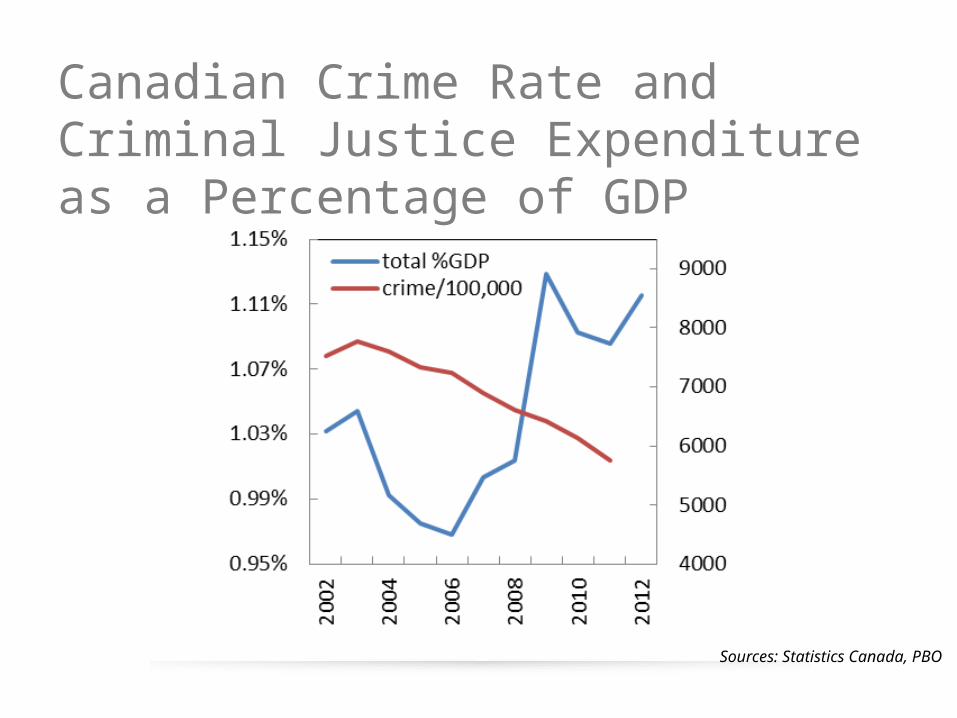
Canadian Crime Rate and Criminal Justice Expenditure as a Percentage of GDP
Sources: Statistics Canada, PBO
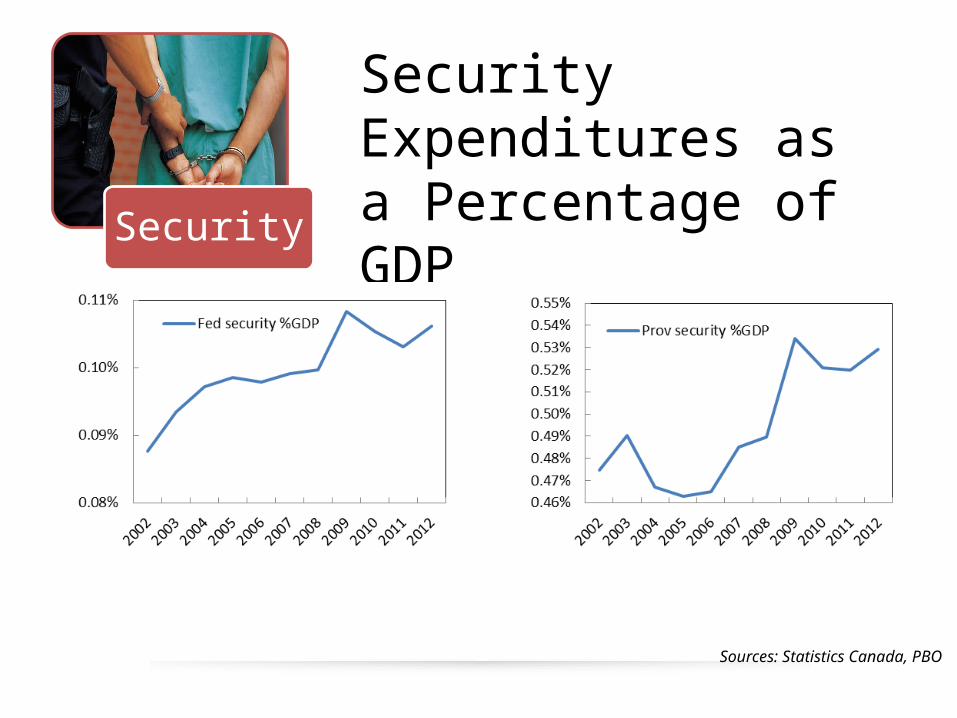
Security
Security Expenditures as a Percentage of GDP
Sources: Statistics Canada, PBO
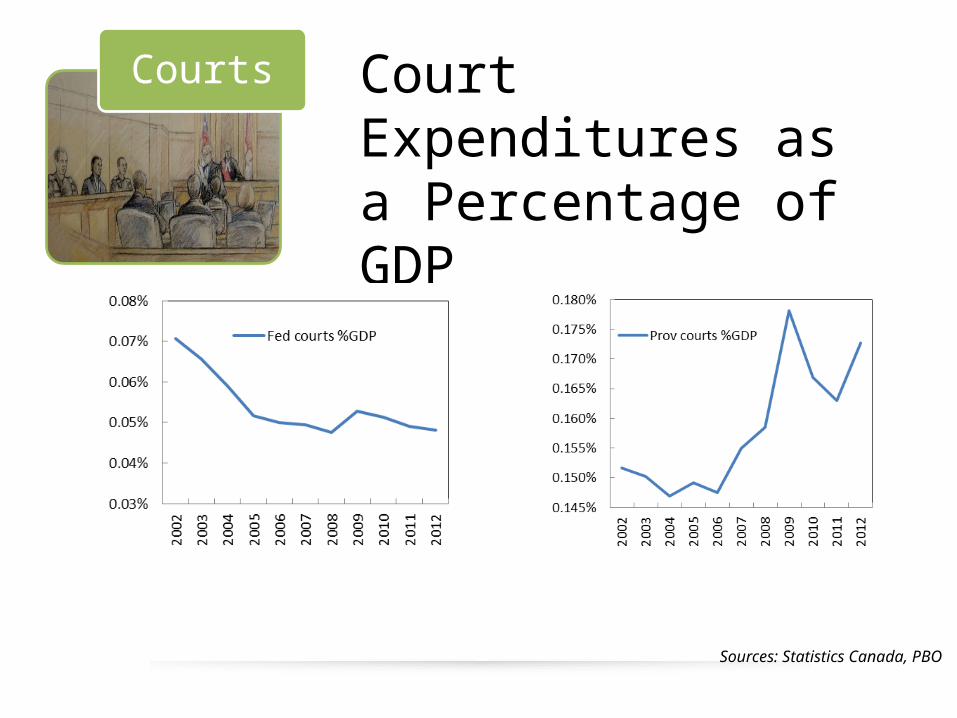
Courts Court Expenditures as a Percentage of GDP
Sources: Statistics Canada, PBO
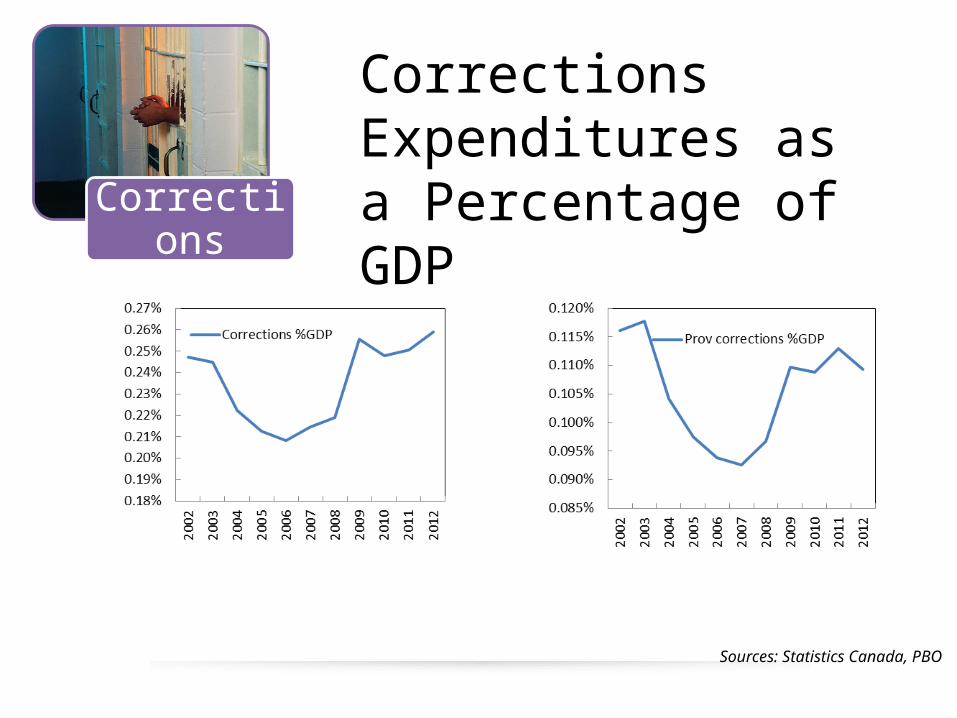
Corrections
Corrections Expenditures as a Percentage of GDP