Embed Size (px)
Citation preview

NNMREC
Experimental and Analytical Study of Helical Cross‐Flow Turbines for a Tidal
Micropower Generation System
Adam NiblickUniversity of Washington
Northwest National Marine Renewable Energy Center
MSME Thesis DefenseMarch 7, 2012

NNMREC
Outline Tidal Micropower System Overview Turbine Selection/Design Parameters Experimental TestingModeling Conclusions and Future Work
NNMREC
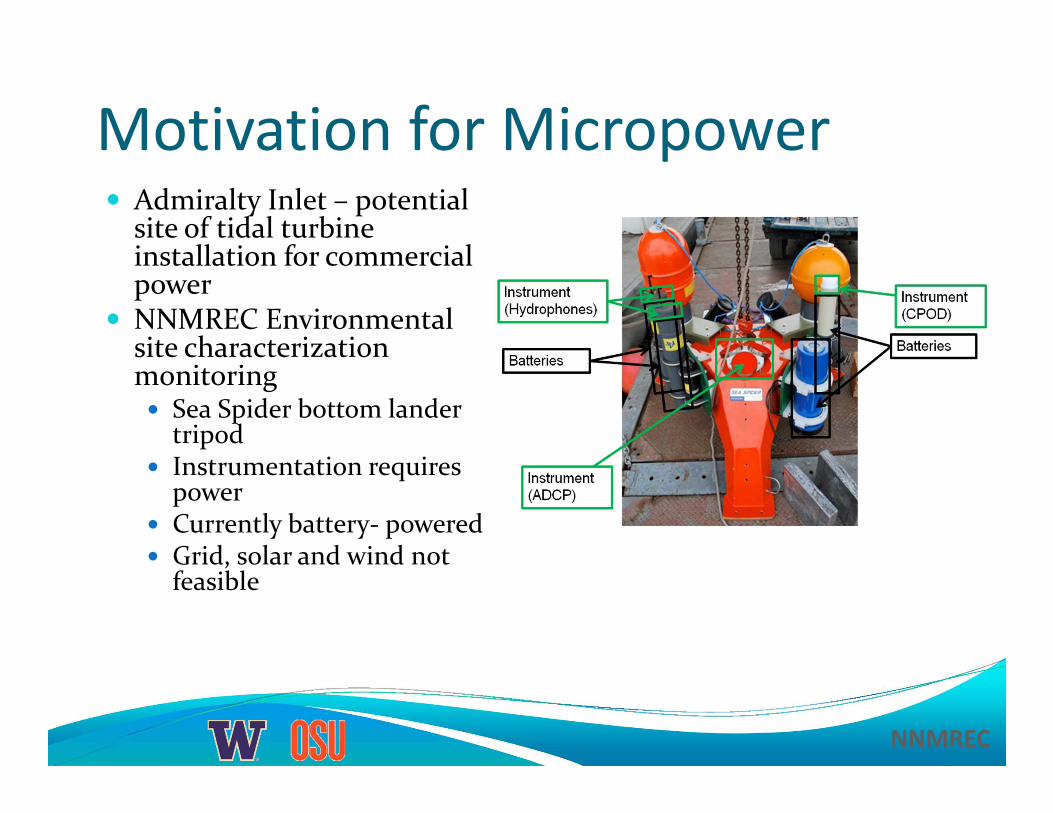
Motivation for Micropower Admiralty Inlet – potential
site of tidal turbine installation for commercial power
NNMREC Environmental site characterization monitoring Sea Spider bottom landertripod
Instrumentation requires power
Currently battery‐ powered Grid, solar and wind not feasible
NNMREC
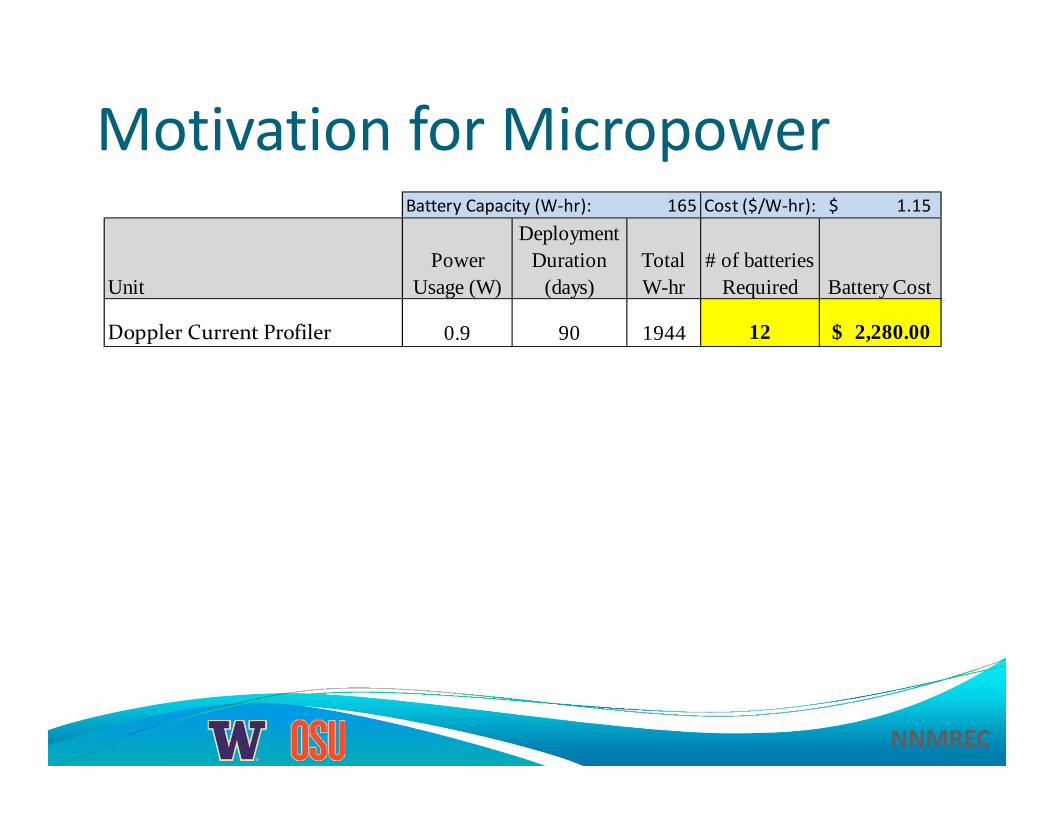
Motivation for MicropowerBattery Capacity (W‐hr): 165 Cost ($/W‐hr): 1.15$
UnitPower
Usage (W)
Deployment Duration
(days)Total W-hr
# of batteries Required Battery Cost
Doppler Current Profiler 0.9 90 1944 12 2,280.00$

NNMREC
Motivation for MicropowerBattery Capacity (W‐hr): 165 Cost ($/W‐hr): 1.15$
UnitPower
Usage (W)
Deployment Duration
(days)Total W-hr
# of batteries Required Battery Cost
Doppler Current Profiler 0.9 90 1944 12 2,280.00$
Doppler Current Profiler 0.9 180 3888 24 4,560.00$

NNMREC
Motivation for MicropowerBattery Capacity (W‐hr): 165 Cost ($/W‐hr): 1.15$
UnitPower
Usage (W)
Deployment Duration
(days)Total W-hr
# of batteries Required Battery Cost
Doppler Current Profiler 0.9 90 1944 12 2,280.00$
Doppler Current Profiler 0.9 180 3888 24 4,560.00$
Imaging Sonar (20% duty cycle) 20.0 180 86400 524 99,560.00$
u0:Inflowvelocityρ:Fluiddensity

NNMREC
Motivation for MicropowerBattery Capacity (W‐hr): 165 Cost ($/W‐hr): 1.15$
UnitPower
Usage (W)
Deployment Duration
(days)Total W-hr
# of batteries Required Battery Cost
Doppler Current Profiler 0.9 90 1944 12 2,280.00$
Doppler Current Profiler 0.9 180 3888 24 4,560.00$
Imaging Sonar (20% duty cycle) 20.0 180 86400 524 99,560.00$
Imaging Sonar (20% duty cycle) 20.0 180 86400 15 2,850.00$

NNMREC
Micropower System Concept
Drawing courtesy of Stelzenmuller et al
Micropower System – A tidal hydrokinetic power generation system to power remote instrumentation on the order of 20 W continuous in 1.5 m/s peak tidal currents.

NNMREC
Research GoalsProvide initial concept for a micropower tidal generation systemProvide detailed design, analysis and experimental testing one of the components: the hydrokinetic turbine

NNMREC
Micropower System Block Diagram
+ ‐+ ‐
Loads
Monitoring Equipment
Controller/processor
Data storage
Gearbox
Generator
Tidal Turbine
Battery Bank
ConverterRectifier
Turbine
Controller
Loads
0 2 4 6-2
0
2
time (days)
u 0 (m/s
)
Tidal Current Profile
NNMREC
OutlineMicropower System Overview Turbine Selection/Design Parameters Experimental TestingModeling Conclusions and Future Work
NNMREC
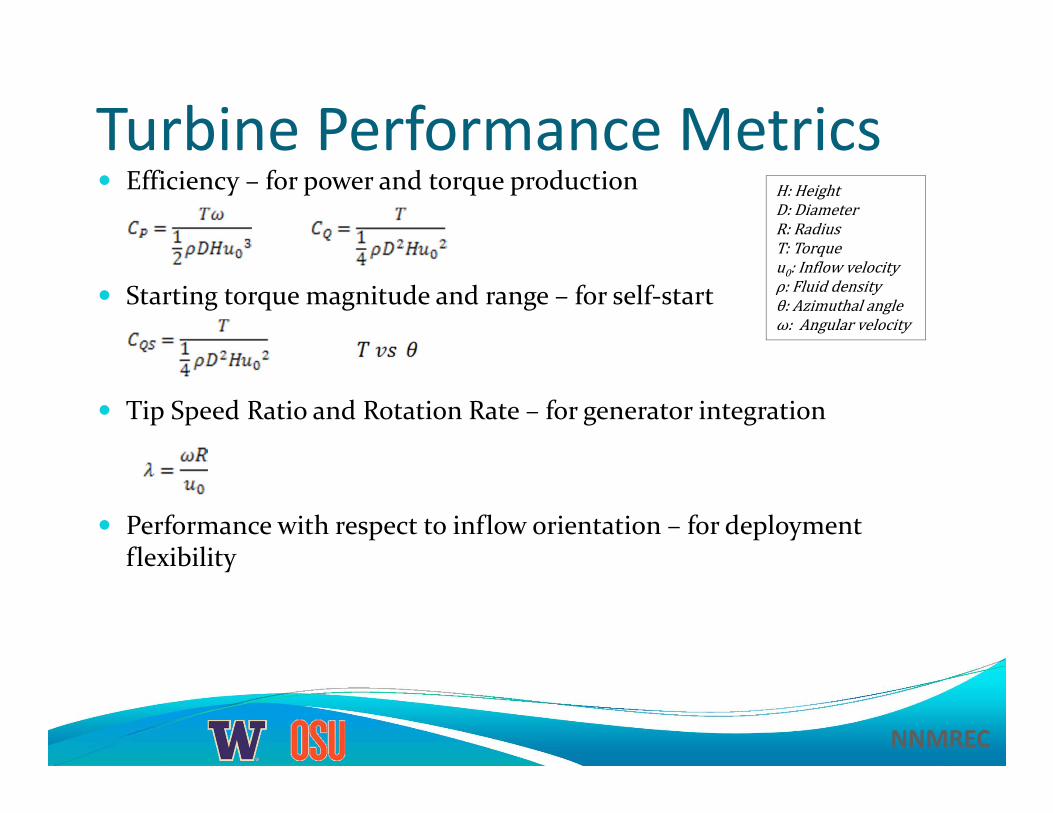
Turbine Performance Metrics Efficiency – for power and torque production
Starting torque magnitude and range – for self‐start
Tip Speed Ratio and Rotation Rate – for generator integration
Performance with respect to inflow orientation – for deployment flexibility
H:HeightD:DiameterR:RadiusT:Torqueu0:Inflowvelocityρ:Fluiddensityθ:Azimuthal angleω:Angularvelocity

NNMREC
Turbine Design Concepts
Axial Turbine
SavoniusRotor
DarrieusTurbine
HybridTurbine
Helical Turbine
Sources: Polagye, 2011; engr.mun.ca/~tariq/jahangiralam.pdf; newenergycorp.ca;
High efficiency (~35%)
Good self‐start capability
Accepts flow from any horizontal direction

NNMREC
Blade Element Theory Streamwise velocity (uS) Tip velocity (ωR)
Induced by turbine’s own rotation Relative velocity (uREL)
Resultant vector of uS and ωR
Angle of attack (α) Angle between uREL and
chord line Lift ‐ Drag Forces (FL, FD)
Generate turbine torque
Best lift‐drag ratio when ‐10< α<10°
c:Bladelengthh:BladeheightAP:Planform area ch
NNMREC
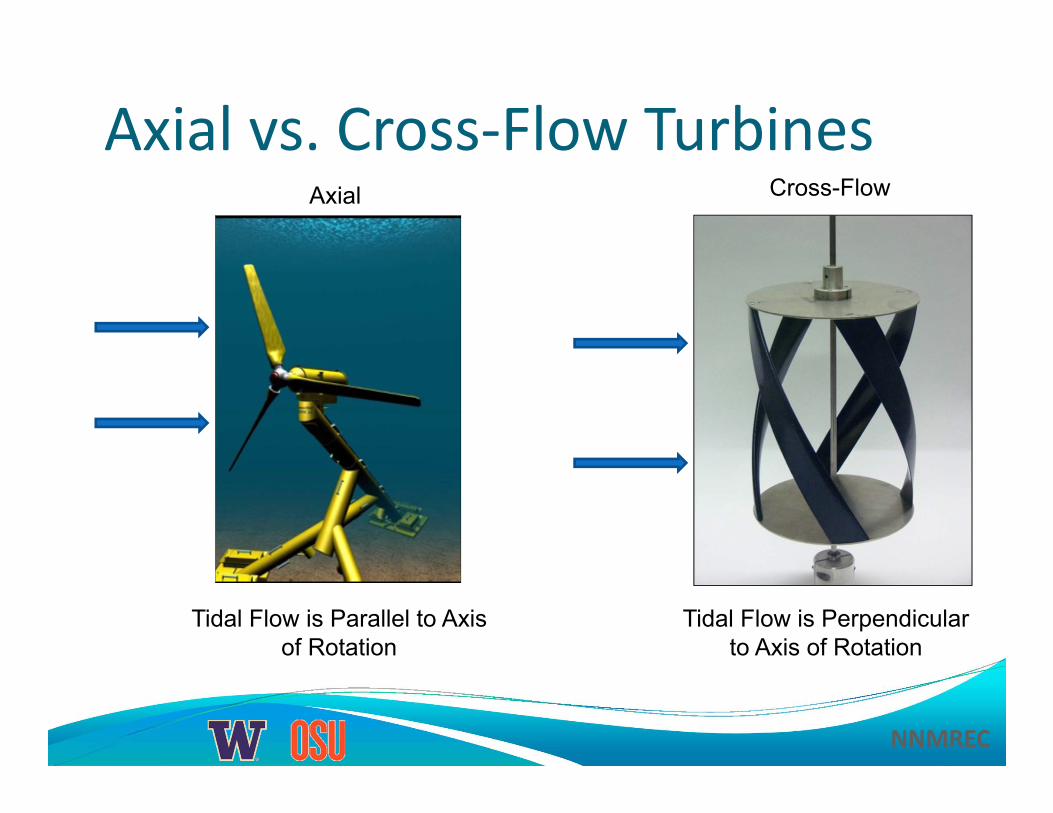
Axial vs. Cross‐Flow Turbines
Tidal Flow is Parallel to Axis of Rotation
Tidal Flow is Perpendicular to Axis of Rotation
Axial Cross-Flow

NNMREC
Blade Element Theory Angle of attack (α)
Constantly changing as turbine rotates
Often exceeds stall angle
NNMREC
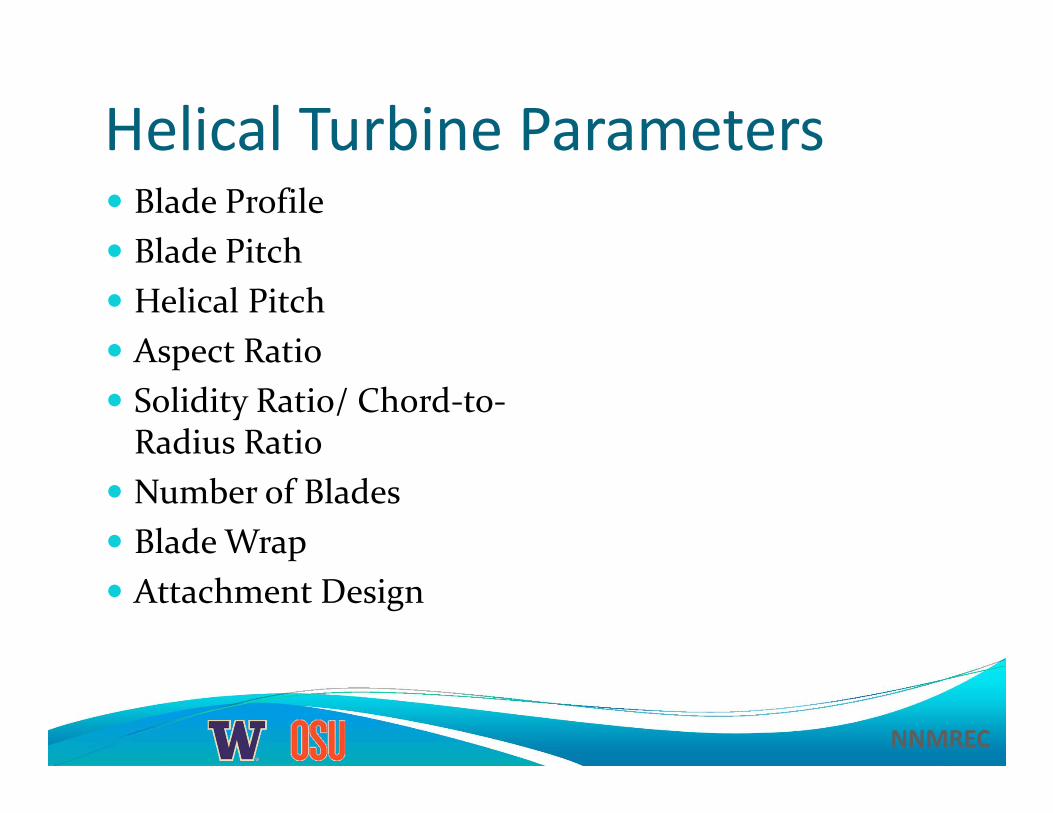
Helical Turbine Parameters Blade Profile Blade Pitch Helical Pitch Aspect Ratio Solidity Ratio/ Chord‐to‐Radius Ratio
Number of Blades Blade Wrap Attachment Design

NNMREC
Helical Turbine Parameters Blade Profile Helical Pitch Aspect Ratio Solidity Ratio/ Chord‐to‐Radius Ratio
Number of Blades Attachment Design
0 0.1 0.2 0.3 0.4 0.5 0.6 0.7 0.8 0.9 1-0.1
0
0.1
x
y
NACA0018
Source: answers.com

NNMREC
Helical Turbine Parameters Blade Profile Helical Pitch Aspect Ratio Solidity Ratio/ Chord‐to‐Radius Ratio
Number of Blades Attachment Design

NNMREC
Helical Turbine Parameters Blade Profile Helical Pitch Aspect Ratio Solidity Ratio/ Chord‐to‐Radius Ratio
Number of Blades Attachment Design
Size limited by deployment constraints

NNMREC
Helical Turbine Parameters Blade Profile Helical Pitch Aspect Ratio Solidity Ratio/ Chord‐to‐Radius Ratio
Number of Blades (B) Attachment Design
30% Solidity
15% Solidity

NNMREC
Helical Turbine Parameters Blade Profile Helical Pitch Aspect Ratio Solidity Ratio/ Chord‐to‐Radius Ratio
Number of Blades Attachment Design

NNMREC
Parameter OptimizationHigher efficiency,Improved CP,
ManufacturabilityHelical Pitch Lower static torque
variation
Improved CP, Allows higher pitch Aspect Ratio
Easier Deployment,Less blade stress, Less vibration
Better starting torque, Manufacturability Solidity Ratio Higher tip speed ratio
Allows increase in pitch and reduced aspect
ratioNumber of Blades Fewer parts, Less blade
wake interference

NNMREC
OutlineMicropower System Overview Turbine Selection/Design Parameters Experimental TestingModeling Conclusions and Future Work
NNMREC
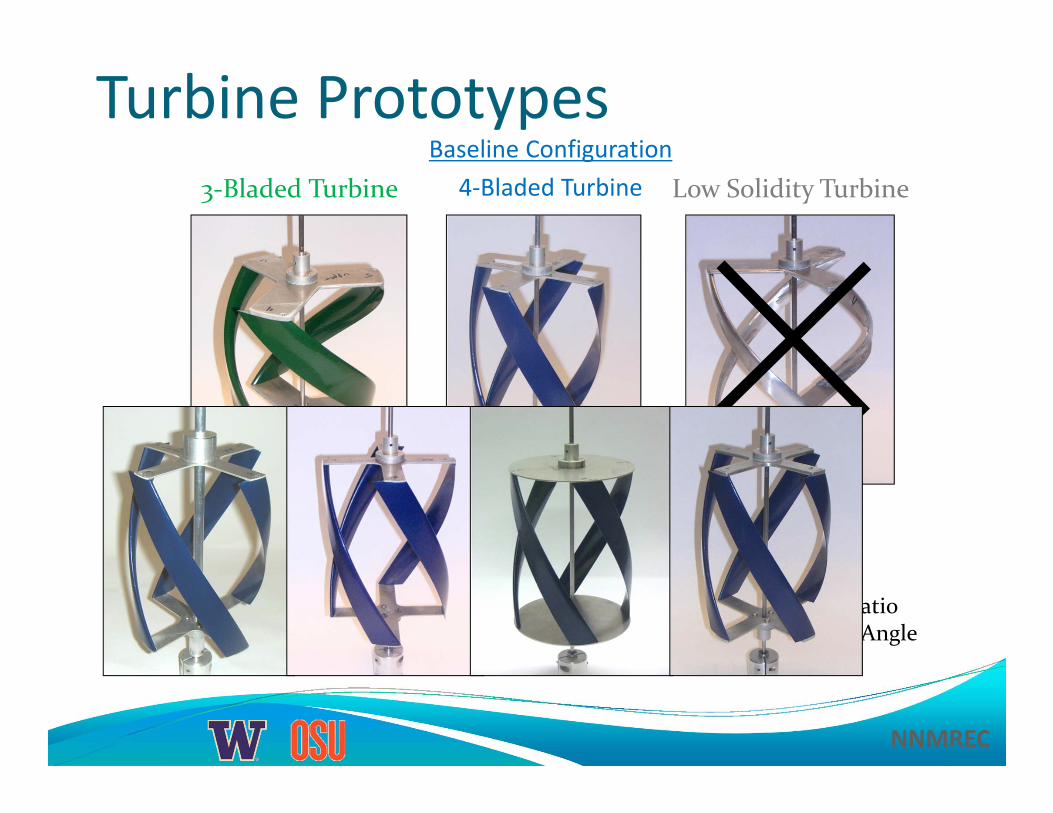
Turbine Prototypes
3 Blades D=20 cm H=20 cm 1.00 Aspect Ratio 43.7° Pitch Angle 30% Solidity
3‐Bladed TurbineBaseline Configuration
4‐Bladed Turbine Low Solidity Turbine
3 Blades D=20 cm H=20 cm 1.00 Aspect Ratio 43.7° Pitch Angle 15% Solidity
4 Blades D=17.2 cm H=23.4 cm 1.36 Aspect Ratio 60° Pitch Angle 30% Solidity

NNMREC
Tests Performed Baseline Configuration
Load Performance Test Static Torque Test Tilted Turbine Test
Design Comparison Tests Helical Pitch/No. of Blades Strut Attachment Design Shaft Design

NNMREC
Flume Test Channel 3 meters length 72 cm wide Maximum 0.8 m/s flow rate
Turbine located in center of flume width at 1.7 m from test channel inlet
Acoustic Doppler Velocimeter (ADV) ‐ to measure flume velocity

NNMREC
Test Instrumentation ModuleReaction Torque Cell
Particle Brake Flex Coupling
Optical Encoder
Locking Plate
Bearing

NNMREC
Turbine Operation

NNMREC
Load Performance Results Baseline
Configuration

NNMREC
Lift and Drag for different α
Region of Turbine Operation at 0.4 m/s
Region of Turbine Operation at 0.8 m/s
…but increasing λdecreases average α

NNMREC
Static Torque Baseline
Configuration Flume: 0.7 m/s
0° view, looking downstream

NNMREC
Turbine Design Comparison4-Bladed Turbine3-Bladed Turbine
Load Performance Test Results

NNMREC
Strut Design Comparison2 mm Spoke 4.8 mm Spoke Circular Plate

NNMREC
Shaft Diameter ComparisonNo Shaft 6.4 mm Shaft 12.7 mm Shaft
NNMREC
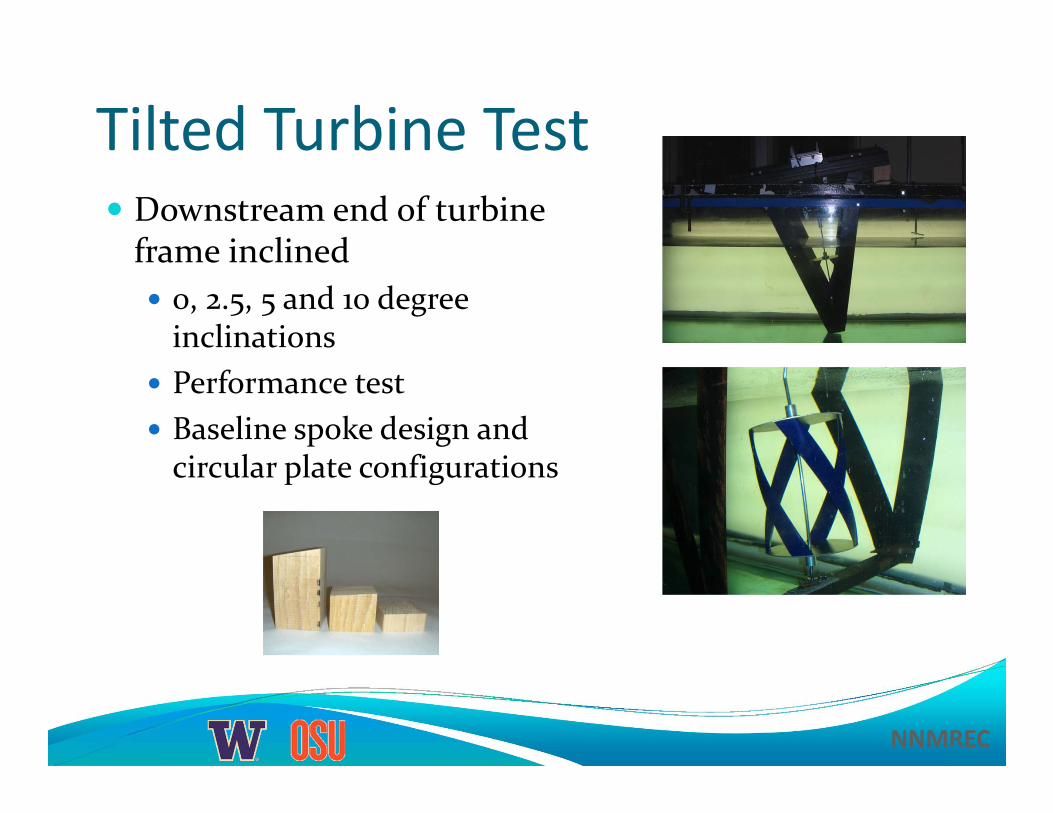
Tilted Turbine Test Downstream end of turbine frame inclined 0, 2.5, 5 and 10 degree inclinations
Performance test Baseline spoke design and circular plate configurations

NNMREC
Tilted Turbine Test

NNMREC
Test Conclusions Four‐bladed turbine is best design for optimum aspect ratio and performance
Good self‐start and performance with high solidity Maximize helical pitch angle to get better max CP
No impact of shaft diameter on performance Circular plate – best attachment design ‐ eliminates profile drag, better tilt angle performance
Static torque is not uniform Higher inflow velocity gives better CP

NNMREC
OutlineMicropower System Overview Turbine Selection/Design Parameters Experimental TestingModeling Conclusions and Future Work

NNMREC
Vortex Model Free‐vortex flow model Blade divided into several
elements Blade element performance
from CL,CD lookup tables Blades elements simulated as
vortex generators Sum of velocity components
gives uREL
NNMREC
Vortex Model Comparison to other model types ‐
Less computational time than CFD (days vs. minutes) Compared to momentum models, the vortex model:
Can resolve helical geometry without yaw correction factors Better resolves the wake
Model Modifications Helical geometry Strut drag for circular plate and end spokes Flow curvature effects
Higher σC‐R than previously modeled

NNMREC
Flow Curvature Change in α from leading edge to trailing edge Important for high chord‐to‐radius ratio turbines Approximated as
‘Virtual camber’
Source: Migliore, 1980

NNMREC
Pitching and Dynamic Stall Lift, drag affected by pitch rate
‘Virtual incidence’ – Approximated by CL calculated from α at ¾‐chord CD calculated at α at ½‐chord Biases α positive
Dynamic stall Vortex forms at the leading edge of hydrofoil and tracks back along the chord
Lift is increased during tracking Lift drops as vortex fully sheds
0 0.1 0.2 0.3 0.4 0.5 0.6 0.7 0.8 0.9 1-0.1
0
0.1
x
y
NACA0018
¼ ½ ¾
Source: Ekaterinaris & Platzer, 1997

NNMREC
Dynamic StallLift Drag
Source: NASA, 2009

NNMREC
Implementation of Secondary Effects
Experimental Data at 0.8 m/s

NNMREC
Implementation of Secondary Effects
Experimental Data at 0.8 m/s
Model Prediction with no Secondary Effects

NNMREC
Implementation of Secondary Effects
Experimental Data at 0.8 m/s
Model Prediction with no Secondary Effects
Dynamic Stall added

NNMREC
Implementation of Secondary Effects
Experimental Data at 0.8 m/s
Model Prediction with no Secondary Effects
Dynamic Stall added
Dynamic Stall & Pitch Rate Effects added

NNMREC
Implementation of Secondary Effects
Model Prediction with no Secondary Effects
Dynamic Stall added
Dynamic Stall & Pitch Rate Effects added
Dynamic Stall, Pitch Rate & Flow Curvature Effects added

NNMREC
Model Prediction of Inflow Variation

NNMREC
Extrapolation to 1.5 m/s

NNMREC
Analysis of High Tip Speed Ratio
Flow curvature disabledCP=0.43
Flow curvature activeCP=0.46
2 3 4 5 6 7 8 9 10-0.1
-0.05
0
0.05
0.1
0.15
0.2
(a)
Normalized Time (t*u0/R)
CQ
=2.6, 1.5 m/s
2 3 4 5 6 7 8 9 10-16
-8
0
8
16
24
32
(d
egre
es)
CQ

NNMREC
Analysis of High Tip Speed Ratio
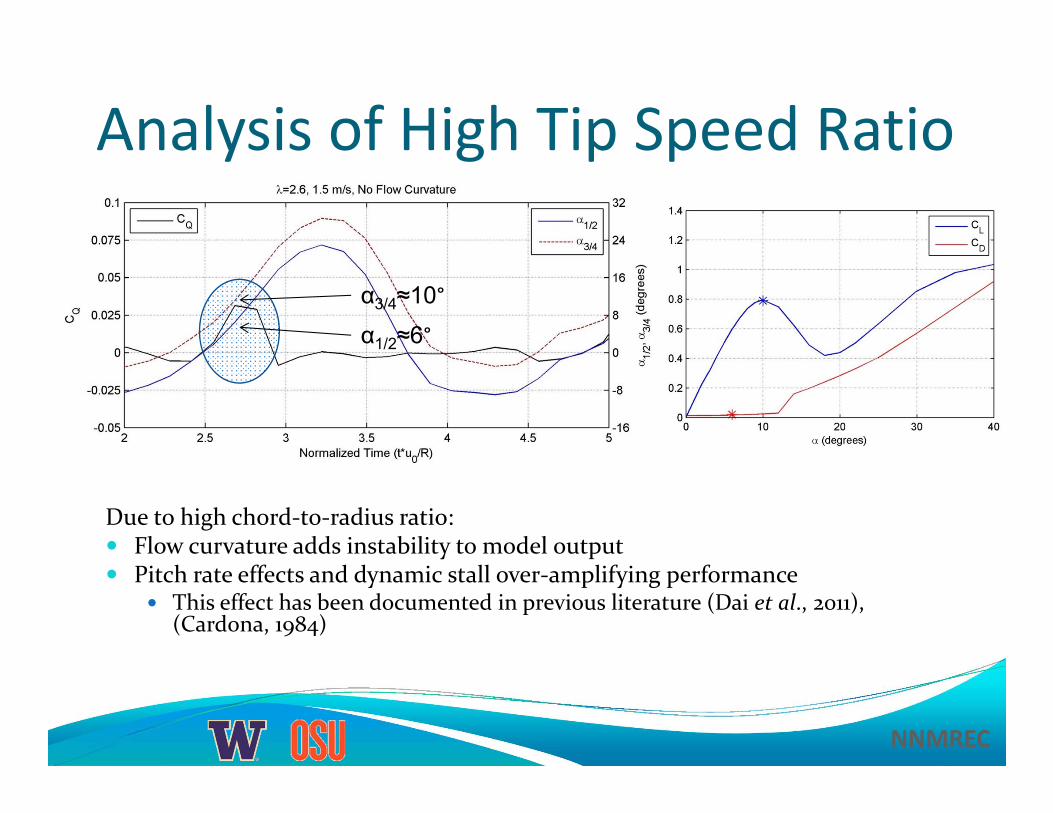
Due to high chord‐to‐radius ratio: Flow curvature adds instability to model output Pitch rate effects and dynamic stall over‐amplifying performance
This effect has been documented in previous literature (Dai et al., 2011), (Cardona, 1984)
α3/4≈10°
α1/2≈6°
NNMREC
Analysis of High Tip Speed Ratio
Due to high chord‐to‐radius ratio: Flow curvature adds instability to model output Pitch rate effects and dynamic stall over‐amplifying performance
This effect has been documented in previous literature (Dai et al., 2011), (Cardona, 1984)
α3/4≈10°
α1/2≈6°

NNMREC
Project Conclusions Demonstrated need for and viability of a tidal micropowersystem
Designed a turbine for a micropower system 24% efficient at 0.8 m/s (and increasing with flume speed) Good self‐start and flow orientation capabilities Optimized select helical turbine design parameters
Modified a vortex model to accept helical turbine design Demonstrated importance of secondary effects Demonstrated general trends in performance Need for further study of secondary effects for high chord‐to‐radius ratio turbines

NNMREC
Future Work Testing of the full‐scale turbine Design of system drive train and control
Turbine‐Generator matching Selection of battery type
Improving turbine efficiency Improved turbine modeling
Examination and refinement of secondary effects Other model types (CFD, etc.)

NNMREC
Acknowledgements Dr. Brian Polagye Dr. Alberto Aliseda Dr. Brian Fabien Dr. Roy Martin Dr. Philip Malte Bill Kuykendall Kevin Soderlund, EamonMcQuaide
Dr. Jim Thomson & APL Capstone Design Team: Nick Stelzenmuller, Bronwyn Hughes, Josh Anderson, Celest Johnson, Brett Taylor, Leo Sutanto
NNMREC Organization Sandia National Labs Marie

NNMREC
Questions?

NNMREC
Backup Slides

NNMREC
System Performance
NNMREC
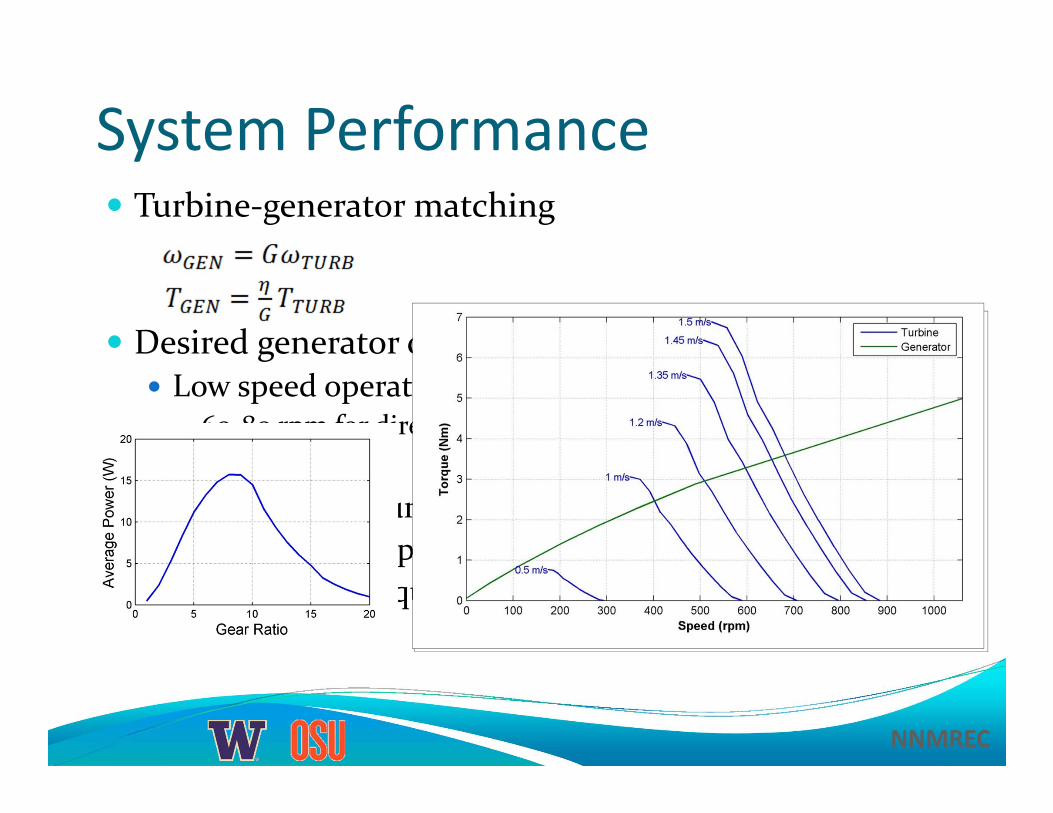
System Performance Turbine‐generator matching
Desired generator characteristics Low speed operation
60‐80 rpm for direct drive High efficiency Flat efficiency curve Fits within Sea Spider size constraints Low starting torque, low cogging

NNMREC
Battery InformationCharacteristic Sealed Lead‐Acid NiMH NiCd Lithium‐Ion
Energy Density (Wh/L) [1]Low50‐90
High430
Low15‐100
High570
Cycle Life (cycles) [1]Low200‐500
Medium300‐1000
High1500
High1000+
Memory Effect [4]LowNo effect
MediumLess than NiCd
HighPeriodic discharge required
LowNo effect
Charging Time [2]High8‐16 hours
Medium2‐4 hours
Lowabout 1 hour
Medium1‐4 hours
Cost [3] ($/kWh)Low$8.50
Medium$18.50
Low‐Medium$11.00
High$24
Toxicity [2] Very high Low Very high Low
Transportation Limitations [4] No No No Yes
Comments [1,4]Slow charging time; low energy density
Generates heat during high rate charge or discharge; tolerant of overcharge oroverdischarge
Rugged; lowest cost per cycle; some l imitations on use due to toxicity
Transportation l imitations; requires complex circuit to operate safely; l imited availabil ity for high‐power applications
Data Source:[1] Reddy & Linden (2011) [2] Buchmann (2010d) [3] Buchmann (2011b) [4] Buchmann (2010e)

NNMREC
Helical Turbines Lift‐style device Advantages:
Easily self‐starts Fairly high efficiency (~35%)
No torque oscillation Disadvantages:
Difficult to manufacture Less efficient than straight‐blade turbine
NNMREC
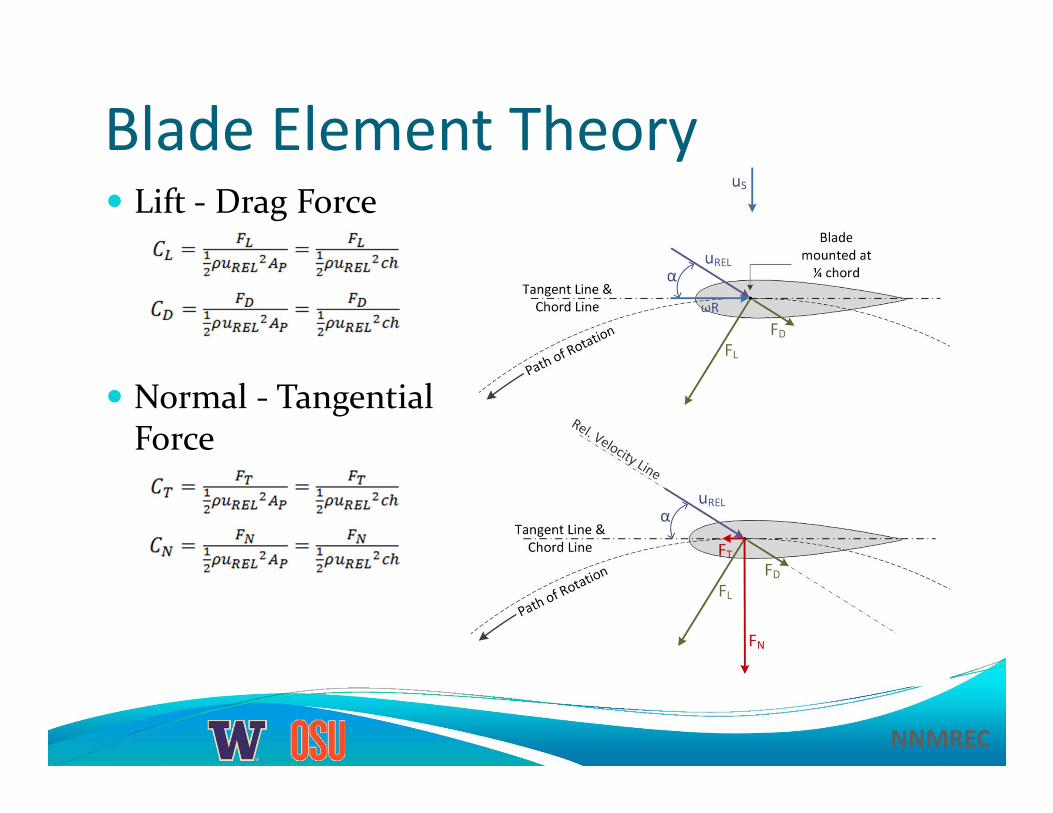
Blade Element Theory Lift ‐ Drag Force
Normal ‐ Tangential Force

NNMREC
Helical Turbine Parameters Blade Profile
NNMREC
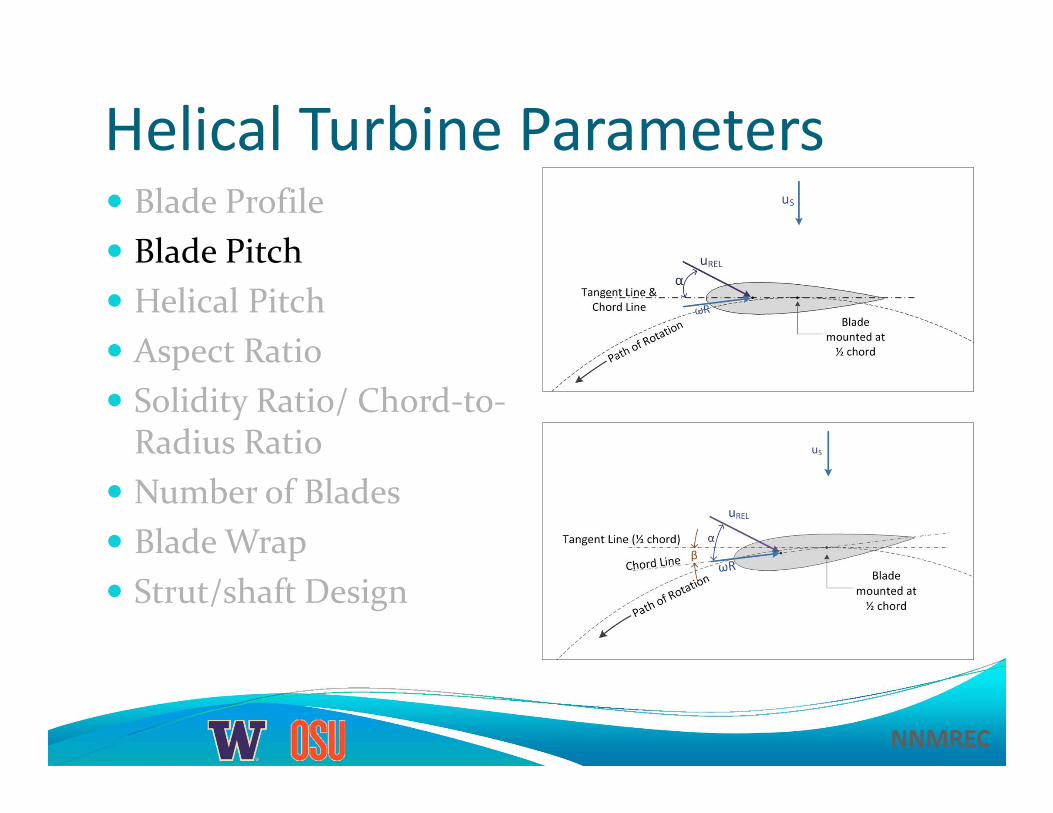
Helical Turbine Parameters Blade Profile Blade Pitch Helical Pitch Aspect Ratio Solidity Ratio/ Chord‐to‐Radius Ratio
Number of Blades Blade Wrap Strut/shaft Design

NNMREC
Helical Turbine Parameters Blade Profile Blade Pitch Helical Pitch Aspect Ratio Solidity Ratio/ Chord‐to‐Radius Ratio
Number of Blades Blade Wrap Strut/shaft Design
100% Wrap
50% Wrap

NNMREC
Test MatrixStartup ‐Shutdown
Wake Measure‐ment
0.8 0.7 0.6 0.5 0.4 0.78 0.7 0‐0.7 0.78
Turbine Design Strut Design
Shaft Diameter (mm) ‐‐ ‐‐ ‐‐ ‐‐ ‐‐
Single blade length
Full Revolution ‐‐ ‐‐ ‐‐
Load Per‐formance
Static Torque ‐‐
Single Blade, from 4‐bladed turbine
Circular Plates 6.4X X X
4.8 mm, 4‐leg spokes
6.4X X X
No shaftX X X
6.4X X X X X X X X X X X
12.7X X X
Circular Plates 6.4X X X X X X X X
3‐bladed turbine4.8 mm, 3‐leg spokes
6.4X X X X X X
Low Solidity Turbine
4.8 mm, 3‐leg spokes
6.4X X
X: Test Completed
Flume Velocity (m/s):Performance test Tilted Turbine
2.0 mm, 4‐leg spokes
4‐bladed turbine
0.7
Dynamic TorqueTurbine Geometry Static Torque
0.72

NNMREC
Test CalculationsParameter Symbol
Flume Speed (m/s) u0 0.4 0.8
Static Water Height (cm) hsw 50 46
Dynamic Water Height (cm) h0 49 42Water Column Cross‐Sectional Area (m2) AF 0.371 0.318
Turbine Cross‐Sectional Area (m2) AC 0.040 0.040Blockage Ratio ε 0.108 0.126Froude Number Fr 0.182 0.394
Max Blade Reynold's Number (4‐Bladed Turbine) ReB 4.0E+04 9.5E+04
Min Blade Reynold's Number (4‐Bladed Turbine) ReB 3.6E+03 2.2E+04
Machine Reynold's Number (4‐Bladed Turbine) ReM 7.7E+04 1.5E+05
Data Range

NNMREC
Typical Test ResultsLoad Performance Test Static Torque Test

NNMREC
Typical Test ResultsLoad Performance Test Static Torque Test

NNMREC
Streamwise Viewθ=0° θ=20° θ=40° θ=70°
Static torque near maximum Static torque drops

NNMREC
Single Blade Static Torque

NNMREC
Single Blade Torque Superposition

NNMREC
Streamwise Viewθ=0° θ=20° θ=40° θ=70°
Static torque near maximum Static torque drops
Unobstructed (-T) blade Partial
obstruction of (+T) blade at location of best drag
NNMREC
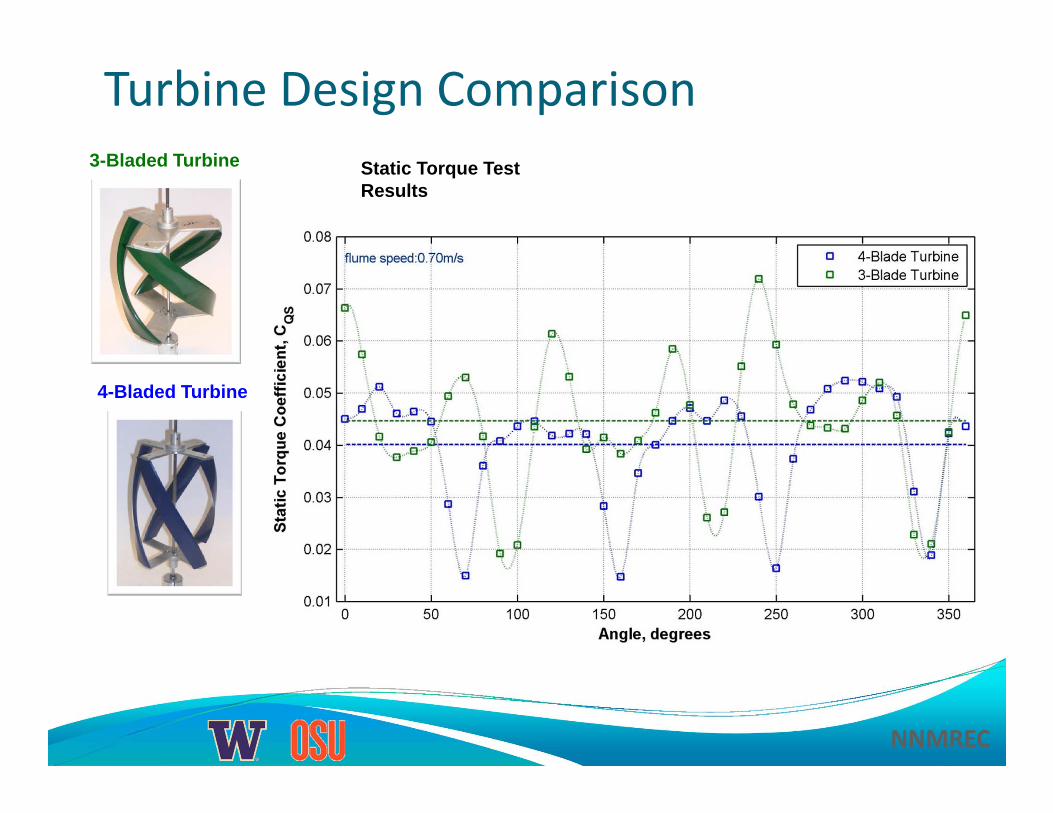
Turbine Design Comparison
4-Bladed Turbine
3-Bladed Turbine Static Torque Test Results

NNMREC
Tilted Turbine Test
Strut Design
Tilt Angle (degrees)
Tilt Velocity
Predicted CP Loss from
cos(Tilt)Actual CP Loss
0 0.720 0.0% 0.0%2.5 0.719 ‐0.2% ‐5.6%5 0.717 ‐0.7% ‐8.8%10 0.709 ‐2.8% ‐23.0%0 0.720 0.0% 0.0%2.5 0.719 ‐0.2% ‐4.5%5 0.717 ‐0.8% ‐4.4%10 0.709 ‐3.3% ‐8.9%
2 mm, 4‐Leg Spoke
2 mm Circular Plate
NNMREC
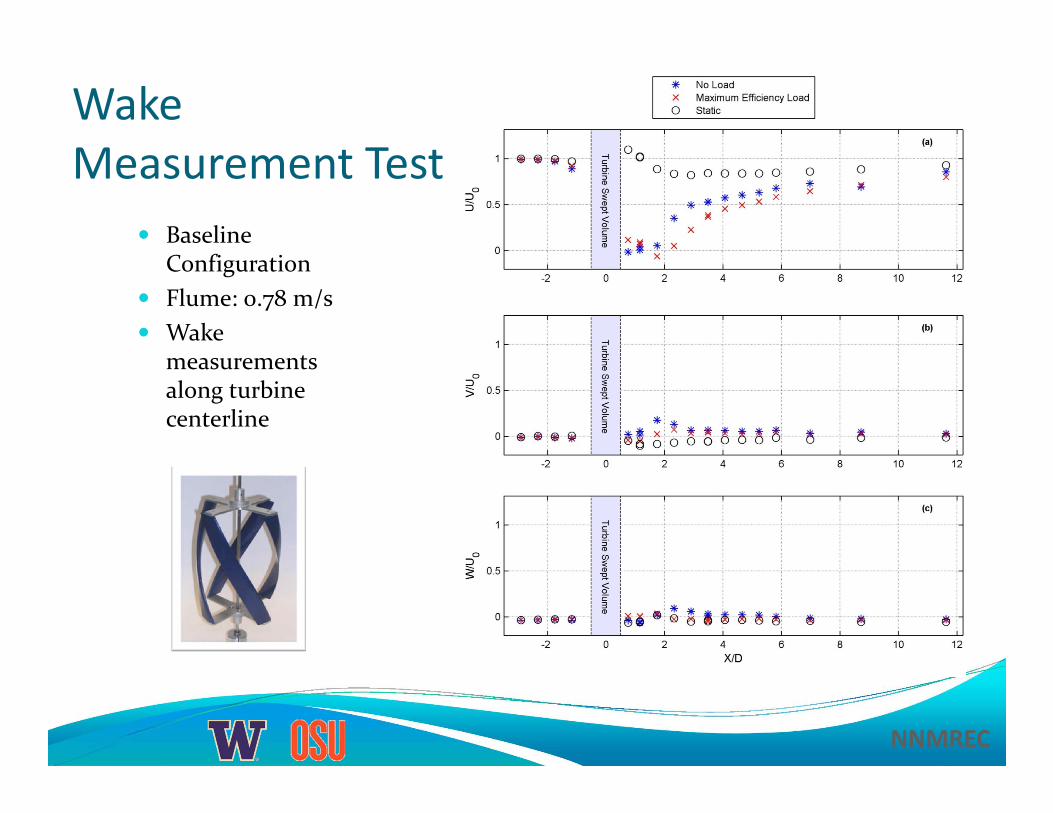
Wake Measurement Test
Baseline Configuration
Flume: 0.78 m/s Wake
measurements along turbine centerline
NNMREC
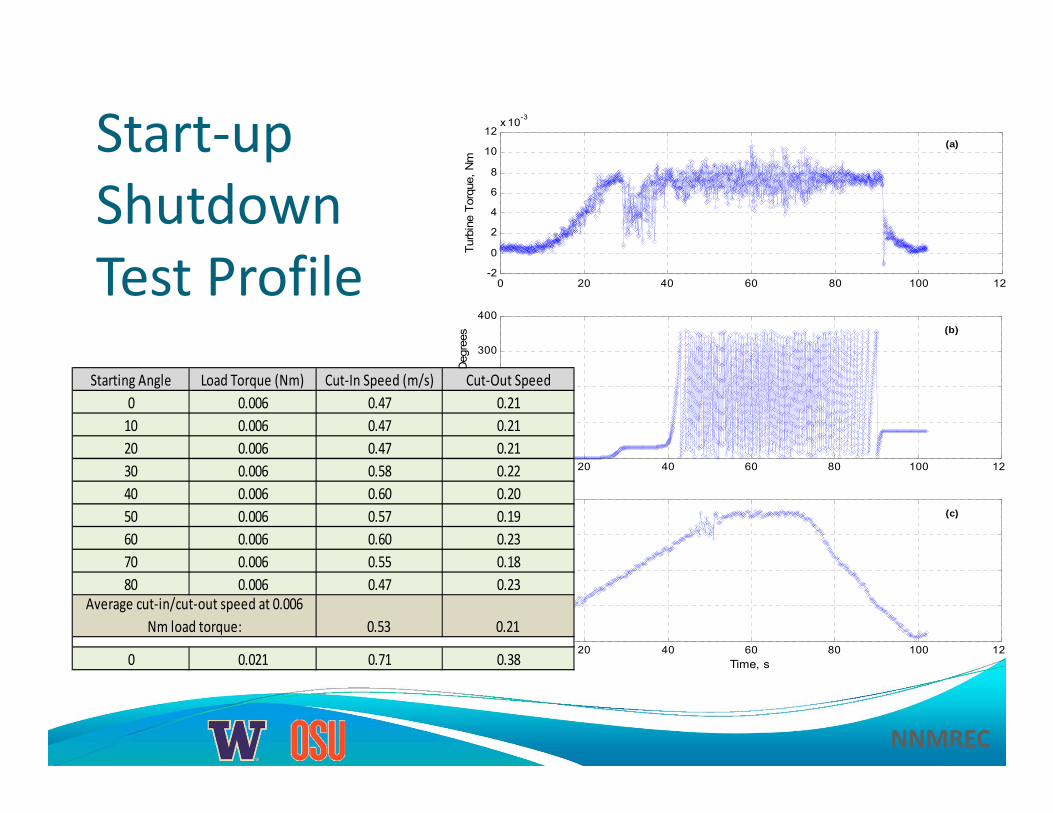
Start‐up Shutdown Test Profile 0 20 40 60 80 100 12
-2
0
2
4
6
8
10
12x 10-3
Turb
ine
Torq
ue, N
m
(a)
0 20 40 60 80 100 120
100
200
300
400
Turb
ine
Ang
le, D
egre
es
(b)
0 20 40 60 80 100 120
0.2
0.4
0.6
0.8
Time, s
U V
eloc
ity, m
/s
(c)
Starting Angle Load Torque (Nm) Cut‐In Speed (m/s) Cut‐Out Speed0 0.006 0.47 0.2110 0.006 0.47 0.2120 0.006 0.47 0.2130 0.006 0.58 0.2240 0.006 0.60 0.2050 0.006 0.57 0.1960 0.006 0.60 0.2370 0.006 0.55 0.1880 0.006 0.47 0.23
0.53 0.21
0 0.021 0.71 0.38
Average cut‐in/cut‐out speed at 0.006 Nm load torque:

NNMREC
Vortex Model Blade is divided into segments, revolution into time steps
8 elements per blade 15 revolutions to establish wake
Vortex influences the flow of surrounding blades

NNMREC
Model Solution Sum of velocity components gives uREL
Total change in circulation over time is zero (Kelvin’s theorem):
Vortex‐induced velocity at a point is found by Biot‐Savart Law:
Circulation strength is found from Kutta‐Joukowski theorem:
Predictor‐corrector to solve system of equations

NNMREC
Boeing Vertol Dynamic Stall Model

NNMREC
Flow Curvature Change in α from leading edge to trailing edge Important for high chord‐to‐radius ratio turbines Approximated as
‘Virtual camber’

NNMREC
Full‐Scale Turbine Prediction
All Secondary Effects Active

NNMREC
Full‐Scale Turbine Prediction
Dynamic Stall only

NNMREC
Model Prediction of Strut Drag u0=0.8 m/s