Embed Size (px)
Citation preview

EXPERIMENTAL AND FINITE ELEMENT EVALUATION OF BENDING FOR
ALUMINIUM
MUHAMMAD HAFIZ BIN AZAM
Thesis submitted in fulfillment of the requirements
for the awards of the degree of
Bachelor of Mechanical Engineering
Faculty of Mechanical Engineering
UNIVERSITI MALAYSIA PAHANG
JUNE 2012

vi
ABSTRACT
This thesis studies the effect of anisotropy to the deformation of springback in sheet
metal forming and reliability of finite element method in sheet metal bending of
Aluminium 1100 with the thickness 1 mm. This thesis focuses on tensile test
experiment, bending experiment and finite element experiment. Tensile test experiment
was done to determine the material properties of aluminium to put in the finite element
simulation. The bending process was done using U-die to define the angle of springback
in aluminium. The finite element simulation was done by using ABAQUS 6.7 to
determine the angle of springback. The results of the experiments were analysed in
order to determine the reliability of finite Element. The results show springback
increased when the angle of rolling direction is higher. The lowest angle of springback
was occurs at the 0° of rolling direction. Based on project, it was concluded that the
parameters of anisotropy affect springback angle. It was found the 0° provides a suitable
condition in U-die bending process. The finding from this project is the finite element
method might be use in order to predict the springback angle of die designing.

vii
ABSTRAK
Tesis ini mengemukakan kajian mengenai kesan anisotropi terhadap bahan yang
berubah daripada bentuk yang mengikut acuan kepada satu bentuk yang berlainan
dalam pembentukan lembaran logam.selain itu, kebolehpercayaan simulasi dalam
analisis pembengkokan kepingan logam Aluminium 1100 dengan tebal 1mm turut
dikemukakan. Dalam kajian ini tumpuan telah diberikan terhadap beberapa eksperimen
seperti eksperimen ujian tegangan, eksperimen lentur dan eksperimen simulasi. Ujian
tegangan telah dilakukan untuk menentukan sifat bahan aluminium untuk dijadikan
input kepada ujian simulasi. Proses lentur telah dilakukan dengan menggunakan acuan
berbentuk U untuk menentukan sudut membidas dalam aluminium. Simulasi telah
dilakukan dengan menggunakan perisian ABAQUS 6.7 untuk meramalkan sudut
membidas. Hasil keputusan eksperimen dianalisis untuk menentukan kebolehpercayaan
simulasi. Hasil keputusan menunjukkan sudut membidas itu bertambah apabila sudut
arah pinda adalah lebih tinggi. Sudut Membidas terendah telah berlaku di 0° arah
mampatan. hasil daripada tesis ini adalah parameter anisotropi mempengaruhi sudut
membidas. Diketahui bahawa 0 ° kepada arahan mampatan adalah terbaik dalam
menyediakan suatu keadaan yang sesuai dalam acuan berbentuk U. hasil daripada kajian
ini menunjukkan proses simulasi boleh digunakan untuk menjangka perubahan sudut
didalam proses membuat acuan.

viii
TABLE OF CONTENTS
Page
SUPERVISOR’S DECLARATION ii
STUDENT’S DECLARATION iii
ACKNOWLEDGEMENTS v
ABSTRACT vi
ABSTRAK vii
TABLE OF CONTENTS viii
LIST OF TABLES xi
LIST OF FIGURES xii
LIST OF SYMBOLS xiv
LIST OF ABBREVIATIONS xv
CHAPTER 1 INTRODUCTION
1.1 Introduction 1
1.2 Problem statement 2
1.3 Project objectives 2
1.4 Scope of Works 2
1.5 Thesis Organisation 3
CHAPTER 2 LITERATURE REVIEW
2.1 Introduction 4
2.2 Material 6
2.2.1 Material Preraration 6
2.2.2 Material Properties 7
2.2.3 Sheet Anisotropic 8

ix
2.3 Tensile Test 11
2.3.1 Tensile Test Preparation 11
2.3.2 Stress-Strain Curve 13
2.3.3 Yield Strength 13
2.3.4 Ultimate Tensile Strength 14
2.4 Bending Test 15
2.4.1 U-Bending Analysis 15
2.5 Finite Element Simulation 17
2.6 Measuring Angle 19
CHAPTER 3 METHODOLOGY
3.1 Introduction 21
3.2 Project Flow Chart 22
3.3 Tensile Test 24
3.3.1 Objectives 25
3.3.2 Test Specimen Preparation 26
3.3.3 Cutting Raw Material 27
3.2.4 Design Tensile Specimen Using Mastercam’s 28
3.2.5 CNC Milling Machine Process 29
3.2.6 Tensile Test Experiment 30
3.4 U-Bending Experiment 31
3.4.1 Objectives 31
3.4.2 Specimen Preparation 31
3.4.3 Experiment Process 33
3.4.4 Bending Machine 34
3.4.5 Bending Process 36
3.5 Finite Element Method 38
3.5.1 Objectives 39
3.5.2 Material Properties 40
3.5.3 Material Modeling 41
3.5.4 Finite Element Process 41
3.6 Angular Measurement 45
3.6.1 U-bending Experiment 45
3.6.2 Finite Element Method 47

x
CHAPTER 4 RESULTS AND DISCUSSION
4.1 Introduction 49
4.2 Tensile Test 49
4.2.1 Material Properties 50
4.2.2 Summary 54
4.3 U-Bending Experiment 56
4.4 Finite Element Method 59
4.5 Comparison Experimental and Finite Element Method 61
CHAPTER 5 CONCLUSION AND RECOMMENDATIONS
5.1 Introduction 64
5.2 Conclusion 64
5.3 Recommendations 65
REFERENCES 66
APPENDICES 68
A Gantt Chart PSM1
B Gantt Chart PSM2
C Measuring Angle of Experimental and Finite Element Parts
D Material Properties from Curve Stress-Strain Tensile Test.
E U-Die Bending Experiment View from solidworks.

1
CHAPTER 1
INTRODUCTION
1.1 Introduction
This chapter discusses some of the overview flow of the entire projects that consists
of project background, problem statement, objectives, scope of the works and organization
of the thesis.
Nowadays, Finite Element Method (FEM) has been used extensively in sheet metal
bending analysis. However, the reliability to use this method depends on the input data.
This method is getting applicable and useful from time to time. Thus there is a need to
evaluate of the data by comparing the results from simulation against experimental results.
By mastering in this method will make the industry especially manufacturing industry
know about the properties of the element, the condition of materials and appropriate
bending process for such material in order to manage the company.
Tensile test has been used in this project to determine the properties of the material
include tensile strength , yield strength, and Young’s Modulus of Elasticity, E. Then,
the data from the tensile test are used in the finite element method for si mulationprocess.
The results from the tensile test experimental was needed because the exact value will make
this project working smoothly and getting the successfully results.

2
After that, the experimental of U-bending will be conducted using press brake
machine. Nine specimens are use; three specimen for each orientation 0º, 45º and 90° in
this experimental. Specimens from the U-bending were measured by using scanner to get
the shape of the final specimens and then the springback were measured using solidworks.
The result from the experimental will be compared to the result of simulation.
1.2 Problem Statement
One of the problems in the sheet metal industry is to design die that will produce
final part exactly same as the shape of die. Usually the final parts of product are different
with its die because of the material behavior. This phenomenon is called springback..
Several solutions have been proposed to predict springback angle. Using finite element is
one of the solutions that provided. However, the reliability of finite element needs to justify
in order proving it.
1.3 Project Objectives
The objectives of study in this project are:
i. To determine the effect of anisotropy to the deformation of springback in
sheet metal forming.
ii. To determine the springback measurement of aluminium.
iii. To determine reliability of finite element method in sheet metal bending
analysis of aluminum by comparing with experimental results.
1.4 Scope of Works
In order to finish this project successfully, flow of project have focus on some of scope
of works to achieve objective the project. Basically, these thesis scopes of works are:
i. Conduct the literature review for overview of previous works
ii. Conduct the tensile test experiment that determines the mechanical properties of
Aluminium.

3
iii. Conduct U-Bending experiment in order to determine the springback angle.
iv. Conduct FE simulation for predicting springback angle of aluminium.
v. Compare FE results with experiment results for reliability evaluation of FE.
1.5 Thesis Organisation
This thesis will provide five chapters:
Chapter 1 has provided clearly about overview of the entire project include
introduction, problem statement, objectives, scope of the works and organization of the
thesis.
Chapter 2 has presented the literature review based on journals that have related to
this project. The background of the system including the material preparation, material
properties, anisotropy parameter, tensile test, bending test, finite element method and
measuring of springback from the previous journals will be discuss.
Chapter 3 has discussed of methodology that use in this project based on chapter 2.
It includes a flow chart of this thesis, such as tensile test experiment to define the material
properties, finite element method to predicting the angle of springback and u- die bending
process as comparison for validity of FE in predicting springback angle.
Chapter 4 has discussed the results of tensile test, finite element method and U-
bending experiment. The result from finite element method was compared with U-bending
result in term of springback angle.
Chapter 5 has concluded this thesis and has answered the objective have been listed
in chapter 1. Besides that, the outcomes from this project are listed.

4
CHAPTER 2
LITERATURE REVIEW
2.1 Introduction
This chapter provides limited literature review on previous research and it to be as
guideline to run this project. Some of previous literature review discussion about the
material, U-bending, numerical method, and tensile test. There are many previous
researcher works has been done in order to reduce spring-back value of sheet metal in U-
bending process. The results have been compared between simulation of finite element and
experiment. The source of this chapter is from journal, articles and some from books.
According to M.Kadkhodayan (2008), one of the most widely used sheet metal
forming processes is bending, which is employed in industry. Bending is a process by
which metal has deformed by plastically deforming the material and changing its shape
following it die. The surface area of the material does not change much but it will affect the
quality of the final parts. One of the problems in bending process is to predict the shape of
the metal after loads have been removed. This phenomenon is called as springback. Gau J.
A (1999) has defined the springback are the change in the shape of a sheet metal part upon
the removal of stamping tooling. According to M.Kadkhodayan (2008) the springback is
normally measured by determined the change in radius of curvature due to elastic recovery.
It was influenced by a combination of various process parameters such as tool shape and
dimension, contact friction condition, material properties, and thickness. M.Firat (2009) has
give that the important of predicting the amount of springback deformations in sheet metal
parts comes from the die-face design and process planning. However, the produced parts do

5
not conform to the design geometry within the required dimensional tolerances right at the
first time. According to Micari F (1997) works, his presented that the sheet metal slides
over a die shoulder, it undergoes bending– unbending deformations developing cyclic
bending loads on the sheet sections, and as a result an unbalanced stress distribution is
developed over the thickness. Bending experiment was done using press brake machine.
Press Brake normally has a capacity of 20 to 200 tons to accommodate stock from 1m to
4.5m (3 feet to 15 feet). Larger and smaller presses are used for specialized applications.
Programmable back gages, and multiple die sets available currently can make for a very
economical process based on Boljanovic (2004). Figure 2.1 show the press brake machine
that use in bending experiment.
Figure 2.1: Press Machine for U-Bending Experiment
Source: Wang Hao et. al (2010)

6
2.2 Material
In engineering application, material selection is important term to make sure that
material is suitable for the produce products. Before the material are chosen, there are many
experiment and procedure that must be follow to avoid the unexpected cases happen after
publishes. In this study, the Aluminium sheet metal has been selected as a material to
perform the experimental and finite element simulation for bending test.
2.2.1 Material Preparation
Material characteristic of the sheet metal was needed as an input in the simulation
finite element. Generally, to characterize the material properties and anisotropy, the
different orientation angle of specimen sheet metal are provided in order to define effect of
anisotropy to springback angle. From the author M. Bakhshi-Jooybari (2009), his worked
has used different specimens of 25x100 mm CK67 steel sheets which were in different
orientation of the rolling directions (0º, 45º and 90º), and different thickness of 0.5, 0.7, and
1 mm. All those specimens were examined with bending test. Tensile test were used to
determine the stress-strain curves and the sheet metal anisotropy parameters, r-values. In
another work, V.Esat (2001) had used Aluminium sheets with a length of 400 mm, a width
of 300 mm, and thickness of 3, 4, and 5 mm to study the 45º angular bending. Wipe
bending was analysed using aluminium sheets with a length of 250 mm, a width of 300
mm, and thickness of 3 and 4 mm. In this project the sheet metal are use is Aluminum with
length of 150mm and wide 50 mm and the thickness of 1mm were analysed with different
orientations to rolling direction (0º, 45º and 90º).

7
2.2.2 Material Properties
According to Aljibori (2009), there is two types of isotropic material involve in his
model. That’s type are linear elastic-plastic (for sheet metal) and linear elastic (for the
punch and die). The materials properties for each type are shown in table 2.1.
Table 2.1: Materials Properties Aluminium
Sheet Metal (Aluminium)
Linear Elastic-Plastic
Material Properties Symbol Properties Value
Young’s Modulus
Uniaxial yield strength
Poisson Ratio
Material Density
E
N
P
78 GPa
550 MPa
0.3
2700 kg/
Punch and Die (Steel)
Linear Elastic
Young’s Modulus
Uniaxial yield strength
Poisson Ratio
Material Density
E
v
ρ
400 GPa
4000GPa
0.3
7800 kg/
Source: Hakim S.Sultan Aljibori et. al. (2009)

8
2.2.3 Sheet Anisotropic
Tensile test were used to determine the stress-strain curves and the sheet metal
anisotropy parameters, r-values. M. Bakhshi-Jooybari (2009) said that the plastic properties
of rolled sheets differ from the through thickness direction, normal anisotropy and vary
with orientation in the plane of the sheet, planar anisotropy. M.Kadkhodayan (2008), was
investigated the effect of sheet anisotropy on the springback of stainless steel 410 draw-
bend specimens experimentally as well as through finite element simulations. Moreover,
they studied the influence of blank holder force and coefficient friction on the amount of
the final springback. Vial.C (1983) had stated that the anisotropy of sheet metal
deformations is represented with the initial (texture-induced) anisotropy due to the sheet
production process and the plastic anisotropy developed during the course of the elastic–
plastic deformations.
Based on previous work by Jianfeng Wang (2004), Sheet metals naturally exhibit
mechanical anisotropy because of the preferred grain orientation. The detailed
crystallographic texture is determined by the thermo- mechanical manufacturing history
(e.g., hot/cold rolling and annealing). Typically, sheet metals are orthotropic, with mirror
symmetry axes aligned with the sheet rolling (RD), transverse (TD) and normal (ND)
directions, as shown in Figure 2.2.

9
Figure 2.2: Schematics of coordinate systems of a sheet (X-Y -Z)
Source: Jianfeng Wang et. al 2004
To characterize the plastic anisotropy of the sheet, the Lankford parameter or the
plastic strain ratio is generally adopted. The plastic strain ratio, also called r-value, is
defined as follows:
, (2.1)
Where, and
are true plastic strains in the sample width and thickness directions,
respectively. The r-values can be measured by uniaxial tension tests for samples at different
angles to the sheet rolling direction, Figure 2.2.

10
In practice, it is quite difficult to precisely measure small changes of the sheet
thickness. Since plastic deformation conserves volume, i.e. +
, +
= 0. It is
convenient and more accurate to calculate r-value alternatively:
-
(2.2)
While is the plastic strain in the longitudinal direction.
The plastic strain ratio has a profound effect on sheet formability. It is a measure of
the resistance to thinning or localized deformation, which usually precedes failure in sheet
metal forming. Therefore, high r-value is desirable to achieve good formability. Usually, r-
value varies with orientation in the sheet plane, and it is also a function of plastic strain. An
averaged r-value is defined as:
(2.3)
Which is closely correlates to the deep drawability of sheet metals. Here, ,
and designate the r-value measured from samples cut at 0°, 45°and 90° from the sheet
rolling direction. On the other hand, the in-plane variation of the r-value can be evaluated
by:
Δr =
(2.4)
Δr is a measure of the planar anisotropy, and it relates to the earing profile in deep- drawn
products.

11
2.3 Tensile Test
The tensile test is widely used for the measurement of basic mechanical properties
of metals, plastics, and composite materials. Mechanical properties are an important
measure in order to produce the good products qualities, and the tensile test is just one way
to certify the products. In tensile test, the materials properties that are always define are
elastic deformation properties (Young’s modulus and Poisson’s ratio), yield strength,
ultimate tensile strength, ductile properties (elongation and reduction in area) and strain-
hardening characteristics.
2.3.1 Tensile Test Preparation
Based on the ASTM standard, there are three types of the specimens for the tensile
test specimens where it is plate, sheet and round type specimen. In this project, sheet metal
type was being performed to get the material properties. This is because in the finite
element and experiment U-bending, the specimens of sheet metal will be use in order to get
the springback angle.
By using ASTM standard E-8M, for the standard sheet type test specimen is shown
in Figure 2.1. This specimen is used for cover the tension testing of metallic materials in
any form at room temperature, specifically, the methods of determination of yield strength,
yield point elongation, tensile strength, elongation and reduction area in the form of sheet,
plate, flat wire, strip, band and hoop ranging in nominal thickness from 0.13 to 19mm. The
detail dimension and specification of the tensile test specimen is shown in the Figure 2.3
and Table 2.2.

12
Figure 2.3: Rectangular (flat) tensile test specimen
Source: Annual Book of ASTM Standards, Vol 01.03. (2003)
Table 2.2: Dimension and Specification of the Tensile Test Specimen ASTM E-8M
Plate type
(1.5 in. wide)
mm
Sheet type
(0.5 in. wide)
mm
Sub-size specimen
(0.25 in. wide)
mm
Gage length 200 ± 0.25 50.0 ± 0.10 25.0 ± 0.08
Width 40 + 3 - 6 12.5 ± 0.25 6.25 ± 0.05
Thickness Thickness of Material
Fillet radius (min.) 13 13 6
Overall length (min.) 450 200 100
Length of reduced section (min.) 225 60 32
Length of grip section (min.) 75 50 32
Width of grip section (approx.) 50 20 10
Source: Annual Book of ASTM Standards, Vol 01.03. (2003)

13
2.3.2 Stress Strain Curve
The Stress-strain curve was created from the plotting the value of the applied forces
(stress) with the elongation the specimen (strain). The figure 2.4 was show the graph stress-
strain by plotting the raw data from the tensile test experiment.
Figure 2.4: Stress Strain Curve
Source: Marc Venet (2010)
2.3.3 Yield Strength
The yield strength is the stress where the material which had been a tension
compression load was gives longer return to its original length or shape when the load is
removed. Some materials break before reaching yield strength, for example some of glass-

14
filled nylons or die cast aluminum. Michael F. Ashby (2005) had suggested taking a piece
of wire and slightly bending it in order to further visualize this property. It will return to its
original shape. The point at which it stays bent is the yield point. The yield point is a very
important concept because a part is usually useless after the material has reached that point.
With most materials there is a gradual transition from elastic to plastic behavior, and the
exact point at which plastic deformation begins to occur is hard to determine. Therefore,
various criteria for the initiation of yielding are used depending on the sensitivity of the
strain measurements and the intended use of the data. For most engineering design and
specification applications, the yield strength is used. The yield strength is defined as the
stress required producing a small, amount of plastic deformation. The offset yield strength
is the stress corresponding to the intersection of the stress-strain curve and a line parallel to
the elastic part of the curve offset by a specified strain (in the US the offset is typically
0.2% for metals and 2% for plastics).
2.3.4 Ultimate tensile strength
The ultimate tensile strength (UTS) is the maximum engineering stress level
reached in a tension test. The strength of a material is its ability to withstand external forces
without breaking. In brittle materials, the UTS were located at the end of the linear-elastic
portion of the stress-strain curve or it was close to the elastic limit. In ductile materials, the
UTS will be well outside of the elastic portion into the plastic portion of the stress-strain
curve.
Based on figure 2.4, the UTS is the highest point where the line is momentarily flat.
Since the UTS are based on the engineering stress, it is often not the same as the breaking
strength. In ductile materials strain hardening occurs and the stress will continue to increase
until fracture occurs, but the engineering stress-strain curve may show a decline in the
stress level before fracture occurs. This is the result of engineering stress being based on
the original cross-section area and not accounting for the necking that commonly occurs in
the test specimen. The UTS may not be completely representative of the highest level of
stress that a material can support, but the value is not typically used in the design of
15
components anyway. For ductile metals the current design practice is to use the yield
strength for sizing static components. However, since the UTS is easy to determine and
quite reproducible, it is useful for the purposes of specifying a material and for quality
control purposes. On the other hand, for brittle materials the design of a component may be
based on the tensile strength of the material. However, it is depend on other factor such as
the preparation of the specimen, the presence or otherwise of the surface defect, and the
temperature of the test environment and material according to Michael F. Ashby (2005).
2.4 Bending Test
Springback is a very complicated behavior and not easy to predict through the
mathematical models. Therefore, some experiments for understanding springback behavior
were conducted and some mathematical models were developed. Various experimental
techniques and procedures have been developed to study and characterize springback of
sheet metals. The most popular and commonly used techniques are cylindrical bending, U-
bending, V-bending and flanging. These methods are attractive because the level of
springback is large and it can easily be measured. In this project, the U-bending techniques
will be used to investigate the springback phenomena. Mohamed Faraj Alfaidi (2009) have
stated that sensitivity of springback to basic parameters, such as R/t ratio (tool radius to
sheet thickness), geometric parameters of the tools, mechanical properties of sheet material
and friction parameters is usually studied by means of these techniques.
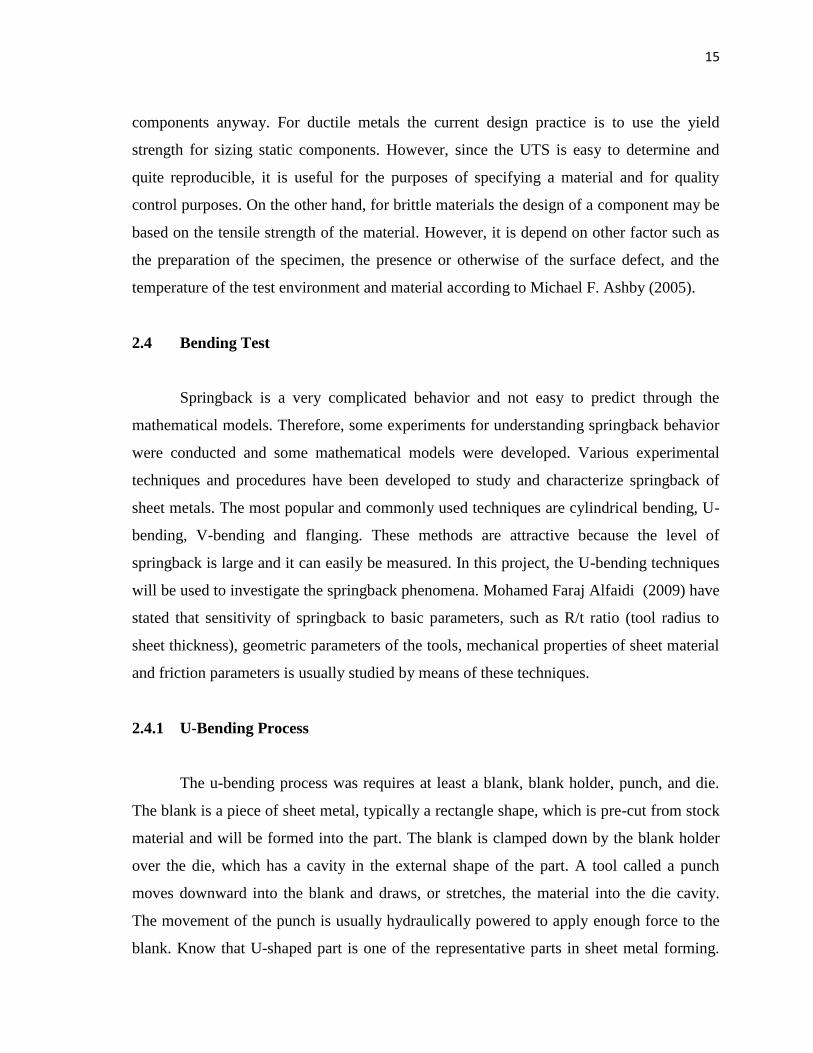
2.4.1 U-Bending Process
The u-bending process was requires at least a blank, blank holder, punch, and die.
The blank is a piece of sheet metal, typically a rectangle shape, which is pre-cut from stock
material and will be formed into the part. The blank is clamped down by the blank holder
over the die, which has a cavity in the external shape of the part. A tool called a punch
moves downward into the blank and draws, or stretches, the material into the die cavity.
The movement of the punch is usually hydraulically powered to apply enough force to the
blank. Know that U-shaped part is one of the representative parts in sheet metal forming.

16
Side wall curl is one of the main defects found in the forming of a U-shaped part based on
Zhanga (2007).
By introducing a large blank-holder force (BHF) into the forming process is useful
to remove side wall curl. According to Liu (2002) and Samuel (2000), they found that as
the BHF increased, flow resistance of the material will also increase, the stress distribution
through the thickness of side wall may be turned to tensile stress over the whole section.
Accordingly, springback directions of both sides become consistent, which is conducive to
decreasing shape distortion based on journal Zhanga (2007).
Before this, there are many researchers have investigated and attempted to obtain a
basic understanding of springback behavior by using U-Bending techniques. Gomes C
(2005) have done the simulation of material models based on various anisotropic models
and compare his result with the experimental outcome to show the variation of spring-back
with orientation of anisotropic sheet in U-die bending process. Papeleux and Ponthot
(2002) have investigated the effect of blank holder force and friction coefficient on spring-
back in U-die bending. M. Bakhshi-Jooybari (2009) had done the experimental and
numerical studies of the effects on significant parameters including sheet thickness, sheets
anisotropy and punch tip radius on spring-back/ spring-go in V-bending and U-bending
processes of CK67 (DIN 17222) steel sheet have been conducted.
Based on journal Bhadpiroon Sresomroeng (2011), U-bending experimental has
been conducted to verify the analytical model. The initial rectangular blanks of 210 mm in
length and 50 mm in width were bended into hat-shaped parts. Experiments were carried
out using the U-bending die shown in Figure 2.5 on a 1500-kN hydraulic press machine.

17
Figure 2.5: U-die Bending Process
Source: Bhadpiroon Sresomroeng et. al 2011
2.5 Finite Element Simulation
Finite element analysis is a simulation technique which evaluates the behavior of
components, equipments and structures for various loading conditions including applied
forces, pressures and temperatures. According to Hakim S. Sultan (2004), he was say that
the analysis of whole structure is obtained by simultaneously analysis the individual finite
elements, having due regard to their individual positions within the mesh and being totally
dependent upon the assistance of an automatic computer. Aljibori (2009) was decide by
using the finite element analysis method, simulation of design can helps to predict errors
and modification can be done at early stage before the parts was fabricated and tested.
Subsequently the labour cost and time lost can be reduced. When we are use finite element
simulation, there are two majors step that we must follow. M.Firat (2005) have give this
two step. First, a forming analysis is conducted, including the blank and tooling, in order to
determine the sheet metal deformation during the stamping process and, second, the sheet
metal springback deformations following the removal of the stamping tooling are computed
18
using the forming stress distribution and the deformed geometry along with thickness
distribution.
Wang (1988) Finite element analysis is now widely used in the sheet metal forming
process to predict draw-in, strain distribution and optimal blank holder forces. M. Bakhshi-
Jooybari (2009) done the simulation of springback was perform by using the FE code,
ABAQUS 6.4. were material properties obtained from the tensile test will put into the
software and the hill’s anisotropy parameters were implemented into the code to model the
sheet anisotropy. According to M.Tisza (2004), incremental FEM simulation are suitable
for optimize the process and die design, and to make the necessary changes and even
optimize the process parameters to ensure feasible processes and acceptable product
quality. Besides that, he also makes assumption that the finite element simulation is
powerful enough to predict all the forming defects and provide optimum stamping tools and
conditions, the prototype tools may be completely eliminated from the design and
manufacturing procedure, and the number of trial and modification can be significantly
reduced.
Based on M.Kadkhodayan (2008) influence of different hardening models in
simulating the U-bending process by utilizing the finite element code, ABAQUS 6.5 has
been investigated. The simulation of the U-bending process is modeled in the finite element
program ABAQUS/Explicit, while the springback analysis is simulated in
ABAQUS/Standard as it would take a long time to obtain a quasistatic solution of
springback analysis in ABAQUS/Explicit. V.Esat (2001) Analyses were carried out using
the commercially available finite-element software MARC/MENTAT with two different
aluminum wrought alloys, 2014-T6 and 6061-T6, were used.
According to Mehmet Firat (2008), the FE analyses of Numisheet’93 U-channel
forming process with blank geometry is a sheet metal strip of size 300mm x 39 mm x 0.78
mm. Due to the symmetry conditions, only half of the tooling and the blank are include in
the simulations along with appropriate boundary conditions. The figure 2.6 was showed the
drawing of the simulation part. In this journal also tell about the materials properties were